Sri Lankan Disability Age 5 to 17
COMPARE
Sri Lankan
Select to Compare
Disability Age 5 to 17
Sri Lankan Disability Age 5 to 17
5.2%
DISABILITY | AGE 5 TO 17
99.6/ 100
METRIC RATING
80th/ 347
METRIC RANK
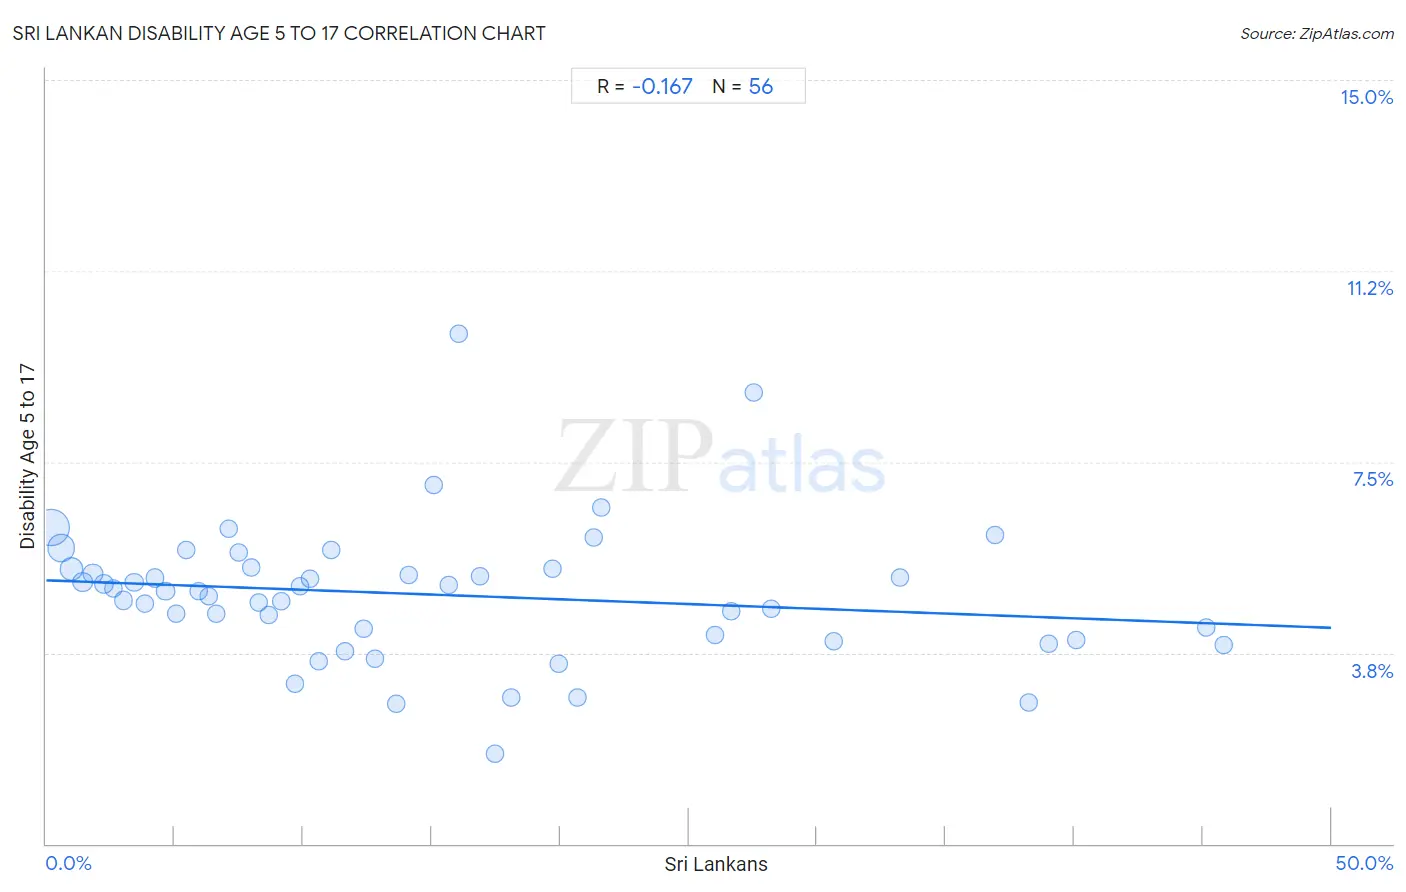
Sri Lankan Disability Age 5 to 17 Correlation Chart
The statistical analysis conducted on geographies consisting of 436,844,660 people shows a poor negative correlation between the proportion of Sri Lankans and percentage of population with a disability between the ages 5 and 17 in the United States with a correlation coefficient (R) of -0.167 and weighted average of 5.2%. On average, for every 1% (one percent) increase in Sri Lankans within a typical geography, there is a decrease of 0.019% in percentage of population with a disability between the ages 5 and 17.
It is essential to understand that the correlation between the percentage of Sri Lankans and percentage of population with a disability between the ages 5 and 17 does not imply a direct cause-and-effect relationship. It remains uncertain whether the presence of Sri Lankans influences an upward or downward trend in the level of percentage of population with a disability between the ages 5 and 17 within an area, or if Sri Lankans simply ended up residing in those areas with higher or lower levels of percentage of population with a disability between the ages 5 and 17 due to other factors.
Demographics Similar to Sri Lankans by Disability Age 5 to 17
In terms of disability age 5 to 17, the demographic groups most similar to Sri Lankans are Afghan (5.2%, a difference of 0.020%), Native Hawaiian (5.2%, a difference of 0.040%), Immigrants from Cuba (5.2%, a difference of 0.060%), Immigrants from Kazakhstan (5.2%, a difference of 0.070%), and Immigrants from Guyana (5.2%, a difference of 0.10%).
| Demographics | Rating | Rank | Disability Age 5 to 17 |
| Immigrants from Czechoslovakia | 99.7 /100 | #73 | Exceptional 5.2% |
| Immigrants from Romania | 99.7 /100 | #74 | Exceptional 5.2% |
| Immigrants from Moldova | 99.6 /100 | #75 | Exceptional 5.2% |
| Immigrants from Guyana | 99.6 /100 | #76 | Exceptional 5.2% |
| Immigrants from Kazakhstan | 99.6 /100 | #77 | Exceptional 5.2% |
| Immigrants from Cuba | 99.6 /100 | #78 | Exceptional 5.2% |
| Afghans | 99.6 /100 | #79 | Exceptional 5.2% |
| Sri Lankans | 99.6 /100 | #80 | Exceptional 5.2% |
| Native Hawaiians | 99.6 /100 | #81 | Exceptional 5.2% |
| Immigrants from Sweden | 99.5 /100 | #82 | Exceptional 5.2% |
| Immigrants from France | 99.5 /100 | #83 | Exceptional 5.2% |
| Immigrants from Nicaragua | 99.5 /100 | #84 | Exceptional 5.2% |
| Bulgarians | 99.4 /100 | #85 | Exceptional 5.2% |
| Immigrants from St. Vincent and the Grenadines | 99.4 /100 | #86 | Exceptional 5.2% |
| Eastern Europeans | 99.4 /100 | #87 | Exceptional 5.2% |
Sri Lankan Disability Age 5 to 17 Correlation Summary
| Measurement | Sri Lankan Data | Disability Age 5 to 17 Data |
| Minimum | 0.18% | 1.8% |
| Maximum | 45.8% | 10.0% |
| Range | 45.6% | 8.3% |
| Mean | 15.0% | 4.9% |
| Median | 11.4% | 5.0% |
| Interquartile 25% (IQ1) | 5.7% | 4.0% |
| Interquartile 75% (IQ3) | 21.0% | 5.4% |
| Interquartile Range (IQR) | 15.3% | 1.4% |
| Standard Deviation (Sample) | 12.2% | 1.4% |
| Standard Deviation (Population) | 12.1% | 1.4% |
Correlation Details
| Sri Lankan Percentile | Sample Size | Disability Age 5 to 17 |
[ 0.0% - 0.5% ] 0.18% | 205,320,620 | 6.2% |
[ 0.5% - 1.0% ] 0.57% | 98,120,333 | 5.8% |
[ 0.5% - 1.0% ] 0.98% | 50,396,171 | 5.4% |
[ 1.0% - 1.5% ] 1.40% | 22,853,264 | 5.1% |
[ 1.5% - 2.0% ] 1.82% | 16,749,439 | 5.3% |
[ 2.0% - 2.5% ] 2.23% | 9,807,767 | 5.1% |
[ 2.5% - 3.0% ] 2.61% | 7,209,493 | 5.0% |
[ 2.5% - 3.0% ] 2.99% | 5,985,569 | 4.8% |
[ 3.0% - 3.5% ] 3.42% | 3,157,198 | 5.1% |
[ 3.5% - 4.0% ] 3.83% | 2,952,959 | 4.7% |
[ 4.0% - 4.5% ] 4.22% | 1,995,101 | 5.2% |
[ 4.5% - 5.0% ] 4.64% | 1,437,593 | 5.0% |
[ 5.0% - 5.5% ] 5.06% | 1,637,430 | 4.5% |
[ 5.0% - 5.5% ] 5.45% | 527,783 | 5.8% |
[ 5.5% - 6.0% ] 5.93% | 1,531,456 | 5.0% |
[ 6.0% - 6.5% ] 6.33% | 428,682 | 4.9% |
[ 6.5% - 7.0% ] 6.62% | 501,270 | 4.5% |
[ 7.0% - 7.5% ] 7.09% | 469,777 | 6.2% |
[ 7.0% - 7.5% ] 7.49% | 346,420 | 5.7% |
[ 7.5% - 8.0% ] 7.98% | 465,855 | 5.4% |
[ 8.0% - 8.5% ] 8.26% | 326,852 | 4.7% |
[ 8.5% - 9.0% ] 8.64% | 260,343 | 4.5% |
[ 9.0% - 9.5% ] 9.13% | 462,954 | 4.8% |
[ 9.5% - 10.0% ] 9.66% | 35,664 | 3.2% |
[ 9.5% - 10.0% ] 9.89% | 158,199 | 5.1% |
[ 10.0% - 10.5% ] 10.28% | 185,938 | 5.2% |
[ 10.5% - 11.0% ] 10.59% | 138,034 | 3.6% |
[ 11.0% - 11.5% ] 11.09% | 251,577 | 5.8% |
[ 11.5% - 12.0% ] 11.62% | 169,405 | 3.8% |
[ 12.0% - 12.5% ] 12.33% | 1,095,434 | 4.2% |
[ 12.5% - 13.0% ] 12.78% | 114,382 | 3.6% |
[ 13.5% - 14.0% ] 13.63% | 243,185 | 2.7% |
[ 14.0% - 14.5% ] 14.12% | 221,988 | 5.3% |
[ 15.0% - 15.5% ] 15.09% | 13,719 | 7.0% |
[ 15.5% - 16.0% ] 15.65% | 27,827 | 5.1% |
[ 16.0% - 16.5% ] 16.03% | 61,688 | 10.0% |
[ 16.5% - 17.0% ] 16.90% | 28,576 | 5.3% |
[ 17.0% - 17.5% ] 17.44% | 51,043 | 1.8% |
[ 18.0% - 18.5% ] 18.08% | 78,830 | 2.9% |
[ 19.5% - 20.0% ] 19.68% | 59,851 | 5.4% |
[ 19.5% - 20.0% ] 19.96% | 96,079 | 3.5% |
[ 20.5% - 21.0% ] 20.69% | 7,786 | 2.9% |
[ 21.0% - 21.5% ] 21.31% | 52,555 | 6.0% |
[ 21.5% - 22.0% ] 21.59% | 1,575 | 6.6% |
[ 26.0% - 26.5% ] 26.04% | 6,916 | 4.1% |
[ 26.5% - 27.0% ] 26.64% | 184,010 | 4.6% |
[ 27.5% - 28.0% ] 27.51% | 53,826 | 8.9% |
[ 28.0% - 28.5% ] 28.22% | 6,563 | 4.6% |
[ 30.5% - 31.0% ] 30.64% | 45,688 | 4.0% |
[ 33.0% - 33.5% ] 33.20% | 171,637 | 5.2% |
[ 36.5% - 37.0% ] 36.91% | 36,657 | 6.1% |
[ 38.0% - 38.5% ] 38.21% | 34,188 | 2.8% |
[ 39.0% - 39.5% ] 39.02% | 47,549 | 3.9% |
[ 40.0% - 40.5% ] 40.07% | 16,072 | 4.0% |
[ 45.0% - 45.5% ] 45.14% | 181,268 | 4.2% |
[ 45.5% - 46.0% ] 45.82% | 22,622 | 3.9% |