Cambodian Disability Age Under 5
COMPARE
Cambodian
Select to Compare
Disability Age Under 5
Cambodian Disability Age Under 5
1.2%
DISABILITY | AGE UNDER 5
95.4/ 100
METRIC RATING
106th/ 347
METRIC RANK
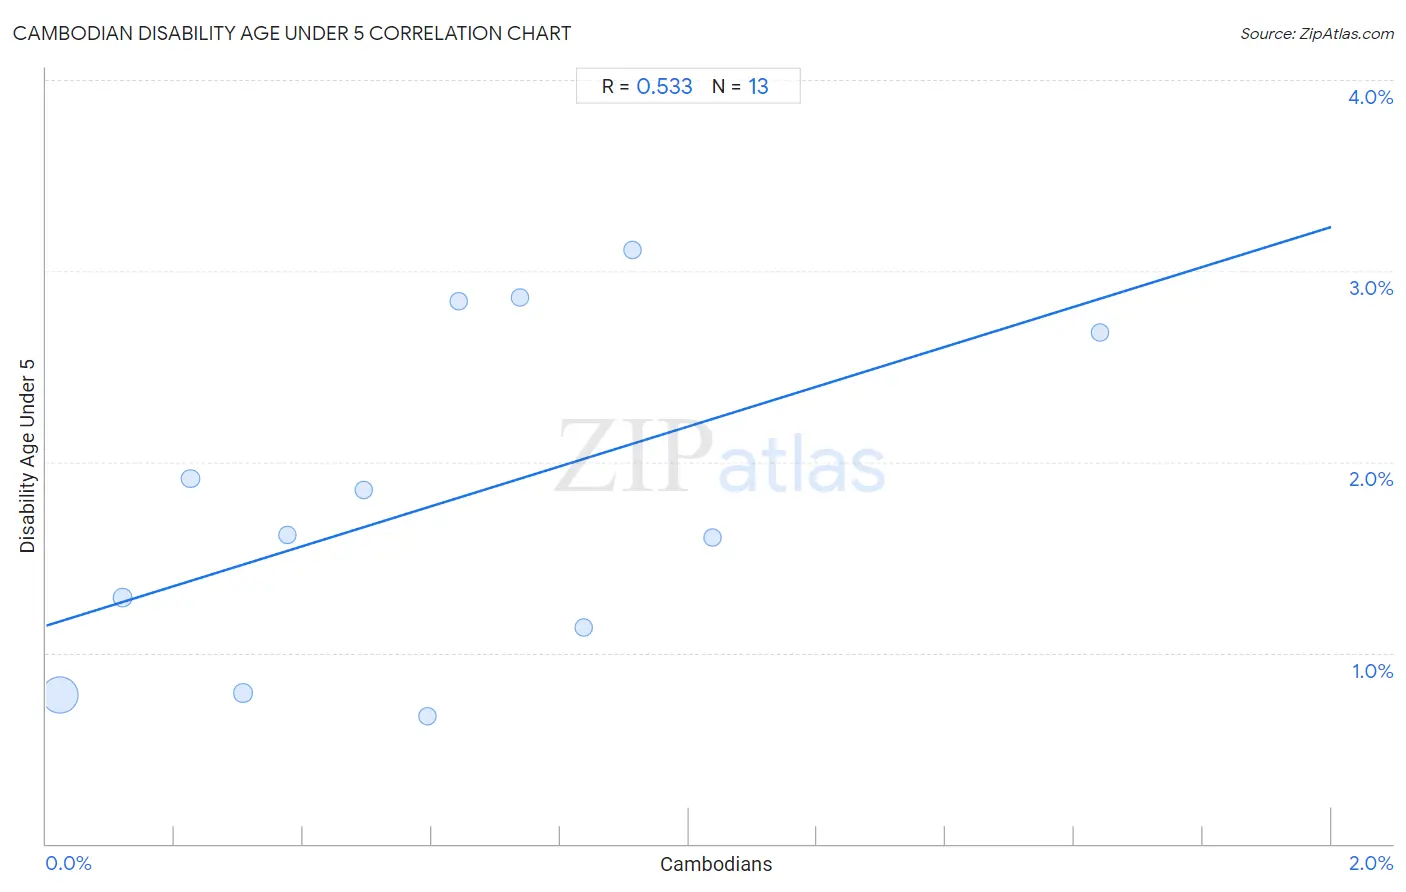
Cambodian Disability Age Under 5 Correlation Chart
The statistical analysis conducted on geographies consisting of 77,498,292 people shows a substantial positive correlation between the proportion of Cambodians and percentage of population with a disability under the age of 5 in the United States with a correlation coefficient (R) of 0.533 and weighted average of 1.2%. On average, for every 1% (one percent) increase in Cambodians within a typical geography, there is an increase of 1.0% in percentage of population with a disability under the age of 5.
It is essential to understand that the correlation between the percentage of Cambodians and percentage of population with a disability under the age of 5 does not imply a direct cause-and-effect relationship. It remains uncertain whether the presence of Cambodians influences an upward or downward trend in the level of percentage of population with a disability under the age of 5 within an area, or if Cambodians simply ended up residing in those areas with higher or lower levels of percentage of population with a disability under the age of 5 due to other factors.
Demographics Similar to Cambodians by Disability Age Under 5
In terms of disability age under 5, the demographic groups most similar to Cambodians are Immigrants from West Indies (1.2%, a difference of 0.040%), Immigrants from South Africa (1.2%, a difference of 0.10%), Iraqi (1.2%, a difference of 0.17%), Immigrants from Panama (1.2%, a difference of 0.19%), and Immigrants from Lebanon (1.2%, a difference of 0.21%).
| Demographics | Rating | Rank | Disability Age Under 5 |
| Dominicans | 96.3 /100 | #99 | Exceptional 1.1% |
| Nicaraguans | 96.3 /100 | #100 | Exceptional 1.1% |
| Immigrants from Uganda | 96.1 /100 | #101 | Exceptional 1.1% |
| Immigrants from Morocco | 96.0 /100 | #102 | Exceptional 1.2% |
| Immigrants from Nicaragua | 96.0 /100 | #103 | Exceptional 1.2% |
| Indonesians | 95.9 /100 | #104 | Exceptional 1.2% |
| Immigrants from South Africa | 95.6 /100 | #105 | Exceptional 1.2% |
| Cambodians | 95.4 /100 | #106 | Exceptional 1.2% |
| Immigrants from West Indies | 95.3 /100 | #107 | Exceptional 1.2% |
| Iraqis | 95.1 /100 | #108 | Exceptional 1.2% |
| Immigrants from Panama | 95.0 /100 | #109 | Exceptional 1.2% |
| Immigrants from Lebanon | 95.0 /100 | #110 | Exceptional 1.2% |
| Senegalese | 94.6 /100 | #111 | Exceptional 1.2% |
| Immigrants from Australia | 94.4 /100 | #112 | Exceptional 1.2% |
| Immigrants from Oceania | 94.2 /100 | #113 | Exceptional 1.2% |
Cambodian Disability Age Under 5 Correlation Summary
| Measurement | Cambodian Data | Disability Age Under 5 Data |
| Minimum | 0.021% | 0.67% |
| Maximum | 1.6% | 3.1% |
| Range | 1.6% | 2.4% |
| Mean | 0.61% | 1.8% |
| Median | 0.59% | 1.6% |
| Interquartile 25% (IQ1) | 0.27% | 0.96% |
| Interquartile 75% (IQ3) | 0.87% | 2.8% |
| Interquartile Range (IQR) | 0.61% | 1.8% |
| Standard Deviation (Sample) | 0.44% | 0.86% |
| Standard Deviation (Population) | 0.42% | 0.82% |
Correlation Details
| Cambodian Percentile | Sample Size | Disability Age Under 5 |
[ 0.0% - 0.5% ] 0.021% | 70,716,424 | 0.78% |
[ 0.0% - 0.5% ] 0.12% | 4,099,924 | 1.3% |
[ 0.0% - 0.5% ] 0.22% | 749,202 | 1.9% |
[ 0.0% - 0.5% ] 0.31% | 635,684 | 0.79% |
[ 0.0% - 0.5% ] 0.38% | 365,542 | 1.6% |
[ 0.0% - 0.5% ] 0.49% | 202,323 | 1.9% |
[ 0.5% - 1.0% ] 0.59% | 306,505 | 0.67% |
[ 0.5% - 1.0% ] 0.64% | 160,016 | 2.8% |
[ 0.5% - 1.0% ] 0.74% | 124,217 | 2.9% |
[ 0.5% - 1.0% ] 0.84% | 88,730 | 1.1% |
[ 0.5% - 1.0% ] 0.91% | 15,566 | 3.1% |
[ 1.0% - 1.5% ] 1.04% | 27,388 | 1.6% |
[ 1.5% - 2.0% ] 1.64% | 6,771 | 2.7% |