Val Verde, CA
Val Verde Map
Val Verde Overview
3,292
TOTAL POPULATION
1,754
MALE POPULATION
1,538
FEMALE POPULATION
114.04
MALES / 100 FEMALES
87.69
FEMALES / 100 MALES
34.5
MEDIAN AGE
4.0
AVG FAMILY SIZE
3.8
AVG HOUSEHOLD SIZE
$31,857
PER CAPITA INCOME
$110,870
AVG FAMILY INCOME
$107,381
AVG HOUSEHOLD INCOME
3.9%
WAGE / INCOME GAP [ % ]
96.1¢/ $1
WAGE / INCOME GAP [ $ ]
0.32
INEQUALITY / GINI INDEX
1,669
LABOR FORCE [ PEOPLE ]
66.8%
PERCENT IN LABOR FORCE
5.4%
UNEMPLOYMENT RATE
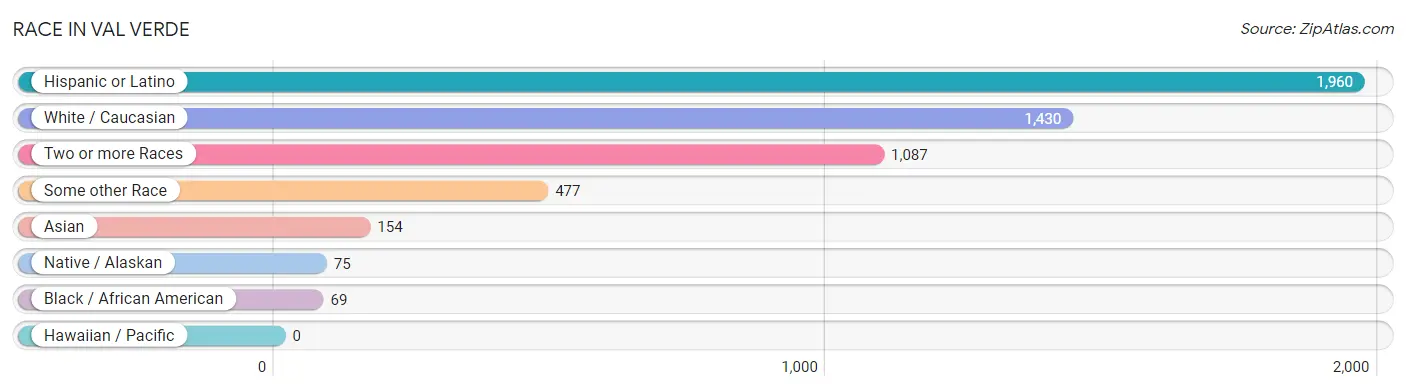
Race in Val Verde
The most populous races in Val Verde are Hispanic or Latino (1,960 | 59.5%), White / Caucasian (1,430 | 43.4%), and Two or more Races (1,087 | 33.0%).
| Race | # Population | % Population |
| Asian | 154 | 4.7% |
| Black / African American | 69 | 2.1% |
| Hawaiian / Pacific | 0 | 0.0% |
| Hispanic or Latino | 1,960 | 59.5% |
| Native / Alaskan | 75 | 2.3% |
| White / Caucasian | 1,430 | 43.4% |
| Two or more Races | 1,087 | 33.0% |
| Some other Race | 477 | 14.5% |
| Total | 3,292 | 100.0% |
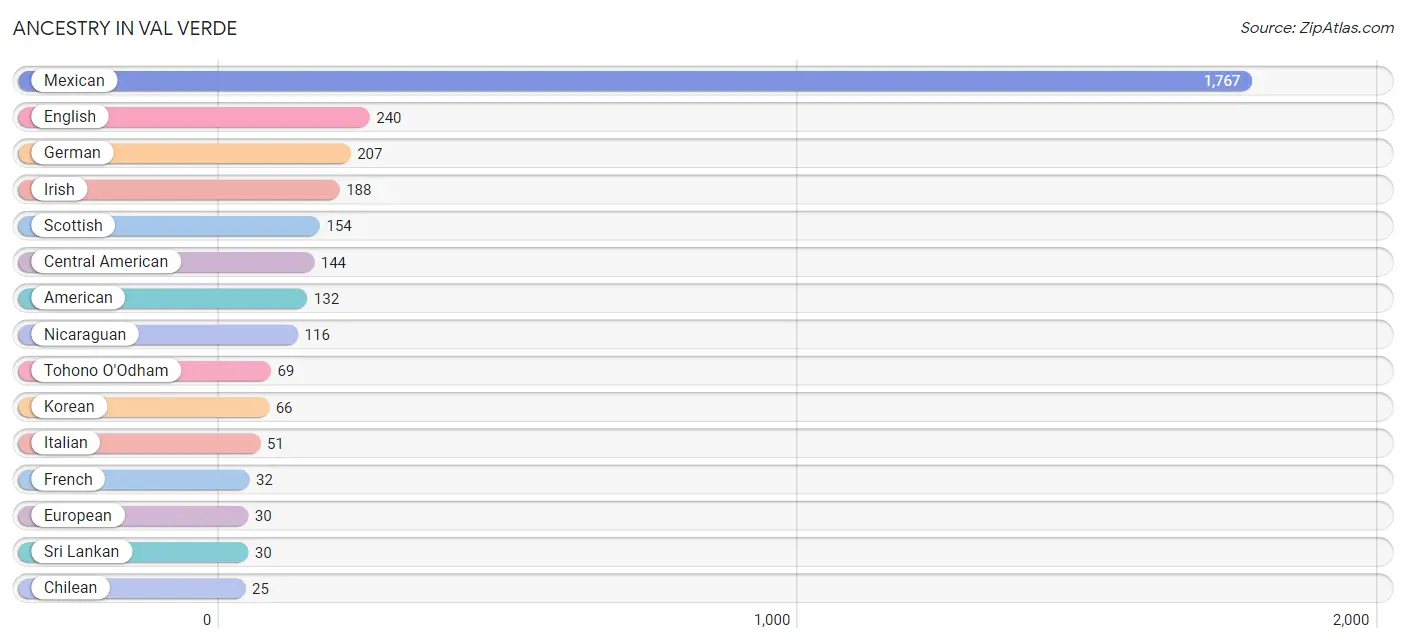
Ancestry in Val Verde
The most populous ancestries reported in Val Verde are Mexican (1,767 | 53.7%), English (240 | 7.3%), German (207 | 6.3%), Irish (188 | 5.7%), and Scottish (154 | 4.7%), together accounting for 77.6% of all Val Verde residents.
| Ancestry | # Population | % Population |
| African | 17 | 0.5% |
| American | 132 | 4.0% |
| Bhutanese | 16 | 0.5% |
| Brazilian | 6 | 0.2% |
| Burmese | 18 | 0.5% |
| Canadian | 8 | 0.2% |
| Central American | 144 | 4.4% |
| Cherokee | 9 | 0.3% |
| Chilean | 25 | 0.8% |
| Croatian | 5 | 0.2% |
| Dutch | 20 | 0.6% |
| English | 240 | 7.3% |
| European | 30 | 0.9% |
| Finnish | 23 | 0.7% |
| French | 32 | 1.0% |
| German | 207 | 6.3% |
| Guatemalan | 24 | 0.7% |
| Hungarian | 8 | 0.2% |
| Irish | 188 | 5.7% |
| Italian | 51 | 1.5% |
| Korean | 66 | 2.0% |
| Mexican | 1,767 | 53.7% |
| Mexican American Indian | 6 | 0.2% |
| Native Hawaiian | 13 | 0.4% |
| Nicaraguan | 116 | 3.5% |
| Norwegian | 21 | 0.6% |
| Pakistani | 24 | 0.7% |
| Polish | 24 | 0.7% |
| Puerto Rican | 17 | 0.5% |
| Salvadoran | 4 | 0.1% |
| Scottish | 154 | 4.7% |
| South American | 25 | 0.8% |
| Sri Lankan | 30 | 0.9% |
| Subsaharan African | 17 | 0.5% |
| Swedish | 18 | 0.5% |
| Thai | 5 | 0.2% |
| Tohono O'Odham | 69 | 2.1% |
| Welsh | 9 | 0.3% | View All 38 Rows |
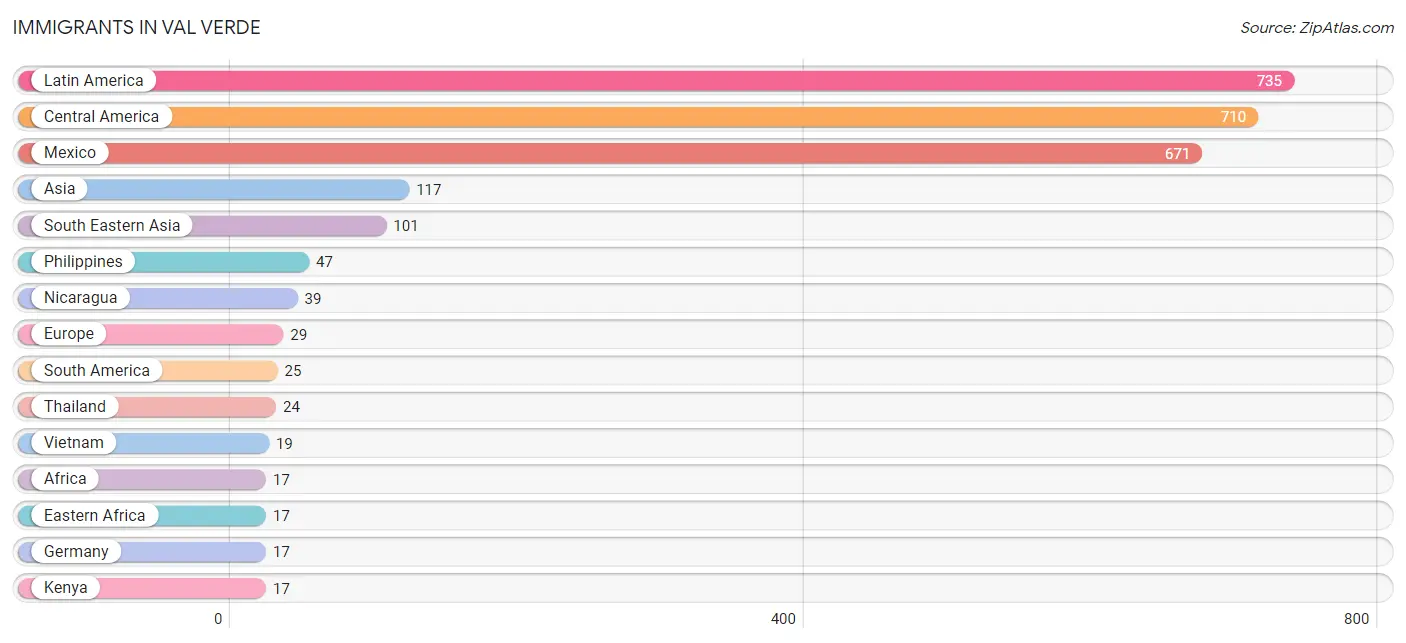
Immigrants in Val Verde
The most numerous immigrant groups reported in Val Verde came from Latin America (735 | 22.3%), Central America (710 | 21.6%), Mexico (671 | 20.4%), Asia (117 | 3.5%), and South Eastern Asia (101 | 3.1%), together accounting for 70.9% of all Val Verde residents.
| Immigration Origin | # Population | % Population |
| Africa | 17 | 0.5% |
| Asia | 117 | 3.5% |
| Brazil | 6 | 0.2% |
| Central America | 710 | 21.6% |
| Chile | 15 | 0.5% |
| Eastern Africa | 17 | 0.5% |
| Eastern Asia | 16 | 0.5% |
| Europe | 29 | 0.9% |
| Germany | 17 | 0.5% |
| Indonesia | 11 | 0.3% |
| Japan | 8 | 0.2% |
| Kenya | 17 | 0.5% |
| Korea | 8 | 0.2% |
| Latin America | 735 | 22.3% |
| Mexico | 671 | 20.4% |
| Nicaragua | 39 | 1.2% |
| Northern Europe | 12 | 0.4% |
| Peru | 4 | 0.1% |
| Philippines | 47 | 1.4% |
| South America | 25 | 0.8% |
| South Eastern Asia | 101 | 3.1% |
| Thailand | 24 | 0.7% |
| Vietnam | 19 | 0.6% |
| Western Europe | 17 | 0.5% | View All 24 Rows |
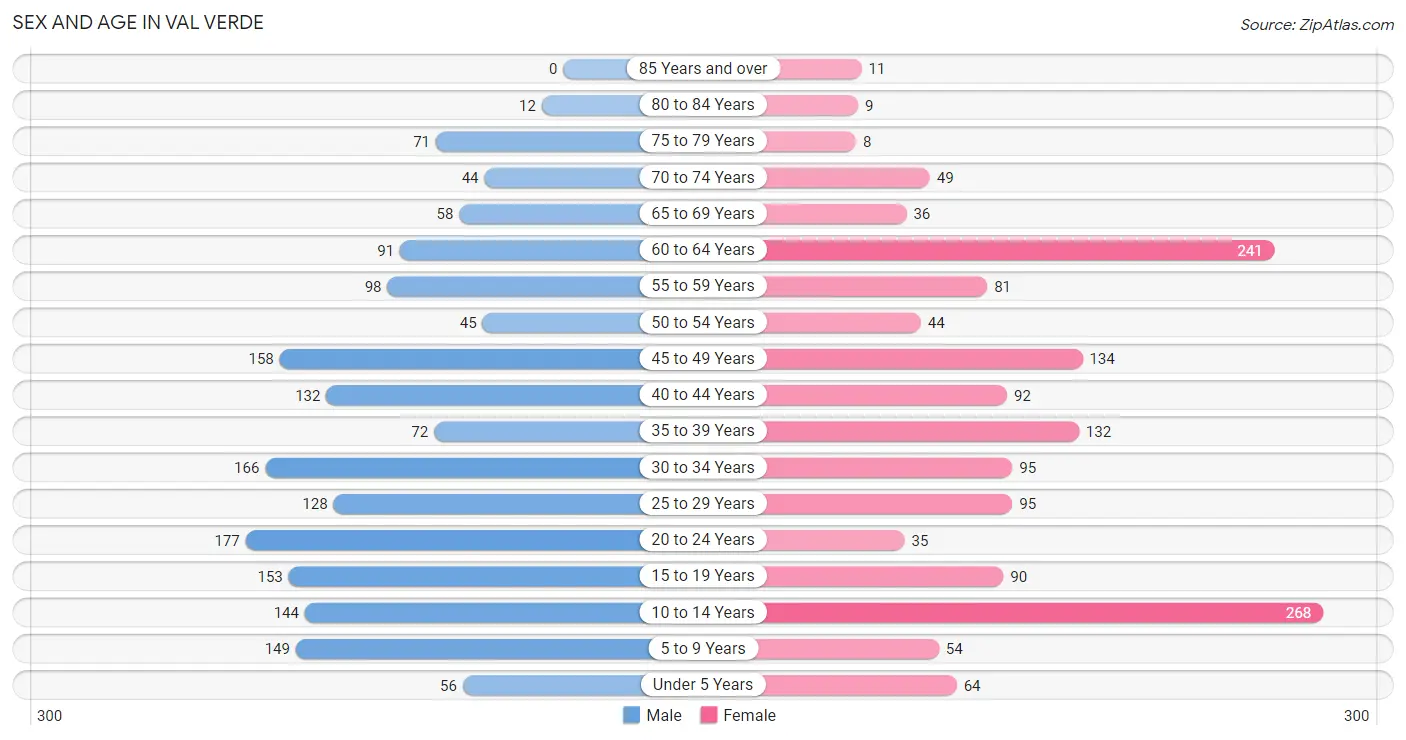
Sex and Age in Val Verde
Sex and Age in Val Verde
The most populous age groups in Val Verde are 20 to 24 Years (177 | 10.1%) for men and 10 to 14 Years (268 | 17.4%) for women.
| Age Bracket | Male | Female |
| Under 5 Years | 56 (3.2%) | 64 (4.2%) |
| 5 to 9 Years | 149 (8.5%) | 54 (3.5%) |
| 10 to 14 Years | 144 (8.2%) | 268 (17.4%) |
| 15 to 19 Years | 153 (8.7%) | 90 (5.9%) |
| 20 to 24 Years | 177 (10.1%) | 35 (2.3%) |
| 25 to 29 Years | 128 (7.3%) | 95 (6.2%) |
| 30 to 34 Years | 166 (9.5%) | 95 (6.2%) |
| 35 to 39 Years | 72 (4.1%) | 132 (8.6%) |
| 40 to 44 Years | 132 (7.5%) | 92 (6.0%) |
| 45 to 49 Years | 158 (9.0%) | 134 (8.7%) |
| 50 to 54 Years | 45 (2.6%) | 44 (2.9%) |
| 55 to 59 Years | 98 (5.6%) | 81 (5.3%) |
| 60 to 64 Years | 91 (5.2%) | 241 (15.7%) |
| 65 to 69 Years | 58 (3.3%) | 36 (2.3%) |
| 70 to 74 Years | 44 (2.5%) | 49 (3.2%) |
| 75 to 79 Years | 71 (4.1%) | 8 (0.5%) |
| 80 to 84 Years | 12 (0.7%) | 9 (0.6%) |
| 85 Years and over | 0 (0.0%) | 11 (0.7%) |
| Total | 1,754 (100.0%) | 1,538 (100.0%) |
Families and Households in Val Verde
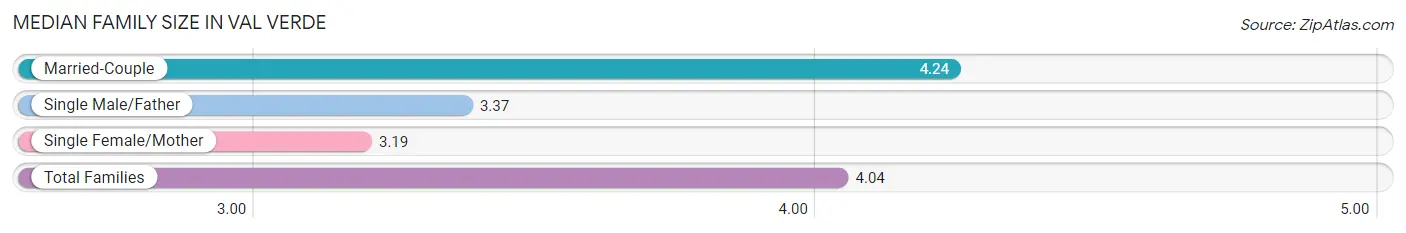
Median Family Size in Val Verde
The median family size in Val Verde is 4.04 persons per family, with married-couple families (581 | 78.7%) accounting for the largest median family size of 4.24 persons per family. On the other hand, single female/mother families (67 | 9.1%) represent the smallest median family size with 3.19 persons per family.
| Family Type | # Families | Family Size |
| Married-Couple | 581 (78.7%) | 4.24 |
| Single Male/Father | 90 (12.2%) | 3.37 |
| Single Female/Mother | 67 (9.1%) | 3.19 |
| Total Families | 738 (100.0%) | 4.04 |
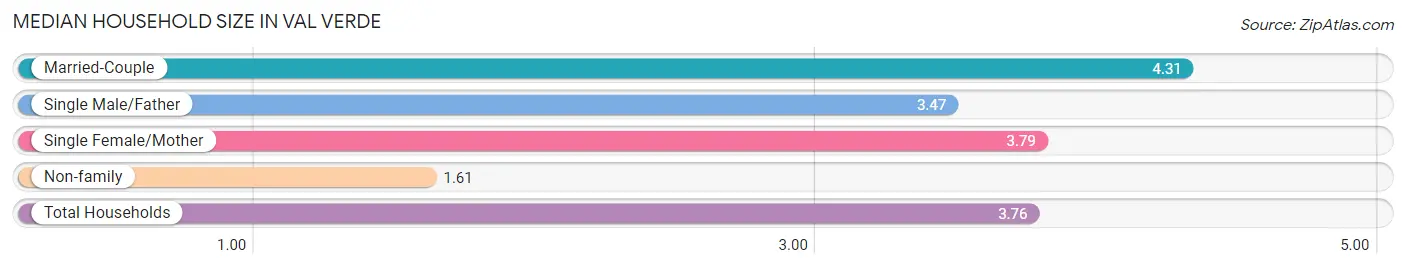
Median Household Size in Val Verde
The median household size in Val Verde is 3.76 persons per household, with married-couple households (581 | 66.3%) accounting for the largest median household size of 4.31 persons per household. non-family households (138 | 15.8%) represent the smallest median household size with 1.61 persons per household.
| Household Type | # Households | Household Size |
| Married-Couple | 581 (66.3%) | 4.31 |
| Single Male/Father | 90 (10.3%) | 3.47 |
| Single Female/Mother | 67 (7.6%) | 3.79 |
| Non-family | 138 (15.8%) | 1.61 |
| Total Households | 876 (100.0%) | 3.76 |
Household Size by Marriage Status in Val Verde
Out of a total of 876 households in Val Verde, 738 (84.3%) are family households, while 138 (15.8%) are nonfamily households. The most numerous type of family households are 4-person households, comprising 231, and the most common type of nonfamily households are 1-person households, comprising 72.

| Household Size | Family Households | Nonfamily Households |
| 1-Person Households | - | 72 (8.2%) |
| 2-Person Households | 152 (17.3%) | 56 (6.4%) |
| 3-Person Households | 125 (14.3%) | 10 (1.1%) |
| 4-Person Households | 231 (26.4%) | 0 (0.0%) |
| 5-Person Households | 124 (14.2%) | 0 (0.0%) |
| 6-Person Households | 83 (9.5%) | 0 (0.0%) |
| 7+ Person Households | 23 (2.6%) | 0 (0.0%) |
| Total | 738 (84.3%) | 138 (15.8%) |
Female Fertility in Val Verde
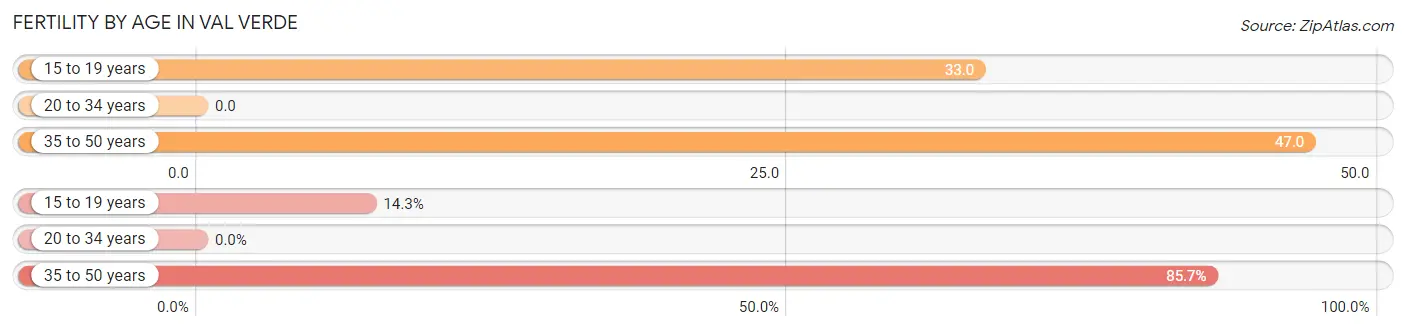
Fertility by Age in Val Verde
Average fertility rate in Val Verde is 30.0 births per 1,000 women. Women in the age bracket of 35 to 50 years have the highest fertility rate with 47.0 births per 1,000 women. Women in the age bracket of 35 to 50 years acount for 85.7% of all women with births.
| Age Bracket | Women with Births | Births / 1,000 Women |
| 15 to 19 years | 3 (14.3%) | 33.0 |
| 20 to 34 years | 0 (0.0%) | 0.0 |
| 35 to 50 years | 18 (85.7%) | 47.0 |
| Total | 21 (100.0%) | 30.0 |
Fertility by Age by Marriage Status in Val Verde
85.7% of women with births (21) in Val Verde are married. The highest percentage of unmarried women with births falls into 15 to 19 years age bracket with 100.0% of them unmarried at the time of birth, while the lowest percentage of unmarried women with births belong to 35 to 50 years age bracket with 0.0% of them unmarried.
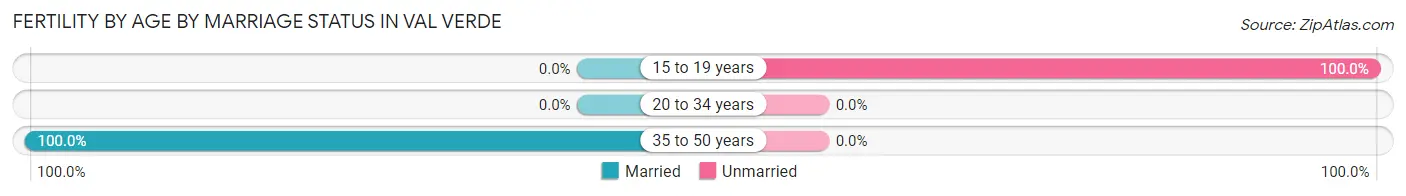
| Age Bracket | Married | Unmarried |
| 15 to 19 years | 0 (0.0%) | 3 (100.0%) |
| 20 to 34 years | 0 (0.0%) | 0 (0.0%) |
| 35 to 50 years | 18 (100.0%) | 0 (0.0%) |
| Total | 18 (85.7%) | 3 (14.3%) |
Fertility by Education in Val Verde
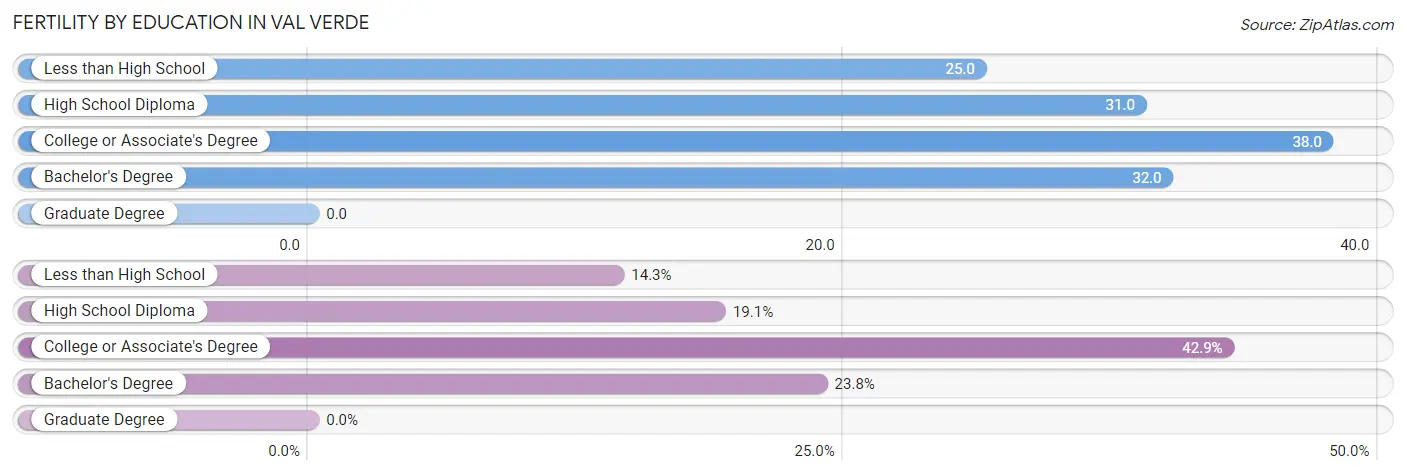
| Educational Attainment | Women with Births | Births / 1,000 Women |
| Less than High School | 3 (14.3%) | 25.0 |
| High School Diploma | 4 (19.1%) | 31.0 |
| College or Associate's Degree | 9 (42.9%) | 38.0 |
| Bachelor's Degree | 5 (23.8%) | 32.0 |
| Graduate Degree | 0 (0.0%) | 0.0 |
| Total | 21 (100.0%) | 30.0 |
Fertility by Education by Marriage Status in Val Verde
14.3% of women with births in Val Verde are unmarried. Women with the educational attainment of high school diploma are most likely to be married with 100.0% of them married at childbirth, while women with the educational attainment of less than high school are least likely to be married with 100.0% of them unmarried at childbirth.
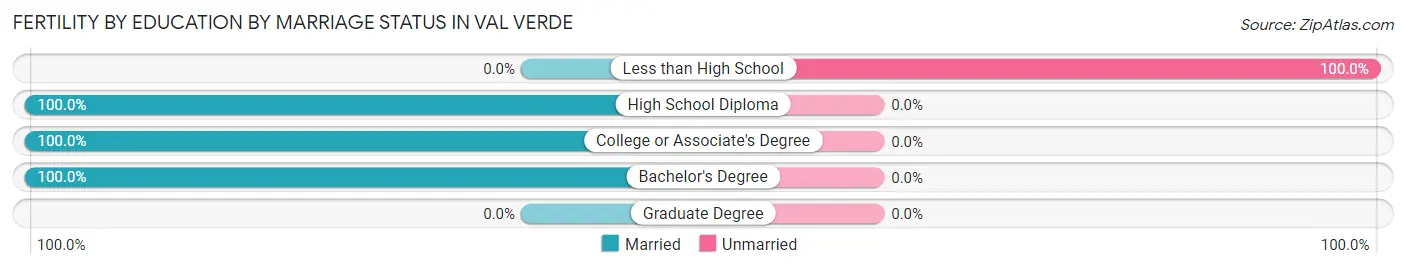
| Educational Attainment | Married | Unmarried |
| Less than High School | 0 (0.0%) | 3 (100.0%) |
| High School Diploma | 4 (100.0%) | 0 (0.0%) |
| College or Associate's Degree | 9 (100.0%) | 0 (0.0%) |
| Bachelor's Degree | 5 (100.0%) | 0 (0.0%) |
| Graduate Degree | 0 (0.0%) | 0 (0.0%) |
| Total | 18 (85.7%) | 3 (14.3%) |
Income in Val Verde
Income Overview in Val Verde
Per Capita Income in Val Verde is $31,857, while median incomes of families and households are $110,870 and $107,381 respectively.
| Characteristic | Number | Measure |
| Per Capita Income | 3,292 | $31,857 |
| Median Family Income | 738 | $110,870 |
| Mean Family Income | 738 | $119,875 |
| Median Household Income | 876 | $107,381 |
| Mean Household Income | 876 | $114,245 |
| Income Deficit | 738 | $0 |
| Wage / Income Gap (%) | 3,292 | 3.90% |
| Wage / Income Gap ($) | 3,292 | 96.10¢ per $1 |
| Gini / Inequality Index | 3,292 | 0.32 |
Earnings by Sex in Val Verde
Average Earnings in Val Verde are $40,324, $39,375 for men and $40,972 for women, a difference of 3.9%.
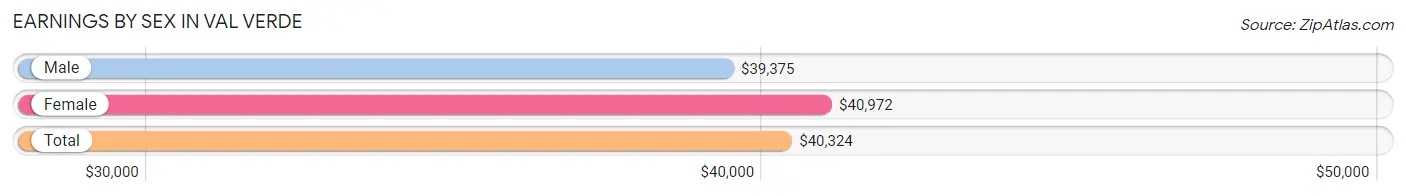
| Sex | Number | Average Earnings |
| Male | 963 (56.4%) | $39,375 |
| Female | 746 (43.6%) | $40,972 |
| Total | 1,709 (100.0%) | $40,324 |
Earnings by Sex by Income Bracket in Val Verde
The most common earnings brackets in Val Verde are $25,000 to $29,999 for men (202 | 21.0%) and $75,000 to $99,999 for women (131 | 17.6%).
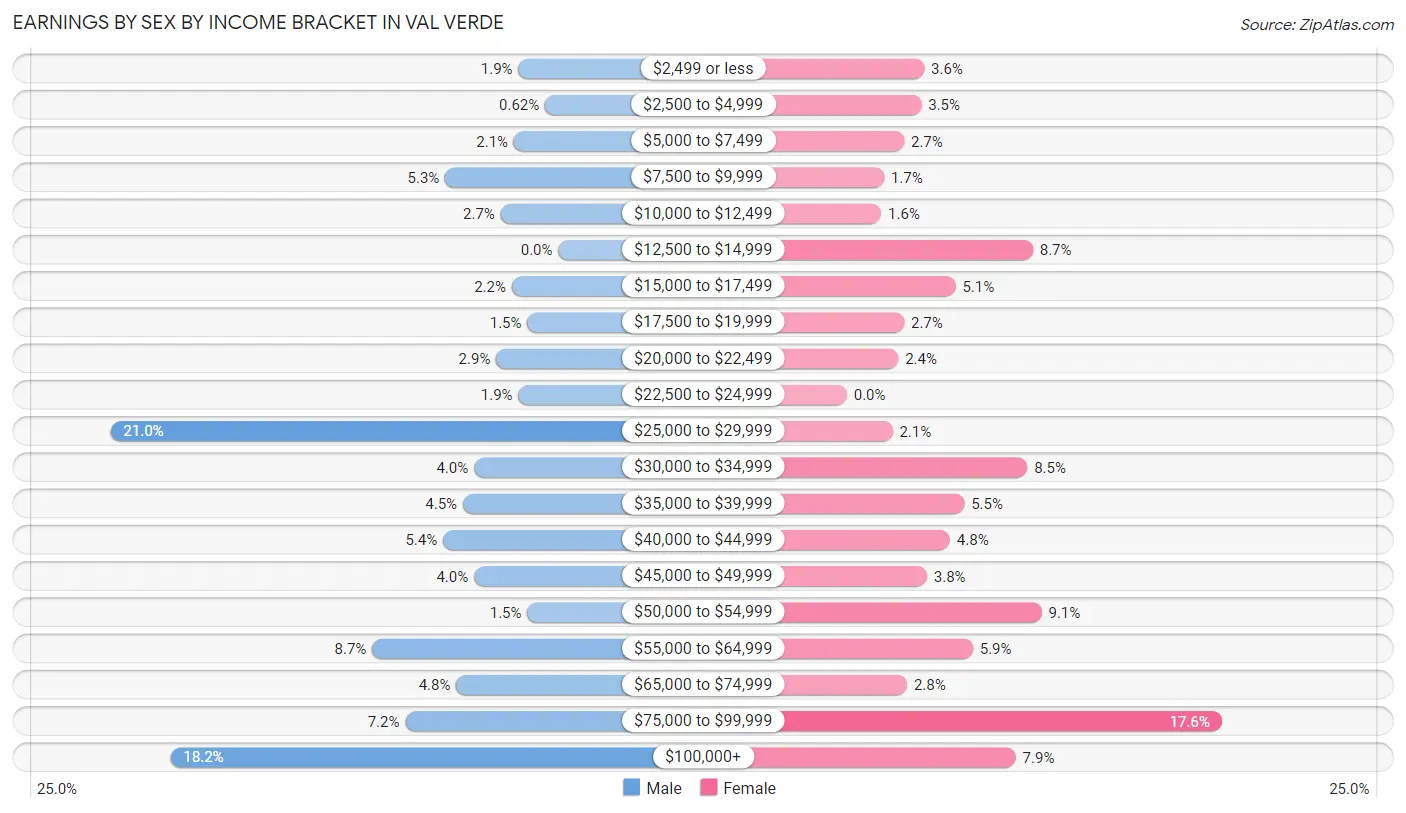
| Income | Male | Female |
| $2,499 or less | 18 (1.9%) | 27 (3.6%) |
| $2,500 to $4,999 | 6 (0.6%) | 26 (3.5%) |
| $5,000 to $7,499 | 20 (2.1%) | 20 (2.7%) |
| $7,500 to $9,999 | 51 (5.3%) | 13 (1.7%) |
| $10,000 to $12,499 | 26 (2.7%) | 12 (1.6%) |
| $12,500 to $14,999 | 0 (0.0%) | 65 (8.7%) |
| $15,000 to $17,499 | 21 (2.2%) | 38 (5.1%) |
| $17,500 to $19,999 | 14 (1.5%) | 20 (2.7%) |
| $20,000 to $22,499 | 28 (2.9%) | 18 (2.4%) |
| $22,500 to $24,999 | 18 (1.9%) | 0 (0.0%) |
| $25,000 to $29,999 | 202 (21.0%) | 16 (2.1%) |
| $30,000 to $34,999 | 38 (4.0%) | 63 (8.5%) |
| $35,000 to $39,999 | 43 (4.5%) | 41 (5.5%) |
| $40,000 to $44,999 | 52 (5.4%) | 36 (4.8%) |
| $45,000 to $49,999 | 38 (4.0%) | 28 (3.7%) |
| $50,000 to $54,999 | 14 (1.5%) | 68 (9.1%) |
| $55,000 to $64,999 | 84 (8.7%) | 44 (5.9%) |
| $65,000 to $74,999 | 46 (4.8%) | 21 (2.8%) |
| $75,000 to $99,999 | 69 (7.2%) | 131 (17.6%) |
| $100,000+ | 175 (18.2%) | 59 (7.9%) |
| Total | 963 (100.0%) | 746 (100.0%) |
Earnings by Sex by Educational Attainment in Val Verde
Average earnings in Val Verde are $44,464 for men and $45,852 for women, a difference of 3.0%. Men with an educational attainment of bachelor's degree enjoy the highest average annual earnings of $130,250, while those with less than high school education earn the least with $26,406. Women with an educational attainment of graduate degree earn the most with the average annual earnings of $99,583, while those with high school diploma education have the smallest earnings of $33,313.
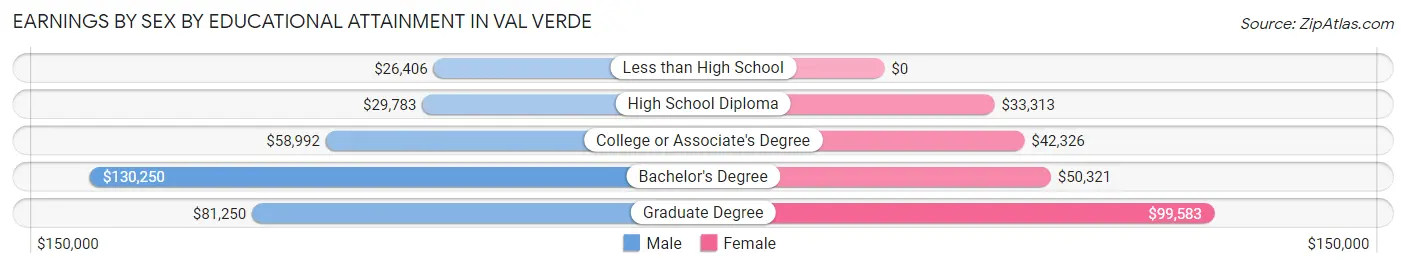
| Educational Attainment | Male Income | Female Income |
| Less than High School | $26,406 | $0 |
| High School Diploma | $29,783 | $33,313 |
| College or Associate's Degree | $58,992 | $42,326 |
| Bachelor's Degree | $130,250 | $50,321 |
| Graduate Degree | $81,250 | $99,583 |
| Total | $44,464 | $45,852 |
Family Income in Val Verde
Family Income Brackets in Val Verde
According to the Val Verde family income data, there are 209 families falling into the $100,000 to $149,999 income range, which is the most common income bracket and makes up 28.3% of all families.
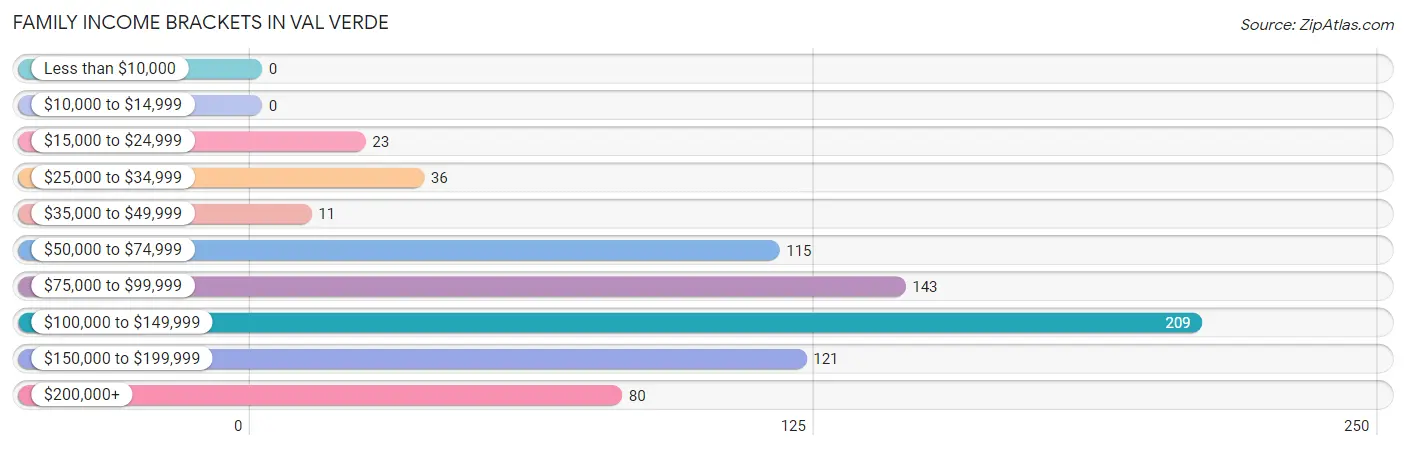
| Income Bracket | # Families | % Families |
| Less than $10,000 | 0 | 0.0% |
| $10,000 to $14,999 | 0 | 0.0% |
| $15,000 to $24,999 | 23 | 3.1% |
| $25,000 to $34,999 | 36 | 4.9% |
| $35,000 to $49,999 | 11 | 1.5% |
| $50,000 to $74,999 | 115 | 15.6% |
| $75,000 to $99,999 | 143 | 19.4% |
| $100,000 to $149,999 | 209 | 28.3% |
| $150,000 to $199,999 | 121 | 16.4% |
| $200,000+ | 80 | 10.8% |
Family Income by Famaliy Size in Val Verde
4-person families (179 | 24.2%) account for the highest median family income in Val Verde with $183,325 per family, while 2-person families (163 | 22.1%) have the highest median income of $55,521 per family member.
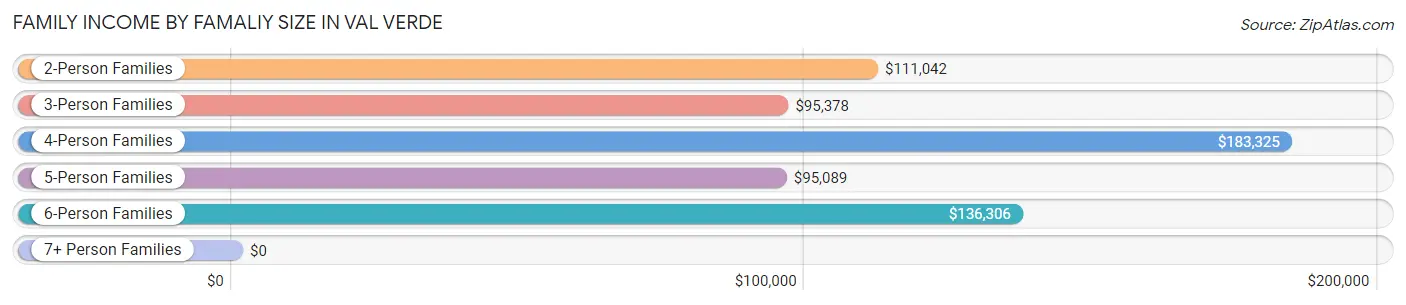
| Income Bracket | # Families | Median Income |
| 2-Person Families | 163 (22.1%) | $111,042 |
| 3-Person Families | 173 (23.4%) | $95,378 |
| 4-Person Families | 179 (24.2%) | $183,325 |
| 5-Person Families | 117 (15.9%) | $95,089 |
| 6-Person Families | 86 (11.7%) | $136,306 |
| 7+ Person Families | 20 (2.7%) | $0 |
| Total | 738 (100.0%) | $110,870 |
Family Income by Number of Earners in Val Verde

| Number of Earners | # Families | Median Income |
| No Earners | 26 (3.5%) | $0 |
| 1 Earner | 140 (19.0%) | $96,570 |
| 2 Earners | 467 (63.3%) | $120,469 |
| 3+ Earners | 105 (14.2%) | $125,268 |
| Total | 738 (100.0%) | $110,870 |
Household Income in Val Verde
Household Income Brackets in Val Verde
With 287 households falling in the category, the $100,000 to $149,999 income range is the most frequent in Val Verde, accounting for 32.8% of all households.

| Income Bracket | # Households | % Households |
| Less than $10,000 | 5 | 0.6% |
| $10,000 to $14,999 | 0 | 0.0% |
| $15,000 to $24,999 | 50 | 5.7% |
| $25,000 to $34,999 | 56 | 6.4% |
| $35,000 to $49,999 | 18 | 2.1% |
| $50,000 to $74,999 | 144 | 16.4% |
| $75,000 to $99,999 | 107 | 12.2% |
| $100,000 to $149,999 | 287 | 32.8% |
| $150,000 to $199,999 | 121 | 13.8% |
| $200,000+ | 88 | 10.0% |
Household Income by Householder Age in Val Verde
The median household income in Val Verde is $107,381, with the highest median household income of $116,838 found in the 25 to 44 years age bracket for the primary householder. A total of 293 households (33.5%) fall into this category. Meanwhile, the 15 to 24 years age bracket for the primary householder has the lowest median household income of $0, with 8 households (0.9%) in this group.
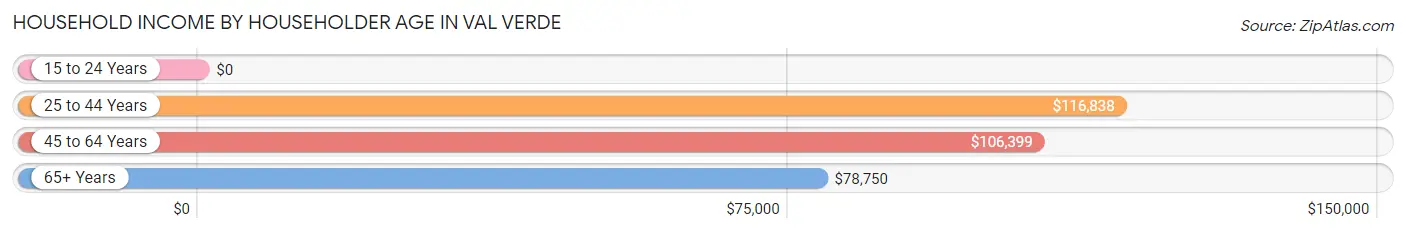
| Income Bracket | # Households | Median Income |
| 15 to 24 Years | 8 (0.9%) | $0 |
| 25 to 44 Years | 293 (33.5%) | $116,838 |
| 45 to 64 Years | 413 (47.1%) | $106,399 |
| 65+ Years | 162 (18.5%) | $78,750 |
| Total | 876 (100.0%) | $107,381 |
Poverty in Val Verde
Income Below Poverty by Sex and Age in Val Verde
With 4.6% poverty level for males and 4.4% for females among the residents of Val Verde, 65 to 74 year old males and 18 to 24 year old females are the most vulnerable to poverty, with 21 males (20.6%) and 14 females (19.7%) in their respective age groups living below the poverty level.
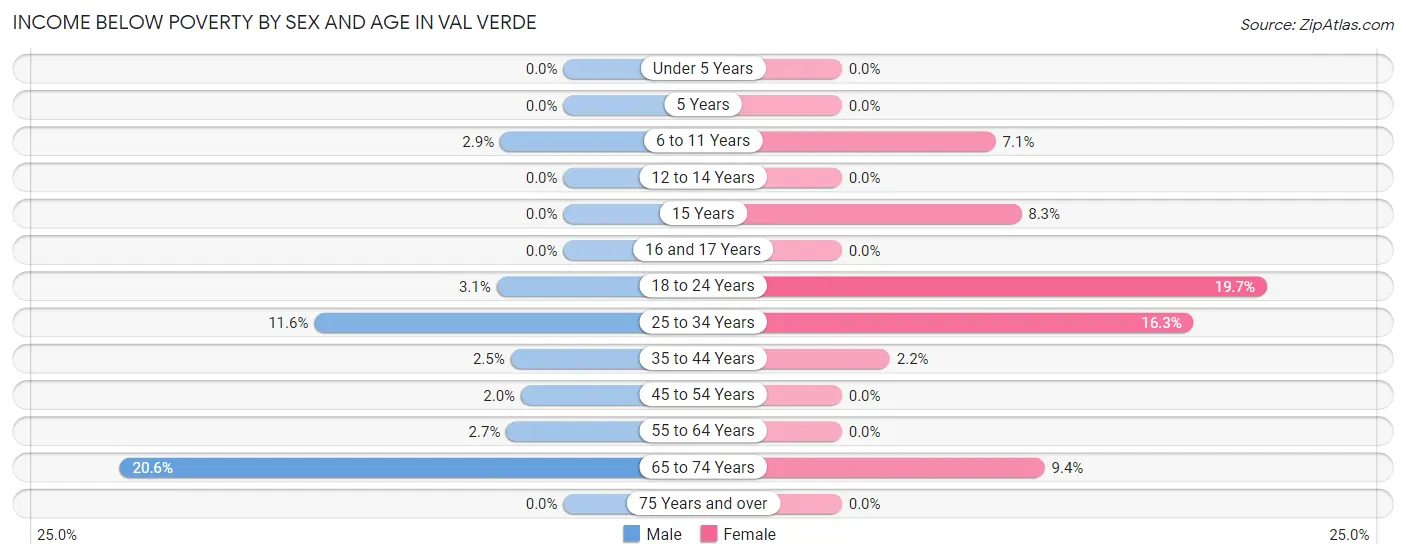
| Age Bracket | Male | Female |
| Under 5 Years | 0 (0.0%) | 0 (0.0%) |
| 5 Years | 0 (0.0%) | 0 (0.0%) |
| 6 to 11 Years | 5 (2.9%) | 6 (7.1%) |
| 12 to 14 Years | 0 (0.0%) | 0 (0.0%) |
| 15 Years | 0 (0.0%) | 3 (8.3%) |
| 16 and 17 Years | 0 (0.0%) | 0 (0.0%) |
| 18 to 24 Years | 7 (3.1%) | 14 (19.7%) |
| 25 to 34 Years | 34 (11.6%) | 31 (16.3%) |
| 35 to 44 Years | 5 (2.5%) | 5 (2.2%) |
| 45 to 54 Years | 4 (2.0%) | 0 (0.0%) |
| 55 to 64 Years | 5 (2.6%) | 0 (0.0%) |
| 65 to 74 Years | 21 (20.6%) | 8 (9.4%) |
| 75 Years and over | 0 (0.0%) | 0 (0.0%) |
| Total | 81 (4.6%) | 67 (4.4%) |
Income Above Poverty by Sex and Age in Val Verde
According to the poverty statistics in Val Verde, males aged under 5 years and females aged under 5 years are the age groups that are most secure financially, with 100.0% of males and 100.0% of females in these age groups living above the poverty line.
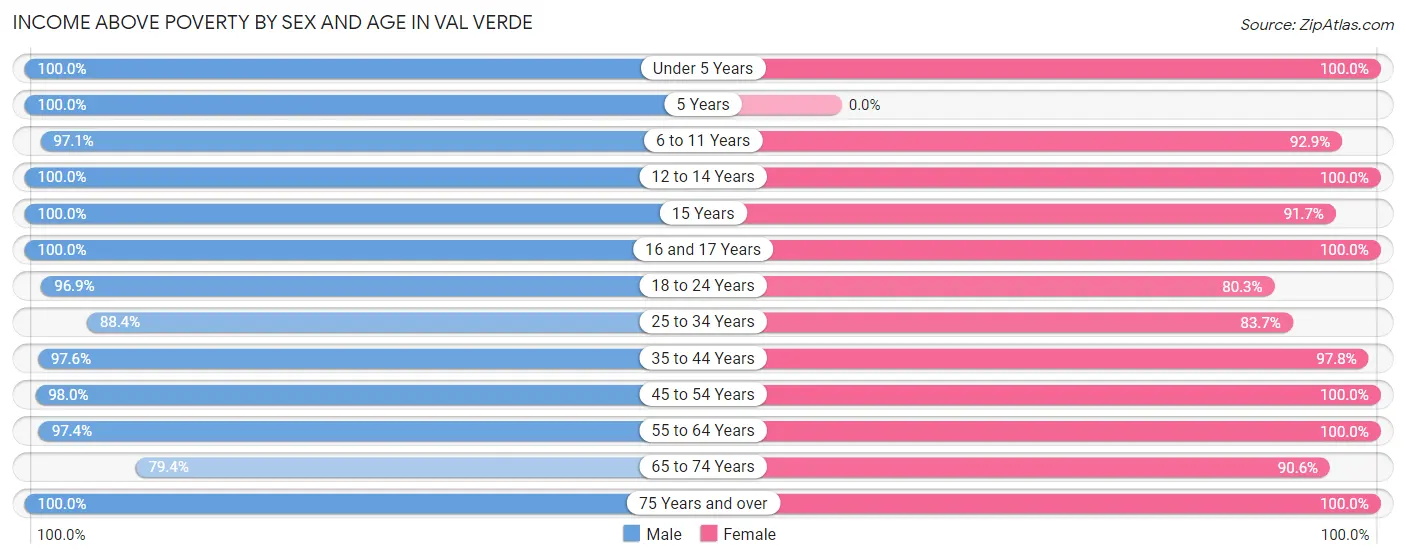
| Age Bracket | Male | Female |
| Under 5 Years | 56 (100.0%) | 64 (100.0%) |
| 5 Years | 14 (100.0%) | 0 (0.0%) |
| 6 to 11 Years | 165 (97.1%) | 78 (92.9%) |
| 12 to 14 Years | 109 (100.0%) | 238 (100.0%) |
| 15 Years | 22 (100.0%) | 33 (91.7%) |
| 16 and 17 Years | 82 (100.0%) | 18 (100.0%) |
| 18 to 24 Years | 219 (96.9%) | 57 (80.3%) |
| 25 to 34 Years | 260 (88.4%) | 159 (83.7%) |
| 35 to 44 Years | 199 (97.6%) | 219 (97.8%) |
| 45 to 54 Years | 199 (98.0%) | 178 (100.0%) |
| 55 to 64 Years | 184 (97.4%) | 322 (100.0%) |
| 65 to 74 Years | 81 (79.4%) | 77 (90.6%) |
| 75 Years and over | 83 (100.0%) | 28 (100.0%) |
| Total | 1,673 (95.4%) | 1,471 (95.6%) |
Income Below Poverty Among Married-Couple Families in Val Verde
The poverty statistics for married-couple families in Val Verde show that 2.2% or 13 of the total 581 families live below the poverty line. Families with no children have the highest poverty rate of 3.7%, comprising of 8 families. On the other hand, families with 3 or 4 children have the lowest poverty rate of 0.0%, which includes 0 families.
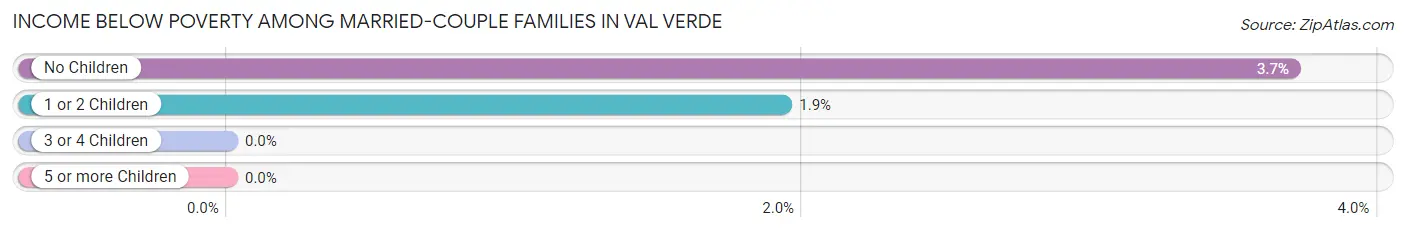
| Children | Above Poverty | Below Poverty |
| No Children | 208 (96.3%) | 8 (3.7%) |
| 1 or 2 Children | 254 (98.1%) | 5 (1.9%) |
| 3 or 4 Children | 106 (100.0%) | 0 (0.0%) |
| 5 or more Children | 0 (0.0%) | 0 (0.0%) |
| Total | 568 (97.8%) | 13 (2.2%) |
Income Below Poverty Among Single-Parent Households in Val Verde
| Children | Single Father | Single Mother |
| No Children | 0 (0.0%) | 0 (0.0%) |
| 1 or 2 Children | 0 (0.0%) | 0 (0.0%) |
| 3 or 4 Children | 0 (0.0%) | 0 (0.0%) |
| 5 or more Children | 0 (0.0%) | 0 (0.0%) |
| Total | 0 (0.0%) | 0 (0.0%) |
Income Below Poverty Among Married-Couple vs Single-Parent Households in Val Verde
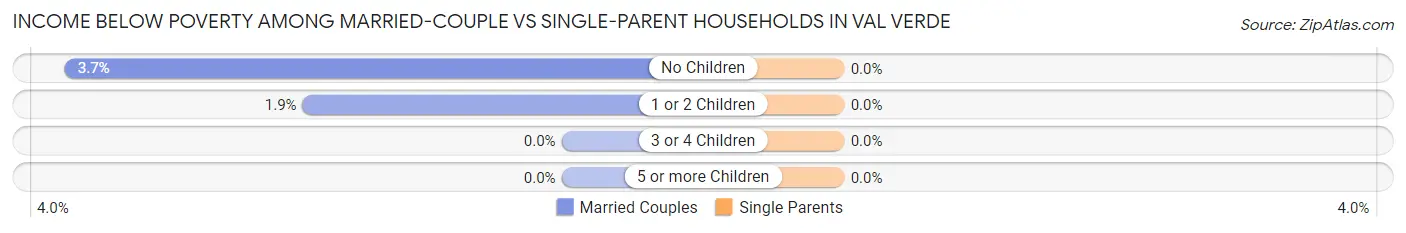
| Children | Married-Couple Families | Single-Parent Households |
| No Children | 8 (3.7%) | 0 (0.0%) |
| 1 or 2 Children | 5 (1.9%) | 0 (0.0%) |
| 3 or 4 Children | 0 (0.0%) | 0 (0.0%) |
| 5 or more Children | 0 (0.0%) | 0 (0.0%) |
| Total | 13 (2.2%) | 0 (0.0%) |
Employment Characteristics in Val Verde
Employment by Class of Employer in Val Verde
Among the 1,457 employed individuals in Val Verde, private company employees (1,009 | 69.3%), local government employees (145 | 10.0%), and self-employed (not incorporated) (122 | 8.4%) make up the most common classes of employment.
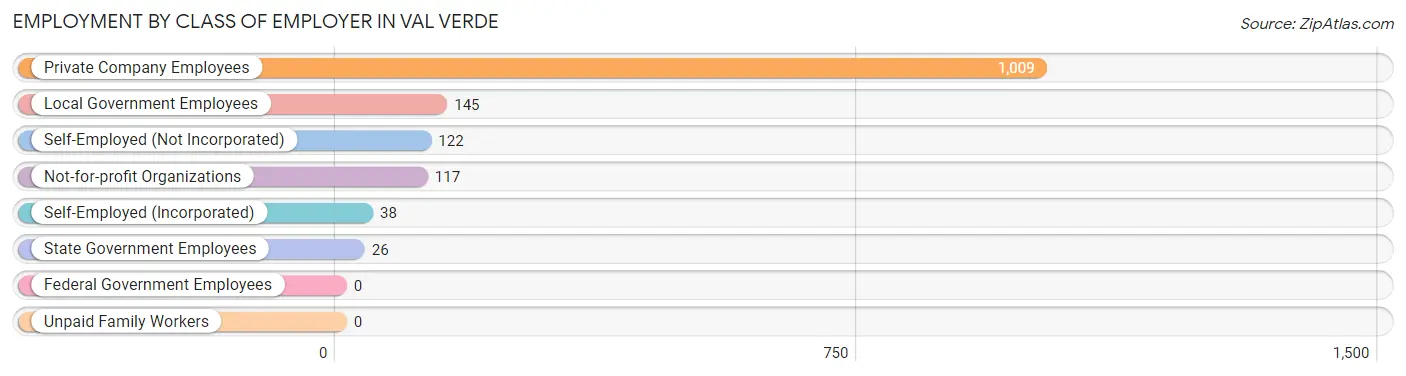
| Employer Class | # Employees | % Employees |
| Private Company Employees | 1,009 | 69.3% |
| Self-Employed (Incorporated) | 38 | 2.6% |
| Self-Employed (Not Incorporated) | 122 | 8.4% |
| Not-for-profit Organizations | 117 | 8.0% |
| Local Government Employees | 145 | 10.0% |
| State Government Employees | 26 | 1.8% |
| Federal Government Employees | 0 | 0.0% |
| Unpaid Family Workers | 0 | 0.0% |
| Total | 1,457 | 100.0% |
Employment Status by Age in Val Verde
According to the labor force statistics for Val Verde, out of the total population over 16 years of age (2,499), 66.8% or 1,669 individuals are in the labor force, with 5.4% or 90 of them unemployed. The age group with the highest labor force participation rate is 30 to 34 years, with 93.1% or 243 individuals in the labor force. Within the labor force, the 16 to 19 years age range has the highest percentage of unemployed individuals, with 33.8% or 22 of them being unemployed.
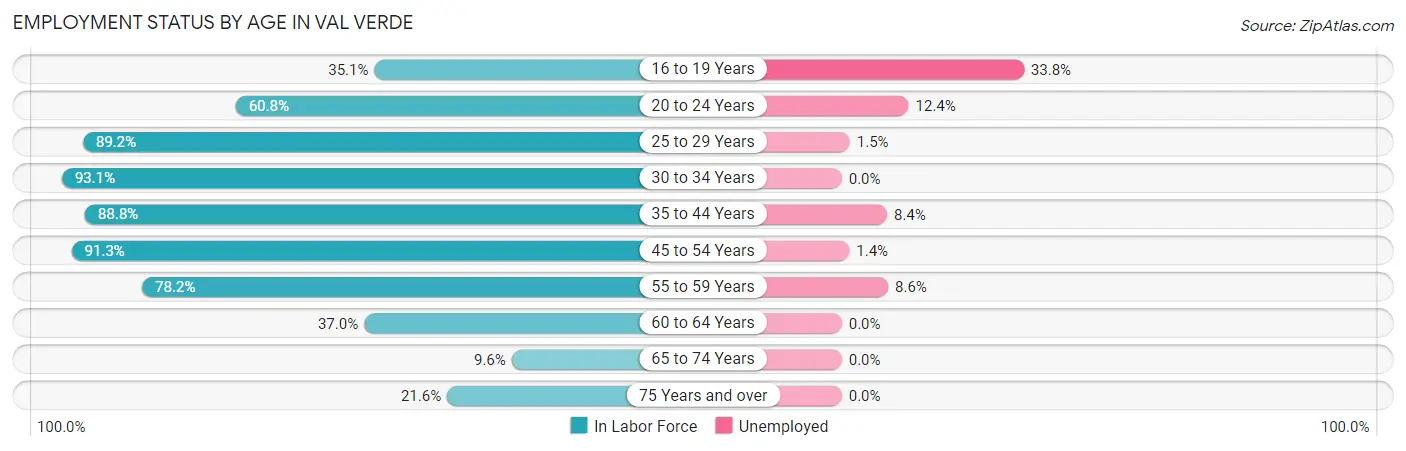
| Age Bracket | In Labor Force | Unemployed |
| 16 to 19 Years | 65 (35.1%) | 22 (33.8%) |
| 20 to 24 Years | 129 (60.8%) | 16 (12.4%) |
| 25 to 29 Years | 199 (89.2%) | 3 (1.5%) |
| 30 to 34 Years | 243 (93.1%) | 0 (0.0%) |
| 35 to 44 Years | 380 (88.8%) | 32 (8.4%) |
| 45 to 54 Years | 348 (91.3%) | 5 (1.4%) |
| 55 to 59 Years | 140 (78.2%) | 12 (8.6%) |
| 60 to 64 Years | 123 (37.0%) | 0 (0.0%) |
| 65 to 74 Years | 18 (9.6%) | 0 (0.0%) |
| 75 Years and over | 24 (21.6%) | 0 (0.0%) |
| Total | 1,669 (66.8%) | 90 (5.4%) |
Employment Status by Educational Attainment in Val Verde
According to labor force statistics for Val Verde, 79.4% of individuals (1,432) out of the total population between 25 and 64 years of age (1,804) are in the labor force, with 3.6% or 52 of them being unemployed. The group with the highest labor force participation rate are those with the educational attainment of college / associate degree, with 88.1% or 592 individuals in the labor force. Within the labor force, individuals with less than high school education have the highest percentage of unemployment, with 24.0% or 37 of them being unemployed.
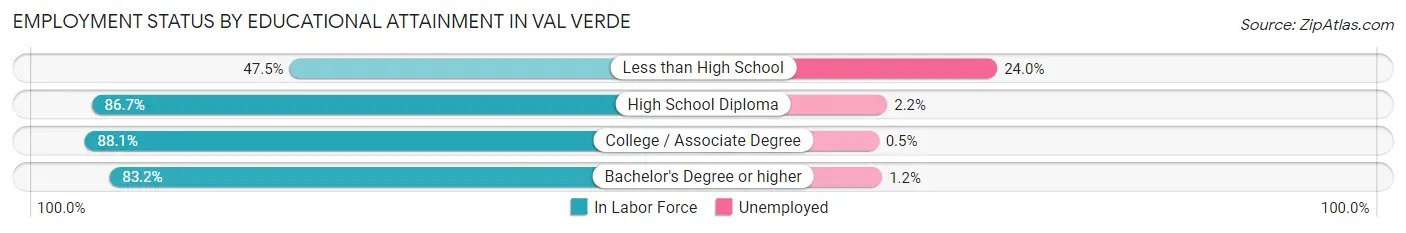
| Educational Attainment | In Labor Force | Unemployed |
| Less than High School | 154 (47.5%) | 78 (24.0%) |
| High School Diploma | 364 (86.7%) | 9 (2.2%) |
| College / Associate Degree | 592 (88.1%) | 3 (0.5%) |
| Bachelor's Degree or higher | 323 (83.2%) | 5 (1.2%) |
| Total | 1,432 (79.4%) | 65 (3.6%) |
Employment Occupations by Sex in Val Verde
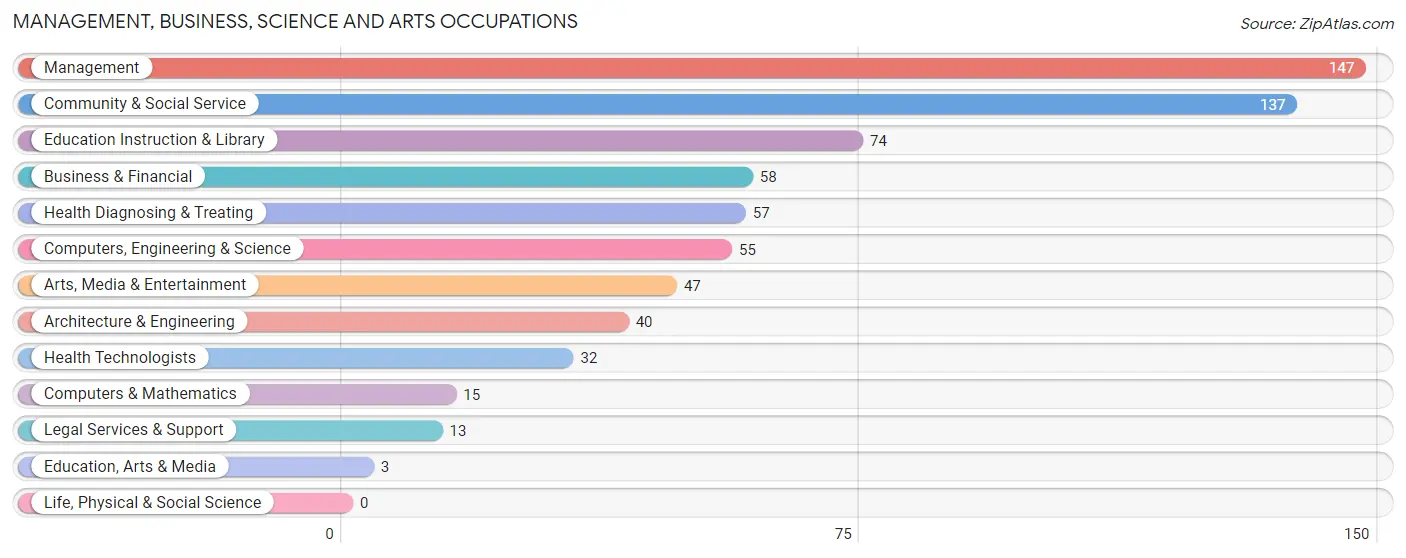
Management, Business, Science and Arts Occupations
The most common Management, Business, Science and Arts occupations in Val Verde are Management (147 | 9.3%), Community & Social Service (137 | 8.7%), Education Instruction & Library (74 | 4.7%), Business & Financial (58 | 3.7%), and Health Diagnosing & Treating (57 | 3.6%).
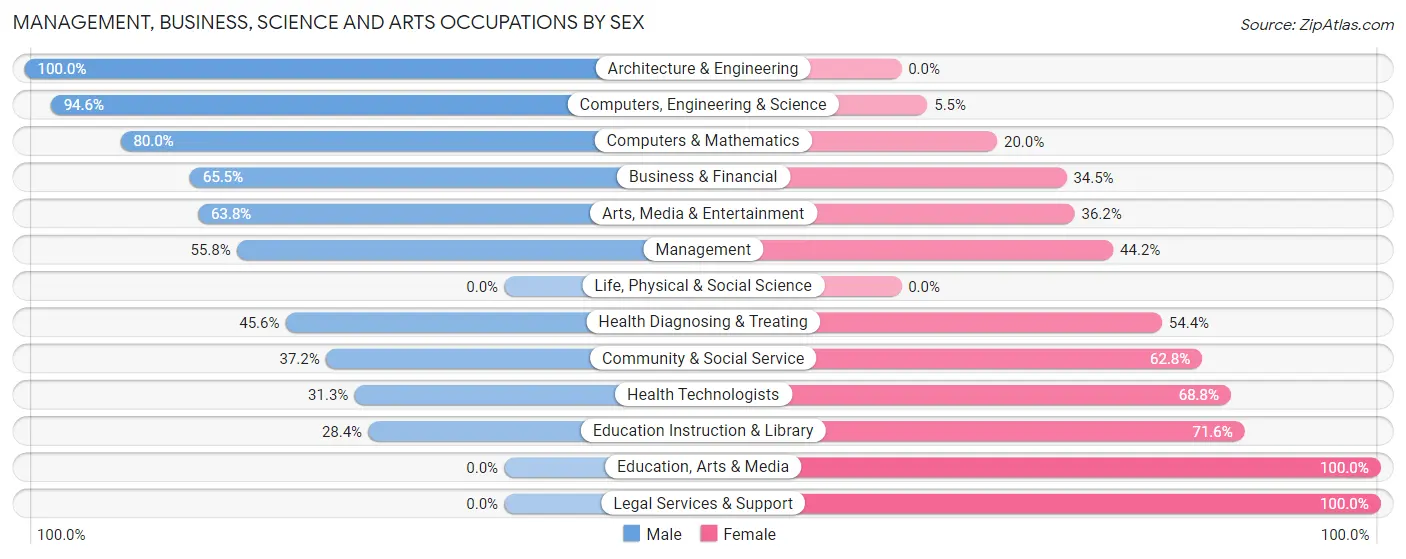
Management, Business, Science and Arts Occupations by Sex
Within the Management, Business, Science and Arts occupations in Val Verde, the most male-oriented occupations are Architecture & Engineering (100.0%), Computers, Engineering & Science (94.6%), and Computers & Mathematics (80.0%), while the most female-oriented occupations are Education, Arts & Media (100.0%), Legal Services & Support (100.0%), and Education Instruction & Library (71.6%).
| Occupation | Male | Female |
| Management | 82 (55.8%) | 65 (44.2%) |
| Business & Financial | 38 (65.5%) | 20 (34.5%) |
| Computers, Engineering & Science | 52 (94.6%) | 3 (5.4%) |
| Computers & Mathematics | 12 (80.0%) | 3 (20.0%) |
| Architecture & Engineering | 40 (100.0%) | 0 (0.0%) |
| Life, Physical & Social Science | 0 (0.0%) | 0 (0.0%) |
| Community & Social Service | 51 (37.2%) | 86 (62.8%) |
| Education, Arts & Media | 0 (0.0%) | 3 (100.0%) |
| Legal Services & Support | 0 (0.0%) | 13 (100.0%) |
| Education Instruction & Library | 21 (28.4%) | 53 (71.6%) |
| Arts, Media & Entertainment | 30 (63.8%) | 17 (36.2%) |
| Health Diagnosing & Treating | 26 (45.6%) | 31 (54.4%) |
| Health Technologists | 10 (31.2%) | 22 (68.8%) |
| Total (Category) | 249 (54.8%) | 205 (45.2%) |
| Total (Overall) | 895 (56.7%) | 684 (43.3%) |
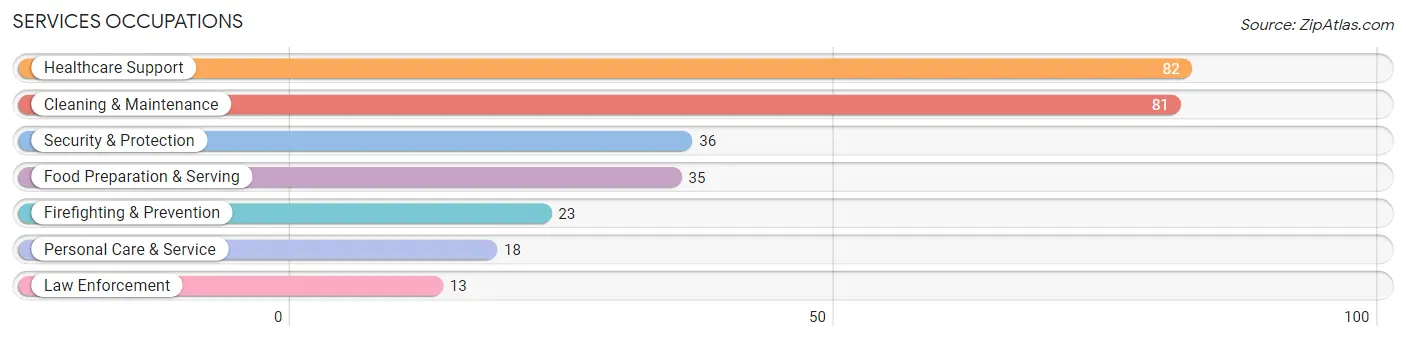
Services Occupations
The most common Services occupations in Val Verde are Healthcare Support (82 | 5.2%), Cleaning & Maintenance (81 | 5.1%), Security & Protection (36 | 2.3%), Food Preparation & Serving (35 | 2.2%), and Firefighting & Prevention (23 | 1.5%).
Services Occupations by Sex
Within the Services occupations in Val Verde, the most male-oriented occupations are Law Enforcement (100.0%), Cleaning & Maintenance (82.7%), and Security & Protection (72.2%), while the most female-oriented occupations are Healthcare Support (100.0%), Food Preparation & Serving (60.0%), and Personal Care & Service (44.4%).
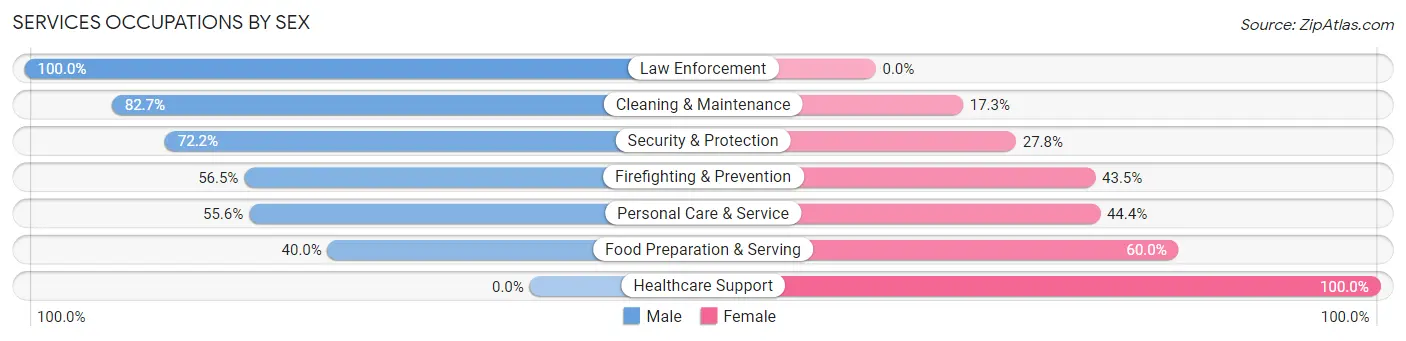
| Occupation | Male | Female |
| Healthcare Support | 0 (0.0%) | 82 (100.0%) |
| Security & Protection | 26 (72.2%) | 10 (27.8%) |
| Firefighting & Prevention | 13 (56.5%) | 10 (43.5%) |
| Law Enforcement | 13 (100.0%) | 0 (0.0%) |
| Food Preparation & Serving | 14 (40.0%) | 21 (60.0%) |
| Cleaning & Maintenance | 67 (82.7%) | 14 (17.3%) |
| Personal Care & Service | 10 (55.6%) | 8 (44.4%) |
| Total (Category) | 117 (46.4%) | 135 (53.6%) |
| Total (Overall) | 895 (56.7%) | 684 (43.3%) |
Sales and Office Occupations
The most common Sales and Office occupations in Val Verde are Office & Administration (254 | 16.1%), and Sales & Related (123 | 7.8%).

Sales and Office Occupations by Sex

| Occupation | Male | Female |
| Sales & Related | 47 (38.2%) | 76 (61.8%) |
| Office & Administration | 51 (20.1%) | 203 (79.9%) |
| Total (Category) | 98 (26.0%) | 279 (74.0%) |
| Total (Overall) | 895 (56.7%) | 684 (43.3%) |
Natural Resources, Construction and Maintenance Occupations
The most common Natural Resources, Construction and Maintenance occupations in Val Verde are Construction & Extraction (208 | 13.2%), Farming, Fishing & Forestry (31 | 2.0%), and Installation, Maintenance & Repair (26 | 1.7%).

Natural Resources, Construction and Maintenance Occupations by Sex
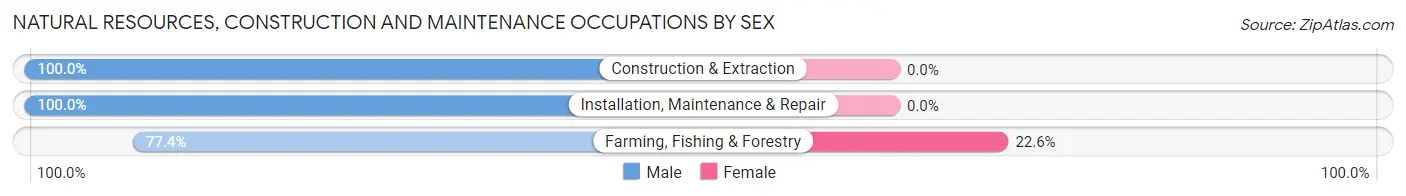
| Occupation | Male | Female |
| Farming, Fishing & Forestry | 24 (77.4%) | 7 (22.6%) |
| Construction & Extraction | 208 (100.0%) | 0 (0.0%) |
| Installation, Maintenance & Repair | 26 (100.0%) | 0 (0.0%) |
| Total (Category) | 258 (97.4%) | 7 (2.6%) |
| Total (Overall) | 895 (56.7%) | 684 (43.3%) |
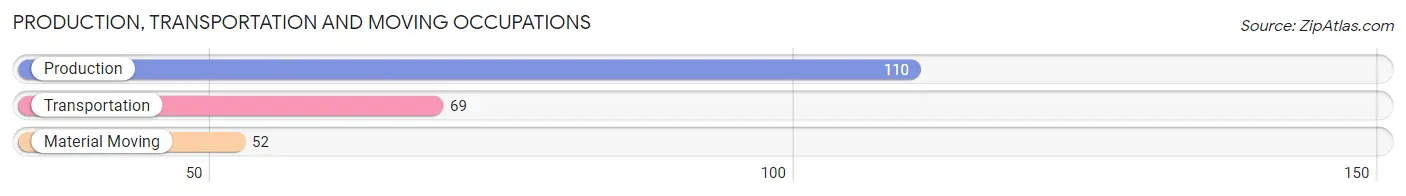
Production, Transportation and Moving Occupations
The most common Production, Transportation and Moving occupations in Val Verde are Production (110 | 7.0%), Transportation (69 | 4.4%), and Material Moving (52 | 3.3%).
Production, Transportation and Moving Occupations by Sex
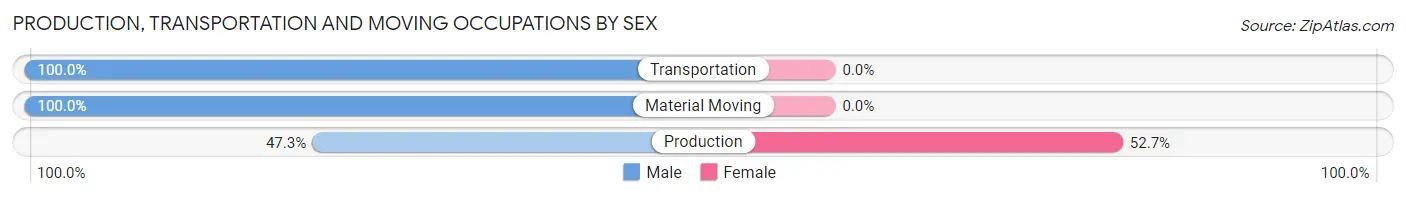
| Occupation | Male | Female |
| Production | 52 (47.3%) | 58 (52.7%) |
| Transportation | 69 (100.0%) | 0 (0.0%) |
| Material Moving | 52 (100.0%) | 0 (0.0%) |
| Total (Category) | 173 (74.9%) | 58 (25.1%) |
| Total (Overall) | 895 (56.7%) | 684 (43.3%) |
Employment Industries by Sex in Val Verde
Employment Industries in Val Verde
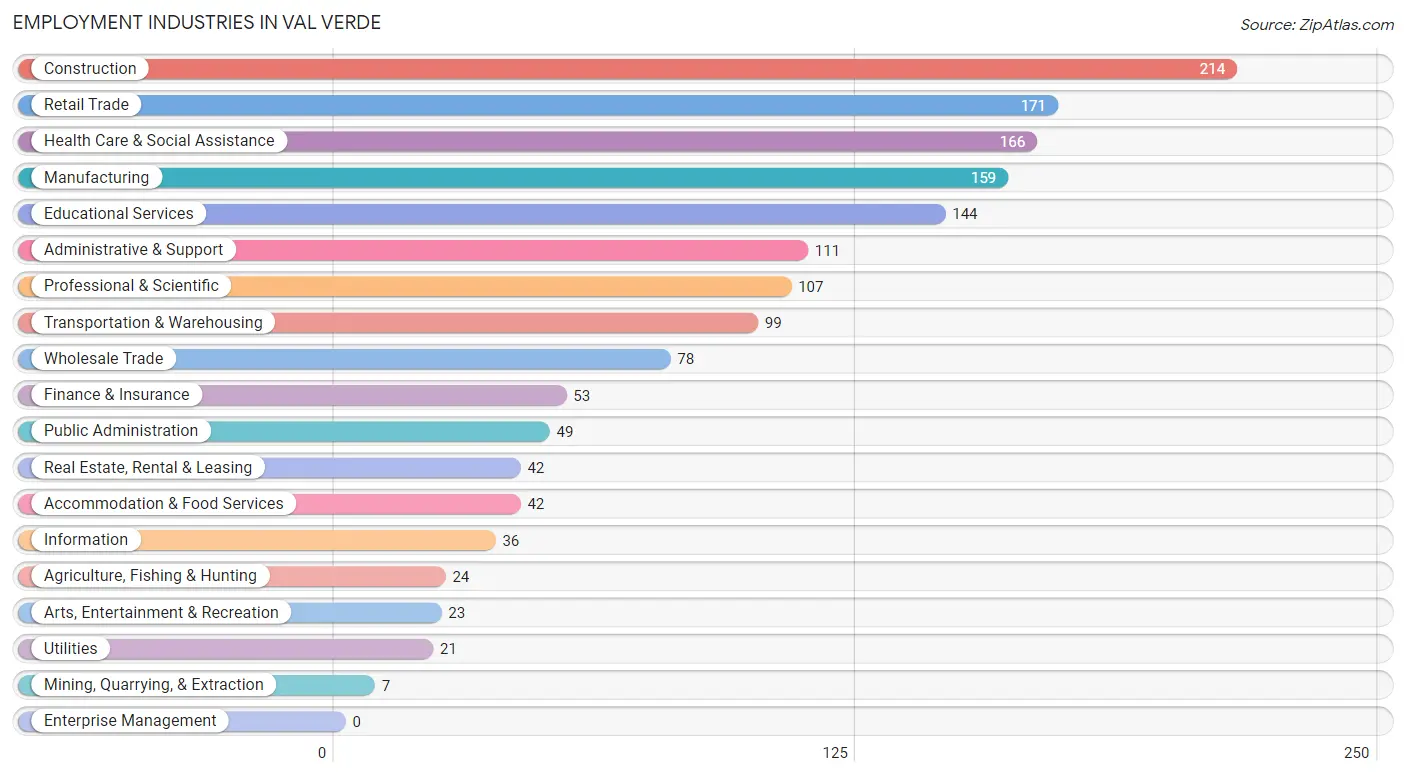
The major employment industries in Val Verde include Construction (214 | 13.6%), Retail Trade (171 | 10.8%), Health Care & Social Assistance (166 | 10.5%), Manufacturing (159 | 10.1%), and Educational Services (144 | 9.1%).
Employment Industries by Sex in Val Verde
The Val Verde industries that see more men than women are Agriculture, Fishing & Hunting (100.0%), Mining, Quarrying, & Extraction (100.0%), and Transportation & Warehousing (100.0%), whereas the industries that tend to have a higher number of women are Wholesale Trade (100.0%), Health Care & Social Assistance (84.3%), and Educational Services (73.6%).
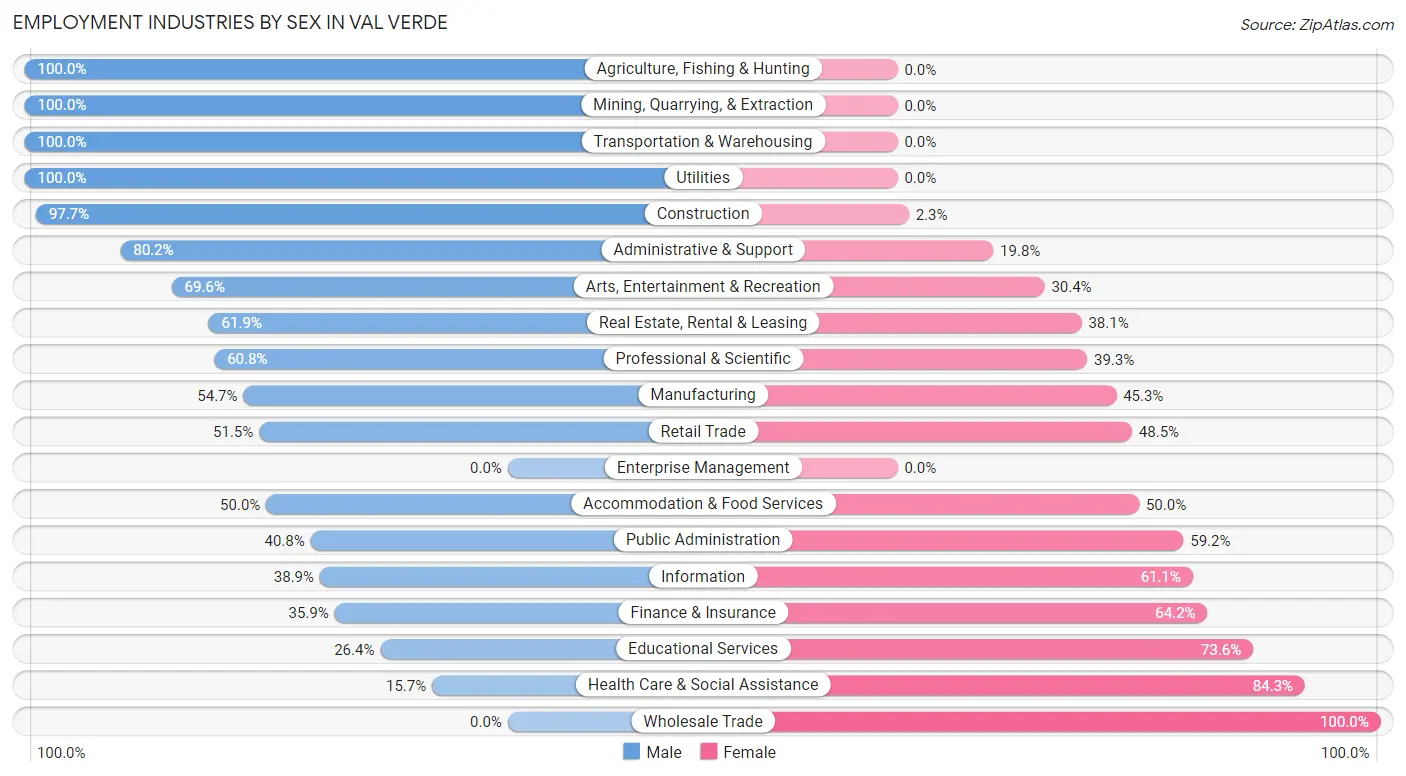
| Industry | Male | Female |
| Agriculture, Fishing & Hunting | 24 (100.0%) | 0 (0.0%) |
| Mining, Quarrying, & Extraction | 7 (100.0%) | 0 (0.0%) |
| Construction | 209 (97.7%) | 5 (2.3%) |
| Manufacturing | 87 (54.7%) | 72 (45.3%) |
| Wholesale Trade | 0 (0.0%) | 78 (100.0%) |
| Retail Trade | 88 (51.5%) | 83 (48.5%) |
| Transportation & Warehousing | 99 (100.0%) | 0 (0.0%) |
| Utilities | 21 (100.0%) | 0 (0.0%) |
| Information | 14 (38.9%) | 22 (61.1%) |
| Finance & Insurance | 19 (35.8%) | 34 (64.1%) |
| Real Estate, Rental & Leasing | 26 (61.9%) | 16 (38.1%) |
| Professional & Scientific | 65 (60.8%) | 42 (39.3%) |
| Enterprise Management | 0 (0.0%) | 0 (0.0%) |
| Administrative & Support | 89 (80.2%) | 22 (19.8%) |
| Educational Services | 38 (26.4%) | 106 (73.6%) |
| Health Care & Social Assistance | 26 (15.7%) | 140 (84.3%) |
| Arts, Entertainment & Recreation | 16 (69.6%) | 7 (30.4%) |
| Accommodation & Food Services | 21 (50.0%) | 21 (50.0%) |
| Public Administration | 20 (40.8%) | 29 (59.2%) |
| Total | 895 (56.7%) | 684 (43.3%) |
Education in Val Verde
School Enrollment in Val Verde
The most common levels of schooling among the 1,035 students in Val Verde are middle school (347 | 33.5%), high school (233 | 22.5%), and college / undergraduate (196 | 18.9%).
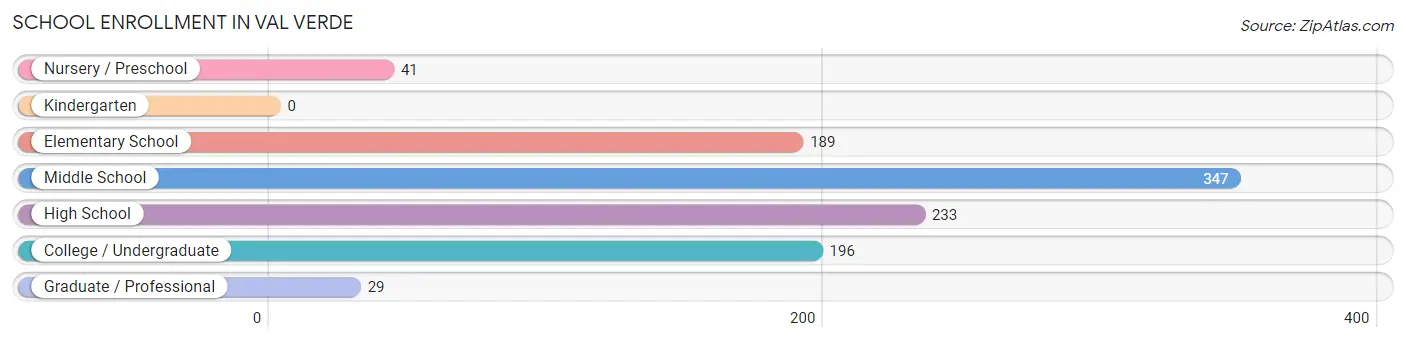
| School Level | # Students | % Students |
| Nursery / Preschool | 41 | 4.0% |
| Kindergarten | 0 | 0.0% |
| Elementary School | 189 | 18.3% |
| Middle School | 347 | 33.5% |
| High School | 233 | 22.5% |
| College / Undergraduate | 196 | 18.9% |
| Graduate / Professional | 29 | 2.8% |
| Total | 1,035 | 100.0% |
School Enrollment by Age by Funding Source in Val Verde
Out of a total of 1,035 students who are enrolled in schools in Val Verde, 81 (7.8%) attend a private institution, while the remaining 954 (92.2%) are enrolled in public schools. The age group of 35 years and over has the highest likelihood of being enrolled in private schools, with 13 (38.2% in the age bracket) enrolled. Conversely, the age group of 3 to 4 year olds has the lowest likelihood of being enrolled in a private school, with 33 (100.0% in the age bracket) attending a public institution.
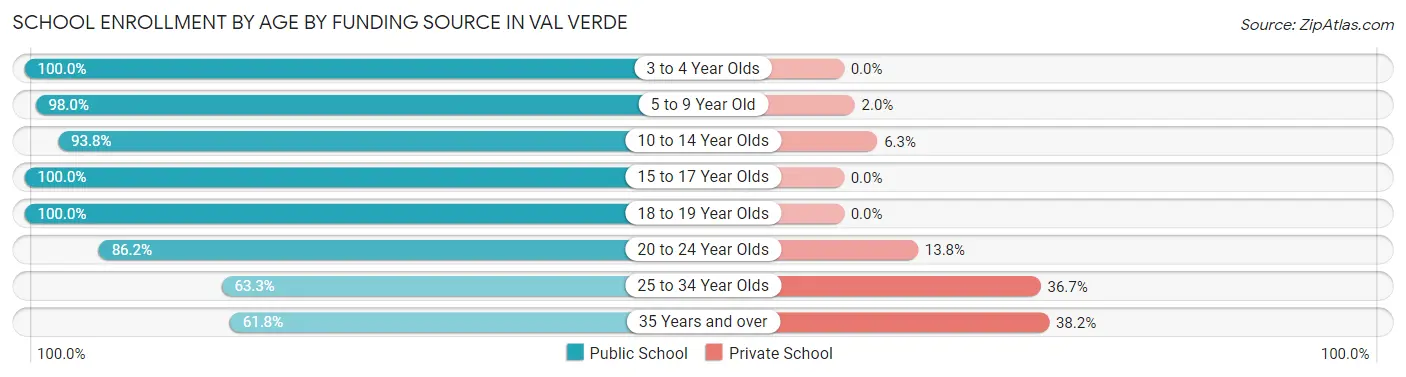
| Age Bracket | Public School | Private School |
| 3 to 4 Year Olds | 33 (100.0%) | 0 (0.0%) |
| 5 to 9 Year Old | 193 (98.0%) | 4 (2.0%) |
| 10 to 14 Year Olds | 375 (93.8%) | 25 (6.2%) |
| 15 to 17 Year Olds | 158 (100.0%) | 0 (0.0%) |
| 18 to 19 Year Olds | 30 (100.0%) | 0 (0.0%) |
| 20 to 24 Year Olds | 106 (86.2%) | 17 (13.8%) |
| 25 to 34 Year Olds | 38 (63.3%) | 22 (36.7%) |
| 35 Years and over | 21 (61.8%) | 13 (38.2%) |
| Total | 954 (92.2%) | 81 (7.8%) |
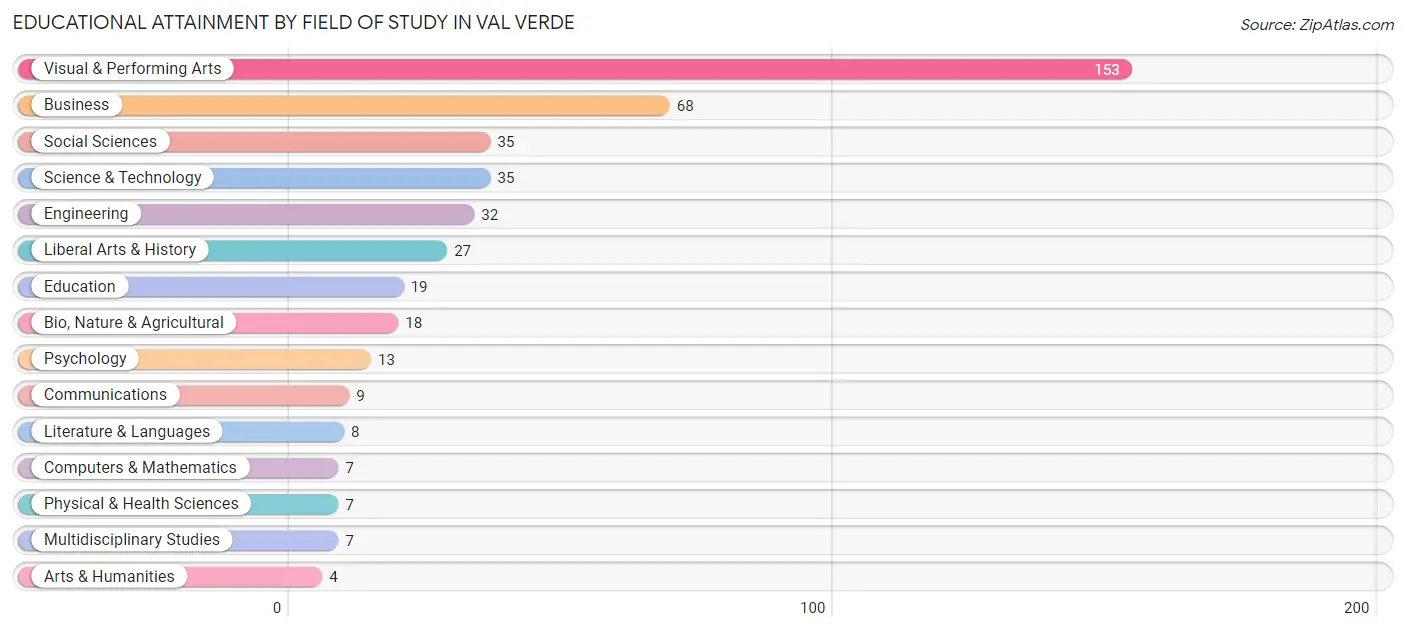
Educational Attainment by Field of Study in Val Verde
Visual & performing arts (153 | 34.6%), business (68 | 15.4%), social sciences (35 | 7.9%), science & technology (35 | 7.9%), and engineering (32 | 7.2%) are the most common fields of study among 442 individuals in Val Verde who have obtained a bachelor's degree or higher.
| Field of Study | # Graduates | % Graduates |
| Computers & Mathematics | 7 | 1.6% |
| Bio, Nature & Agricultural | 18 | 4.1% |
| Physical & Health Sciences | 7 | 1.6% |
| Psychology | 13 | 2.9% |
| Social Sciences | 35 | 7.9% |
| Engineering | 32 | 7.2% |
| Multidisciplinary Studies | 7 | 1.6% |
| Science & Technology | 35 | 7.9% |
| Business | 68 | 15.4% |
| Education | 19 | 4.3% |
| Literature & Languages | 8 | 1.8% |
| Liberal Arts & History | 27 | 6.1% |
| Visual & Performing Arts | 153 | 34.6% |
| Communications | 9 | 2.0% |
| Arts & Humanities | 4 | 0.9% |
| Total | 442 | 100.0% |
Transportation & Commute in Val Verde
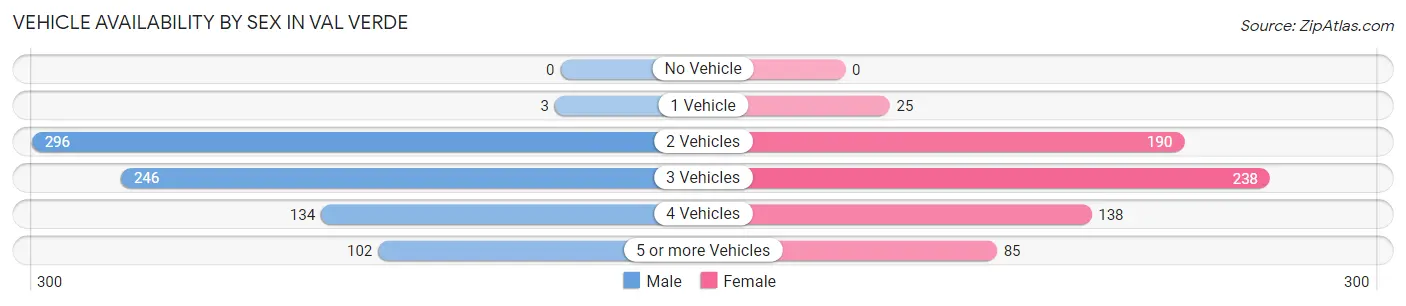
Vehicle Availability by Sex in Val Verde
The most prevalent vehicle ownership categories in Val Verde are males with 2 vehicles (296, accounting for 37.9%) and females with 2 vehicles (190, making up 43.8%).
| Vehicles Available | Male | Female |
| No Vehicle | 0 (0.0%) | 0 (0.0%) |
| 1 Vehicle | 3 (0.4%) | 25 (3.7%) |
| 2 Vehicles | 296 (37.9%) | 190 (28.1%) |
| 3 Vehicles | 246 (31.5%) | 238 (35.2%) |
| 4 Vehicles | 134 (17.2%) | 138 (20.4%) |
| 5 or more Vehicles | 102 (13.1%) | 85 (12.6%) |
| Total | 781 (100.0%) | 676 (100.0%) |
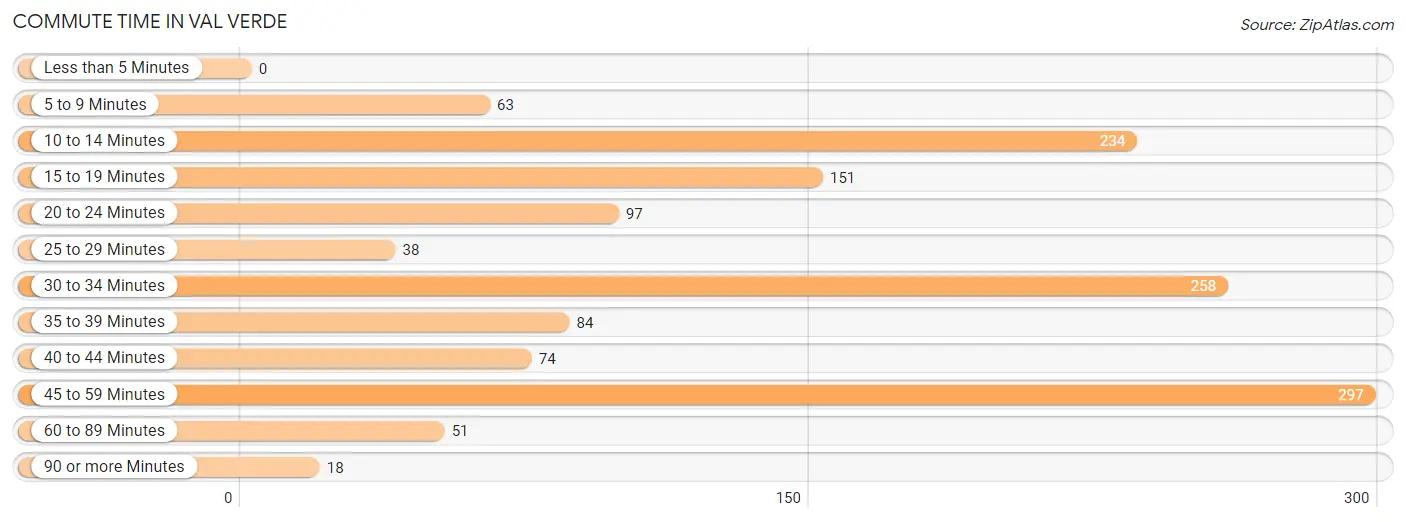
Commute Time in Val Verde
The most frequently occuring commute durations in Val Verde are 45 to 59 minutes (297 commuters, 21.8%), 30 to 34 minutes (258 commuters, 18.9%), and 10 to 14 minutes (234 commuters, 17.1%).
| Commute Time | # Commuters | % Commuters |
| Less than 5 Minutes | 0 | 0.0% |
| 5 to 9 Minutes | 63 | 4.6% |
| 10 to 14 Minutes | 234 | 17.1% |
| 15 to 19 Minutes | 151 | 11.1% |
| 20 to 24 Minutes | 97 | 7.1% |
| 25 to 29 Minutes | 38 | 2.8% |
| 30 to 34 Minutes | 258 | 18.9% |
| 35 to 39 Minutes | 84 | 6.1% |
| 40 to 44 Minutes | 74 | 5.4% |
| 45 to 59 Minutes | 297 | 21.8% |
| 60 to 89 Minutes | 51 | 3.7% |
| 90 or more Minutes | 18 | 1.3% |
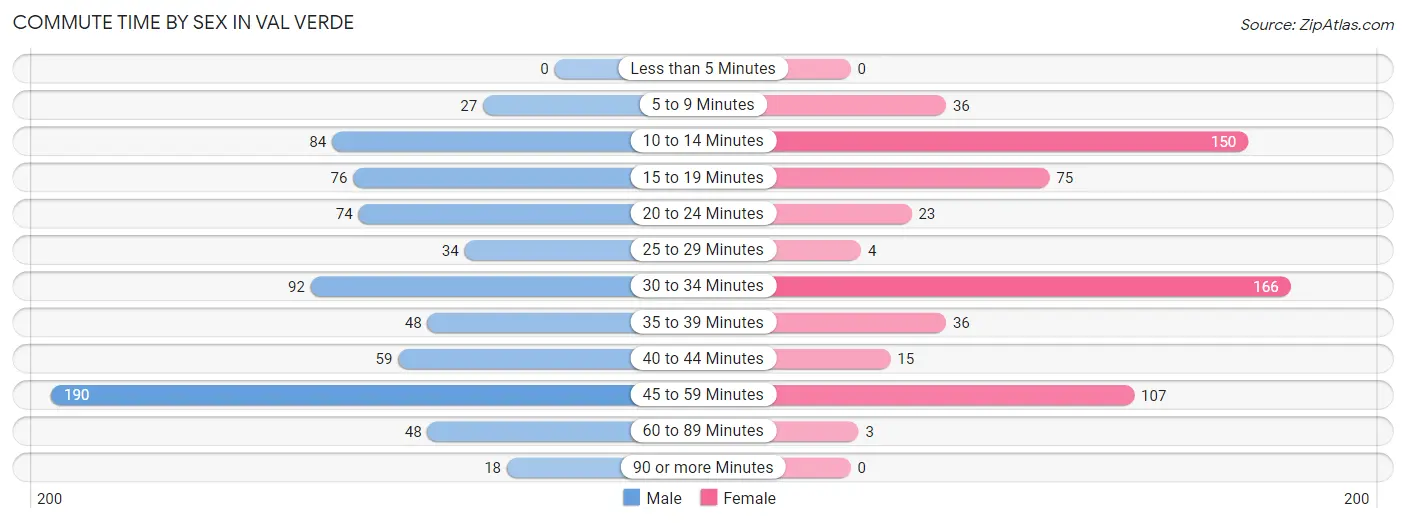
Commute Time by Sex in Val Verde
The most common commute times in Val Verde are 45 to 59 minutes (190 commuters, 25.3%) for males and 30 to 34 minutes (166 commuters, 27.0%) for females.
| Commute Time | Male | Female |
| Less than 5 Minutes | 0 (0.0%) | 0 (0.0%) |
| 5 to 9 Minutes | 27 (3.6%) | 36 (5.9%) |
| 10 to 14 Minutes | 84 (11.2%) | 150 (24.4%) |
| 15 to 19 Minutes | 76 (10.1%) | 75 (12.2%) |
| 20 to 24 Minutes | 74 (9.9%) | 23 (3.7%) |
| 25 to 29 Minutes | 34 (4.5%) | 4 (0.6%) |
| 30 to 34 Minutes | 92 (12.3%) | 166 (27.0%) |
| 35 to 39 Minutes | 48 (6.4%) | 36 (5.9%) |
| 40 to 44 Minutes | 59 (7.9%) | 15 (2.4%) |
| 45 to 59 Minutes | 190 (25.3%) | 107 (17.4%) |
| 60 to 89 Minutes | 48 (6.4%) | 3 (0.5%) |
| 90 or more Minutes | 18 (2.4%) | 0 (0.0%) |
Time of Departure to Work by Sex in Val Verde
The most frequent times of departure to work in Val Verde are 6:00 AM to 6:29 AM (170, 22.7%) for males and 7:30 AM to 7:59 AM (114, 18.5%) for females.
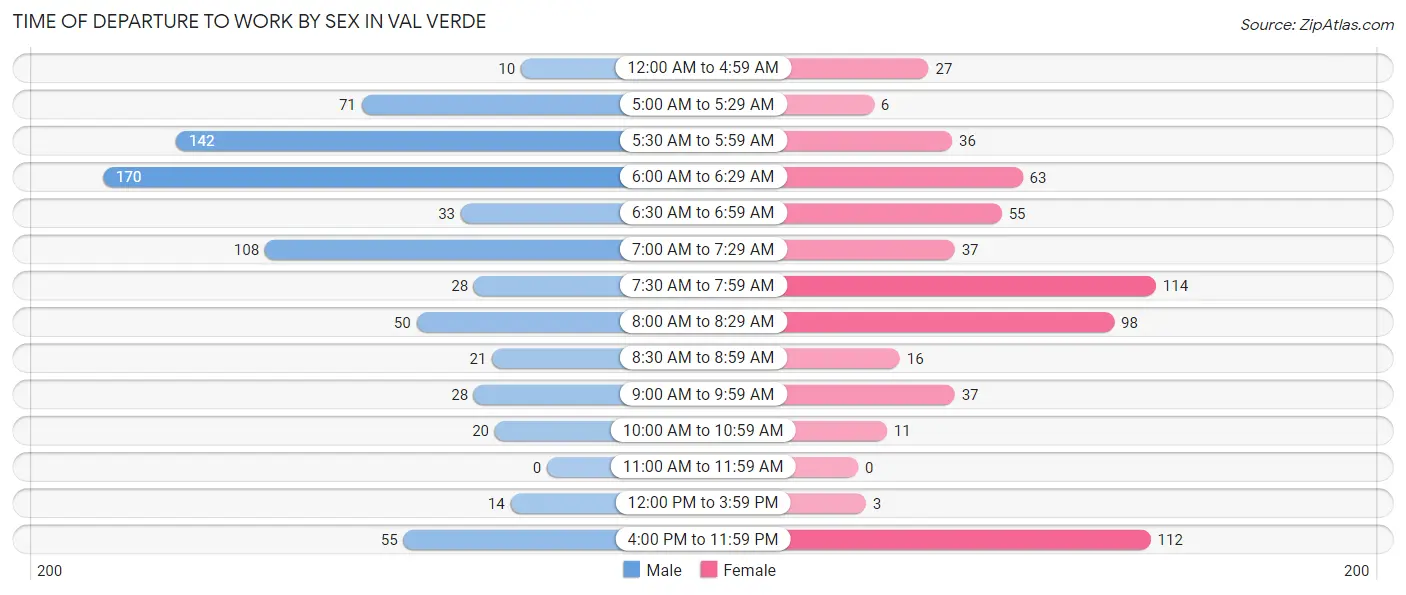
| Time of Departure | Male | Female |
| 12:00 AM to 4:59 AM | 10 (1.3%) | 27 (4.4%) |
| 5:00 AM to 5:29 AM | 71 (9.5%) | 6 (1.0%) |
| 5:30 AM to 5:59 AM | 142 (18.9%) | 36 (5.9%) |
| 6:00 AM to 6:29 AM | 170 (22.7%) | 63 (10.2%) |
| 6:30 AM to 6:59 AM | 33 (4.4%) | 55 (8.9%) |
| 7:00 AM to 7:29 AM | 108 (14.4%) | 37 (6.0%) |
| 7:30 AM to 7:59 AM | 28 (3.7%) | 114 (18.5%) |
| 8:00 AM to 8:29 AM | 50 (6.7%) | 98 (15.9%) |
| 8:30 AM to 8:59 AM | 21 (2.8%) | 16 (2.6%) |
| 9:00 AM to 9:59 AM | 28 (3.7%) | 37 (6.0%) |
| 10:00 AM to 10:59 AM | 20 (2.7%) | 11 (1.8%) |
| 11:00 AM to 11:59 AM | 0 (0.0%) | 0 (0.0%) |
| 12:00 PM to 3:59 PM | 14 (1.9%) | 3 (0.5%) |
| 4:00 PM to 11:59 PM | 55 (7.3%) | 112 (18.2%) |
| Total | 750 (100.0%) | 615 (100.0%) |
Housing Occupancy in Val Verde
Occupancy by Ownership in Val Verde
Of the total 876 dwellings in Val Verde, owner-occupied units account for 754 (86.1%), while renter-occupied units make up 122 (13.9%).
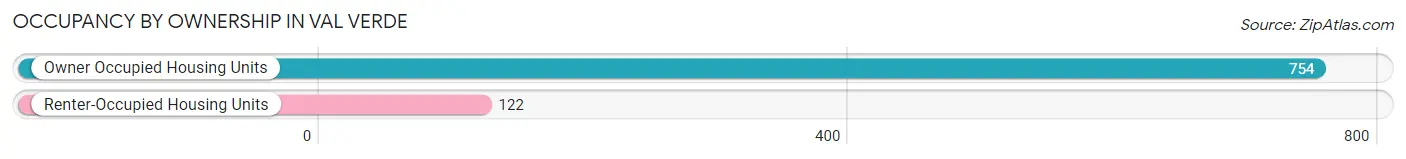
| Occupancy | # Housing Units | % Housing Units |
| Owner Occupied Housing Units | 754 | 86.1% |
| Renter-Occupied Housing Units | 122 | 13.9% |
| Total Occupied Housing Units | 876 | 100.0% |
Occupancy by Household Size in Val Verde
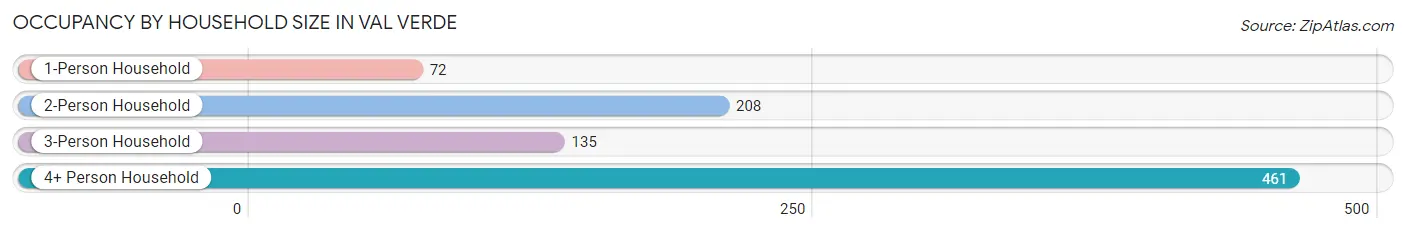
| Household Size | # Housing Units | % Housing Units |
| 1-Person Household | 72 | 8.2% |
| 2-Person Household | 208 | 23.7% |
| 3-Person Household | 135 | 15.4% |
| 4+ Person Household | 461 | 52.6% |
| Total Housing Units | 876 | 100.0% |
Occupancy by Ownership by Household Size in Val Verde
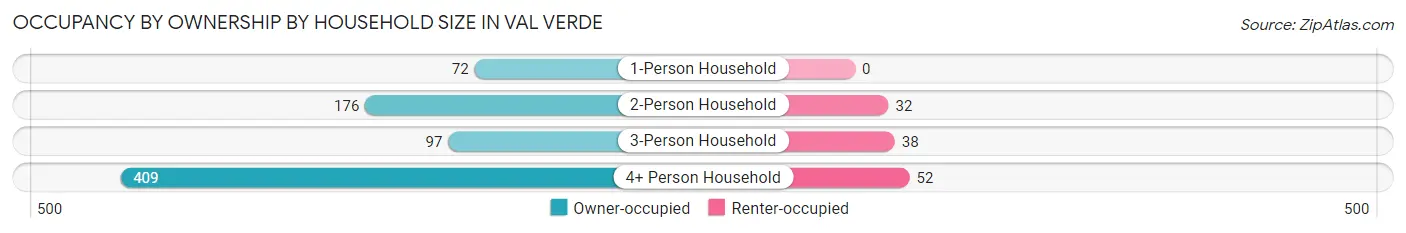
| Household Size | Owner-occupied | Renter-occupied |
| 1-Person Household | 72 (100.0%) | 0 (0.0%) |
| 2-Person Household | 176 (84.6%) | 32 (15.4%) |
| 3-Person Household | 97 (71.9%) | 38 (28.1%) |
| 4+ Person Household | 409 (88.7%) | 52 (11.3%) |
| Total Housing Units | 754 (86.1%) | 122 (13.9%) |
Occupancy by Educational Attainment in Val Verde
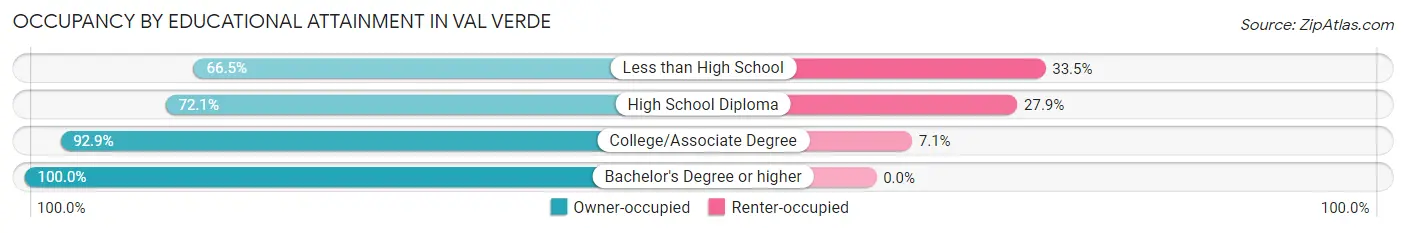
| Household Size | Owner-occupied | Renter-occupied |
| Less than High School | 113 (66.5%) | 57 (33.5%) |
| High School Diploma | 98 (72.1%) | 38 (27.9%) |
| College/Associate Degree | 355 (92.9%) | 27 (7.1%) |
| Bachelor's Degree or higher | 188 (100.0%) | 0 (0.0%) |
Occupancy by Age of Householder in Val Verde
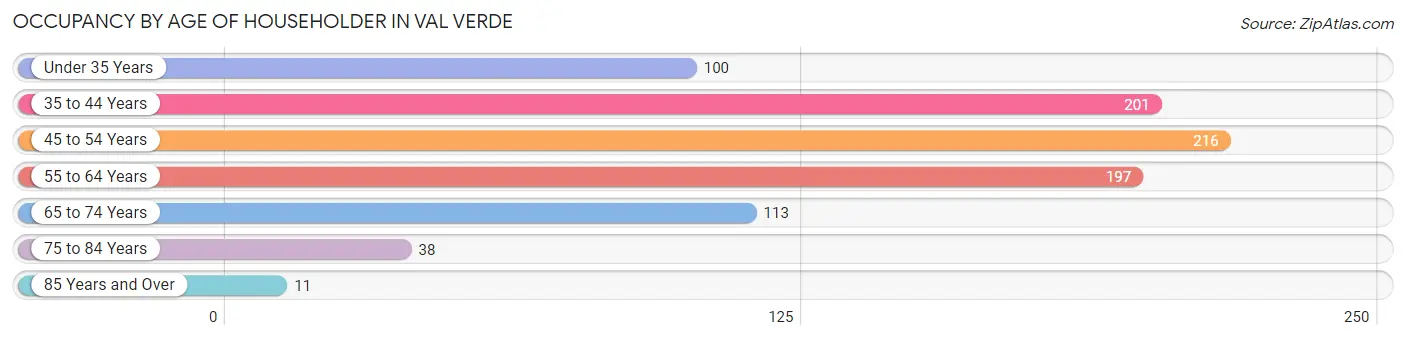
| Age Bracket | # Households | % Households |
| Under 35 Years | 100 | 11.4% |
| 35 to 44 Years | 201 | 23.0% |
| 45 to 54 Years | 216 | 24.7% |
| 55 to 64 Years | 197 | 22.5% |
| 65 to 74 Years | 113 | 12.9% |
| 75 to 84 Years | 38 | 4.3% |
| 85 Years and Over | 11 | 1.3% |
| Total | 876 | 100.0% |
Housing Finances in Val Verde
Median Income by Occupancy in Val Verde
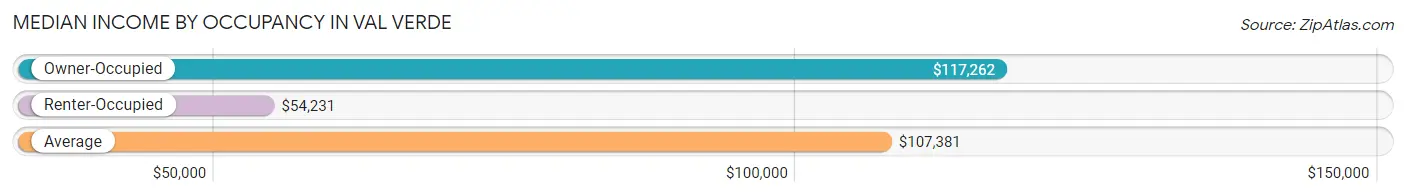
| Occupancy Type | # Households | Median Income |
| Owner-Occupied | 754 (86.1%) | $117,262 |
| Renter-Occupied | 122 (13.9%) | $54,231 |
| Average | 876 (100.0%) | $107,381 |
Occupancy by Householder Income Bracket in Val Verde
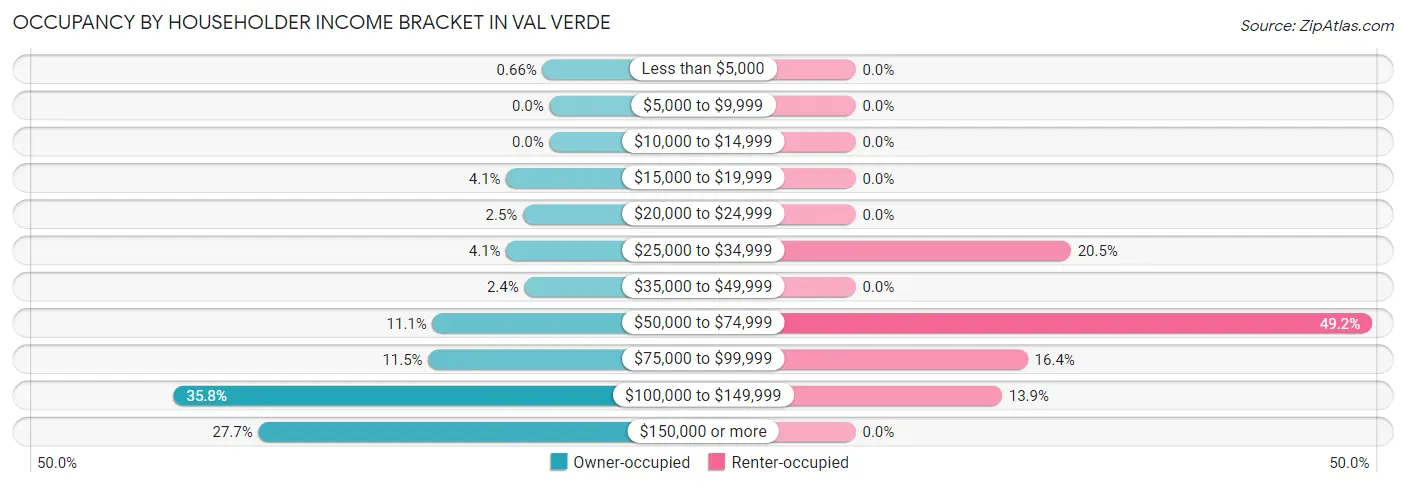
| Income Bracket | Owner-occupied | Renter-occupied |
| Less than $5,000 | 5 (0.7%) | 0 (0.0%) |
| $5,000 to $9,999 | 0 (0.0%) | 0 (0.0%) |
| $10,000 to $14,999 | 0 (0.0%) | 0 (0.0%) |
| $15,000 to $19,999 | 31 (4.1%) | 0 (0.0%) |
| $20,000 to $24,999 | 19 (2.5%) | 0 (0.0%) |
| $25,000 to $34,999 | 31 (4.1%) | 25 (20.5%) |
| $35,000 to $49,999 | 18 (2.4%) | 0 (0.0%) |
| $50,000 to $74,999 | 84 (11.1%) | 60 (49.2%) |
| $75,000 to $99,999 | 87 (11.5%) | 20 (16.4%) |
| $100,000 to $149,999 | 270 (35.8%) | 17 (13.9%) |
| $150,000 or more | 209 (27.7%) | 0 (0.0%) |
| Total | 754 (100.0%) | 122 (100.0%) |
Monthly Housing Cost Tiers in Val Verde
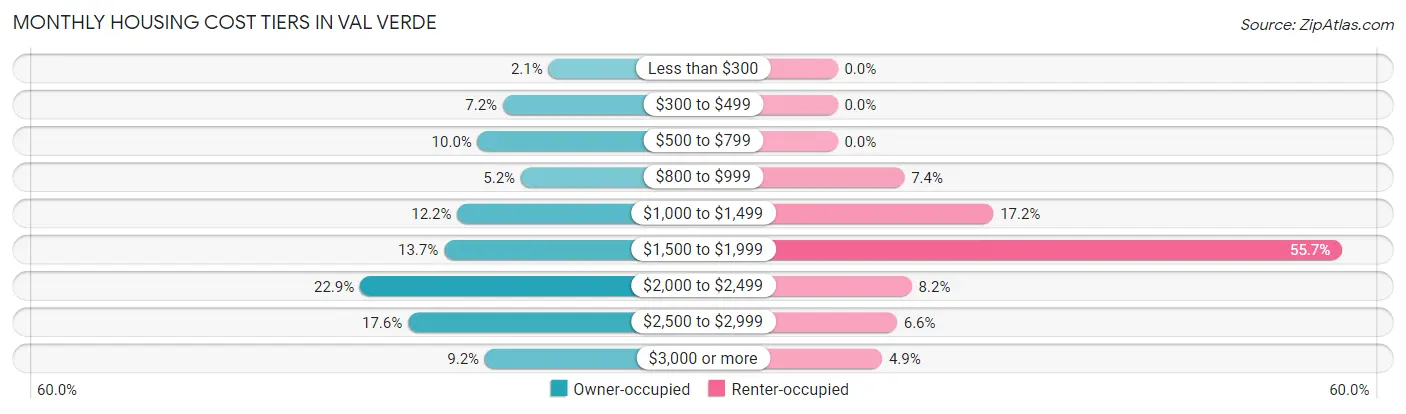
| Monthly Cost | Owner-occupied | Renter-occupied |
| Less than $300 | 16 (2.1%) | 0 (0.0%) |
| $300 to $499 | 54 (7.2%) | 0 (0.0%) |
| $500 to $799 | 75 (10.0%) | 0 (0.0%) |
| $800 to $999 | 39 (5.2%) | 9 (7.4%) |
| $1,000 to $1,499 | 92 (12.2%) | 21 (17.2%) |
| $1,500 to $1,999 | 103 (13.7%) | 68 (55.7%) |
| $2,000 to $2,499 | 173 (22.9%) | 10 (8.2%) |
| $2,500 to $2,999 | 133 (17.6%) | 8 (6.6%) |
| $3,000 or more | 69 (9.1%) | 6 (4.9%) |
| Total | 754 (100.0%) | 122 (100.0%) |
Physical Housing Characteristics in Val Verde
Housing Structures in Val Verde
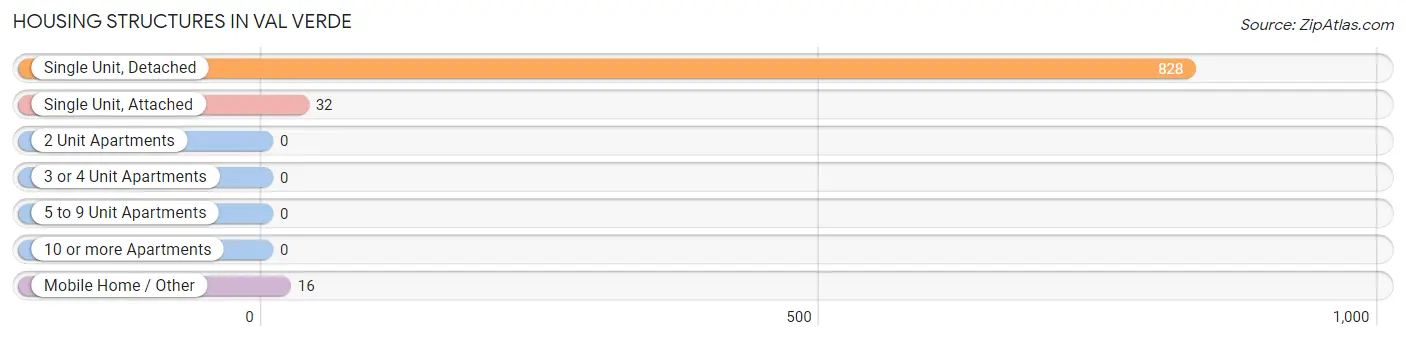
| Structure Type | # Housing Units | % Housing Units |
| Single Unit, Detached | 828 | 94.5% |
| Single Unit, Attached | 32 | 3.6% |
| 2 Unit Apartments | 0 | 0.0% |
| 3 or 4 Unit Apartments | 0 | 0.0% |
| 5 to 9 Unit Apartments | 0 | 0.0% |
| 10 or more Apartments | 0 | 0.0% |
| Mobile Home / Other | 16 | 1.8% |
| Total | 876 | 100.0% |
Housing Structures by Occupancy in Val Verde

| Structure Type | Owner-occupied | Renter-occupied |
| Single Unit, Detached | 706 (85.3%) | 122 (14.7%) |
| Single Unit, Attached | 32 (100.0%) | 0 (0.0%) |
| 2 Unit Apartments | 0 (0.0%) | 0 (0.0%) |
| 3 or 4 Unit Apartments | 0 (0.0%) | 0 (0.0%) |
| 5 to 9 Unit Apartments | 0 (0.0%) | 0 (0.0%) |
| 10 or more Apartments | 0 (0.0%) | 0 (0.0%) |
| Mobile Home / Other | 16 (100.0%) | 0 (0.0%) |
| Total | 754 (86.1%) | 122 (13.9%) |
Housing Structures by Number of Rooms in Val Verde
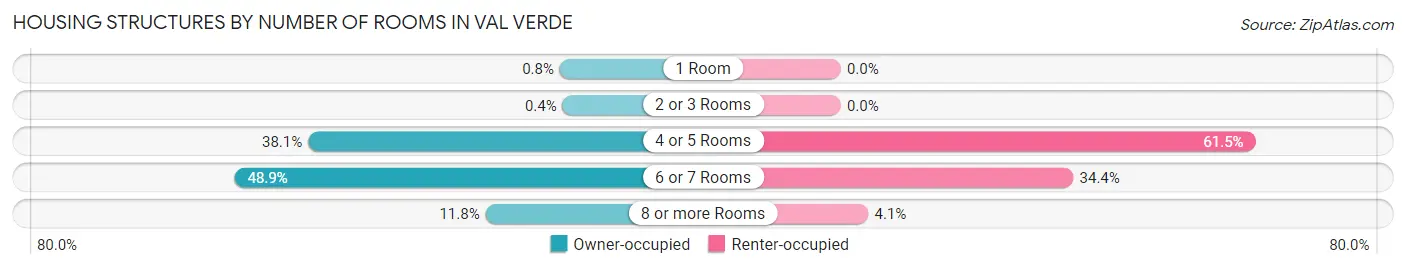
| Number of Rooms | Owner-occupied | Renter-occupied |
| 1 Room | 6 (0.8%) | 0 (0.0%) |
| 2 or 3 Rooms | 3 (0.4%) | 0 (0.0%) |
| 4 or 5 Rooms | 287 (38.1%) | 75 (61.5%) |
| 6 or 7 Rooms | 369 (48.9%) | 42 (34.4%) |
| 8 or more Rooms | 89 (11.8%) | 5 (4.1%) |
| Total | 754 (100.0%) | 122 (100.0%) |
Housing Structure by Heating Type in Val Verde
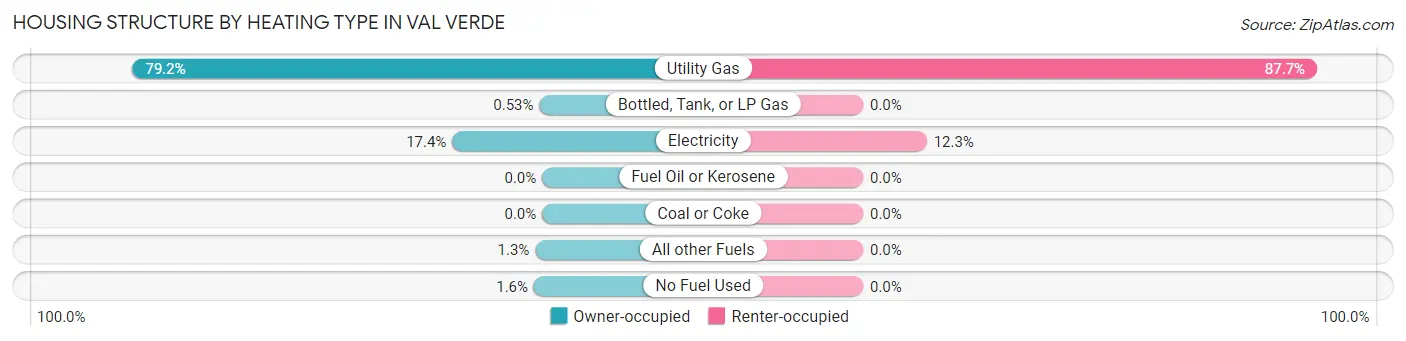
| Heating Type | Owner-occupied | Renter-occupied |
| Utility Gas | 597 (79.2%) | 107 (87.7%) |
| Bottled, Tank, or LP Gas | 4 (0.5%) | 0 (0.0%) |
| Electricity | 131 (17.4%) | 15 (12.3%) |
| Fuel Oil or Kerosene | 0 (0.0%) | 0 (0.0%) |
| Coal or Coke | 0 (0.0%) | 0 (0.0%) |
| All other Fuels | 10 (1.3%) | 0 (0.0%) |
| No Fuel Used | 12 (1.6%) | 0 (0.0%) |
| Total | 754 (100.0%) | 122 (100.0%) |
Household Vehicle Usage in Val Verde
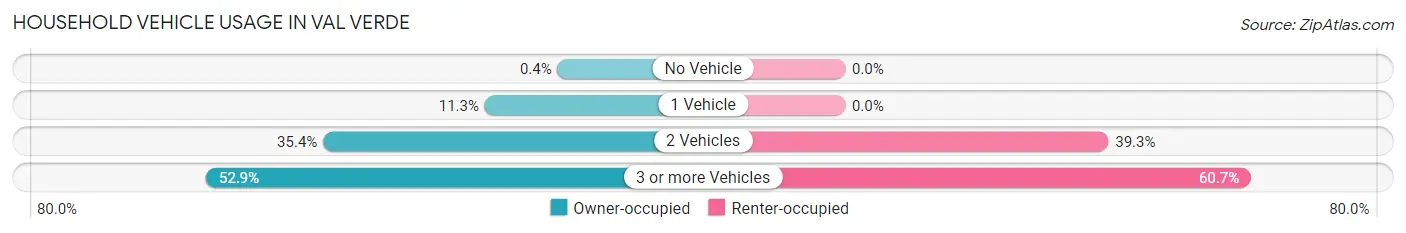
| Vehicles per Household | Owner-occupied | Renter-occupied |
| No Vehicle | 3 (0.4%) | 0 (0.0%) |
| 1 Vehicle | 85 (11.3%) | 0 (0.0%) |
| 2 Vehicles | 267 (35.4%) | 48 (39.3%) |
| 3 or more Vehicles | 399 (52.9%) | 74 (60.7%) |
| Total | 754 (100.0%) | 122 (100.0%) |
Real Estate & Mortgages in Val Verde
Real Estate and Mortgage Overview in Val Verde
| Characteristic | Without Mortgage | With Mortgage |
| Housing Units | 180 | 574 |
| Median Property Value | $464,900 | $468,300 |
| Median Household Income | $91,316 | $163 |
| Monthly Housing Costs | $574 | $69 |
| Real Estate Taxes | $3,608 | $0 |
Property Value by Mortgage Status in Val Verde
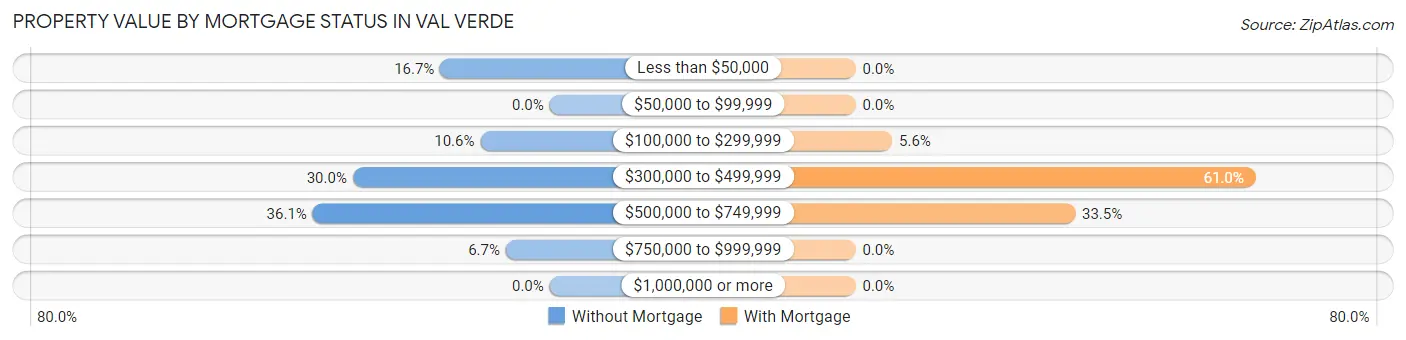
| Property Value | Without Mortgage | With Mortgage |
| Less than $50,000 | 30 (16.7%) | 0 (0.0%) |
| $50,000 to $99,999 | 0 (0.0%) | 0 (0.0%) |
| $100,000 to $299,999 | 19 (10.6%) | 32 (5.6%) |
| $300,000 to $499,999 | 54 (30.0%) | 350 (61.0%) |
| $500,000 to $749,999 | 65 (36.1%) | 192 (33.5%) |
| $750,000 to $999,999 | 12 (6.7%) | 0 (0.0%) |
| $1,000,000 or more | 0 (0.0%) | 0 (0.0%) |
| Total | 180 (100.0%) | 574 (100.0%) |
Household Income by Mortgage Status in Val Verde
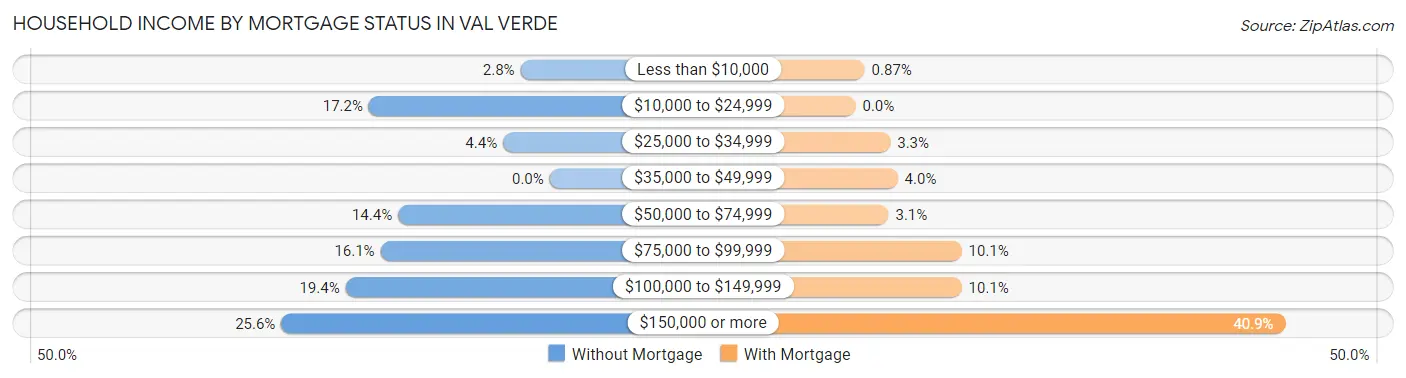
| Household Income | Without Mortgage | With Mortgage |
| Less than $10,000 | 5 (2.8%) | 5 (0.9%) |
| $10,000 to $24,999 | 31 (17.2%) | 0 (0.0%) |
| $25,000 to $34,999 | 8 (4.4%) | 19 (3.3%) |
| $35,000 to $49,999 | 0 (0.0%) | 23 (4.0%) |
| $50,000 to $74,999 | 26 (14.4%) | 18 (3.1%) |
| $75,000 to $99,999 | 29 (16.1%) | 58 (10.1%) |
| $100,000 to $149,999 | 35 (19.4%) | 58 (10.1%) |
| $150,000 or more | 46 (25.6%) | 235 (40.9%) |
| Total | 180 (100.0%) | 574 (100.0%) |
Property Value to Household Income Ratio in Val Verde
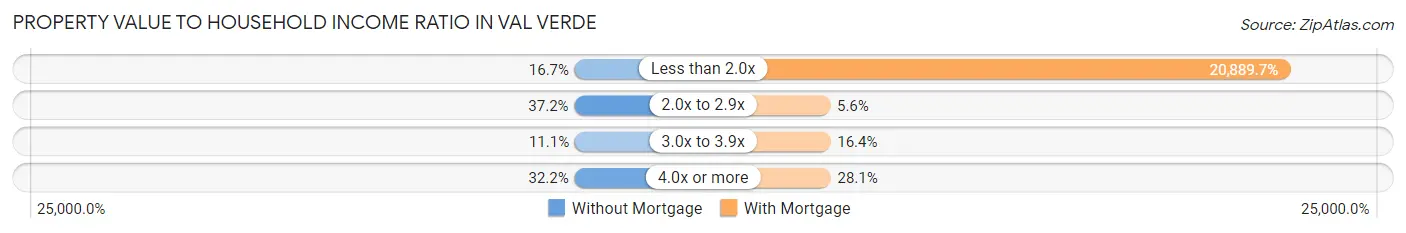
| Value-to-Income Ratio | Without Mortgage | With Mortgage |
| Less than 2.0x | 30 (16.7%) | 119,907 (20,889.7%) |
| 2.0x to 2.9x | 67 (37.2%) | 32 (5.6%) |
| 3.0x to 3.9x | 20 (11.1%) | 94 (16.4%) |
| 4.0x or more | 58 (32.2%) | 161 (28.1%) |
| Total | 180 (100.0%) | 574 (100.0%) |
Real Estate Taxes by Mortgage Status in Val Verde

| Property Taxes | Without Mortgage | With Mortgage |
| Less than $800 | 13 (7.2%) | 0 (0.0%) |
| $800 to $1,499 | 0 (0.0%) | 4 (0.7%) |
| $800 to $1,499 | 144 (80.0%) | 35 (6.1%) |
| Total | 180 (100.0%) | 574 (100.0%) |
Health & Disability in Val Verde
Health Insurance Coverage by Age in Val Verde
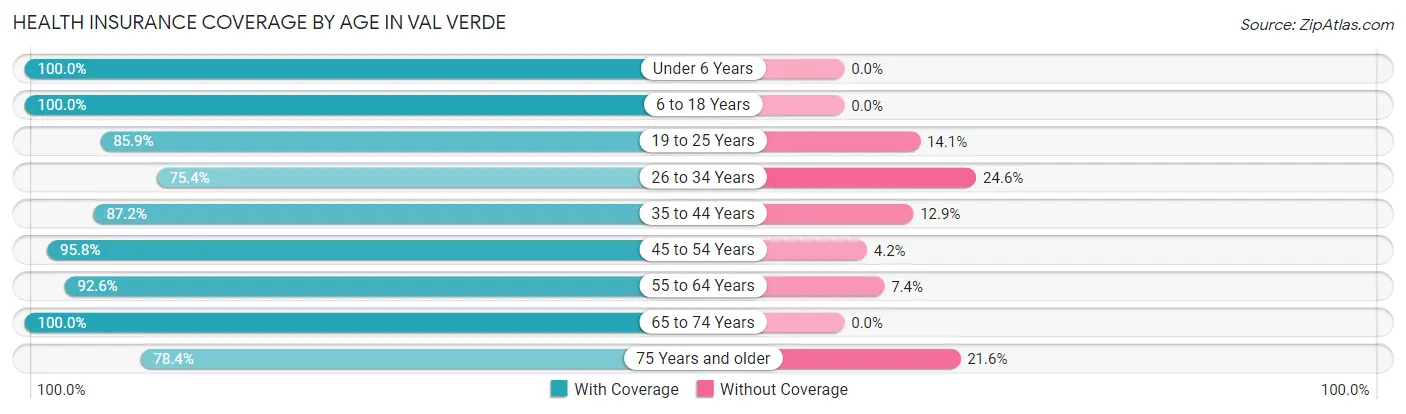
| Age Bracket | With Coverage | Without Coverage |
| Under 6 Years | 134 (100.0%) | 0 (0.0%) |
| 6 to 18 Years | 784 (100.0%) | 0 (0.0%) |
| 19 to 25 Years | 286 (85.9%) | 47 (14.1%) |
| 26 to 34 Years | 319 (75.4%) | 104 (24.6%) |
| 35 to 44 Years | 373 (87.2%) | 55 (12.9%) |
| 45 to 54 Years | 365 (95.8%) | 16 (4.2%) |
| 55 to 64 Years | 473 (92.6%) | 38 (7.4%) |
| 65 to 74 Years | 187 (100.0%) | 0 (0.0%) |
| 75 Years and older | 87 (78.4%) | 24 (21.6%) |
| Total | 3,008 (91.4%) | 284 (8.6%) |
Health Insurance Coverage by Citizenship Status in Val Verde

| Citizenship Status | With Coverage | Without Coverage |
| Native Born | 134 (100.0%) | 0 (0.0%) |
| Foreign Born, Citizen | 784 (100.0%) | 0 (0.0%) |
| Foreign Born, not a Citizen | 286 (85.9%) | 47 (14.1%) |
Health Insurance Coverage by Household Income in Val Verde

| Household Income | With Coverage | Without Coverage |
| Under $25,000 | 92 (86.0%) | 15 (14.0%) |
| $25,000 to $49,999 | 186 (100.0%) | 0 (0.0%) |
| $50,000 to $74,999 | 426 (82.1%) | 93 (17.9%) |
| $75,000 to $99,999 | 386 (100.0%) | 0 (0.0%) |
| $100,000 and over | 1,918 (91.6%) | 176 (8.4%) |
Public vs Private Health Insurance Coverage by Age in Val Verde
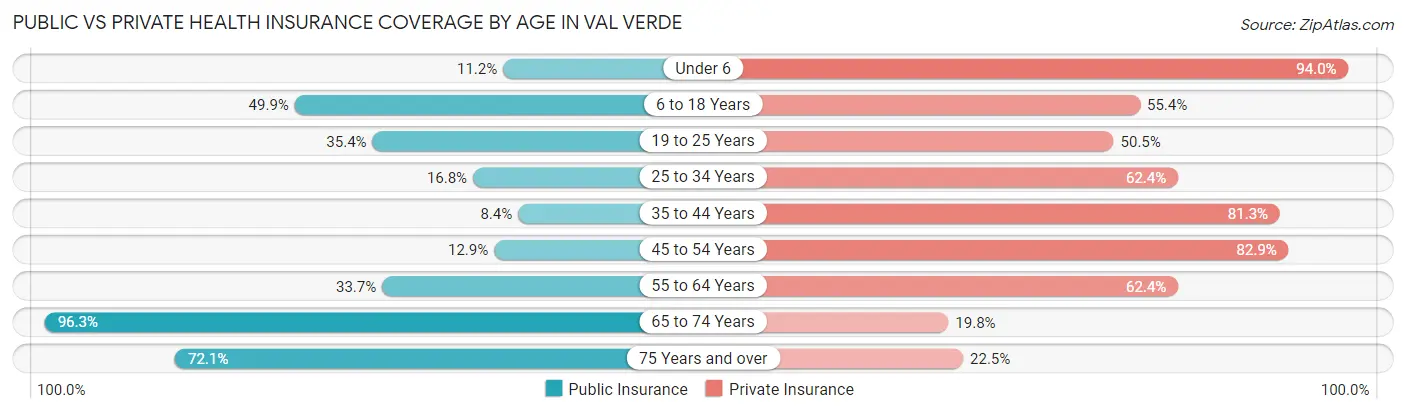
| Age Bracket | Public Insurance | Private Insurance |
| Under 6 | 15 (11.2%) | 126 (94.0%) |
| 6 to 18 Years | 391 (49.9%) | 434 (55.4%) |
| 19 to 25 Years | 118 (35.4%) | 168 (50.4%) |
| 25 to 34 Years | 71 (16.8%) | 264 (62.4%) |
| 35 to 44 Years | 36 (8.4%) | 348 (81.3%) |
| 45 to 54 Years | 49 (12.9%) | 316 (82.9%) |
| 55 to 64 Years | 172 (33.7%) | 319 (62.4%) |
| 65 to 74 Years | 180 (96.3%) | 37 (19.8%) |
| 75 Years and over | 80 (72.1%) | 25 (22.5%) |
| Total | 1,112 (33.8%) | 2,037 (61.9%) |
Disability Status by Sex by Age in Val Verde
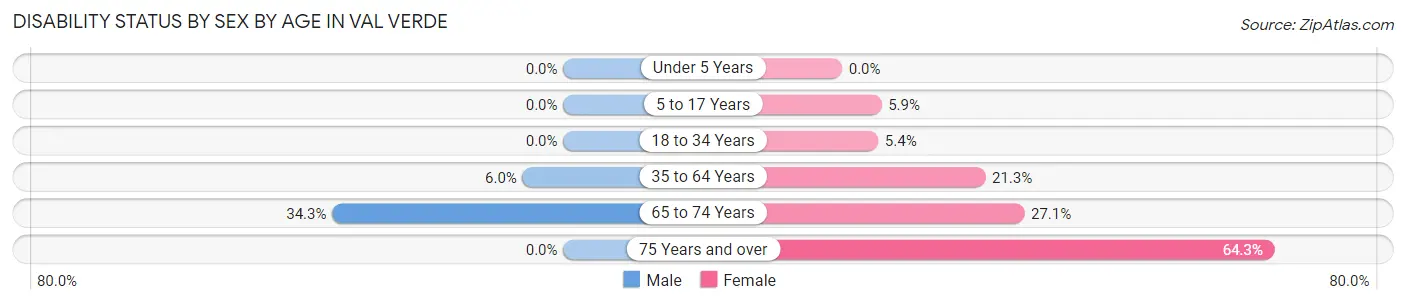
| Age Bracket | Male | Female |
| Under 5 Years | 0 (0.0%) | 0 (0.0%) |
| 5 to 17 Years | 0 (0.0%) | 22 (5.9%) |
| 18 to 34 Years | 0 (0.0%) | 14 (5.4%) |
| 35 to 64 Years | 36 (6.0%) | 154 (21.3%) |
| 65 to 74 Years | 35 (34.3%) | 23 (27.1%) |
| 75 Years and over | 0 (0.0%) | 18 (64.3%) |
Disability Class by Sex by Age in Val Verde
Disability Class: Hearing Difficulty
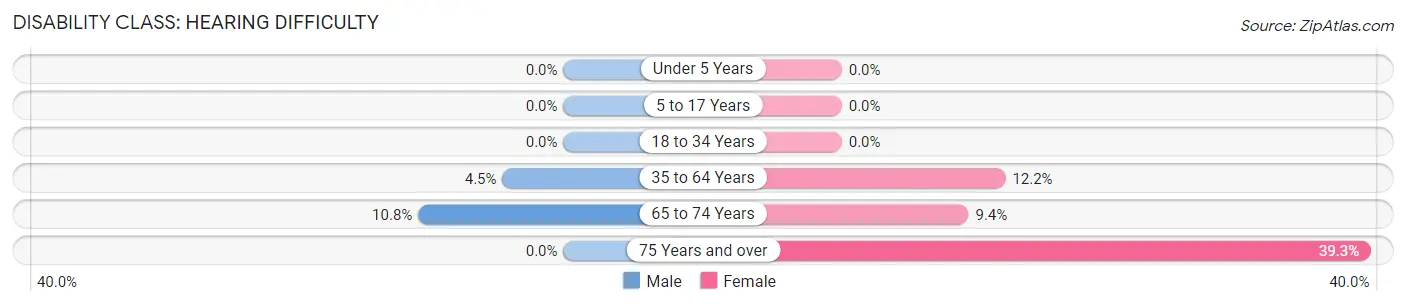
| Age Bracket | Male | Female |
| Under 5 Years | 0 (0.0%) | 0 (0.0%) |
| 5 to 17 Years | 0 (0.0%) | 0 (0.0%) |
| 18 to 34 Years | 0 (0.0%) | 0 (0.0%) |
| 35 to 64 Years | 27 (4.5%) | 88 (12.1%) |
| 65 to 74 Years | 11 (10.8%) | 8 (9.4%) |
| 75 Years and over | 0 (0.0%) | 11 (39.3%) |
Disability Class: Vision Difficulty
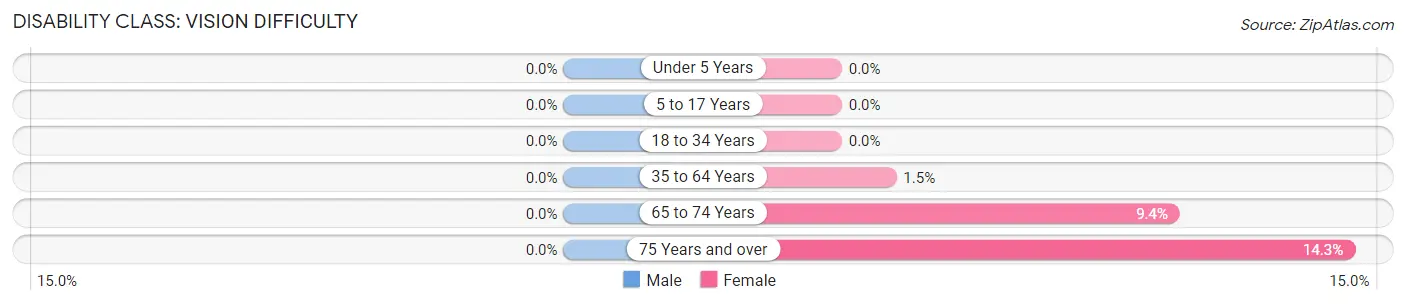
| Age Bracket | Male | Female |
| Under 5 Years | 0 (0.0%) | 0 (0.0%) |
| 5 to 17 Years | 0 (0.0%) | 0 (0.0%) |
| 18 to 34 Years | 0 (0.0%) | 0 (0.0%) |
| 35 to 64 Years | 0 (0.0%) | 11 (1.5%) |
| 65 to 74 Years | 0 (0.0%) | 8 (9.4%) |
| 75 Years and over | 0 (0.0%) | 4 (14.3%) |
Disability Class: Cognitive Difficulty
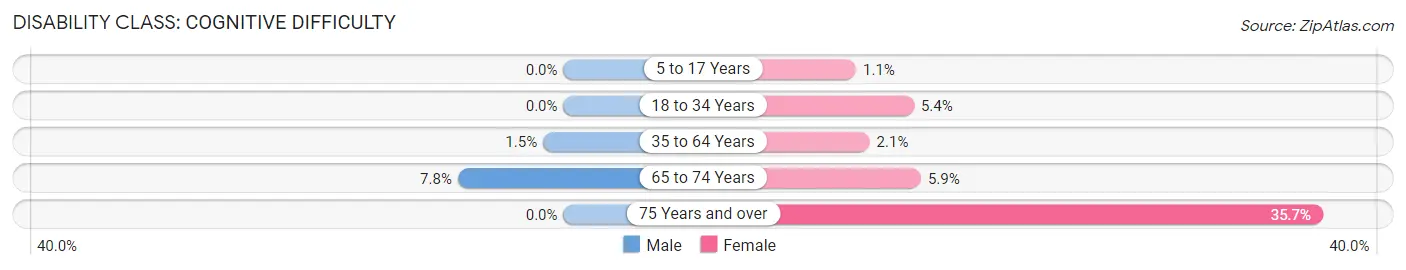
| Age Bracket | Male | Female |
| 5 to 17 Years | 0 (0.0%) | 4 (1.1%) |
| 18 to 34 Years | 0 (0.0%) | 14 (5.4%) |
| 35 to 64 Years | 9 (1.5%) | 15 (2.1%) |
| 65 to 74 Years | 8 (7.8%) | 5 (5.9%) |
| 75 Years and over | 0 (0.0%) | 10 (35.7%) |
Disability Class: Ambulatory Difficulty
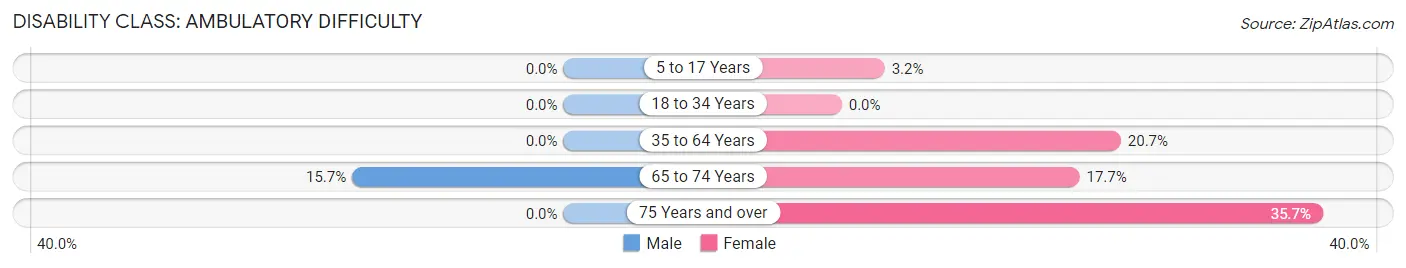
| Age Bracket | Male | Female |
| 5 to 17 Years | 0 (0.0%) | 12 (3.2%) |
| 18 to 34 Years | 0 (0.0%) | 0 (0.0%) |
| 35 to 64 Years | 0 (0.0%) | 150 (20.7%) |
| 65 to 74 Years | 16 (15.7%) | 15 (17.6%) |
| 75 Years and over | 0 (0.0%) | 10 (35.7%) |
Disability Class: Self-Care Difficulty
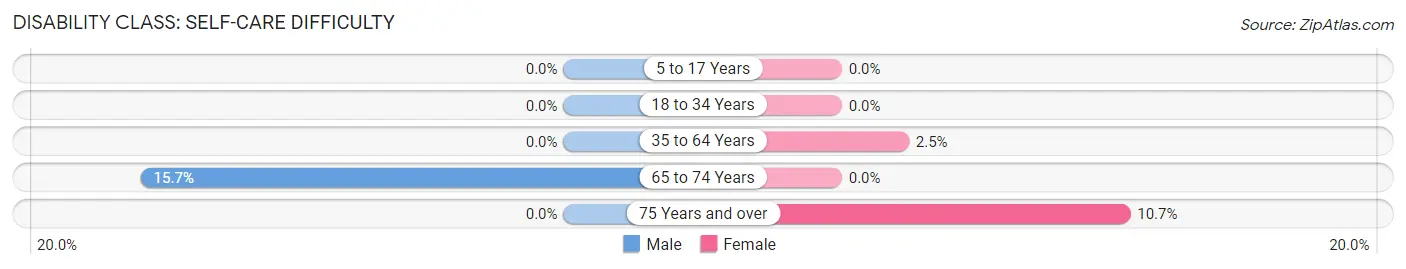
| Age Bracket | Male | Female |
| 5 to 17 Years | 0 (0.0%) | 0 (0.0%) |
| 18 to 34 Years | 0 (0.0%) | 0 (0.0%) |
| 35 to 64 Years | 0 (0.0%) | 18 (2.5%) |
| 65 to 74 Years | 16 (15.7%) | 0 (0.0%) |
| 75 Years and over | 0 (0.0%) | 3 (10.7%) |
Technology Access in Val Verde
Computing Device Access in Val Verde
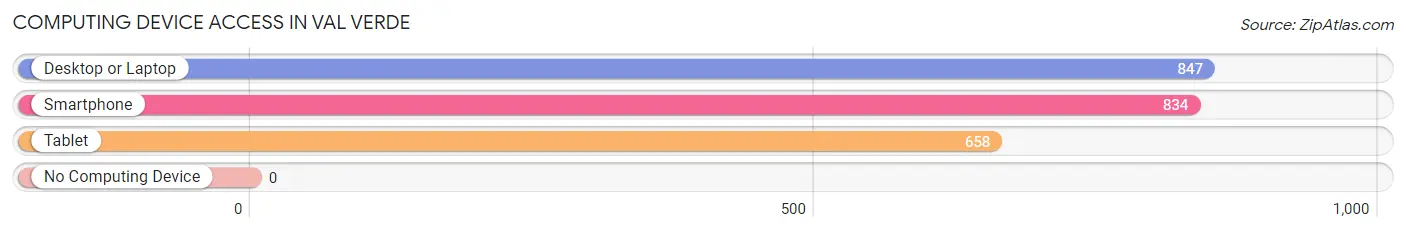
| Device Type | # Households | % Households |
| Desktop or Laptop | 847 | 96.7% |
| Smartphone | 834 | 95.2% |
| Tablet | 658 | 75.1% |
| No Computing Device | 0 | 0.0% |
| Total | 876 | 100.0% |
Internet Access in Val Verde
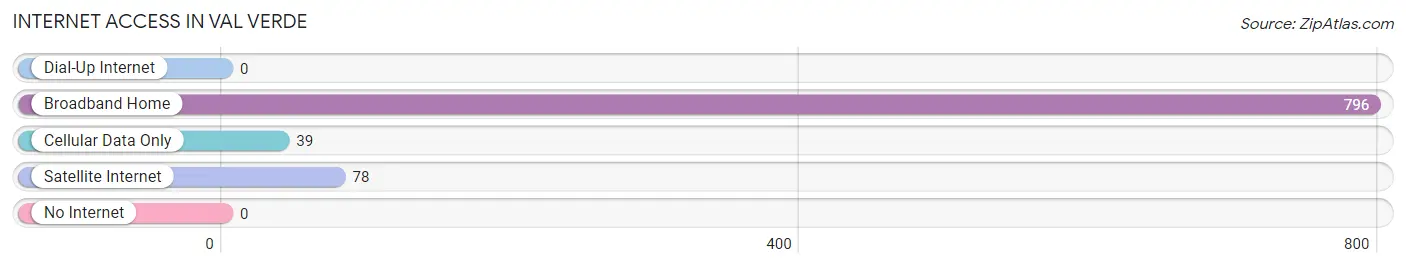
| Internet Type | # Households | % Households |
| Dial-Up Internet | 0 | 0.0% |
| Broadband Home | 796 | 90.9% |
| Cellular Data Only | 39 | 4.4% |
| Satellite Internet | 78 | 8.9% |
| No Internet | 0 | 0.0% |
| Total | 876 | 100.0% |
Val Verde Summary
Verde, California is a small unincorporated community located in the San Bernardino County of California. It is situated in the Mojave Desert, approximately 25 miles east of Barstow and about 50 miles north of Victorville. The population of Verde was estimated to be around 1,000 people in 2000.
History
Verde was founded in the late 1800s by a group of settlers who were looking for a place to settle and start a new life. The area was originally known as “Verde Valley” and was part of the San Bernardino County. The first settlers were mostly miners and ranchers who were attracted to the area due to its abundance of natural resources.
The town was officially established in 1891 and was named after the nearby Verde River. The town quickly grew and by the early 1900s, it had become a bustling community with a post office, a school, a general store, and a few other businesses.
In the 1920s, the town experienced a period of growth and prosperity due to the discovery of oil in the area. This led to the construction of several oil wells and the establishment of a refinery. The town also became a popular tourist destination due to its proximity to the nearby desert.
In the 1950s, the town experienced a period of decline as the oil industry began to decline and the population began to move away. The town was eventually abandoned in the late 1960s and has remained largely unchanged since then.
Geography
Verde is located in the Mojave Desert in the San Bernardino County of California. It is situated at an elevation of 2,400 feet and is surrounded by the San Bernardino National Forest. The town is located approximately 25 miles east of Barstow and about 50 miles north of Victorville.
The climate in Verde is arid and hot, with temperatures ranging from the mid-90s in the summer to the mid-50s in the winter. The area receives an average of 8 inches of rain per year.
Economy
The economy of Verde is largely based on tourism and agriculture. The town is home to several tourist attractions, including the nearby desert and the Verde River. The town also has a few small businesses, such as a general store and a few restaurants.
The town is also home to several farms and ranches, which produce a variety of crops, including alfalfa, cotton, and wheat. The town also has a few small manufacturing businesses, such as a furniture factory and a metal fabrication shop.
Demographics
As of the 2000 census, the population of Verde was estimated to be around 1,000 people. The racial makeup of the town was 94.7% White, 0.7% African American, 0.3% Native American, 0.3% Asian, 0.1% Pacific Islander, and 3.8% from other races. The median household income was $25,000 and the median family income was $30,000. The per capita income was $14,000.
Common Questions
What is the Total Population of Val Verde?
Total Population of Val Verde is 3,292.
What is the Total Male Population of Val Verde?
Total Male Population of Val Verde is 1,754.
What is the Total Female Population of Val Verde?
Total Female Population of Val Verde is 1,538.
What is the Ratio of Males per 100 Females in Val Verde?
There are 114.04 Males per 100 Females in Val Verde.
What is the Ratio of Females per 100 Males in Val Verde?
There are 87.69 Females per 100 Males in Val Verde.
What is the Median Population Age in Val Verde?
Median Population Age in Val Verde is 34.5 Years.
What is the Average Family Size in Val Verde
Average Family Size in Val Verde is 4.0 People.
What is the Average Household Size in Val Verde
Average Household Size in Val Verde is 3.8 People.
What is Per Capita Income in Val Verde?
Per Capita income in Val Verde is $31,857.
What is the Median Family Income in Val Verde?
Median Family Income in Val Verde is $110,870.
What is the Median Household income in Val Verde?
Median Household Income in Val Verde is $107,381.
What is Income or Wage Gap in Val Verde?
Income or Wage Gap in Val Verde is 3.9%.
Women in Val Verde earn 96.1 cents for every dollar earned by a man.
What is Inequality or Gini Index in Val Verde?
Inequality or Gini Index in Val Verde is 0.32.
How Large is the Labor Force in Val Verde?
There are 1,669 People in the Labor Forcein in Val Verde.
What is the Percentage of People in the Labor Force in Val Verde?
66.8% of People are in the Labor Force in Val Verde.
What is the Unemployment Rate in Val Verde?
Unemployment Rate in Val Verde is 5.4%.