Prairie Creek, AR
Prairie Creek Map
Prairie Creek Overview
2,379
TOTAL POPULATION
1,254
MALE POPULATION
1,125
FEMALE POPULATION
111.47
MALES / 100 FEMALES
89.71
FEMALES / 100 MALES
51.5
MEDIAN AGE
3.2
AVG FAMILY SIZE
2.6
AVG HOUSEHOLD SIZE
$44,324
PER CAPITA INCOME
$135,994
AVG FAMILY INCOME
$106,250
AVG HOUSEHOLD INCOME
14.2%
WAGE / INCOME GAP [ % ]
85.8¢/ $1
WAGE / INCOME GAP [ $ ]
0.38
INEQUALITY / GINI INDEX
1,193
LABOR FORCE [ PEOPLE ]
55.9%
PERCENT IN LABOR FORCE
7.2%
UNEMPLOYMENT RATE
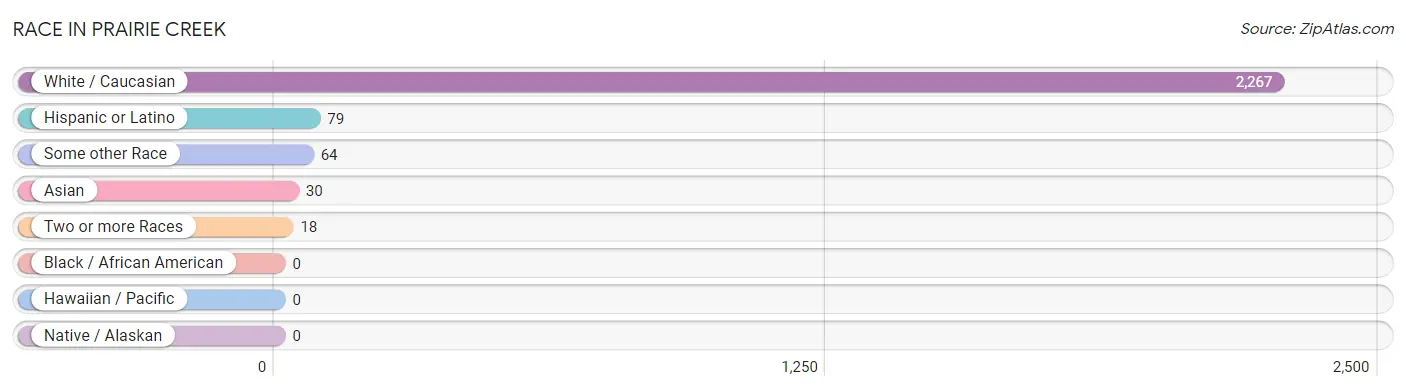
Race in Prairie Creek
The most populous races in Prairie Creek are White / Caucasian (2,267 | 95.3%), Hispanic or Latino (79 | 3.3%), and Some other Race (64 | 2.7%).
| Race | # Population | % Population |
| Asian | 30 | 1.3% |
| Black / African American | 0 | 0.0% |
| Hawaiian / Pacific | 0 | 0.0% |
| Hispanic or Latino | 79 | 3.3% |
| Native / Alaskan | 0 | 0.0% |
| White / Caucasian | 2,267 | 95.3% |
| Two or more Races | 18 | 0.8% |
| Some other Race | 64 | 2.7% |
| Total | 2,379 | 100.0% |
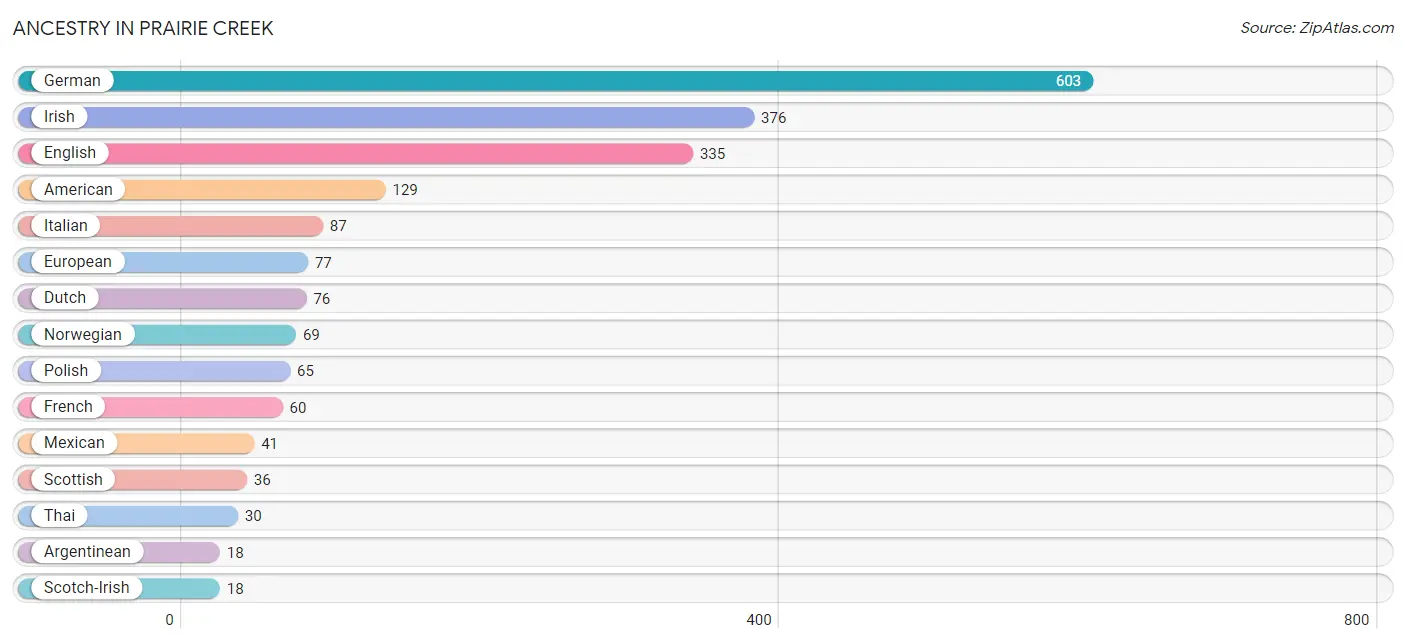
Ancestry in Prairie Creek
The most populous ancestries reported in Prairie Creek are German (603 | 25.4%), Irish (376 | 15.8%), English (335 | 14.1%), American (129 | 5.4%), and Italian (87 | 3.7%), together accounting for 64.3% of all Prairie Creek residents.
| Ancestry | # Population | % Population |
| American | 129 | 5.4% |
| Arab | 5 | 0.2% |
| Argentinean | 18 | 0.8% |
| Armenian | 6 | 0.3% |
| Brazilian | 15 | 0.6% |
| Central American | 14 | 0.6% |
| Cuban | 6 | 0.3% |
| Dutch | 76 | 3.2% |
| Dutch West Indian | 12 | 0.5% |
| Eastern European | 12 | 0.5% |
| English | 335 | 14.1% |
| European | 77 | 3.2% |
| French | 60 | 2.5% |
| German | 603 | 25.4% |
| Irish | 376 | 15.8% |
| Italian | 87 | 3.7% |
| Lebanese | 5 | 0.2% |
| Luxembourger | 7 | 0.3% |
| Mexican | 41 | 1.7% |
| Norwegian | 69 | 2.9% |
| Polish | 65 | 2.7% |
| Salvadoran | 14 | 0.6% |
| Scotch-Irish | 18 | 0.8% |
| Scottish | 36 | 1.5% |
| South American | 18 | 0.8% |
| Swedish | 3 | 0.1% |
| Thai | 30 | 1.3% | View All 27 Rows |
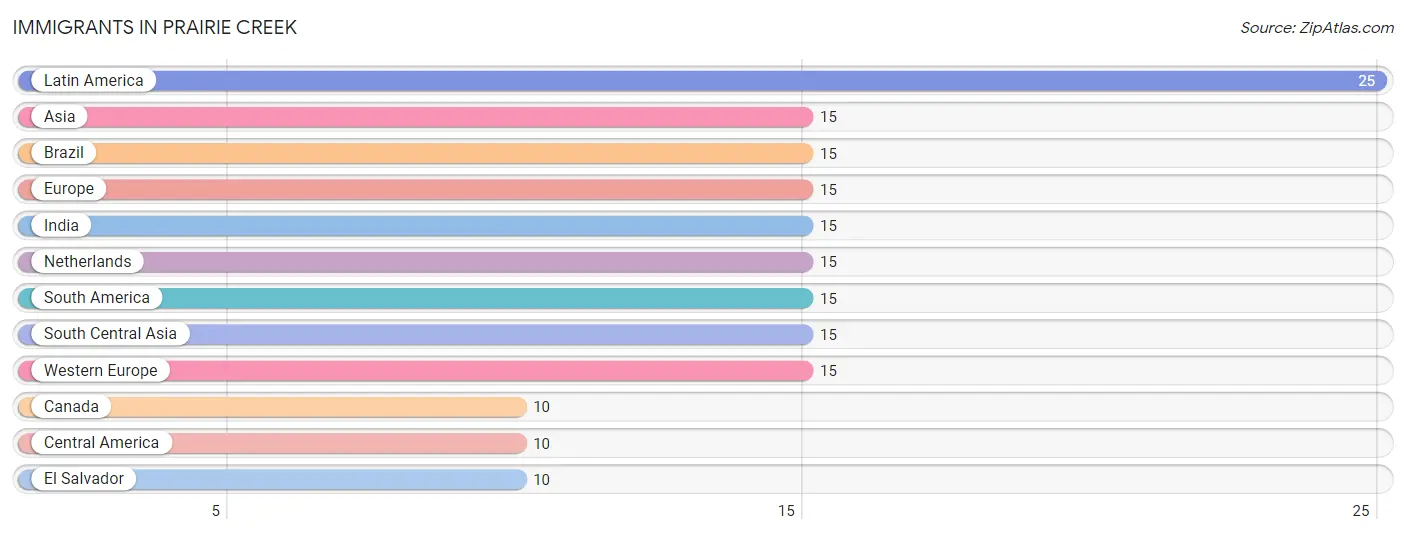
Immigrants in Prairie Creek
The most numerous immigrant groups reported in Prairie Creek came from Latin America (25 | 1.1%), Asia (15 | 0.6%), Brazil (15 | 0.6%), Europe (15 | 0.6%), and India (15 | 0.6%), together accounting for 3.6% of all Prairie Creek residents.
| Immigration Origin | # Population | % Population |
| Asia | 15 | 0.6% |
| Brazil | 15 | 0.6% |
| Canada | 10 | 0.4% |
| Central America | 10 | 0.4% |
| El Salvador | 10 | 0.4% |
| Europe | 15 | 0.6% |
| India | 15 | 0.6% |
| Latin America | 25 | 1.1% |
| Netherlands | 15 | 0.6% |
| South America | 15 | 0.6% |
| South Central Asia | 15 | 0.6% |
| Western Europe | 15 | 0.6% | View All 12 Rows |
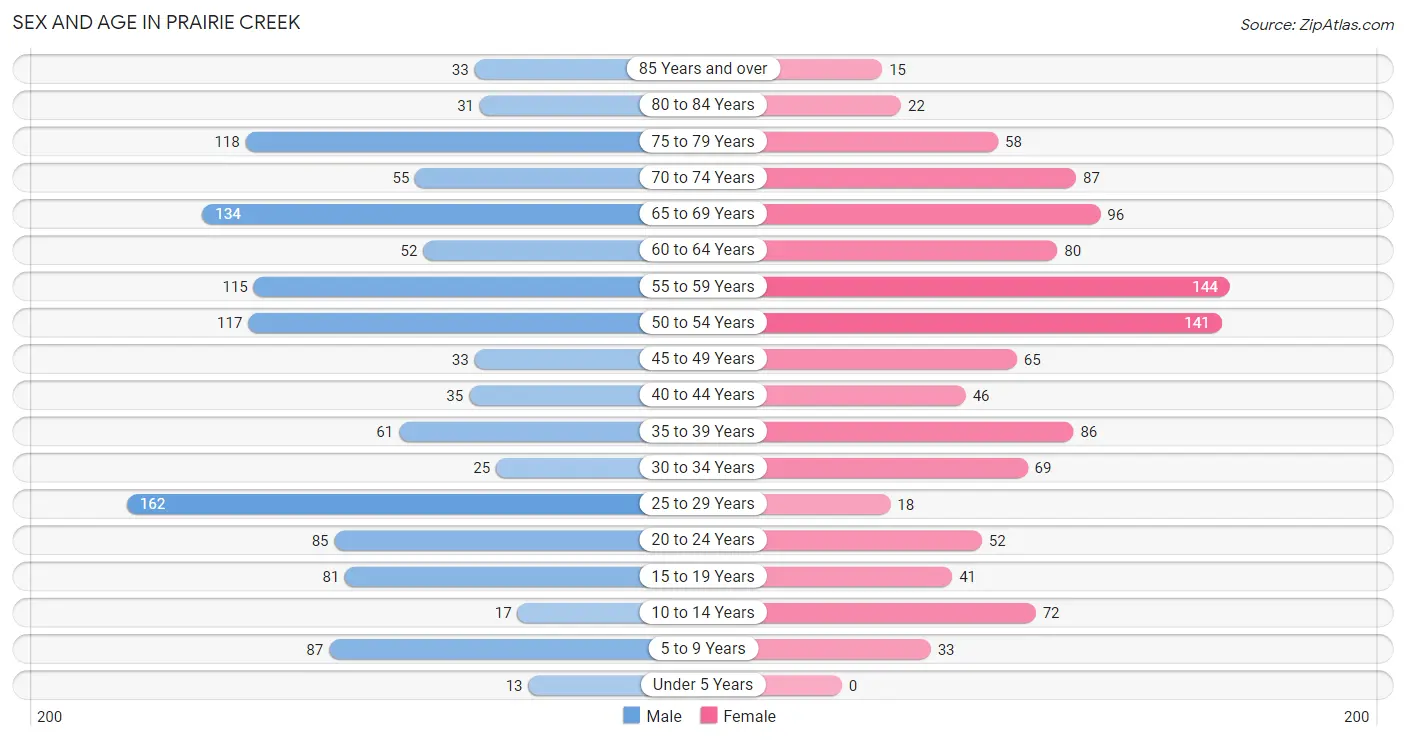
Sex and Age in Prairie Creek
Sex and Age in Prairie Creek
The most populous age groups in Prairie Creek are 25 to 29 Years (162 | 12.9%) for men and 55 to 59 Years (144 | 12.8%) for women.
| Age Bracket | Male | Female |
| Under 5 Years | 13 (1.0%) | 0 (0.0%) |
| 5 to 9 Years | 87 (6.9%) | 33 (2.9%) |
| 10 to 14 Years | 17 (1.4%) | 72 (6.4%) |
| 15 to 19 Years | 81 (6.5%) | 41 (3.6%) |
| 20 to 24 Years | 85 (6.8%) | 52 (4.6%) |
| 25 to 29 Years | 162 (12.9%) | 18 (1.6%) |
| 30 to 34 Years | 25 (2.0%) | 69 (6.1%) |
| 35 to 39 Years | 61 (4.9%) | 86 (7.6%) |
| 40 to 44 Years | 35 (2.8%) | 46 (4.1%) |
| 45 to 49 Years | 33 (2.6%) | 65 (5.8%) |
| 50 to 54 Years | 117 (9.3%) | 141 (12.5%) |
| 55 to 59 Years | 115 (9.2%) | 144 (12.8%) |
| 60 to 64 Years | 52 (4.2%) | 80 (7.1%) |
| 65 to 69 Years | 134 (10.7%) | 96 (8.5%) |
| 70 to 74 Years | 55 (4.4%) | 87 (7.7%) |
| 75 to 79 Years | 118 (9.4%) | 58 (5.2%) |
| 80 to 84 Years | 31 (2.5%) | 22 (2.0%) |
| 85 Years and over | 33 (2.6%) | 15 (1.3%) |
| Total | 1,254 (100.0%) | 1,125 (100.0%) |
Families and Households in Prairie Creek
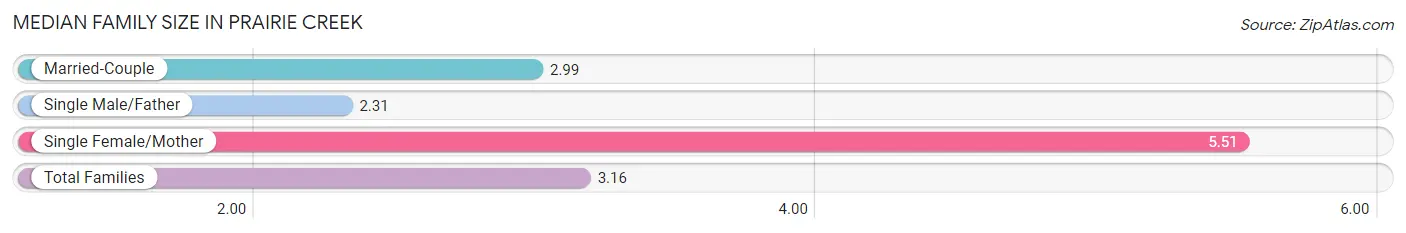
Median Family Size in Prairie Creek
The median family size in Prairie Creek is 3.16 persons per family, with single female/mother families (65 | 10.4%) accounting for the largest median family size of 5.51 persons per family. On the other hand, single male/father families (80 | 12.8%) represent the smallest median family size with 2.31 persons per family.
| Family Type | # Families | Family Size |
| Married-Couple | 482 (76.9%) | 2.99 |
| Single Male/Father | 80 (12.8%) | 2.31 |
| Single Female/Mother | 65 (10.4%) | 5.51 |
| Total Families | 627 (100.0%) | 3.16 |
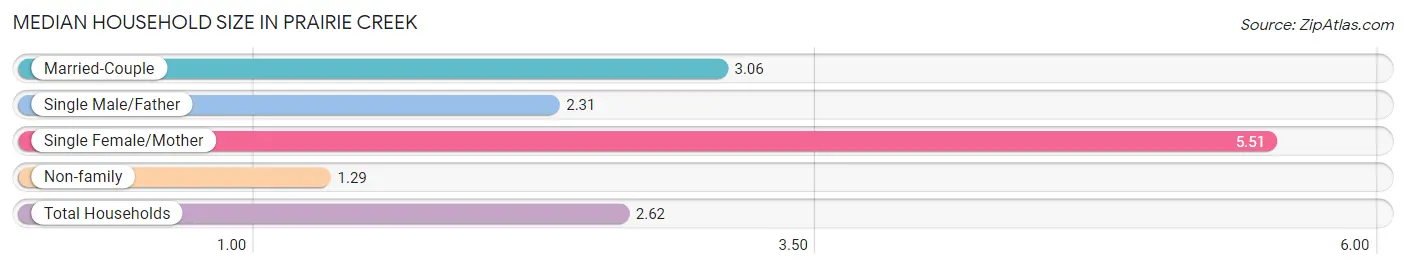
Median Household Size in Prairie Creek
The median household size in Prairie Creek is 2.62 persons per household, with single female/mother households (65 | 7.2%) accounting for the largest median household size of 5.51 persons per household. non-family households (281 | 30.9%) represent the smallest median household size with 1.29 persons per household.
| Household Type | # Households | Household Size |
| Married-Couple | 482 (53.1%) | 3.06 |
| Single Male/Father | 80 (8.8%) | 2.31 |
| Single Female/Mother | 65 (7.2%) | 5.51 |
| Non-family | 281 (30.9%) | 1.29 |
| Total Households | 908 (100.0%) | 2.62 |
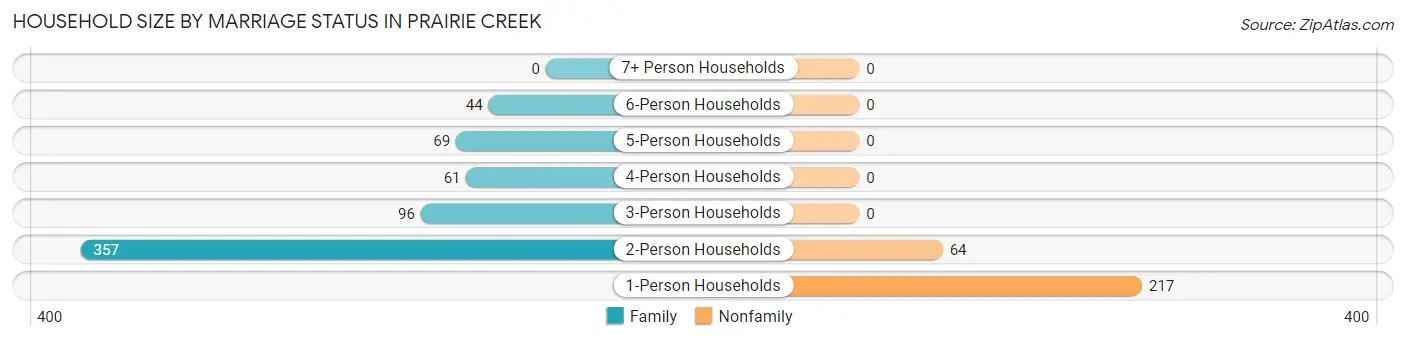
Household Size by Marriage Status in Prairie Creek
Out of a total of 908 households in Prairie Creek, 627 (69.1%) are family households, while 281 (30.9%) are nonfamily households. The most numerous type of family households are 2-person households, comprising 357, and the most common type of nonfamily households are 1-person households, comprising 217.
| Household Size | Family Households | Nonfamily Households |
| 1-Person Households | - | 217 (23.9%) |
| 2-Person Households | 357 (39.3%) | 64 (7.0%) |
| 3-Person Households | 96 (10.6%) | 0 (0.0%) |
| 4-Person Households | 61 (6.7%) | 0 (0.0%) |
| 5-Person Households | 69 (7.6%) | 0 (0.0%) |
| 6-Person Households | 44 (4.9%) | 0 (0.0%) |
| 7+ Person Households | 0 (0.0%) | 0 (0.0%) |
| Total | 627 (69.1%) | 281 (30.9%) |
Female Fertility in Prairie Creek
Fertility by Age in Prairie Creek
| Age Bracket | Women with Births | Births / 1,000 Women |
| 15 to 19 years | 0 (0.0%) | 0.0 |
| 20 to 34 years | 0 (0.0%) | 0.0 |
| 35 to 50 years | 0 (0.0%) | 0.0 |
| Total | 0 (0.0%) | 0.0 |
Fertility by Age by Marriage Status in Prairie Creek

| Age Bracket | Married | Unmarried |
| 15 to 19 years | 0 (0.0%) | 0 (0.0%) |
| 20 to 34 years | 0 (0.0%) | 0 (0.0%) |
| 35 to 50 years | 0 (0.0%) | 0 (0.0%) |
| Total | 0 (0.0%) | 0 (0.0%) |
Fertility by Education in Prairie Creek
| Educational Attainment | Women with Births | Births / 1,000 Women |
| Less than High School | 0 (0.0%) | 0.0 |
| High School Diploma | 0 (0.0%) | 0.0 |
| College or Associate's Degree | 0 (0.0%) | 0.0 |
| Bachelor's Degree | 0 (0.0%) | 0.0 |
| Graduate Degree | 0 (0.0%) | 0.0 |
| Total | 0 (0.0%) | 0.0 |
Fertility by Education by Marriage Status in Prairie Creek
| Educational Attainment | Married | Unmarried |
| Less than High School | 0 (0.0%) | 0 (0.0%) |
| High School Diploma | 0 (0.0%) | 0 (0.0%) |
| College or Associate's Degree | 0 (0.0%) | 0 (0.0%) |
| Bachelor's Degree | 0 (0.0%) | 0 (0.0%) |
| Graduate Degree | 0 (0.0%) | 0 (0.0%) |
| Total | 0 (0.0%) | 0 (0.0%) |
Income in Prairie Creek
Income Overview in Prairie Creek
Per Capita Income in Prairie Creek is $44,324, while median incomes of families and households are $135,994 and $106,250 respectively.
| Characteristic | Number | Measure |
| Per Capita Income | 2,379 | $44,324 |
| Median Family Income | 627 | $135,994 |
| Mean Family Income | 627 | $128,226 |
| Median Household Income | 908 | $106,250 |
| Mean Household Income | 908 | $109,725 |
| Income Deficit | 627 | $0 |
| Wage / Income Gap (%) | 2,379 | 14.18% |
| Wage / Income Gap ($) | 2,379 | 85.82¢ per $1 |
| Gini / Inequality Index | 2,379 | 0.38 |
Earnings by Sex in Prairie Creek
Average Earnings in Prairie Creek are $54,231, $48,496 for men and $56,506 for women, a difference of 14.2%.
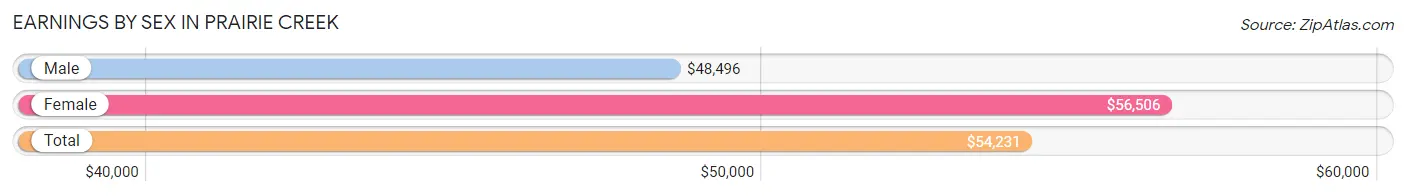
| Sex | Number | Average Earnings |
| Male | 627 (53.0%) | $48,496 |
| Female | 557 (47.0%) | $56,506 |
| Total | 1,184 (100.0%) | $54,231 |
Earnings by Sex by Income Bracket in Prairie Creek
The most common earnings brackets in Prairie Creek are $100,000+ for men (118 | 18.8%) and $65,000 to $74,999 for women (168 | 30.2%).
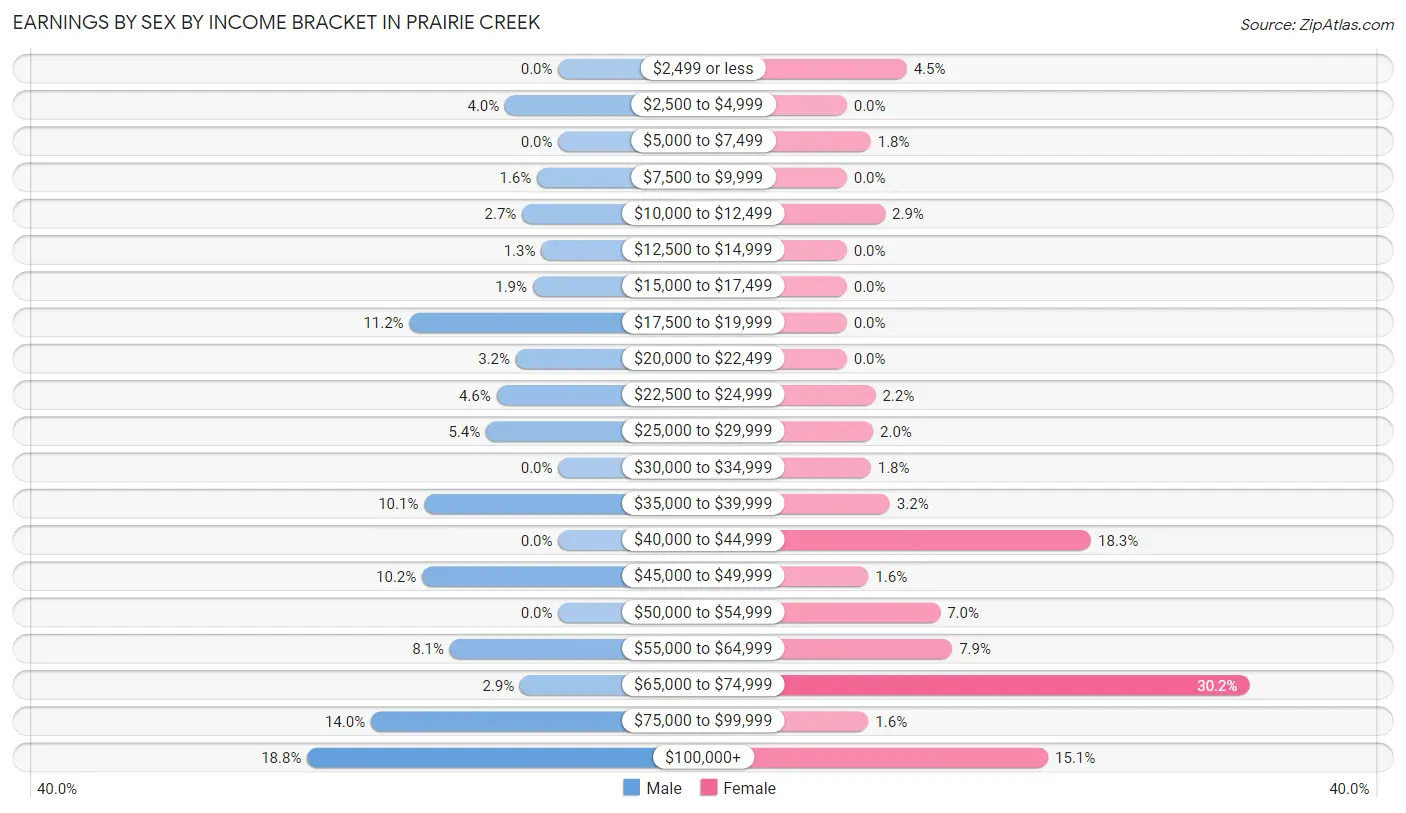
| Income | Male | Female |
| $2,499 or less | 0 (0.0%) | 25 (4.5%) |
| $2,500 to $4,999 | 25 (4.0%) | 0 (0.0%) |
| $5,000 to $7,499 | 0 (0.0%) | 10 (1.8%) |
| $7,500 to $9,999 | 10 (1.6%) | 0 (0.0%) |
| $10,000 to $12,499 | 17 (2.7%) | 16 (2.9%) |
| $12,500 to $14,999 | 8 (1.3%) | 0 (0.0%) |
| $15,000 to $17,499 | 12 (1.9%) | 0 (0.0%) |
| $17,500 to $19,999 | 70 (11.2%) | 0 (0.0%) |
| $20,000 to $22,499 | 20 (3.2%) | 0 (0.0%) |
| $22,500 to $24,999 | 29 (4.6%) | 12 (2.1%) |
| $25,000 to $29,999 | 34 (5.4%) | 11 (2.0%) |
| $30,000 to $34,999 | 0 (0.0%) | 10 (1.8%) |
| $35,000 to $39,999 | 63 (10.1%) | 18 (3.2%) |
| $40,000 to $44,999 | 0 (0.0%) | 102 (18.3%) |
| $45,000 to $49,999 | 64 (10.2%) | 9 (1.6%) |
| $50,000 to $54,999 | 0 (0.0%) | 39 (7.0%) |
| $55,000 to $64,999 | 51 (8.1%) | 44 (7.9%) |
| $65,000 to $74,999 | 18 (2.9%) | 168 (30.2%) |
| $75,000 to $99,999 | 88 (14.0%) | 9 (1.6%) |
| $100,000+ | 118 (18.8%) | 84 (15.1%) |
| Total | 627 (100.0%) | 557 (100.0%) |
Earnings by Sex by Educational Attainment in Prairie Creek
Average earnings in Prairie Creek are $56,719 for men and $56,051 for women, a difference of 1.2%. Men with an educational attainment of bachelor's degree enjoy the highest average annual earnings of $116,875, while those with graduate degree education earn the least with $38,640. Women with an educational attainment of bachelor's degree earn the most with the average annual earnings of $68,467, while those with college or associate's degree education have the smallest earnings of $46,042.
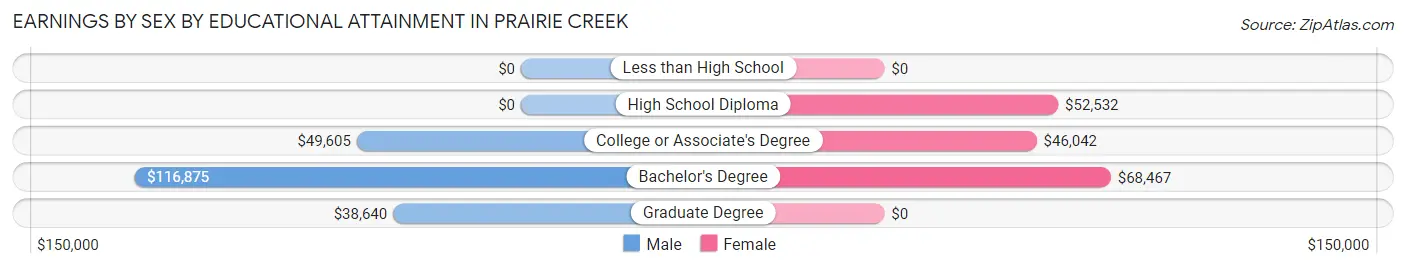
| Educational Attainment | Male Income | Female Income |
| Less than High School | - | - |
| High School Diploma | - | - |
| College or Associate's Degree | $49,605 | $46,042 |
| Bachelor's Degree | $116,875 | $68,467 |
| Graduate Degree | $38,640 | $0 |
| Total | $56,719 | $56,051 |
Family Income in Prairie Creek
Family Income Brackets in Prairie Creek
According to the Prairie Creek family income data, there are 222 families falling into the $150,000 to $199,999 income range, which is the most common income bracket and makes up 35.4% of all families. Conversely, the less than $10,000 income bracket is the least frequent group with only 13 families (2.1%) belonging to this category.
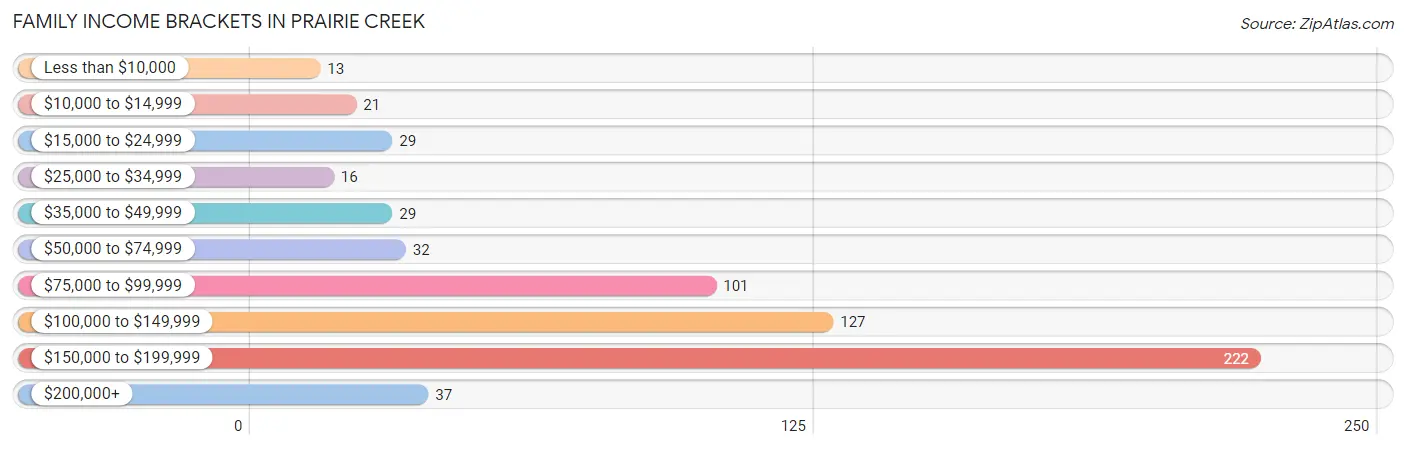
| Income Bracket | # Families | % Families |
| Less than $10,000 | 13 | 2.1% |
| $10,000 to $14,999 | 21 | 3.3% |
| $15,000 to $24,999 | 29 | 4.6% |
| $25,000 to $34,999 | 16 | 2.6% |
| $35,000 to $49,999 | 29 | 4.6% |
| $50,000 to $74,999 | 32 | 5.1% |
| $75,000 to $99,999 | 101 | 16.1% |
| $100,000 to $149,999 | 127 | 20.3% |
| $150,000 to $199,999 | 222 | 35.4% |
| $200,000+ | 37 | 5.9% |
Family Income by Famaliy Size in Prairie Creek
5-person families (85 | 13.6%) account for the highest median family income in Prairie Creek with $144,922 per family, while 2-person families (357 | 56.9%) have the highest median income of $62,604 per family member.
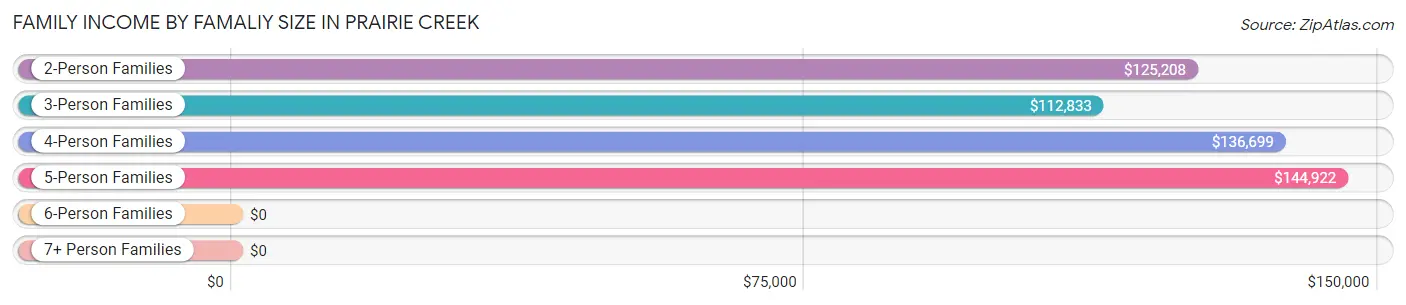
| Income Bracket | # Families | Median Income |
| 2-Person Families | 357 (56.9%) | $125,208 |
| 3-Person Families | 104 (16.6%) | $112,833 |
| 4-Person Families | 53 (8.5%) | $136,699 |
| 5-Person Families | 85 (13.6%) | $144,922 |
| 6-Person Families | 28 (4.5%) | $0 |
| 7+ Person Families | 0 (0.0%) | $0 |
| Total | 627 (100.0%) | $135,994 |
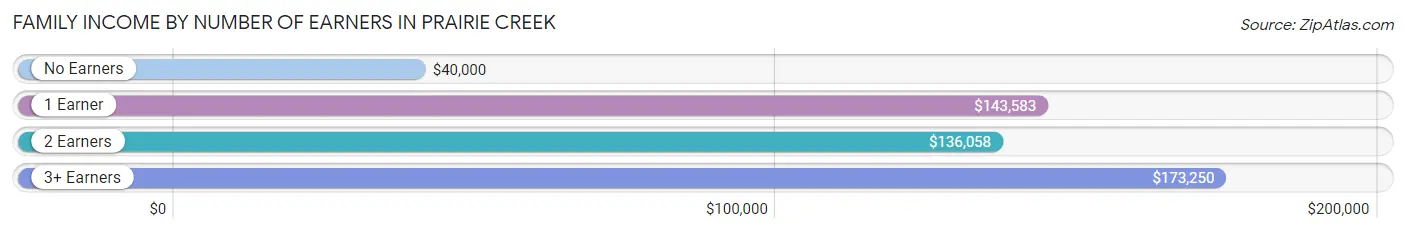
Family Income by Number of Earners in Prairie Creek
The median family income in Prairie Creek is $135,994, with families comprising 3+ earners (105) having the highest median family income of $173,250, while families with no earners (138) have the lowest median family income of $40,000, accounting for 16.8% and 22.0% of families, respectively.
| Number of Earners | # Families | Median Income |
| No Earners | 138 (22.0%) | $40,000 |
| 1 Earner | 231 (36.8%) | $143,583 |
| 2 Earners | 153 (24.4%) | $136,058 |
| 3+ Earners | 105 (16.8%) | $173,250 |
| Total | 627 (100.0%) | $135,994 |
Household Income in Prairie Creek
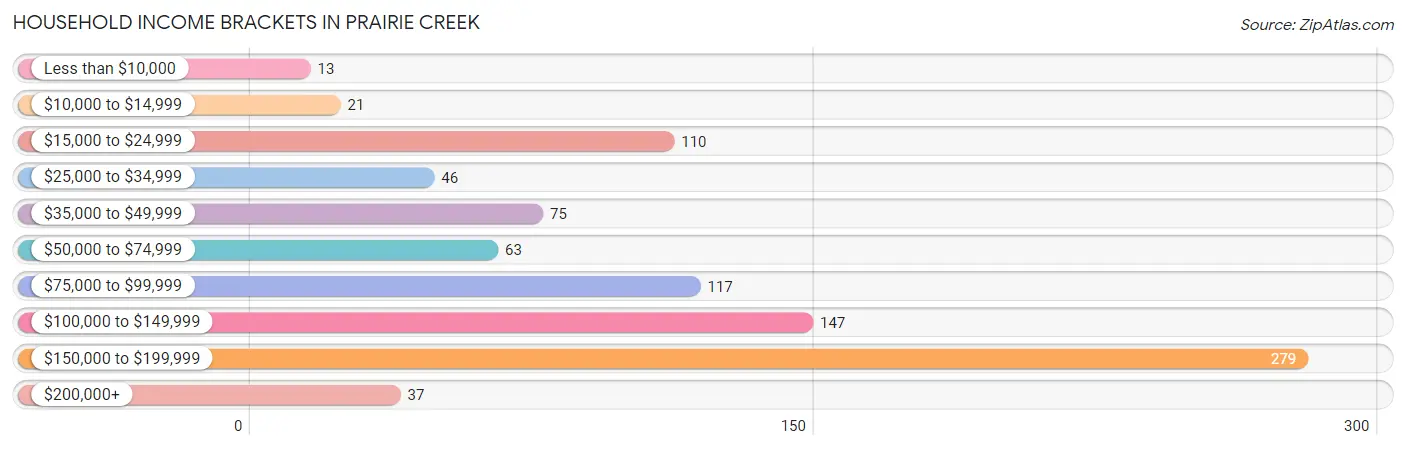
Household Income Brackets in Prairie Creek
With 279 households falling in the category, the $150,000 to $199,999 income range is the most frequent in Prairie Creek, accounting for 30.7% of all households. In contrast, only 13 households (1.4%) fall into the less than $10,000 income bracket, making it the least populous group.
| Income Bracket | # Households | % Households |
| Less than $10,000 | 13 | 1.4% |
| $10,000 to $14,999 | 21 | 2.3% |
| $15,000 to $24,999 | 110 | 12.1% |
| $25,000 to $34,999 | 46 | 5.1% |
| $35,000 to $49,999 | 75 | 8.3% |
| $50,000 to $74,999 | 63 | 6.9% |
| $75,000 to $99,999 | 117 | 12.9% |
| $100,000 to $149,999 | 147 | 16.2% |
| $150,000 to $199,999 | 279 | 30.7% |
| $200,000+ | 37 | 4.1% |
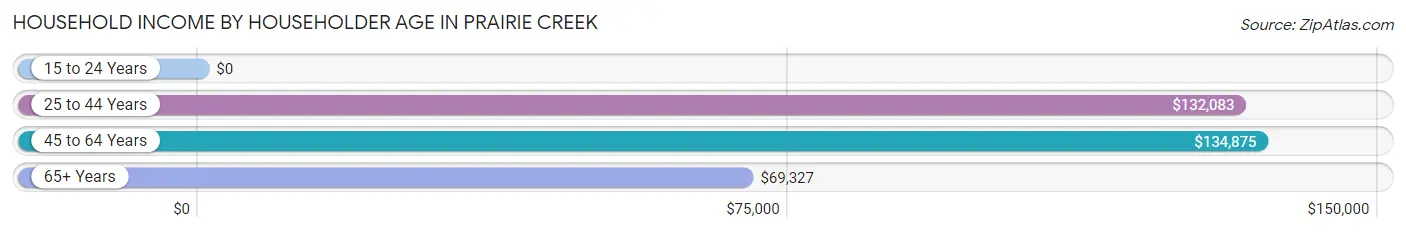
Household Income by Householder Age in Prairie Creek
The median household income in Prairie Creek is $106,250, with the highest median household income of $134,875 found in the 45 to 64 years age bracket for the primary householder. A total of 341 households (37.6%) fall into this category.
| Income Bracket | # Households | Median Income |
| 15 to 24 Years | 0 (0.0%) | $0 |
| 25 to 44 Years | 162 (17.8%) | $132,083 |
| 45 to 64 Years | 341 (37.6%) | $134,875 |
| 65+ Years | 405 (44.6%) | $69,327 |
| Total | 908 (100.0%) | $106,250 |
Poverty in Prairie Creek
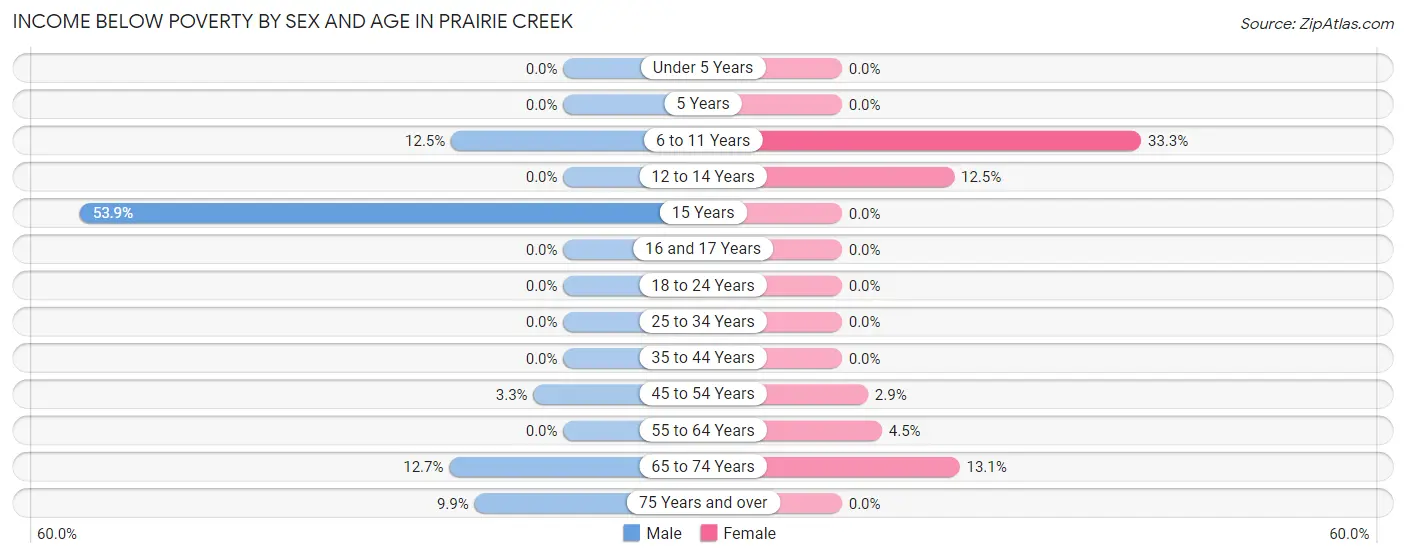
Income Below Poverty by Sex and Age in Prairie Creek
With 4.8% poverty level for males and 5.7% for females among the residents of Prairie Creek, 15 year old males and 6 to 11 year old females are the most vulnerable to poverty, with 7 males (53.8%) and 18 females (33.3%) in their respective age groups living below the poverty level.
| Age Bracket | Male | Female |
| Under 5 Years | 0 (0.0%) | 0 (0.0%) |
| 5 Years | 0 (0.0%) | 0 (0.0%) |
| 6 to 11 Years | 6 (12.5%) | 18 (33.3%) |
| 12 to 14 Years | 0 (0.0%) | 6 (12.5%) |
| 15 Years | 7 (53.8%) | 0 (0.0%) |
| 16 and 17 Years | 0 (0.0%) | 0 (0.0%) |
| 18 to 24 Years | 0 (0.0%) | 0 (0.0%) |
| 25 to 34 Years | 0 (0.0%) | 0 (0.0%) |
| 35 to 44 Years | 0 (0.0%) | 0 (0.0%) |
| 45 to 54 Years | 5 (3.3%) | 6 (2.9%) |
| 55 to 64 Years | 0 (0.0%) | 10 (4.5%) |
| 65 to 74 Years | 24 (12.7%) | 24 (13.1%) |
| 75 Years and over | 18 (9.9%) | 0 (0.0%) |
| Total | 60 (4.8%) | 64 (5.7%) |
Income Above Poverty by Sex and Age in Prairie Creek
According to the poverty statistics in Prairie Creek, males aged under 5 years and females aged 5 years are the age groups that are most secure financially, with 100.0% of males and 100.0% of females in these age groups living above the poverty line.
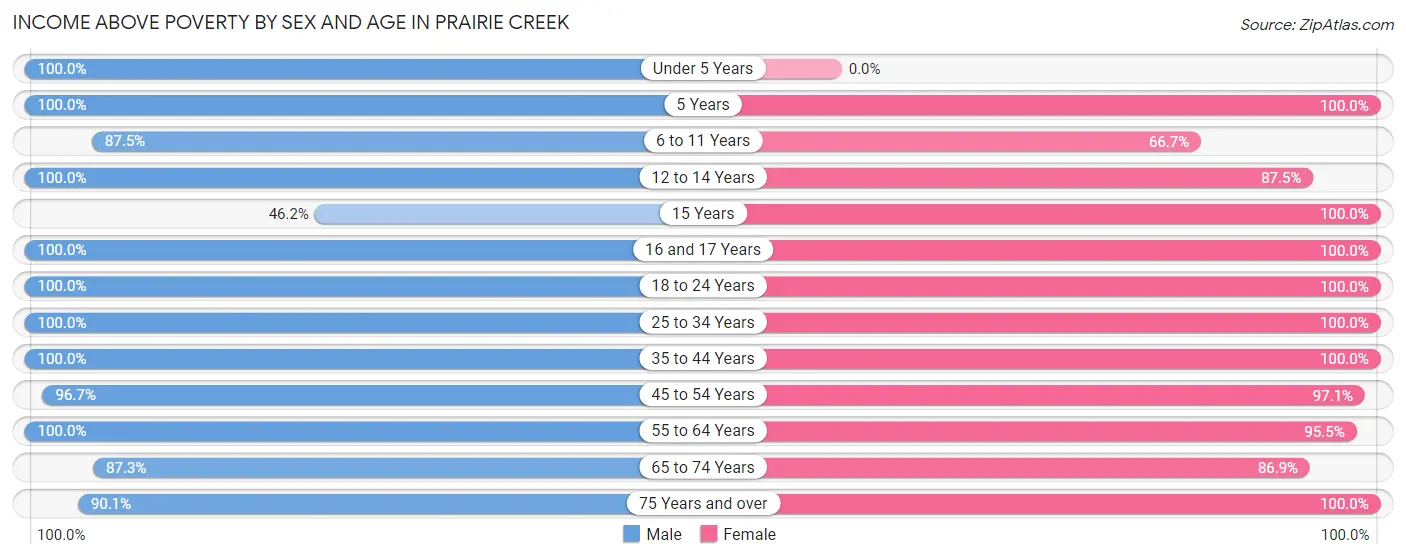
| Age Bracket | Male | Female |
| Under 5 Years | 13 (100.0%) | 0 (0.0%) |
| 5 Years | 39 (100.0%) | 3 (100.0%) |
| 6 to 11 Years | 42 (87.5%) | 36 (66.7%) |
| 12 to 14 Years | 17 (100.0%) | 42 (87.5%) |
| 15 Years | 6 (46.2%) | 9 (100.0%) |
| 16 and 17 Years | 43 (100.0%) | 25 (100.0%) |
| 18 to 24 Years | 110 (100.0%) | 59 (100.0%) |
| 25 to 34 Years | 187 (100.0%) | 87 (100.0%) |
| 35 to 44 Years | 96 (100.0%) | 132 (100.0%) |
| 45 to 54 Years | 145 (96.7%) | 200 (97.1%) |
| 55 to 64 Years | 167 (100.0%) | 214 (95.5%) |
| 65 to 74 Years | 165 (87.3%) | 159 (86.9%) |
| 75 Years and over | 164 (90.1%) | 95 (100.0%) |
| Total | 1,194 (95.2%) | 1,061 (94.3%) |
Income Below Poverty Among Married-Couple Families in Prairie Creek
The poverty statistics for married-couple families in Prairie Creek show that 5.8% or 28 of the total 482 families live below the poverty line. Families with no children have the highest poverty rate of 8.3%, comprising of 28 families. On the other hand, families with 1 or 2 children have the lowest poverty rate of 0.0%, which includes 0 families.
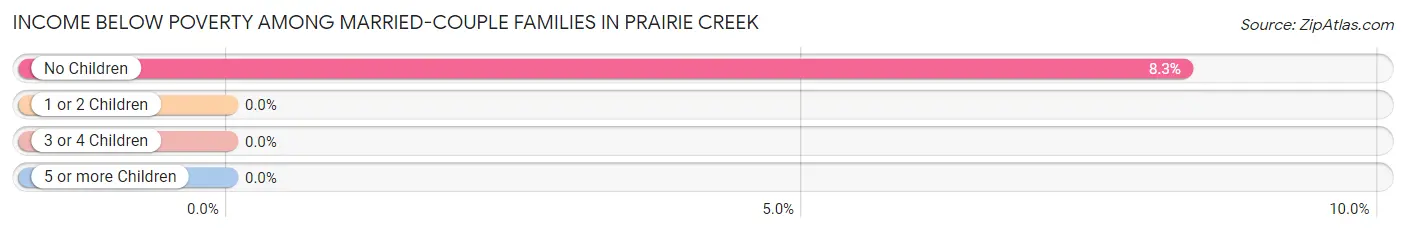
| Children | Above Poverty | Below Poverty |
| No Children | 309 (91.7%) | 28 (8.3%) |
| 1 or 2 Children | 128 (100.0%) | 0 (0.0%) |
| 3 or 4 Children | 17 (100.0%) | 0 (0.0%) |
| 5 or more Children | 0 (0.0%) | 0 (0.0%) |
| Total | 454 (94.2%) | 28 (5.8%) |
Income Below Poverty Among Single-Parent Households in Prairie Creek
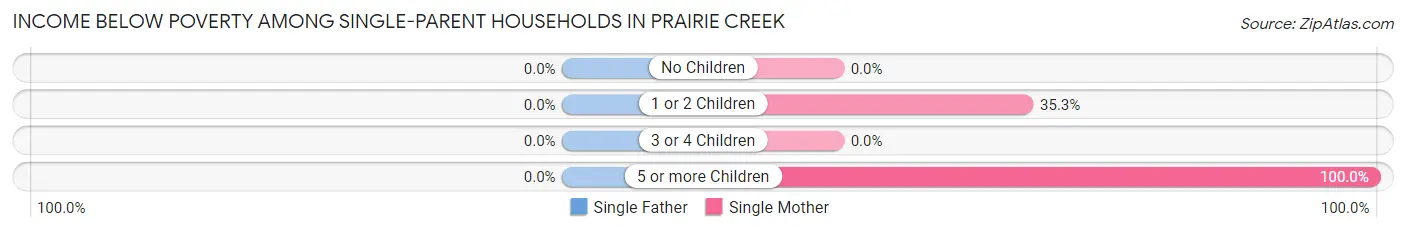
| Children | Single Father | Single Mother |
| No Children | 0 (0.0%) | 0 (0.0%) |
| 1 or 2 Children | 0 (0.0%) | 6 (35.3%) |
| 3 or 4 Children | 0 (0.0%) | 0 (0.0%) |
| 5 or more Children | 0 (0.0%) | 6 (100.0%) |
| Total | 0 (0.0%) | 12 (18.5%) |
Income Below Poverty Among Married-Couple vs Single-Parent Households in Prairie Creek
The poverty data for Prairie Creek shows that 28 of the married-couple family households (5.8%) and 12 of the single-parent households (8.3%) are living below the poverty level. Within the married-couple family households, those with no children have the highest poverty rate, with 28 households (8.3%) falling below the poverty line. Among the single-parent households, those with 5 or more children have the highest poverty rate, with 6 household (100.0%) living below poverty.
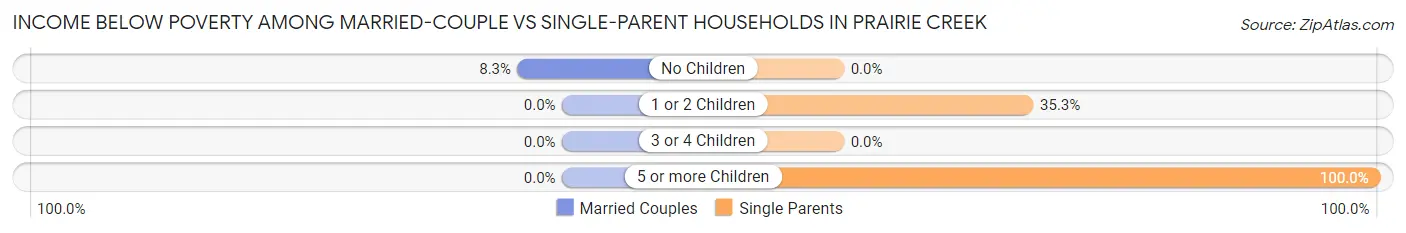
| Children | Married-Couple Families | Single-Parent Households |
| No Children | 28 (8.3%) | 0 (0.0%) |
| 1 or 2 Children | 0 (0.0%) | 6 (35.3%) |
| 3 or 4 Children | 0 (0.0%) | 0 (0.0%) |
| 5 or more Children | 0 (0.0%) | 6 (100.0%) |
| Total | 28 (5.8%) | 12 (8.3%) |
Employment Characteristics in Prairie Creek
Employment by Class of Employer in Prairie Creek
Among the 1,108 employed individuals in Prairie Creek, private company employees (815 | 73.6%), local government employees (119 | 10.7%), and not-for-profit organizations (98 | 8.8%) make up the most common classes of employment.
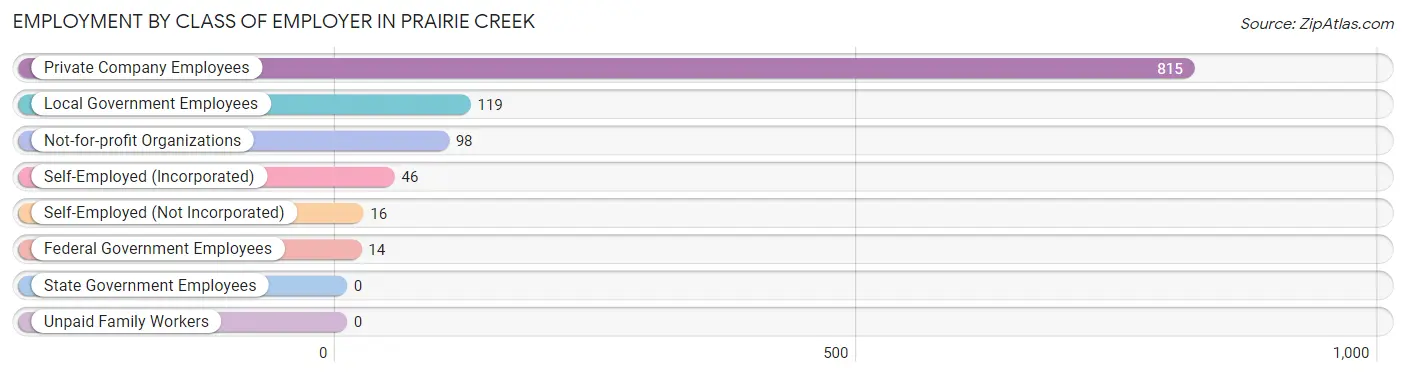
| Employer Class | # Employees | % Employees |
| Private Company Employees | 815 | 73.6% |
| Self-Employed (Incorporated) | 46 | 4.2% |
| Self-Employed (Not Incorporated) | 16 | 1.4% |
| Not-for-profit Organizations | 98 | 8.8% |
| Local Government Employees | 119 | 10.7% |
| State Government Employees | 0 | 0.0% |
| Federal Government Employees | 14 | 1.3% |
| Unpaid Family Workers | 0 | 0.0% |
| Total | 1,108 | 100.0% |
Employment Status by Age in Prairie Creek
According to the labor force statistics for Prairie Creek, out of the total population over 16 years of age (2,135), 55.9% or 1,193 individuals are in the labor force, with 7.2% or 86 of them unemployed. The age group with the highest labor force participation rate is 35 to 44 years, with 96.5% or 220 individuals in the labor force. Within the labor force, the 25 to 29 years age range has the highest percentage of unemployed individuals, with 33.9% or 56 of them being unemployed.
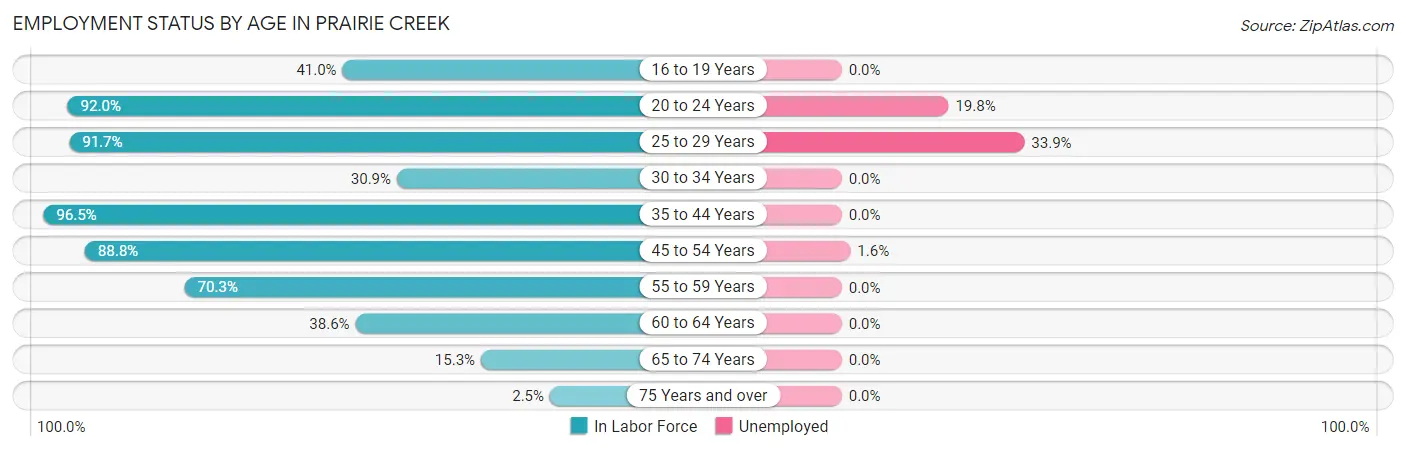
| Age Bracket | In Labor Force | Unemployed |
| 16 to 19 Years | 41 (41.0%) | 0 (0.0%) |
| 20 to 24 Years | 126 (92.0%) | 25 (19.8%) |
| 25 to 29 Years | 165 (91.7%) | 56 (33.9%) |
| 30 to 34 Years | 29 (30.9%) | 0 (0.0%) |
| 35 to 44 Years | 220 (96.5%) | 0 (0.0%) |
| 45 to 54 Years | 316 (88.8%) | 5 (1.6%) |
| 55 to 59 Years | 182 (70.3%) | 0 (0.0%) |
| 60 to 64 Years | 51 (38.6%) | 0 (0.0%) |
| 65 to 74 Years | 57 (15.3%) | 0 (0.0%) |
| 75 Years and over | 7 (2.5%) | 0 (0.0%) |
| Total | 1,193 (55.9%) | 86 (7.2%) |
Employment Status by Educational Attainment in Prairie Creek
According to labor force statistics for Prairie Creek, 77.1% of individuals (963) out of the total population between 25 and 64 years of age (1,249) are in the labor force, with 6.3% or 61 of them being unemployed. The group with the highest labor force participation rate are those with the educational attainment of college / associate degree, with 87.4% or 403 individuals in the labor force. Within the labor force, individuals with college / associate degree education have the highest percentage of unemployment, with 13.9% or 56 of them being unemployed.
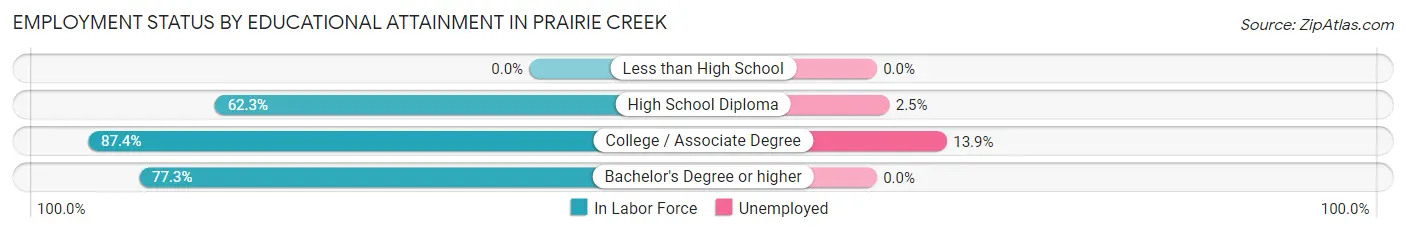
| Educational Attainment | In Labor Force | Unemployed |
| Less than High School | 0 (0.0%) | 0 (0.0%) |
| High School Diploma | 203 (62.3%) | 8 (2.5%) |
| College / Associate Degree | 403 (87.4%) | 64 (13.9%) |
| Bachelor's Degree or higher | 357 (77.3%) | 0 (0.0%) |
| Total | 963 (77.1%) | 79 (6.3%) |
Employment Occupations by Sex in Prairie Creek
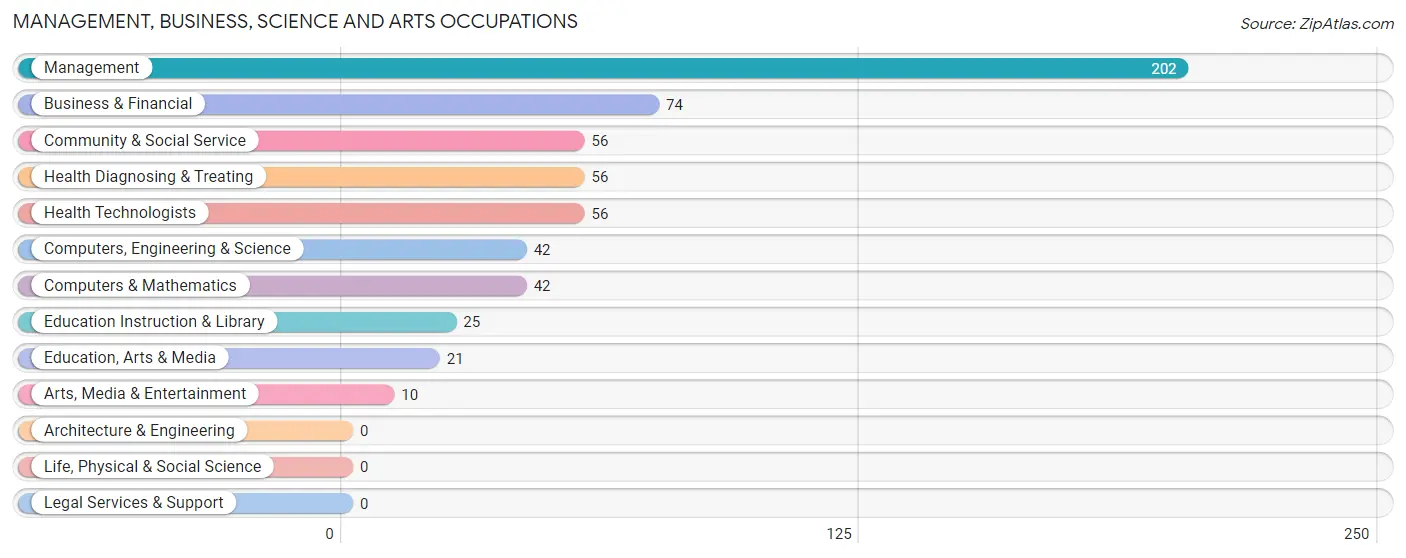
Management, Business, Science and Arts Occupations
The most common Management, Business, Science and Arts occupations in Prairie Creek are Management (202 | 18.2%), Business & Financial (74 | 6.7%), Community & Social Service (56 | 5.1%), Health Diagnosing & Treating (56 | 5.1%), and Health Technologists (56 | 5.1%).
Management, Business, Science and Arts Occupations by Sex
Within the Management, Business, Science and Arts occupations in Prairie Creek, the most male-oriented occupations are Education, Arts & Media (100.0%), Computers, Engineering & Science (71.4%), and Computers & Mathematics (71.4%), while the most female-oriented occupations are Education Instruction & Library (100.0%), Arts, Media & Entertainment (100.0%), and Business & Financial (79.7%).
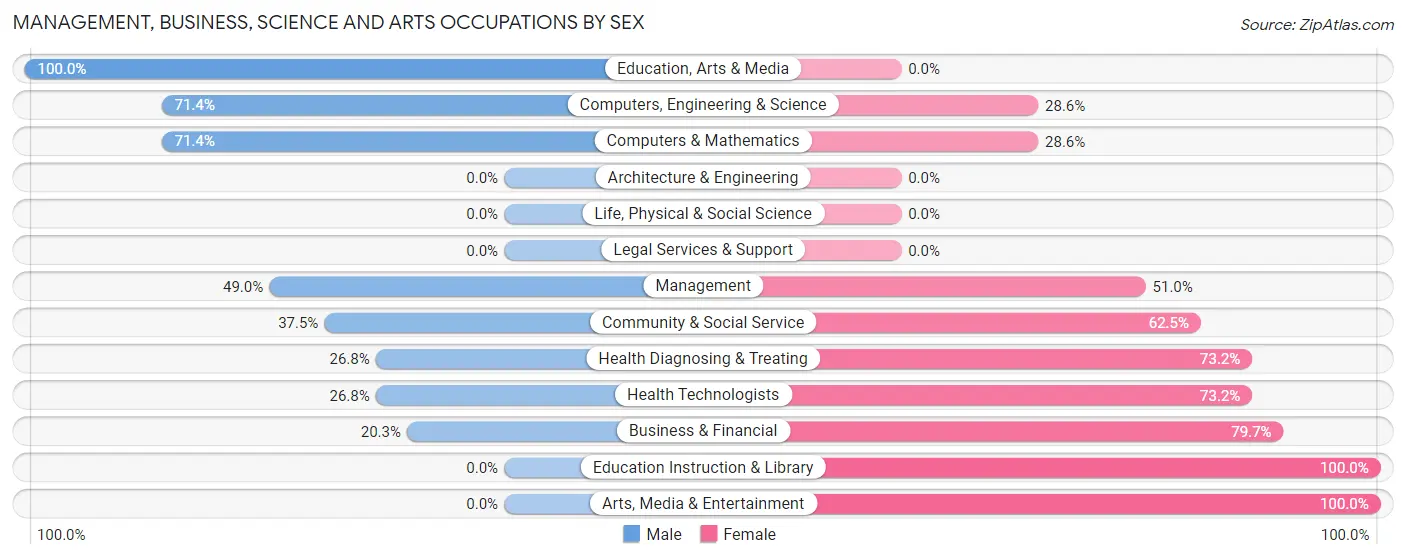
| Occupation | Male | Female |
| Management | 99 (49.0%) | 103 (51.0%) |
| Business & Financial | 15 (20.3%) | 59 (79.7%) |
| Computers, Engineering & Science | 30 (71.4%) | 12 (28.6%) |
| Computers & Mathematics | 30 (71.4%) | 12 (28.6%) |
| Architecture & Engineering | 0 (0.0%) | 0 (0.0%) |
| Life, Physical & Social Science | 0 (0.0%) | 0 (0.0%) |
| Community & Social Service | 21 (37.5%) | 35 (62.5%) |
| Education, Arts & Media | 21 (100.0%) | 0 (0.0%) |
| Legal Services & Support | 0 (0.0%) | 0 (0.0%) |
| Education Instruction & Library | 0 (0.0%) | 25 (100.0%) |
| Arts, Media & Entertainment | 0 (0.0%) | 10 (100.0%) |
| Health Diagnosing & Treating | 15 (26.8%) | 41 (73.2%) |
| Health Technologists | 15 (26.8%) | 41 (73.2%) |
| Total (Category) | 180 (41.9%) | 250 (58.1%) |
| Total (Overall) | 572 (51.6%) | 536 (48.4%) |
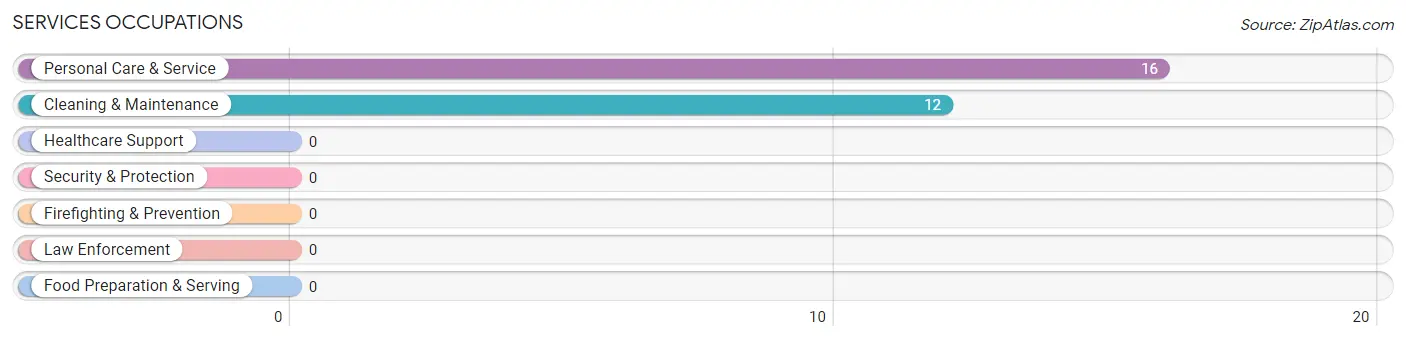
Services Occupations
The most common Services occupations in Prairie Creek are Personal Care & Service (16 | 1.4%), and Cleaning & Maintenance (12 | 1.1%).
Services Occupations by Sex
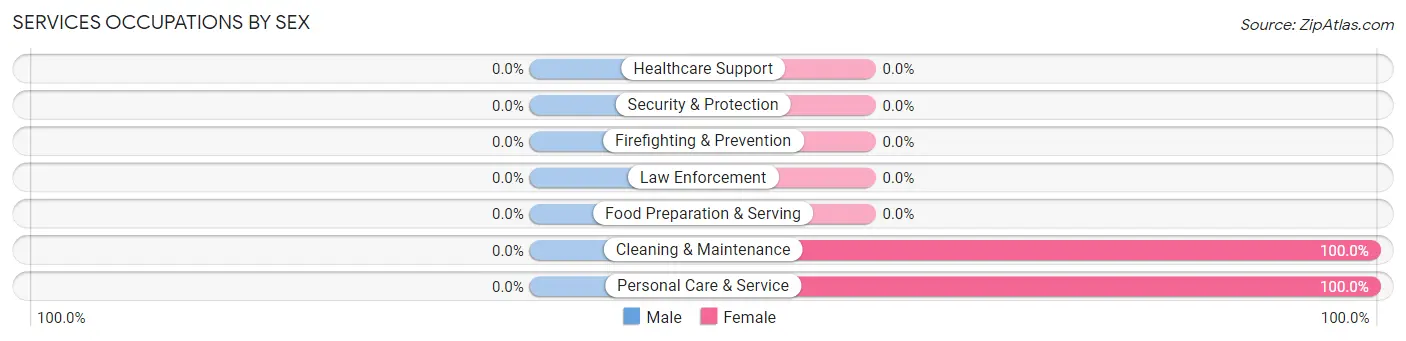
| Occupation | Male | Female |
| Healthcare Support | 0 (0.0%) | 0 (0.0%) |
| Security & Protection | 0 (0.0%) | 0 (0.0%) |
| Firefighting & Prevention | 0 (0.0%) | 0 (0.0%) |
| Law Enforcement | 0 (0.0%) | 0 (0.0%) |
| Food Preparation & Serving | 0 (0.0%) | 0 (0.0%) |
| Cleaning & Maintenance | 0 (0.0%) | 12 (100.0%) |
| Personal Care & Service | 0 (0.0%) | 16 (100.0%) |
| Total (Category) | 0 (0.0%) | 28 (100.0%) |
| Total (Overall) | 572 (51.6%) | 536 (48.4%) |
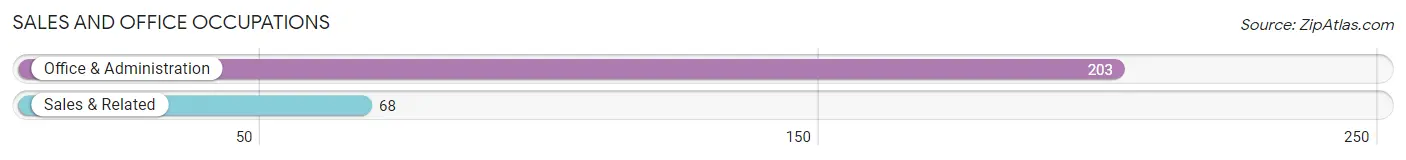
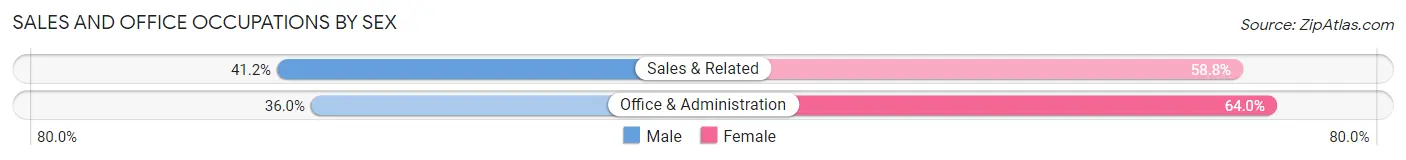
Sales and Office Occupations
The most common Sales and Office occupations in Prairie Creek are Office & Administration (203 | 18.3%), and Sales & Related (68 | 6.1%).
Sales and Office Occupations by Sex
| Occupation | Male | Female |
| Sales & Related | 28 (41.2%) | 40 (58.8%) |
| Office & Administration | 73 (36.0%) | 130 (64.0%) |
| Total (Category) | 101 (37.3%) | 170 (62.7%) |
| Total (Overall) | 572 (51.6%) | 536 (48.4%) |
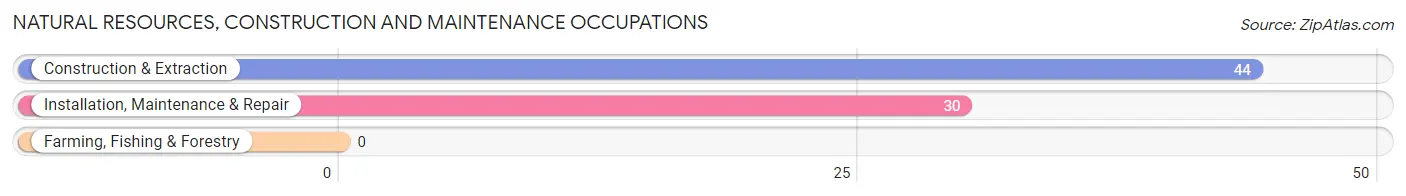
Natural Resources, Construction and Maintenance Occupations
The most common Natural Resources, Construction and Maintenance occupations in Prairie Creek are Construction & Extraction (44 | 4.0%), and Installation, Maintenance & Repair (30 | 2.7%).
Natural Resources, Construction and Maintenance Occupations by Sex
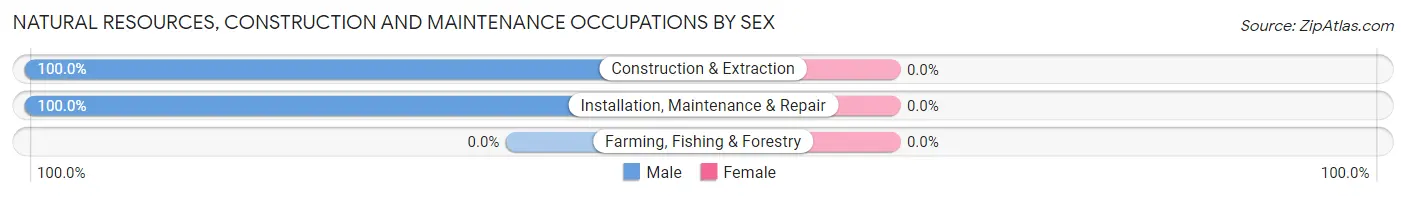
| Occupation | Male | Female |
| Farming, Fishing & Forestry | 0 (0.0%) | 0 (0.0%) |
| Construction & Extraction | 44 (100.0%) | 0 (0.0%) |
| Installation, Maintenance & Repair | 30 (100.0%) | 0 (0.0%) |
| Total (Category) | 74 (100.0%) | 0 (0.0%) |
| Total (Overall) | 572 (51.6%) | 536 (48.4%) |
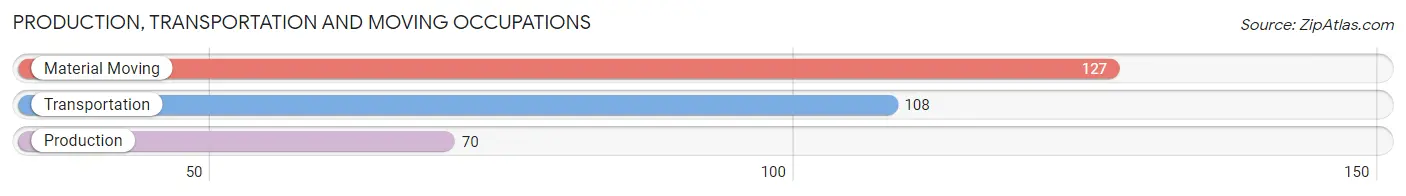
Production, Transportation and Moving Occupations
The most common Production, Transportation and Moving occupations in Prairie Creek are Material Moving (127 | 11.5%), Transportation (108 | 9.8%), and Production (70 | 6.3%).
Production, Transportation and Moving Occupations by Sex
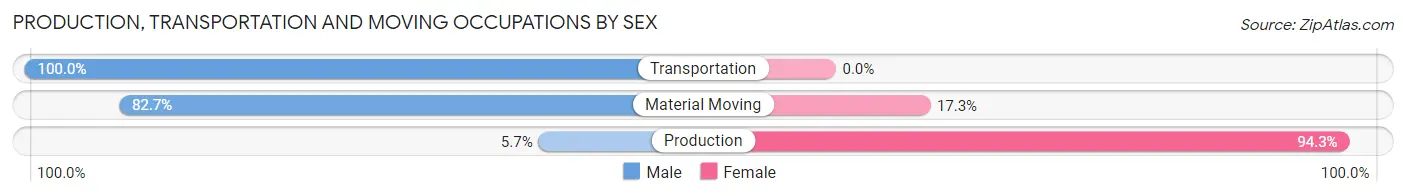
| Occupation | Male | Female |
| Production | 4 (5.7%) | 66 (94.3%) |
| Transportation | 108 (100.0%) | 0 (0.0%) |
| Material Moving | 105 (82.7%) | 22 (17.3%) |
| Total (Category) | 217 (71.2%) | 88 (28.8%) |
| Total (Overall) | 572 (51.6%) | 536 (48.4%) |
Employment Industries by Sex in Prairie Creek
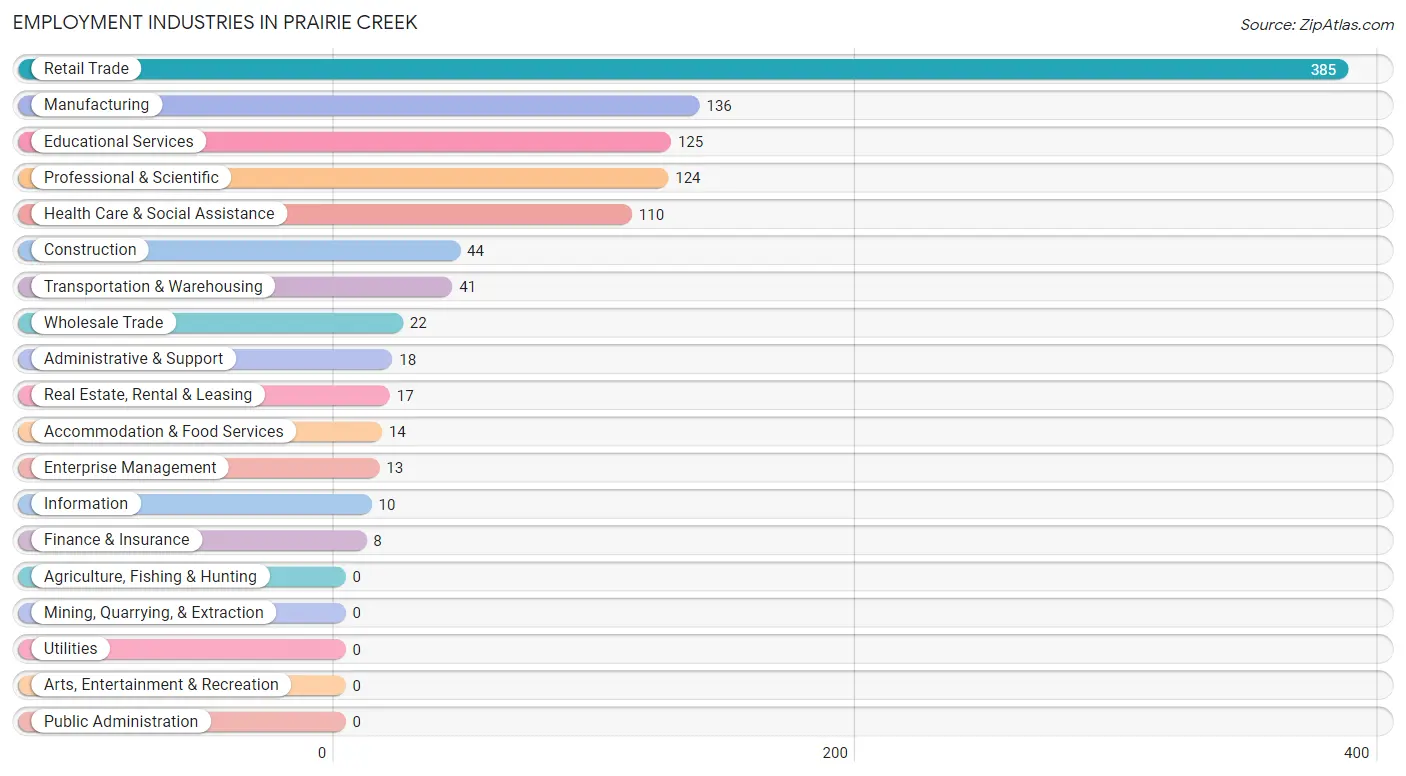
Employment Industries in Prairie Creek
The major employment industries in Prairie Creek include Retail Trade (385 | 34.7%), Manufacturing (136 | 12.3%), Educational Services (125 | 11.3%), Professional & Scientific (124 | 11.2%), and Health Care & Social Assistance (110 | 9.9%).
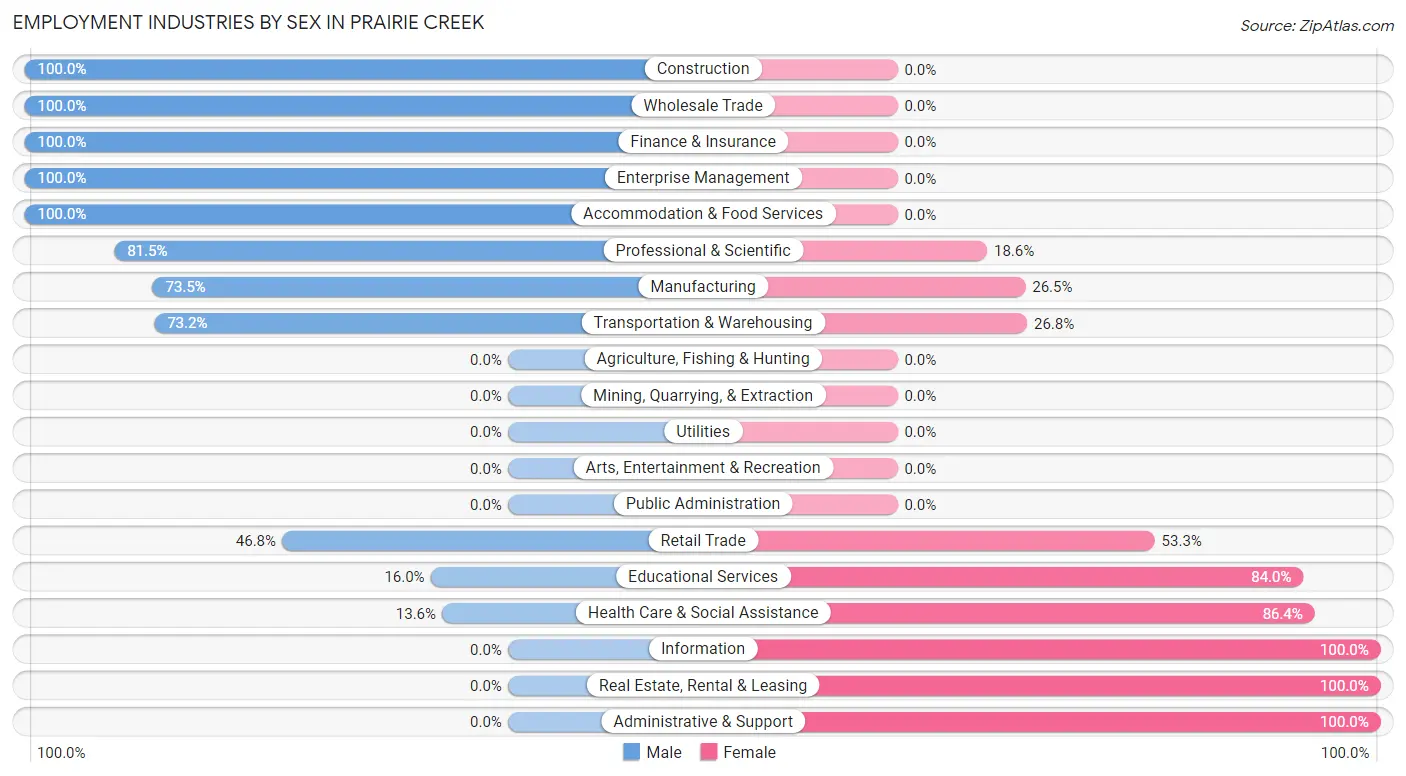
Employment Industries by Sex in Prairie Creek
The Prairie Creek industries that see more men than women are Construction (100.0%), Wholesale Trade (100.0%), and Finance & Insurance (100.0%), whereas the industries that tend to have a higher number of women are Information (100.0%), Real Estate, Rental & Leasing (100.0%), and Administrative & Support (100.0%).
| Industry | Male | Female |
| Agriculture, Fishing & Hunting | 0 (0.0%) | 0 (0.0%) |
| Mining, Quarrying, & Extraction | 0 (0.0%) | 0 (0.0%) |
| Construction | 44 (100.0%) | 0 (0.0%) |
| Manufacturing | 100 (73.5%) | 36 (26.5%) |
| Wholesale Trade | 22 (100.0%) | 0 (0.0%) |
| Retail Trade | 180 (46.8%) | 205 (53.2%) |
| Transportation & Warehousing | 30 (73.2%) | 11 (26.8%) |
| Utilities | 0 (0.0%) | 0 (0.0%) |
| Information | 0 (0.0%) | 10 (100.0%) |
| Finance & Insurance | 8 (100.0%) | 0 (0.0%) |
| Real Estate, Rental & Leasing | 0 (0.0%) | 17 (100.0%) |
| Professional & Scientific | 101 (81.5%) | 23 (18.5%) |
| Enterprise Management | 13 (100.0%) | 0 (0.0%) |
| Administrative & Support | 0 (0.0%) | 18 (100.0%) |
| Educational Services | 20 (16.0%) | 105 (84.0%) |
| Health Care & Social Assistance | 15 (13.6%) | 95 (86.4%) |
| Arts, Entertainment & Recreation | 0 (0.0%) | 0 (0.0%) |
| Accommodation & Food Services | 14 (100.0%) | 0 (0.0%) |
| Public Administration | 0 (0.0%) | 0 (0.0%) |
| Total | 572 (51.6%) | 536 (48.4%) |
Education in Prairie Creek
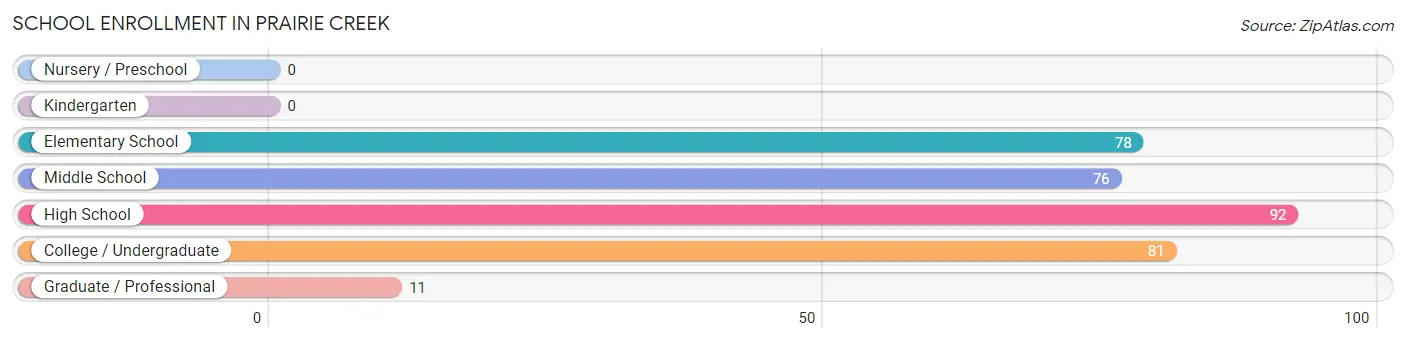
School Enrollment in Prairie Creek
The most common levels of schooling among the 338 students in Prairie Creek are high school (92 | 27.2%), college / undergraduate (81 | 24.0%), and elementary school (78 | 23.1%).
| School Level | # Students | % Students |
| Nursery / Preschool | 0 | 0.0% |
| Kindergarten | 0 | 0.0% |
| Elementary School | 78 | 23.1% |
| Middle School | 76 | 22.5% |
| High School | 92 | 27.2% |
| College / Undergraduate | 81 | 24.0% |
| Graduate / Professional | 11 | 3.3% |
| Total | 338 | 100.0% |
School Enrollment by Age by Funding Source in Prairie Creek
Out of a total of 338 students who are enrolled in schools in Prairie Creek, 18 (5.3%) attend a private institution, while the remaining 320 (94.7%) are enrolled in public schools. The age group of 5 to 9 year old has the highest likelihood of being enrolled in private schools, with 11 (14.1% in the age bracket) enrolled. Conversely, the age group of 10 to 14 year olds has the lowest likelihood of being enrolled in a private school, with 89 (100.0% in the age bracket) attending a public institution.
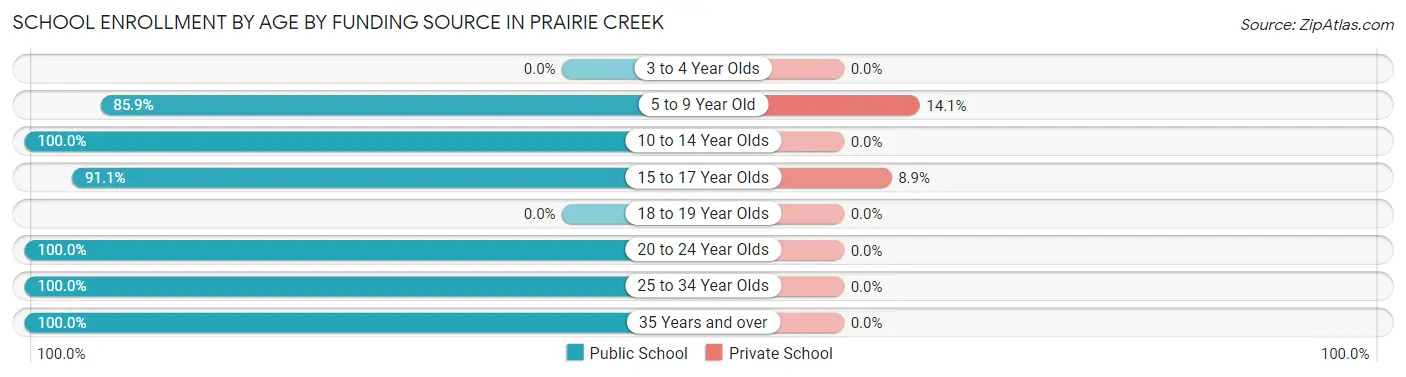
| Age Bracket | Public School | Private School |
| 3 to 4 Year Olds | 0 (0.0%) | 0 (0.0%) |
| 5 to 9 Year Old | 67 (85.9%) | 11 (14.1%) |
| 10 to 14 Year Olds | 89 (100.0%) | 0 (0.0%) |
| 15 to 17 Year Olds | 72 (91.1%) | 7 (8.9%) |
| 18 to 19 Year Olds | 0 (0.0%) | 0 (0.0%) |
| 20 to 24 Year Olds | 23 (100.0%) | 0 (0.0%) |
| 25 to 34 Year Olds | 33 (100.0%) | 0 (0.0%) |
| 35 Years and over | 36 (100.0%) | 0 (0.0%) |
| Total | 320 (94.7%) | 18 (5.3%) |
Educational Attainment by Field of Study in Prairie Creek
Education (171 | 23.4%), business (159 | 21.7%), liberal arts & history (87 | 11.9%), engineering (49 | 6.7%), and social sciences (43 | 5.9%) are the most common fields of study among 732 individuals in Prairie Creek who have obtained a bachelor's degree or higher.
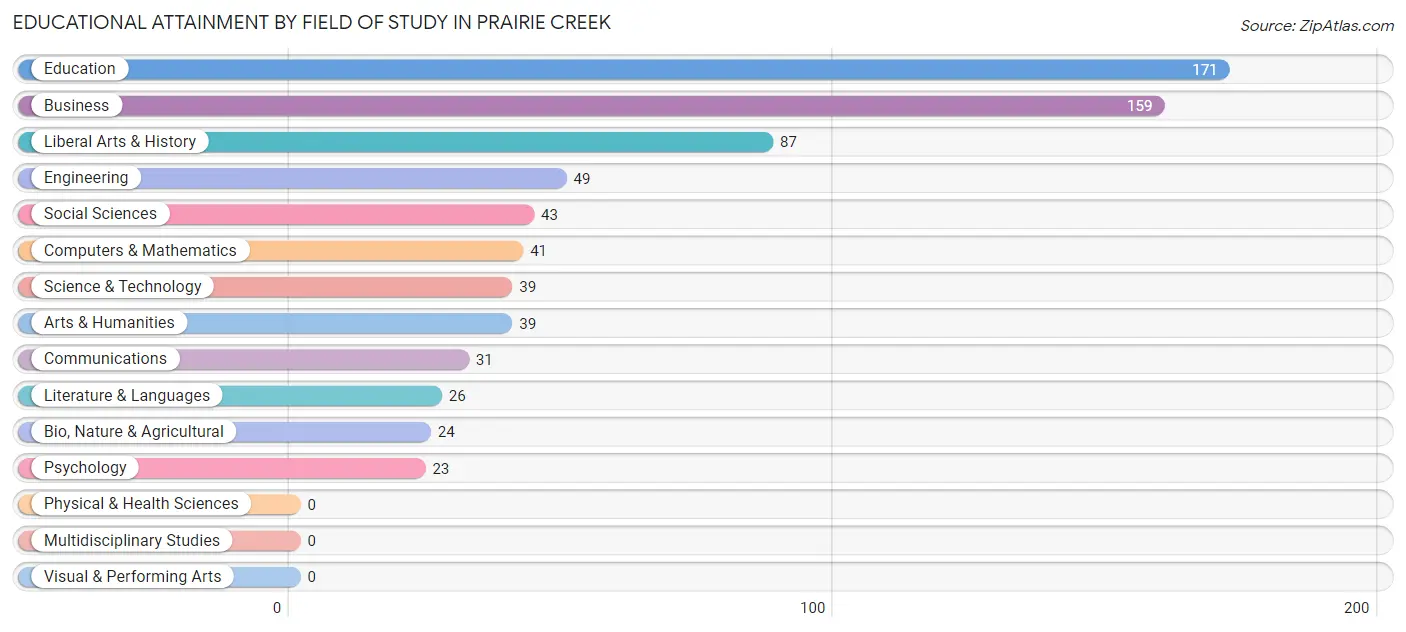
| Field of Study | # Graduates | % Graduates |
| Computers & Mathematics | 41 | 5.6% |
| Bio, Nature & Agricultural | 24 | 3.3% |
| Physical & Health Sciences | 0 | 0.0% |
| Psychology | 23 | 3.1% |
| Social Sciences | 43 | 5.9% |
| Engineering | 49 | 6.7% |
| Multidisciplinary Studies | 0 | 0.0% |
| Science & Technology | 39 | 5.3% |
| Business | 159 | 21.7% |
| Education | 171 | 23.4% |
| Literature & Languages | 26 | 3.5% |
| Liberal Arts & History | 87 | 11.9% |
| Visual & Performing Arts | 0 | 0.0% |
| Communications | 31 | 4.2% |
| Arts & Humanities | 39 | 5.3% |
| Total | 732 | 100.0% |
Transportation & Commute in Prairie Creek
Vehicle Availability by Sex in Prairie Creek
The most prevalent vehicle ownership categories in Prairie Creek are males with 2 vehicles (194, accounting for 33.9%) and females with 2 vehicles (263, making up 36.2%).
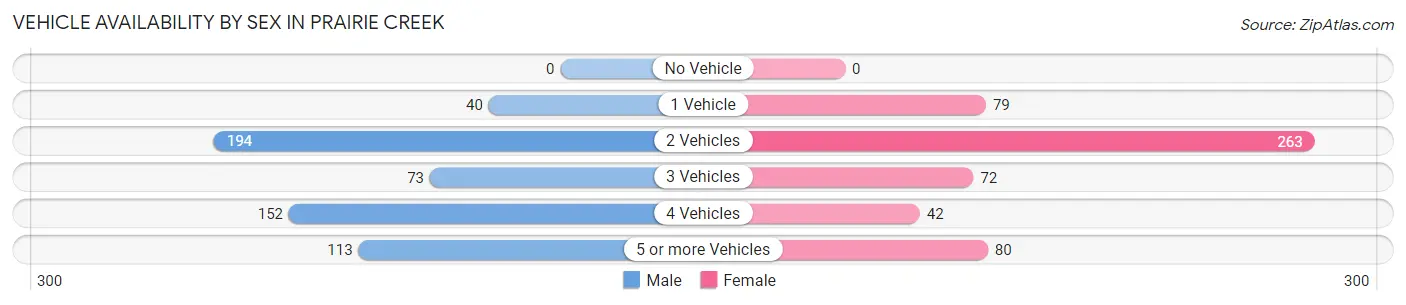
| Vehicles Available | Male | Female |
| No Vehicle | 0 (0.0%) | 0 (0.0%) |
| 1 Vehicle | 40 (7.0%) | 79 (14.7%) |
| 2 Vehicles | 194 (33.9%) | 263 (49.1%) |
| 3 Vehicles | 73 (12.8%) | 72 (13.4%) |
| 4 Vehicles | 152 (26.6%) | 42 (7.8%) |
| 5 or more Vehicles | 113 (19.8%) | 80 (14.9%) |
| Total | 572 (100.0%) | 536 (100.0%) |
Commute Time in Prairie Creek
The most frequently occuring commute durations in Prairie Creek are 20 to 24 minutes (293 commuters, 32.5%), 30 to 34 minutes (166 commuters, 18.4%), and 15 to 19 minutes (137 commuters, 15.2%).
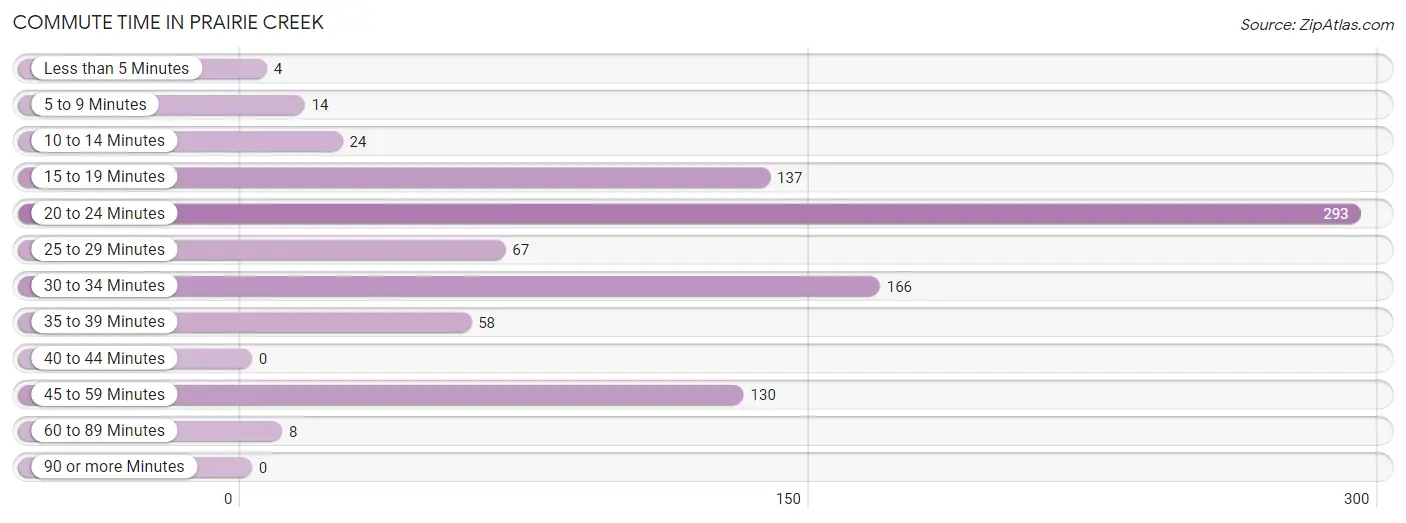
| Commute Time | # Commuters | % Commuters |
| Less than 5 Minutes | 4 | 0.4% |
| 5 to 9 Minutes | 14 | 1.5% |
| 10 to 14 Minutes | 24 | 2.7% |
| 15 to 19 Minutes | 137 | 15.2% |
| 20 to 24 Minutes | 293 | 32.5% |
| 25 to 29 Minutes | 67 | 7.4% |
| 30 to 34 Minutes | 166 | 18.4% |
| 35 to 39 Minutes | 58 | 6.4% |
| 40 to 44 Minutes | 0 | 0.0% |
| 45 to 59 Minutes | 130 | 14.4% |
| 60 to 89 Minutes | 8 | 0.9% |
| 90 or more Minutes | 0 | 0.0% |
Commute Time by Sex in Prairie Creek
The most common commute times in Prairie Creek are 20 to 24 minutes (164 commuters, 31.2%) for males and 20 to 24 minutes (129 commuters, 34.3%) for females.
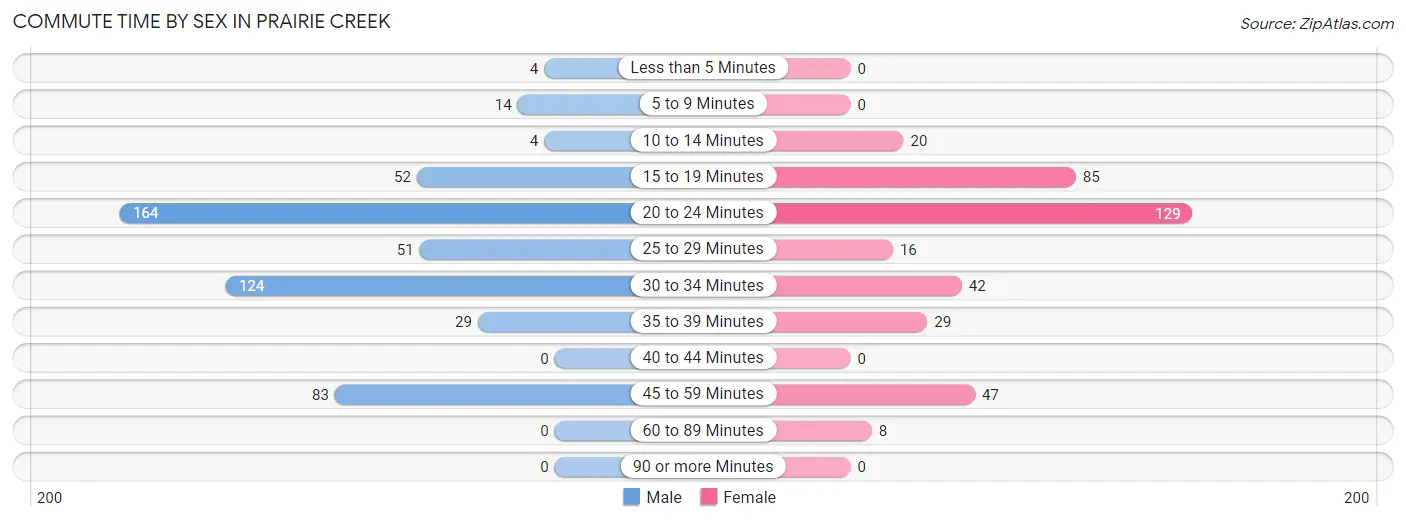
| Commute Time | Male | Female |
| Less than 5 Minutes | 4 (0.8%) | 0 (0.0%) |
| 5 to 9 Minutes | 14 (2.7%) | 0 (0.0%) |
| 10 to 14 Minutes | 4 (0.8%) | 20 (5.3%) |
| 15 to 19 Minutes | 52 (9.9%) | 85 (22.6%) |
| 20 to 24 Minutes | 164 (31.2%) | 129 (34.3%) |
| 25 to 29 Minutes | 51 (9.7%) | 16 (4.3%) |
| 30 to 34 Minutes | 124 (23.6%) | 42 (11.2%) |
| 35 to 39 Minutes | 29 (5.5%) | 29 (7.7%) |
| 40 to 44 Minutes | 0 (0.0%) | 0 (0.0%) |
| 45 to 59 Minutes | 83 (15.8%) | 47 (12.5%) |
| 60 to 89 Minutes | 0 (0.0%) | 8 (2.1%) |
| 90 or more Minutes | 0 (0.0%) | 0 (0.0%) |
Time of Departure to Work by Sex in Prairie Creek
The most frequent times of departure to work in Prairie Creek are 7:00 AM to 7:29 AM (207, 39.4%) for males and 7:30 AM to 7:59 AM (88, 23.4%) for females.
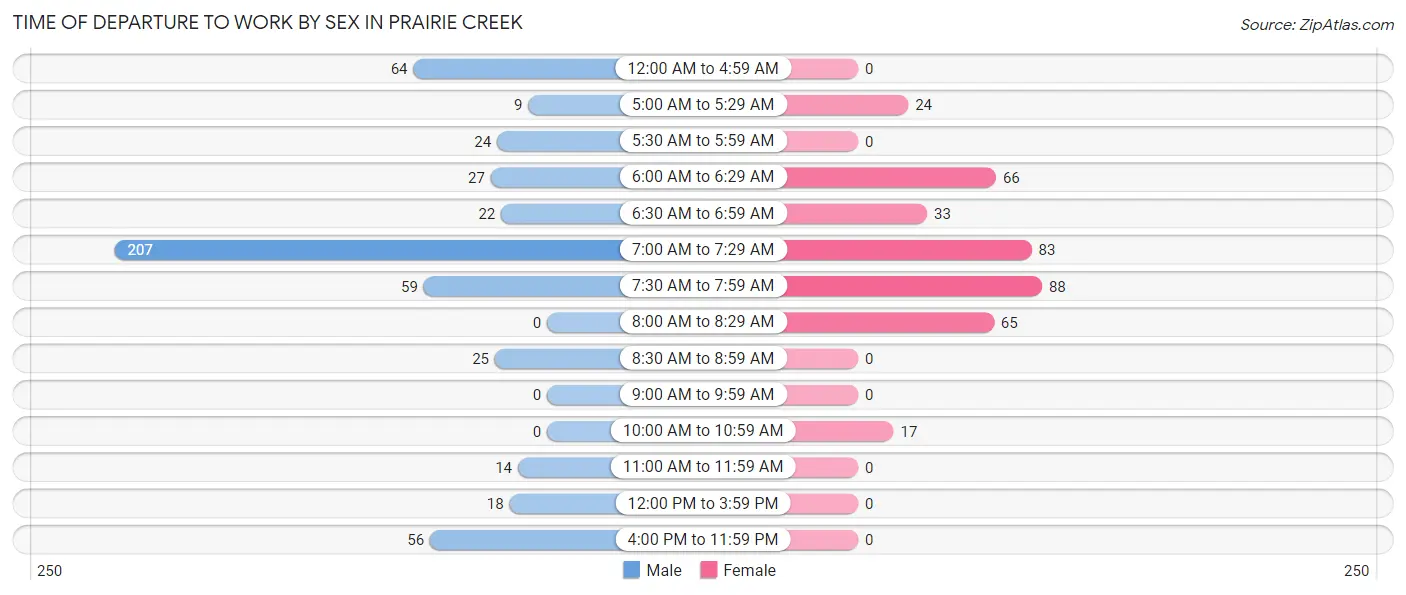
| Time of Departure | Male | Female |
| 12:00 AM to 4:59 AM | 64 (12.2%) | 0 (0.0%) |
| 5:00 AM to 5:29 AM | 9 (1.7%) | 24 (6.4%) |
| 5:30 AM to 5:59 AM | 24 (4.6%) | 0 (0.0%) |
| 6:00 AM to 6:29 AM | 27 (5.1%) | 66 (17.5%) |
| 6:30 AM to 6:59 AM | 22 (4.2%) | 33 (8.8%) |
| 7:00 AM to 7:29 AM | 207 (39.4%) | 83 (22.1%) |
| 7:30 AM to 7:59 AM | 59 (11.2%) | 88 (23.4%) |
| 8:00 AM to 8:29 AM | 0 (0.0%) | 65 (17.3%) |
| 8:30 AM to 8:59 AM | 25 (4.8%) | 0 (0.0%) |
| 9:00 AM to 9:59 AM | 0 (0.0%) | 0 (0.0%) |
| 10:00 AM to 10:59 AM | 0 (0.0%) | 17 (4.5%) |
| 11:00 AM to 11:59 AM | 14 (2.7%) | 0 (0.0%) |
| 12:00 PM to 3:59 PM | 18 (3.4%) | 0 (0.0%) |
| 4:00 PM to 11:59 PM | 56 (10.7%) | 0 (0.0%) |
| Total | 525 (100.0%) | 376 (100.0%) |
Housing Occupancy in Prairie Creek
Occupancy by Ownership in Prairie Creek
Of the total 908 dwellings in Prairie Creek, owner-occupied units account for 769 (84.7%), while renter-occupied units make up 139 (15.3%).
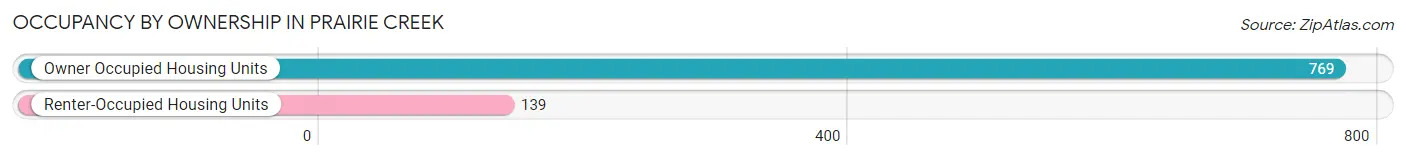
| Occupancy | # Housing Units | % Housing Units |
| Owner Occupied Housing Units | 769 | 84.7% |
| Renter-Occupied Housing Units | 139 | 15.3% |
| Total Occupied Housing Units | 908 | 100.0% |
Occupancy by Household Size in Prairie Creek
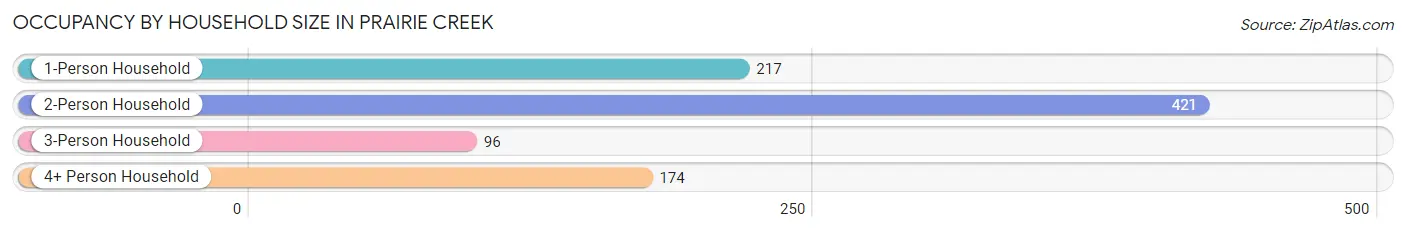
| Household Size | # Housing Units | % Housing Units |
| 1-Person Household | 217 | 23.9% |
| 2-Person Household | 421 | 46.4% |
| 3-Person Household | 96 | 10.6% |
| 4+ Person Household | 174 | 19.2% |
| Total Housing Units | 908 | 100.0% |
Occupancy by Ownership by Household Size in Prairie Creek
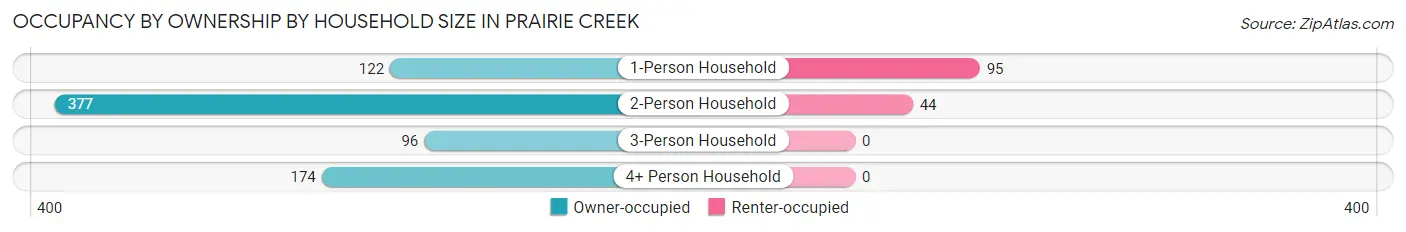
| Household Size | Owner-occupied | Renter-occupied |
| 1-Person Household | 122 (56.2%) | 95 (43.8%) |
| 2-Person Household | 377 (89.5%) | 44 (10.4%) |
| 3-Person Household | 96 (100.0%) | 0 (0.0%) |
| 4+ Person Household | 174 (100.0%) | 0 (0.0%) |
| Total Housing Units | 769 (84.7%) | 139 (15.3%) |
Occupancy by Educational Attainment in Prairie Creek
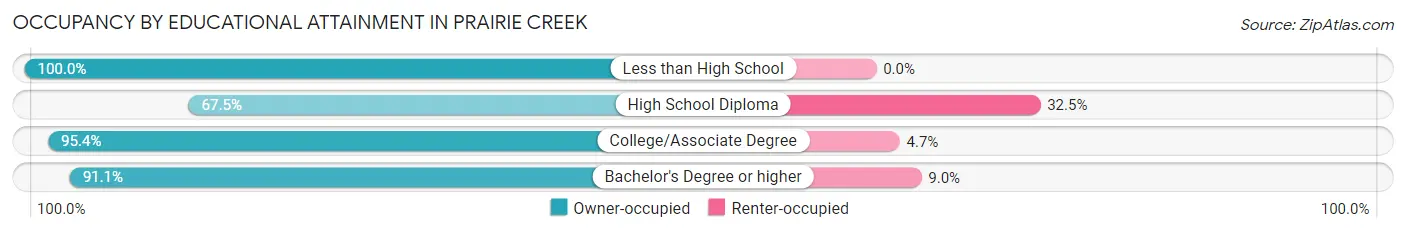
| Household Size | Owner-occupied | Renter-occupied |
| Less than High School | 13 (100.0%) | 0 (0.0%) |
| High School Diploma | 195 (67.5%) | 94 (32.5%) |
| College/Associate Degree | 205 (95.4%) | 10 (4.6%) |
| Bachelor's Degree or higher | 356 (91.0%) | 35 (8.9%) |
Occupancy by Age of Householder in Prairie Creek
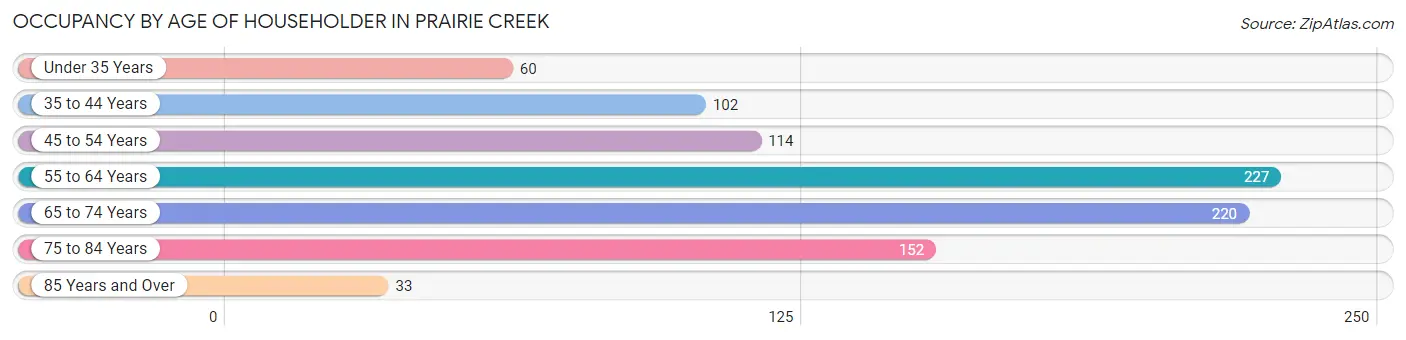
| Age Bracket | # Households | % Households |
| Under 35 Years | 60 | 6.6% |
| 35 to 44 Years | 102 | 11.2% |
| 45 to 54 Years | 114 | 12.6% |
| 55 to 64 Years | 227 | 25.0% |
| 65 to 74 Years | 220 | 24.2% |
| 75 to 84 Years | 152 | 16.7% |
| 85 Years and Over | 33 | 3.6% |
| Total | 908 | 100.0% |
Housing Finances in Prairie Creek
Median Income by Occupancy in Prairie Creek
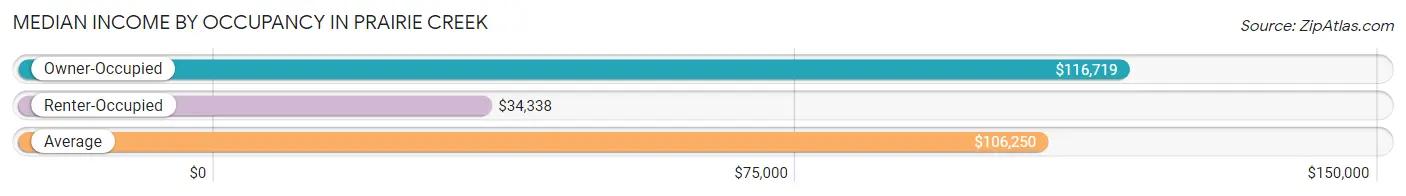
| Occupancy Type | # Households | Median Income |
| Owner-Occupied | 769 (84.7%) | $116,719 |
| Renter-Occupied | 139 (15.3%) | $34,338 |
| Average | 908 (100.0%) | $106,250 |
Occupancy by Householder Income Bracket in Prairie Creek
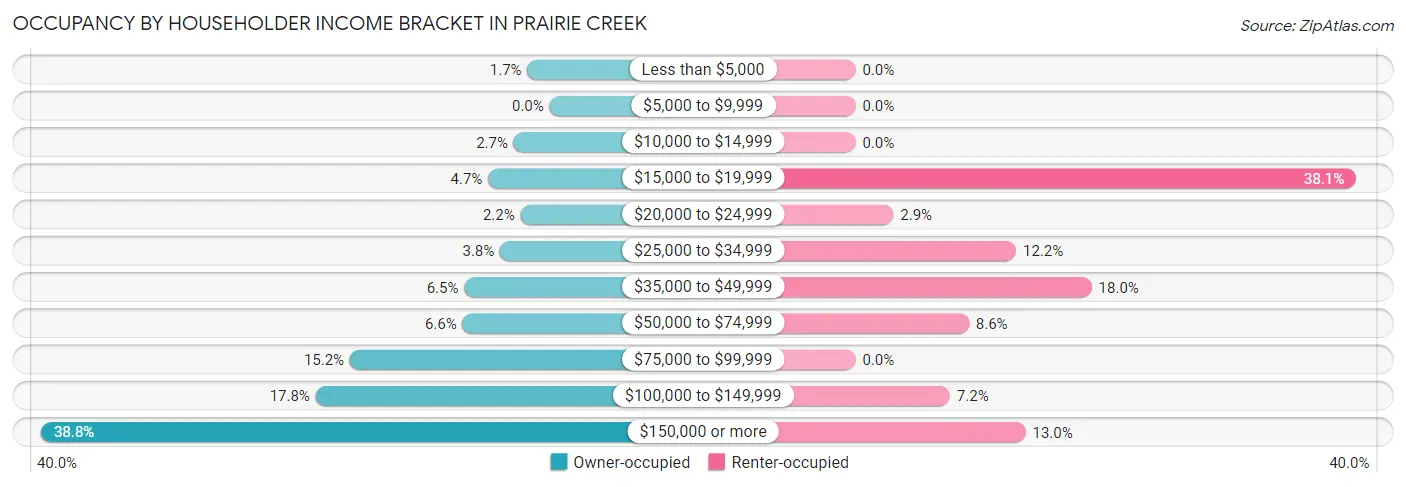
| Income Bracket | Owner-occupied | Renter-occupied |
| Less than $5,000 | 13 (1.7%) | 0 (0.0%) |
| $5,000 to $9,999 | 0 (0.0%) | 0 (0.0%) |
| $10,000 to $14,999 | 21 (2.7%) | 0 (0.0%) |
| $15,000 to $19,999 | 36 (4.7%) | 53 (38.1%) |
| $20,000 to $24,999 | 17 (2.2%) | 4 (2.9%) |
| $25,000 to $34,999 | 29 (3.8%) | 17 (12.2%) |
| $35,000 to $49,999 | 50 (6.5%) | 25 (18.0%) |
| $50,000 to $74,999 | 51 (6.6%) | 12 (8.6%) |
| $75,000 to $99,999 | 117 (15.2%) | 0 (0.0%) |
| $100,000 to $149,999 | 137 (17.8%) | 10 (7.2%) |
| $150,000 or more | 298 (38.8%) | 18 (13.0%) |
| Total | 769 (100.0%) | 139 (100.0%) |
Monthly Housing Cost Tiers in Prairie Creek
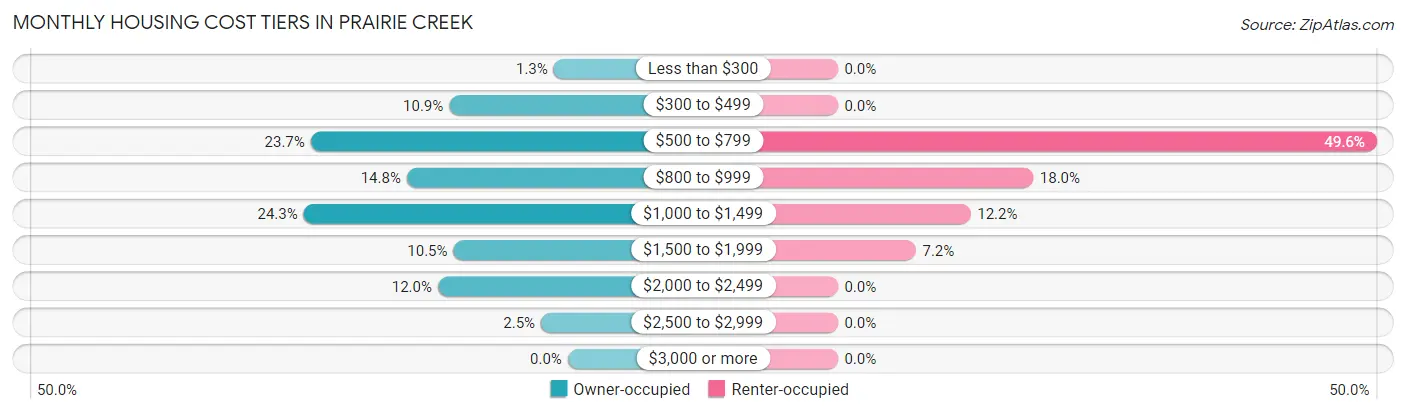
| Monthly Cost | Owner-occupied | Renter-occupied |
| Less than $300 | 10 (1.3%) | 0 (0.0%) |
| $300 to $499 | 84 (10.9%) | 0 (0.0%) |
| $500 to $799 | 182 (23.7%) | 69 (49.6%) |
| $800 to $999 | 114 (14.8%) | 25 (18.0%) |
| $1,000 to $1,499 | 187 (24.3%) | 17 (12.2%) |
| $1,500 to $1,999 | 81 (10.5%) | 10 (7.2%) |
| $2,000 to $2,499 | 92 (12.0%) | 0 (0.0%) |
| $2,500 to $2,999 | 19 (2.5%) | 0 (0.0%) |
| $3,000 or more | 0 (0.0%) | 0 (0.0%) |
| Total | 769 (100.0%) | 139 (100.0%) |
Physical Housing Characteristics in Prairie Creek
Housing Structures in Prairie Creek
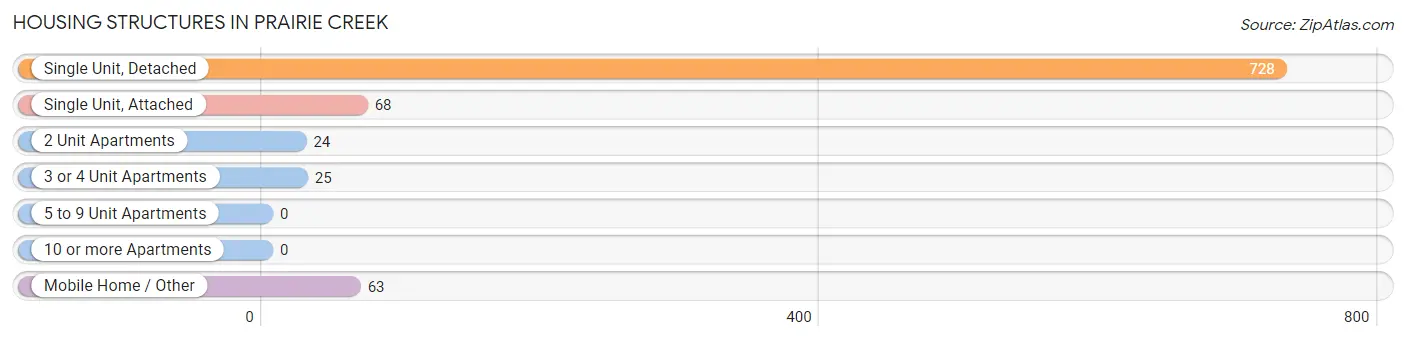
| Structure Type | # Housing Units | % Housing Units |
| Single Unit, Detached | 728 | 80.2% |
| Single Unit, Attached | 68 | 7.5% |
| 2 Unit Apartments | 24 | 2.6% |
| 3 or 4 Unit Apartments | 25 | 2.8% |
| 5 to 9 Unit Apartments | 0 | 0.0% |
| 10 or more Apartments | 0 | 0.0% |
| Mobile Home / Other | 63 | 6.9% |
| Total | 908 | 100.0% |
Housing Structures by Occupancy in Prairie Creek

| Structure Type | Owner-occupied | Renter-occupied |
| Single Unit, Detached | 696 (95.6%) | 32 (4.4%) |
| Single Unit, Attached | 51 (75.0%) | 17 (25.0%) |
| 2 Unit Apartments | 12 (50.0%) | 12 (50.0%) |
| 3 or 4 Unit Apartments | 0 (0.0%) | 25 (100.0%) |
| 5 to 9 Unit Apartments | 0 (0.0%) | 0 (0.0%) |
| 10 or more Apartments | 0 (0.0%) | 0 (0.0%) |
| Mobile Home / Other | 10 (15.9%) | 53 (84.1%) |
| Total | 769 (84.7%) | 139 (15.3%) |
Housing Structures by Number of Rooms in Prairie Creek
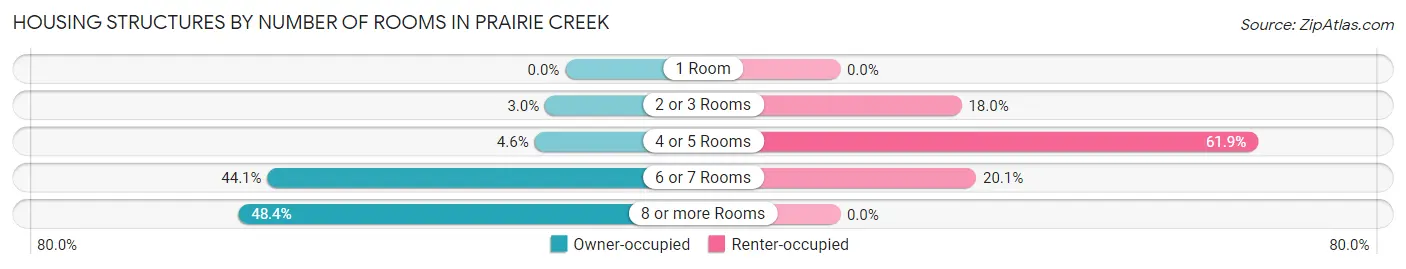
| Number of Rooms | Owner-occupied | Renter-occupied |
| 1 Room | 0 (0.0%) | 0 (0.0%) |
| 2 or 3 Rooms | 23 (3.0%) | 25 (18.0%) |
| 4 or 5 Rooms | 35 (4.5%) | 86 (61.9%) |
| 6 or 7 Rooms | 339 (44.1%) | 28 (20.1%) |
| 8 or more Rooms | 372 (48.4%) | 0 (0.0%) |
| Total | 769 (100.0%) | 139 (100.0%) |
Housing Structure by Heating Type in Prairie Creek
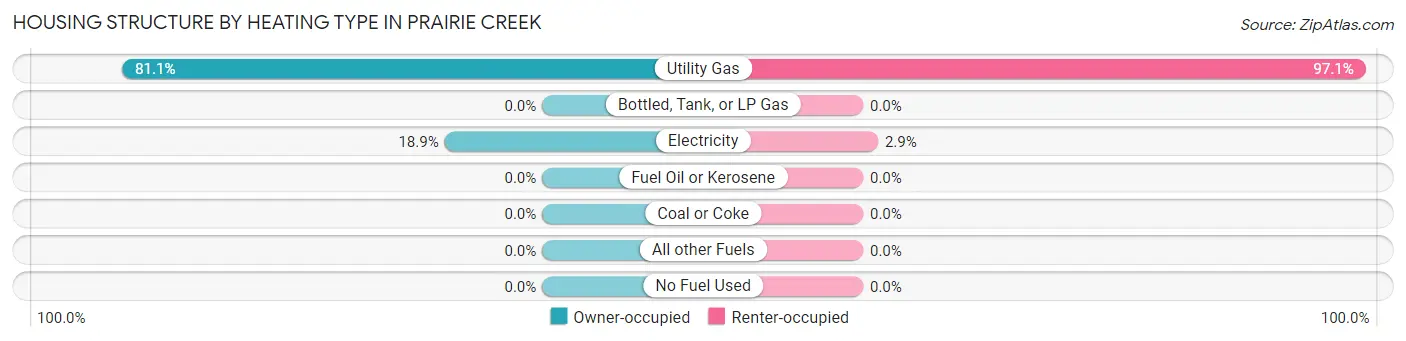
| Heating Type | Owner-occupied | Renter-occupied |
| Utility Gas | 624 (81.1%) | 135 (97.1%) |
| Bottled, Tank, or LP Gas | 0 (0.0%) | 0 (0.0%) |
| Electricity | 145 (18.9%) | 4 (2.9%) |
| Fuel Oil or Kerosene | 0 (0.0%) | 0 (0.0%) |
| Coal or Coke | 0 (0.0%) | 0 (0.0%) |
| All other Fuels | 0 (0.0%) | 0 (0.0%) |
| No Fuel Used | 0 (0.0%) | 0 (0.0%) |
| Total | 769 (100.0%) | 139 (100.0%) |
Household Vehicle Usage in Prairie Creek
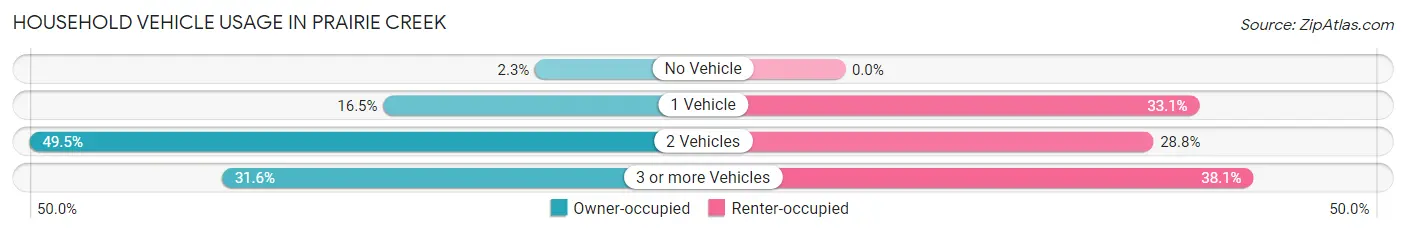
| Vehicles per Household | Owner-occupied | Renter-occupied |
| No Vehicle | 18 (2.3%) | 0 (0.0%) |
| 1 Vehicle | 127 (16.5%) | 46 (33.1%) |
| 2 Vehicles | 381 (49.5%) | 40 (28.8%) |
| 3 or more Vehicles | 243 (31.6%) | 53 (38.1%) |
| Total | 769 (100.0%) | 139 (100.0%) |
Real Estate & Mortgages in Prairie Creek
Real Estate and Mortgage Overview in Prairie Creek
| Characteristic | Without Mortgage | With Mortgage |
| Housing Units | 379 | 390 |
| Median Property Value | $381,300 | $252,100 |
| Median Household Income | $114,408 | $158 |
| Monthly Housing Costs | $642 | $0 |
| Real Estate Taxes | $1,922 | $10 |
Property Value by Mortgage Status in Prairie Creek
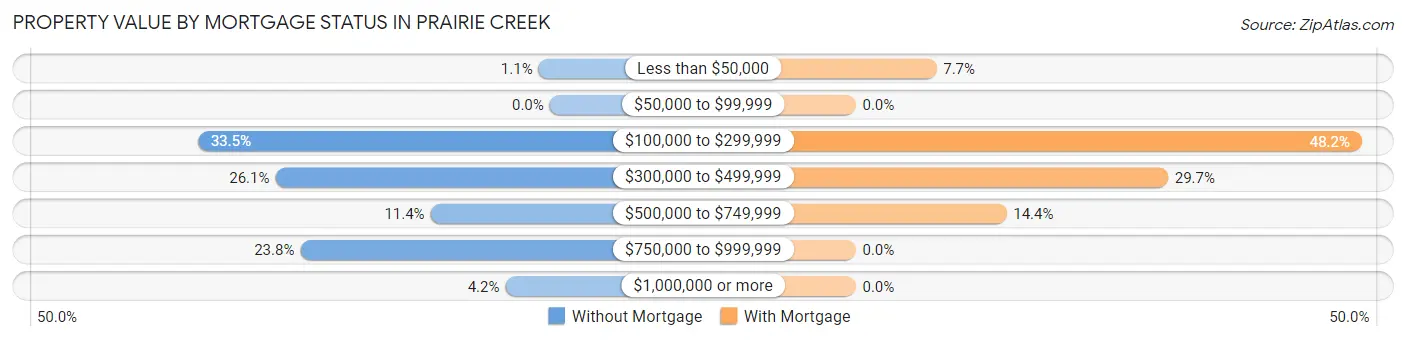
| Property Value | Without Mortgage | With Mortgage |
| Less than $50,000 | 4 (1.1%) | 30 (7.7%) |
| $50,000 to $99,999 | 0 (0.0%) | 0 (0.0%) |
| $100,000 to $299,999 | 127 (33.5%) | 188 (48.2%) |
| $300,000 to $499,999 | 99 (26.1%) | 116 (29.7%) |
| $500,000 to $749,999 | 43 (11.4%) | 56 (14.4%) |
| $750,000 to $999,999 | 90 (23.7%) | 0 (0.0%) |
| $1,000,000 or more | 16 (4.2%) | 0 (0.0%) |
| Total | 379 (100.0%) | 390 (100.0%) |
Household Income by Mortgage Status in Prairie Creek
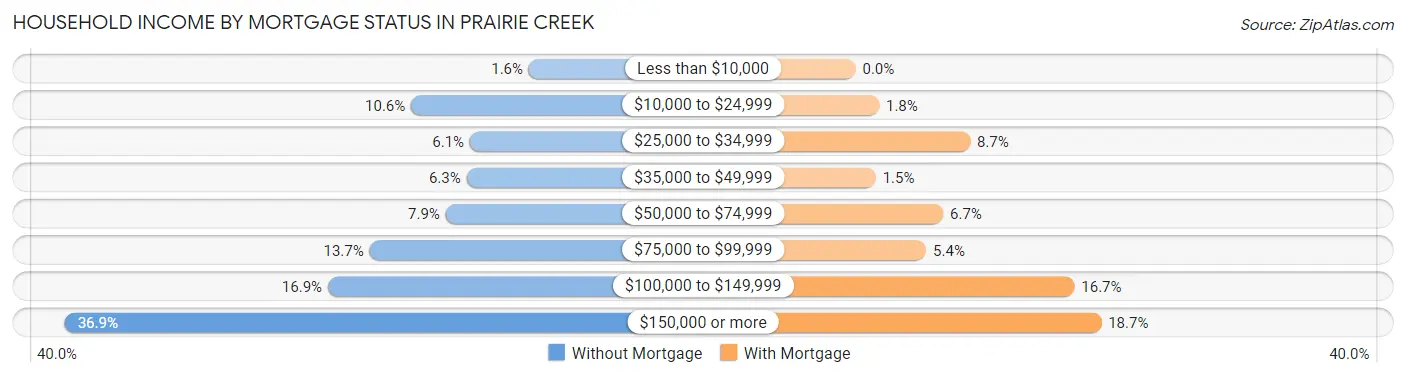
| Household Income | Without Mortgage | With Mortgage |
| Less than $10,000 | 6 (1.6%) | 0 (0.0%) |
| $10,000 to $24,999 | 40 (10.5%) | 7 (1.8%) |
| $25,000 to $34,999 | 23 (6.1%) | 34 (8.7%) |
| $35,000 to $49,999 | 24 (6.3%) | 6 (1.5%) |
| $50,000 to $74,999 | 30 (7.9%) | 26 (6.7%) |
| $75,000 to $99,999 | 52 (13.7%) | 21 (5.4%) |
| $100,000 to $149,999 | 64 (16.9%) | 65 (16.7%) |
| $150,000 or more | 140 (36.9%) | 73 (18.7%) |
| Total | 379 (100.0%) | 390 (100.0%) |
Property Value to Household Income Ratio in Prairie Creek
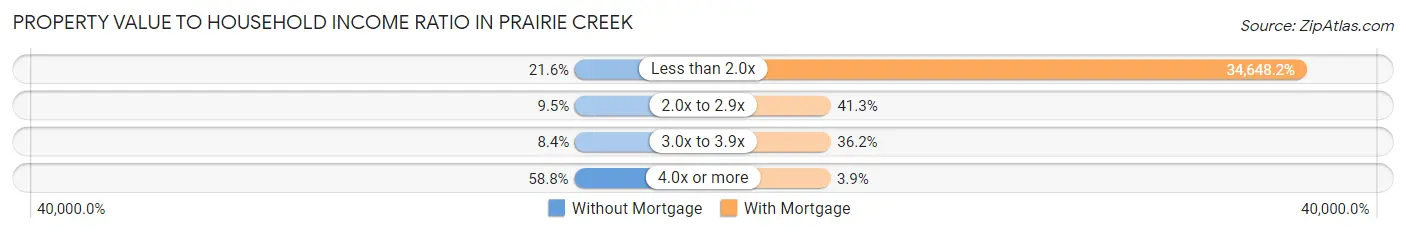
| Value-to-Income Ratio | Without Mortgage | With Mortgage |
| Less than 2.0x | 82 (21.6%) | 135,128 (34,648.2%) |
| 2.0x to 2.9x | 36 (9.5%) | 161 (41.3%) |
| 3.0x to 3.9x | 32 (8.4%) | 141 (36.1%) |
| 4.0x or more | 223 (58.8%) | 15 (3.8%) |
| Total | 379 (100.0%) | 390 (100.0%) |
Real Estate Taxes by Mortgage Status in Prairie Creek
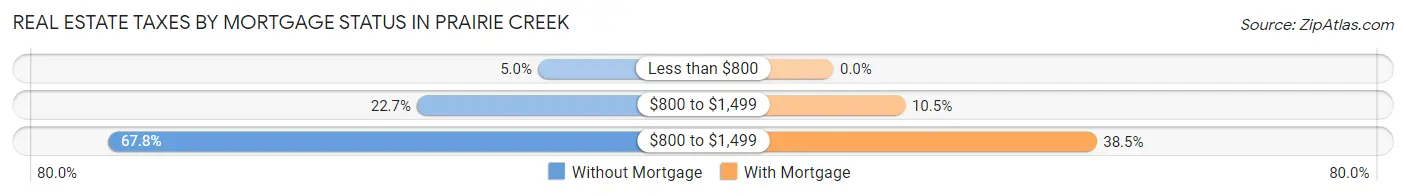
| Property Taxes | Without Mortgage | With Mortgage |
| Less than $800 | 19 (5.0%) | 0 (0.0%) |
| $800 to $1,499 | 86 (22.7%) | 41 (10.5%) |
| $800 to $1,499 | 257 (67.8%) | 150 (38.5%) |
| Total | 379 (100.0%) | 390 (100.0%) |
Health & Disability in Prairie Creek
Health Insurance Coverage by Age in Prairie Creek
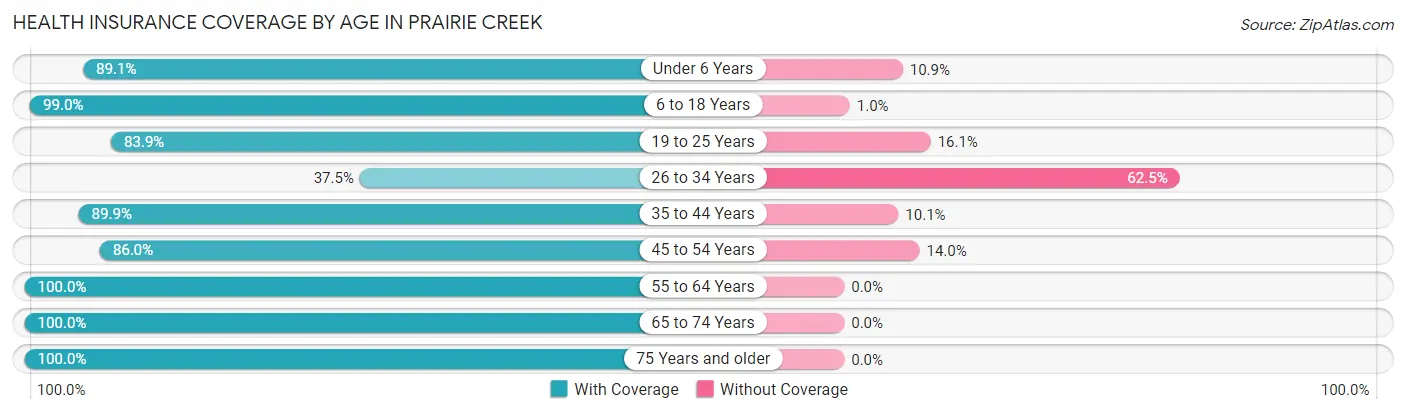
| Age Bracket | With Coverage | Without Coverage |
| Under 6 Years | 49 (89.1%) | 6 (10.9%) |
| 6 to 18 Years | 286 (99.0%) | 3 (1.0%) |
| 19 to 25 Years | 177 (83.9%) | 34 (16.1%) |
| 26 to 34 Years | 75 (37.5%) | 125 (62.5%) |
| 35 to 44 Years | 205 (89.9%) | 23 (10.1%) |
| 45 to 54 Years | 306 (86.0%) | 50 (14.0%) |
| 55 to 64 Years | 391 (100.0%) | 0 (0.0%) |
| 65 to 74 Years | 372 (100.0%) | 0 (0.0%) |
| 75 Years and older | 277 (100.0%) | 0 (0.0%) |
| Total | 2,138 (89.9%) | 241 (10.1%) |
Health Insurance Coverage by Citizenship Status in Prairie Creek
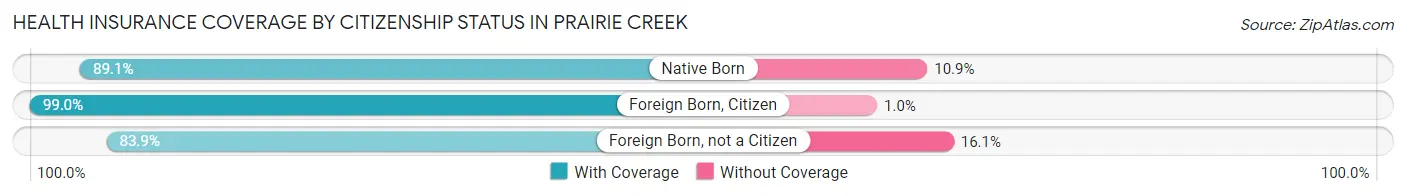
| Citizenship Status | With Coverage | Without Coverage |
| Native Born | 49 (89.1%) | 6 (10.9%) |
| Foreign Born, Citizen | 286 (99.0%) | 3 (1.0%) |
| Foreign Born, not a Citizen | 177 (83.9%) | 34 (16.1%) |
Health Insurance Coverage by Household Income in Prairie Creek
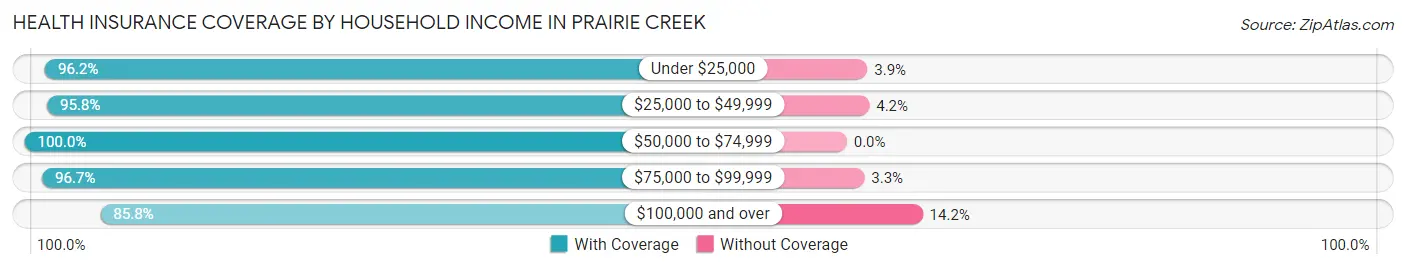
| Household Income | With Coverage | Without Coverage |
| Under $25,000 | 225 (96.2%) | 9 (3.8%) |
| $25,000 to $49,999 | 205 (95.8%) | 9 (4.2%) |
| $50,000 to $74,999 | 105 (100.0%) | 0 (0.0%) |
| $75,000 to $99,999 | 323 (96.7%) | 11 (3.3%) |
| $100,000 and over | 1,280 (85.8%) | 212 (14.2%) |
Public vs Private Health Insurance Coverage by Age in Prairie Creek
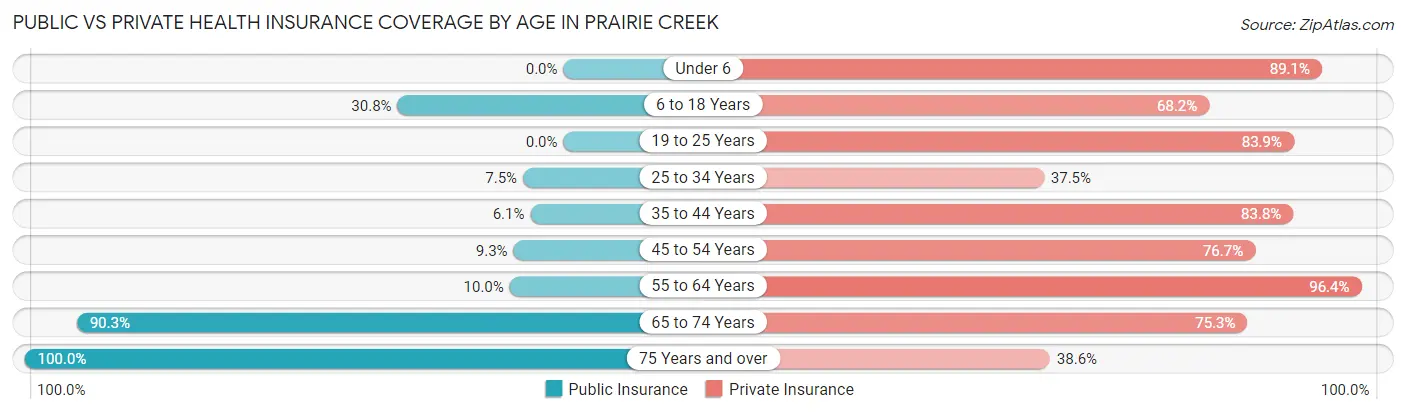
| Age Bracket | Public Insurance | Private Insurance |
| Under 6 | 0 (0.0%) | 49 (89.1%) |
| 6 to 18 Years | 89 (30.8%) | 197 (68.2%) |
| 19 to 25 Years | 0 (0.0%) | 177 (83.9%) |
| 25 to 34 Years | 15 (7.5%) | 75 (37.5%) |
| 35 to 44 Years | 14 (6.1%) | 191 (83.8%) |
| 45 to 54 Years | 33 (9.3%) | 273 (76.7%) |
| 55 to 64 Years | 39 (10.0%) | 377 (96.4%) |
| 65 to 74 Years | 336 (90.3%) | 280 (75.3%) |
| 75 Years and over | 277 (100.0%) | 107 (38.6%) |
| Total | 803 (33.8%) | 1,726 (72.6%) |
Disability Status by Sex by Age in Prairie Creek
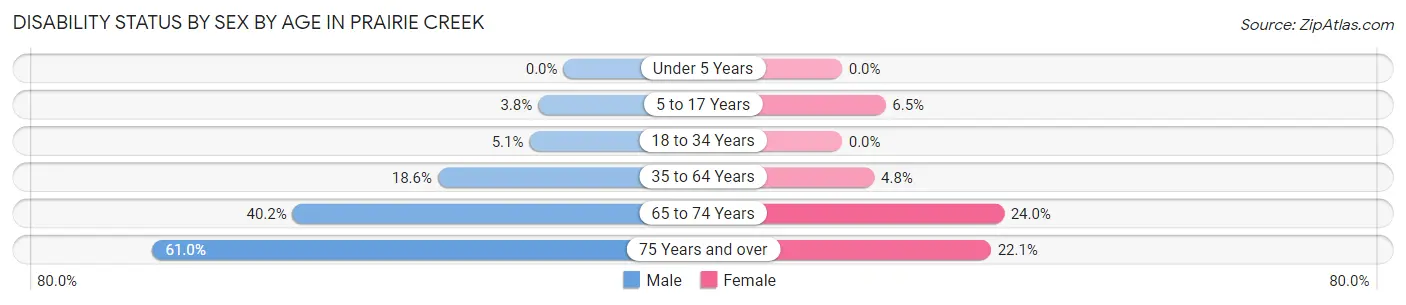
| Age Bracket | Male | Female |
| Under 5 Years | 0 (0.0%) | 0 (0.0%) |
| 5 to 17 Years | 6 (3.7%) | 9 (6.5%) |
| 18 to 34 Years | 15 (5.1%) | 0 (0.0%) |
| 35 to 64 Years | 77 (18.6%) | 27 (4.8%) |
| 65 to 74 Years | 76 (40.2%) | 44 (24.0%) |
| 75 Years and over | 111 (61.0%) | 21 (22.1%) |
Disability Class by Sex by Age in Prairie Creek
Disability Class: Hearing Difficulty
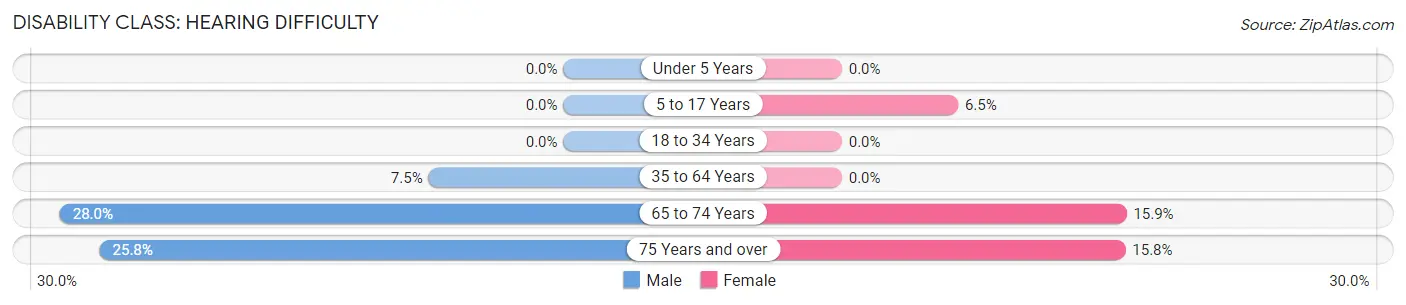
| Age Bracket | Male | Female |
| Under 5 Years | 0 (0.0%) | 0 (0.0%) |
| 5 to 17 Years | 0 (0.0%) | 9 (6.5%) |
| 18 to 34 Years | 0 (0.0%) | 0 (0.0%) |
| 35 to 64 Years | 31 (7.5%) | 0 (0.0%) |
| 65 to 74 Years | 53 (28.0%) | 29 (15.9%) |
| 75 Years and over | 47 (25.8%) | 15 (15.8%) |
Disability Class: Vision Difficulty
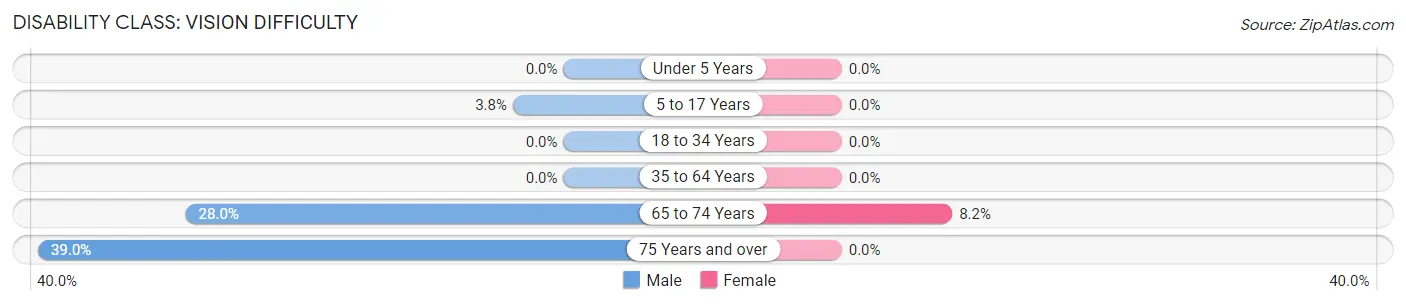
| Age Bracket | Male | Female |
| Under 5 Years | 0 (0.0%) | 0 (0.0%) |
| 5 to 17 Years | 6 (3.7%) | 0 (0.0%) |
| 18 to 34 Years | 0 (0.0%) | 0 (0.0%) |
| 35 to 64 Years | 0 (0.0%) | 0 (0.0%) |
| 65 to 74 Years | 53 (28.0%) | 15 (8.2%) |
| 75 Years and over | 71 (39.0%) | 0 (0.0%) |
Disability Class: Cognitive Difficulty
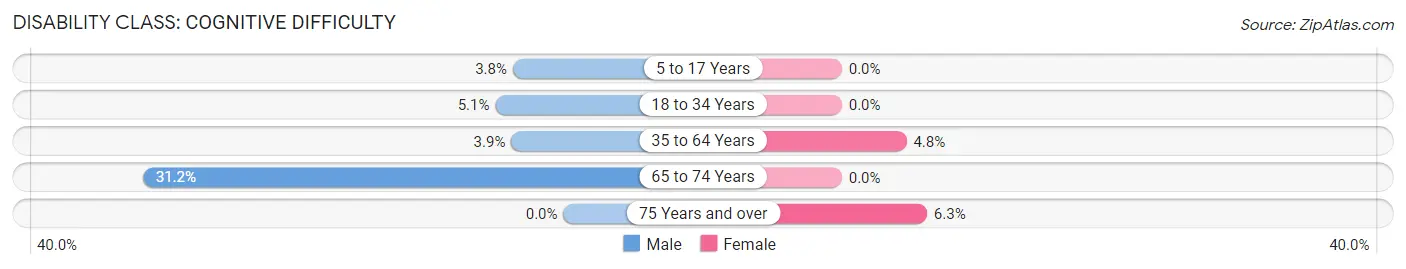
| Age Bracket | Male | Female |
| 5 to 17 Years | 6 (3.7%) | 0 (0.0%) |
| 18 to 34 Years | 15 (5.1%) | 0 (0.0%) |
| 35 to 64 Years | 16 (3.9%) | 27 (4.8%) |
| 65 to 74 Years | 59 (31.2%) | 0 (0.0%) |
| 75 Years and over | 0 (0.0%) | 6 (6.3%) |
Disability Class: Ambulatory Difficulty
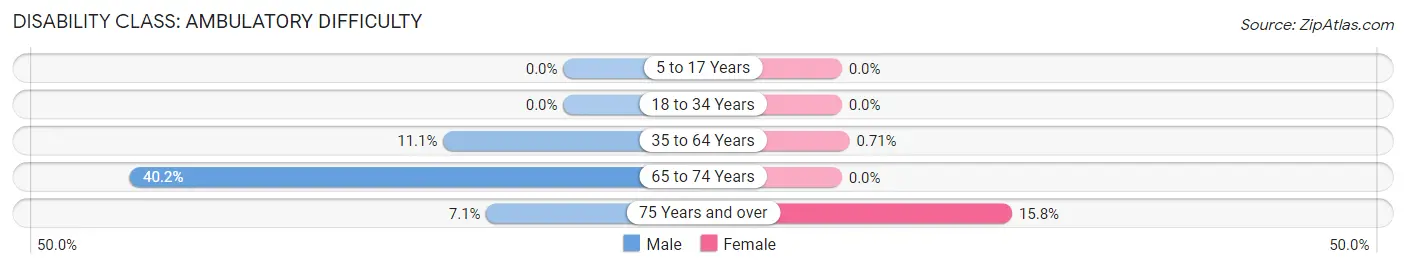
| Age Bracket | Male | Female |
| 5 to 17 Years | 0 (0.0%) | 0 (0.0%) |
| 18 to 34 Years | 0 (0.0%) | 0 (0.0%) |
| 35 to 64 Years | 46 (11.1%) | 4 (0.7%) |
| 65 to 74 Years | 76 (40.2%) | 0 (0.0%) |
| 75 Years and over | 13 (7.1%) | 15 (15.8%) |
Disability Class: Self-Care Difficulty
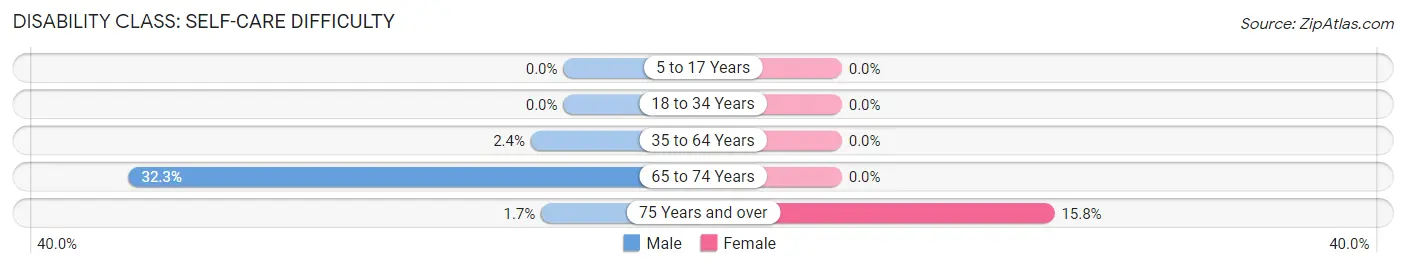
| Age Bracket | Male | Female |
| 5 to 17 Years | 0 (0.0%) | 0 (0.0%) |
| 18 to 34 Years | 0 (0.0%) | 0 (0.0%) |
| 35 to 64 Years | 10 (2.4%) | 0 (0.0%) |
| 65 to 74 Years | 61 (32.3%) | 0 (0.0%) |
| 75 Years and over | 3 (1.7%) | 15 (15.8%) |
Technology Access in Prairie Creek
Computing Device Access in Prairie Creek
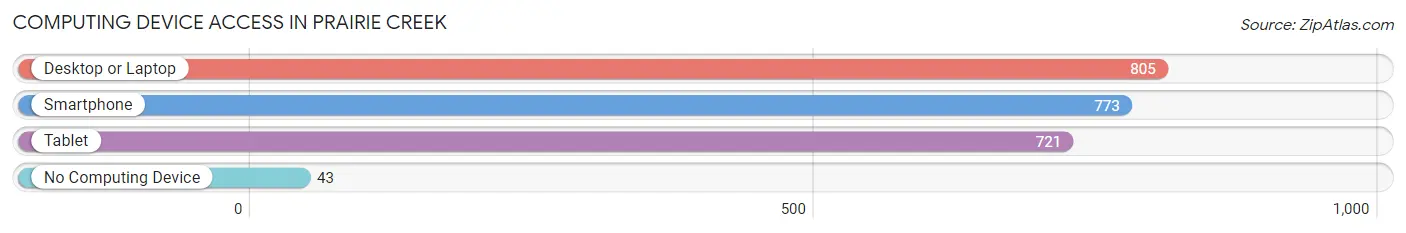
| Device Type | # Households | % Households |
| Desktop or Laptop | 805 | 88.7% |
| Smartphone | 773 | 85.1% |
| Tablet | 721 | 79.4% |
| No Computing Device | 43 | 4.7% |
| Total | 908 | 100.0% |
Internet Access in Prairie Creek
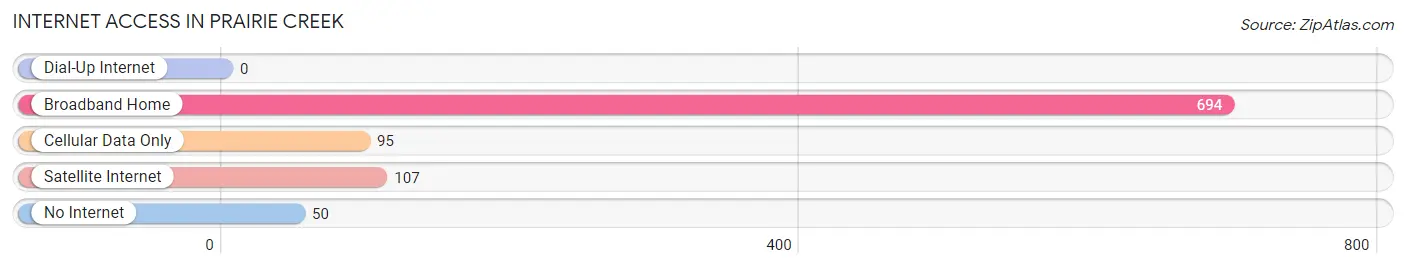
| Internet Type | # Households | % Households |
| Dial-Up Internet | 0 | 0.0% |
| Broadband Home | 694 | 76.4% |
| Cellular Data Only | 95 | 10.5% |
| Satellite Internet | 107 | 11.8% |
| No Internet | 50 | 5.5% |
| Total | 908 | 100.0% |
Prairie Creek Summary
Prairie Creek is a small unincorporated community located in the Ozark Mountains of Arkansas. It is situated in the northwest corner of the state, near the Oklahoma border. The town is located in Crawford County, and is part of the Fort Smith metropolitan area. The population of Prairie Creek was estimated to be around 200 people in 2020.
History
Prairie Creek was first settled in the late 1800s by settlers from the nearby town of Van Buren. The town was originally known as Prairie Creek Station, and was a stop on the St. Louis and San Francisco Railroad. The town was officially incorporated in 1891, and the name was changed to Prairie Creek.
The town grew slowly over the years, and by the early 1900s, it had become a popular destination for tourists. The town was known for its natural beauty, and was a popular spot for fishing and hunting.
Geography
Prairie Creek is located in the Ozark Mountains of Arkansas. The town is situated in the northwest corner of the state, near the Oklahoma border. The town is located in Crawford County, and is part of the Fort Smith metropolitan area.
The town is situated on the banks of the Arkansas River, and is surrounded by rolling hills and forests. The town is located at an elevation of 890 feet above sea level.
Economy
The economy of Prairie Creek is largely based on tourism. The town is known for its natural beauty, and is a popular spot for fishing and hunting. The town also has a few small businesses, including a general store, a gas station, and a few restaurants.
Demographics
The population of Prairie Creek was estimated to be around 200 people in 2020. The town is predominantly white, with a small minority population. The median household income in the town is around $30,000, and the median home value is around $90,000. The town has a low unemployment rate, and the poverty rate is below the national average.
Conclusion
Prairie Creek is a small unincorporated community located in the Ozark Mountains of Arkansas. The town is known for its natural beauty, and is a popular spot for fishing and hunting. The population of Prairie Creek was estimated to be around 200 people in 2020. The town has a largely tourism-based economy, and the median household income is around $30,000. The town has a low unemployment rate, and the poverty rate is below the national average.
Common Questions
What is the Total Population of Prairie Creek?
Total Population of Prairie Creek is 2,379.
What is the Total Male Population of Prairie Creek?
Total Male Population of Prairie Creek is 1,254.
What is the Total Female Population of Prairie Creek?
Total Female Population of Prairie Creek is 1,125.
What is the Ratio of Males per 100 Females in Prairie Creek?
There are 111.47 Males per 100 Females in Prairie Creek.
What is the Ratio of Females per 100 Males in Prairie Creek?
There are 89.71 Females per 100 Males in Prairie Creek.
What is the Median Population Age in Prairie Creek?
Median Population Age in Prairie Creek is 51.5 Years.
What is the Average Family Size in Prairie Creek
Average Family Size in Prairie Creek is 3.2 People.
What is the Average Household Size in Prairie Creek
Average Household Size in Prairie Creek is 2.6 People.
What is Per Capita Income in Prairie Creek?
Per Capita income in Prairie Creek is $44,324.
What is the Median Family Income in Prairie Creek?
Median Family Income in Prairie Creek is $135,994.
What is the Median Household income in Prairie Creek?
Median Household Income in Prairie Creek is $106,250.
What is Income or Wage Gap in Prairie Creek?
Income or Wage Gap in Prairie Creek is 14.2%.
Women in Prairie Creek earn 85.8 cents for every dollar earned by a man.
What is Inequality or Gini Index in Prairie Creek?
Inequality or Gini Index in Prairie Creek is 0.38.
How Large is the Labor Force in Prairie Creek?
There are 1,193 People in the Labor Forcein in Prairie Creek.
What is the Percentage of People in the Labor Force in Prairie Creek?
55.9% of People are in the Labor Force in Prairie Creek.
What is the Unemployment Rate in Prairie Creek?
Unemployment Rate in Prairie Creek is 7.2%.