Kinsey, AL
Kinsey Map
Kinsey Overview
2,254
TOTAL POPULATION
1,122
MALE POPULATION
1,132
FEMALE POPULATION
99.12
MALES / 100 FEMALES
100.89
FEMALES / 100 MALES
33.9
MEDIAN AGE
3.4
AVG FAMILY SIZE
2.7
AVG HOUSEHOLD SIZE
$24,466
PER CAPITA INCOME
$58,594
AVG FAMILY INCOME
$51,250
AVG HOUSEHOLD INCOME
26.0%
WAGE / INCOME GAP [ % ]
74.0¢/ $1
WAGE / INCOME GAP [ $ ]
$8,906
FAMILY INCOME DEFICIT
0.39
INEQUALITY / GINI INDEX
1,190
LABOR FORCE [ PEOPLE ]
67.8%
PERCENT IN LABOR FORCE
4.6%
UNEMPLOYMENT RATE
Kinsey Area Codes
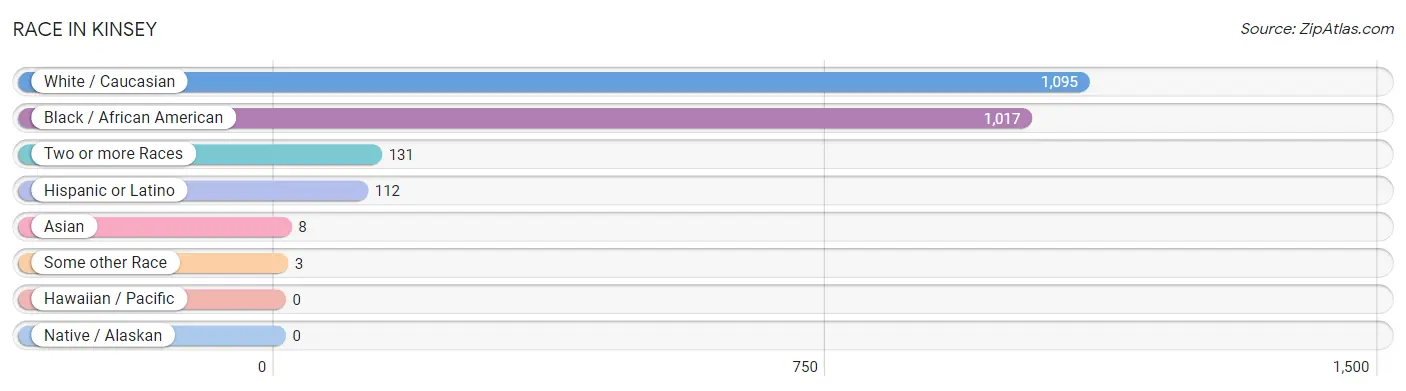
Race in Kinsey
The most populous races in Kinsey are White / Caucasian (1,095 | 48.6%), Black / African American (1,017 | 45.1%), and Two or more Races (131 | 5.8%).
| Race | # Population | % Population |
| Asian | 8 | 0.4% |
| Black / African American | 1,017 | 45.1% |
| Hawaiian / Pacific | 0 | 0.0% |
| Hispanic or Latino | 112 | 5.0% |
| Native / Alaskan | 0 | 0.0% |
| White / Caucasian | 1,095 | 48.6% |
| Two or more Races | 131 | 5.8% |
| Some other Race | 3 | 0.1% |
| Total | 2,254 | 100.0% |
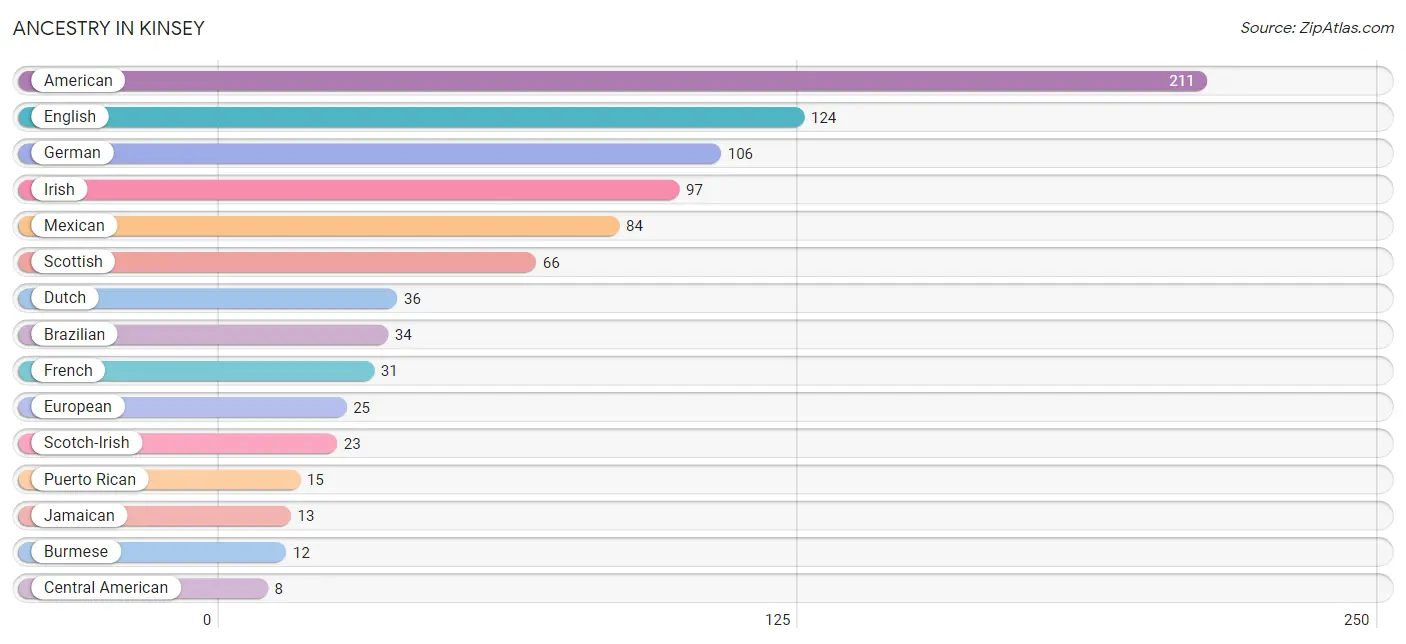
Ancestry in Kinsey
The most populous ancestries reported in Kinsey are American (211 | 9.4%), English (124 | 5.5%), German (106 | 4.7%), Irish (97 | 4.3%), and Mexican (84 | 3.7%), together accounting for 27.6% of all Kinsey residents.
| Ancestry | # Population | % Population |
| African | 7 | 0.3% |
| American | 211 | 9.4% |
| Bhutanese | 2 | 0.1% |
| Brazilian | 34 | 1.5% |
| Burmese | 12 | 0.5% |
| Central American | 8 | 0.4% |
| Cuban | 3 | 0.1% |
| Dutch | 36 | 1.6% |
| Eastern European | 8 | 0.4% |
| English | 124 | 5.5% |
| European | 25 | 1.1% |
| French | 31 | 1.4% |
| German | 106 | 4.7% |
| Indian (Asian) | 6 | 0.3% |
| Irish | 97 | 4.3% |
| Italian | 6 | 0.3% |
| Jamaican | 13 | 0.6% |
| Korean | 5 | 0.2% |
| Mexican | 84 | 3.7% |
| Puerto Rican | 15 | 0.7% |
| Romanian | 3 | 0.1% |
| Salvadoran | 8 | 0.4% |
| Scotch-Irish | 23 | 1.0% |
| Scottish | 66 | 2.9% |
| Subsaharan African | 7 | 0.3% |
| Swedish | 1 | 0.0% | View All 26 Rows |
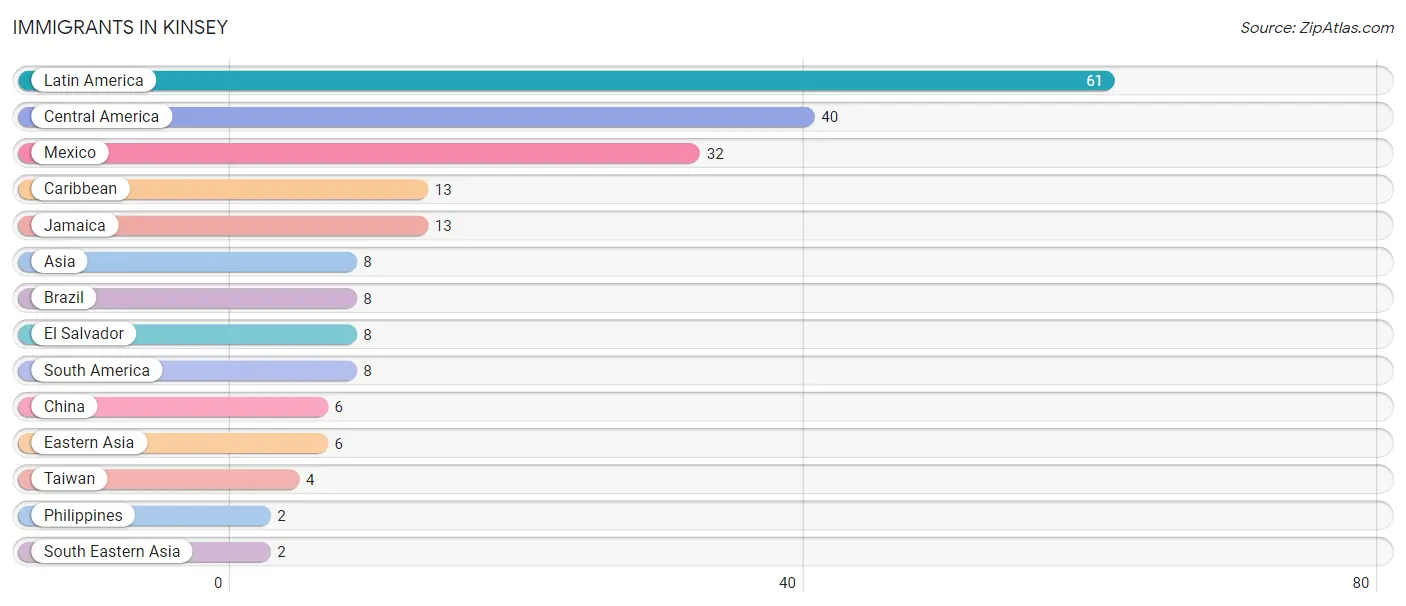
Immigrants in Kinsey
The most numerous immigrant groups reported in Kinsey came from Latin America (61 | 2.7%), Central America (40 | 1.8%), Mexico (32 | 1.4%), Caribbean (13 | 0.6%), and Jamaica (13 | 0.6%), together accounting for 7.1% of all Kinsey residents.
| Immigration Origin | # Population | % Population |
| Asia | 8 | 0.4% |
| Brazil | 8 | 0.4% |
| Caribbean | 13 | 0.6% |
| Central America | 40 | 1.8% |
| China | 6 | 0.3% |
| Eastern Asia | 6 | 0.3% |
| El Salvador | 8 | 0.4% |
| Jamaica | 13 | 0.6% |
| Latin America | 61 | 2.7% |
| Mexico | 32 | 1.4% |
| Philippines | 2 | 0.1% |
| South America | 8 | 0.4% |
| South Eastern Asia | 2 | 0.1% |
| Taiwan | 4 | 0.2% | View All 14 Rows |
Sex and Age in Kinsey
Sex and Age in Kinsey
The most populous age groups in Kinsey are 15 to 19 Years (130 | 11.6%) for men and 5 to 9 Years (122 | 10.8%) for women.
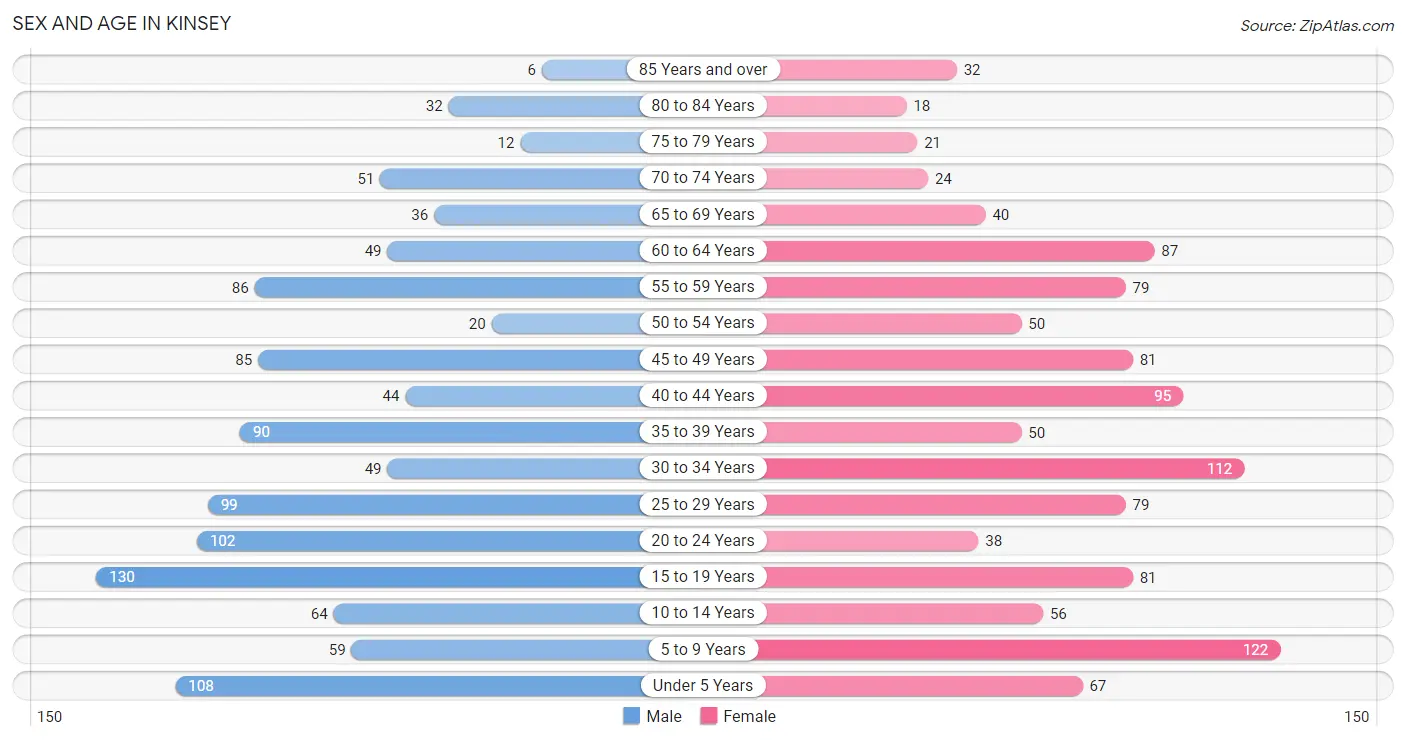
| Age Bracket | Male | Female |
| Under 5 Years | 108 (9.6%) | 67 (5.9%) |
| 5 to 9 Years | 59 (5.3%) | 122 (10.8%) |
| 10 to 14 Years | 64 (5.7%) | 56 (5.0%) |
| 15 to 19 Years | 130 (11.6%) | 81 (7.2%) |
| 20 to 24 Years | 102 (9.1%) | 38 (3.4%) |
| 25 to 29 Years | 99 (8.8%) | 79 (7.0%) |
| 30 to 34 Years | 49 (4.4%) | 112 (9.9%) |
| 35 to 39 Years | 90 (8.0%) | 50 (4.4%) |
| 40 to 44 Years | 44 (3.9%) | 95 (8.4%) |
| 45 to 49 Years | 85 (7.6%) | 81 (7.2%) |
| 50 to 54 Years | 20 (1.8%) | 50 (4.4%) |
| 55 to 59 Years | 86 (7.7%) | 79 (7.0%) |
| 60 to 64 Years | 49 (4.4%) | 87 (7.7%) |
| 65 to 69 Years | 36 (3.2%) | 40 (3.5%) |
| 70 to 74 Years | 51 (4.5%) | 24 (2.1%) |
| 75 to 79 Years | 12 (1.1%) | 21 (1.9%) |
| 80 to 84 Years | 32 (2.9%) | 18 (1.6%) |
| 85 Years and over | 6 (0.5%) | 32 (2.8%) |
| Total | 1,122 (100.0%) | 1,132 (100.0%) |
Families and Households in Kinsey
Median Family Size in Kinsey
The median family size in Kinsey is 3.40 persons per family, with single male/father families (58 | 10.4%) accounting for the largest median family size of 3.66 persons per family. On the other hand, married-couple families (336 | 60.4%) represent the smallest median family size with 3.34 persons per family.
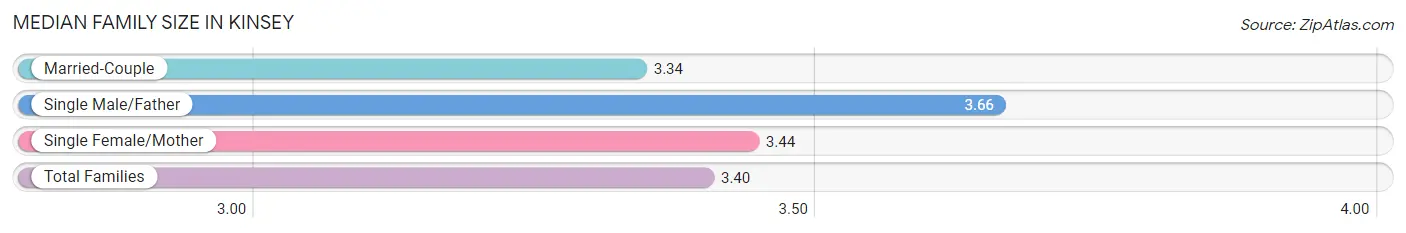
| Family Type | # Families | Family Size |
| Married-Couple | 336 (60.4%) | 3.34 |
| Single Male/Father | 58 (10.4%) | 3.66 |
| Single Female/Mother | 162 (29.1%) | 3.44 |
| Total Families | 556 (100.0%) | 3.40 |
Median Household Size in Kinsey
The median household size in Kinsey is 2.74 persons per household, with single male/father households (58 | 7.1%) accounting for the largest median household size of 4.14 persons per household. non-family households (266 | 32.4%) represent the smallest median household size with 1.14 persons per household.
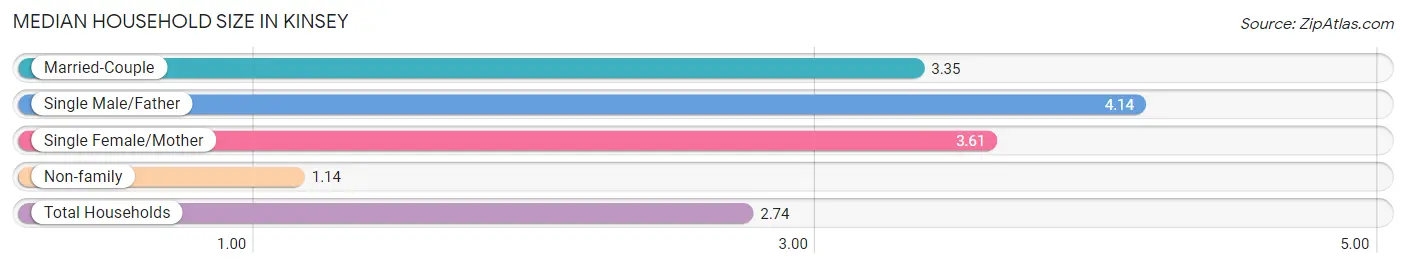
| Household Type | # Households | Household Size |
| Married-Couple | 336 (40.9%) | 3.35 |
| Single Male/Father | 58 (7.1%) | 4.14 |
| Single Female/Mother | 162 (19.7%) | 3.61 |
| Non-family | 266 (32.4%) | 1.14 |
| Total Households | 822 (100.0%) | 2.74 |
Household Size by Marriage Status in Kinsey
Out of a total of 822 households in Kinsey, 556 (67.6%) are family households, while 266 (32.4%) are nonfamily households. The most numerous type of family households are 2-person households, comprising 225, and the most common type of nonfamily households are 1-person households, comprising 236.
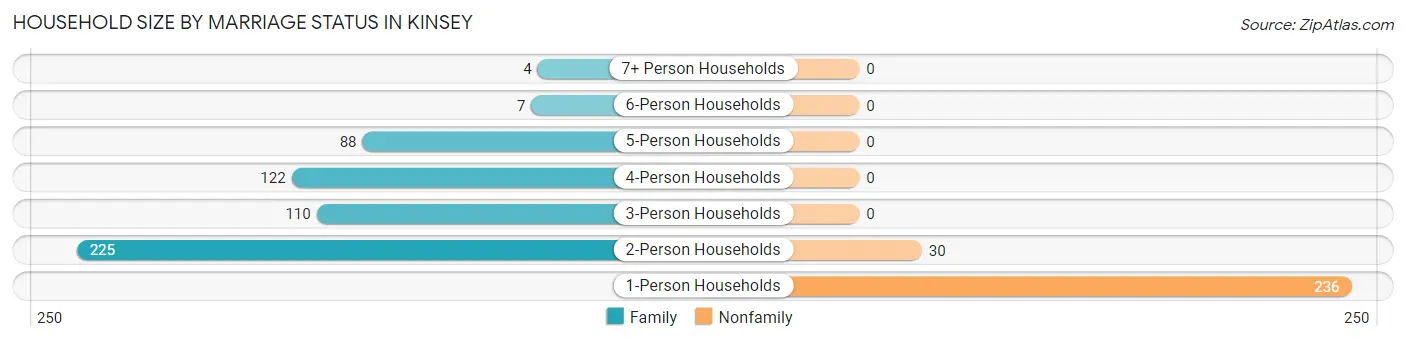
| Household Size | Family Households | Nonfamily Households |
| 1-Person Households | - | 236 (28.7%) |
| 2-Person Households | 225 (27.4%) | 30 (3.6%) |
| 3-Person Households | 110 (13.4%) | 0 (0.0%) |
| 4-Person Households | 122 (14.8%) | 0 (0.0%) |
| 5-Person Households | 88 (10.7%) | 0 (0.0%) |
| 6-Person Households | 7 (0.9%) | 0 (0.0%) |
| 7+ Person Households | 4 (0.5%) | 0 (0.0%) |
| Total | 556 (67.6%) | 266 (32.4%) |
Female Fertility in Kinsey
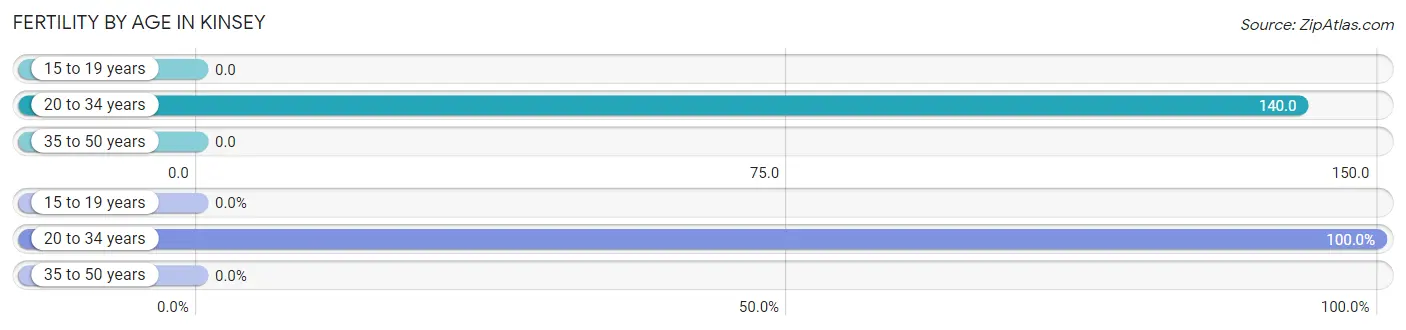
Fertility by Age in Kinsey
Average fertility rate in Kinsey is 59.0 births per 1,000 women. Women in the age bracket of 20 to 34 years have the highest fertility rate with 140.0 births per 1,000 women. Women in the age bracket of 20 to 34 years acount for 100.0% of all women with births.
| Age Bracket | Women with Births | Births / 1,000 Women |
| 15 to 19 years | 0 (0.0%) | 0.0 |
| 20 to 34 years | 32 (100.0%) | 140.0 |
| 35 to 50 years | 0 (0.0%) | 0.0 |
| Total | 32 (100.0%) | 59.0 |
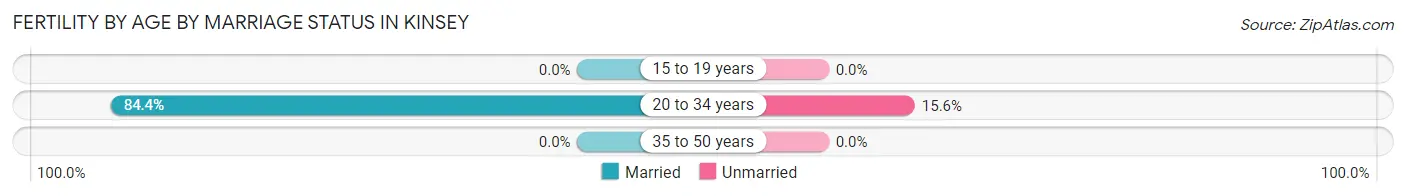
Fertility by Age by Marriage Status in Kinsey
84.4% of women with births (32) in Kinsey are married. The highest percentage of unmarried women with births falls into 20 to 34 years age bracket with 15.6% of them unmarried at the time of birth, while the lowest percentage of unmarried women with births belong to 20 to 34 years age bracket with 15.6% of them unmarried.
| Age Bracket | Married | Unmarried |
| 15 to 19 years | 0 (0.0%) | 0 (0.0%) |
| 20 to 34 years | 27 (84.4%) | 5 (15.6%) |
| 35 to 50 years | 0 (0.0%) | 0 (0.0%) |
| Total | 27 (84.4%) | 5 (15.6%) |
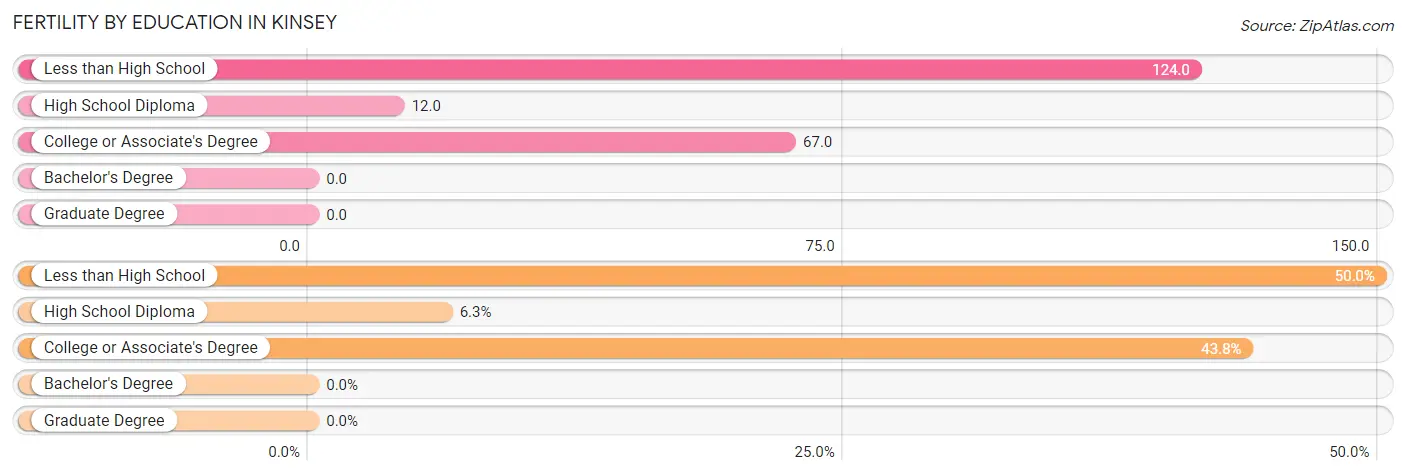
Fertility by Education in Kinsey
| Educational Attainment | Women with Births | Births / 1,000 Women |
| Less than High School | 16 (50.0%) | 124.0 |
| High School Diploma | 2 (6.2%) | 12.0 |
| College or Associate's Degree | 14 (43.8%) | 67.0 |
| Bachelor's Degree | 0 (0.0%) | 0.0 |
| Graduate Degree | 0 (0.0%) | 0.0 |
| Total | 32 (100.0%) | 59.0 |
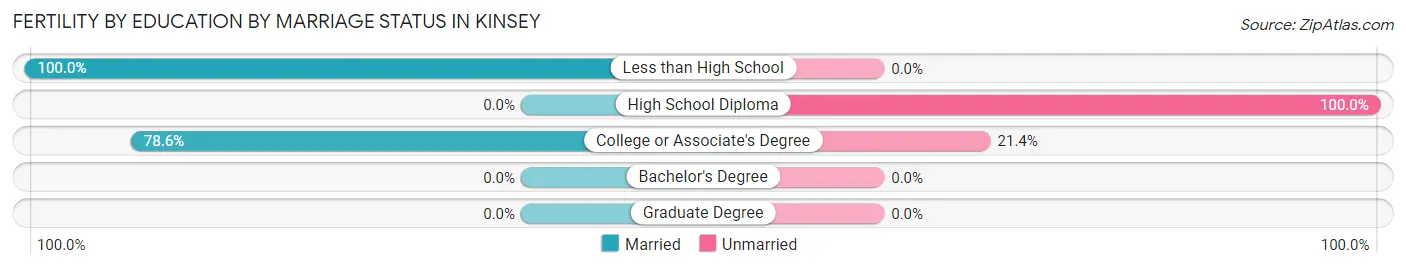
Fertility by Education by Marriage Status in Kinsey
15.6% of women with births in Kinsey are unmarried. Women with the educational attainment of less than high school are most likely to be married with 100.0% of them married at childbirth, while women with the educational attainment of high school diploma are least likely to be married with 100.0% of them unmarried at childbirth.
| Educational Attainment | Married | Unmarried |
| Less than High School | 16 (100.0%) | 0 (0.0%) |
| High School Diploma | 0 (0.0%) | 2 (100.0%) |
| College or Associate's Degree | 11 (78.6%) | 3 (21.4%) |
| Bachelor's Degree | 0 (0.0%) | 0 (0.0%) |
| Graduate Degree | 0 (0.0%) | 0 (0.0%) |
| Total | 27 (84.4%) | 5 (15.6%) |
Income in Kinsey
Income Overview in Kinsey
Per Capita Income in Kinsey is $24,466, while median incomes of families and households are $58,594 and $51,250 respectively.
| Characteristic | Number | Measure |
| Per Capita Income | 2,254 | $24,466 |
| Median Family Income | 556 | $58,594 |
| Mean Family Income | 556 | $69,411 |
| Median Household Income | 822 | $51,250 |
| Mean Household Income | 822 | $62,479 |
| Income Deficit | 556 | $8,906 |
| Wage / Income Gap (%) | 2,254 | 26.03% |
| Wage / Income Gap ($) | 2,254 | 73.97¢ per $1 |
| Gini / Inequality Index | 2,254 | 0.39 |
Earnings by Sex in Kinsey
Average Earnings in Kinsey are $28,258, $32,813 for men and $24,271 for women, a difference of 26.0%.
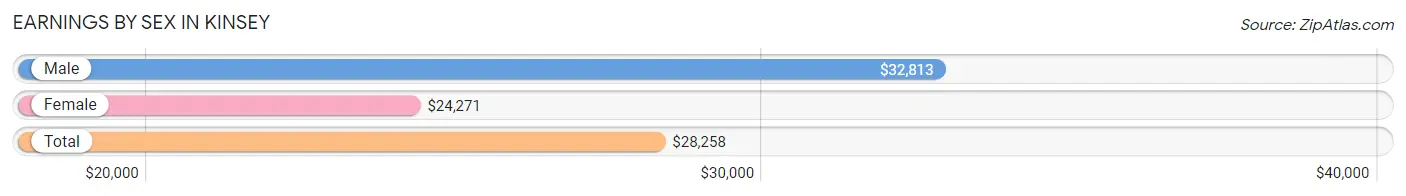
| Sex | Number | Average Earnings |
| Male | 663 (54.1%) | $32,813 |
| Female | 563 (45.9%) | $24,271 |
| Total | 1,226 (100.0%) | $28,258 |
Earnings by Sex by Income Bracket in Kinsey
The most common earnings brackets in Kinsey are $25,000 to $29,999 for men (111 | 16.7%) and $10,000 to $12,499 for women (79 | 14.0%).
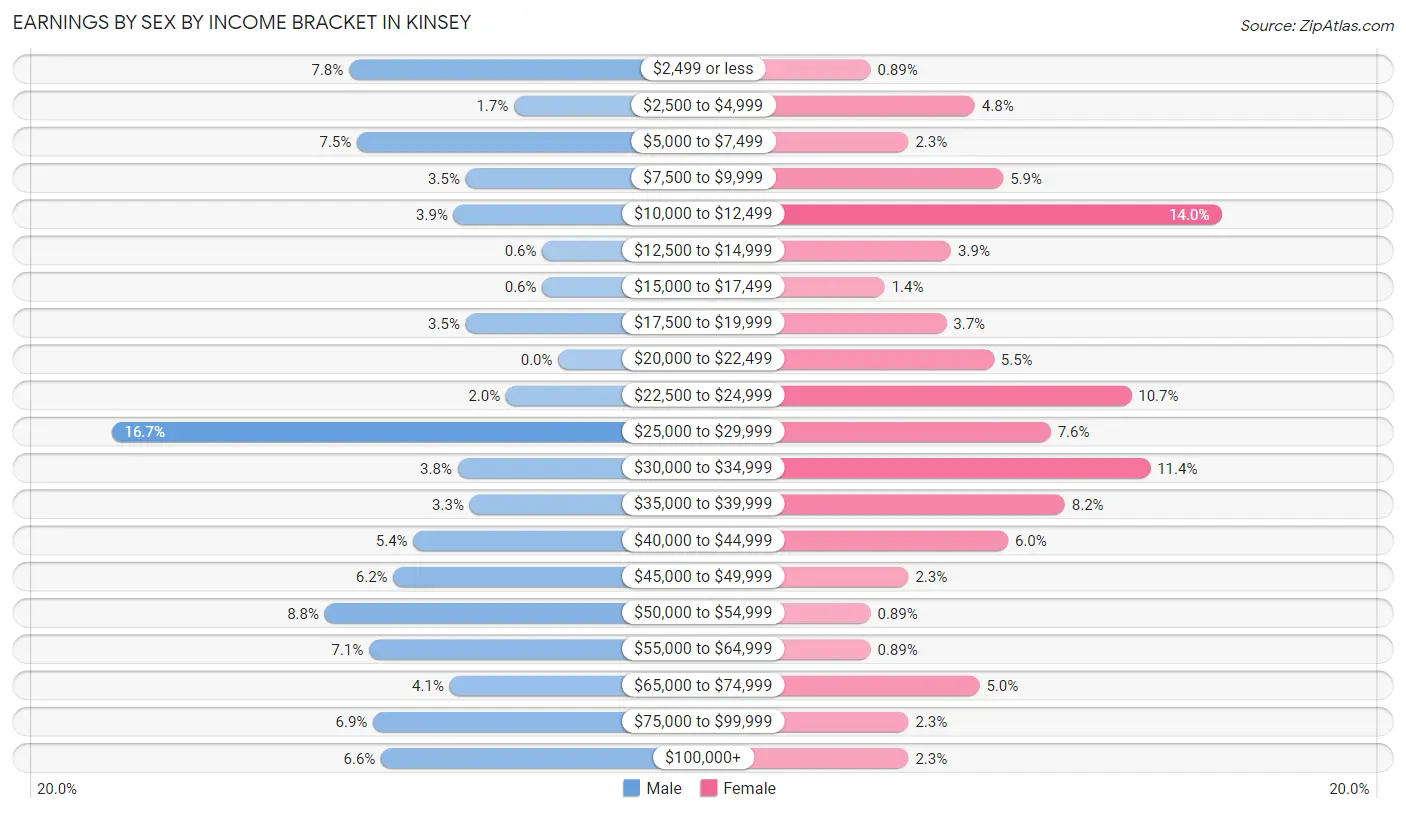
| Income | Male | Female |
| $2,499 or less | 52 (7.8%) | 5 (0.9%) |
| $2,500 to $4,999 | 11 (1.7%) | 27 (4.8%) |
| $5,000 to $7,499 | 50 (7.5%) | 13 (2.3%) |
| $7,500 to $9,999 | 23 (3.5%) | 33 (5.9%) |
| $10,000 to $12,499 | 26 (3.9%) | 79 (14.0%) |
| $12,500 to $14,999 | 4 (0.6%) | 22 (3.9%) |
| $15,000 to $17,499 | 4 (0.6%) | 8 (1.4%) |
| $17,500 to $19,999 | 23 (3.5%) | 21 (3.7%) |
| $20,000 to $22,499 | 0 (0.0%) | 31 (5.5%) |
| $22,500 to $24,999 | 13 (2.0%) | 60 (10.7%) |
| $25,000 to $29,999 | 111 (16.7%) | 43 (7.6%) |
| $30,000 to $34,999 | 25 (3.8%) | 64 (11.4%) |
| $35,000 to $39,999 | 22 (3.3%) | 46 (8.2%) |
| $40,000 to $44,999 | 36 (5.4%) | 34 (6.0%) |
| $45,000 to $49,999 | 41 (6.2%) | 13 (2.3%) |
| $50,000 to $54,999 | 58 (8.7%) | 5 (0.9%) |
| $55,000 to $64,999 | 47 (7.1%) | 5 (0.9%) |
| $65,000 to $74,999 | 27 (4.1%) | 28 (5.0%) |
| $75,000 to $99,999 | 46 (6.9%) | 13 (2.3%) |
| $100,000+ | 44 (6.6%) | 13 (2.3%) |
| Total | 663 (100.0%) | 563 (100.0%) |
Earnings by Sex by Educational Attainment in Kinsey
Average earnings in Kinsey are $42,414 for men and $25,313 for women, a difference of 40.3%. Men with an educational attainment of bachelor's degree enjoy the highest average annual earnings of $87,708, while those with less than high school education earn the least with $27,875. Women with an educational attainment of graduate degree earn the most with the average annual earnings of $78,958, while those with less than high school education have the smallest earnings of $12,000.
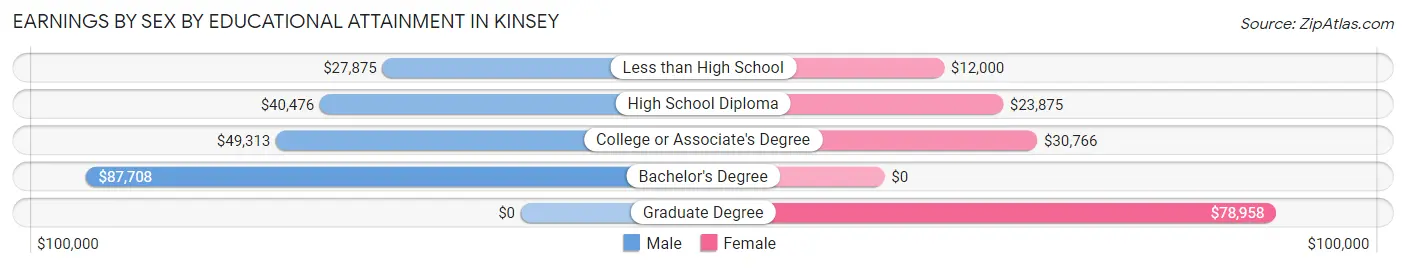
| Educational Attainment | Male Income | Female Income |
| Less than High School | $27,875 | $12,000 |
| High School Diploma | $40,476 | $23,875 |
| College or Associate's Degree | $49,313 | $30,766 |
| Bachelor's Degree | $87,708 | $0 |
| Graduate Degree | - | - |
| Total | $42,414 | $25,313 |
Family Income in Kinsey
Family Income Brackets in Kinsey
According to the Kinsey family income data, there are 119 families falling into the $50,000 to $74,999 income range, which is the most common income bracket and makes up 21.4% of all families. Conversely, the $200,000+ income bracket is the least frequent group with only 9 families (1.6%) belonging to this category.
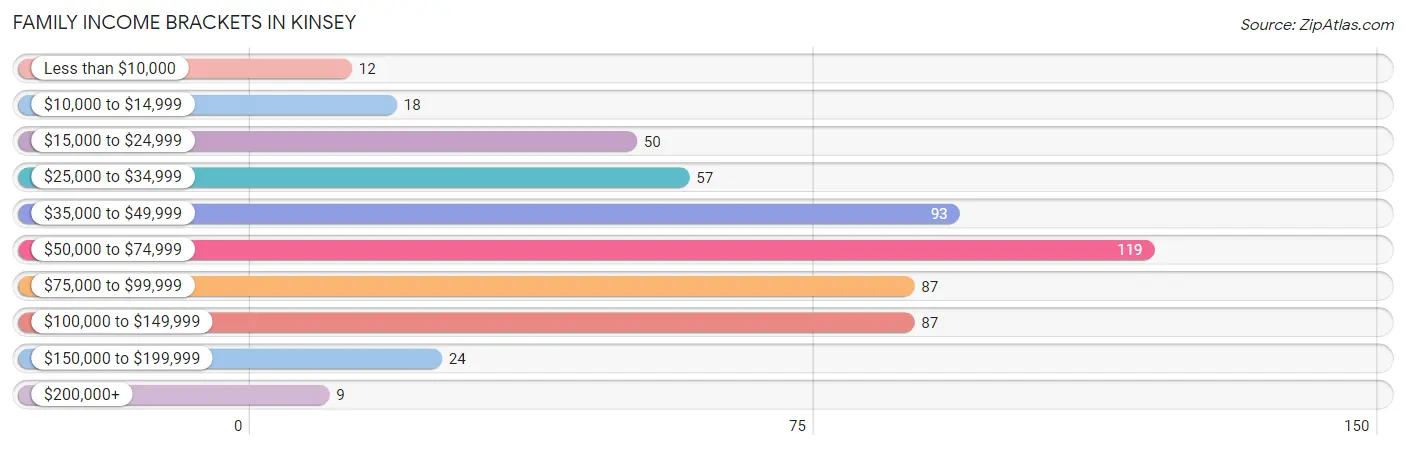
| Income Bracket | # Families | % Families |
| Less than $10,000 | 12 | 2.2% |
| $10,000 to $14,999 | 18 | 3.2% |
| $15,000 to $24,999 | 50 | 9.0% |
| $25,000 to $34,999 | 57 | 10.3% |
| $35,000 to $49,999 | 93 | 16.7% |
| $50,000 to $74,999 | 119 | 21.4% |
| $75,000 to $99,999 | 87 | 15.6% |
| $100,000 to $149,999 | 87 | 15.6% |
| $150,000 to $199,999 | 24 | 4.3% |
| $200,000+ | 9 | 1.6% |
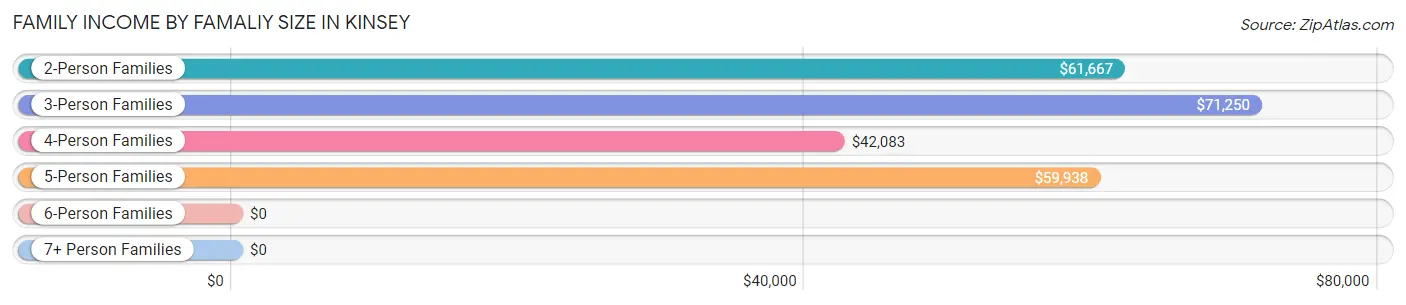
Family Income by Famaliy Size in Kinsey
3-person families (108 | 19.4%) account for the highest median family income in Kinsey with $71,250 per family, while 2-person families (236 | 42.4%) have the highest median income of $30,834 per family member.
| Income Bracket | # Families | Median Income |
| 2-Person Families | 236 (42.4%) | $61,667 |
| 3-Person Families | 108 (19.4%) | $71,250 |
| 4-Person Families | 142 (25.5%) | $42,083 |
| 5-Person Families | 67 (12.0%) | $59,938 |
| 6-Person Families | 0 (0.0%) | $0 |
| 7+ Person Families | 3 (0.5%) | $0 |
| Total | 556 (100.0%) | $58,594 |
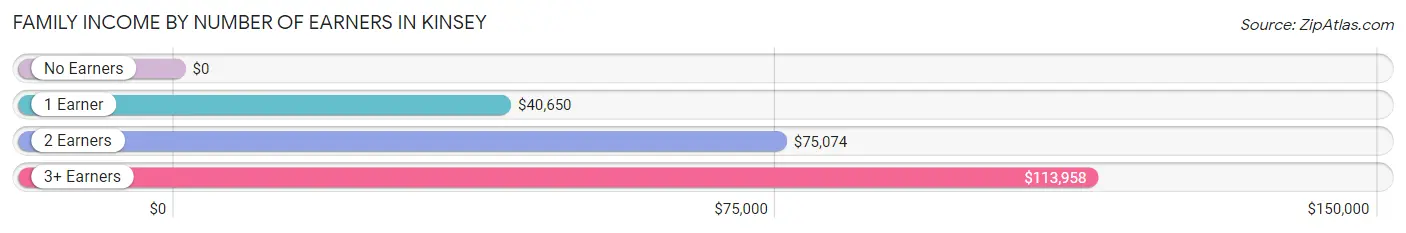
Family Income by Number of Earners in Kinsey
| Number of Earners | # Families | Median Income |
| No Earners | 73 (13.1%) | $0 |
| 1 Earner | 229 (41.2%) | $40,650 |
| 2 Earners | 189 (34.0%) | $75,074 |
| 3+ Earners | 65 (11.7%) | $113,958 |
| Total | 556 (100.0%) | $58,594 |
Household Income in Kinsey
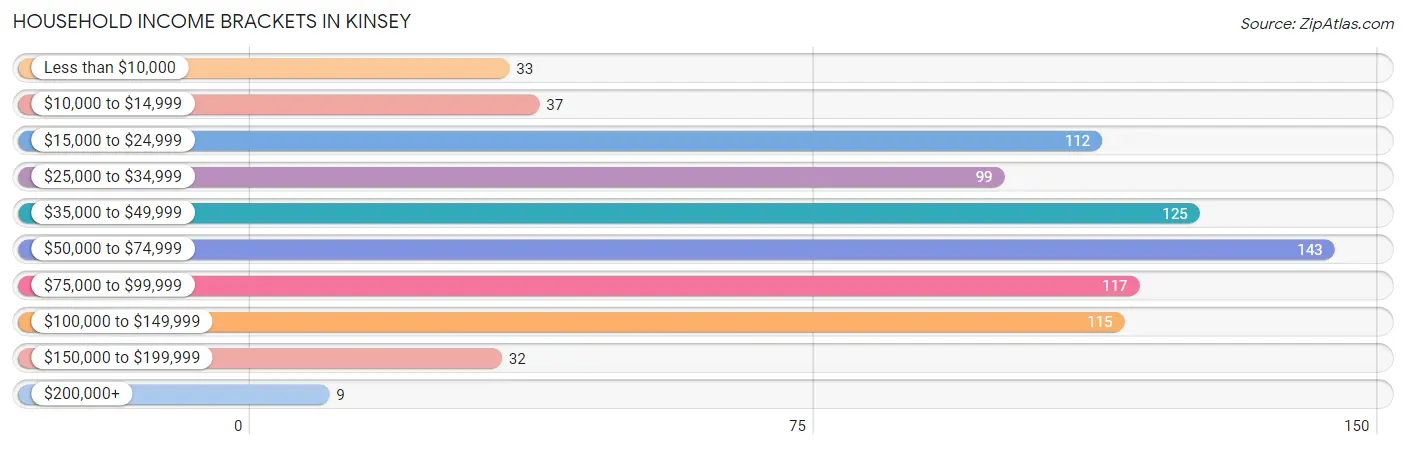
Household Income Brackets in Kinsey
With 143 households falling in the category, the $50,000 to $74,999 income range is the most frequent in Kinsey, accounting for 17.4% of all households. In contrast, only 9 households (1.1%) fall into the $200,000+ income bracket, making it the least populous group.
| Income Bracket | # Households | % Households |
| Less than $10,000 | 33 | 4.0% |
| $10,000 to $14,999 | 37 | 4.5% |
| $15,000 to $24,999 | 112 | 13.6% |
| $25,000 to $34,999 | 99 | 12.0% |
| $35,000 to $49,999 | 125 | 15.2% |
| $50,000 to $74,999 | 143 | 17.4% |
| $75,000 to $99,999 | 117 | 14.2% |
| $100,000 to $149,999 | 115 | 14.0% |
| $150,000 to $199,999 | 32 | 3.9% |
| $200,000+ | 9 | 1.1% |
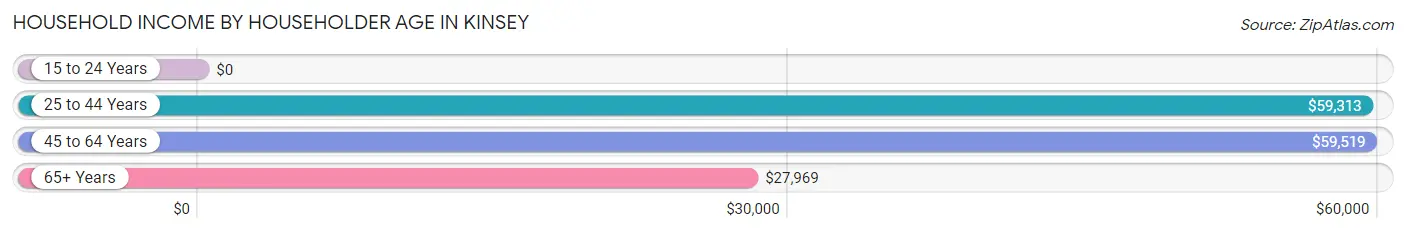
Household Income by Householder Age in Kinsey
The median household income in Kinsey is $51,250, with the highest median household income of $59,519 found in the 45 to 64 years age bracket for the primary householder. A total of 301 households (36.6%) fall into this category. Meanwhile, the 15 to 24 years age bracket for the primary householder has the lowest median household income of $0, with 17 households (2.1%) in this group.
| Income Bracket | # Households | Median Income |
| 15 to 24 Years | 17 (2.1%) | $0 |
| 25 to 44 Years | 319 (38.8%) | $59,313 |
| 45 to 64 Years | 301 (36.6%) | $59,519 |
| 65+ Years | 185 (22.5%) | $27,969 |
| Total | 822 (100.0%) | $51,250 |
Poverty in Kinsey
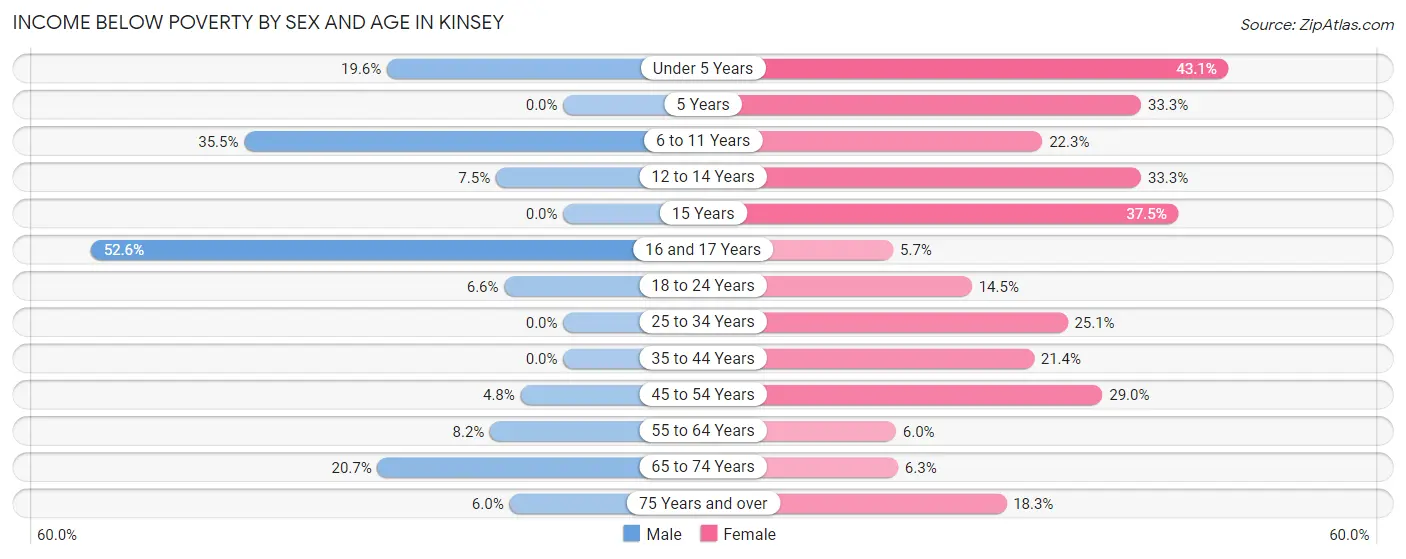
Income Below Poverty by Sex and Age in Kinsey
With 9.9% poverty level for males and 20.8% for females among the residents of Kinsey, 16 and 17 year old males and under 5 year old females are the most vulnerable to poverty, with 10 males (52.6%) and 28 females (43.1%) in their respective age groups living below the poverty level.
| Age Bracket | Male | Female |
| Under 5 Years | 21 (19.6%) | 28 (43.1%) |
| 5 Years | 0 (0.0%) | 7 (33.3%) |
| 6 to 11 Years | 27 (35.5%) | 25 (22.3%) |
| 12 to 14 Years | 3 (7.5%) | 15 (33.3%) |
| 15 Years | 0 (0.0%) | 3 (37.5%) |
| 16 and 17 Years | 10 (52.6%) | 2 (5.7%) |
| 18 to 24 Years | 13 (6.6%) | 11 (14.5%) |
| 25 to 34 Years | 0 (0.0%) | 48 (25.1%) |
| 35 to 44 Years | 0 (0.0%) | 31 (21.4%) |
| 45 to 54 Years | 5 (4.8%) | 38 (29.0%) |
| 55 to 64 Years | 11 (8.2%) | 10 (6.0%) |
| 65 to 74 Years | 18 (20.7%) | 4 (6.2%) |
| 75 Years and over | 3 (6.0%) | 13 (18.3%) |
| Total | 111 (9.9%) | 235 (20.8%) |
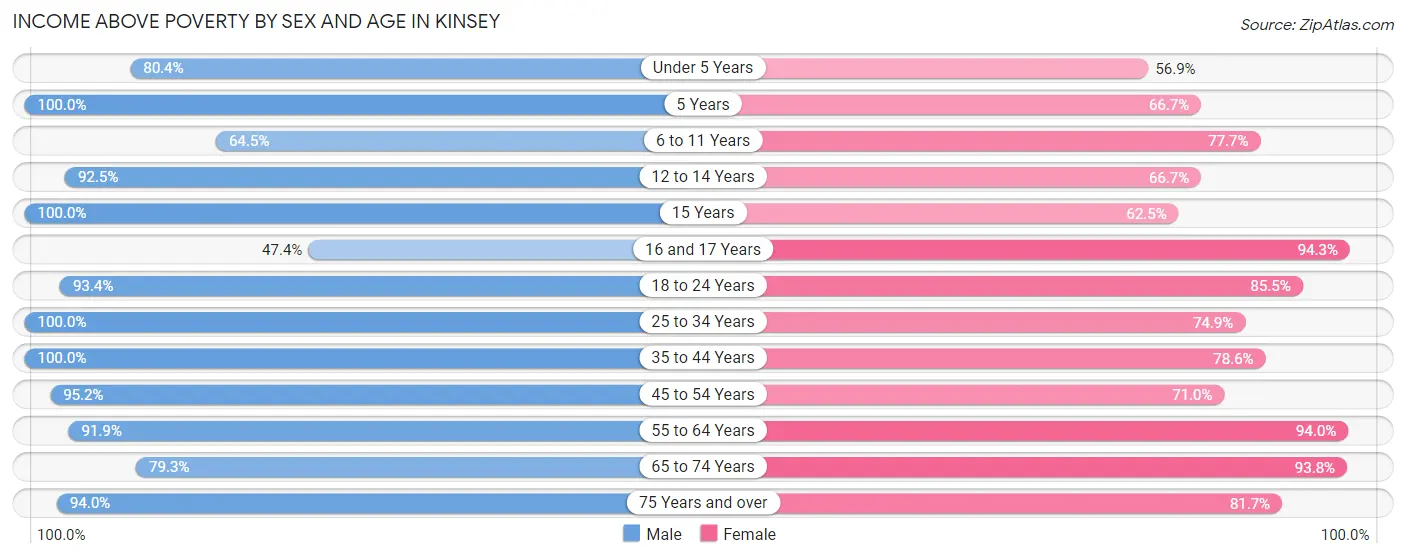
Income Above Poverty by Sex and Age in Kinsey
According to the poverty statistics in Kinsey, males aged 5 years and females aged 16 and 17 years are the age groups that are most secure financially, with 100.0% of males and 94.3% of females in these age groups living above the poverty line.
| Age Bracket | Male | Female |
| Under 5 Years | 86 (80.4%) | 37 (56.9%) |
| 5 Years | 7 (100.0%) | 14 (66.7%) |
| 6 to 11 Years | 49 (64.5%) | 87 (77.7%) |
| 12 to 14 Years | 37 (92.5%) | 30 (66.7%) |
| 15 Years | 15 (100.0%) | 5 (62.5%) |
| 16 and 17 Years | 9 (47.4%) | 33 (94.3%) |
| 18 to 24 Years | 185 (93.4%) | 65 (85.5%) |
| 25 to 34 Years | 148 (100.0%) | 143 (74.9%) |
| 35 to 44 Years | 134 (100.0%) | 114 (78.6%) |
| 45 to 54 Years | 100 (95.2%) | 93 (71.0%) |
| 55 to 64 Years | 124 (91.8%) | 156 (94.0%) |
| 65 to 74 Years | 69 (79.3%) | 60 (93.8%) |
| 75 Years and over | 47 (94.0%) | 58 (81.7%) |
| Total | 1,010 (90.1%) | 895 (79.2%) |
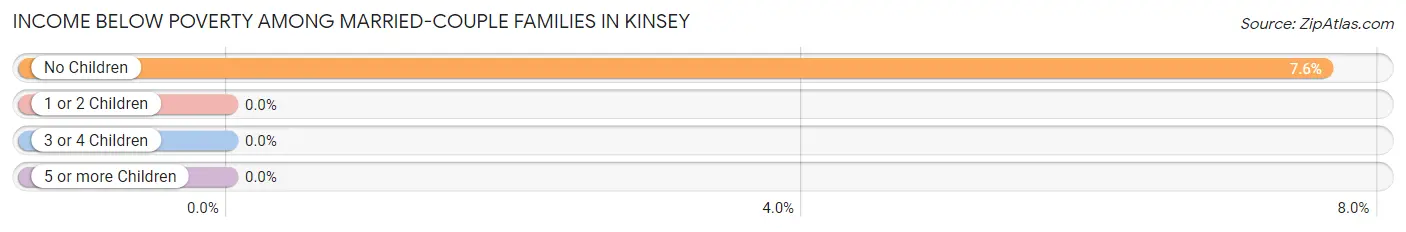
Income Below Poverty Among Married-Couple Families in Kinsey
The poverty statistics for married-couple families in Kinsey show that 5.4% or 18 of the total 336 families live below the poverty line. Families with no children have the highest poverty rate of 7.6%, comprising of 18 families. On the other hand, families with 1 or 2 children have the lowest poverty rate of 0.0%, which includes 0 families.
| Children | Above Poverty | Below Poverty |
| No Children | 218 (92.4%) | 18 (7.6%) |
| 1 or 2 Children | 64 (100.0%) | 0 (0.0%) |
| 3 or 4 Children | 36 (100.0%) | 0 (0.0%) |
| 5 or more Children | 0 (0.0%) | 0 (0.0%) |
| Total | 318 (94.6%) | 18 (5.4%) |
Income Below Poverty Among Single-Parent Households in Kinsey
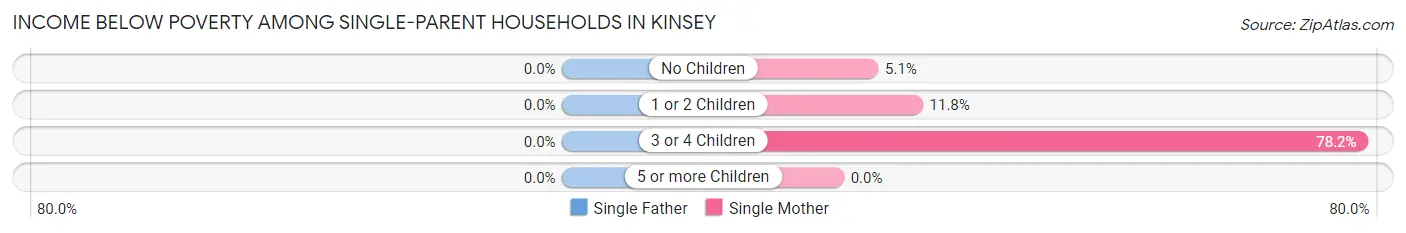
| Children | Single Father | Single Mother |
| No Children | 0 (0.0%) | 2 (5.1%) |
| 1 or 2 Children | 0 (0.0%) | 8 (11.8%) |
| 3 or 4 Children | 0 (0.0%) | 43 (78.2%) |
| 5 or more Children | 0 (0.0%) | 0 (0.0%) |
| Total | 0 (0.0%) | 53 (32.7%) |
Income Below Poverty Among Married-Couple vs Single-Parent Households in Kinsey
The poverty data for Kinsey shows that 18 of the married-couple family households (5.4%) and 53 of the single-parent households (24.1%) are living below the poverty level. Within the married-couple family households, those with no children have the highest poverty rate, with 18 households (7.6%) falling below the poverty line. Among the single-parent households, those with 3 or 4 children have the highest poverty rate, with 43 household (48.3%) living below poverty.
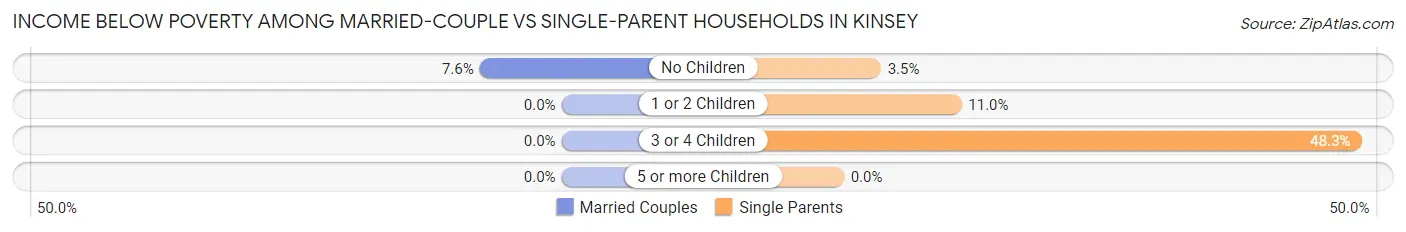
| Children | Married-Couple Families | Single-Parent Households |
| No Children | 18 (7.6%) | 2 (3.5%) |
| 1 or 2 Children | 0 (0.0%) | 8 (11.0%) |
| 3 or 4 Children | 0 (0.0%) | 43 (48.3%) |
| 5 or more Children | 0 (0.0%) | 0 (0.0%) |
| Total | 18 (5.4%) | 53 (24.1%) |
Employment Characteristics in Kinsey
Employment by Class of Employer in Kinsey
Among the 1,120 employed individuals in Kinsey, private company employees (851 | 76.0%), local government employees (77 | 6.9%), and self-employed (not incorporated) (74 | 6.6%) make up the most common classes of employment.
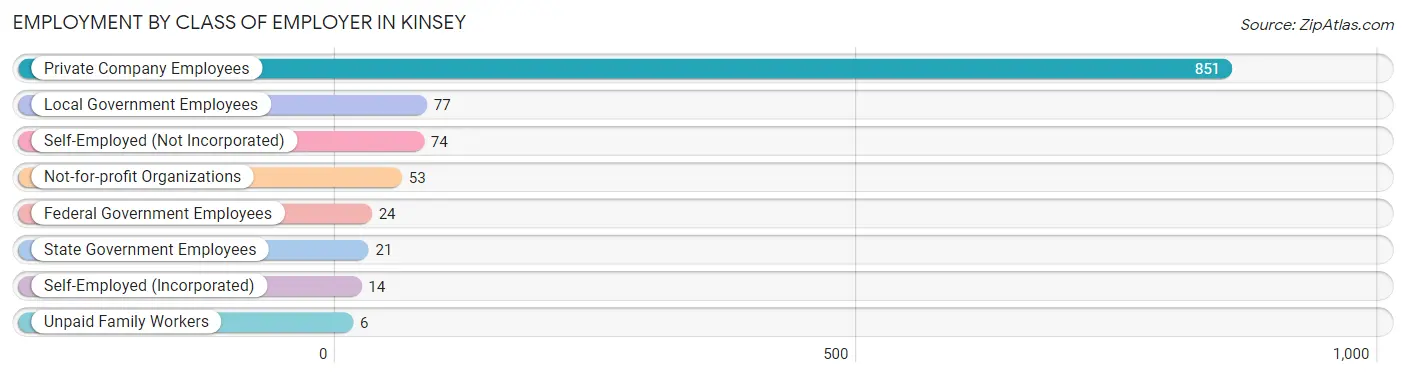
| Employer Class | # Employees | % Employees |
| Private Company Employees | 851 | 76.0% |
| Self-Employed (Incorporated) | 14 | 1.3% |
| Self-Employed (Not Incorporated) | 74 | 6.6% |
| Not-for-profit Organizations | 53 | 4.7% |
| Local Government Employees | 77 | 6.9% |
| State Government Employees | 21 | 1.9% |
| Federal Government Employees | 24 | 2.1% |
| Unpaid Family Workers | 6 | 0.5% |
| Total | 1,120 | 100.0% |
Employment Status by Age in Kinsey
According to the labor force statistics for Kinsey, out of the total population over 16 years of age (1,755), 67.8% or 1,190 individuals are in the labor force, with 4.6% or 55 of them unemployed. The age group with the highest labor force participation rate is 25 to 29 years, with 94.9% or 169 individuals in the labor force. Within the labor force, the 65 to 74 years age range has the highest percentage of unemployed individuals, with 14.3% or 4 of them being unemployed.
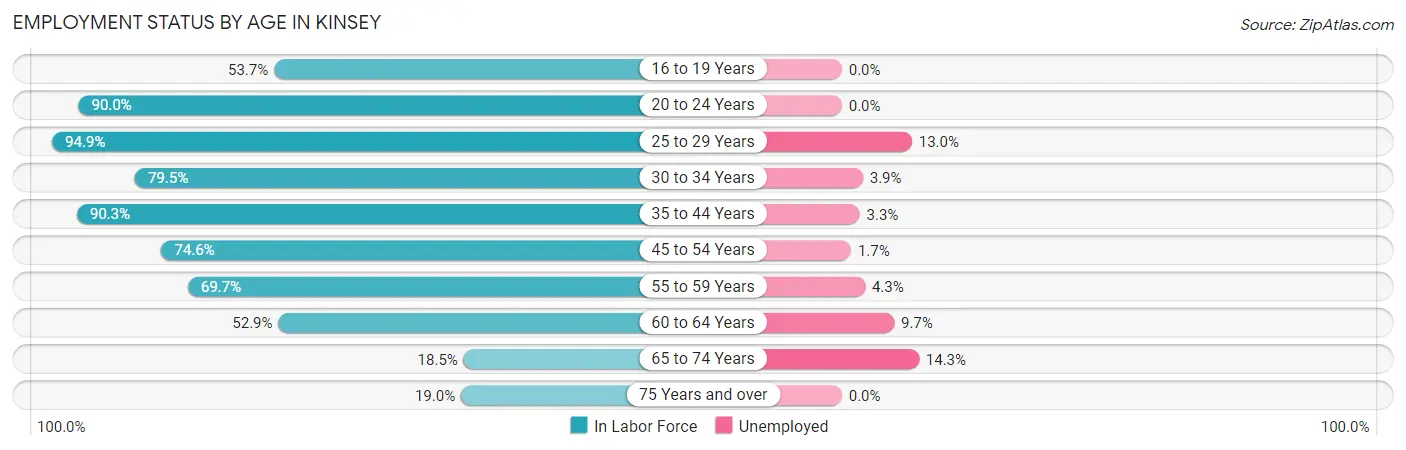
| Age Bracket | In Labor Force | Unemployed |
| 16 to 19 Years | 101 (53.7%) | 0 (0.0%) |
| 20 to 24 Years | 126 (90.0%) | 0 (0.0%) |
| 25 to 29 Years | 169 (94.9%) | 22 (13.0%) |
| 30 to 34 Years | 128 (79.5%) | 5 (3.9%) |
| 35 to 44 Years | 252 (90.3%) | 8 (3.3%) |
| 45 to 54 Years | 176 (74.6%) | 3 (1.7%) |
| 55 to 59 Years | 115 (69.7%) | 5 (4.3%) |
| 60 to 64 Years | 72 (52.9%) | 7 (9.7%) |
| 65 to 74 Years | 28 (18.5%) | 4 (14.3%) |
| 75 Years and over | 23 (19.0%) | 0 (0.0%) |
| Total | 1,190 (67.8%) | 55 (4.6%) |
Employment Status by Educational Attainment in Kinsey
According to labor force statistics for Kinsey, 79.0% of individuals (912) out of the total population between 25 and 64 years of age (1,155) are in the labor force, with 5.5% or 50 of them being unemployed. The group with the highest labor force participation rate are those with the educational attainment of college / associate degree, with 84.8% or 401 individuals in the labor force. Within the labor force, individuals with less than high school education have the highest percentage of unemployment, with 9.8% or 11 of them being unemployed.
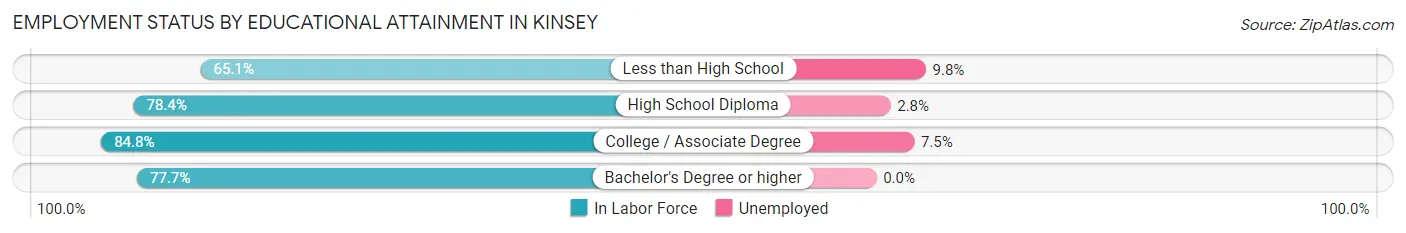
| Educational Attainment | In Labor Force | Unemployed |
| Less than High School | 112 (65.1%) | 17 (9.8%) |
| High School Diploma | 319 (78.4%) | 11 (2.8%) |
| College / Associate Degree | 401 (84.8%) | 35 (7.5%) |
| Bachelor's Degree or higher | 80 (77.7%) | 0 (0.0%) |
| Total | 912 (79.0%) | 64 (5.5%) |
Employment Occupations by Sex in Kinsey
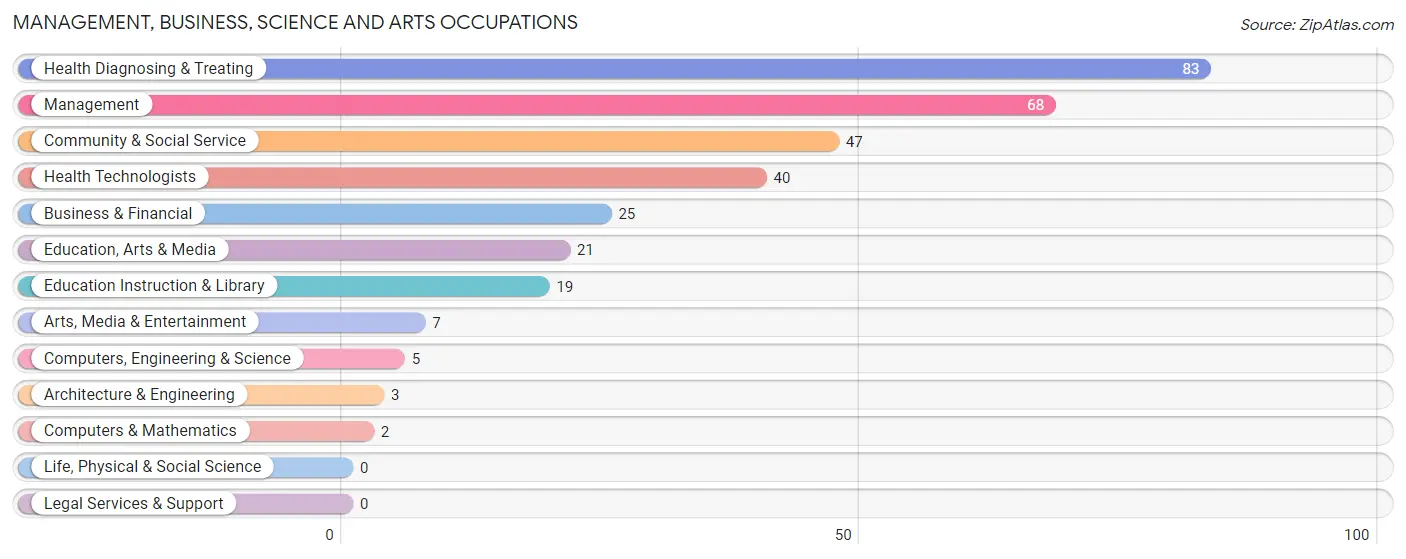
Management, Business, Science and Arts Occupations
The most common Management, Business, Science and Arts occupations in Kinsey are Health Diagnosing & Treating (83 | 7.4%), Management (68 | 6.0%), Community & Social Service (47 | 4.2%), Health Technologists (40 | 3.5%), and Business & Financial (25 | 2.2%).
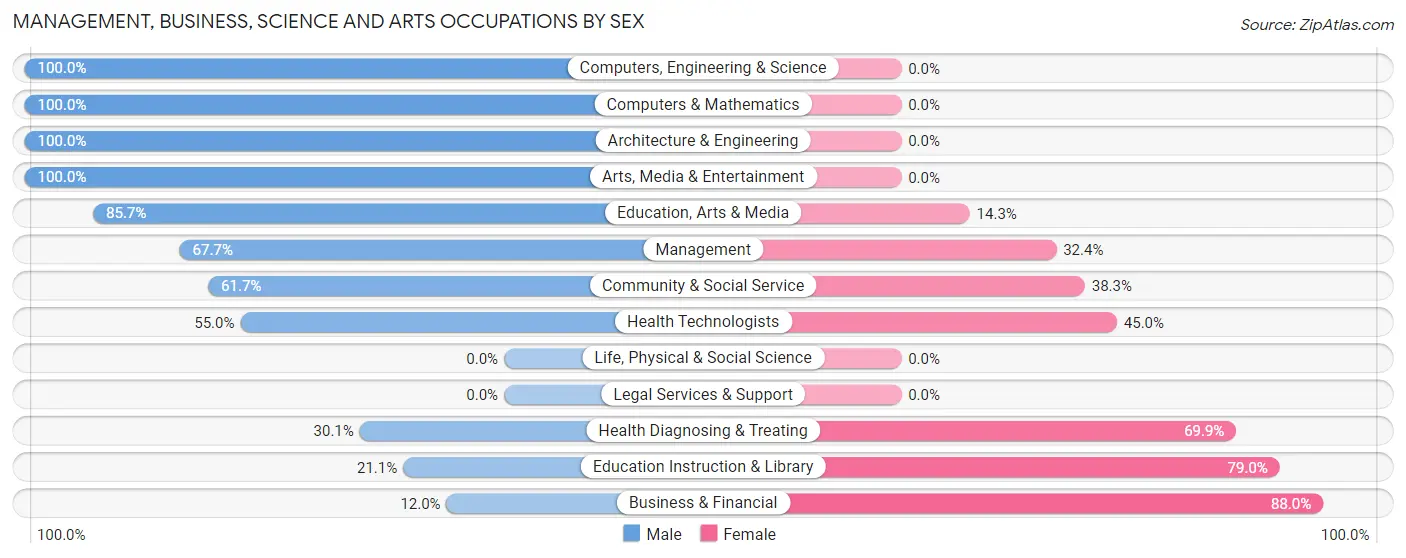
Management, Business, Science and Arts Occupations by Sex
Within the Management, Business, Science and Arts occupations in Kinsey, the most male-oriented occupations are Computers, Engineering & Science (100.0%), Computers & Mathematics (100.0%), and Architecture & Engineering (100.0%), while the most female-oriented occupations are Business & Financial (88.0%), Education Instruction & Library (78.9%), and Health Diagnosing & Treating (69.9%).
| Occupation | Male | Female |
| Management | 46 (67.6%) | 22 (32.4%) |
| Business & Financial | 3 (12.0%) | 22 (88.0%) |
| Computers, Engineering & Science | 5 (100.0%) | 0 (0.0%) |
| Computers & Mathematics | 2 (100.0%) | 0 (0.0%) |
| Architecture & Engineering | 3 (100.0%) | 0 (0.0%) |
| Life, Physical & Social Science | 0 (0.0%) | 0 (0.0%) |
| Community & Social Service | 29 (61.7%) | 18 (38.3%) |
| Education, Arts & Media | 18 (85.7%) | 3 (14.3%) |
| Legal Services & Support | 0 (0.0%) | 0 (0.0%) |
| Education Instruction & Library | 4 (21.0%) | 15 (78.9%) |
| Arts, Media & Entertainment | 7 (100.0%) | 0 (0.0%) |
| Health Diagnosing & Treating | 25 (30.1%) | 58 (69.9%) |
| Health Technologists | 22 (55.0%) | 18 (45.0%) |
| Total (Category) | 108 (47.4%) | 120 (52.6%) |
| Total (Overall) | 630 (55.9%) | 496 (44.1%) |
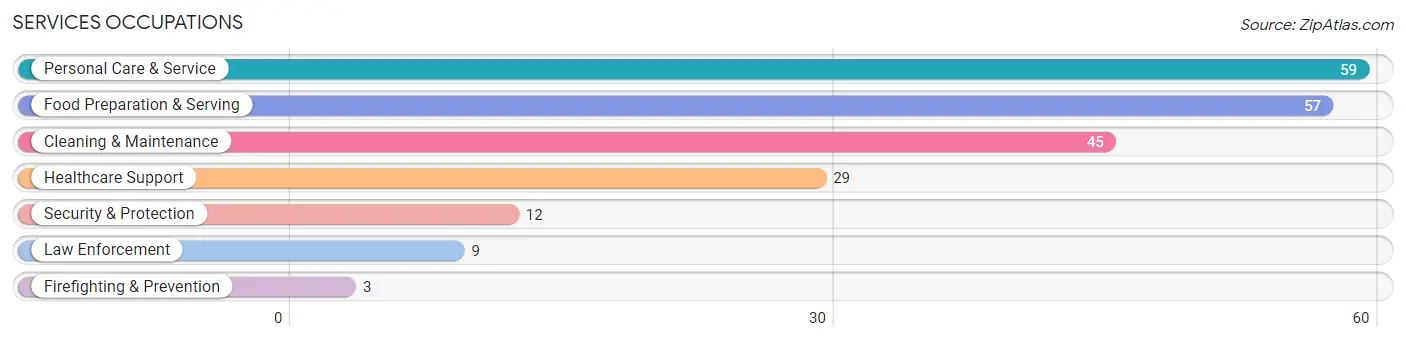
Services Occupations
The most common Services occupations in Kinsey are Personal Care & Service (59 | 5.2%), Food Preparation & Serving (57 | 5.1%), Cleaning & Maintenance (45 | 4.0%), Healthcare Support (29 | 2.6%), and Security & Protection (12 | 1.1%).
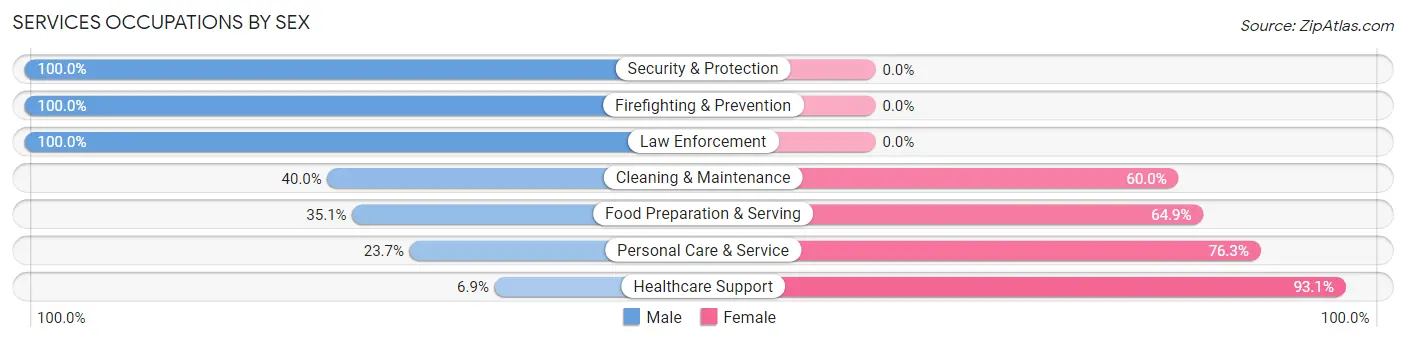
Services Occupations by Sex
Within the Services occupations in Kinsey, the most male-oriented occupations are Security & Protection (100.0%), Firefighting & Prevention (100.0%), and Law Enforcement (100.0%), while the most female-oriented occupations are Healthcare Support (93.1%), Personal Care & Service (76.3%), and Food Preparation & Serving (64.9%).
| Occupation | Male | Female |
| Healthcare Support | 2 (6.9%) | 27 (93.1%) |
| Security & Protection | 12 (100.0%) | 0 (0.0%) |
| Firefighting & Prevention | 3 (100.0%) | 0 (0.0%) |
| Law Enforcement | 9 (100.0%) | 0 (0.0%) |
| Food Preparation & Serving | 20 (35.1%) | 37 (64.9%) |
| Cleaning & Maintenance | 18 (40.0%) | 27 (60.0%) |
| Personal Care & Service | 14 (23.7%) | 45 (76.3%) |
| Total (Category) | 66 (32.7%) | 136 (67.3%) |
| Total (Overall) | 630 (55.9%) | 496 (44.1%) |
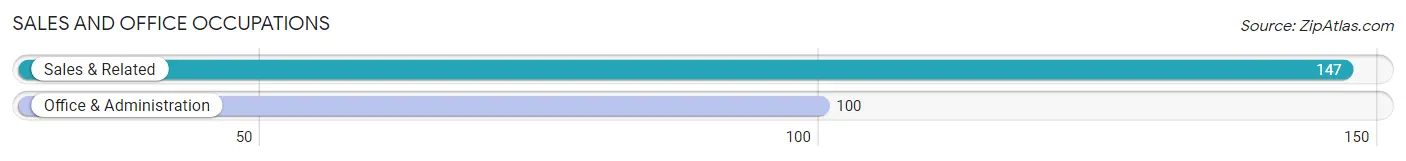
Sales and Office Occupations
The most common Sales and Office occupations in Kinsey are Sales & Related (147 | 13.1%), and Office & Administration (100 | 8.9%).
Sales and Office Occupations by Sex

| Occupation | Male | Female |
| Sales & Related | 54 (36.7%) | 93 (63.3%) |
| Office & Administration | 17 (17.0%) | 83 (83.0%) |
| Total (Category) | 71 (28.7%) | 176 (71.3%) |
| Total (Overall) | 630 (55.9%) | 496 (44.1%) |
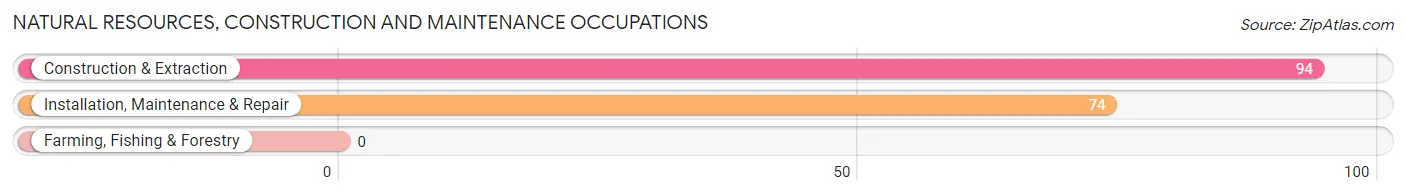
Natural Resources, Construction and Maintenance Occupations
The most common Natural Resources, Construction and Maintenance occupations in Kinsey are Construction & Extraction (94 | 8.4%), and Installation, Maintenance & Repair (74 | 6.6%).
Natural Resources, Construction and Maintenance Occupations by Sex
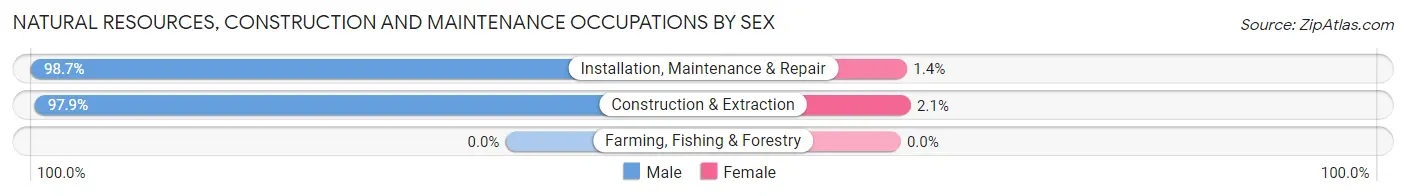
| Occupation | Male | Female |
| Farming, Fishing & Forestry | 0 (0.0%) | 0 (0.0%) |
| Construction & Extraction | 92 (97.9%) | 2 (2.1%) |
| Installation, Maintenance & Repair | 73 (98.7%) | 1 (1.3%) |
| Total (Category) | 165 (98.2%) | 3 (1.8%) |
| Total (Overall) | 630 (55.9%) | 496 (44.1%) |
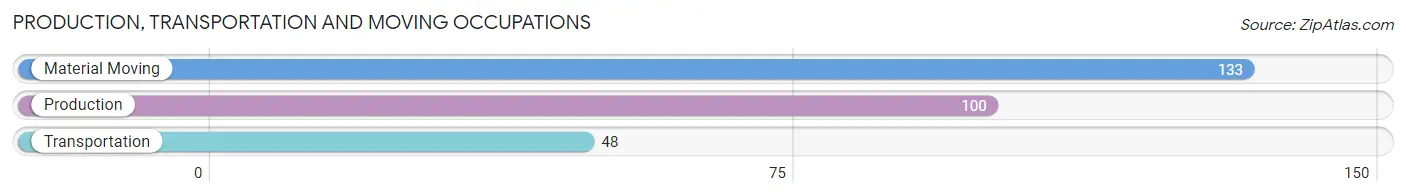
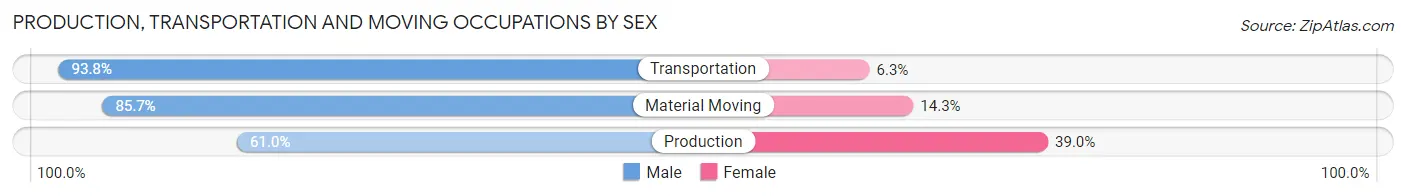
Production, Transportation and Moving Occupations
The most common Production, Transportation and Moving occupations in Kinsey are Material Moving (133 | 11.8%), Production (100 | 8.9%), and Transportation (48 | 4.3%).
Production, Transportation and Moving Occupations by Sex
| Occupation | Male | Female |
| Production | 61 (61.0%) | 39 (39.0%) |
| Transportation | 45 (93.8%) | 3 (6.2%) |
| Material Moving | 114 (85.7%) | 19 (14.3%) |
| Total (Category) | 220 (78.3%) | 61 (21.7%) |
| Total (Overall) | 630 (55.9%) | 496 (44.1%) |
Employment Industries by Sex in Kinsey
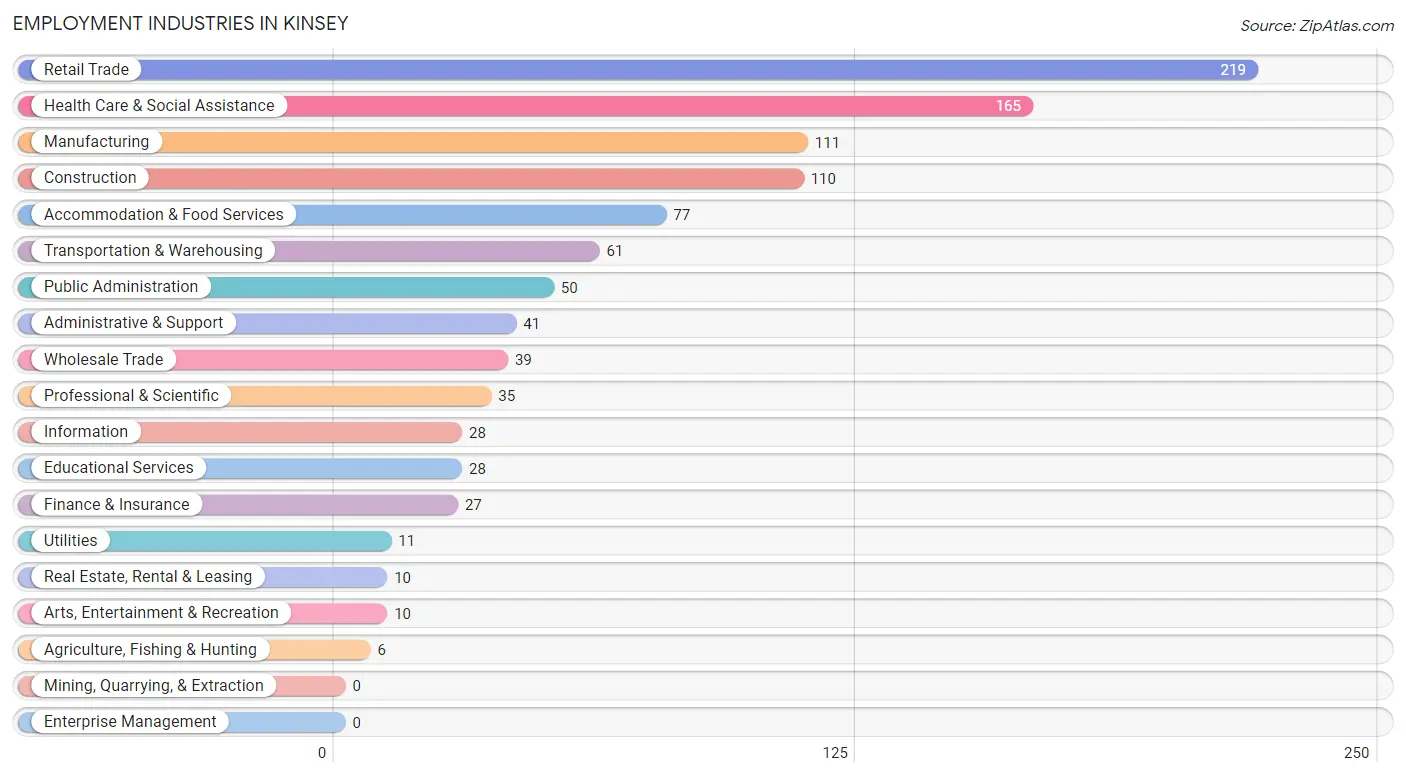
Employment Industries in Kinsey
The major employment industries in Kinsey include Retail Trade (219 | 19.5%), Health Care & Social Assistance (165 | 14.6%), Manufacturing (111 | 9.9%), Construction (110 | 9.8%), and Accommodation & Food Services (77 | 6.8%).
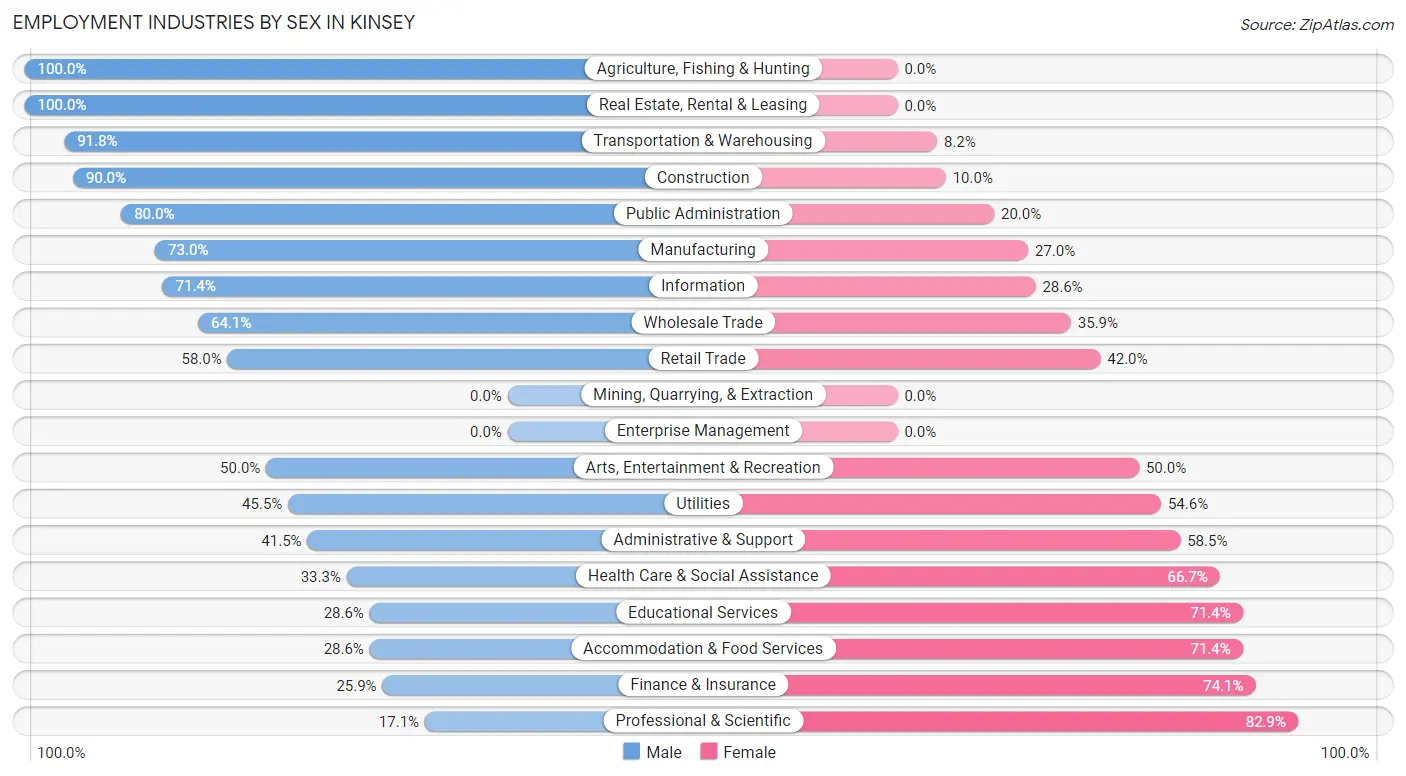
Employment Industries by Sex in Kinsey
The Kinsey industries that see more men than women are Agriculture, Fishing & Hunting (100.0%), Real Estate, Rental & Leasing (100.0%), and Transportation & Warehousing (91.8%), whereas the industries that tend to have a higher number of women are Professional & Scientific (82.9%), Finance & Insurance (74.1%), and Educational Services (71.4%).
| Industry | Male | Female |
| Agriculture, Fishing & Hunting | 6 (100.0%) | 0 (0.0%) |
| Mining, Quarrying, & Extraction | 0 (0.0%) | 0 (0.0%) |
| Construction | 99 (90.0%) | 11 (10.0%) |
| Manufacturing | 81 (73.0%) | 30 (27.0%) |
| Wholesale Trade | 25 (64.1%) | 14 (35.9%) |
| Retail Trade | 127 (58.0%) | 92 (42.0%) |
| Transportation & Warehousing | 56 (91.8%) | 5 (8.2%) |
| Utilities | 5 (45.5%) | 6 (54.5%) |
| Information | 20 (71.4%) | 8 (28.6%) |
| Finance & Insurance | 7 (25.9%) | 20 (74.1%) |
| Real Estate, Rental & Leasing | 10 (100.0%) | 0 (0.0%) |
| Professional & Scientific | 6 (17.1%) | 29 (82.9%) |
| Enterprise Management | 0 (0.0%) | 0 (0.0%) |
| Administrative & Support | 17 (41.5%) | 24 (58.5%) |
| Educational Services | 8 (28.6%) | 20 (71.4%) |
| Health Care & Social Assistance | 55 (33.3%) | 110 (66.7%) |
| Arts, Entertainment & Recreation | 5 (50.0%) | 5 (50.0%) |
| Accommodation & Food Services | 22 (28.6%) | 55 (71.4%) |
| Public Administration | 40 (80.0%) | 10 (20.0%) |
| Total | 630 (55.9%) | 496 (44.1%) |
Education in Kinsey
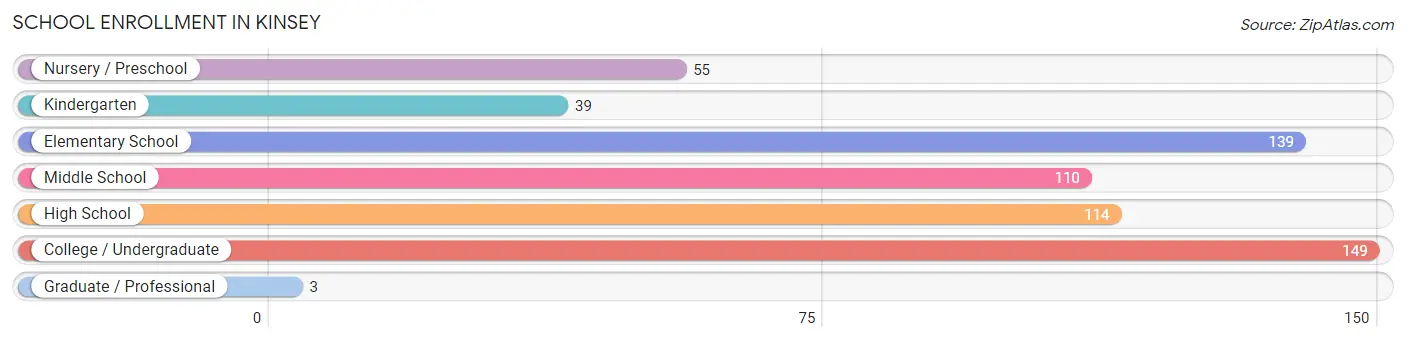
School Enrollment in Kinsey
The most common levels of schooling among the 609 students in Kinsey are college / undergraduate (149 | 24.5%), elementary school (139 | 22.8%), and high school (114 | 18.7%).
| School Level | # Students | % Students |
| Nursery / Preschool | 55 | 9.0% |
| Kindergarten | 39 | 6.4% |
| Elementary School | 139 | 22.8% |
| Middle School | 110 | 18.1% |
| High School | 114 | 18.7% |
| College / Undergraduate | 149 | 24.5% |
| Graduate / Professional | 3 | 0.5% |
| Total | 609 | 100.0% |
School Enrollment by Age by Funding Source in Kinsey
Out of a total of 609 students who are enrolled in schools in Kinsey, 47 (7.7%) attend a private institution, while the remaining 562 (92.3%) are enrolled in public schools. The age group of 35 years and over has the highest likelihood of being enrolled in private schools, with 12 (60.0% in the age bracket) enrolled. Conversely, the age group of 25 to 34 year olds has the lowest likelihood of being enrolled in a private school, with 25 (100.0% in the age bracket) attending a public institution.
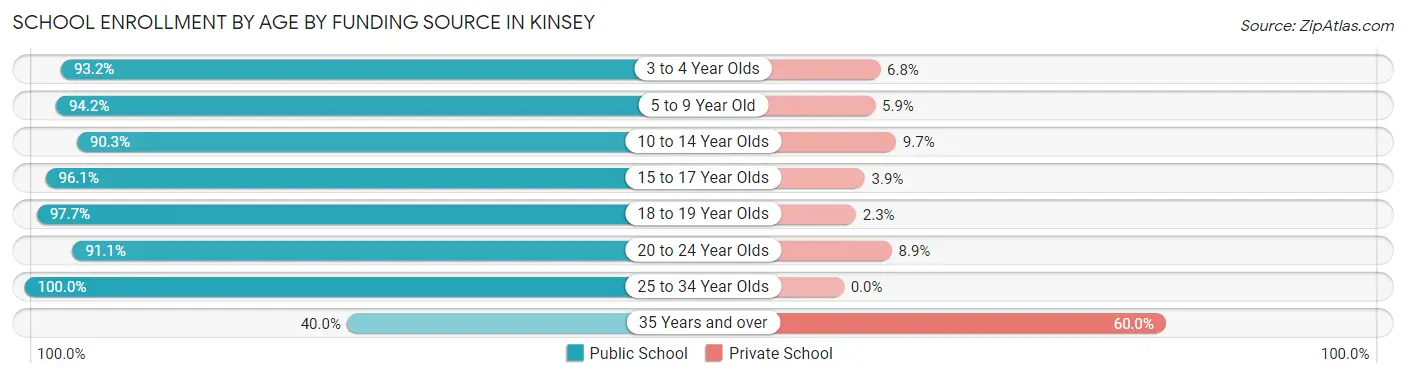
| Age Bracket | Public School | Private School |
| 3 to 4 Year Olds | 55 (93.2%) | 4 (6.8%) |
| 5 to 9 Year Old | 161 (94.2%) | 10 (5.9%) |
| 10 to 14 Year Olds | 102 (90.3%) | 11 (9.7%) |
| 15 to 17 Year Olds | 74 (96.1%) | 3 (3.9%) |
| 18 to 19 Year Olds | 86 (97.7%) | 2 (2.3%) |
| 20 to 24 Year Olds | 51 (91.1%) | 5 (8.9%) |
| 25 to 34 Year Olds | 25 (100.0%) | 0 (0.0%) |
| 35 Years and over | 8 (40.0%) | 12 (60.0%) |
| Total | 562 (92.3%) | 47 (7.7%) |
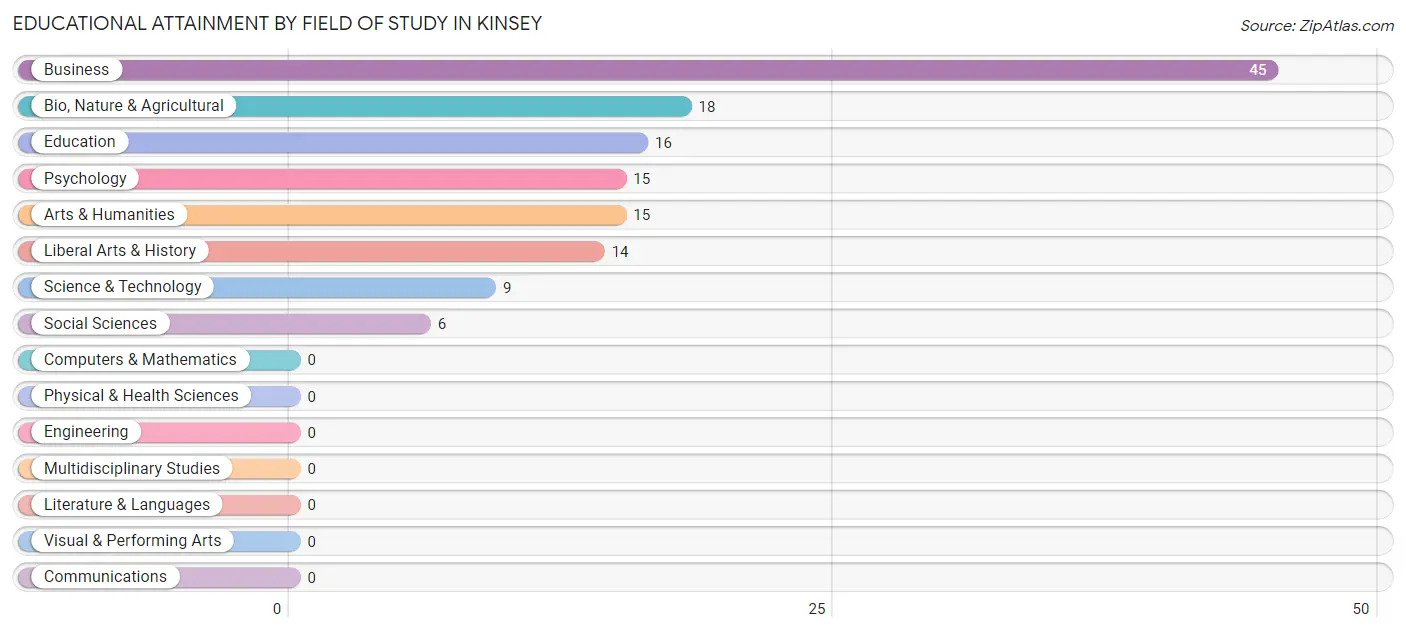
Educational Attainment by Field of Study in Kinsey
Business (45 | 32.6%), bio, nature & agricultural (18 | 13.0%), education (16 | 11.6%), psychology (15 | 10.9%), and arts & humanities (15 | 10.9%) are the most common fields of study among 138 individuals in Kinsey who have obtained a bachelor's degree or higher.
| Field of Study | # Graduates | % Graduates |
| Computers & Mathematics | 0 | 0.0% |
| Bio, Nature & Agricultural | 18 | 13.0% |
| Physical & Health Sciences | 0 | 0.0% |
| Psychology | 15 | 10.9% |
| Social Sciences | 6 | 4.3% |
| Engineering | 0 | 0.0% |
| Multidisciplinary Studies | 0 | 0.0% |
| Science & Technology | 9 | 6.5% |
| Business | 45 | 32.6% |
| Education | 16 | 11.6% |
| Literature & Languages | 0 | 0.0% |
| Liberal Arts & History | 14 | 10.1% |
| Visual & Performing Arts | 0 | 0.0% |
| Communications | 0 | 0.0% |
| Arts & Humanities | 15 | 10.9% |
| Total | 138 | 100.0% |
Transportation & Commute in Kinsey
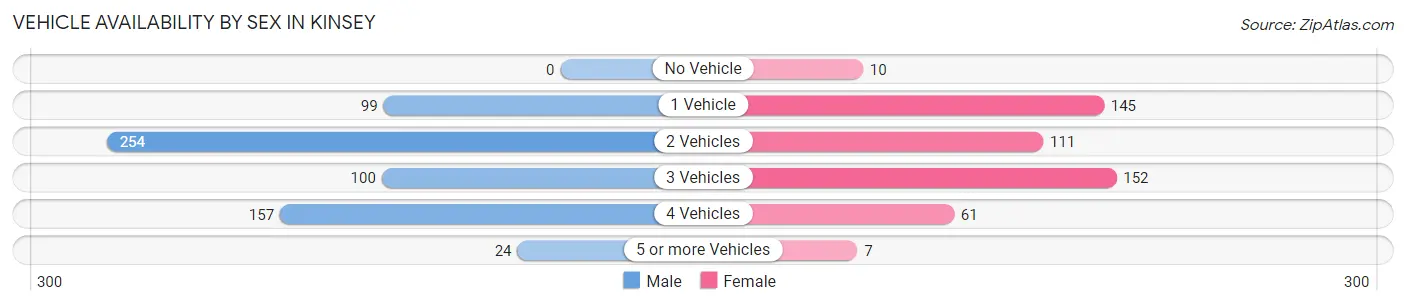
Vehicle Availability by Sex in Kinsey
The most prevalent vehicle ownership categories in Kinsey are males with 2 vehicles (254, accounting for 40.1%) and females with 2 vehicles (111, making up 52.3%).
| Vehicles Available | Male | Female |
| No Vehicle | 0 (0.0%) | 10 (2.1%) |
| 1 Vehicle | 99 (15.6%) | 145 (29.8%) |
| 2 Vehicles | 254 (40.1%) | 111 (22.8%) |
| 3 Vehicles | 100 (15.8%) | 152 (31.3%) |
| 4 Vehicles | 157 (24.8%) | 61 (12.6%) |
| 5 or more Vehicles | 24 (3.8%) | 7 (1.4%) |
| Total | 634 (100.0%) | 486 (100.0%) |
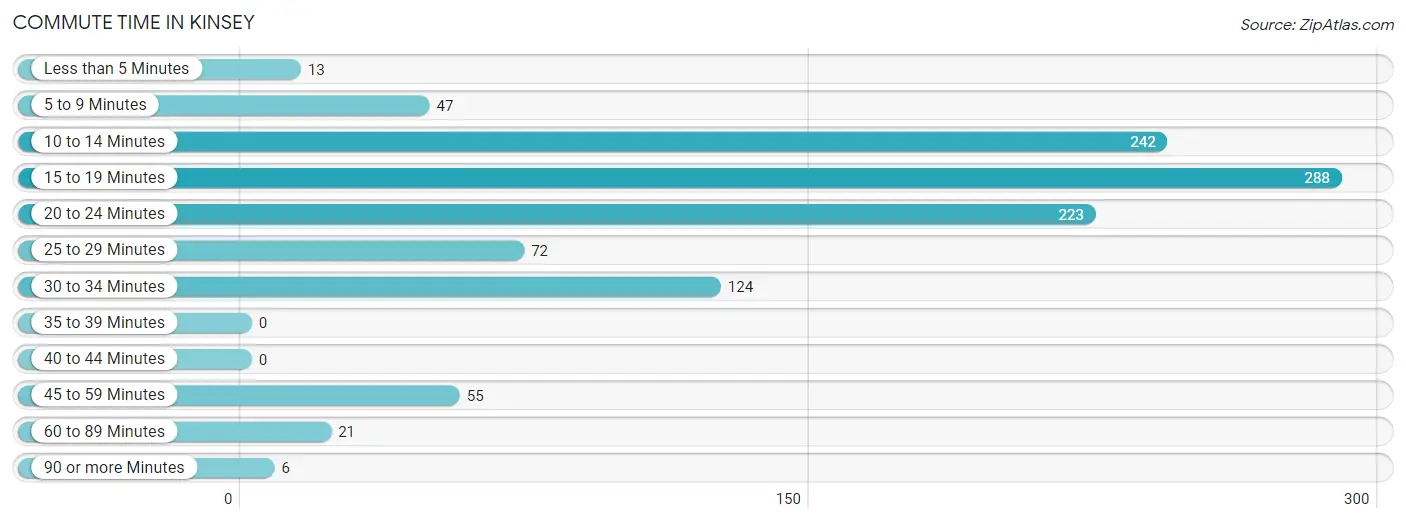
Commute Time in Kinsey
The most frequently occuring commute durations in Kinsey are 15 to 19 minutes (288 commuters, 26.4%), 10 to 14 minutes (242 commuters, 22.2%), and 20 to 24 minutes (223 commuters, 20.4%).
| Commute Time | # Commuters | % Commuters |
| Less than 5 Minutes | 13 | 1.2% |
| 5 to 9 Minutes | 47 | 4.3% |
| 10 to 14 Minutes | 242 | 22.2% |
| 15 to 19 Minutes | 288 | 26.4% |
| 20 to 24 Minutes | 223 | 20.4% |
| 25 to 29 Minutes | 72 | 6.6% |
| 30 to 34 Minutes | 124 | 11.4% |
| 35 to 39 Minutes | 0 | 0.0% |
| 40 to 44 Minutes | 0 | 0.0% |
| 45 to 59 Minutes | 55 | 5.0% |
| 60 to 89 Minutes | 21 | 1.9% |
| 90 or more Minutes | 6 | 0.5% |
Commute Time by Sex in Kinsey
The most common commute times in Kinsey are 10 to 14 minutes (205 commuters, 32.9%) for males and 15 to 19 minutes (190 commuters, 40.7%) for females.
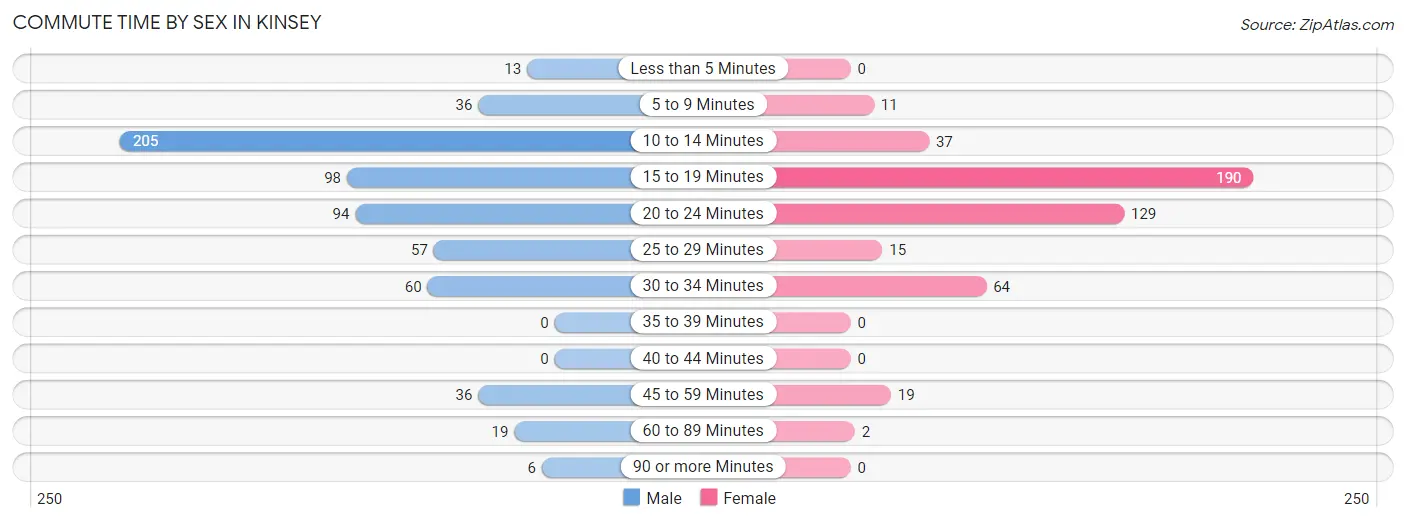
| Commute Time | Male | Female |
| Less than 5 Minutes | 13 (2.1%) | 0 (0.0%) |
| 5 to 9 Minutes | 36 (5.8%) | 11 (2.4%) |
| 10 to 14 Minutes | 205 (32.9%) | 37 (7.9%) |
| 15 to 19 Minutes | 98 (15.7%) | 190 (40.7%) |
| 20 to 24 Minutes | 94 (15.1%) | 129 (27.6%) |
| 25 to 29 Minutes | 57 (9.1%) | 15 (3.2%) |
| 30 to 34 Minutes | 60 (9.6%) | 64 (13.7%) |
| 35 to 39 Minutes | 0 (0.0%) | 0 (0.0%) |
| 40 to 44 Minutes | 0 (0.0%) | 0 (0.0%) |
| 45 to 59 Minutes | 36 (5.8%) | 19 (4.1%) |
| 60 to 89 Minutes | 19 (3.0%) | 2 (0.4%) |
| 90 or more Minutes | 6 (1.0%) | 0 (0.0%) |
Time of Departure to Work by Sex in Kinsey
The most frequent times of departure to work in Kinsey are 12:00 AM to 4:59 AM (135, 21.6%) for males and 7:30 AM to 7:59 AM (95, 20.3%) for females.
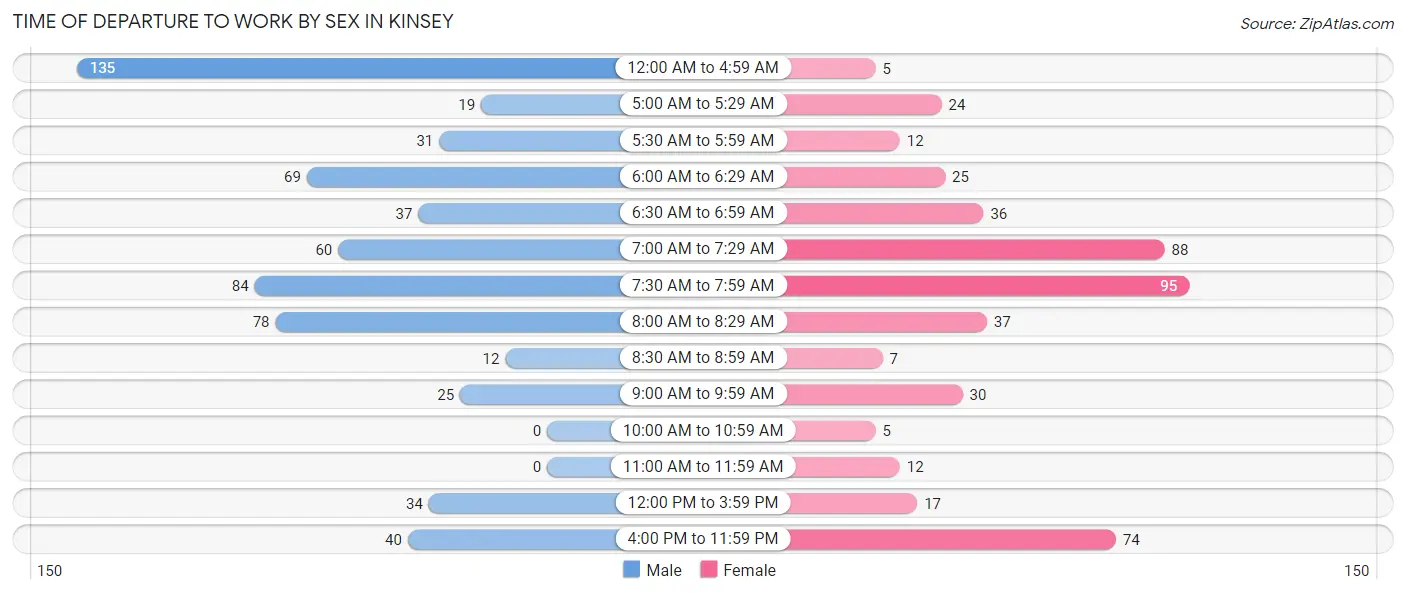
| Time of Departure | Male | Female |
| 12:00 AM to 4:59 AM | 135 (21.6%) | 5 (1.1%) |
| 5:00 AM to 5:29 AM | 19 (3.0%) | 24 (5.1%) |
| 5:30 AM to 5:59 AM | 31 (5.0%) | 12 (2.6%) |
| 6:00 AM to 6:29 AM | 69 (11.1%) | 25 (5.3%) |
| 6:30 AM to 6:59 AM | 37 (5.9%) | 36 (7.7%) |
| 7:00 AM to 7:29 AM | 60 (9.6%) | 88 (18.8%) |
| 7:30 AM to 7:59 AM | 84 (13.5%) | 95 (20.3%) |
| 8:00 AM to 8:29 AM | 78 (12.5%) | 37 (7.9%) |
| 8:30 AM to 8:59 AM | 12 (1.9%) | 7 (1.5%) |
| 9:00 AM to 9:59 AM | 25 (4.0%) | 30 (6.4%) |
| 10:00 AM to 10:59 AM | 0 (0.0%) | 5 (1.1%) |
| 11:00 AM to 11:59 AM | 0 (0.0%) | 12 (2.6%) |
| 12:00 PM to 3:59 PM | 34 (5.4%) | 17 (3.6%) |
| 4:00 PM to 11:59 PM | 40 (6.4%) | 74 (15.9%) |
| Total | 624 (100.0%) | 467 (100.0%) |
Housing Occupancy in Kinsey
Occupancy by Ownership in Kinsey
Of the total 822 dwellings in Kinsey, owner-occupied units account for 604 (73.5%), while renter-occupied units make up 218 (26.5%).
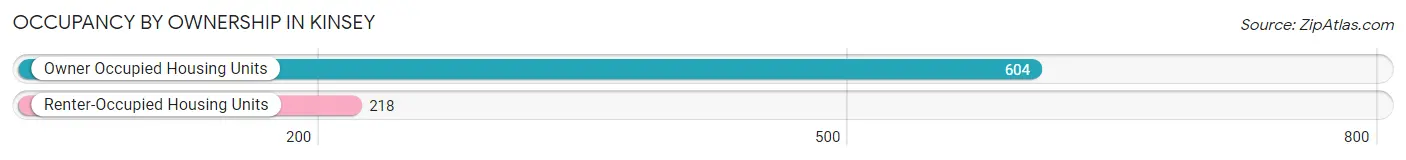
| Occupancy | # Housing Units | % Housing Units |
| Owner Occupied Housing Units | 604 | 73.5% |
| Renter-Occupied Housing Units | 218 | 26.5% |
| Total Occupied Housing Units | 822 | 100.0% |
Occupancy by Household Size in Kinsey
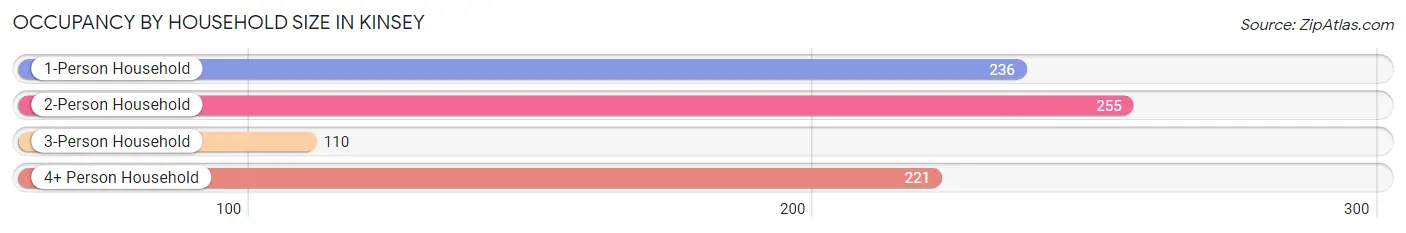
| Household Size | # Housing Units | % Housing Units |
| 1-Person Household | 236 | 28.7% |
| 2-Person Household | 255 | 31.0% |
| 3-Person Household | 110 | 13.4% |
| 4+ Person Household | 221 | 26.9% |
| Total Housing Units | 822 | 100.0% |
Occupancy by Ownership by Household Size in Kinsey
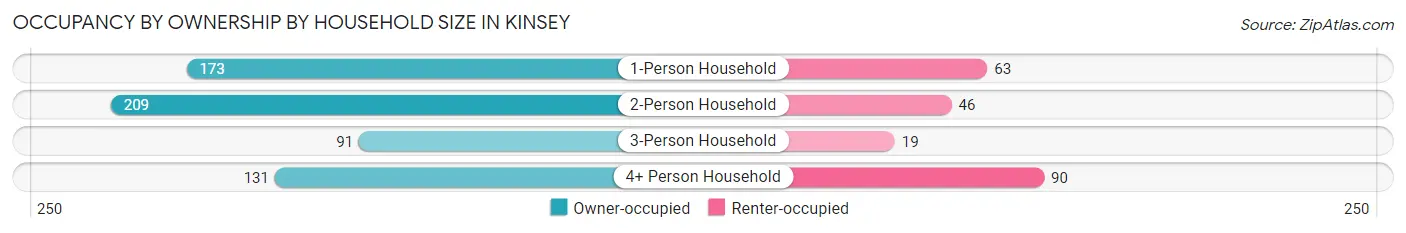
| Household Size | Owner-occupied | Renter-occupied |
| 1-Person Household | 173 (73.3%) | 63 (26.7%) |
| 2-Person Household | 209 (82.0%) | 46 (18.0%) |
| 3-Person Household | 91 (82.7%) | 19 (17.3%) |
| 4+ Person Household | 131 (59.3%) | 90 (40.7%) |
| Total Housing Units | 604 (73.5%) | 218 (26.5%) |
Occupancy by Educational Attainment in Kinsey
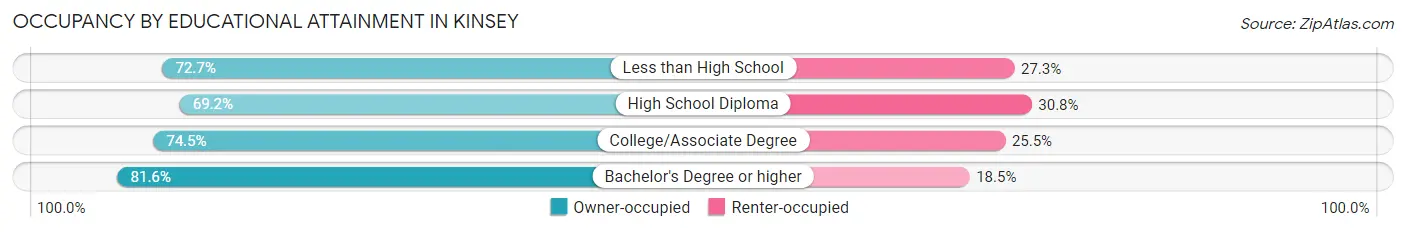
| Household Size | Owner-occupied | Renter-occupied |
| Less than High School | 101 (72.7%) | 38 (27.3%) |
| High School Diploma | 171 (69.2%) | 76 (30.8%) |
| College/Associate Degree | 248 (74.5%) | 85 (25.5%) |
| Bachelor's Degree or higher | 84 (81.6%) | 19 (18.4%) |
Occupancy by Age of Householder in Kinsey
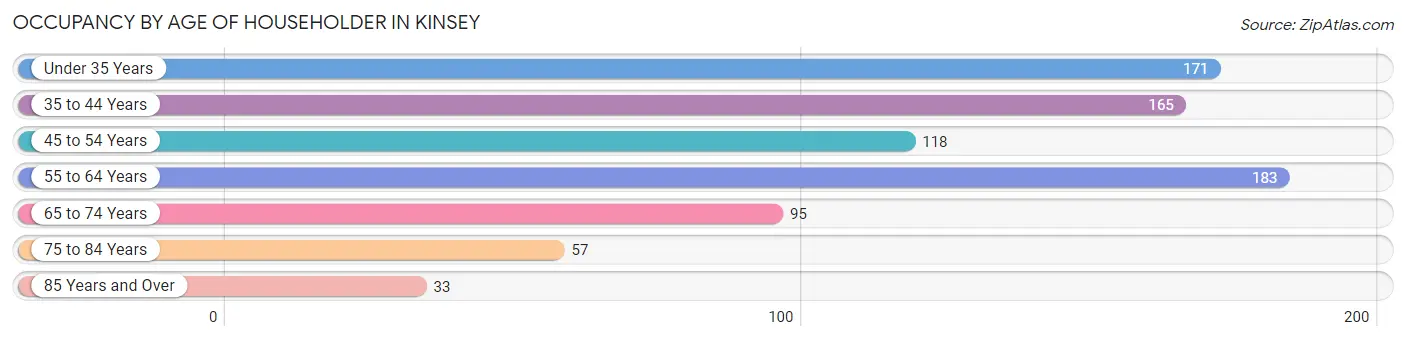
| Age Bracket | # Households | % Households |
| Under 35 Years | 171 | 20.8% |
| 35 to 44 Years | 165 | 20.1% |
| 45 to 54 Years | 118 | 14.4% |
| 55 to 64 Years | 183 | 22.3% |
| 65 to 74 Years | 95 | 11.6% |
| 75 to 84 Years | 57 | 6.9% |
| 85 Years and Over | 33 | 4.0% |
| Total | 822 | 100.0% |
Housing Finances in Kinsey
Median Income by Occupancy in Kinsey
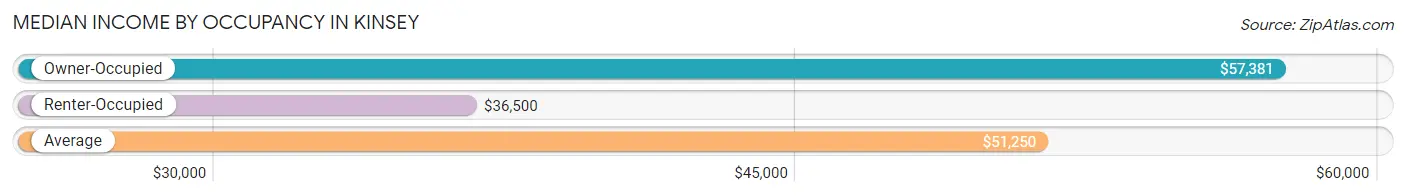
| Occupancy Type | # Households | Median Income |
| Owner-Occupied | 604 (73.5%) | $57,381 |
| Renter-Occupied | 218 (26.5%) | $36,500 |
| Average | 822 (100.0%) | $51,250 |
Occupancy by Householder Income Bracket in Kinsey
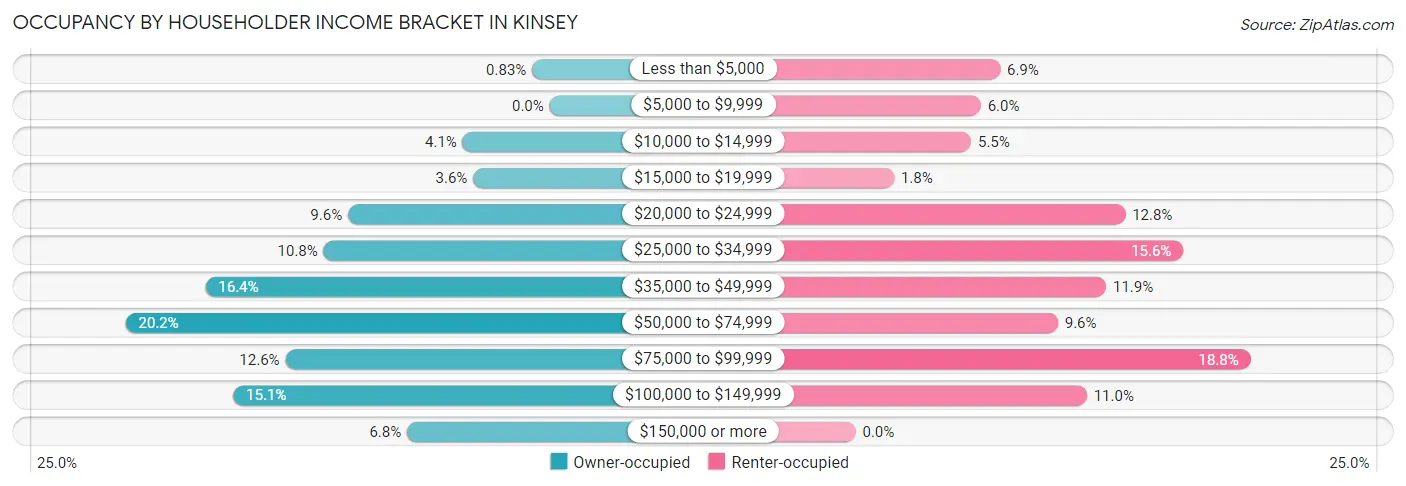
| Income Bracket | Owner-occupied | Renter-occupied |
| Less than $5,000 | 5 (0.8%) | 15 (6.9%) |
| $5,000 to $9,999 | 0 (0.0%) | 13 (6.0%) |
| $10,000 to $14,999 | 25 (4.1%) | 12 (5.5%) |
| $15,000 to $19,999 | 22 (3.6%) | 4 (1.8%) |
| $20,000 to $24,999 | 58 (9.6%) | 28 (12.8%) |
| $25,000 to $34,999 | 65 (10.8%) | 34 (15.6%) |
| $35,000 to $49,999 | 99 (16.4%) | 26 (11.9%) |
| $50,000 to $74,999 | 122 (20.2%) | 21 (9.6%) |
| $75,000 to $99,999 | 76 (12.6%) | 41 (18.8%) |
| $100,000 to $149,999 | 91 (15.1%) | 24 (11.0%) |
| $150,000 or more | 41 (6.8%) | 0 (0.0%) |
| Total | 604 (100.0%) | 218 (100.0%) |
Monthly Housing Cost Tiers in Kinsey
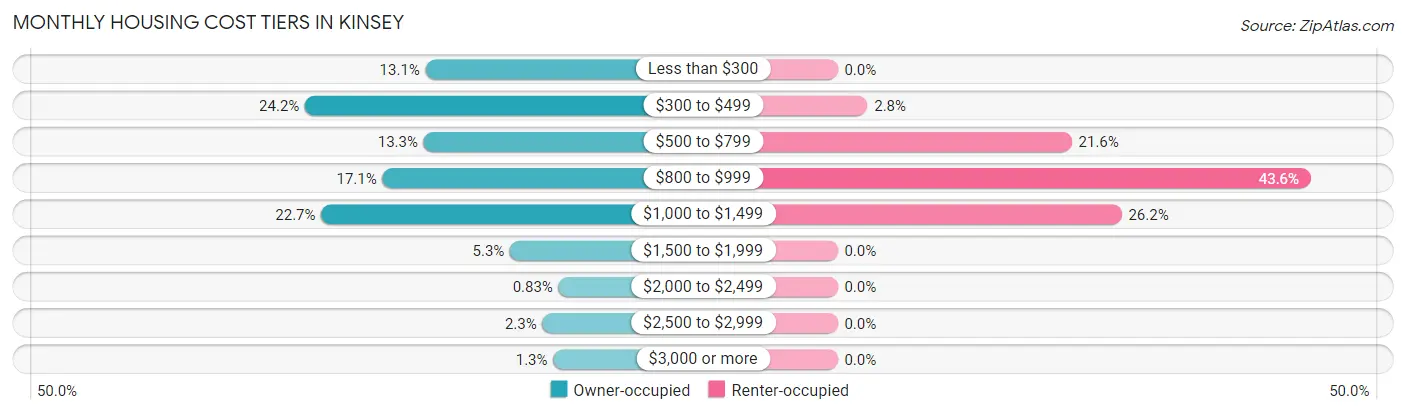
| Monthly Cost | Owner-occupied | Renter-occupied |
| Less than $300 | 79 (13.1%) | 0 (0.0%) |
| $300 to $499 | 146 (24.2%) | 6 (2.8%) |
| $500 to $799 | 80 (13.3%) | 47 (21.6%) |
| $800 to $999 | 103 (17.1%) | 95 (43.6%) |
| $1,000 to $1,499 | 137 (22.7%) | 57 (26.2%) |
| $1,500 to $1,999 | 32 (5.3%) | 0 (0.0%) |
| $2,000 to $2,499 | 5 (0.8%) | 0 (0.0%) |
| $2,500 to $2,999 | 14 (2.3%) | 0 (0.0%) |
| $3,000 or more | 8 (1.3%) | 0 (0.0%) |
| Total | 604 (100.0%) | 218 (100.0%) |
Physical Housing Characteristics in Kinsey
Housing Structures in Kinsey
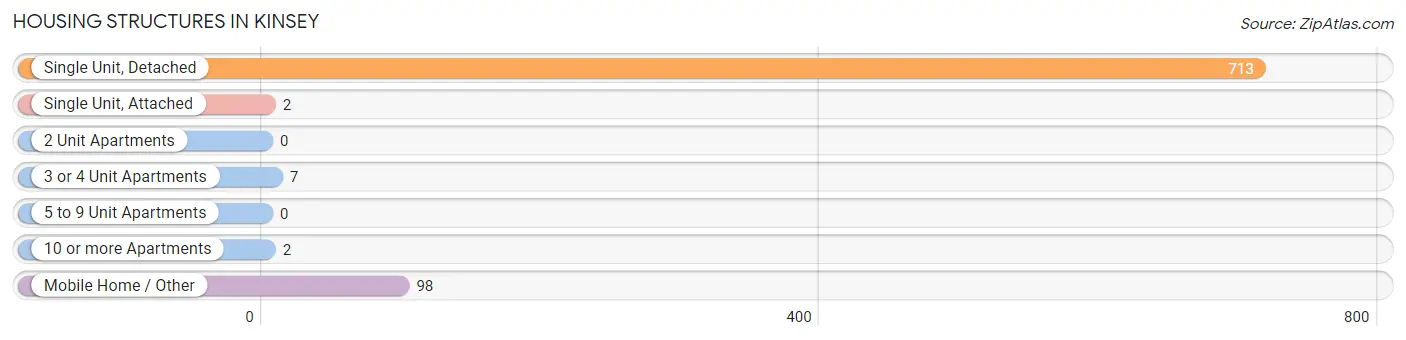
| Structure Type | # Housing Units | % Housing Units |
| Single Unit, Detached | 713 | 86.7% |
| Single Unit, Attached | 2 | 0.2% |
| 2 Unit Apartments | 0 | 0.0% |
| 3 or 4 Unit Apartments | 7 | 0.9% |
| 5 to 9 Unit Apartments | 0 | 0.0% |
| 10 or more Apartments | 2 | 0.2% |
| Mobile Home / Other | 98 | 11.9% |
| Total | 822 | 100.0% |
Housing Structures by Occupancy in Kinsey
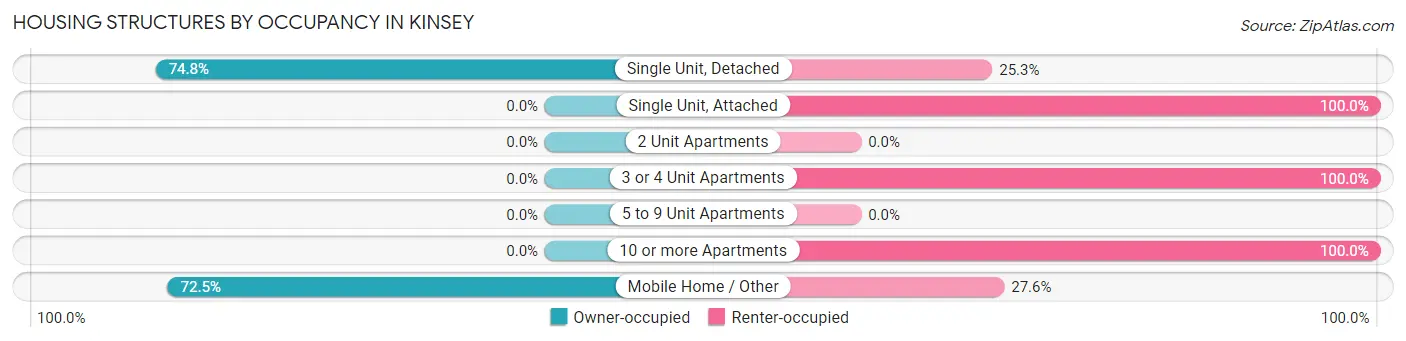
| Structure Type | Owner-occupied | Renter-occupied |
| Single Unit, Detached | 533 (74.8%) | 180 (25.3%) |
| Single Unit, Attached | 0 (0.0%) | 2 (100.0%) |
| 2 Unit Apartments | 0 (0.0%) | 0 (0.0%) |
| 3 or 4 Unit Apartments | 0 (0.0%) | 7 (100.0%) |
| 5 to 9 Unit Apartments | 0 (0.0%) | 0 (0.0%) |
| 10 or more Apartments | 0 (0.0%) | 2 (100.0%) |
| Mobile Home / Other | 71 (72.5%) | 27 (27.6%) |
| Total | 604 (73.5%) | 218 (26.5%) |
Housing Structures by Number of Rooms in Kinsey
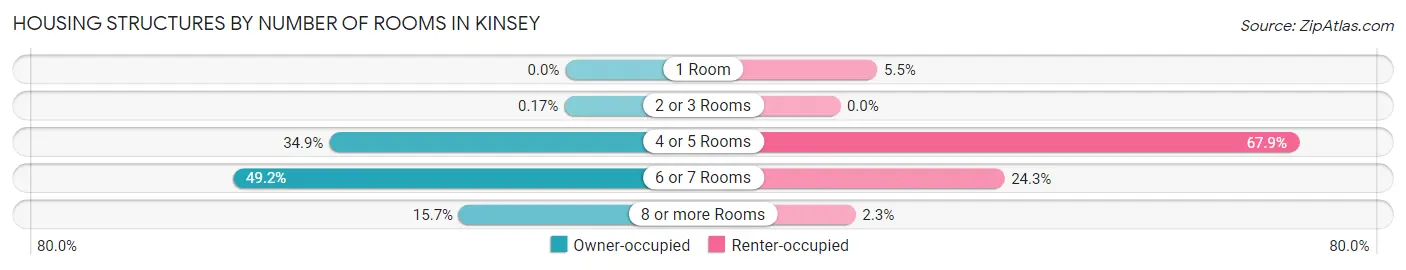
| Number of Rooms | Owner-occupied | Renter-occupied |
| 1 Room | 0 (0.0%) | 12 (5.5%) |
| 2 or 3 Rooms | 1 (0.2%) | 0 (0.0%) |
| 4 or 5 Rooms | 211 (34.9%) | 148 (67.9%) |
| 6 or 7 Rooms | 297 (49.2%) | 53 (24.3%) |
| 8 or more Rooms | 95 (15.7%) | 5 (2.3%) |
| Total | 604 (100.0%) | 218 (100.0%) |
Housing Structure by Heating Type in Kinsey
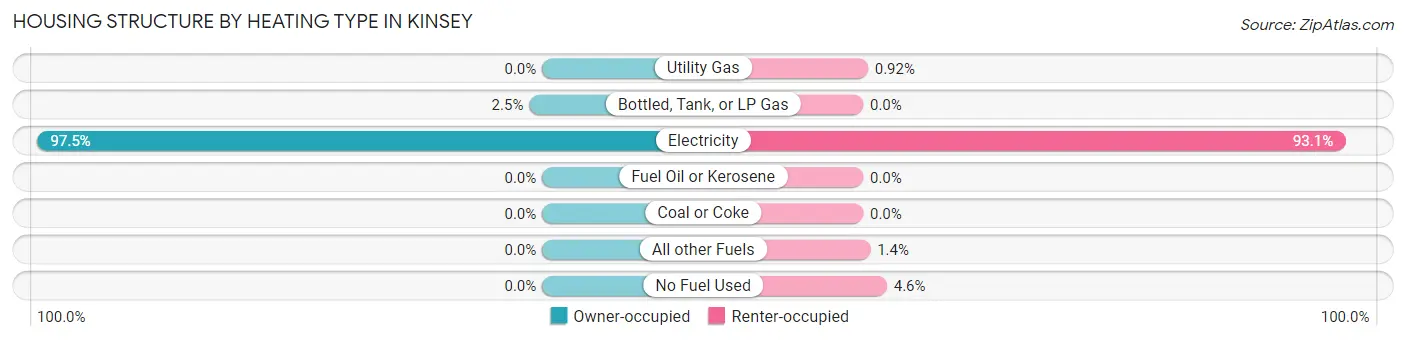
| Heating Type | Owner-occupied | Renter-occupied |
| Utility Gas | 0 (0.0%) | 2 (0.9%) |
| Bottled, Tank, or LP Gas | 15 (2.5%) | 0 (0.0%) |
| Electricity | 589 (97.5%) | 203 (93.1%) |
| Fuel Oil or Kerosene | 0 (0.0%) | 0 (0.0%) |
| Coal or Coke | 0 (0.0%) | 0 (0.0%) |
| All other Fuels | 0 (0.0%) | 3 (1.4%) |
| No Fuel Used | 0 (0.0%) | 10 (4.6%) |
| Total | 604 (100.0%) | 218 (100.0%) |
Household Vehicle Usage in Kinsey
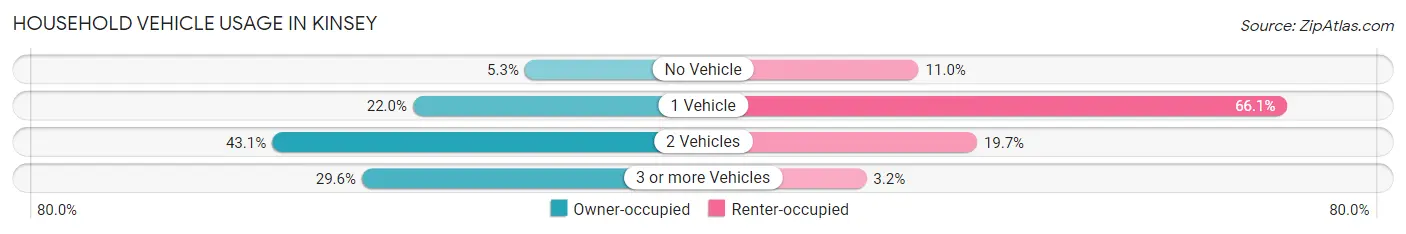
| Vehicles per Household | Owner-occupied | Renter-occupied |
| No Vehicle | 32 (5.3%) | 24 (11.0%) |
| 1 Vehicle | 133 (22.0%) | 144 (66.1%) |
| 2 Vehicles | 260 (43.0%) | 43 (19.7%) |
| 3 or more Vehicles | 179 (29.6%) | 7 (3.2%) |
| Total | 604 (100.0%) | 218 (100.0%) |
Real Estate & Mortgages in Kinsey
Real Estate and Mortgage Overview in Kinsey
| Characteristic | Without Mortgage | With Mortgage |
| Housing Units | 231 | 373 |
| Median Property Value | $91,300 | $122,300 |
| Median Household Income | $40,179 | $34 |
| Monthly Housing Costs | $357 | $5 |
| Real Estate Taxes | $235 | $46 |
Property Value by Mortgage Status in Kinsey
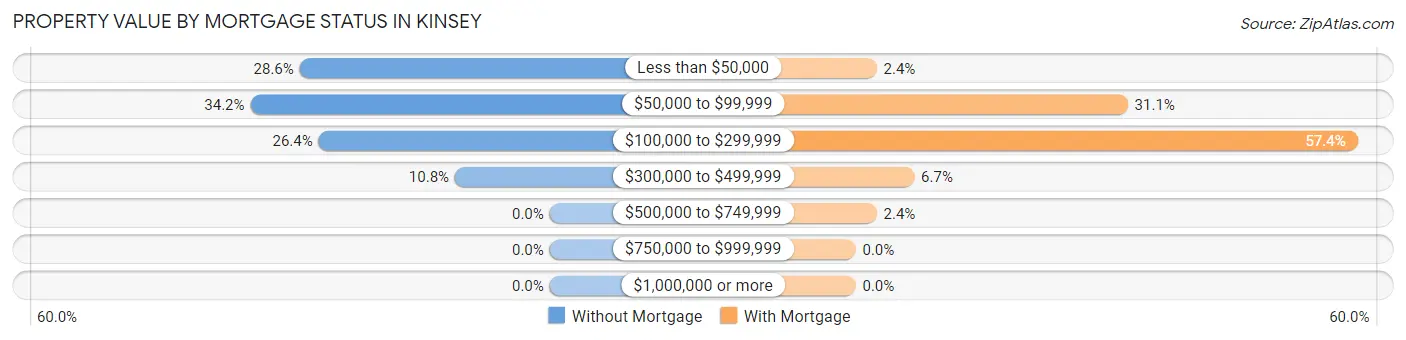
| Property Value | Without Mortgage | With Mortgage |
| Less than $50,000 | 66 (28.6%) | 9 (2.4%) |
| $50,000 to $99,999 | 79 (34.2%) | 116 (31.1%) |
| $100,000 to $299,999 | 61 (26.4%) | 214 (57.4%) |
| $300,000 to $499,999 | 25 (10.8%) | 25 (6.7%) |
| $500,000 to $749,999 | 0 (0.0%) | 9 (2.4%) |
| $750,000 to $999,999 | 0 (0.0%) | 0 (0.0%) |
| $1,000,000 or more | 0 (0.0%) | 0 (0.0%) |
| Total | 231 (100.0%) | 373 (100.0%) |
Household Income by Mortgage Status in Kinsey
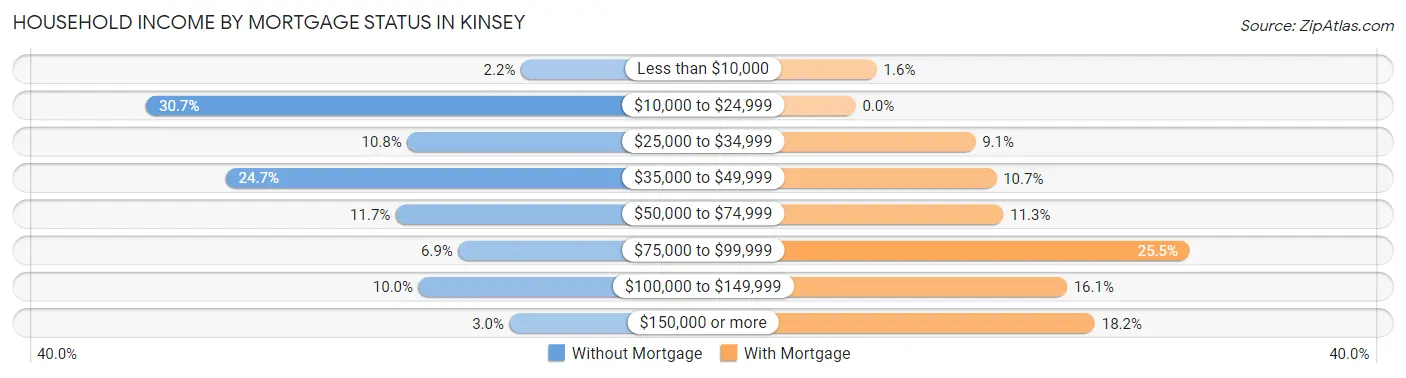
| Household Income | Without Mortgage | With Mortgage |
| Less than $10,000 | 5 (2.2%) | 6 (1.6%) |
| $10,000 to $24,999 | 71 (30.7%) | 0 (0.0%) |
| $25,000 to $34,999 | 25 (10.8%) | 34 (9.1%) |
| $35,000 to $49,999 | 57 (24.7%) | 40 (10.7%) |
| $50,000 to $74,999 | 27 (11.7%) | 42 (11.3%) |
| $75,000 to $99,999 | 16 (6.9%) | 95 (25.5%) |
| $100,000 to $149,999 | 23 (10.0%) | 60 (16.1%) |
| $150,000 or more | 7 (3.0%) | 68 (18.2%) |
| Total | 231 (100.0%) | 373 (100.0%) |
Property Value to Household Income Ratio in Kinsey
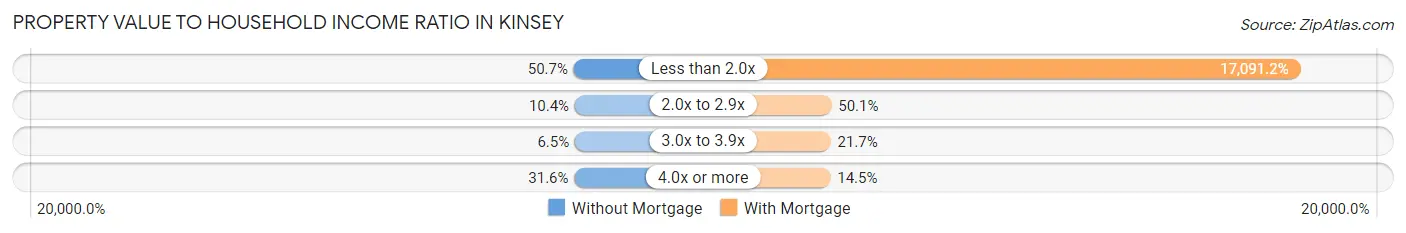
| Value-to-Income Ratio | Without Mortgage | With Mortgage |
| Less than 2.0x | 117 (50.6%) | 63,750 (17,091.1%) |
| 2.0x to 2.9x | 24 (10.4%) | 187 (50.1%) |
| 3.0x to 3.9x | 15 (6.5%) | 81 (21.7%) |
| 4.0x or more | 73 (31.6%) | 54 (14.5%) |
| Total | 231 (100.0%) | 373 (100.0%) |
Real Estate Taxes by Mortgage Status in Kinsey
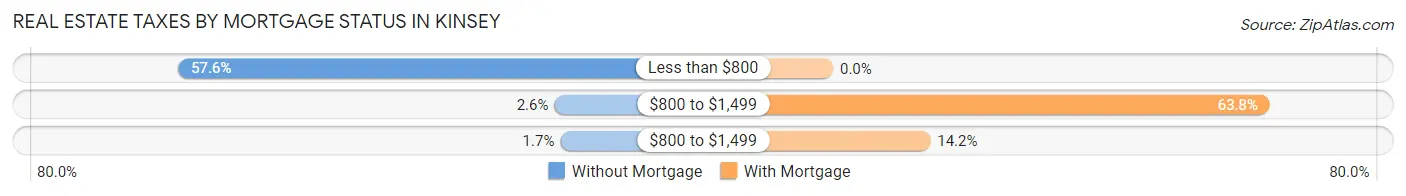
| Property Taxes | Without Mortgage | With Mortgage |
| Less than $800 | 133 (57.6%) | 0 (0.0%) |
| $800 to $1,499 | 6 (2.6%) | 238 (63.8%) |
| $800 to $1,499 | 4 (1.7%) | 53 (14.2%) |
| Total | 231 (100.0%) | 373 (100.0%) |
Health & Disability in Kinsey
Health Insurance Coverage by Age in Kinsey
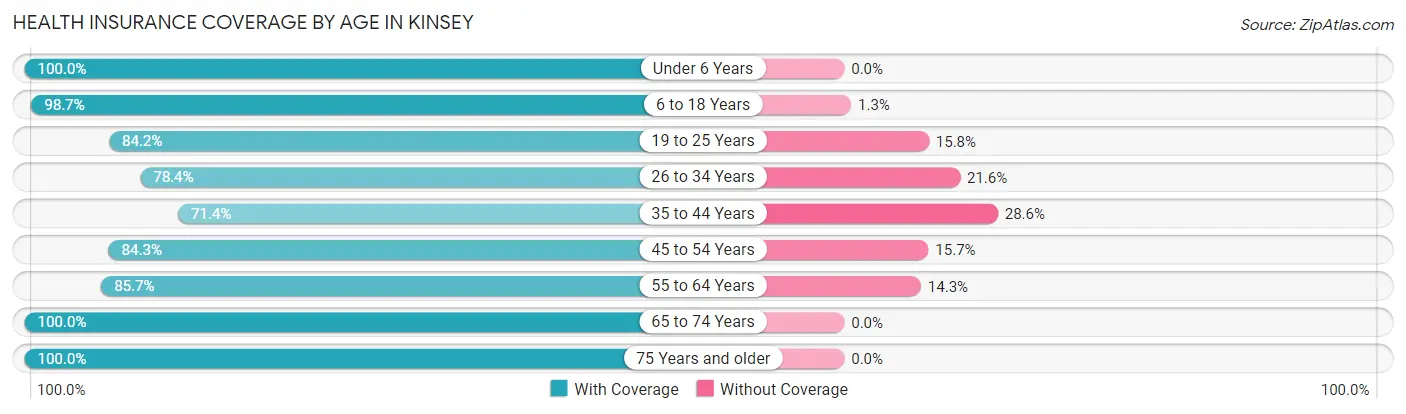
| Age Bracket | With Coverage | Without Coverage |
| Under 6 Years | 203 (100.0%) | 0 (0.0%) |
| 6 to 18 Years | 388 (98.7%) | 5 (1.3%) |
| 19 to 25 Years | 203 (84.2%) | 38 (15.8%) |
| 26 to 34 Years | 258 (78.4%) | 71 (21.6%) |
| 35 to 44 Years | 192 (71.4%) | 77 (28.6%) |
| 45 to 54 Years | 199 (84.3%) | 37 (15.7%) |
| 55 to 64 Years | 258 (85.7%) | 43 (14.3%) |
| 65 to 74 Years | 151 (100.0%) | 0 (0.0%) |
| 75 Years and older | 121 (100.0%) | 0 (0.0%) |
| Total | 1,973 (87.9%) | 271 (12.1%) |
Health Insurance Coverage by Citizenship Status in Kinsey
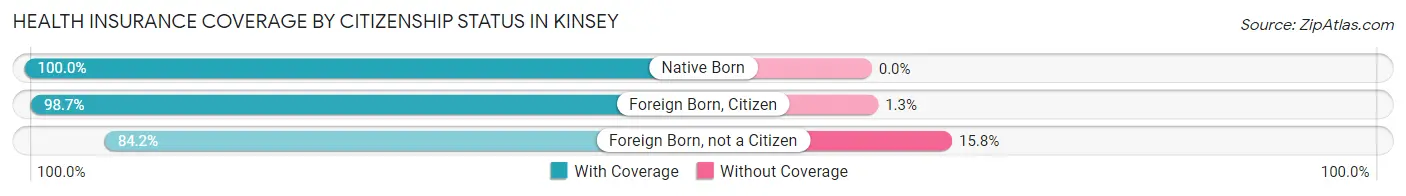
| Citizenship Status | With Coverage | Without Coverage |
| Native Born | 203 (100.0%) | 0 (0.0%) |
| Foreign Born, Citizen | 388 (98.7%) | 5 (1.3%) |
| Foreign Born, not a Citizen | 203 (84.2%) | 38 (15.8%) |
Health Insurance Coverage by Household Income in Kinsey
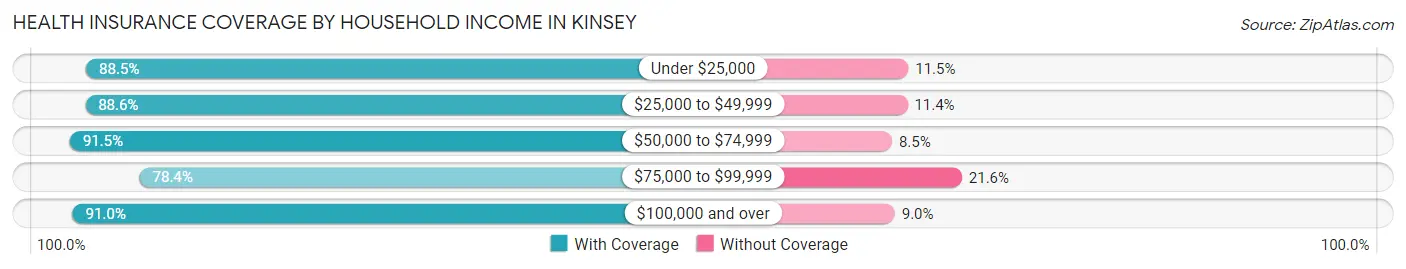
| Household Income | With Coverage | Without Coverage |
| Under $25,000 | 284 (88.5%) | 37 (11.5%) |
| $25,000 to $49,999 | 546 (88.6%) | 70 (11.4%) |
| $50,000 to $74,999 | 335 (91.5%) | 31 (8.5%) |
| $75,000 to $99,999 | 302 (78.4%) | 83 (21.6%) |
| $100,000 and over | 506 (91.0%) | 50 (9.0%) |
Public vs Private Health Insurance Coverage by Age in Kinsey
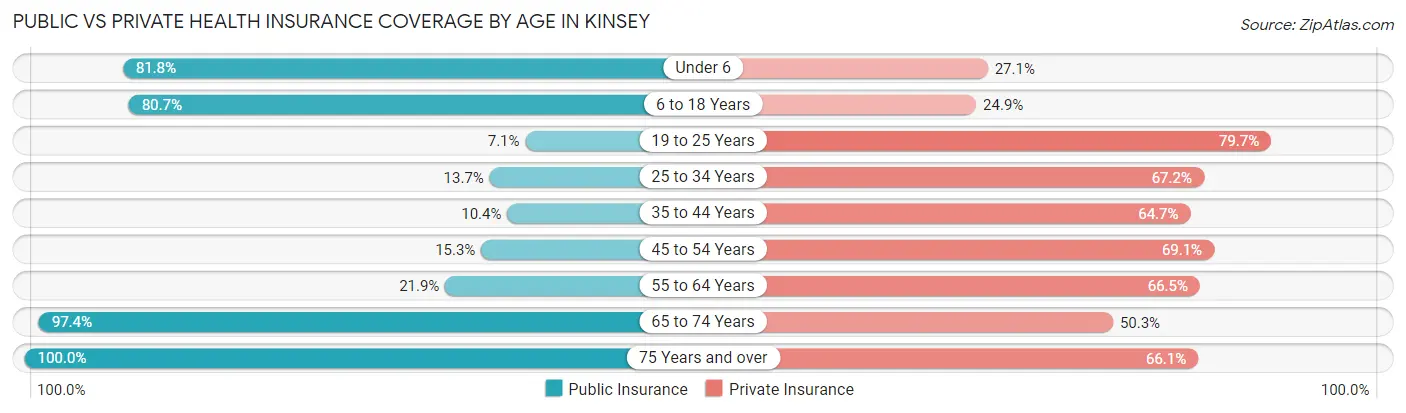
| Age Bracket | Public Insurance | Private Insurance |
| Under 6 | 166 (81.8%) | 55 (27.1%) |
| 6 to 18 Years | 317 (80.7%) | 98 (24.9%) |
| 19 to 25 Years | 17 (7.0%) | 192 (79.7%) |
| 25 to 34 Years | 45 (13.7%) | 221 (67.2%) |
| 35 to 44 Years | 28 (10.4%) | 174 (64.7%) |
| 45 to 54 Years | 36 (15.2%) | 163 (69.1%) |
| 55 to 64 Years | 66 (21.9%) | 200 (66.4%) |
| 65 to 74 Years | 147 (97.4%) | 76 (50.3%) |
| 75 Years and over | 121 (100.0%) | 80 (66.1%) |
| Total | 943 (42.0%) | 1,259 (56.1%) |
Disability Status by Sex by Age in Kinsey
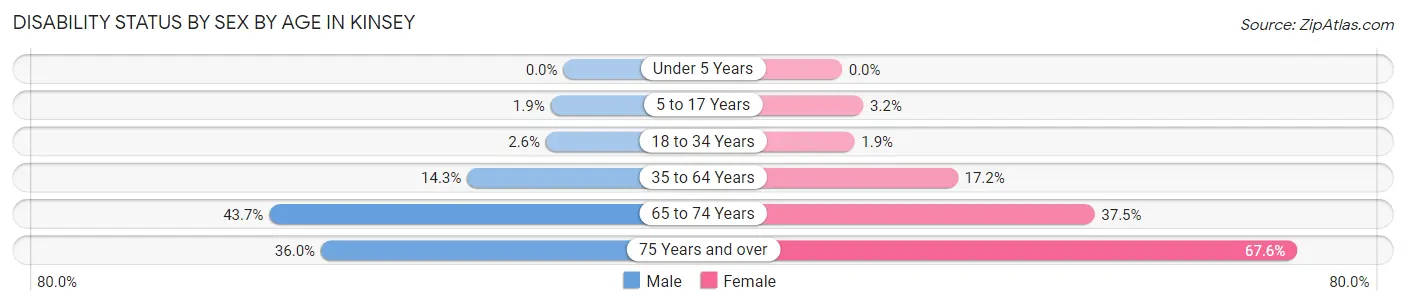
| Age Bracket | Male | Female |
| Under 5 Years | 0 (0.0%) | 0 (0.0%) |
| 5 to 17 Years | 3 (1.9%) | 7 (3.2%) |
| 18 to 34 Years | 9 (2.6%) | 5 (1.9%) |
| 35 to 64 Years | 52 (14.3%) | 76 (17.2%) |
| 65 to 74 Years | 38 (43.7%) | 24 (37.5%) |
| 75 Years and over | 18 (36.0%) | 48 (67.6%) |
Disability Class by Sex by Age in Kinsey
Disability Class: Hearing Difficulty
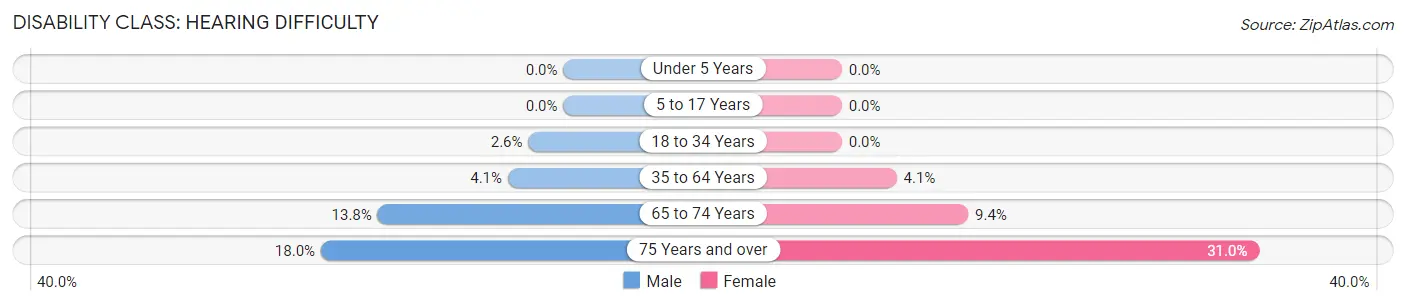
| Age Bracket | Male | Female |
| Under 5 Years | 0 (0.0%) | 0 (0.0%) |
| 5 to 17 Years | 0 (0.0%) | 0 (0.0%) |
| 18 to 34 Years | 9 (2.6%) | 0 (0.0%) |
| 35 to 64 Years | 15 (4.1%) | 18 (4.1%) |
| 65 to 74 Years | 12 (13.8%) | 6 (9.4%) |
| 75 Years and over | 9 (18.0%) | 22 (31.0%) |
Disability Class: Vision Difficulty
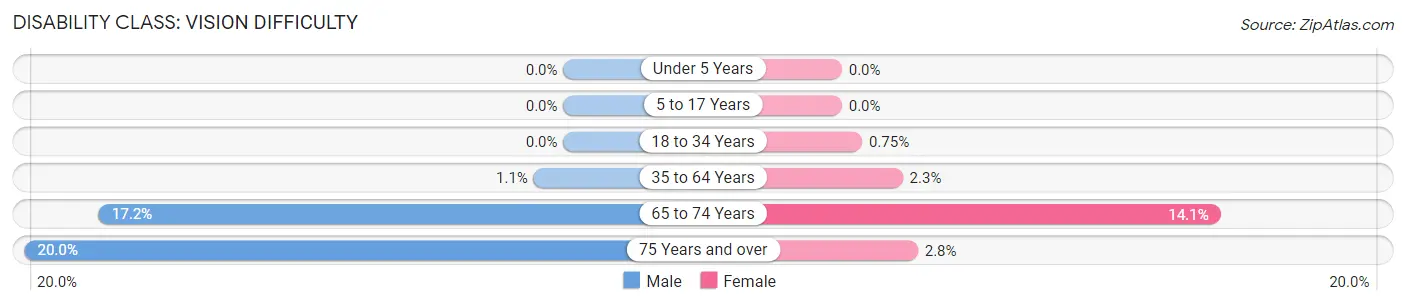
| Age Bracket | Male | Female |
| Under 5 Years | 0 (0.0%) | 0 (0.0%) |
| 5 to 17 Years | 0 (0.0%) | 0 (0.0%) |
| 18 to 34 Years | 0 (0.0%) | 2 (0.7%) |
| 35 to 64 Years | 4 (1.1%) | 10 (2.3%) |
| 65 to 74 Years | 15 (17.2%) | 9 (14.1%) |
| 75 Years and over | 10 (20.0%) | 2 (2.8%) |
Disability Class: Cognitive Difficulty
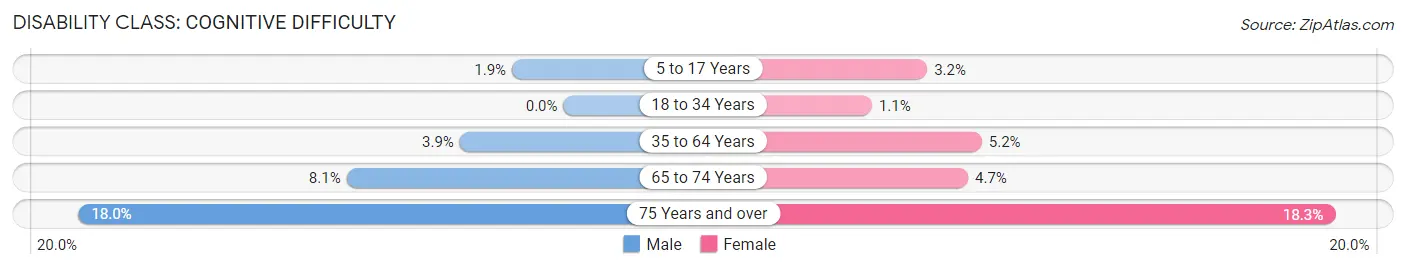
| Age Bracket | Male | Female |
| 5 to 17 Years | 3 (1.9%) | 7 (3.2%) |
| 18 to 34 Years | 0 (0.0%) | 3 (1.1%) |
| 35 to 64 Years | 14 (3.8%) | 23 (5.2%) |
| 65 to 74 Years | 7 (8.1%) | 3 (4.7%) |
| 75 Years and over | 9 (18.0%) | 13 (18.3%) |
Disability Class: Ambulatory Difficulty
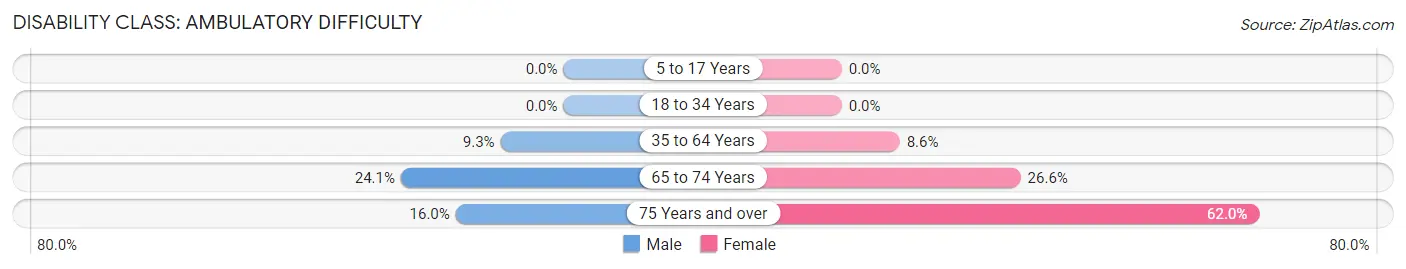
| Age Bracket | Male | Female |
| 5 to 17 Years | 0 (0.0%) | 0 (0.0%) |
| 18 to 34 Years | 0 (0.0%) | 0 (0.0%) |
| 35 to 64 Years | 34 (9.3%) | 38 (8.6%) |
| 65 to 74 Years | 21 (24.1%) | 17 (26.6%) |
| 75 Years and over | 8 (16.0%) | 44 (62.0%) |
Disability Class: Self-Care Difficulty
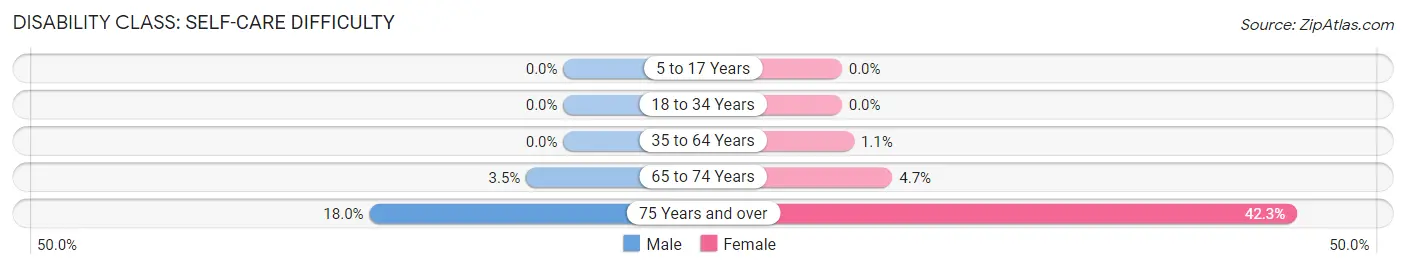
| Age Bracket | Male | Female |
| 5 to 17 Years | 0 (0.0%) | 0 (0.0%) |
| 18 to 34 Years | 0 (0.0%) | 0 (0.0%) |
| 35 to 64 Years | 0 (0.0%) | 5 (1.1%) |
| 65 to 74 Years | 3 (3.5%) | 3 (4.7%) |
| 75 Years and over | 9 (18.0%) | 30 (42.2%) |
Technology Access in Kinsey
Computing Device Access in Kinsey
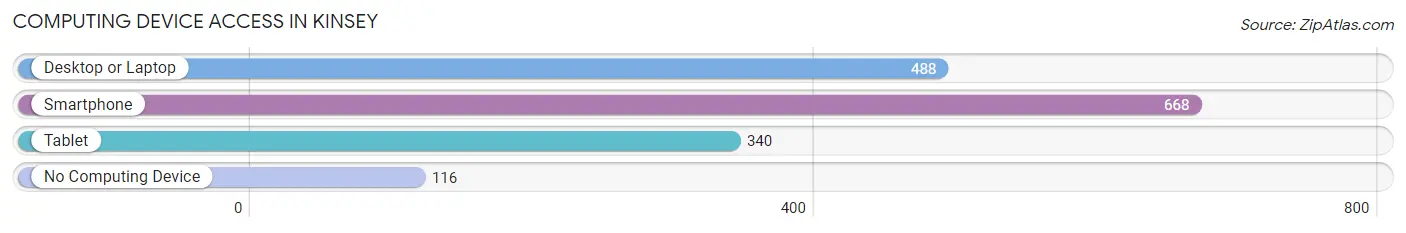
| Device Type | # Households | % Households |
| Desktop or Laptop | 488 | 59.4% |
| Smartphone | 668 | 81.3% |
| Tablet | 340 | 41.4% |
| No Computing Device | 116 | 14.1% |
| Total | 822 | 100.0% |
Internet Access in Kinsey
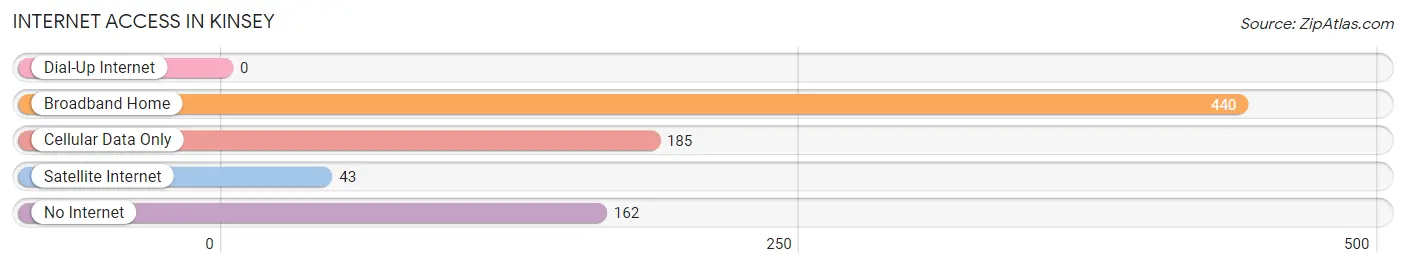
| Internet Type | # Households | % Households |
| Dial-Up Internet | 0 | 0.0% |
| Broadband Home | 440 | 53.5% |
| Cellular Data Only | 185 | 22.5% |
| Satellite Internet | 43 | 5.2% |
| No Internet | 162 | 19.7% |
| Total | 822 | 100.0% |
Kinsey Summary
History
Kinsey, Alabama is a small town located in the southeastern corner of the state, in Conecuh County. It was founded in 1883 by a group of settlers from Georgia, who named the town after their leader, William Kinsey. The town was originally a farming community, and the main crops grown were cotton, corn, and peanuts. In the early 1900s, the town began to grow and develop, and by the 1920s, it had become a thriving community with a population of over 500 people.
The town was home to several businesses, including a general store, a sawmill, a grist mill, and a cotton gin. The town also had a school, a post office, and a church. In the 1930s, the Great Depression hit the town hard, and many of the businesses closed. However, the town was able to survive, and by the 1940s, it had recovered and was once again a thriving community.
In the 1950s, the town began to experience a period of growth and development. The population increased, and new businesses opened, including a grocery store, a hardware store, and a bank. The town also had a movie theater, a bowling alley, and a library.
In the 1960s, the town experienced a period of decline, as many of the businesses closed and the population decreased. However, in the 1970s, the town began to experience a resurgence, and by the 1980s, it had become a thriving community once again.
Geography
Kinsey is located in the southeastern corner of Alabama, in Conecuh County. It is situated on the banks of the Conecuh River, and is surrounded by rolling hills and forests. The town is located about 30 miles from the Gulf of Mexico, and is about an hour’s drive from Mobile, Alabama.
The climate in Kinsey is humid subtropical, with hot, humid summers and mild winters. The average annual temperature is around 70 degrees Fahrenheit, and the average annual precipitation is around 50 inches.
Economy
The economy of Kinsey is largely based on agriculture. The main crops grown in the area are cotton, corn, and peanuts. The town also has a few small businesses, including a grocery store, a hardware store, and a bank.
The town is also home to a few manufacturing companies, including a furniture factory and a paper mill. The town also has a few tourist attractions, including a museum and a historic district.
Demographics
As of the 2010 census, the population of Kinsey was 1,845. The racial makeup of the town was 79.3% White, 19.2% African American, 0.3% Native American, 0.2% Asian, and 0.9% from other races. The median household income was $30,938, and the median family income was $37,813.
The town is served by the Conecuh County School District, which includes two elementary schools, a middle school, and a high school. The town also has a library and a museum.
Conclusion
Kinsey, Alabama is a small town located in the southeastern corner of the state, in Conecuh County. It was founded in 1883 by a group of settlers from Georgia, and has since become a thriving community. The town’s economy is largely based on agriculture, and it also has a few small businesses and tourist attractions. The population of Kinsey is 1,845, and the town is served by the Conecuh County School District.
Common Questions
What is the Total Population of Kinsey?
Total Population of Kinsey is 2,254.
What is the Total Male Population of Kinsey?
Total Male Population of Kinsey is 1,122.
What is the Total Female Population of Kinsey?
Total Female Population of Kinsey is 1,132.
What is the Ratio of Males per 100 Females in Kinsey?
There are 99.12 Males per 100 Females in Kinsey.
What is the Ratio of Females per 100 Males in Kinsey?
There are 100.89 Females per 100 Males in Kinsey.
What is the Median Population Age in Kinsey?
Median Population Age in Kinsey is 33.9 Years.
What is the Average Family Size in Kinsey
Average Family Size in Kinsey is 3.4 People.
What is the Average Household Size in Kinsey
Average Household Size in Kinsey is 2.7 People.
What is Per Capita Income in Kinsey?
Per Capita income in Kinsey is $24,466.
What is the Median Family Income in Kinsey?
Median Family Income in Kinsey is $58,594.
What is the Median Household income in Kinsey?
Median Household Income in Kinsey is $51,250.
What is Income or Wage Gap in Kinsey?
Income or Wage Gap in Kinsey is 26.0%.
Women in Kinsey earn 74.0 cents for every dollar earned by a man.
What is Family Income Deficit in Kinsey?
Family Income Deficit in Kinsey is $8,906.
Families that are below poverty line in Kinsey earn $8,906 less on average than the poverty threshold level.
What is Inequality or Gini Index in Kinsey?
Inequality or Gini Index in Kinsey is 0.39.
How Large is the Labor Force in Kinsey?
There are 1,190 People in the Labor Forcein in Kinsey.
What is the Percentage of People in the Labor Force in Kinsey?
67.8% of People are in the Labor Force in Kinsey.
What is the Unemployment Rate in Kinsey?
Unemployment Rate in Kinsey is 4.6%.