Hilltop, WV
Hilltop Map
Hilltop Overview
603
TOTAL POPULATION
252
MALE POPULATION
351
FEMALE POPULATION
71.79
MALES / 100 FEMALES
139.29
FEMALES / 100 MALES
48.8
MEDIAN AGE
3.0
AVG FAMILY SIZE
2.6
AVG HOUSEHOLD SIZE
$22,015
PER CAPITA INCOME
0.39
INEQUALITY / GINI INDEX
229
LABOR FORCE [ PEOPLE ]
40.3%
PERCENT IN LABOR FORCE
12.7%
UNEMPLOYMENT RATE
Hilltop Zip Codes
Hilltop Area Codes
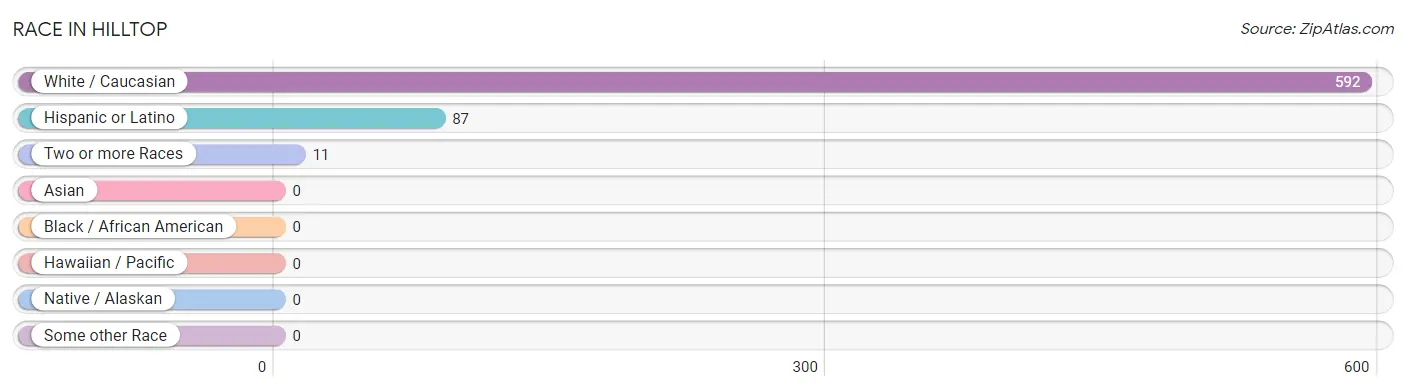
Race in Hilltop
The most populous races in Hilltop are White / Caucasian (592 | 98.2%), Hispanic or Latino (87 | 14.4%), and Two or more Races (11 | 1.8%).
| Race | # Population | % Population |
| Asian | 0 | 0.0% |
| Black / African American | 0 | 0.0% |
| Hawaiian / Pacific | 0 | 0.0% |
| Hispanic or Latino | 87 | 14.4% |
| Native / Alaskan | 0 | 0.0% |
| White / Caucasian | 592 | 98.2% |
| Two or more Races | 11 | 1.8% |
| Some other Race | 0 | 0.0% |
| Total | 603 | 100.0% |
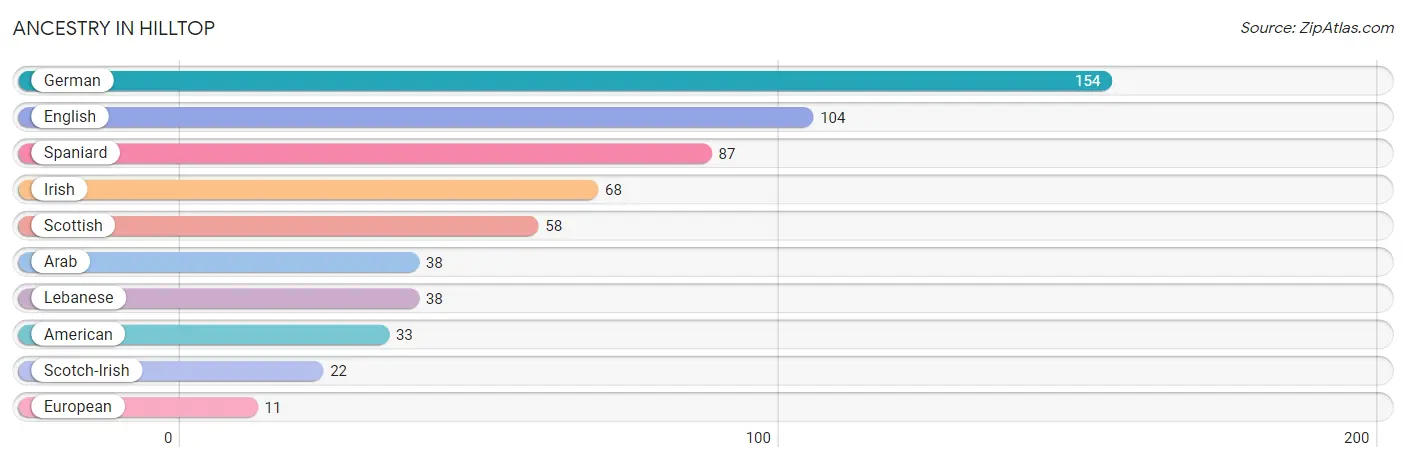
Ancestry in Hilltop
The most populous ancestries reported in Hilltop are German (154 | 25.5%), English (104 | 17.2%), Spaniard (87 | 14.4%), Irish (68 | 11.3%), and Scottish (58 | 9.6%), together accounting for 78.1% of all Hilltop residents.
| Ancestry | # Population | % Population |
| American | 33 | 5.5% |
| Arab | 38 | 6.3% |
| English | 104 | 17.2% |
| European | 11 | 1.8% |
| German | 154 | 25.5% |
| Irish | 68 | 11.3% |
| Lebanese | 38 | 6.3% |
| Scotch-Irish | 22 | 3.6% |
| Scottish | 58 | 9.6% |
| Spaniard | 87 | 14.4% | View All 10 Rows |
Immigrants in Hilltop

| Immigration Origin | # Population | % Population | View All 0 Rows |
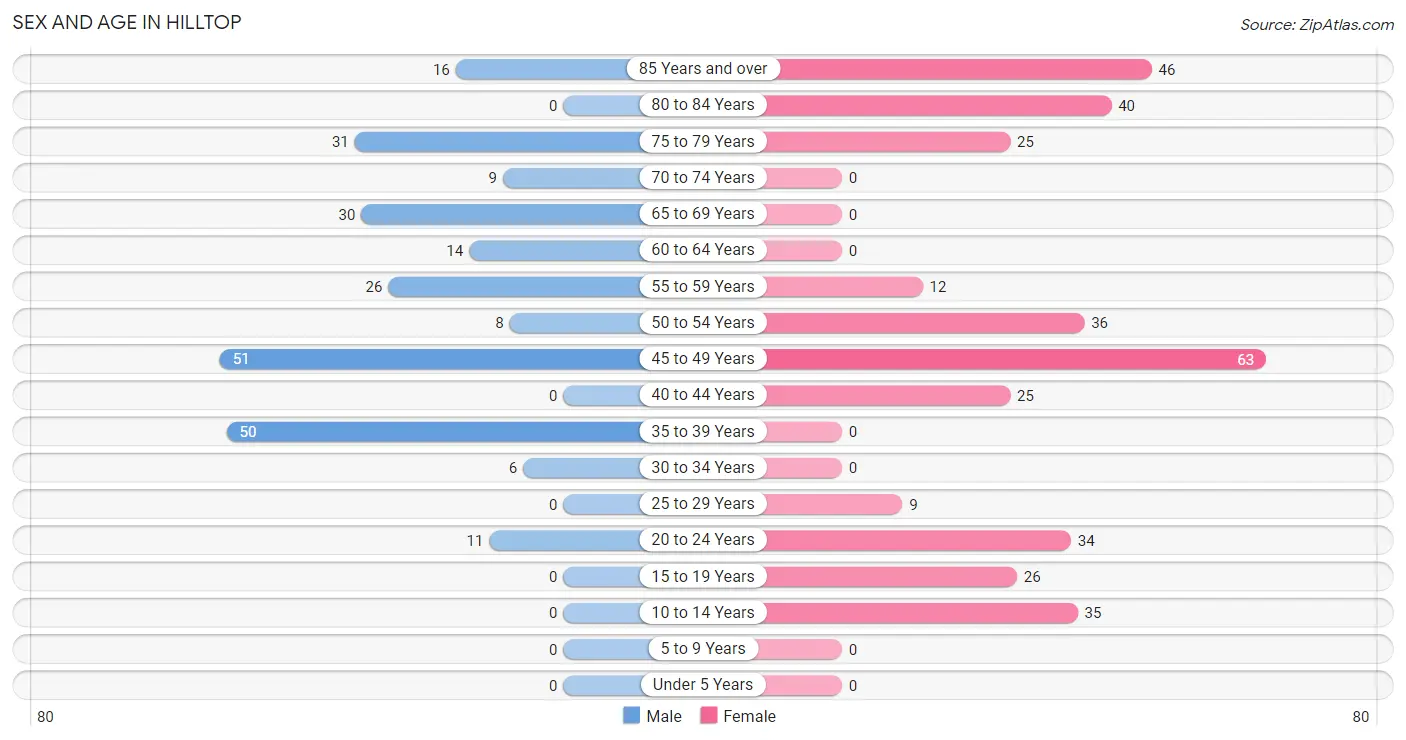
Sex and Age in Hilltop
Sex and Age in Hilltop
The most populous age groups in Hilltop are 45 to 49 Years (51 | 20.2%) for men and 45 to 49 Years (63 | 17.9%) for women.
| Age Bracket | Male | Female |
| Under 5 Years | 0 (0.0%) | 0 (0.0%) |
| 5 to 9 Years | 0 (0.0%) | 0 (0.0%) |
| 10 to 14 Years | 0 (0.0%) | 35 (10.0%) |
| 15 to 19 Years | 0 (0.0%) | 26 (7.4%) |
| 20 to 24 Years | 11 (4.4%) | 34 (9.7%) |
| 25 to 29 Years | 0 (0.0%) | 9 (2.6%) |
| 30 to 34 Years | 6 (2.4%) | 0 (0.0%) |
| 35 to 39 Years | 50 (19.8%) | 0 (0.0%) |
| 40 to 44 Years | 0 (0.0%) | 25 (7.1%) |
| 45 to 49 Years | 51 (20.2%) | 63 (17.9%) |
| 50 to 54 Years | 8 (3.2%) | 36 (10.3%) |
| 55 to 59 Years | 26 (10.3%) | 12 (3.4%) |
| 60 to 64 Years | 14 (5.6%) | 0 (0.0%) |
| 65 to 69 Years | 30 (11.9%) | 0 (0.0%) |
| 70 to 74 Years | 9 (3.6%) | 0 (0.0%) |
| 75 to 79 Years | 31 (12.3%) | 25 (7.1%) |
| 80 to 84 Years | 0 (0.0%) | 40 (11.4%) |
| 85 Years and over | 16 (6.4%) | 46 (13.1%) |
| Total | 252 (100.0%) | 351 (100.0%) |
Families and Households in Hilltop
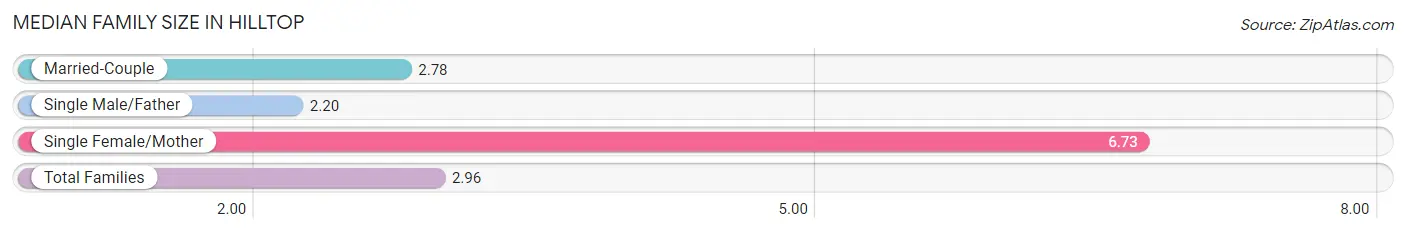
Median Family Size in Hilltop
The median family size in Hilltop is 2.96 persons per family, with single female/mother families (11 | 7.8%) accounting for the largest median family size of 6.73 persons per family. On the other hand, single male/father families (30 | 21.3%) represent the smallest median family size with 2.20 persons per family.
| Family Type | # Families | Family Size |
| Married-Couple | 100 (70.9%) | 2.78 |
| Single Male/Father | 30 (21.3%) | 2.20 |
| Single Female/Mother | 11 (7.8%) | 6.73 |
| Total Families | 141 (100.0%) | 2.96 |
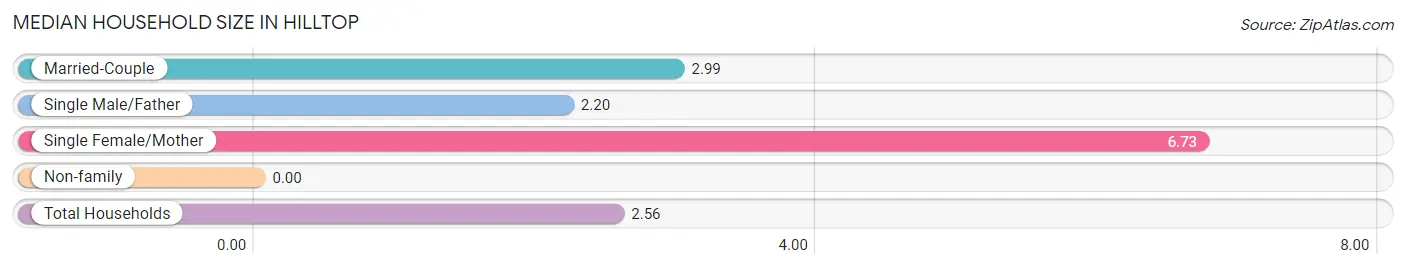
Median Household Size in Hilltop
| Household Type | # Households | Household Size |
| Married-Couple | 100 (52.4%) | 2.99 |
| Single Male/Father | 30 (15.7%) | 2.20 |
| Single Female/Mother | 11 (5.8%) | 6.73 |
| Non-family | 50 (26.2%) | - |
| Total Households | 191 (100.0%) | 2.56 |
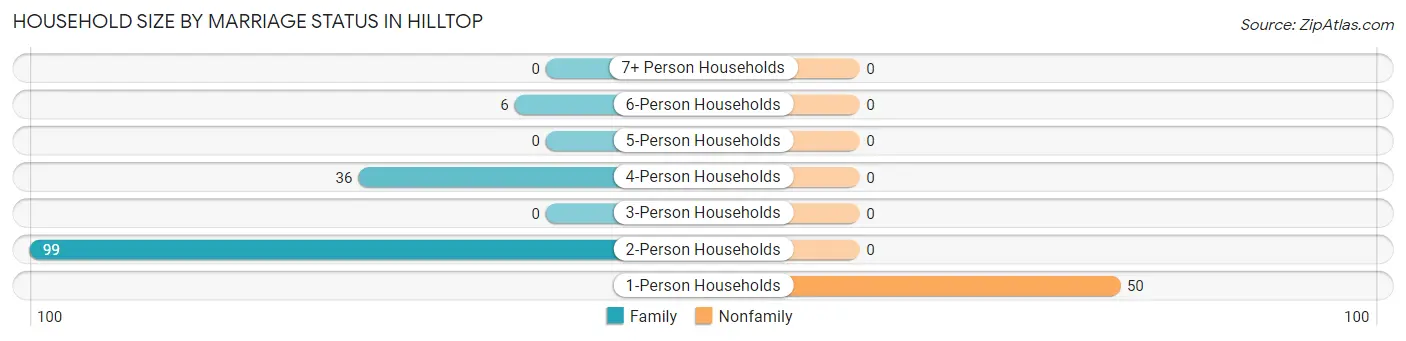
Household Size by Marriage Status in Hilltop
Out of a total of 191 households in Hilltop, 141 (73.8%) are family households, while 50 (26.2%) are nonfamily households. The most numerous type of family households are 2-person households, comprising 99, and the most common type of nonfamily households are 1-person households, comprising 50.
| Household Size | Family Households | Nonfamily Households |
| 1-Person Households | - | 50 (26.2%) |
| 2-Person Households | 99 (51.8%) | 0 (0.0%) |
| 3-Person Households | 0 (0.0%) | 0 (0.0%) |
| 4-Person Households | 36 (18.9%) | 0 (0.0%) |
| 5-Person Households | 0 (0.0%) | 0 (0.0%) |
| 6-Person Households | 6 (3.1%) | 0 (0.0%) |
| 7+ Person Households | 0 (0.0%) | 0 (0.0%) |
| Total | 141 (73.8%) | 50 (26.2%) |
Female Fertility in Hilltop
Fertility by Age in Hilltop
| Age Bracket | Women with Births | Births / 1,000 Women |
| 15 to 19 years | 0 (0.0%) | 0.0 |
| 20 to 34 years | 0 (0.0%) | 0.0 |
| 35 to 50 years | 0 (0.0%) | 0.0 |
| Total | 0 (0.0%) | 0.0 |
Fertility by Age by Marriage Status in Hilltop
| Age Bracket | Married | Unmarried |
| 15 to 19 years | 0 (0.0%) | 0 (0.0%) |
| 20 to 34 years | 0 (0.0%) | 0 (0.0%) |
| 35 to 50 years | 0 (0.0%) | 0 (0.0%) |
| Total | 0 (0.0%) | 0 (0.0%) |
Fertility by Education in Hilltop
| Educational Attainment | Women with Births | Births / 1,000 Women |
| Less than High School | 0 (0.0%) | 0.0 |
| High School Diploma | 0 (0.0%) | 0.0 |
| College or Associate's Degree | 0 (0.0%) | 0.0 |
| Bachelor's Degree | 0 (0.0%) | 0.0 |
| Graduate Degree | 0 (0.0%) | 0.0 |
| Total | 0 (0.0%) | 0.0 |
Fertility by Education by Marriage Status in Hilltop
| Educational Attainment | Married | Unmarried |
| Less than High School | 0 (0.0%) | 0 (0.0%) |
| High School Diploma | 0 (0.0%) | 0 (0.0%) |
| College or Associate's Degree | 0 (0.0%) | 0 (0.0%) |
| Bachelor's Degree | 0 (0.0%) | 0 (0.0%) |
| Graduate Degree | 0 (0.0%) | 0 (0.0%) |
| Total | 0 (0.0%) | 0 (0.0%) |
Income in Hilltop
Income Overview in Hilltop
| Characteristic | Number | Measure |
| Per Capita Income | 603 | $22,015 |
| Median Family Income | 141 | $0 |
| Mean Family Income | 141 | $72,334 |
| Median Household Income | 191 | $0 |
| Mean Household Income | 191 | $58,930 |
| Income Deficit | 141 | $0 |
| Wage / Income Gap (%) | 603 | 0.00% |
| Wage / Income Gap ($) | 603 | 100.00¢ per $1 |
| Gini / Inequality Index | 603 | 0.39 |
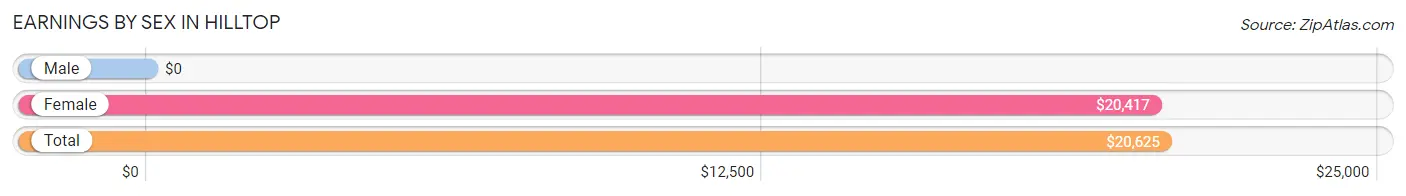
Earnings by Sex in Hilltop
| Sex | Number | Average Earnings |
| Male | 88 (44.0%) | $0 |
| Female | 112 (56.0%) | $20,417 |
| Total | 200 (100.0%) | $20,625 |
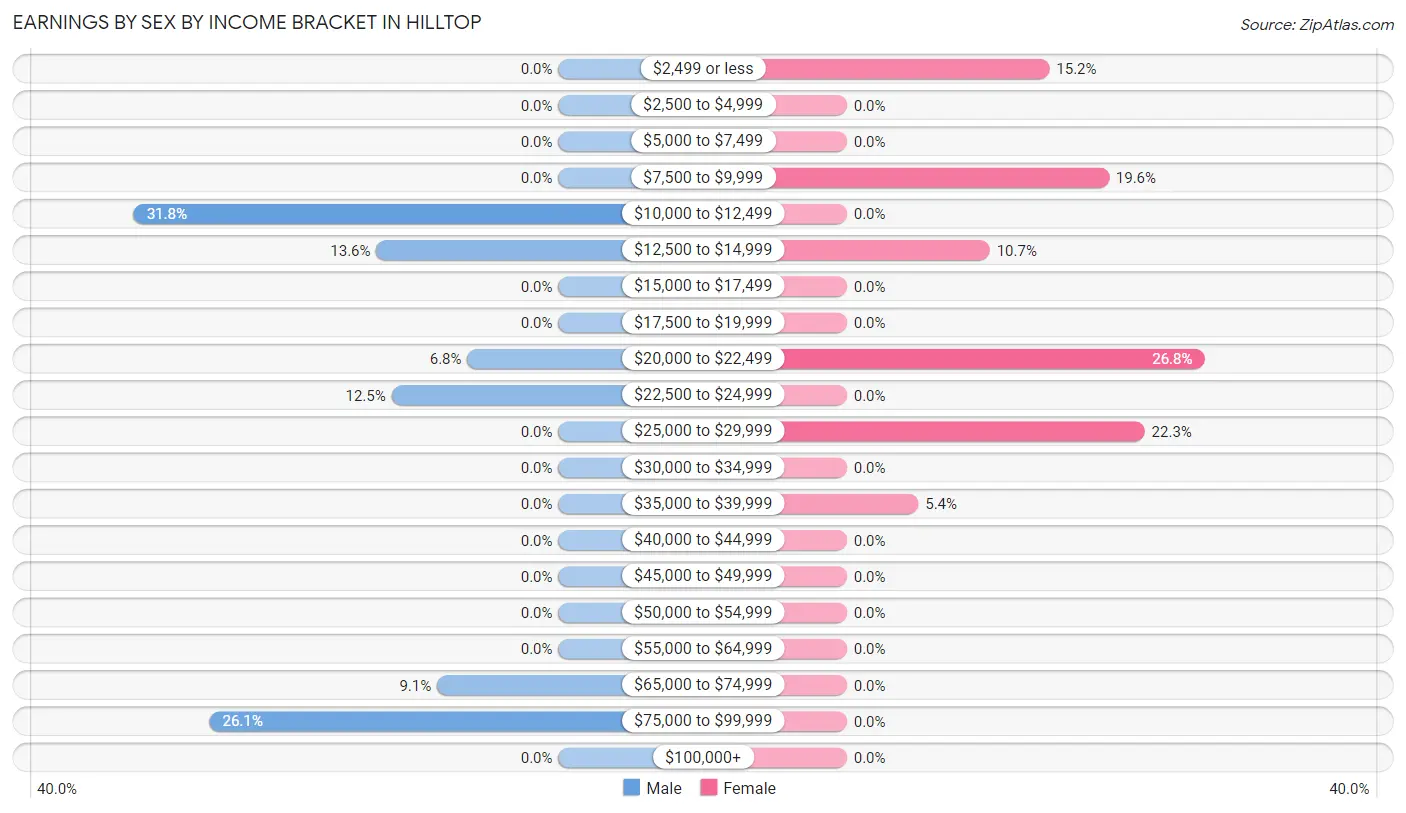
Earnings by Sex by Income Bracket in Hilltop
The most common earnings brackets in Hilltop are $10,000 to $12,499 for men (28 | 31.8%) and $20,000 to $22,499 for women (30 | 26.8%).
| Income | Male | Female |
| $2,499 or less | 0 (0.0%) | 17 (15.2%) |
| $2,500 to $4,999 | 0 (0.0%) | 0 (0.0%) |
| $5,000 to $7,499 | 0 (0.0%) | 0 (0.0%) |
| $7,500 to $9,999 | 0 (0.0%) | 22 (19.6%) |
| $10,000 to $12,499 | 28 (31.8%) | 0 (0.0%) |
| $12,500 to $14,999 | 12 (13.6%) | 12 (10.7%) |
| $15,000 to $17,499 | 0 (0.0%) | 0 (0.0%) |
| $17,500 to $19,999 | 0 (0.0%) | 0 (0.0%) |
| $20,000 to $22,499 | 6 (6.8%) | 30 (26.8%) |
| $22,500 to $24,999 | 11 (12.5%) | 0 (0.0%) |
| $25,000 to $29,999 | 0 (0.0%) | 25 (22.3%) |
| $30,000 to $34,999 | 0 (0.0%) | 0 (0.0%) |
| $35,000 to $39,999 | 0 (0.0%) | 6 (5.4%) |
| $40,000 to $44,999 | 0 (0.0%) | 0 (0.0%) |
| $45,000 to $49,999 | 0 (0.0%) | 0 (0.0%) |
| $50,000 to $54,999 | 0 (0.0%) | 0 (0.0%) |
| $55,000 to $64,999 | 0 (0.0%) | 0 (0.0%) |
| $65,000 to $74,999 | 8 (9.1%) | 0 (0.0%) |
| $75,000 to $99,999 | 23 (26.1%) | 0 (0.0%) |
| $100,000+ | 0 (0.0%) | 0 (0.0%) |
| Total | 88 (100.0%) | 112 (100.0%) |
Earnings by Sex by Educational Attainment in Hilltop
| Educational Attainment | Male Income | Female Income |
| Less than High School | - | - |
| High School Diploma | - | - |
| College or Associate's Degree | - | - |
| Bachelor's Degree | - | - |
| Graduate Degree | - | - |
| Total | - | - |
Family Income in Hilltop
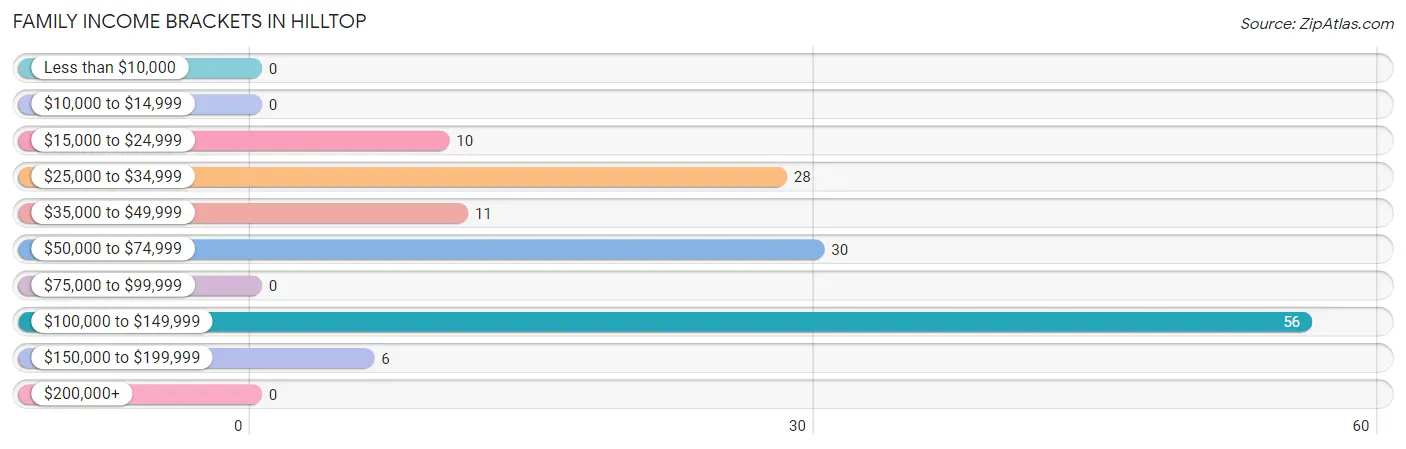
Family Income Brackets in Hilltop
According to the Hilltop family income data, there are 56 families falling into the $100,000 to $149,999 income range, which is the most common income bracket and makes up 39.7% of all families.
| Income Bracket | # Families | % Families |
| Less than $10,000 | 0 | 0.0% |
| $10,000 to $14,999 | 0 | 0.0% |
| $15,000 to $24,999 | 10 | 7.1% |
| $25,000 to $34,999 | 28 | 19.9% |
| $35,000 to $49,999 | 11 | 7.8% |
| $50,000 to $74,999 | 30 | 21.3% |
| $75,000 to $99,999 | 0 | 0.0% |
| $100,000 to $149,999 | 56 | 39.7% |
| $150,000 to $199,999 | 6 | 4.3% |
| $200,000+ | 0 | 0.0% |
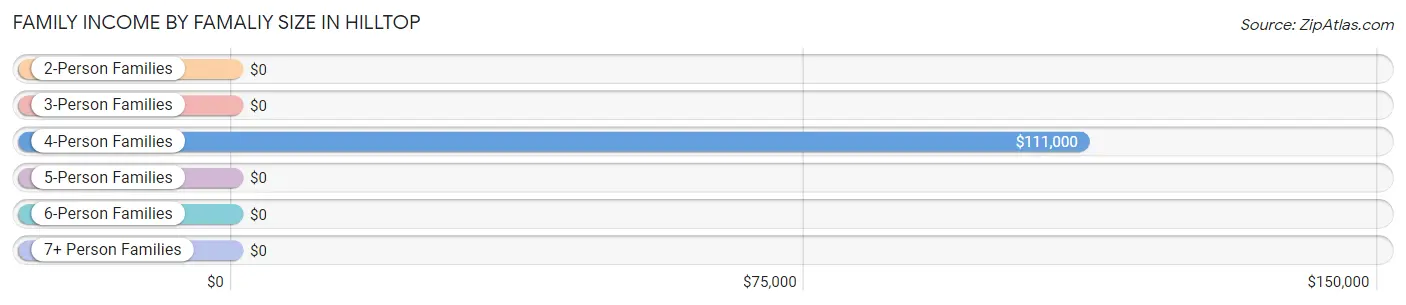
Family Income by Famaliy Size in Hilltop
4-person families (42 | 29.8%) account for the highest median family income in Hilltop with $111,000 per family, while 4-person families (42 | 29.8%) have the highest median income of $27,750 per family member.
| Income Bracket | # Families | Median Income |
| 2-Person Families | 99 (70.2%) | $0 |
| 3-Person Families | 0 (0.0%) | $0 |
| 4-Person Families | 42 (29.8%) | $111,000 |
| 5-Person Families | 0 (0.0%) | $0 |
| 6-Person Families | 0 (0.0%) | $0 |
| 7+ Person Families | 0 (0.0%) | $0 |
| Total | 141 (100.0%) | $0 |
Family Income by Number of Earners in Hilltop
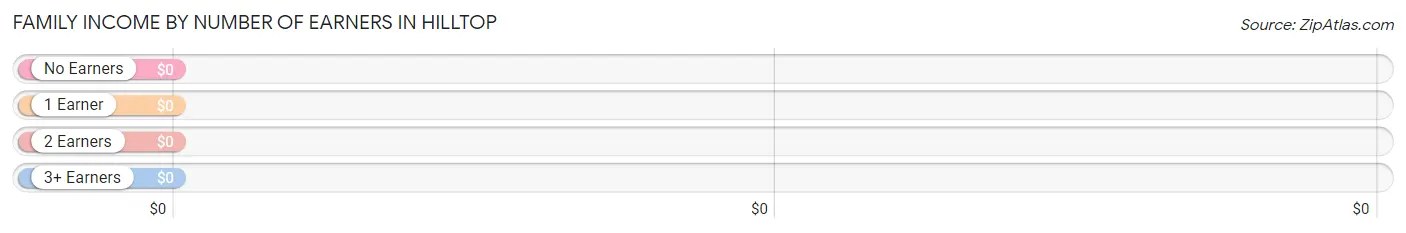
| Number of Earners | # Families | Median Income |
| No Earners | 71 (50.3%) | $0 |
| 1 Earner | 28 (19.9%) | $0 |
| 2 Earners | 36 (25.5%) | $0 |
| 3+ Earners | 6 (4.3%) | $0 |
| Total | 141 (100.0%) | $0 |
Household Income in Hilltop
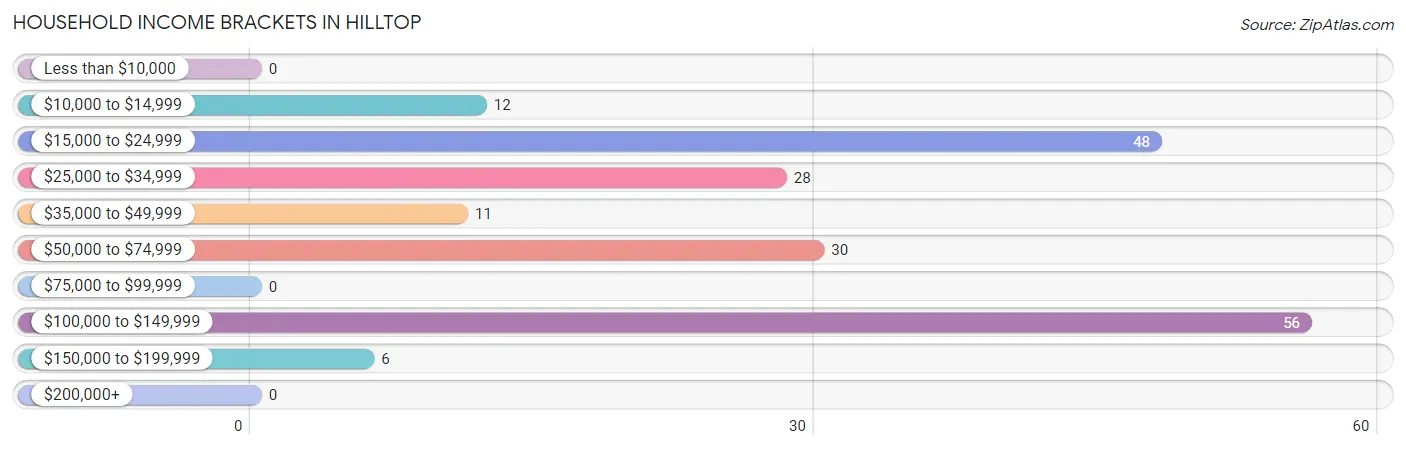
Household Income Brackets in Hilltop
With 56 households falling in the category, the $100,000 to $149,999 income range is the most frequent in Hilltop, accounting for 29.3% of all households.
| Income Bracket | # Households | % Households |
| Less than $10,000 | 0 | 0.0% |
| $10,000 to $14,999 | 12 | 6.3% |
| $15,000 to $24,999 | 48 | 25.1% |
| $25,000 to $34,999 | 28 | 14.7% |
| $35,000 to $49,999 | 11 | 5.8% |
| $50,000 to $74,999 | 30 | 15.7% |
| $75,000 to $99,999 | 0 | 0.0% |
| $100,000 to $149,999 | 56 | 29.3% |
| $150,000 to $199,999 | 6 | 3.1% |
| $200,000+ | 0 | 0.0% |
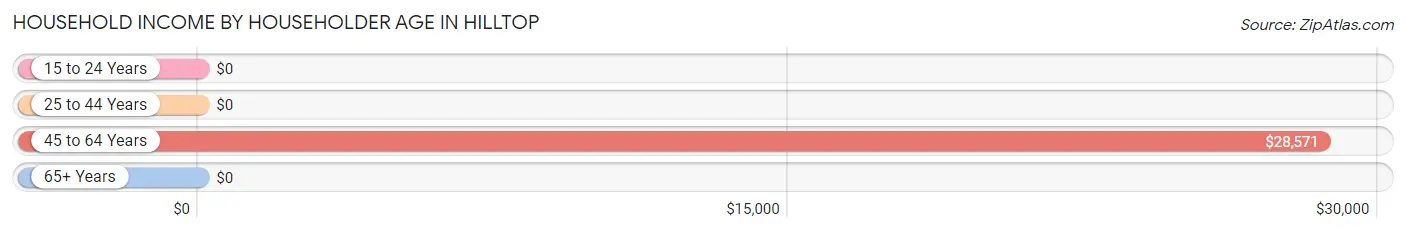
Household Income by Householder Age in Hilltop
The median household income in Hilltop is $0, with the highest median household income of $28,571 found in the 45 to 64 years age bracket for the primary householder. A total of 44 households (23.0%) fall into this category.
| Income Bracket | # Households | Median Income |
| 15 to 24 Years | 0 (0.0%) | $0 |
| 25 to 44 Years | 75 (39.3%) | $0 |
| 45 to 64 Years | 44 (23.0%) | $28,571 |
| 65+ Years | 72 (37.7%) | $0 |
| Total | 191 (100.0%) | $0 |
Poverty in Hilltop
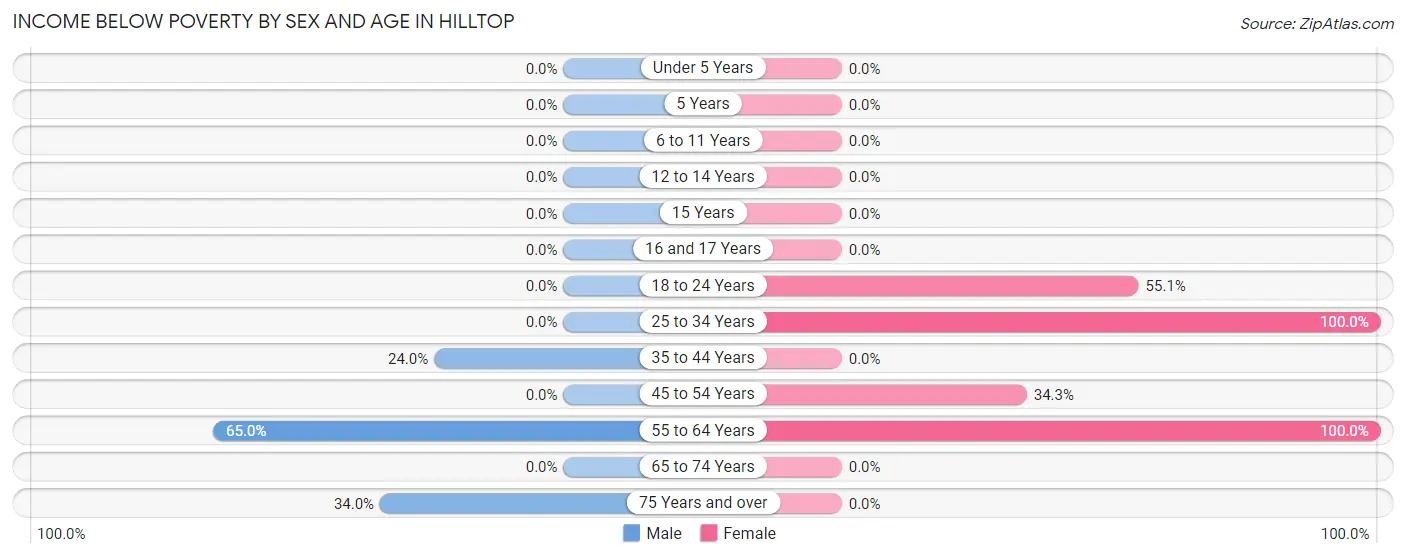
Income Below Poverty by Sex and Age in Hilltop
With 22.2% poverty level for males and 24.0% for females among the residents of Hilltop, 55 to 64 year old males and 25 to 34 year old females are the most vulnerable to poverty, with 26 males (65.0%) and 9 females (100.0%) in their respective age groups living below the poverty level.
| Age Bracket | Male | Female |
| Under 5 Years | 0 (0.0%) | 0 (0.0%) |
| 5 Years | 0 (0.0%) | 0 (0.0%) |
| 6 to 11 Years | 0 (0.0%) | 0 (0.0%) |
| 12 to 14 Years | 0 (0.0%) | 0 (0.0%) |
| 15 Years | 0 (0.0%) | 0 (0.0%) |
| 16 and 17 Years | 0 (0.0%) | 0 (0.0%) |
| 18 to 24 Years | 0 (0.0%) | 27 (55.1%) |
| 25 to 34 Years | 0 (0.0%) | 9 (100.0%) |
| 35 to 44 Years | 12 (24.0%) | 0 (0.0%) |
| 45 to 54 Years | 0 (0.0%) | 34 (34.3%) |
| 55 to 64 Years | 26 (65.0%) | 12 (100.0%) |
| 65 to 74 Years | 0 (0.0%) | 0 (0.0%) |
| 75 Years and over | 16 (34.0%) | 0 (0.0%) |
| Total | 54 (22.2%) | 82 (24.0%) |
Income Above Poverty by Sex and Age in Hilltop
According to the poverty statistics in Hilltop, males aged 18 to 24 years and females aged 12 to 14 years are the age groups that are most secure financially, with 100.0% of males and 100.0% of females in these age groups living above the poverty line.
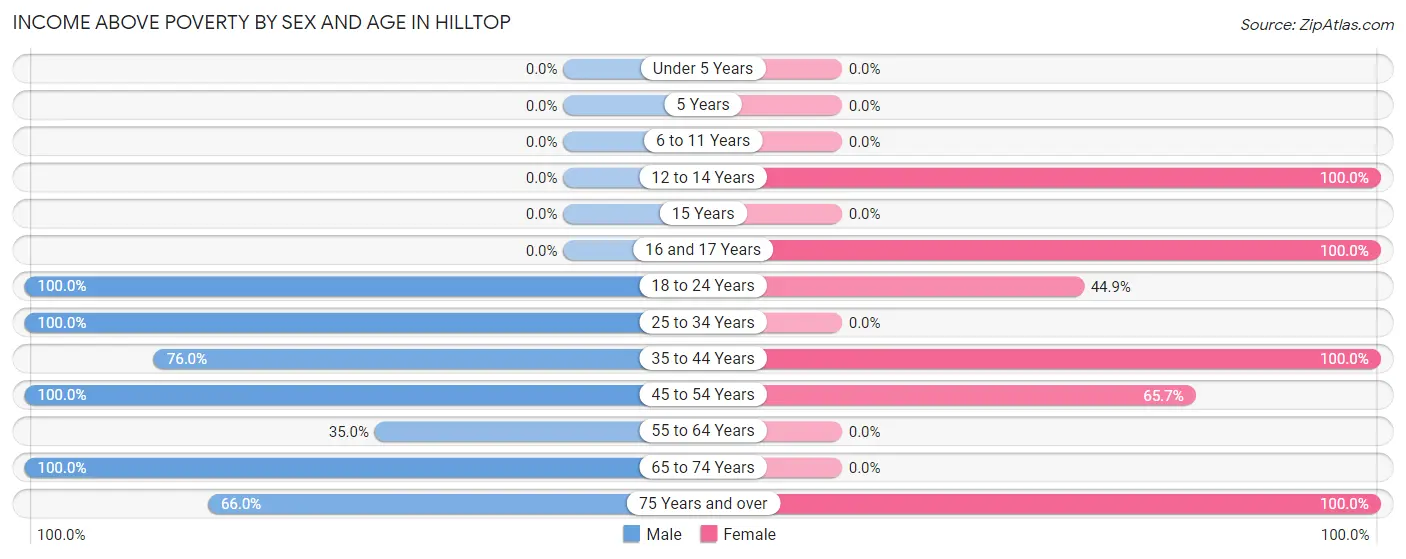
| Age Bracket | Male | Female |
| Under 5 Years | 0 (0.0%) | 0 (0.0%) |
| 5 Years | 0 (0.0%) | 0 (0.0%) |
| 6 to 11 Years | 0 (0.0%) | 0 (0.0%) |
| 12 to 14 Years | 0 (0.0%) | 35 (100.0%) |
| 15 Years | 0 (0.0%) | 0 (0.0%) |
| 16 and 17 Years | 0 (0.0%) | 11 (100.0%) |
| 18 to 24 Years | 11 (100.0%) | 22 (44.9%) |
| 25 to 34 Years | 6 (100.0%) | 0 (0.0%) |
| 35 to 44 Years | 38 (76.0%) | 25 (100.0%) |
| 45 to 54 Years | 59 (100.0%) | 65 (65.7%) |
| 55 to 64 Years | 14 (35.0%) | 0 (0.0%) |
| 65 to 74 Years | 30 (100.0%) | 0 (0.0%) |
| 75 Years and over | 31 (66.0%) | 101 (100.0%) |
| Total | 189 (77.8%) | 259 (75.9%) |
Income Below Poverty Among Married-Couple Families in Hilltop
The poverty statistics for married-couple families in Hilltop show that 10.0% or 10 of the total 100 families live below the poverty line. Families with no children have the highest poverty rate of 13.3%, comprising of 10 families. On the other hand, families with 1 or 2 children have the lowest poverty rate of 0.0%, which includes 0 families.
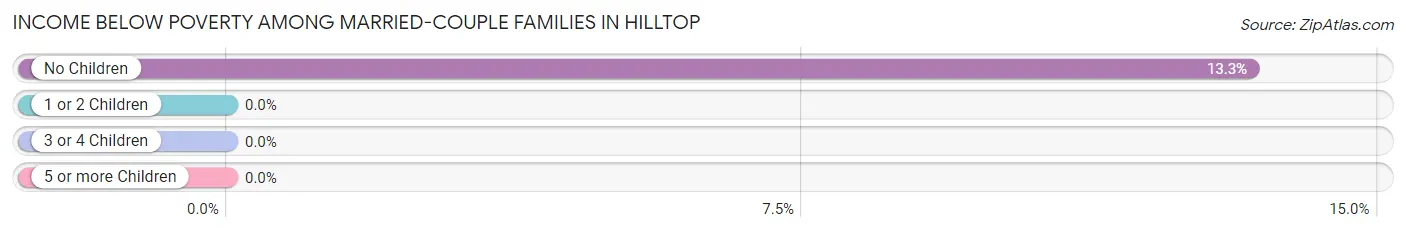
| Children | Above Poverty | Below Poverty |
| No Children | 65 (86.7%) | 10 (13.3%) |
| 1 or 2 Children | 25 (100.0%) | 0 (0.0%) |
| 3 or 4 Children | 0 (0.0%) | 0 (0.0%) |
| 5 or more Children | 0 (0.0%) | 0 (0.0%) |
| Total | 90 (90.0%) | 10 (10.0%) |
Income Below Poverty Among Single-Parent Households in Hilltop
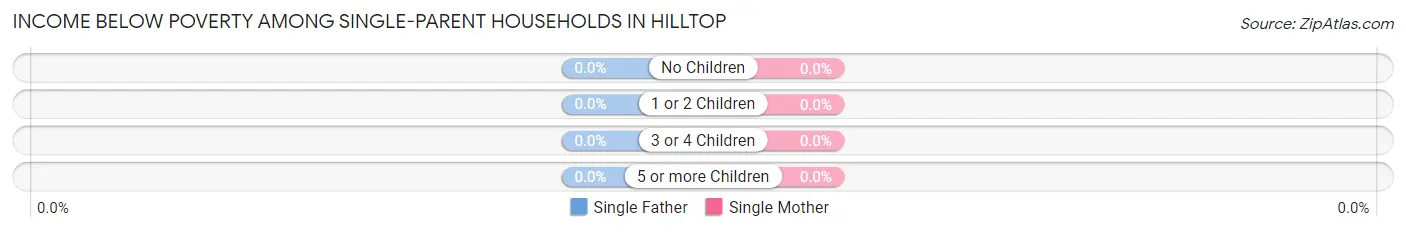
| Children | Single Father | Single Mother |
| No Children | 0 (0.0%) | 0 (0.0%) |
| 1 or 2 Children | 0 (0.0%) | 0 (0.0%) |
| 3 or 4 Children | 0 (0.0%) | 0 (0.0%) |
| 5 or more Children | 0 (0.0%) | 0 (0.0%) |
| Total | 0 (0.0%) | 0 (0.0%) |
Income Below Poverty Among Married-Couple vs Single-Parent Households in Hilltop
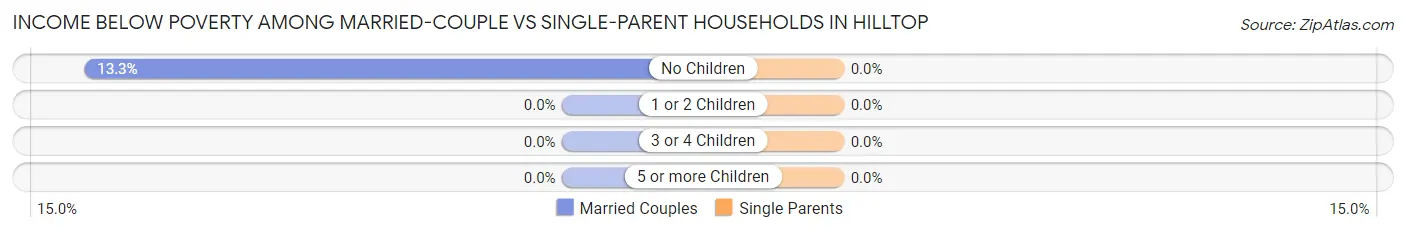
| Children | Married-Couple Families | Single-Parent Households |
| No Children | 10 (13.3%) | 0 (0.0%) |
| 1 or 2 Children | 0 (0.0%) | 0 (0.0%) |
| 3 or 4 Children | 0 (0.0%) | 0 (0.0%) |
| 5 or more Children | 0 (0.0%) | 0 (0.0%) |
| Total | 10 (10.0%) | 0 (0.0%) |
Employment Characteristics in Hilltop
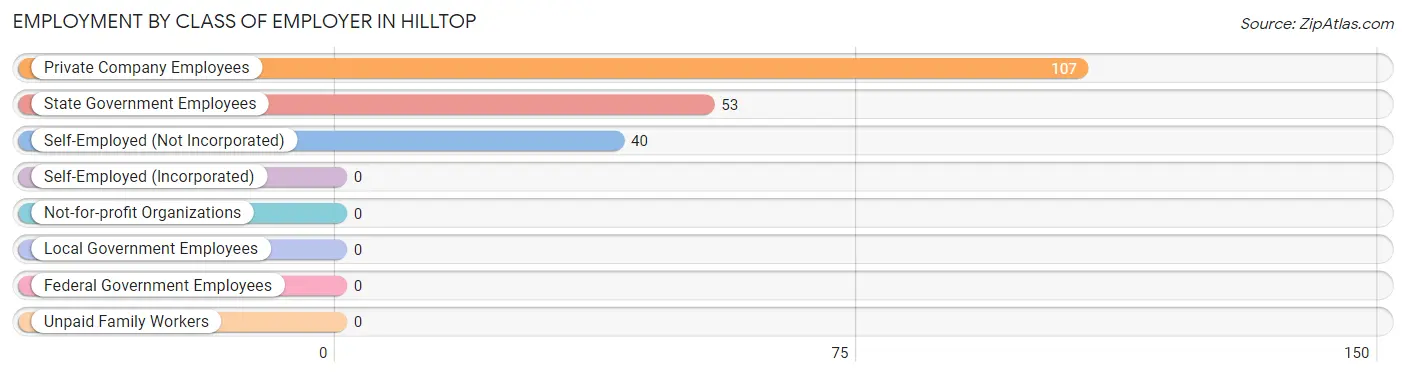
Employment by Class of Employer in Hilltop
Among the 200 employed individuals in Hilltop, private company employees (107 | 53.5%), state government employees (53 | 26.5%), and self-employed (not incorporated) (40 | 20.0%) make up the most common classes of employment.
| Employer Class | # Employees | % Employees |
| Private Company Employees | 107 | 53.5% |
| Self-Employed (Incorporated) | 0 | 0.0% |
| Self-Employed (Not Incorporated) | 40 | 20.0% |
| Not-for-profit Organizations | 0 | 0.0% |
| Local Government Employees | 0 | 0.0% |
| State Government Employees | 53 | 26.5% |
| Federal Government Employees | 0 | 0.0% |
| Unpaid Family Workers | 0 | 0.0% |
| Total | 200 | 100.0% |
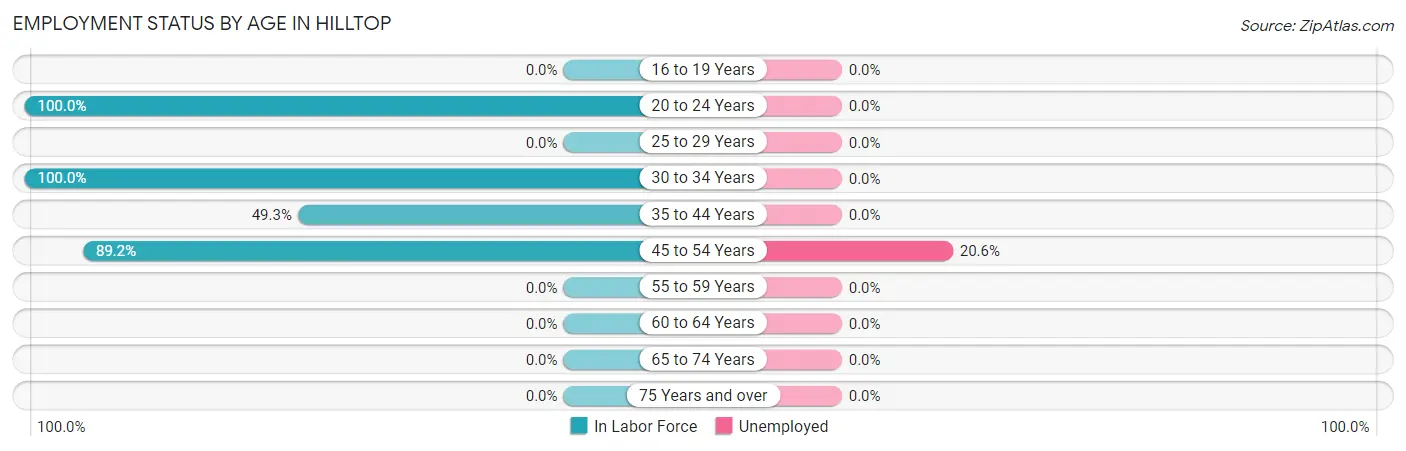
Employment Status by Age in Hilltop
According to the labor force statistics for Hilltop, out of the total population over 16 years of age (568), 40.3% or 229 individuals are in the labor force, with 12.7% or 29 of them unemployed. The age group with the highest labor force participation rate is 20 to 24 years, with 100.0% or 45 individuals in the labor force. Within the labor force, the 45 to 54 years age range has the highest percentage of unemployed individuals, with 20.6% or 29 of them being unemployed.
| Age Bracket | In Labor Force | Unemployed |
| 16 to 19 Years | 0 (0.0%) | 0 (0.0%) |
| 20 to 24 Years | 45 (100.0%) | 0 (0.0%) |
| 25 to 29 Years | 0 (0.0%) | 0 (0.0%) |
| 30 to 34 Years | 6 (100.0%) | 0 (0.0%) |
| 35 to 44 Years | 37 (49.3%) | 0 (0.0%) |
| 45 to 54 Years | 141 (89.2%) | 29 (20.6%) |
| 55 to 59 Years | 0 (0.0%) | 0 (0.0%) |
| 60 to 64 Years | 0 (0.0%) | 0 (0.0%) |
| 65 to 74 Years | 0 (0.0%) | 0 (0.0%) |
| 75 Years and over | 0 (0.0%) | 0 (0.0%) |
| Total | 229 (40.3%) | 29 (12.7%) |
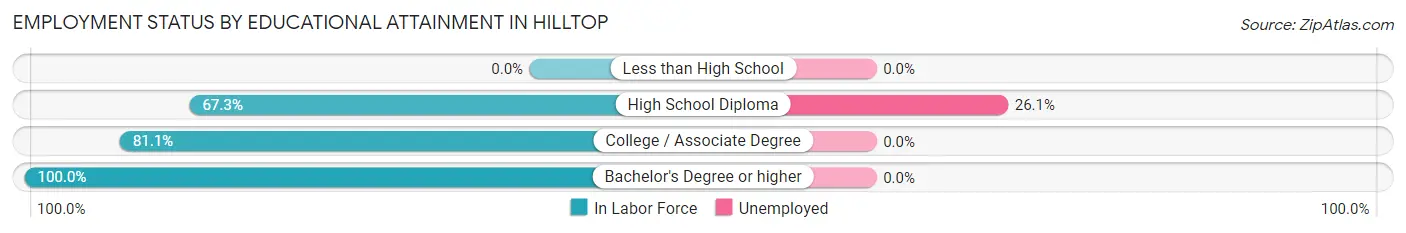
Employment Status by Educational Attainment in Hilltop
According to labor force statistics for Hilltop, 61.3% of individuals (184) out of the total population between 25 and 64 years of age (300) are in the labor force, with 15.8% or 29 of them being unemployed. The group with the highest labor force participation rate are those with the educational attainment of bachelor's degree or higher, with 100.0% or 30 individuals in the labor force. Within the labor force, individuals with high school diploma education have the highest percentage of unemployment, with 26.1% or 29 of them being unemployed.
| Educational Attainment | In Labor Force | Unemployed |
| Less than High School | 0 (0.0%) | 0 (0.0%) |
| High School Diploma | 111 (67.3%) | 43 (26.1%) |
| College / Associate Degree | 43 (81.1%) | 0 (0.0%) |
| Bachelor's Degree or higher | 30 (100.0%) | 0 (0.0%) |
| Total | 184 (61.3%) | 47 (15.8%) |
Employment Occupations by Sex in Hilltop
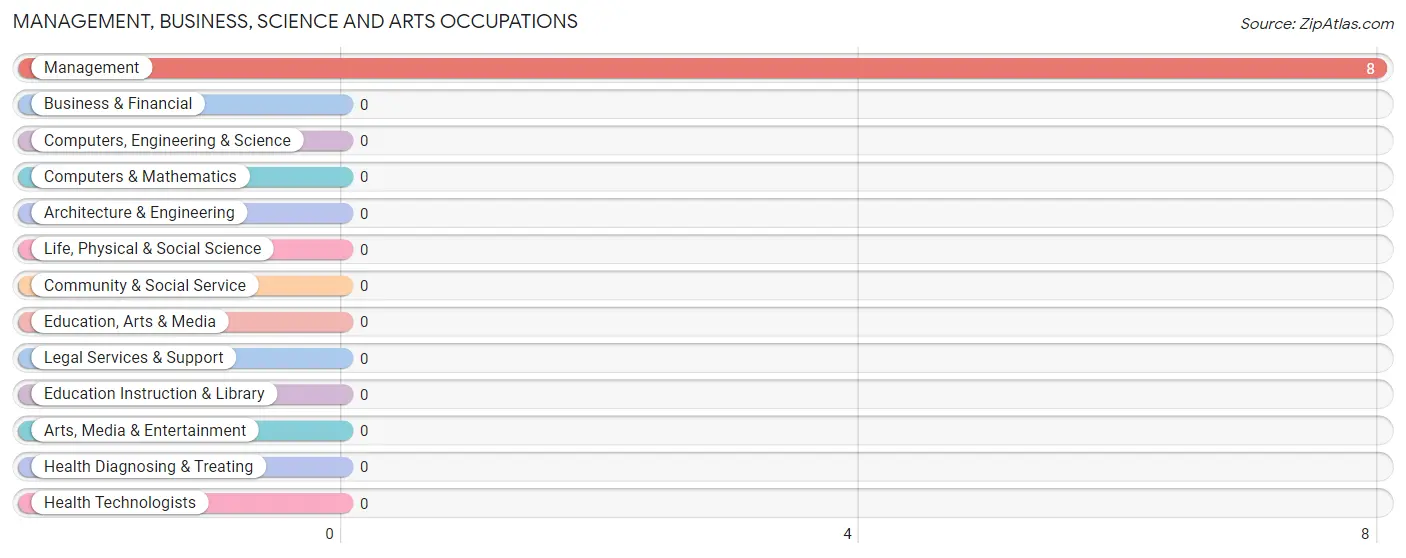
Management, Business, Science and Arts Occupations
The most common Management, Business, Science and Arts occupations in Hilltop are , and Management (8 | 4.0%).
Management, Business, Science and Arts Occupations by Sex
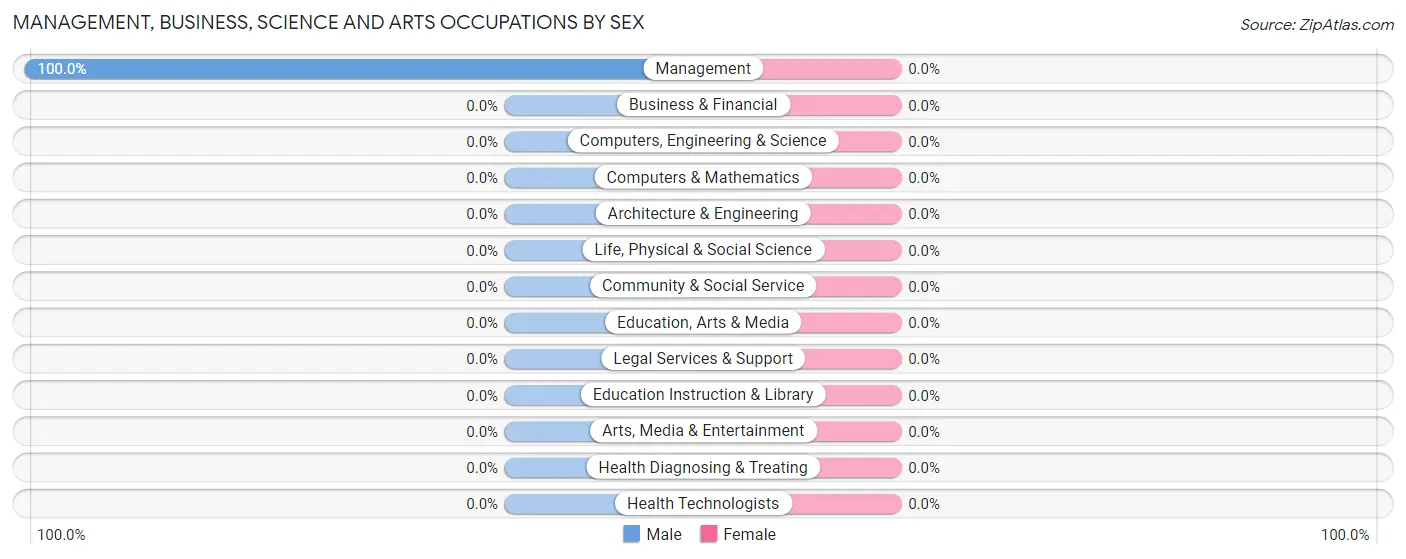
| Occupation | Male | Female |
| Management | 8 (100.0%) | 0 (0.0%) |
| Business & Financial | 0 (0.0%) | 0 (0.0%) |
| Computers, Engineering & Science | 0 (0.0%) | 0 (0.0%) |
| Computers & Mathematics | 0 (0.0%) | 0 (0.0%) |
| Architecture & Engineering | 0 (0.0%) | 0 (0.0%) |
| Life, Physical & Social Science | 0 (0.0%) | 0 (0.0%) |
| Community & Social Service | 0 (0.0%) | 0 (0.0%) |
| Education, Arts & Media | 0 (0.0%) | 0 (0.0%) |
| Legal Services & Support | 0 (0.0%) | 0 (0.0%) |
| Education Instruction & Library | 0 (0.0%) | 0 (0.0%) |
| Arts, Media & Entertainment | 0 (0.0%) | 0 (0.0%) |
| Health Diagnosing & Treating | 0 (0.0%) | 0 (0.0%) |
| Health Technologists | 0 (0.0%) | 0 (0.0%) |
| Total (Category) | 8 (100.0%) | 0 (0.0%) |
| Total (Overall) | 88 (44.0%) | 112 (56.0%) |
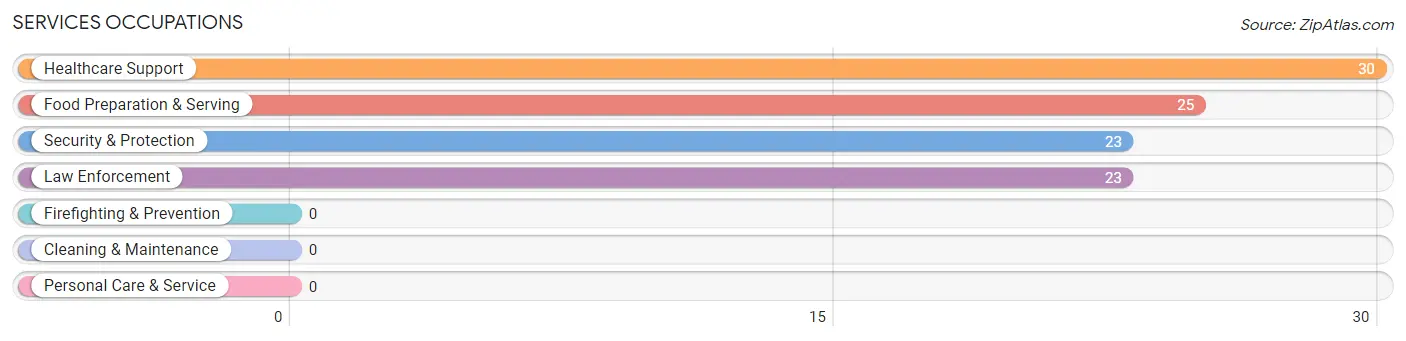
Services Occupations
The most common Services occupations in Hilltop are Healthcare Support (30 | 15.0%), Food Preparation & Serving (25 | 12.5%), Security & Protection (23 | 11.5%), and Law Enforcement (23 | 11.5%).
Services Occupations by Sex
Within the Services occupations in Hilltop, the most male-oriented occupations are Security & Protection (100.0%), and Law Enforcement (100.0%), while the most female-oriented occupations are Healthcare Support (100.0%), and Food Preparation & Serving (100.0%).
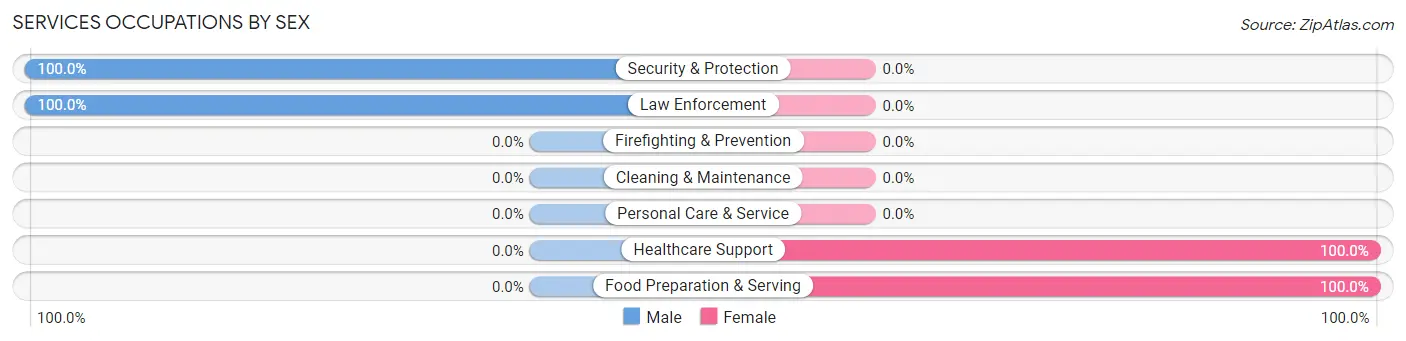
| Occupation | Male | Female |
| Healthcare Support | 0 (0.0%) | 30 (100.0%) |
| Security & Protection | 23 (100.0%) | 0 (0.0%) |
| Firefighting & Prevention | 0 (0.0%) | 0 (0.0%) |
| Law Enforcement | 23 (100.0%) | 0 (0.0%) |
| Food Preparation & Serving | 0 (0.0%) | 25 (100.0%) |
| Cleaning & Maintenance | 0 (0.0%) | 0 (0.0%) |
| Personal Care & Service | 0 (0.0%) | 0 (0.0%) |
| Total (Category) | 23 (29.5%) | 55 (70.5%) |
| Total (Overall) | 88 (44.0%) | 112 (56.0%) |
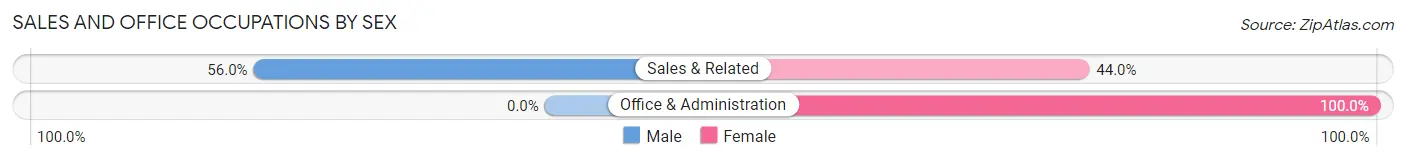
Sales and Office Occupations
The most common Sales and Office occupations in Hilltop are Sales & Related (50 | 25.0%), and Office & Administration (35 | 17.5%).
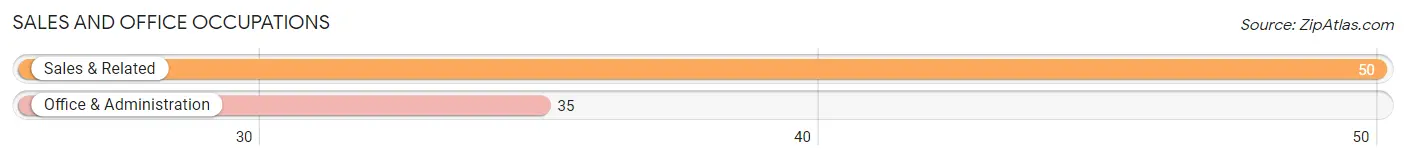
Sales and Office Occupations by Sex
| Occupation | Male | Female |
| Sales & Related | 28 (56.0%) | 22 (44.0%) |
| Office & Administration | 0 (0.0%) | 35 (100.0%) |
| Total (Category) | 28 (32.9%) | 57 (67.1%) |
| Total (Overall) | 88 (44.0%) | 112 (56.0%) |
Natural Resources, Construction and Maintenance Occupations
The most common Natural Resources, Construction and Maintenance occupations in Hilltop are , and Construction & Extraction (6 | 3.0%).
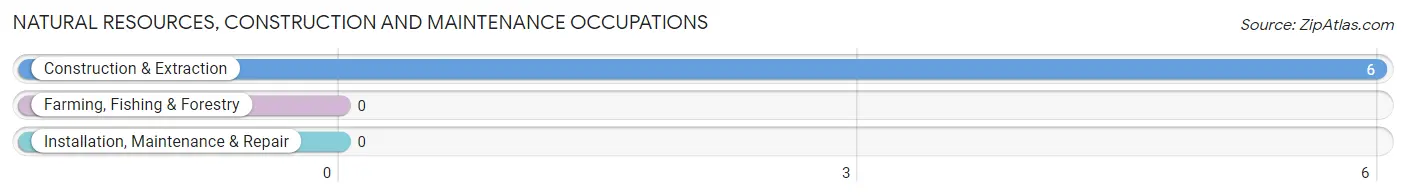
Natural Resources, Construction and Maintenance Occupations by Sex
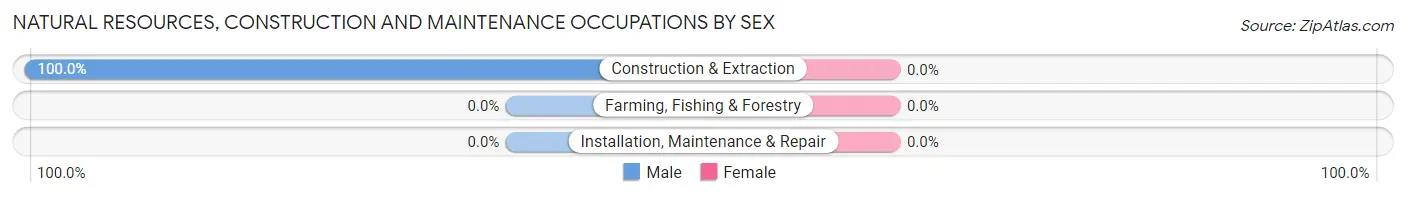
| Occupation | Male | Female |
| Farming, Fishing & Forestry | 0 (0.0%) | 0 (0.0%) |
| Construction & Extraction | 6 (100.0%) | 0 (0.0%) |
| Installation, Maintenance & Repair | 0 (0.0%) | 0 (0.0%) |
| Total (Category) | 6 (100.0%) | 0 (0.0%) |
| Total (Overall) | 88 (44.0%) | 112 (56.0%) |
Production, Transportation and Moving Occupations
The most common Production, Transportation and Moving occupations in Hilltop are Production (12 | 6.0%), and Material Moving (11 | 5.5%).
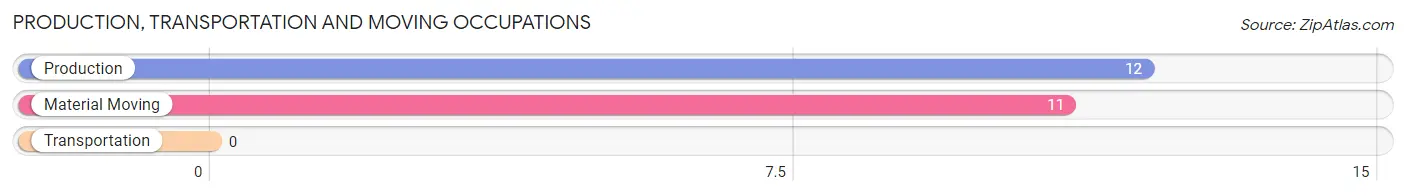
Production, Transportation and Moving Occupations by Sex
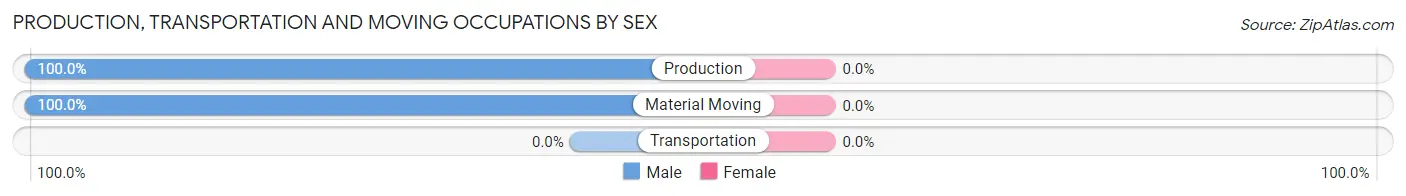
| Occupation | Male | Female |
| Production | 12 (100.0%) | 0 (0.0%) |
| Transportation | 0 (0.0%) | 0 (0.0%) |
| Material Moving | 11 (100.0%) | 0 (0.0%) |
| Total (Category) | 23 (100.0%) | 0 (0.0%) |
| Total (Overall) | 88 (44.0%) | 112 (56.0%) |
Employment Industries by Sex in Hilltop
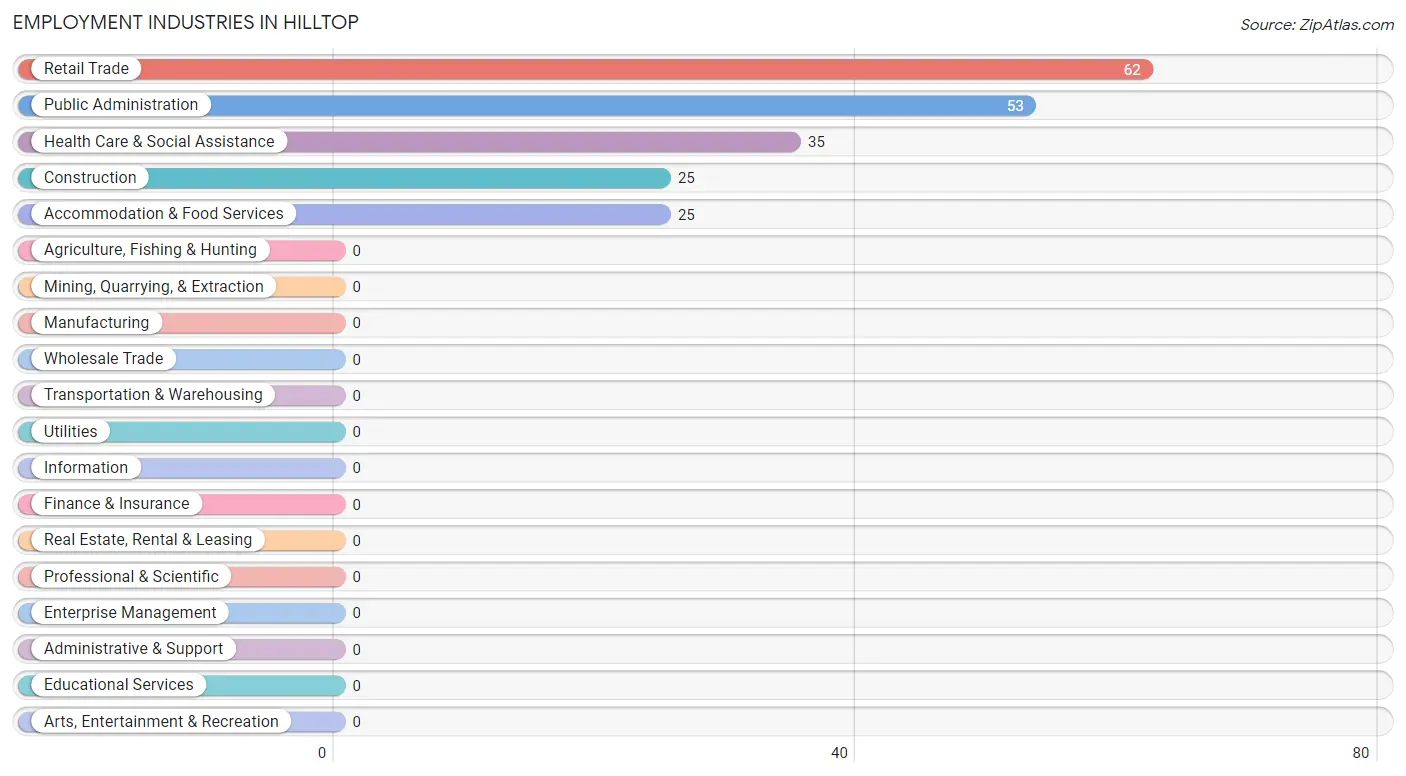
Employment Industries in Hilltop
The major employment industries in Hilltop include Retail Trade (62 | 31.0%), Public Administration (53 | 26.5%), Health Care & Social Assistance (35 | 17.5%), Construction (25 | 12.5%), and Accommodation & Food Services (25 | 12.5%).
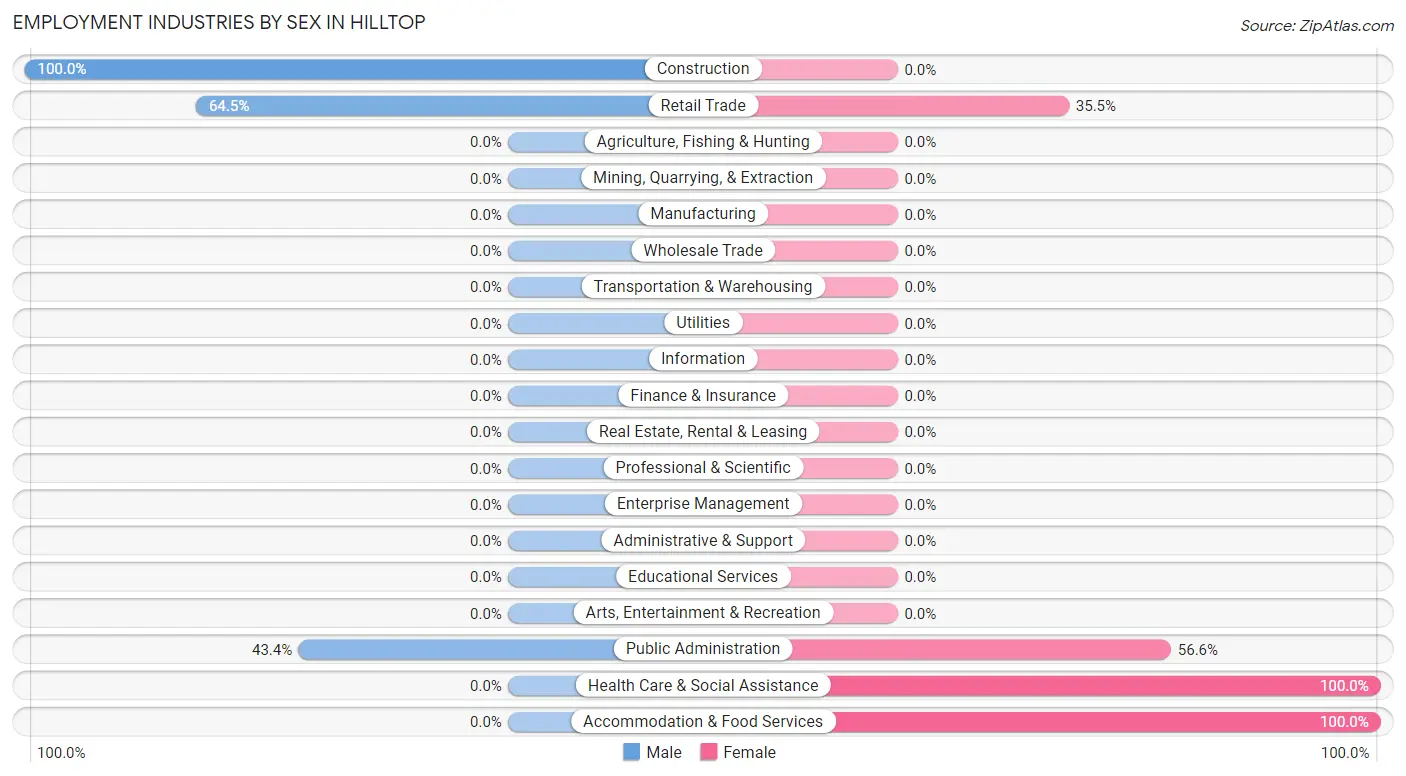
Employment Industries by Sex in Hilltop
The Hilltop industries that see more men than women are Construction (100.0%), Retail Trade (64.5%), and Public Administration (43.4%), whereas the industries that tend to have a higher number of women are Health Care & Social Assistance (100.0%), Accommodation & Food Services (100.0%), and Public Administration (56.6%).
| Industry | Male | Female |
| Agriculture, Fishing & Hunting | 0 (0.0%) | 0 (0.0%) |
| Mining, Quarrying, & Extraction | 0 (0.0%) | 0 (0.0%) |
| Construction | 25 (100.0%) | 0 (0.0%) |
| Manufacturing | 0 (0.0%) | 0 (0.0%) |
| Wholesale Trade | 0 (0.0%) | 0 (0.0%) |
| Retail Trade | 40 (64.5%) | 22 (35.5%) |
| Transportation & Warehousing | 0 (0.0%) | 0 (0.0%) |
| Utilities | 0 (0.0%) | 0 (0.0%) |
| Information | 0 (0.0%) | 0 (0.0%) |
| Finance & Insurance | 0 (0.0%) | 0 (0.0%) |
| Real Estate, Rental & Leasing | 0 (0.0%) | 0 (0.0%) |
| Professional & Scientific | 0 (0.0%) | 0 (0.0%) |
| Enterprise Management | 0 (0.0%) | 0 (0.0%) |
| Administrative & Support | 0 (0.0%) | 0 (0.0%) |
| Educational Services | 0 (0.0%) | 0 (0.0%) |
| Health Care & Social Assistance | 0 (0.0%) | 35 (100.0%) |
| Arts, Entertainment & Recreation | 0 (0.0%) | 0 (0.0%) |
| Accommodation & Food Services | 0 (0.0%) | 25 (100.0%) |
| Public Administration | 23 (43.4%) | 30 (56.6%) |
| Total | 88 (44.0%) | 112 (56.0%) |
Education in Hilltop
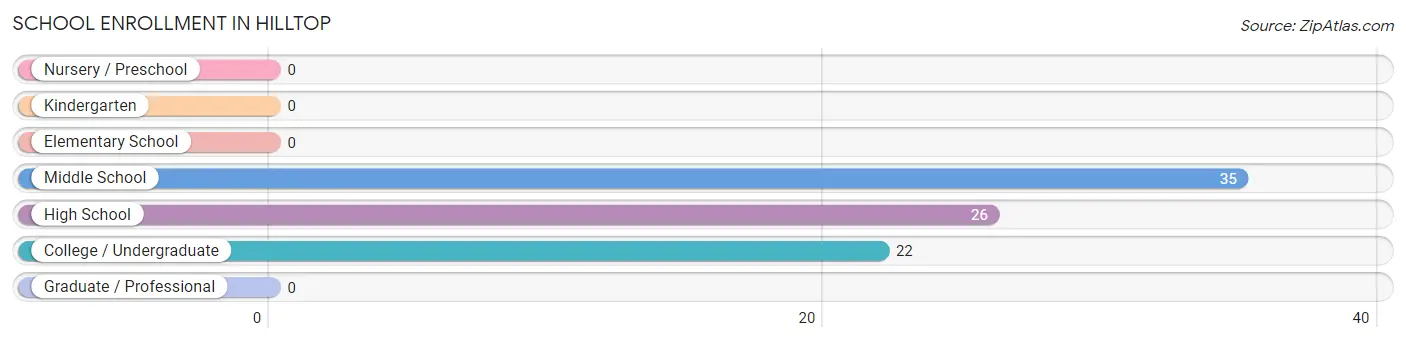
School Enrollment in Hilltop
The most common levels of schooling among the 83 students in Hilltop are middle school (35 | 42.2%), high school (26 | 31.3%), and college / undergraduate (22 | 26.5%).
| School Level | # Students | % Students |
| Nursery / Preschool | 0 | 0.0% |
| Kindergarten | 0 | 0.0% |
| Elementary School | 0 | 0.0% |
| Middle School | 35 | 42.2% |
| High School | 26 | 31.3% |
| College / Undergraduate | 22 | 26.5% |
| Graduate / Professional | 0 | 0.0% |
| Total | 83 | 100.0% |
School Enrollment by Age by Funding Source in Hilltop
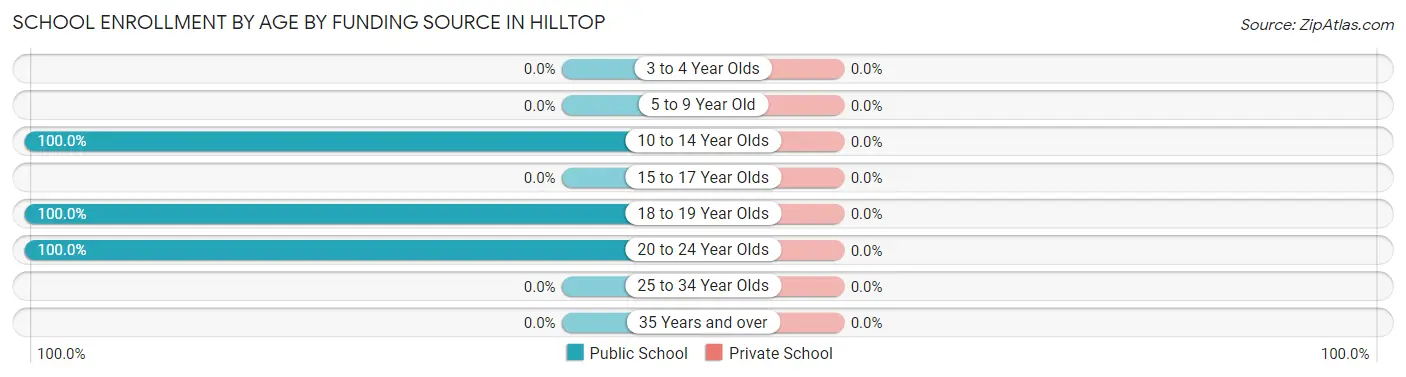
| Age Bracket | Public School | Private School |
| 3 to 4 Year Olds | 0 (0.0%) | 0 (0.0%) |
| 5 to 9 Year Old | 0 (0.0%) | 0 (0.0%) |
| 10 to 14 Year Olds | 35 (100.0%) | 0 (0.0%) |
| 15 to 17 Year Olds | 0 (0.0%) | 0 (0.0%) |
| 18 to 19 Year Olds | 15 (100.0%) | 0 (0.0%) |
| 20 to 24 Year Olds | 33 (100.0%) | 0 (0.0%) |
| 25 to 34 Year Olds | 0 (0.0%) | 0 (0.0%) |
| 35 Years and over | 0 (0.0%) | 0 (0.0%) |
| Total | 83 (100.0%) | 0 (0.0%) |
Educational Attainment by Field of Study in Hilltop
, and psychology (30 | 100.0%) are the most common fields of study among 30 individuals in Hilltop who have obtained a bachelor's degree or higher.
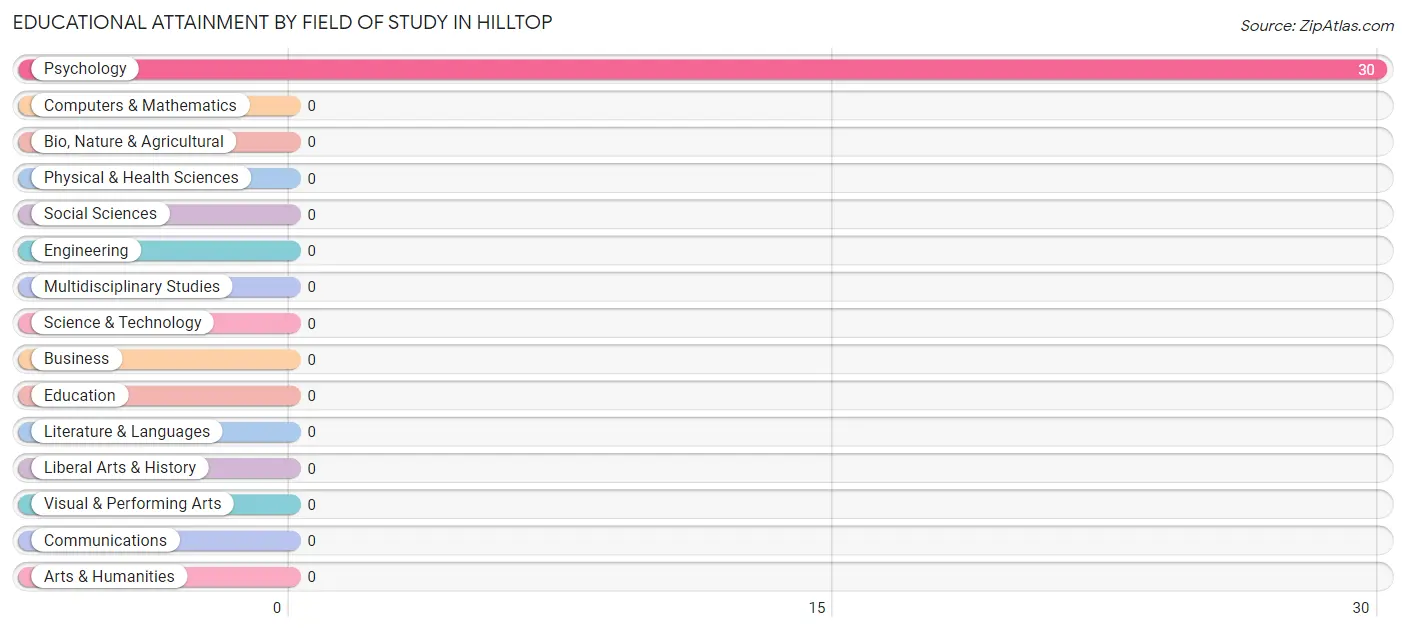
| Field of Study | # Graduates | % Graduates |
| Computers & Mathematics | 0 | 0.0% |
| Bio, Nature & Agricultural | 0 | 0.0% |
| Physical & Health Sciences | 0 | 0.0% |
| Psychology | 30 | 100.0% |
| Social Sciences | 0 | 0.0% |
| Engineering | 0 | 0.0% |
| Multidisciplinary Studies | 0 | 0.0% |
| Science & Technology | 0 | 0.0% |
| Business | 0 | 0.0% |
| Education | 0 | 0.0% |
| Literature & Languages | 0 | 0.0% |
| Liberal Arts & History | 0 | 0.0% |
| Visual & Performing Arts | 0 | 0.0% |
| Communications | 0 | 0.0% |
| Arts & Humanities | 0 | 0.0% |
| Total | 30 | 100.0% |
Transportation & Commute in Hilltop
Vehicle Availability by Sex in Hilltop
The most prevalent vehicle ownership categories in Hilltop are males with 3 vehicles (48, accounting for 54.5%) and females with 3 vehicles (43, making up 50.5%).
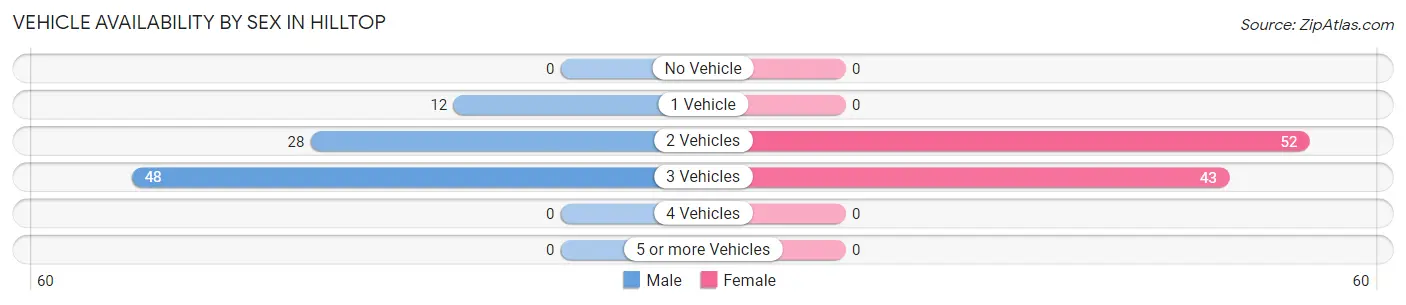
| Vehicles Available | Male | Female |
| No Vehicle | 0 (0.0%) | 0 (0.0%) |
| 1 Vehicle | 12 (13.6%) | 0 (0.0%) |
| 2 Vehicles | 28 (31.8%) | 52 (54.7%) |
| 3 Vehicles | 48 (54.5%) | 43 (45.3%) |
| 4 Vehicles | 0 (0.0%) | 0 (0.0%) |
| 5 or more Vehicles | 0 (0.0%) | 0 (0.0%) |
| Total | 88 (100.0%) | 95 (100.0%) |
Commute Time in Hilltop
The most frequently occuring commute durations in Hilltop are less than 5 minutes (42 commuters, 24.4%), 10 to 14 minutes (39 commuters, 22.7%), and 35 to 39 minutes (37 commuters, 21.5%).
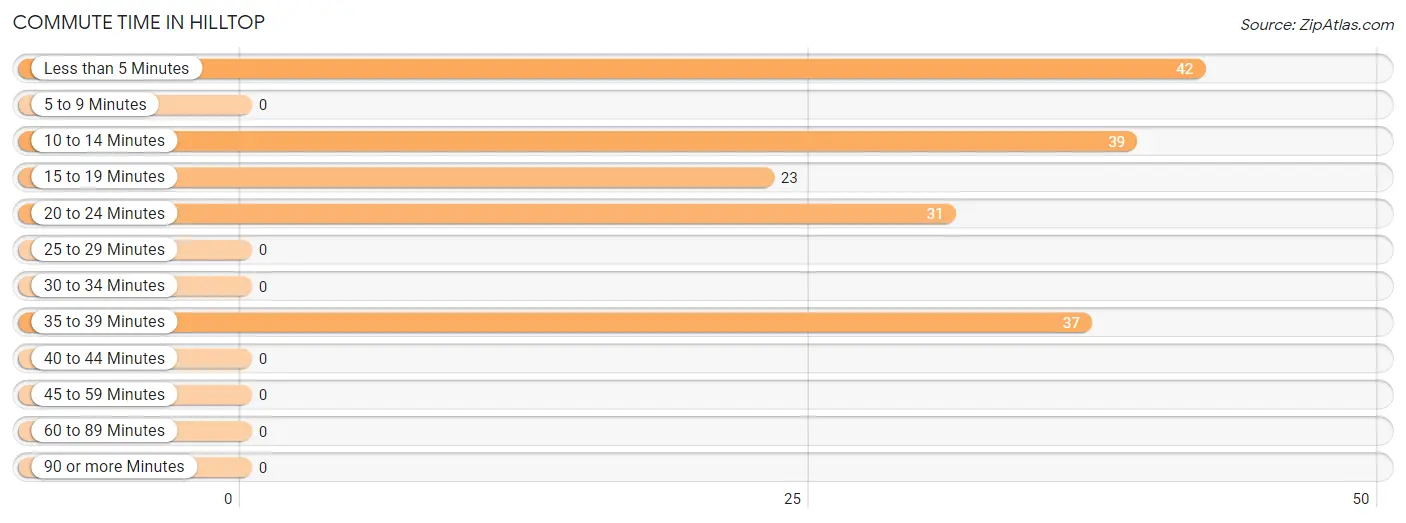
| Commute Time | # Commuters | % Commuters |
| Less than 5 Minutes | 42 | 24.4% |
| 5 to 9 Minutes | 0 | 0.0% |
| 10 to 14 Minutes | 39 | 22.7% |
| 15 to 19 Minutes | 23 | 13.4% |
| 20 to 24 Minutes | 31 | 18.0% |
| 25 to 29 Minutes | 0 | 0.0% |
| 30 to 34 Minutes | 0 | 0.0% |
| 35 to 39 Minutes | 37 | 21.5% |
| 40 to 44 Minutes | 0 | 0.0% |
| 45 to 59 Minutes | 0 | 0.0% |
| 60 to 89 Minutes | 0 | 0.0% |
| 90 or more Minutes | 0 | 0.0% |
Commute Time by Sex in Hilltop
The most common commute times in Hilltop are 20 to 24 minutes (31 commuters, 51.7%) for males and 10 to 14 minutes (39 commuters, 34.8%) for females.
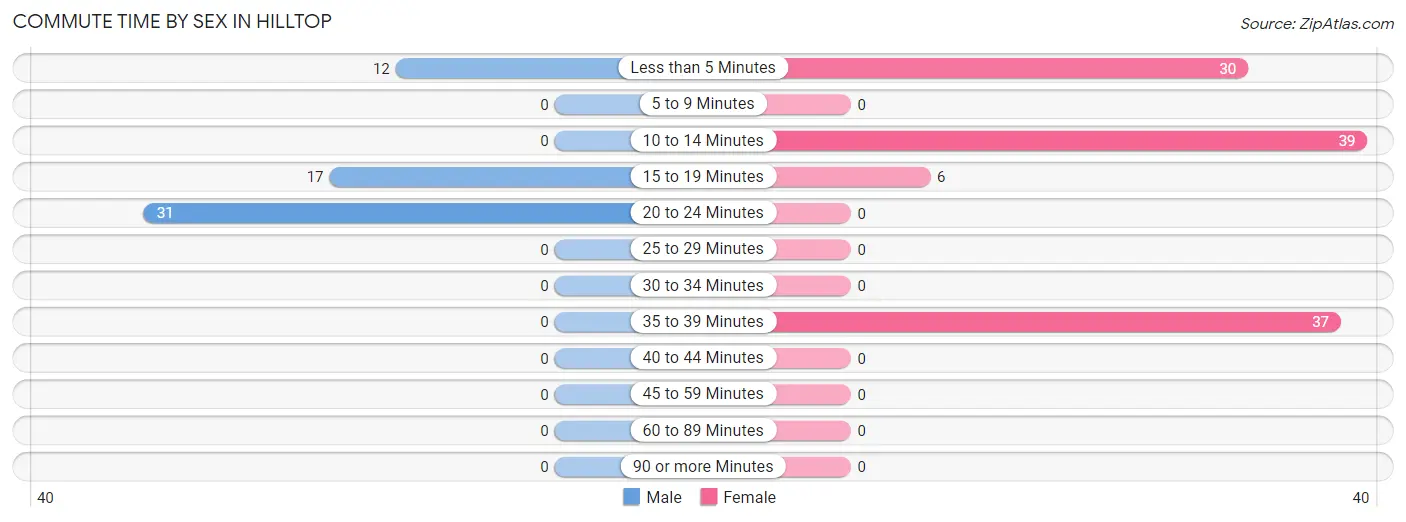
| Commute Time | Male | Female |
| Less than 5 Minutes | 12 (20.0%) | 30 (26.8%) |
| 5 to 9 Minutes | 0 (0.0%) | 0 (0.0%) |
| 10 to 14 Minutes | 0 (0.0%) | 39 (34.8%) |
| 15 to 19 Minutes | 17 (28.3%) | 6 (5.4%) |
| 20 to 24 Minutes | 31 (51.7%) | 0 (0.0%) |
| 25 to 29 Minutes | 0 (0.0%) | 0 (0.0%) |
| 30 to 34 Minutes | 0 (0.0%) | 0 (0.0%) |
| 35 to 39 Minutes | 0 (0.0%) | 37 (33.0%) |
| 40 to 44 Minutes | 0 (0.0%) | 0 (0.0%) |
| 45 to 59 Minutes | 0 (0.0%) | 0 (0.0%) |
| 60 to 89 Minutes | 0 (0.0%) | 0 (0.0%) |
| 90 or more Minutes | 0 (0.0%) | 0 (0.0%) |
Time of Departure to Work by Sex in Hilltop
The most frequent times of departure to work in Hilltop are 8:00 AM to 8:29 AM (40, 66.7%) for males and 9:00 AM to 9:59 AM (30, 26.8%) for females.
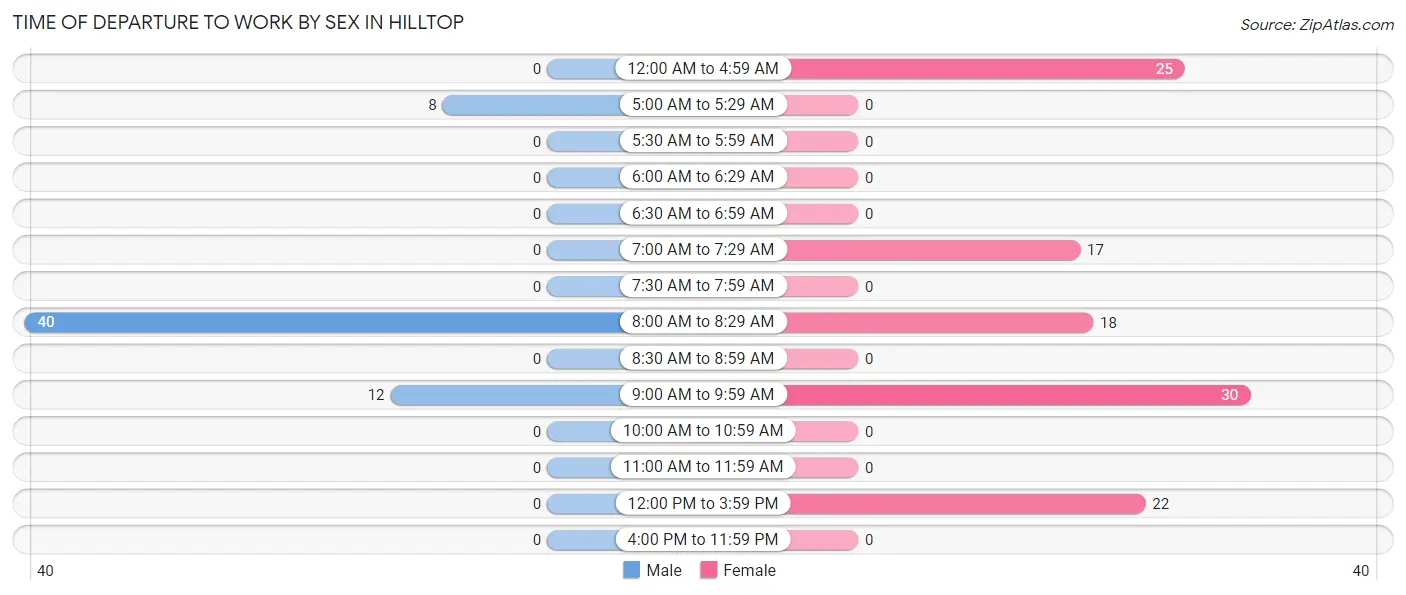
| Time of Departure | Male | Female |
| 12:00 AM to 4:59 AM | 0 (0.0%) | 25 (22.3%) |
| 5:00 AM to 5:29 AM | 8 (13.3%) | 0 (0.0%) |
| 5:30 AM to 5:59 AM | 0 (0.0%) | 0 (0.0%) |
| 6:00 AM to 6:29 AM | 0 (0.0%) | 0 (0.0%) |
| 6:30 AM to 6:59 AM | 0 (0.0%) | 0 (0.0%) |
| 7:00 AM to 7:29 AM | 0 (0.0%) | 17 (15.2%) |
| 7:30 AM to 7:59 AM | 0 (0.0%) | 0 (0.0%) |
| 8:00 AM to 8:29 AM | 40 (66.7%) | 18 (16.1%) |
| 8:30 AM to 8:59 AM | 0 (0.0%) | 0 (0.0%) |
| 9:00 AM to 9:59 AM | 12 (20.0%) | 30 (26.8%) |
| 10:00 AM to 10:59 AM | 0 (0.0%) | 0 (0.0%) |
| 11:00 AM to 11:59 AM | 0 (0.0%) | 0 (0.0%) |
| 12:00 PM to 3:59 PM | 0 (0.0%) | 22 (19.6%) |
| 4:00 PM to 11:59 PM | 0 (0.0%) | 0 (0.0%) |
| Total | 60 (100.0%) | 112 (100.0%) |
Housing Occupancy in Hilltop
Occupancy by Ownership in Hilltop
Of the total 191 dwellings in Hilltop, owner-occupied units account for 153 (80.1%), while renter-occupied units make up 38 (19.9%).
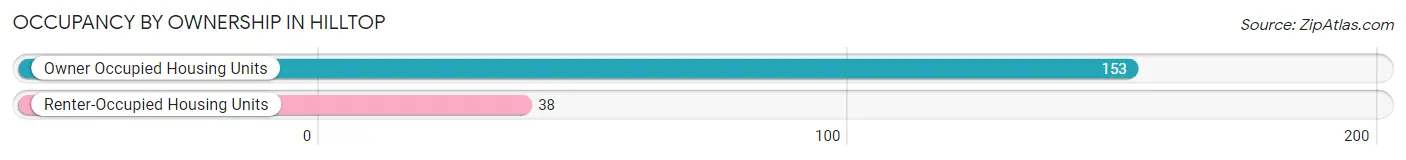
| Occupancy | # Housing Units | % Housing Units |
| Owner Occupied Housing Units | 153 | 80.1% |
| Renter-Occupied Housing Units | 38 | 19.9% |
| Total Occupied Housing Units | 191 | 100.0% |
Occupancy by Household Size in Hilltop
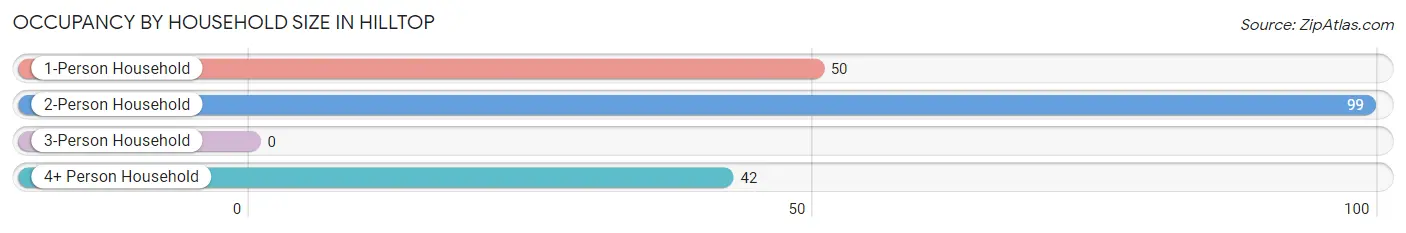
| Household Size | # Housing Units | % Housing Units |
| 1-Person Household | 50 | 26.2% |
| 2-Person Household | 99 | 51.8% |
| 3-Person Household | 0 | 0.0% |
| 4+ Person Household | 42 | 22.0% |
| Total Housing Units | 191 | 100.0% |
Occupancy by Ownership by Household Size in Hilltop
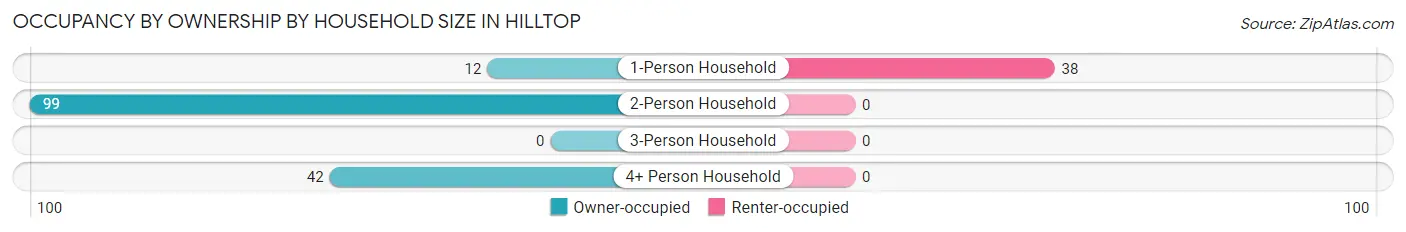
| Household Size | Owner-occupied | Renter-occupied |
| 1-Person Household | 12 (24.0%) | 38 (76.0%) |
| 2-Person Household | 99 (100.0%) | 0 (0.0%) |
| 3-Person Household | 0 (0.0%) | 0 (0.0%) |
| 4+ Person Household | 42 (100.0%) | 0 (0.0%) |
| Total Housing Units | 153 (80.1%) | 38 (19.9%) |
Occupancy by Educational Attainment in Hilltop
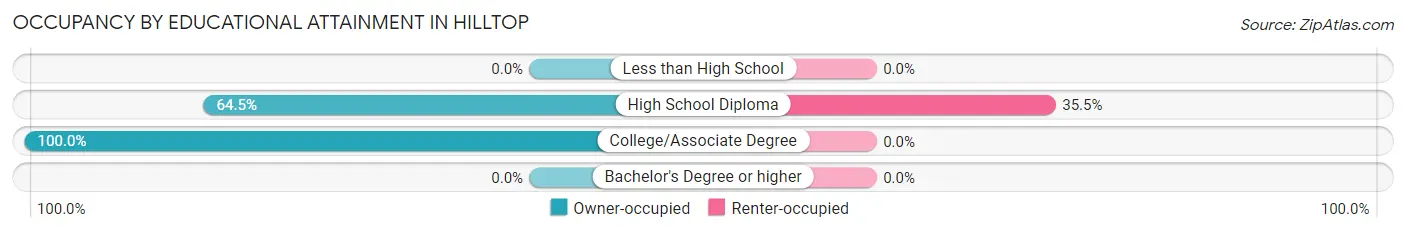
| Household Size | Owner-occupied | Renter-occupied |
| Less than High School | 0 (0.0%) | 0 (0.0%) |
| High School Diploma | 69 (64.5%) | 38 (35.5%) |
| College/Associate Degree | 84 (100.0%) | 0 (0.0%) |
| Bachelor's Degree or higher | 0 (0.0%) | 0 (0.0%) |
Occupancy by Age of Householder in Hilltop
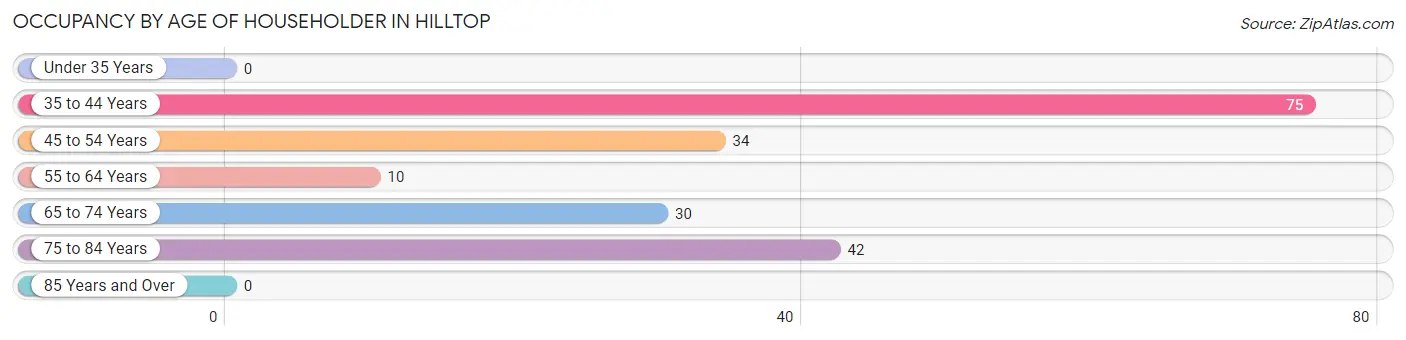
| Age Bracket | # Households | % Households |
| Under 35 Years | 0 | 0.0% |
| 35 to 44 Years | 75 | 39.3% |
| 45 to 54 Years | 34 | 17.8% |
| 55 to 64 Years | 10 | 5.2% |
| 65 to 74 Years | 30 | 15.7% |
| 75 to 84 Years | 42 | 22.0% |
| 85 Years and Over | 0 | 0.0% |
| Total | 191 | 100.0% |
Housing Finances in Hilltop
Median Income by Occupancy in Hilltop
| Occupancy Type | # Households | Median Income |
| Owner-Occupied | 153 (80.1%) | $0 |
| Renter-Occupied | 38 (19.9%) | $0 |
| Average | 191 (100.0%) | $0 |
Occupancy by Householder Income Bracket in Hilltop
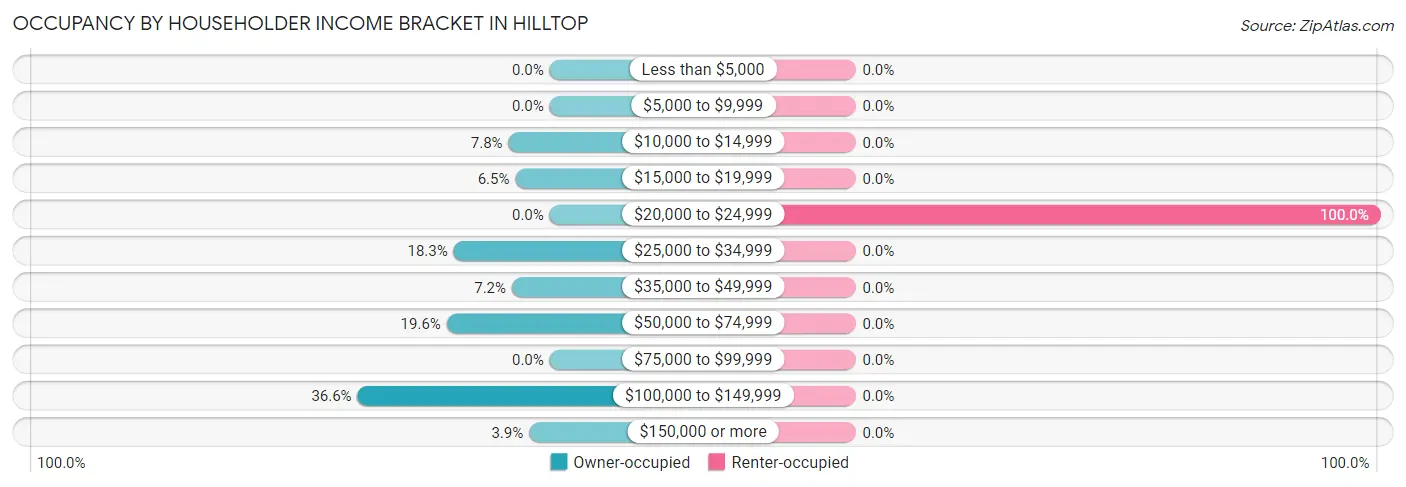
| Income Bracket | Owner-occupied | Renter-occupied |
| Less than $5,000 | 0 (0.0%) | 0 (0.0%) |
| $5,000 to $9,999 | 0 (0.0%) | 0 (0.0%) |
| $10,000 to $14,999 | 12 (7.8%) | 0 (0.0%) |
| $15,000 to $19,999 | 10 (6.5%) | 0 (0.0%) |
| $20,000 to $24,999 | 0 (0.0%) | 38 (100.0%) |
| $25,000 to $34,999 | 28 (18.3%) | 0 (0.0%) |
| $35,000 to $49,999 | 11 (7.2%) | 0 (0.0%) |
| $50,000 to $74,999 | 30 (19.6%) | 0 (0.0%) |
| $75,000 to $99,999 | 0 (0.0%) | 0 (0.0%) |
| $100,000 to $149,999 | 56 (36.6%) | 0 (0.0%) |
| $150,000 or more | 6 (3.9%) | 0 (0.0%) |
| Total | 153 (100.0%) | 38 (100.0%) |
Monthly Housing Cost Tiers in Hilltop
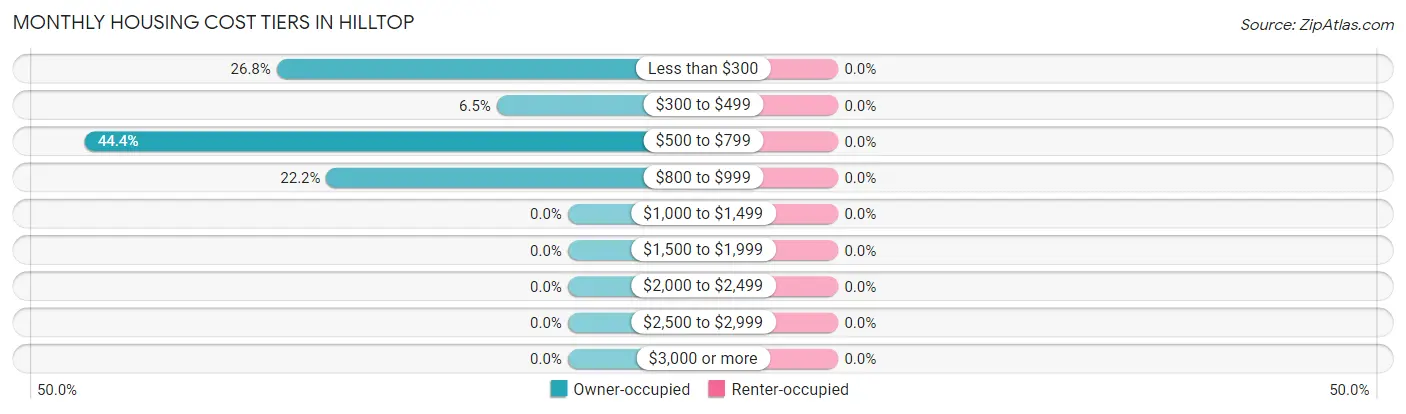
| Monthly Cost | Owner-occupied | Renter-occupied |
| Less than $300 | 41 (26.8%) | 0 (0.0%) |
| $300 to $499 | 10 (6.5%) | 0 (0.0%) |
| $500 to $799 | 68 (44.4%) | 0 (0.0%) |
| $800 to $999 | 34 (22.2%) | 0 (0.0%) |
| $1,000 to $1,499 | 0 (0.0%) | 0 (0.0%) |
| $1,500 to $1,999 | 0 (0.0%) | 0 (0.0%) |
| $2,000 to $2,499 | 0 (0.0%) | 0 (0.0%) |
| $2,500 to $2,999 | 0 (0.0%) | 0 (0.0%) |
| $3,000 or more | 0 (0.0%) | 0 (0.0%) |
| Total | 153 (100.0%) | 38 (100.0%) |
Physical Housing Characteristics in Hilltop
Housing Structures in Hilltop
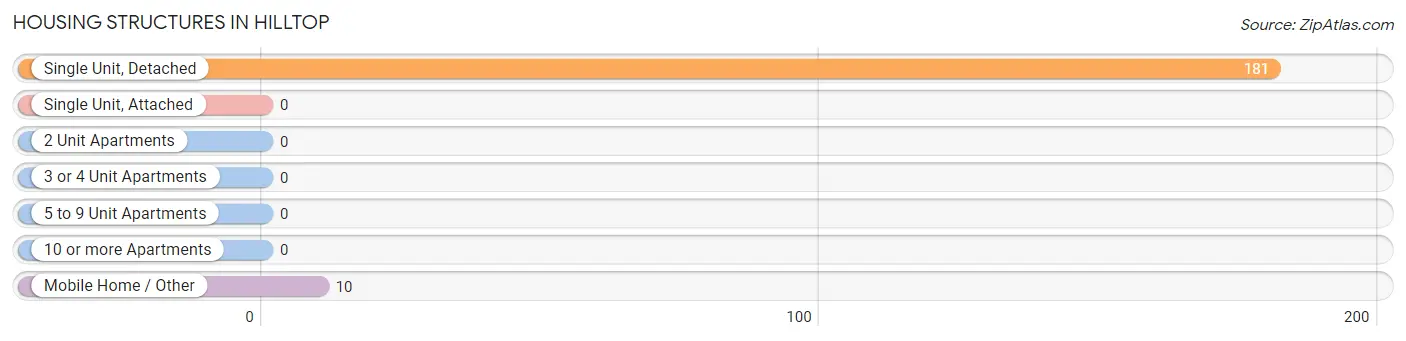
| Structure Type | # Housing Units | % Housing Units |
| Single Unit, Detached | 181 | 94.8% |
| Single Unit, Attached | 0 | 0.0% |
| 2 Unit Apartments | 0 | 0.0% |
| 3 or 4 Unit Apartments | 0 | 0.0% |
| 5 to 9 Unit Apartments | 0 | 0.0% |
| 10 or more Apartments | 0 | 0.0% |
| Mobile Home / Other | 10 | 5.2% |
| Total | 191 | 100.0% |
Housing Structures by Occupancy in Hilltop
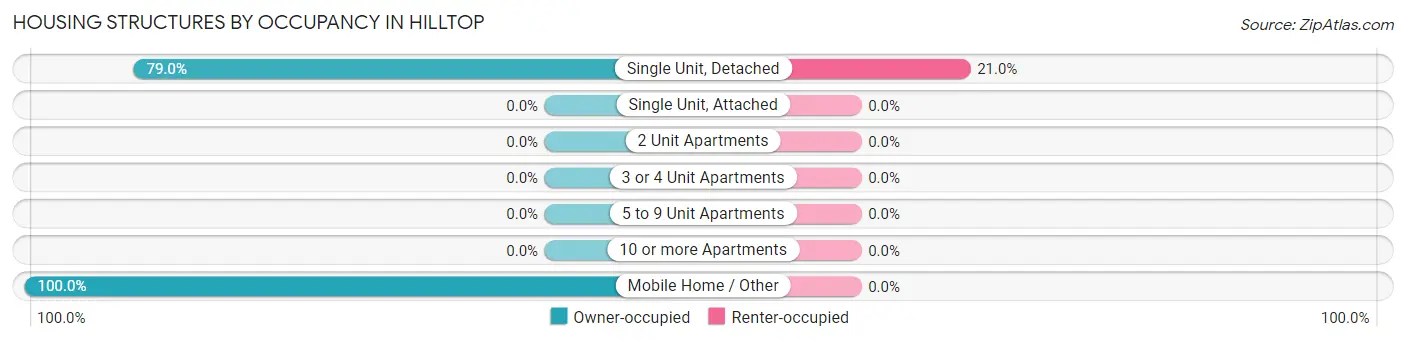
| Structure Type | Owner-occupied | Renter-occupied |
| Single Unit, Detached | 143 (79.0%) | 38 (21.0%) |
| Single Unit, Attached | 0 (0.0%) | 0 (0.0%) |
| 2 Unit Apartments | 0 (0.0%) | 0 (0.0%) |
| 3 or 4 Unit Apartments | 0 (0.0%) | 0 (0.0%) |
| 5 to 9 Unit Apartments | 0 (0.0%) | 0 (0.0%) |
| 10 or more Apartments | 0 (0.0%) | 0 (0.0%) |
| Mobile Home / Other | 10 (100.0%) | 0 (0.0%) |
| Total | 153 (80.1%) | 38 (19.9%) |
Housing Structures by Number of Rooms in Hilltop
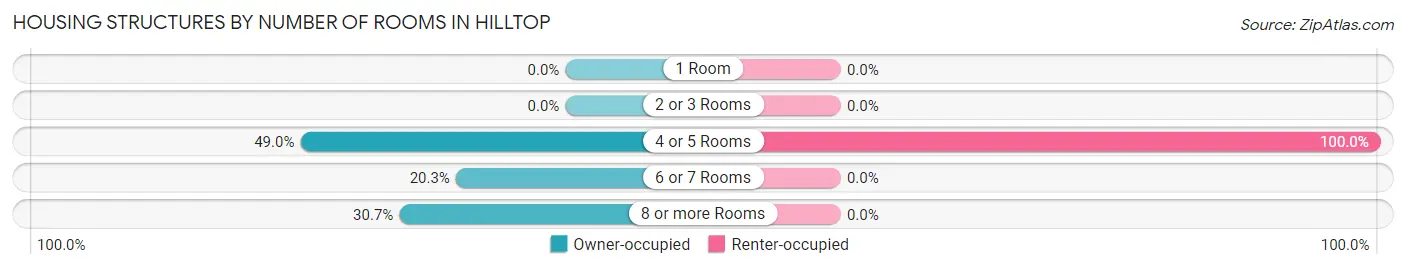
| Number of Rooms | Owner-occupied | Renter-occupied |
| 1 Room | 0 (0.0%) | 0 (0.0%) |
| 2 or 3 Rooms | 0 (0.0%) | 0 (0.0%) |
| 4 or 5 Rooms | 75 (49.0%) | 38 (100.0%) |
| 6 or 7 Rooms | 31 (20.3%) | 0 (0.0%) |
| 8 or more Rooms | 47 (30.7%) | 0 (0.0%) |
| Total | 153 (100.0%) | 38 (100.0%) |
Housing Structure by Heating Type in Hilltop
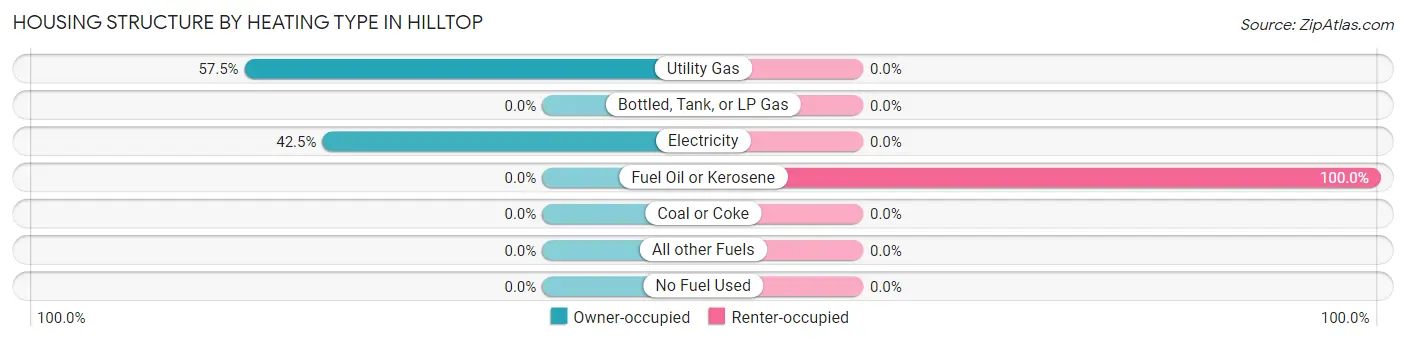
| Heating Type | Owner-occupied | Renter-occupied |
| Utility Gas | 88 (57.5%) | 0 (0.0%) |
| Bottled, Tank, or LP Gas | 0 (0.0%) | 0 (0.0%) |
| Electricity | 65 (42.5%) | 0 (0.0%) |
| Fuel Oil or Kerosene | 0 (0.0%) | 38 (100.0%) |
| Coal or Coke | 0 (0.0%) | 0 (0.0%) |
| All other Fuels | 0 (0.0%) | 0 (0.0%) |
| No Fuel Used | 0 (0.0%) | 0 (0.0%) |
| Total | 153 (100.0%) | 38 (100.0%) |
Household Vehicle Usage in Hilltop
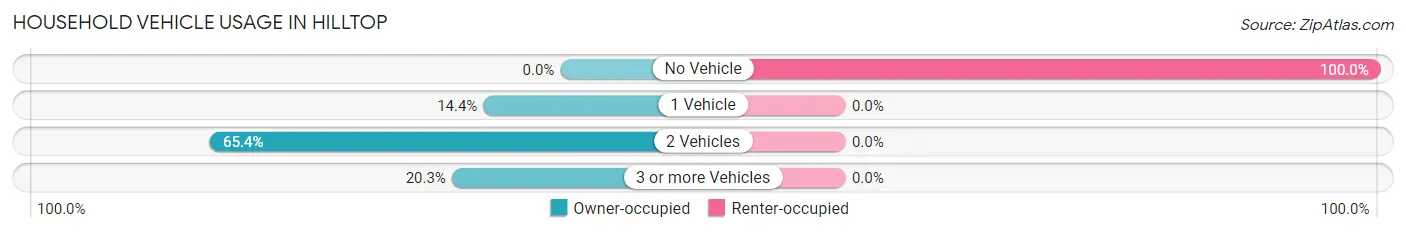
| Vehicles per Household | Owner-occupied | Renter-occupied |
| No Vehicle | 0 (0.0%) | 38 (100.0%) |
| 1 Vehicle | 22 (14.4%) | 0 (0.0%) |
| 2 Vehicles | 100 (65.4%) | 0 (0.0%) |
| 3 or more Vehicles | 31 (20.3%) | 0 (0.0%) |
| Total | 153 (100.0%) | 38 (100.0%) |
Real Estate & Mortgages in Hilltop
Real Estate and Mortgage Overview in Hilltop
| Characteristic | Without Mortgage | With Mortgage |
| Housing Units | 119 | 34 |
| Median Property Value | $101,200 | $0 |
| Median Household Income | - | - |
| Monthly Housing Costs | $513 | $0 |
| Real Estate Taxes | $278 | $0 |
Property Value by Mortgage Status in Hilltop
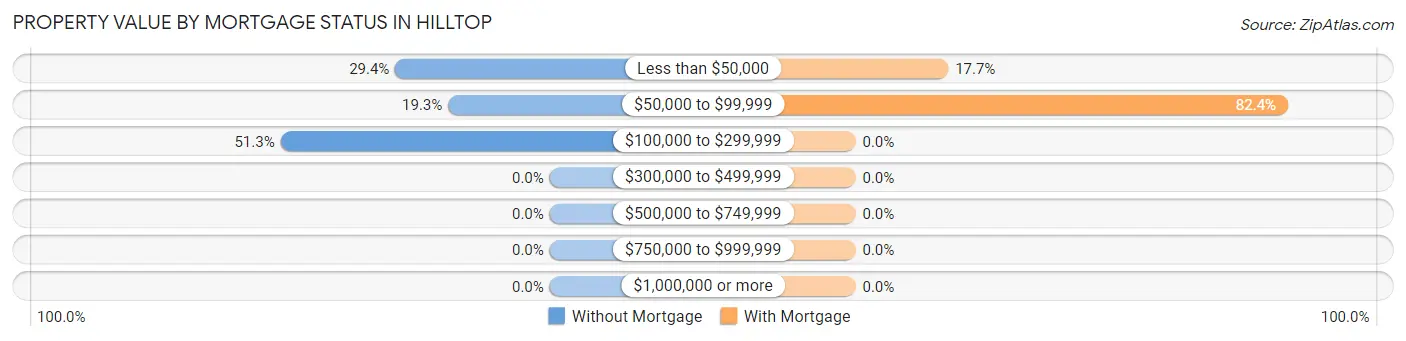
| Property Value | Without Mortgage | With Mortgage |
| Less than $50,000 | 35 (29.4%) | 6 (17.6%) |
| $50,000 to $99,999 | 23 (19.3%) | 28 (82.4%) |
| $100,000 to $299,999 | 61 (51.3%) | 0 (0.0%) |
| $300,000 to $499,999 | 0 (0.0%) | 0 (0.0%) |
| $500,000 to $749,999 | 0 (0.0%) | 0 (0.0%) |
| $750,000 to $999,999 | 0 (0.0%) | 0 (0.0%) |
| $1,000,000 or more | 0 (0.0%) | 0 (0.0%) |
| Total | 119 (100.0%) | 34 (100.0%) |
Household Income by Mortgage Status in Hilltop
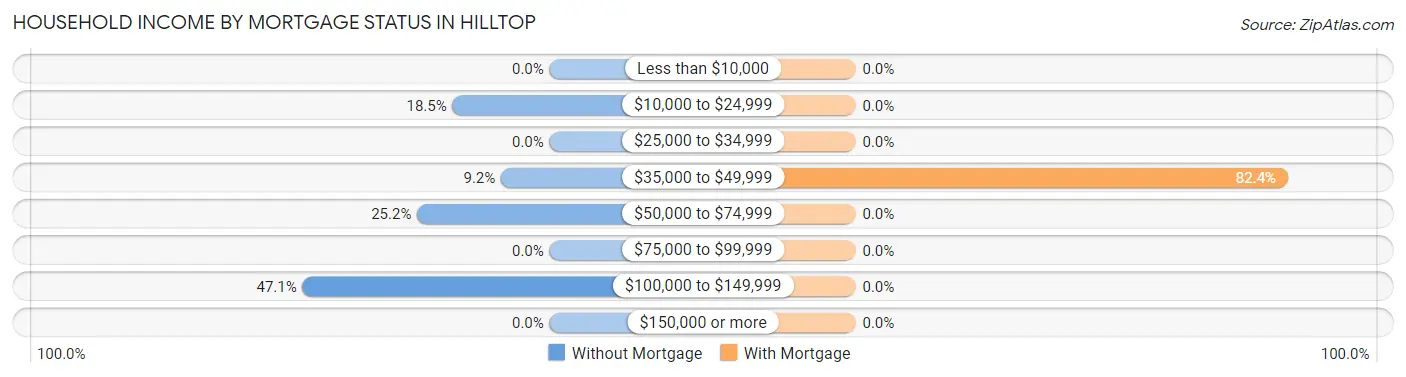
| Household Income | Without Mortgage | With Mortgage |
| Less than $10,000 | 0 (0.0%) | 0 (0.0%) |
| $10,000 to $24,999 | 22 (18.5%) | 0 (0.0%) |
| $25,000 to $34,999 | 0 (0.0%) | 0 (0.0%) |
| $35,000 to $49,999 | 11 (9.2%) | 28 (82.4%) |
| $50,000 to $74,999 | 30 (25.2%) | 0 (0.0%) |
| $75,000 to $99,999 | 0 (0.0%) | 0 (0.0%) |
| $100,000 to $149,999 | 56 (47.1%) | 0 (0.0%) |
| $150,000 or more | 0 (0.0%) | 0 (0.0%) |
| Total | 119 (100.0%) | 34 (100.0%) |
Property Value to Household Income Ratio in Hilltop
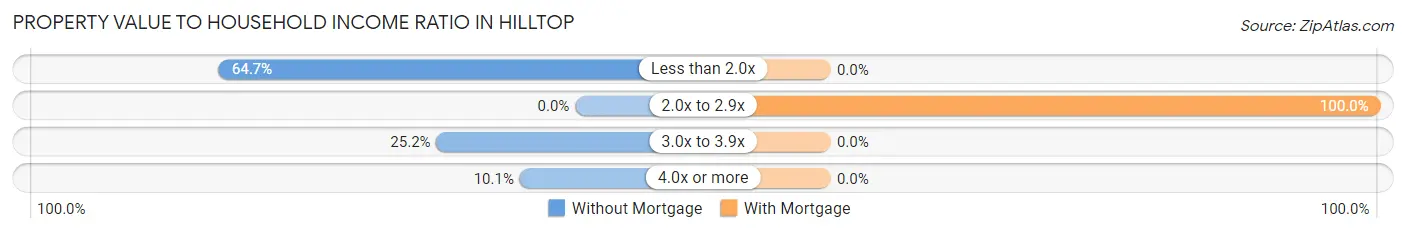
| Value-to-Income Ratio | Without Mortgage | With Mortgage |
| Less than 2.0x | 77 (64.7%) | 0 (0.0%) |
| 2.0x to 2.9x | 0 (0.0%) | 34 (100.0%) |
| 3.0x to 3.9x | 30 (25.2%) | 0 (0.0%) |
| 4.0x or more | 12 (10.1%) | 0 (0.0%) |
| Total | 119 (100.0%) | 34 (100.0%) |
Real Estate Taxes by Mortgage Status in Hilltop
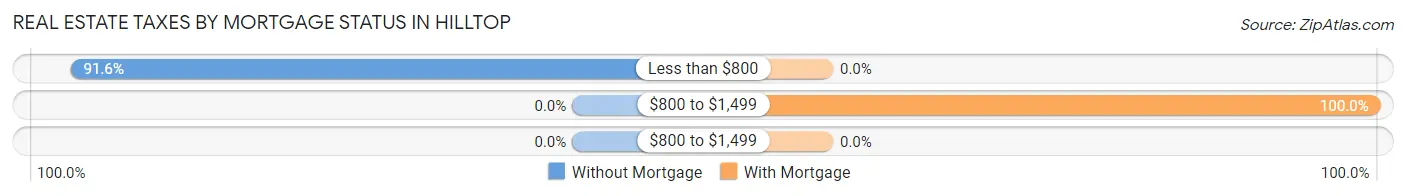
| Property Taxes | Without Mortgage | With Mortgage |
| Less than $800 | 109 (91.6%) | 0 (0.0%) |
| $800 to $1,499 | 0 (0.0%) | 34 (100.0%) |
| $800 to $1,499 | 0 (0.0%) | 0 (0.0%) |
| Total | 119 (100.0%) | 34 (100.0%) |
Health & Disability in Hilltop
Health Insurance Coverage by Age in Hilltop
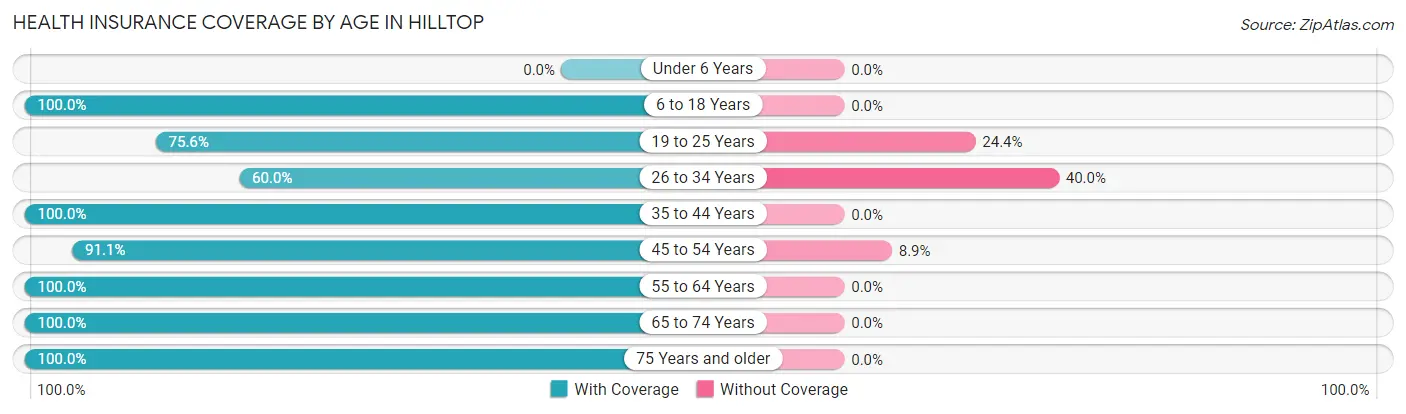
| Age Bracket | With Coverage | Without Coverage |
| Under 6 Years | 0 (0.0%) | 0 (0.0%) |
| 6 to 18 Years | 61 (100.0%) | 0 (0.0%) |
| 19 to 25 Years | 34 (75.6%) | 11 (24.4%) |
| 26 to 34 Years | 9 (60.0%) | 6 (40.0%) |
| 35 to 44 Years | 75 (100.0%) | 0 (0.0%) |
| 45 to 54 Years | 144 (91.1%) | 14 (8.9%) |
| 55 to 64 Years | 52 (100.0%) | 0 (0.0%) |
| 65 to 74 Years | 30 (100.0%) | 0 (0.0%) |
| 75 Years and older | 148 (100.0%) | 0 (0.0%) |
| Total | 553 (94.7%) | 31 (5.3%) |
Health Insurance Coverage by Citizenship Status in Hilltop
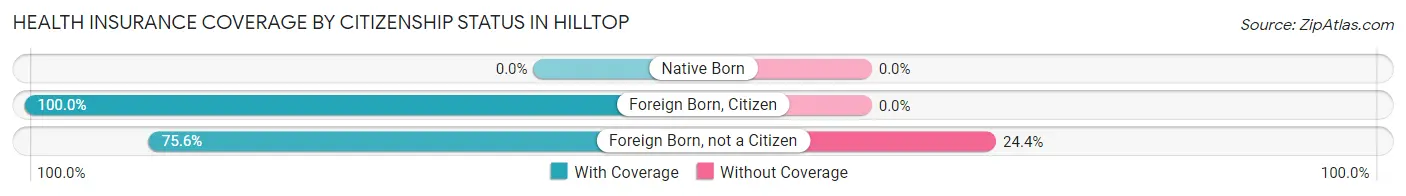
| Citizenship Status | With Coverage | Without Coverage |
| Native Born | 0 (0.0%) | 0 (0.0%) |
| Foreign Born, Citizen | 61 (100.0%) | 0 (0.0%) |
| Foreign Born, not a Citizen | 34 (75.6%) | 11 (24.4%) |
Health Insurance Coverage by Household Income in Hilltop
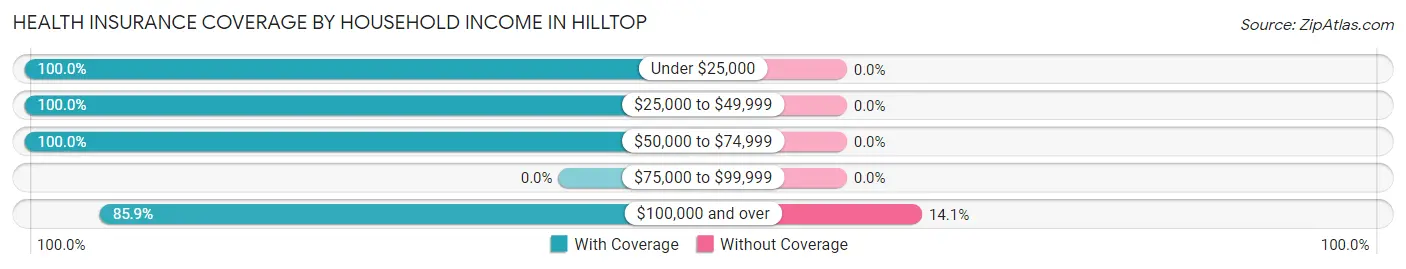
| Household Income | With Coverage | Without Coverage |
| Under $25,000 | 72 (100.0%) | 0 (0.0%) |
| $25,000 to $49,999 | 131 (100.0%) | 0 (0.0%) |
| $50,000 to $74,999 | 66 (100.0%) | 0 (0.0%) |
| $75,000 to $99,999 | 0 (0.0%) | 0 (0.0%) |
| $100,000 and over | 189 (85.9%) | 31 (14.1%) |
Public vs Private Health Insurance Coverage by Age in Hilltop
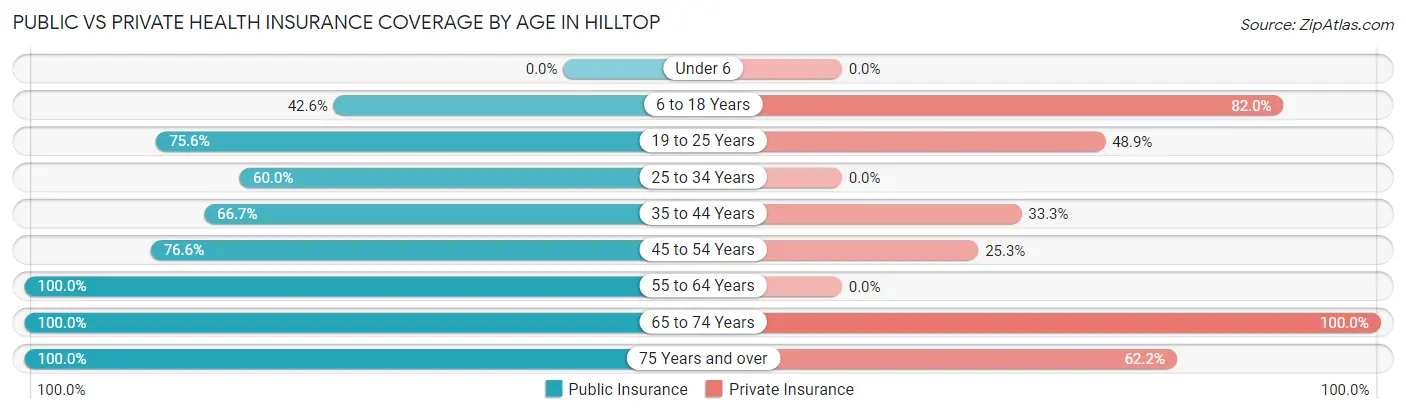
| Age Bracket | Public Insurance | Private Insurance |
| Under 6 | 0 (0.0%) | 0 (0.0%) |
| 6 to 18 Years | 26 (42.6%) | 50 (82.0%) |
| 19 to 25 Years | 34 (75.6%) | 22 (48.9%) |
| 25 to 34 Years | 9 (60.0%) | 0 (0.0%) |
| 35 to 44 Years | 50 (66.7%) | 25 (33.3%) |
| 45 to 54 Years | 121 (76.6%) | 40 (25.3%) |
| 55 to 64 Years | 52 (100.0%) | 0 (0.0%) |
| 65 to 74 Years | 30 (100.0%) | 30 (100.0%) |
| 75 Years and over | 148 (100.0%) | 92 (62.2%) |
| Total | 470 (80.5%) | 259 (44.4%) |
Disability Status by Sex by Age in Hilltop
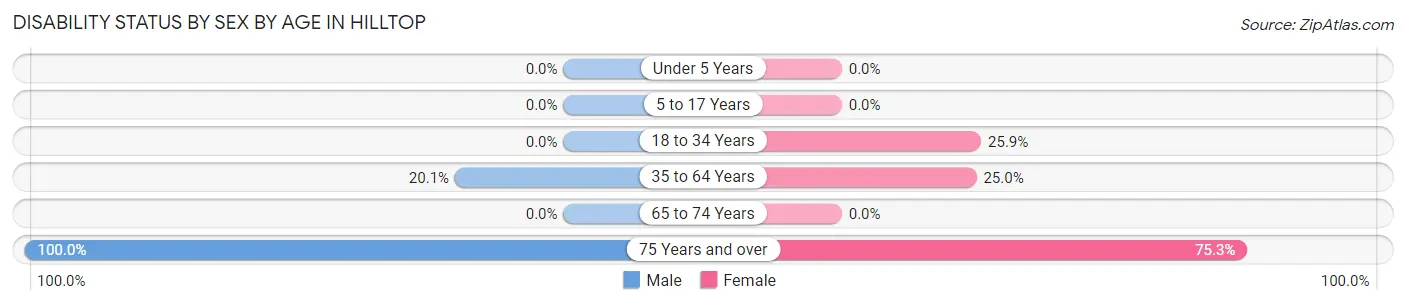
| Age Bracket | Male | Female |
| Under 5 Years | 0 (0.0%) | 0 (0.0%) |
| 5 to 17 Years | 0 (0.0%) | 0 (0.0%) |
| 18 to 34 Years | 0 (0.0%) | 15 (25.9%) |
| 35 to 64 Years | 30 (20.1%) | 34 (25.0%) |
| 65 to 74 Years | 0 (0.0%) | 0 (0.0%) |
| 75 Years and over | 47 (100.0%) | 76 (75.2%) |
Disability Class by Sex by Age in Hilltop
Disability Class: Hearing Difficulty
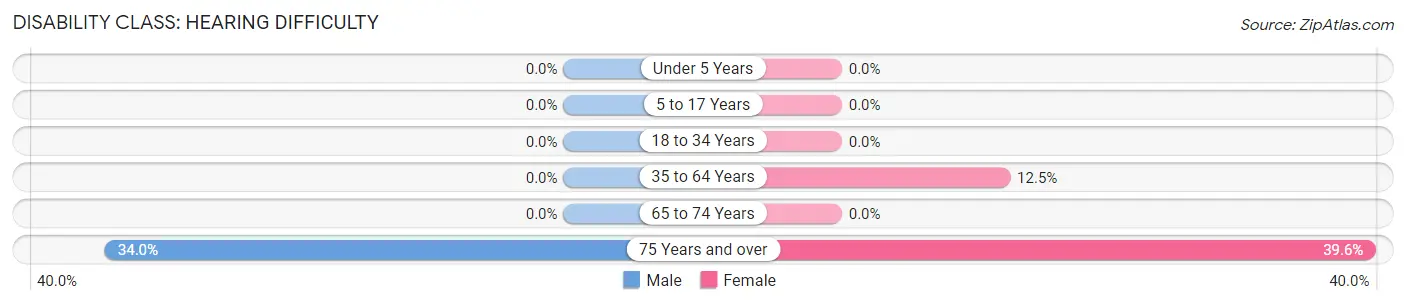
| Age Bracket | Male | Female |
| Under 5 Years | 0 (0.0%) | 0 (0.0%) |
| 5 to 17 Years | 0 (0.0%) | 0 (0.0%) |
| 18 to 34 Years | 0 (0.0%) | 0 (0.0%) |
| 35 to 64 Years | 0 (0.0%) | 17 (12.5%) |
| 65 to 74 Years | 0 (0.0%) | 0 (0.0%) |
| 75 Years and over | 16 (34.0%) | 40 (39.6%) |
Disability Class: Vision Difficulty
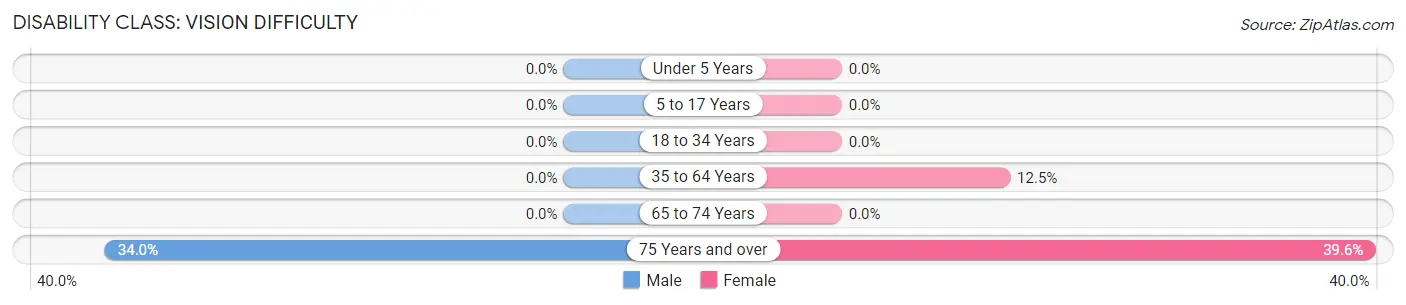
| Age Bracket | Male | Female |
| Under 5 Years | 0 (0.0%) | 0 (0.0%) |
| 5 to 17 Years | 0 (0.0%) | 0 (0.0%) |
| 18 to 34 Years | 0 (0.0%) | 0 (0.0%) |
| 35 to 64 Years | 0 (0.0%) | 17 (12.5%) |
| 65 to 74 Years | 0 (0.0%) | 0 (0.0%) |
| 75 Years and over | 16 (34.0%) | 40 (39.6%) |
Disability Class: Cognitive Difficulty
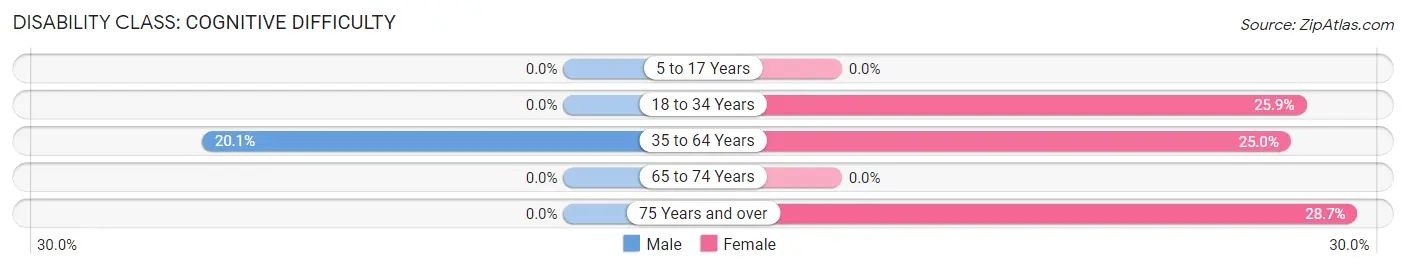
| Age Bracket | Male | Female |
| 5 to 17 Years | 0 (0.0%) | 0 (0.0%) |
| 18 to 34 Years | 0 (0.0%) | 15 (25.9%) |
| 35 to 64 Years | 30 (20.1%) | 34 (25.0%) |
| 65 to 74 Years | 0 (0.0%) | 0 (0.0%) |
| 75 Years and over | 0 (0.0%) | 29 (28.7%) |
Disability Class: Ambulatory Difficulty
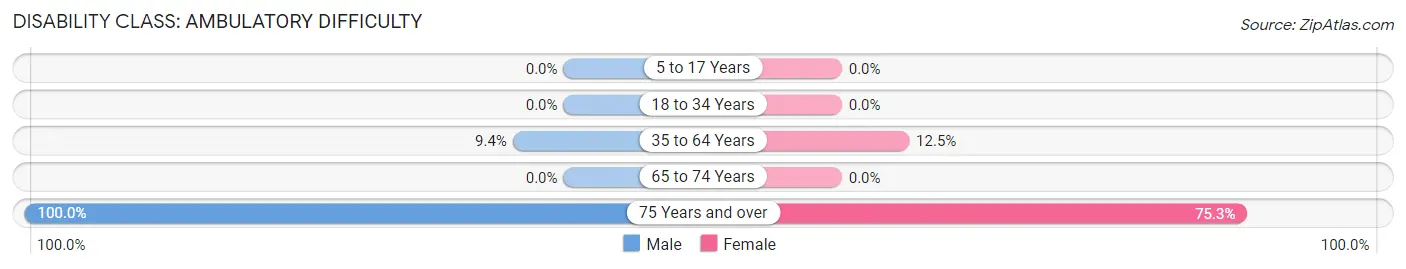
| Age Bracket | Male | Female |
| 5 to 17 Years | 0 (0.0%) | 0 (0.0%) |
| 18 to 34 Years | 0 (0.0%) | 0 (0.0%) |
| 35 to 64 Years | 14 (9.4%) | 17 (12.5%) |
| 65 to 74 Years | 0 (0.0%) | 0 (0.0%) |
| 75 Years and over | 47 (100.0%) | 76 (75.2%) |
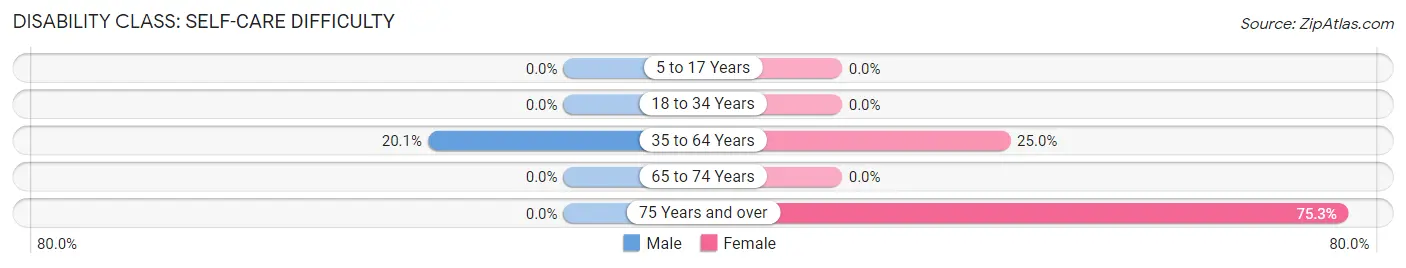
Disability Class: Self-Care Difficulty
| Age Bracket | Male | Female |
| 5 to 17 Years | 0 (0.0%) | 0 (0.0%) |
| 18 to 34 Years | 0 (0.0%) | 0 (0.0%) |
| 35 to 64 Years | 30 (20.1%) | 34 (25.0%) |
| 65 to 74 Years | 0 (0.0%) | 0 (0.0%) |
| 75 Years and over | 0 (0.0%) | 76 (75.2%) |
Technology Access in Hilltop
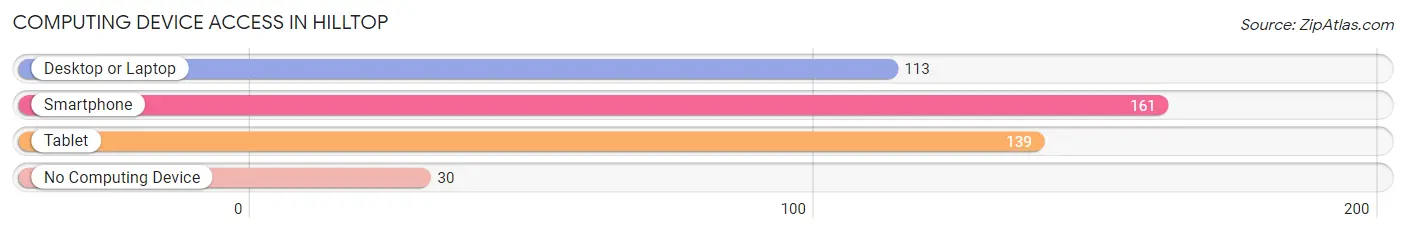
Computing Device Access in Hilltop
| Device Type | # Households | % Households |
| Desktop or Laptop | 113 | 59.2% |
| Smartphone | 161 | 84.3% |
| Tablet | 139 | 72.8% |
| No Computing Device | 30 | 15.7% |
| Total | 191 | 100.0% |
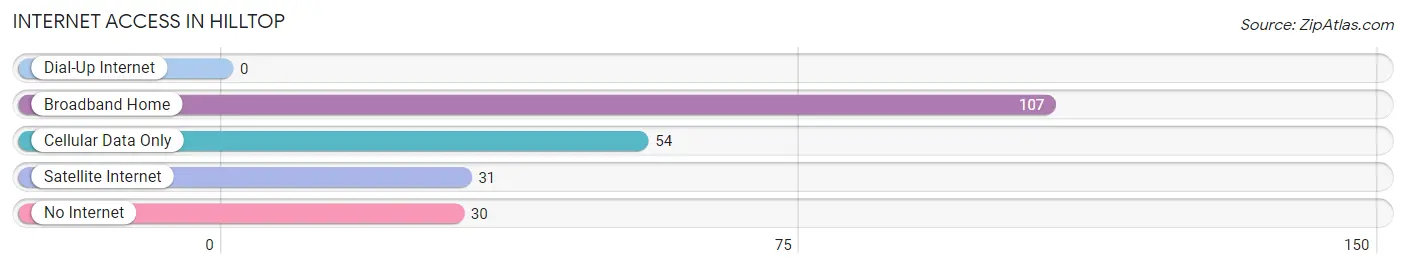
Internet Access in Hilltop
| Internet Type | # Households | % Households |
| Dial-Up Internet | 0 | 0.0% |
| Broadband Home | 107 | 56.0% |
| Cellular Data Only | 54 | 28.3% |
| Satellite Internet | 31 | 16.2% |
| No Internet | 30 | 15.7% |
| Total | 191 | 100.0% |
Hilltop Summary
Hilltop, West Virginia is a small town located in the eastern part of the state, in the Appalachian Mountains. It is situated in the heart of the Monongahela National Forest, and is surrounded by lush forests and rolling hills. The town is home to just over 1,000 people, and is a popular destination for outdoor recreation.
History
Hilltop was founded in the late 1800s by a group of settlers from Pennsylvania. The town was originally called “Hilltop Station”, and was a stop on the Baltimore and Ohio Railroad. The town was officially incorporated in 1891, and the name was changed to Hilltop.
The town grew slowly over the years, and by the early 1900s, it had become a popular destination for outdoor recreation. The town was home to several resorts, and was a popular spot for fishing, hunting, and camping.
In the 1950s, the town began to decline as the railroad industry declined. The town’s population dropped from over 1,000 in 1950 to just over 500 in 1970.
Geography
Hilltop is located in the eastern part of West Virginia, in the Appalachian Mountains. The town is situated in the heart of the Monongahela National Forest, and is surrounded by lush forests and rolling hills. The town is located at an elevation of 1,800 feet, and is about 30 miles from the state capital of Charleston.
The town is located on the banks of the Cheat River, and is home to several small lakes and streams. The town is also home to several hiking trails, and is a popular destination for outdoor recreation.
Economy
The economy of Hilltop is largely based on tourism and outdoor recreation. The town is home to several resorts, and is a popular destination for fishing, hunting, and camping. The town is also home to several small businesses, including restaurants, shops, and a few small manufacturing companies.
The town is also home to several small farms, and is a popular destination for farmers’ markets. The town is also home to several wineries, and is a popular destination for wine tasting.
Demographics
As of the 2010 census, Hilltop had a population of 1,072. The town is predominantly white, with 95.3% of the population being white. The town is also home to a small Hispanic population, with 2.2% of the population being Hispanic. The town is also home to a small African American population, with 1.2% of the population being African American.
The median household income in Hilltop is $37,500, and the median home value is $90,000. The town has a poverty rate of 16.3%, and the unemployment rate is 5.3%.
Conclusion
Hilltop, West Virginia is a small town located in the eastern part of the state, in the Appalachian Mountains. The town is home to just over 1,000 people, and is a popular destination for outdoor recreation. The town’s economy is largely based on tourism and outdoor recreation, and the town is home to several small businesses, farms, and wineries. The town is predominantly white, with 95.3% of the population being white. The median household income in Hilltop is $37,500, and the median home value is $90,000.
Common Questions
What is the Total Population of Hilltop?
Total Population of Hilltop is 603.
What is the Total Male Population of Hilltop?
Total Male Population of Hilltop is 252.
What is the Total Female Population of Hilltop?
Total Female Population of Hilltop is 351.
What is the Ratio of Males per 100 Females in Hilltop?
There are 71.79 Males per 100 Females in Hilltop.
What is the Ratio of Females per 100 Males in Hilltop?
There are 139.29 Females per 100 Males in Hilltop.
What is the Median Population Age in Hilltop?
Median Population Age in Hilltop is 48.8 Years.
What is the Average Family Size in Hilltop
Average Family Size in Hilltop is 3.0 People.
What is the Average Household Size in Hilltop
Average Household Size in Hilltop is 2.6 People.
What is Per Capita Income in Hilltop?
Per Capita income in Hilltop is $22,015.
What is Inequality or Gini Index in Hilltop?
Inequality or Gini Index in Hilltop is 0.39.
How Large is the Labor Force in Hilltop?
There are 229 People in the Labor Forcein in Hilltop.
What is the Percentage of People in the Labor Force in Hilltop?
40.3% of People are in the Labor Force in Hilltop.
What is the Unemployment Rate in Hilltop?
Unemployment Rate in Hilltop is 12.7%.