Cities with the Highest Percentage of Population Employed in Transportation & Warehousing in Washington
RELATED REPORTS & OPTIONS
Transportation & Warehousing
Washington
Compare Cities
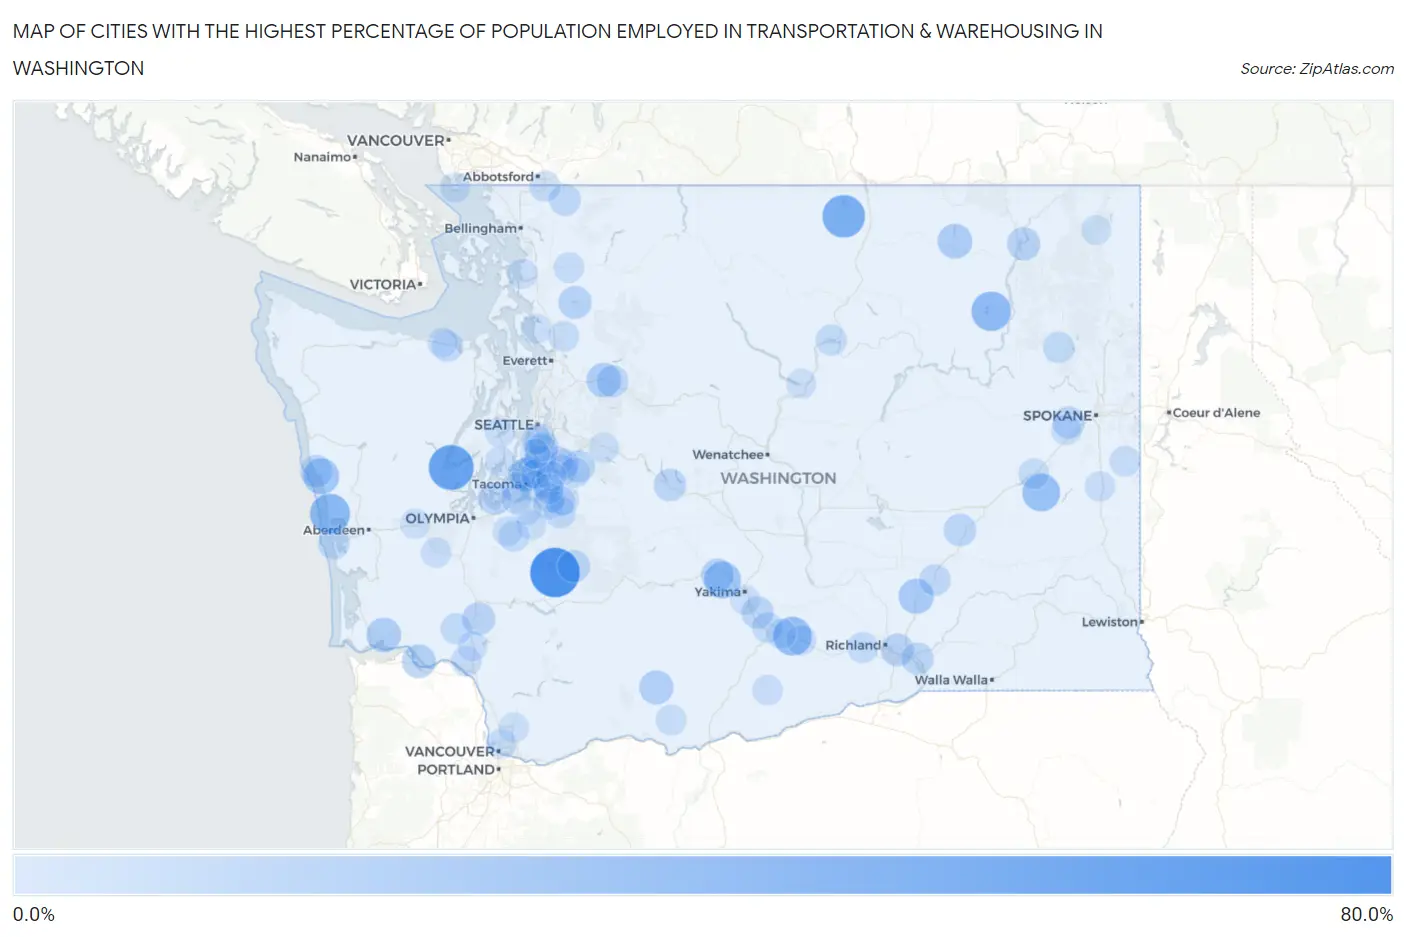
Map of Cities with the Highest Percentage of Population Employed in Transportation & Warehousing in Washington
0.0%
80.0%
Cities with the Highest Percentage of Population Employed in Transportation & Warehousing in Washington
| City | % Employed | vs State | vs National | |
| 1. | Mineral | 65.5% | 4.9%(+60.5)#1 | 4.9%(+60.5)#57 |
| 2. | Union | 51.8% | 4.9%(+46.8)#2 | 4.9%(+46.8)#107 |
| 3. | Loomis | 44.4% | 4.9%(+39.5)#3 | 4.9%(+39.5)#164 |
| 4. | Ocean City | 37.0% | 4.9%(+32.0)#4 | 4.9%(+32.0)#225 |
| 5. | Twin Lakes | 35.3% | 4.9%(+30.4)#5 | 4.9%(+30.3)#257 |
| 6. | Ocosta | 33.3% | 4.9%(+28.4)#6 | 4.9%(+28.4)#297 |
| 7. | Outlook | 32.7% | 4.9%(+27.8)#7 | 4.9%(+27.8)#318 |
| 8. | Lamont | 30.2% | 4.9%(+25.3)#8 | 4.9%(+25.2)#359 |
| 9. | Crescent Bar | 29.3% | 4.9%(+24.4)#9 | 4.9%(+24.3)#384 |
| 10. | Cowiche | 27.7% | 4.9%(+22.8)#10 | 4.9%(+22.8)#440 |
| 11. | Santiago | 25.0% | 4.9%(+20.1)#11 | 4.9%(+20.1)#546 |
| 12. | Schwana | 23.8% | 4.9%(+18.9)#12 | 4.9%(+18.9)#592 |
| 13. | Mesa | 22.4% | 4.9%(+17.5)#13 | 4.9%(+17.4)#668 |
| 14. | Torboy | 21.4% | 4.9%(+16.5)#14 | 4.9%(+16.4)#733 |
| 15. | Deep River | 21.1% | 4.9%(+16.1)#15 | 4.9%(+16.1)#754 |
| 16. | Startup | 20.6% | 4.9%(+15.7)#16 | 4.9%(+15.6)#790 |
| 17. | Glenwood | 19.5% | 4.9%(+14.6)#17 | 4.9%(+14.5)#873 |
| 18. | Puget Island | 18.7% | 4.9%(+13.8)#18 | 4.9%(+13.8)#938 |
| 19. | Dash Point | 18.7% | 4.9%(+13.8)#19 | 4.9%(+13.7)#942 |
| 20. | Browns Point | 17.7% | 4.9%(+12.8)#20 | 4.9%(+12.7)#1,063 |
| 21. | Marcus | 17.0% | 4.9%(+12.1)#21 | 4.9%(+12.1)#1,155 |
| 22. | Lake Cavanaugh | 16.7% | 4.9%(+11.8)#22 | 4.9%(+11.7)#1,216 |
| 23. | Tieton | 16.5% | 4.9%(+11.6)#23 | 4.9%(+11.6)#1,258 |
| 24. | Seatac | 16.3% | 4.9%(+11.4)#24 | 4.9%(+11.3)#1,295 |
| 25. | Toledo | 16.2% | 4.9%(+11.3)#25 | 4.9%(+11.3)#1,308 |
| 26. | West Pasco | 15.8% | 4.9%(+10.9)#26 | 4.9%(+10.8)#1,377 |
| 27. | Taholah | 15.4% | 4.9%(+10.5)#27 | 4.9%(+10.5)#1,444 |
| 28. | Anderson Island | 15.3% | 4.9%(+10.4)#28 | 4.9%(+10.4)#1,474 |
| 29. | Lind | 15.3% | 4.9%(+10.4)#29 | 4.9%(+10.4)#1,476 |
| 30. | Ashford | 15.1% | 4.9%(+10.1)#30 | 4.9%(+10.1)#1,524 |
| 31. | Ravensdale | 15.0% | 4.9%(+10.1)#31 | 4.9%(+10.1)#1,531 |
| 32. | Easton | 14.9% | 4.9%(+9.95)#32 | 4.9%(+9.92)#1,570 |
| 33. | Donald | 14.4% | 4.9%(+9.52)#33 | 4.9%(+9.49)#1,674 |
| 34. | Burbank | 14.2% | 4.9%(+9.28)#34 | 4.9%(+9.24)#1,754 |
| 35. | Pacific | 14.0% | 4.9%(+9.10)#35 | 4.9%(+9.07)#1,789 |
| 36. | Fairchild Afb | 13.9% | 4.9%(+8.97)#36 | 4.9%(+8.94)#1,820 |
| 37. | May Creek | 13.7% | 4.9%(+8.75)#37 | 4.9%(+8.72)#1,882 |
| 38. | Maple Falls | 13.2% | 4.9%(+8.26)#38 | 4.9%(+8.23)#2,021 |
| 39. | Connell | 13.0% | 4.9%(+8.07)#39 | 4.9%(+8.03)#2,093 |
| 40. | Westport | 12.2% | 4.9%(+7.33)#40 | 4.9%(+7.30)#2,365 |
| 41. | Springdale | 12.1% | 4.9%(+7.18)#41 | 4.9%(+7.15)#2,427 |
| 42. | Des Moines | 12.1% | 4.9%(+7.16)#42 | 4.9%(+7.13)#2,436 |
| 43. | Crocker | 12.0% | 4.9%(+7.08)#43 | 4.9%(+7.05)#2,468 |
| 44. | Ryderwood | 11.9% | 4.9%(+6.95)#44 | 4.9%(+6.92)#2,515 |
| 45. | Brewster | 11.7% | 4.9%(+6.81)#45 | 4.9%(+6.78)#2,588 |
| 46. | River Road | 11.7% | 4.9%(+6.79)#46 | 4.9%(+6.76)#2,600 |
| 47. | Benton City | 11.3% | 4.9%(+6.36)#47 | 4.9%(+6.33)#2,817 |
| 48. | Mckenna | 11.2% | 4.9%(+6.25)#48 | 4.9%(+6.22)#2,864 |
| 49. | Fife | 11.0% | 4.9%(+6.10)#49 | 4.9%(+6.07)#2,943 |
| 50. | Sumas | 10.9% | 4.9%(+6.03)#50 | 4.9%(+6.00)#2,974 |
| 51. | Toppenish | 10.8% | 4.9%(+5.93)#51 | 4.9%(+5.90)#3,027 |
| 52. | Sisco Heights | 10.6% | 4.9%(+5.69)#52 | 4.9%(+5.66)#3,163 |
| 53. | Fairfield | 10.5% | 4.9%(+5.55)#53 | 4.9%(+5.51)#3,240 |
| 54. | Roche Harbor | 10.4% | 4.9%(+5.51)#54 | 4.9%(+5.48)#3,263 |
| 55. | Mcmillin | 10.4% | 4.9%(+5.47)#55 | 4.9%(+5.44)#3,290 |
| 56. | Klickitat | 10.3% | 4.9%(+5.40)#56 | 4.9%(+5.37)#3,337 |
| 57. | Prairie Heights | 10.1% | 4.9%(+5.21)#57 | 4.9%(+5.17)#3,460 |
| 58. | Sprague | 10.0% | 4.9%(+5.09)#58 | 4.9%(+5.05)#3,527 |
| 59. | Fircrest | 10.0% | 4.9%(+5.08)#59 | 4.9%(+5.05)#3,559 |
| 60. | Longview Heights | 9.9% | 4.9%(+5.01)#60 | 4.9%(+4.97)#3,590 |
| 61. | Alderton | 9.9% | 4.9%(+5.00)#61 | 4.9%(+4.97)#3,594 |
| 62. | Lyman | 9.9% | 4.9%(+4.99)#62 | 4.9%(+4.96)#3,603 |
| 63. | Erlands Point | 9.8% | 4.9%(+4.91)#63 | 4.9%(+4.88)#3,663 |
| 64. | Kent | 9.7% | 4.9%(+4.79)#64 | 4.9%(+4.75)#3,753 |
| 65. | Lake Morton Berrydale | 9.6% | 4.9%(+4.72)#65 | 4.9%(+4.69)#3,803 |
| 66. | Covington | 9.6% | 4.9%(+4.66)#66 | 4.9%(+4.63)#3,852 |
| 67. | Black Diamond | 9.4% | 4.9%(+4.51)#67 | 4.9%(+4.48)#3,966 |
| 68. | Boulevard Park | 9.4% | 4.9%(+4.47)#68 | 4.9%(+4.44)#3,999 |
| 69. | Bickleton | 9.4% | 4.9%(+4.46)#69 | 4.9%(+4.43)#4,012 |
| 70. | Oakville | 9.4% | 4.9%(+4.45)#70 | 4.9%(+4.42)#4,016 |
| 71. | Sunnyside | 9.2% | 4.9%(+4.31)#71 | 4.9%(+4.28)#4,109 |
| 72. | Prairie Ridge | 9.2% | 4.9%(+4.30)#72 | 4.9%(+4.27)#4,115 |
| 73. | Federal Way | 9.2% | 4.9%(+4.28)#73 | 4.9%(+4.25)#4,137 |
| 74. | Clear Lake Cdp Pierce County | 9.1% | 4.9%(+4.18)#74 | 4.9%(+4.14)#4,215 |
| 75. | Bay View | 9.1% | 4.9%(+4.15)#75 | 4.9%(+4.12)#4,266 |
| 76. | Point Roberts | 9.0% | 4.9%(+4.09)#76 | 4.9%(+4.06)#4,299 |
| 77. | Rosalia | 9.0% | 4.9%(+4.07)#77 | 4.9%(+4.04)#4,319 |
| 78. | Medical Lake | 8.8% | 4.9%(+3.91)#78 | 4.9%(+3.87)#4,477 |
| 79. | Hazel Dell | 8.8% | 4.9%(+3.87)#79 | 4.9%(+3.84)#4,517 |
| 80. | Wauna | 8.8% | 4.9%(+3.86)#80 | 4.9%(+3.83)#4,520 |
| 81. | Elma | 8.7% | 4.9%(+3.81)#81 | 4.9%(+3.78)#4,573 |
| 82. | Warm Beach | 8.7% | 4.9%(+3.80)#82 | 4.9%(+3.76)#4,582 |
| 83. | Castle Rock | 8.6% | 4.9%(+3.72)#83 | 4.9%(+3.69)#4,675 |
| 84. | Navy Yard City | 8.6% | 4.9%(+3.72)#84 | 4.9%(+3.68)#4,676 |
| 85. | Auburn | 8.5% | 4.9%(+3.63)#85 | 4.9%(+3.60)#4,750 |
| 86. | Spanaway | 8.5% | 4.9%(+3.62)#86 | 4.9%(+3.59)#4,756 |
| 87. | Battle Ground | 8.5% | 4.9%(+3.60)#87 | 4.9%(+3.57)#4,784 |
| 88. | Tukwila | 8.5% | 4.9%(+3.59)#88 | 4.9%(+3.56)#4,790 |
| 89. | South Creek | 8.5% | 4.9%(+3.58)#89 | 4.9%(+3.54)#4,799 |
| 90. | North Yelm | 8.5% | 4.9%(+3.57)#90 | 4.9%(+3.54)#4,805 |
| 91. | Ione | 8.5% | 4.9%(+3.56)#91 | 4.9%(+3.53)#4,819 |
| 92. | Union Gap | 8.5% | 4.9%(+3.55)#92 | 4.9%(+3.52)#4,835 |
| 93. | Granger | 8.5% | 4.9%(+3.55)#93 | 4.9%(+3.51)#4,838 |
| 94. | White Center | 8.4% | 4.9%(+3.49)#94 | 4.9%(+3.46)#4,891 |
| 95. | Normandy Park | 8.4% | 4.9%(+3.48)#95 | 4.9%(+3.45)#4,903 |
| 96. | Lakewood | 8.4% | 4.9%(+3.46)#96 | 4.9%(+3.43)#4,921 |
| 97. | Chelan | 8.4% | 4.9%(+3.46)#97 | 4.9%(+3.43)#4,927 |
| 98. | Riverbend | 8.4% | 4.9%(+3.45)#98 | 4.9%(+3.42)#4,941 |
| 99. | Sumner | 8.3% | 4.9%(+3.40)#99 | 4.9%(+3.37)#5,005 |
| 100. | Carlsborg | 8.3% | 4.9%(+3.36)#100 | 4.9%(+3.33)#5,048 |
Common Questions
What are the Top 10 Cities with the Highest Percentage of Population Employed in Transportation & Warehousing in Washington?
Top 10 Cities with the Highest Percentage of Population Employed in Transportation & Warehousing in Washington are:
#1
65.5%
#2
51.8%
#3
44.4%
#4
37.0%
#5
35.3%
#6
32.7%
#7
30.2%
#8
27.7%
#9
25.0%
#10
22.4%
What city has the Highest Percentage of Population Employed in Transportation & Warehousing in Washington?
Mineral has the Highest Percentage of Population Employed in Transportation & Warehousing in Washington with 65.5%.
What is the Percentage of Population Employed in Transportation & Warehousing in the State of Washington?
Percentage of Population Employed in Transportation & Warehousing in Washington is 4.9%.
What is the Percentage of Population Employed in Transportation & Warehousing in the United States?
Percentage of Population Employed in Transportation & Warehousing in the United States is 4.9%.