Zip Codes with the Highest Percentage of Population Employed in Transportation & Warehousing in Virginia
RELATED REPORTS & OPTIONS
Transportation & Warehousing
Virginia
Compare Zip Codes
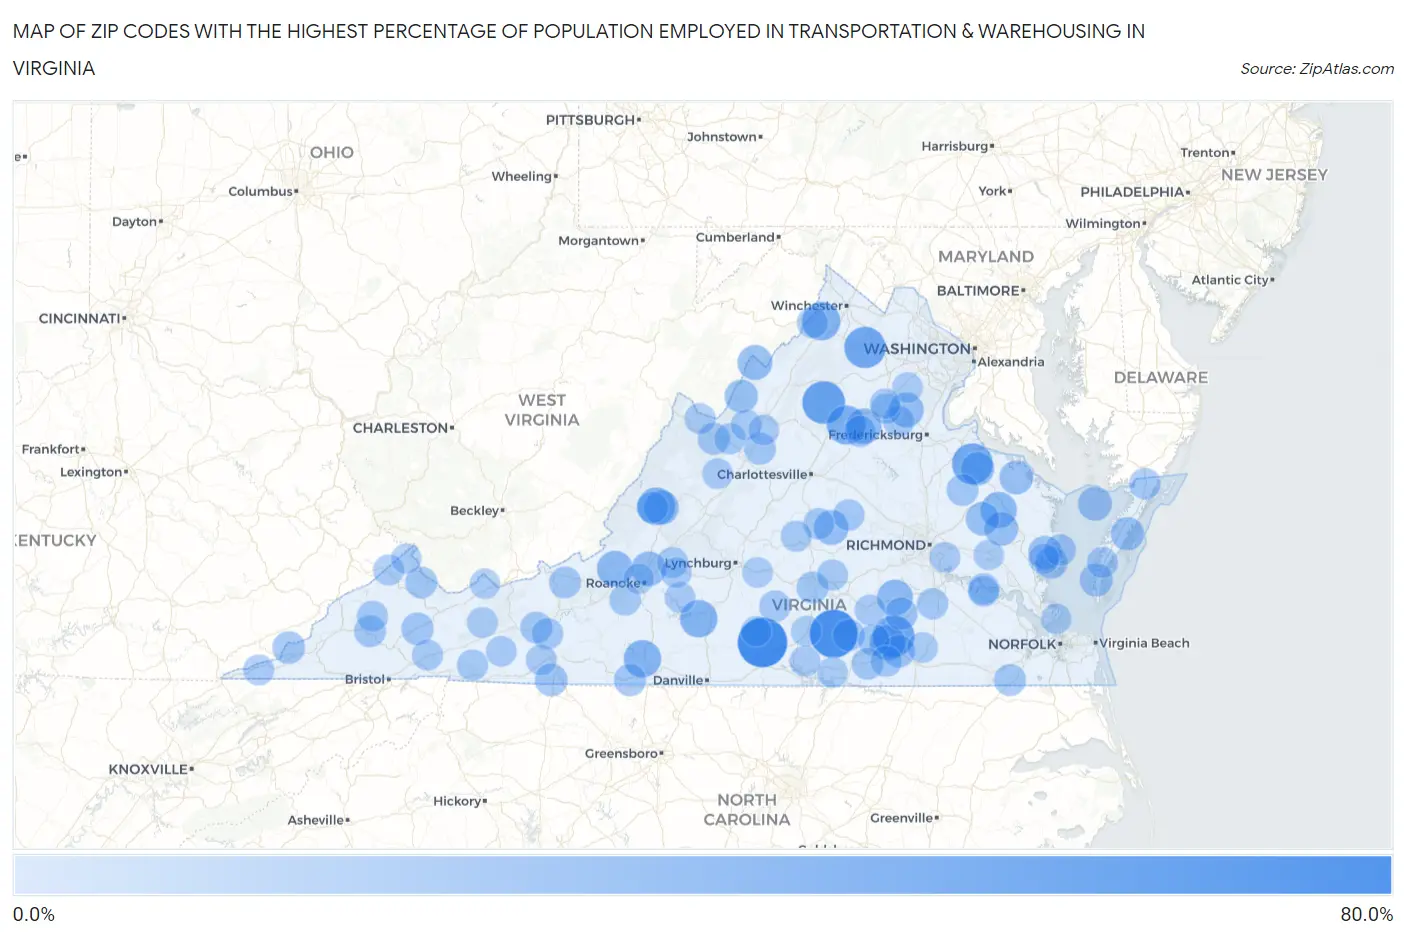
Map of Zip Codes with the Highest Percentage of Population Employed in Transportation & Warehousing in Virginia
0.0%
80.0%
Zip Codes with the Highest Percentage of Population Employed in Transportation & Warehousing in Virginia
| Zip Code | % Employed | vs State | vs National | |
| 1. | 24539 | 62.4% | 4.0%(+58.4)#1 | 4.9%(+57.4)#45 |
| 2. | 23952 | 57.6% | 4.0%(+53.6)#2 | 4.9%(+52.6)#55 |
| 3. | 22743 | 42.7% | 4.0%(+38.7)#3 | 4.9%(+37.8)#114 |
| 4. | 23889 | 39.3% | 4.0%(+35.3)#4 | 4.9%(+34.3)#132 |
| 5. | 22643 | 39.0% | 4.0%(+35.0)#5 | 4.9%(+34.0)#137 |
| 6. | 22509 | 37.5% | 4.0%(+33.5)#6 | 4.9%(+32.6)#149 |
| 7. | 22730 | 31.8% | 4.0%(+27.8)#7 | 4.9%(+26.9)#203 |
| 8. | 22641 | 29.9% | 4.0%(+25.9)#8 | 4.9%(+25.0)#228 |
| 9. | 24474 | 28.2% | 4.0%(+24.2)#9 | 4.9%(+23.3)#265 |
| 10. | 24139 | 27.6% | 4.0%(+23.6)#10 | 4.9%(+22.7)#279 |
| 11. | 24168 | 27.6% | 4.0%(+23.6)#11 | 4.9%(+22.6)#280 |
| 12. | 22437 | 24.1% | 4.0%(+20.1)#12 | 4.9%(+19.1)#362 |
| 13. | 24070 | 23.6% | 4.0%(+19.6)#13 | 4.9%(+18.7)#377 |
| 14. | 23850 | 23.2% | 4.0%(+19.2)#14 | 4.9%(+18.2)#389 |
| 15. | 23843 | 22.8% | 4.0%(+18.8)#15 | 4.9%(+17.9)#402 |
| 16. | 22729 | 22.6% | 4.0%(+18.6)#16 | 4.9%(+17.6)#405 |
| 17. | 22720 | 20.6% | 4.0%(+16.6)#17 | 4.9%(+15.7)#498 |
| 18. | 24448 | 20.5% | 4.0%(+16.5)#18 | 4.9%(+15.5)#510 |
| 19. | 23123 | 20.3% | 4.0%(+16.3)#19 | 4.9%(+15.4)#521 |
| 20. | 22811 | 20.2% | 4.0%(+16.2)#20 | 4.9%(+15.3)#530 |
| 21. | 24077 | 19.8% | 4.0%(+15.8)#21 | 4.9%(+14.9)#549 |
| 22. | 23440 | 18.3% | 4.0%(+14.3)#22 | 4.9%(+13.3)#653 |
| 23. | 23091 | 17.6% | 4.0%(+13.6)#23 | 4.9%(+12.7)#714 |
| 24. | 22529 | 17.3% | 4.0%(+13.3)#24 | 4.9%(+12.3)#747 |
| 25. | 23050 | 17.1% | 4.0%(+13.1)#25 | 4.9%(+12.2)#766 |
| 26. | 22438 | 16.8% | 4.0%(+12.8)#26 | 4.9%(+11.8)#799 |
| 27. | 23177 | 16.8% | 4.0%(+12.8)#27 | 4.9%(+11.8)#801 |
| 28. | 23480 | 16.3% | 4.0%(+12.3)#28 | 4.9%(+11.3)#870 |
| 29. | 22831 | 16.3% | 4.0%(+12.3)#29 | 4.9%(+11.3)#871 |
| 30. | 23316 | 16.0% | 4.0%(+12.0)#30 | 4.9%(+11.1)#911 |
| 31. | 23856 | 14.4% | 4.0%(+10.4)#31 | 4.9%(+9.45)#1,184 |
| 32. | 24282 | 14.3% | 4.0%(+10.3)#32 | 4.9%(+9.34)#1,203 |
| 33. | 24351 | 14.3% | 4.0%(+10.3)#33 | 4.9%(+9.34)#1,207 |
| 34. | 23840 | 14.2% | 4.0%(+10.2)#34 | 4.9%(+9.20)#1,250 |
| 35. | 23025 | 14.1% | 4.0%(+10.1)#35 | 4.9%(+9.17)#1,260 |
| 36. | 24280 | 13.9% | 4.0%(+9.92)#36 | 4.9%(+8.98)#1,297 |
| 37. | 24165 | 13.2% | 4.0%(+9.19)#37 | 4.9%(+8.25)#1,487 |
| 38. | 24485 | 12.9% | 4.0%(+8.90)#38 | 4.9%(+7.96)#1,562 |
| 39. | 24437 | 12.5% | 4.0%(+8.50)#39 | 4.9%(+7.55)#1,672 |
| 40. | 24360 | 12.4% | 4.0%(+8.36)#40 | 4.9%(+7.42)#1,727 |
| 41. | 24086 | 12.4% | 4.0%(+8.36)#41 | 4.9%(+7.41)#1,730 |
| 42. | 24634 | 12.3% | 4.0%(+8.34)#42 | 4.9%(+7.40)#1,732 |
| 43. | 23944 | 12.3% | 4.0%(+8.33)#43 | 4.9%(+7.38)#1,737 |
| 44. | 23943 | 12.3% | 4.0%(+8.29)#44 | 4.9%(+7.34)#1,753 |
| 45. | 24283 | 12.2% | 4.0%(+8.20)#45 | 4.9%(+7.26)#1,783 |
| 46. | 23821 | 12.1% | 4.0%(+8.10)#46 | 4.9%(+7.16)#1,806 |
| 47. | 23438 | 12.1% | 4.0%(+8.09)#47 | 4.9%(+7.15)#1,814 |
| 48. | 23920 | 12.1% | 4.0%(+8.09)#48 | 4.9%(+7.14)#1,815 |
| 49. | 23126 | 12.0% | 4.0%(+7.98)#49 | 4.9%(+7.04)#1,869 |
| 50. | 23066 | 11.9% | 4.0%(+7.94)#50 | 4.9%(+7.00)#1,890 |
| 51. | 22733 | 11.6% | 4.0%(+7.60)#51 | 4.9%(+6.65)#2,025 |
| 52. | 24457 | 11.6% | 4.0%(+7.56)#52 | 4.9%(+6.61)#2,047 |
| 53. | 23959 | 11.5% | 4.0%(+7.52)#53 | 4.9%(+6.58)#2,068 |
| 54. | 23415 | 11.3% | 4.0%(+7.28)#54 | 4.9%(+6.33)#2,193 |
| 55. | 23038 | 11.2% | 4.0%(+7.16)#55 | 4.9%(+6.22)#2,247 |
| 56. | 23805 | 11.0% | 4.0%(+7.02)#56 | 4.9%(+6.07)#2,314 |
| 57. | 23899 | 11.0% | 4.0%(+6.99)#57 | 4.9%(+6.04)#2,331 |
| 58. | 24313 | 10.8% | 4.0%(+6.83)#58 | 4.9%(+5.88)#2,404 |
| 59. | 23868 | 10.8% | 4.0%(+6.77)#59 | 4.9%(+5.83)#2,440 |
| 60. | 23004 | 10.7% | 4.0%(+6.65)#60 | 4.9%(+5.70)#2,496 |
| 61. | 24059 | 10.6% | 4.0%(+6.57)#61 | 4.9%(+5.63)#2,540 |
| 62. | 24421 | 10.6% | 4.0%(+6.55)#62 | 4.9%(+5.61)#2,556 |
| 63. | 22736 | 10.5% | 4.0%(+6.53)#63 | 4.9%(+5.58)#2,572 |
| 64. | 22654 | 10.4% | 4.0%(+6.42)#64 | 4.9%(+5.47)#2,628 |
| 65. | 24272 | 10.3% | 4.0%(+6.34)#65 | 4.9%(+5.40)#2,678 |
| 66. | 23966 | 10.3% | 4.0%(+6.30)#66 | 4.9%(+5.36)#2,706 |
| 67. | 24378 | 10.1% | 4.0%(+6.14)#67 | 4.9%(+5.19)#2,792 |
| 68. | 23405 | 10.1% | 4.0%(+6.13)#68 | 4.9%(+5.18)#2,799 |
| 69. | 23921 | 10.0% | 4.0%(+6.00)#69 | 4.9%(+5.05)#2,882 |
| 70. | 24122 | 10.0% | 4.0%(+6.00)#70 | 4.9%(+5.05)#2,883 |
| 71. | 23881 | 9.9% | 4.0%(+5.93)#71 | 4.9%(+4.98)#2,936 |
| 72. | 24361 | 9.8% | 4.0%(+5.84)#72 | 4.9%(+4.89)#2,996 |
| 73. | 24603 | 9.8% | 4.0%(+5.78)#73 | 4.9%(+4.84)#3,018 |
| 74. | 24433 | 9.6% | 4.0%(+5.61)#74 | 4.9%(+4.67)#3,154 |
| 75. | 24281 | 9.6% | 4.0%(+5.61)#75 | 4.9%(+4.66)#3,162 |
| 76. | 24381 | 9.4% | 4.0%(+5.40)#76 | 4.9%(+4.46)#3,311 |
| 77. | 23231 | 9.3% | 4.0%(+5.29)#77 | 4.9%(+4.35)#3,403 |
| 78. | 24121 | 9.2% | 4.0%(+5.22)#78 | 4.9%(+4.28)#3,456 |
| 79. | 23917 | 9.2% | 4.0%(+5.20)#79 | 4.9%(+4.26)#3,481 |
| 80. | 23824 | 9.2% | 4.0%(+5.19)#80 | 4.9%(+4.24)#3,493 |
| 81. | 24318 | 9.2% | 4.0%(+5.18)#81 | 4.9%(+4.24)#3,499 |
| 82. | 23968 | 9.2% | 4.0%(+5.15)#82 | 4.9%(+4.20)#3,531 |
| 83. | 22812 | 9.1% | 4.0%(+5.10)#83 | 4.9%(+4.15)#3,591 |
| 84. | 24459 | 9.1% | 4.0%(+5.09)#84 | 4.9%(+4.14)#3,606 |
| 85. | 24374 | 9.1% | 4.0%(+5.05)#85 | 4.9%(+4.11)#3,646 |
| 86. | 23867 | 9.0% | 4.0%(+5.04)#86 | 4.9%(+4.10)#3,655 |
| 87. | 22841 | 9.0% | 4.0%(+5.00)#87 | 4.9%(+4.06)#3,697 |
| 88. | 23128 | 8.9% | 4.0%(+4.90)#88 | 4.9%(+3.95)#3,807 |
| 89. | 24538 | 8.8% | 4.0%(+4.83)#89 | 4.9%(+3.88)#3,895 |
| 90. | 24174 | 8.8% | 4.0%(+4.82)#90 | 4.9%(+3.87)#3,905 |
| 91. | 22718 | 8.8% | 4.0%(+4.80)#91 | 4.9%(+3.86)#3,926 |
| 92. | 20119 | 8.8% | 4.0%(+4.79)#92 | 4.9%(+3.84)#3,942 |
| 93. | 23663 | 8.7% | 4.0%(+4.67)#93 | 4.9%(+3.73)#4,075 |
| 94. | 23937 | 8.6% | 4.0%(+4.60)#94 | 4.9%(+3.65)#4,155 |
| 95. | 24017 | 8.5% | 4.0%(+4.46)#95 | 4.9%(+3.51)#4,319 |
| 96. | 24577 | 8.5% | 4.0%(+4.45)#96 | 4.9%(+3.51)#4,327 |
| 97. | 24620 | 8.3% | 4.0%(+4.32)#97 | 4.9%(+3.37)#4,488 |
| 98. | 23089 | 8.1% | 4.0%(+4.12)#98 | 4.9%(+3.17)#4,729 |
| 99. | 22734 | 8.0% | 4.0%(+4.04)#99 | 4.9%(+3.09)#4,844 |
| 100. | 24613 | 8.0% | 4.0%(+4.03)#100 | 4.9%(+3.09)#4,847 |
Common Questions
What are the Top 10 Zip Codes with the Highest Percentage of Population Employed in Transportation & Warehousing in Virginia?
Top 10 Zip Codes with the Highest Percentage of Population Employed in Transportation & Warehousing in Virginia are:
What zip code has the Highest Percentage of Population Employed in Transportation & Warehousing in Virginia?
24539 has the Highest Percentage of Population Employed in Transportation & Warehousing in Virginia with 62.4%.
What is the Percentage of Population Employed in Transportation & Warehousing in the State of Virginia?
Percentage of Population Employed in Transportation & Warehousing in Virginia is 4.0%.
What is the Percentage of Population Employed in Transportation & Warehousing in the United States?
Percentage of Population Employed in Transportation & Warehousing in the United States is 4.9%.