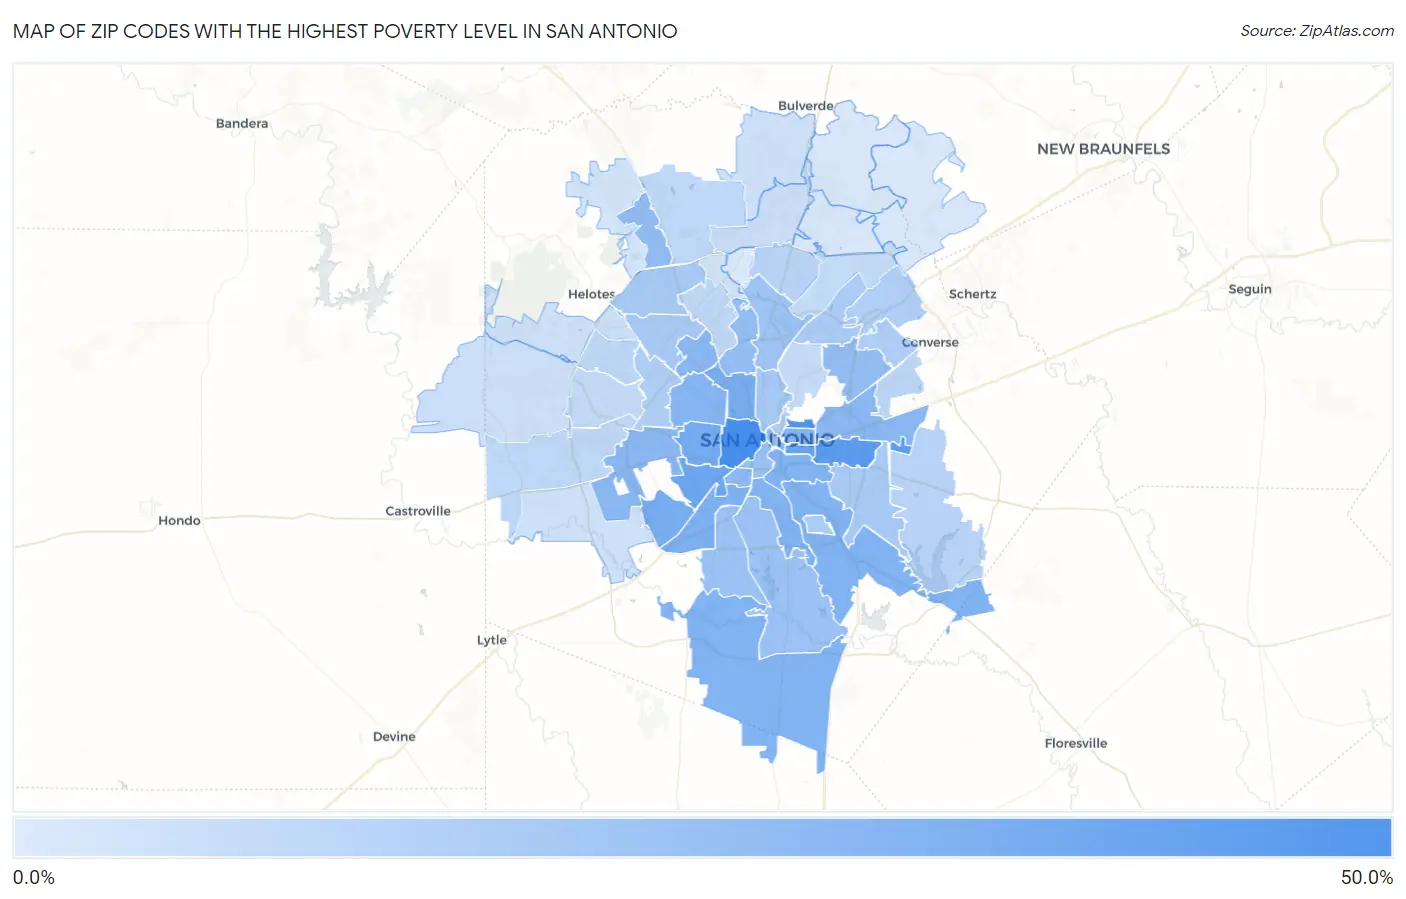
Zip Codes with the Highest Poverty Level in San Antonio, TX
RELATED REPORTS & OPTIONS
Highest Poverty
San Antonio
Compare Zip Codes
Map of Zip Codes with the Highest Poverty Level in San Antonio
0.0%
50.0%
Zip Codes with the Highest Poverty Level in San Antonio, TX
| Zip Code | Poverty | vs State | vs National | |
| 1. | 78207 | 42.5% | 13.9%(+28.5)#48 | 12.5%(+30.0)#917 |
| 2. | 78208 | 39.0% | 13.9%(+25.1)#55 | 12.5%(+26.5)#1,146 |
| 3. | 78220 | 36.0% | 13.9%(+22.0)#64 | 12.5%(+23.5)#1,421 |
| 4. | 78203 | 33.4% | 13.9%(+19.4)#82 | 12.5%(+20.8)#1,766 |
| 5. | 78226 | 30.7% | 13.9%(+16.8)#119 | 12.5%(+18.2)#2,229 |
| 6. | 78237 | 28.6% | 13.9%(+14.7)#152 | 12.5%(+16.1)#2,654 |
| 7. | 78242 | 27.8% | 13.9%(+13.8)#165 | 12.5%(+15.2)#2,840 |
| 8. | 78201 | 27.2% | 13.9%(+13.2)#179 | 12.5%(+14.6)#3,011 |
| 9. | 78211 | 26.3% | 13.9%(+12.4)#199 | 12.5%(+13.8)#3,229 |
| 10. | 78264 | 25.7% | 13.9%(+11.7)#211 | 12.5%(+13.2)#3,412 |
| 11. | 78214 | 25.2% | 13.9%(+11.3)#226 | 12.5%(+12.7)#3,586 |
| 12. | 78223 | 25.2% | 13.9%(+11.3)#227 | 12.5%(+12.7)#3,592 |
| 13. | 78210 | 25.2% | 13.9%(+11.2)#228 | 12.5%(+12.7)#3,599 |
| 14. | 78202 | 24.9% | 13.9%(+10.9)#236 | 12.5%(+12.3)#3,709 |
| 15. | 78228 | 24.0% | 13.9%(+10.1)#265 | 12.5%(+11.5)#4,021 |
| 16. | 78229 | 23.1% | 13.9%(+9.17)#297 | 12.5%(+10.6)#4,372 |
| 17. | 78227 | 23.1% | 13.9%(+9.16)#299 | 12.5%(+10.6)#4,385 |
| 18. | 78225 | 23.0% | 13.9%(+9.06)#301 | 12.5%(+10.5)#4,418 |
| 19. | 78219 | 22.7% | 13.9%(+8.72)#318 | 12.5%(+10.1)#4,563 |
| 20. | 78205 | 21.5% | 13.9%(+7.59)#354 | 12.5%(+9.00)#5,139 |
| 21. | 78213 | 20.5% | 13.9%(+6.60)#394 | 12.5%(+8.01)#5,727 |
| 22. | 78218 | 20.2% | 13.9%(+6.25)#416 | 12.5%(+7.66)#5,953 |
| 23. | 78256 | 20.1% | 13.9%(+6.15)#423 | 12.5%(+7.56)#6,024 |
| 24. | 78204 | 19.4% | 13.9%(+5.45)#450 | 12.5%(+6.86)#6,468 |
| 25. | 78221 | 18.3% | 13.9%(+4.35)#512 | 12.5%(+5.76)#7,288 |
| 26. | 78224 | 17.7% | 13.9%(+3.77)#542 | 12.5%(+5.18)#7,781 |
| 27. | 78216 | 17.0% | 13.9%(+3.09)#578 | 12.5%(+4.50)#8,370 |
| 28. | 78212 | 15.3% | 13.9%(+1.39)#692 | 12.5%(+2.80)#10,059 |
| 29. | 78249 | 15.2% | 13.9%(+1.23)#709 | 12.5%(+2.63)#10,257 |
| 30. | 78222 | 15.1% | 13.9%(+1.18)#713 | 12.5%(+2.59)#10,323 |
| 31. | 78240 | 15.1% | 13.9%(+1.13)#718 | 12.5%(+2.54)#10,381 |
| 32. | 78235 | 14.2% | 13.9%(+0.302)#781 | 12.5%(+1.71)#11,320 |
| 33. | 78217 | 14.1% | 13.9%(+0.171)#793 | 12.5%(+1.58)#11,467 |
| 34. | 78239 | 13.3% | 13.9%(-0.660)#857 | 12.5%(+0.750)#12,484 |
| 35. | 78238 | 13.2% | 13.9%(-0.790)#868 | 12.5%(+0.619)#12,657 |
| 36. | 78233 | 12.9% | 13.9%(-1.06)#887 | 12.5%(+0.351)#13,011 |
| 37. | 78215 | 11.5% | 13.9%(-2.47)#1,012 | 12.5%(-1.06)#15,071 |
| 38. | 78232 | 10.9% | 13.9%(-3.09)#1,065 | 12.5%(-1.68)#16,053 |
| 39. | 78263 | 10.8% | 13.9%(-3.14)#1,070 | 12.5%(-1.73)#16,132 |
| 40. | 78244 | 9.9% | 13.9%(-4.05)#1,147 | 12.5%(-2.65)#17,625 |
| 41. | 78245 | 9.5% | 13.9%(-4.45)#1,188 | 12.5%(-3.04)#18,292 |
| 42. | 78250 | 9.4% | 13.9%(-4.52)#1,198 | 12.5%(-3.11)#18,423 |
| 43. | 78230 | 9.3% | 13.9%(-4.60)#1,205 | 12.5%(-3.19)#18,560 |
| 44. | 78257 | 9.1% | 13.9%(-4.83)#1,226 | 12.5%(-3.42)#18,941 |
| 45. | 78251 | 8.2% | 13.9%(-5.77)#1,308 | 12.5%(-4.36)#20,666 |
| 46. | 78209 | 8.0% | 13.9%(-5.97)#1,325 | 12.5%(-4.56)#21,017 |
| 47. | 78247 | 7.7% | 13.9%(-6.23)#1,354 | 12.5%(-4.82)#21,513 |
| 48. | 78258 | 6.7% | 13.9%(-7.24)#1,445 | 12.5%(-5.83)#23,363 |
| 49. | 78253 | 6.0% | 13.9%(-7.90)#1,500 | 12.5%(-6.50)#24,575 |
| 50. | 78252 | 5.6% | 13.9%(-8.30)#1,539 | 12.5%(-6.89)#25,294 |
| 51. | 78260 | 5.5% | 13.9%(-8.43)#1,548 | 12.5%(-7.02)#25,495 |
| 52. | 78254 | 5.2% | 13.9%(-8.73)#1,565 | 12.5%(-7.32)#25,988 |
| 53. | 78231 | 4.3% | 13.9%(-9.61)#1,635 | 12.5%(-8.20)#27,464 |
| 54. | 78255 | 4.2% | 13.9%(-9.78)#1,651 | 12.5%(-8.37)#27,745 |
| 55. | 78266 | 3.3% | 13.9%(-10.7)#1,707 | 12.5%(-9.28)#29,064 |
| 56. | 78261 | 3.1% | 13.9%(-10.8)#1,712 | 12.5%(-9.41)#29,223 |
| 57. | 78259 | 3.0% | 13.9%(-10.9)#1,719 | 12.5%(-9.54)#29,392 |
| 58. | 78248 | 2.2% | 13.9%(-11.7)#1,750 | 12.5%(-10.3)#30,222 |
1
Common Questions
What are the Top 10 Zip Codes with the Highest Poverty Level in San Antonio, TX?
Top 10 Zip Codes with the Highest Poverty Level in San Antonio, TX are:
What zip code has the Highest Poverty Level in San Antonio, TX?
78207 has the Highest Poverty Level in San Antonio, TX with 42.5%.
What is the Poverty Level in San Antonio, TX?
Poverty Level in San Antonio is 17.7%.
What is the Poverty Level in Texas?
Poverty Level in Texas is 13.9%.
What is the Poverty Level in the United States?
Poverty Level in the United States is 12.5%.