Zip Codes with the Highest Percentage of Population Employed in Health Care & Social Assistance in San Antonio, TX
RELATED REPORTS & OPTIONS
Health Care & Social Assistance
San Antonio
Compare Zip Codes
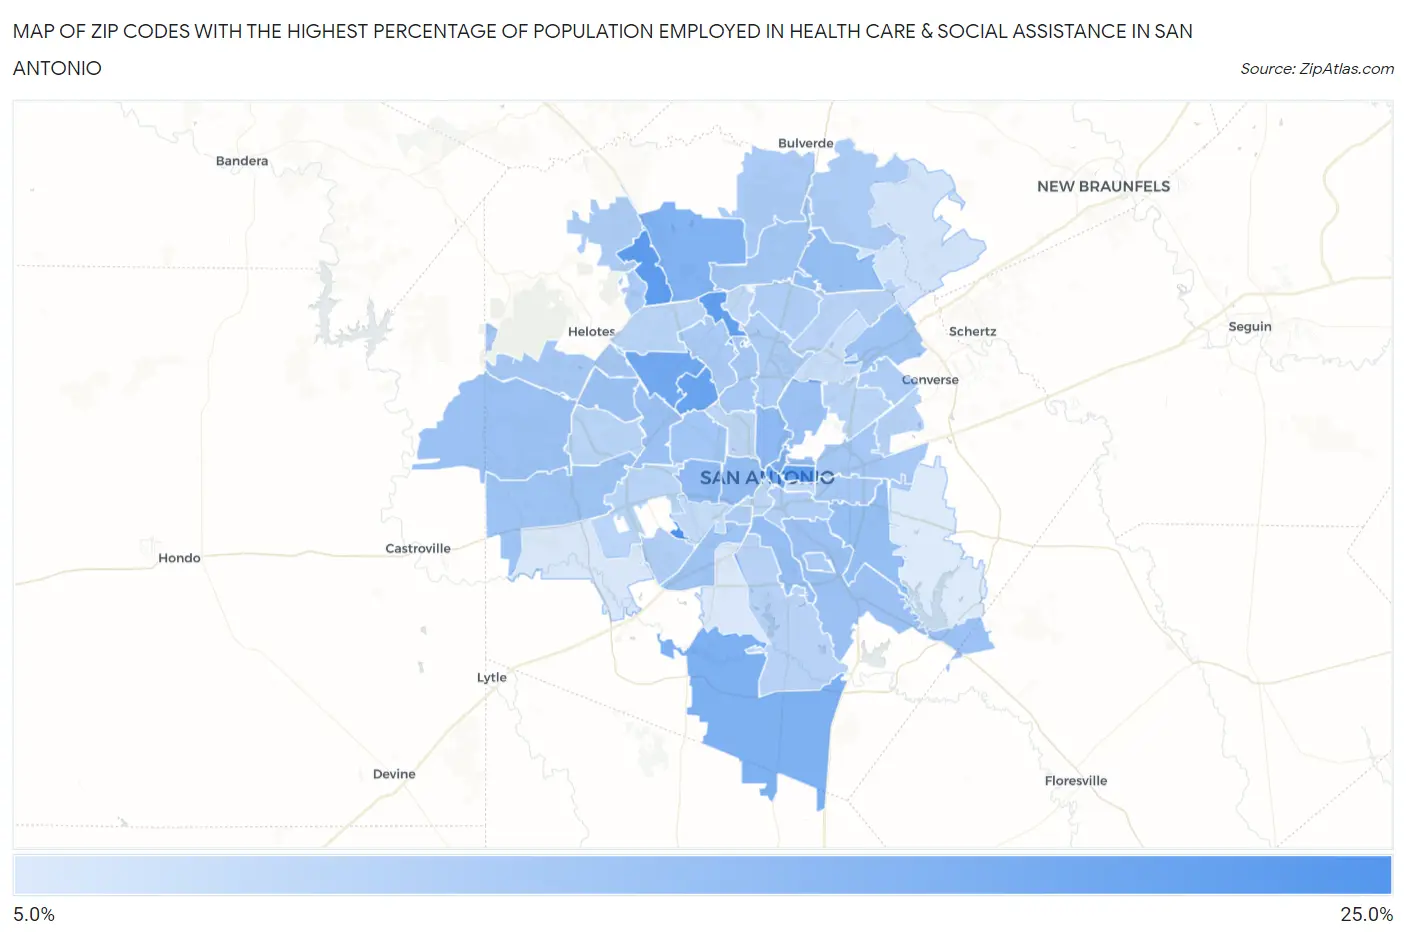
Map of Zip Codes with the Highest Percentage of Population Employed in Health Care & Social Assistance in San Antonio
0.0%
25.0%
Zip Codes with the Highest Percentage of Population Employed in Health Care & Social Assistance in San Antonio, TX
| Zip Code | % Employed | vs State | vs National | |
| 1. | 78243 | 22.9% | 11.9%(+10.9)#99 | 13.9%(+8.92)#2,394 |
| 2. | 78256 | 20.6% | 11.9%(+8.72)#138 | 13.9%(+6.71)#3,619 |
| 3. | 78202 | 20.2% | 11.9%(+8.23)#149 | 13.9%(+6.22)#3,964 |
| 4. | 78231 | 20.0% | 11.9%(+8.08)#151 | 13.9%(+6.07)#4,073 |
| 5. | 78229 | 19.5% | 11.9%(+7.56)#174 | 13.9%(+5.55)#4,521 |
| 6. | 78205 | 19.2% | 11.9%(+7.23)#179 | 13.9%(+5.22)#4,833 |
| 7. | 78240 | 18.7% | 11.9%(+6.73)#193 | 13.9%(+4.72)#5,361 |
| 8. | 78264 | 17.3% | 11.9%(+5.37)#249 | 13.9%(+3.36)#7,246 |
| 9. | 78257 | 17.2% | 11.9%(+5.32)#253 | 13.9%(+3.31)#7,305 |
| 10. | 78215 | 17.1% | 11.9%(+5.16)#263 | 13.9%(+3.15)#7,572 |
| 11. | 78212 | 15.9% | 11.9%(+3.98)#338 | 13.9%(+1.97)#9,681 |
| 12. | 78237 | 15.5% | 11.9%(+3.57)#376 | 13.9%(+1.56)#10,507 |
| 13. | 78207 | 15.4% | 11.9%(+3.43)#390 | 13.9%(+1.42)#10,866 |
| 14. | 78259 | 15.2% | 11.9%(+3.23)#400 | 13.9%(+1.22)#11,286 |
| 15. | 78222 | 15.1% | 11.9%(+3.16)#409 | 13.9%(+1.15)#11,471 |
| 16. | 78208 | 15.0% | 11.9%(+3.11)#415 | 13.9%(+1.10)#11,546 |
| 17. | 78214 | 14.8% | 11.9%(+2.91)#438 | 13.9%(+0.904)#12,029 |
| 18. | 78223 | 14.8% | 11.9%(+2.87)#443 | 13.9%(+0.856)#12,125 |
| 19. | 78253 | 14.8% | 11.9%(+2.85)#447 | 13.9%(+0.844)#12,152 |
| 20. | 78238 | 14.7% | 11.9%(+2.81)#454 | 13.9%(+0.799)#12,256 |
| 21. | 78250 | 14.6% | 11.9%(+2.69)#467 | 13.9%(+0.679)#12,557 |
| 22. | 78209 | 14.5% | 11.9%(+2.59)#477 | 13.9%(+0.577)#12,812 |
| 23. | 78211 | 14.4% | 11.9%(+2.45)#495 | 13.9%(+0.436)#13,161 |
| 24. | 78233 | 14.3% | 11.9%(+2.35)#507 | 13.9%(+0.337)#13,423 |
| 25. | 78245 | 14.3% | 11.9%(+2.33)#511 | 13.9%(+0.318)#13,464 |
| 26. | 78228 | 13.9% | 11.9%(+1.97)#550 | 13.9%(-0.036)#14,313 |
| 27. | 78258 | 13.8% | 11.9%(+1.92)#557 | 13.9%(-0.093)#14,462 |
| 28. | 78254 | 13.7% | 11.9%(+1.80)#579 | 13.9%(-0.212)#14,741 |
| 29. | 78219 | 13.7% | 11.9%(+1.79)#581 | 13.9%(-0.220)#14,756 |
| 30. | 78213 | 13.6% | 11.9%(+1.67)#595 | 13.9%(-0.336)#15,031 |
| 31. | 78220 | 13.5% | 11.9%(+1.62)#599 | 13.9%(-0.393)#15,170 |
| 32. | 78260 | 13.2% | 11.9%(+1.29)#638 | 13.9%(-0.716)#16,009 |
| 33. | 78230 | 13.2% | 11.9%(+1.24)#646 | 13.9%(-0.768)#16,147 |
| 34. | 78235 | 13.0% | 11.9%(+1.05)#673 | 13.9%(-0.955)#16,638 |
| 35. | 78261 | 13.0% | 11.9%(+1.04)#674 | 13.9%(-0.970)#16,677 |
| 36. | 78216 | 13.0% | 11.9%(+1.03)#676 | 13.9%(-0.975)#16,689 |
| 37. | 78255 | 13.0% | 11.9%(+1.03)#677 | 13.9%(-0.984)#16,708 |
| 38. | 78225 | 12.8% | 11.9%(+0.855)#704 | 13.9%(-1.15)#17,135 |
| 39. | 78232 | 12.8% | 11.9%(+0.846)#706 | 13.9%(-1.16)#17,155 |
| 40. | 78239 | 12.7% | 11.9%(+0.735)#719 | 13.9%(-1.28)#17,459 |
| 41. | 78210 | 12.6% | 11.9%(+0.687)#725 | 13.9%(-1.32)#17,567 |
| 42. | 78242 | 12.6% | 11.9%(+0.641)#731 | 13.9%(-1.37)#17,672 |
| 43. | 78244 | 12.1% | 11.9%(+0.161)#791 | 13.9%(-1.85)#18,834 |
| 44. | 78247 | 11.9% | 11.9%(-0.075)#833 | 13.9%(-2.08)#19,368 |
| 45. | 78221 | 11.8% | 11.9%(-0.119)#842 | 13.9%(-2.13)#19,455 |
| 46. | 78227 | 11.8% | 11.9%(-0.132)#844 | 13.9%(-2.14)#19,482 |
| 47. | 78251 | 11.7% | 11.9%(-0.222)#852 | 13.9%(-2.23)#19,701 |
| 48. | 78218 | 11.7% | 11.9%(-0.255)#862 | 13.9%(-2.26)#19,788 |
| 49. | 78249 | 11.6% | 11.9%(-0.304)#869 | 13.9%(-2.31)#19,906 |
| 50. | 78204 | 11.4% | 11.9%(-0.495)#901 | 13.9%(-2.51)#20,367 |
| 51. | 78201 | 11.2% | 11.9%(-0.732)#930 | 13.9%(-2.74)#20,918 |
| 52. | 78248 | 11.2% | 11.9%(-0.751)#932 | 13.9%(-2.76)#20,959 |
| 53. | 78203 | 11.0% | 11.9%(-0.892)#951 | 13.9%(-2.90)#21,269 |
| 54. | 78226 | 10.6% | 11.9%(-1.32)#1,030 | 13.9%(-3.33)#22,216 |
| 55. | 78217 | 10.3% | 11.9%(-1.60)#1,074 | 13.9%(-3.61)#22,798 |
| 56. | 78266 | 9.6% | 11.9%(-2.34)#1,198 | 13.9%(-4.35)#24,213 |
| 57. | 78252 | 9.0% | 11.9%(-2.94)#1,277 | 13.9%(-4.95)#25,188 |
| 58. | 78224 | 8.8% | 11.9%(-3.10)#1,303 | 13.9%(-5.11)#25,435 |
| 59. | 78263 | 8.5% | 11.9%(-3.38)#1,345 | 13.9%(-5.39)#25,835 |
1
Common Questions
What are the Top 10 Zip Codes with the Highest Percentage of Population Employed in Health Care & Social Assistance in San Antonio, TX?
Top 10 Zip Codes with the Highest Percentage of Population Employed in Health Care & Social Assistance in San Antonio, TX are:
What zip code has the Highest Percentage of Population Employed in Health Care & Social Assistance in San Antonio, TX?
78243 has the Highest Percentage of Population Employed in Health Care & Social Assistance in San Antonio, TX with 22.9%.
What is the Percentage of Population Employed in Health Care & Social Assistance in San Antonio, TX?
Percentage of Population Employed in Health Care & Social Assistance in San Antonio is 13.7%.
What is the Percentage of Population Employed in Health Care & Social Assistance in Texas?
Percentage of Population Employed in Health Care & Social Assistance in Texas is 11.9%.
What is the Percentage of Population Employed in Health Care & Social Assistance in the United States?
Percentage of Population Employed in Health Care & Social Assistance in the United States is 13.9%.