Rio Hondo, TX
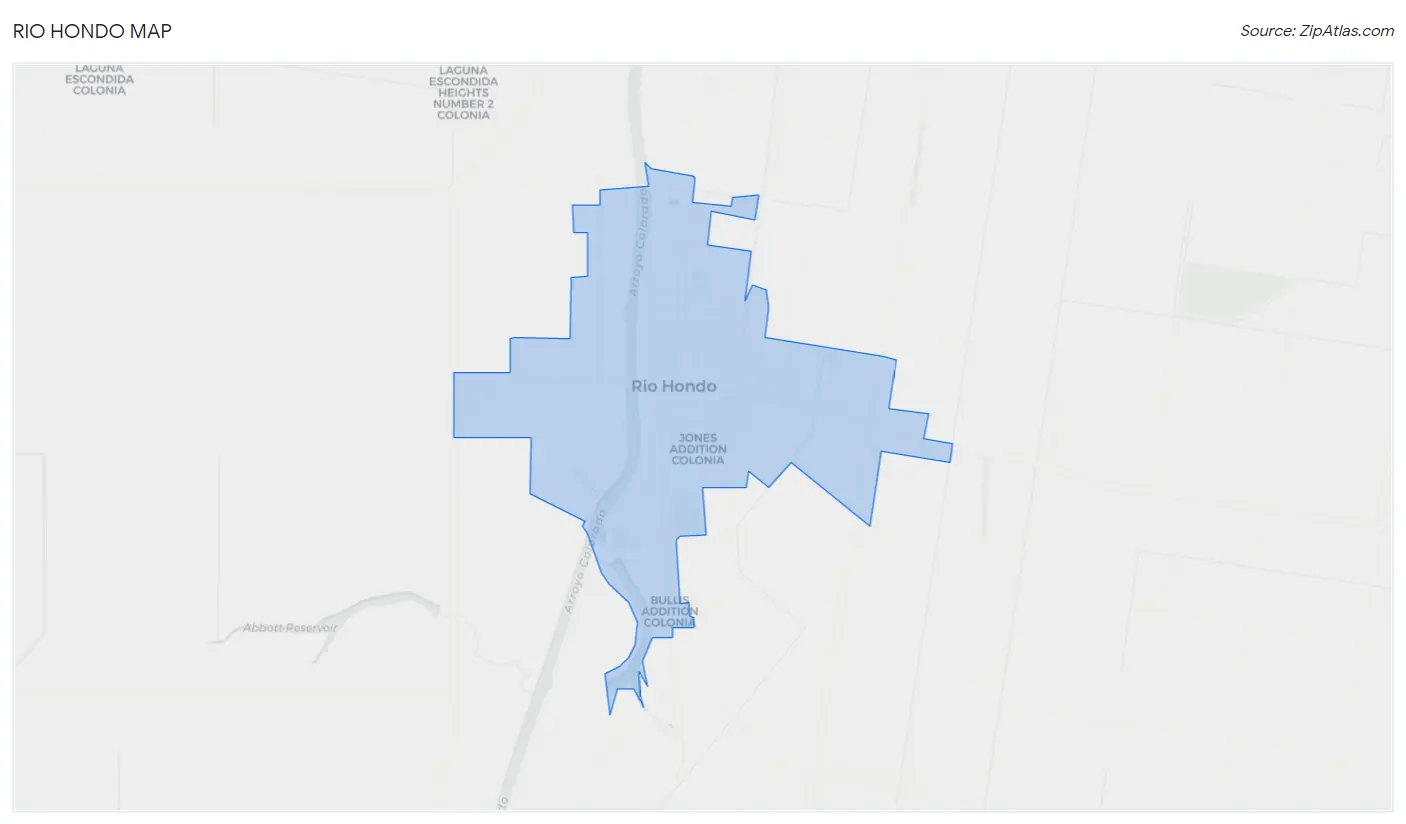
Rio Hondo Map
Rio Hondo Overview
2,295
TOTAL POPULATION
998
MALE POPULATION
1,297
FEMALE POPULATION
76.95
MALES / 100 FEMALES
129.96
FEMALES / 100 MALES
36.2
MEDIAN AGE
3.6
AVG FAMILY SIZE
3.0
AVG HOUSEHOLD SIZE
$24,188
PER CAPITA INCOME
$68,125
AVG FAMILY INCOME
$58,487
AVG HOUSEHOLD INCOME
8.4%
WAGE / INCOME GAP [ % ]
91.6¢/ $1
WAGE / INCOME GAP [ $ ]
0.43
INEQUALITY / GINI INDEX
944
LABOR FORCE [ PEOPLE ]
55.1%
PERCENT IN LABOR FORCE
Rio Hondo Zip Codes
Rio Hondo Area Codes
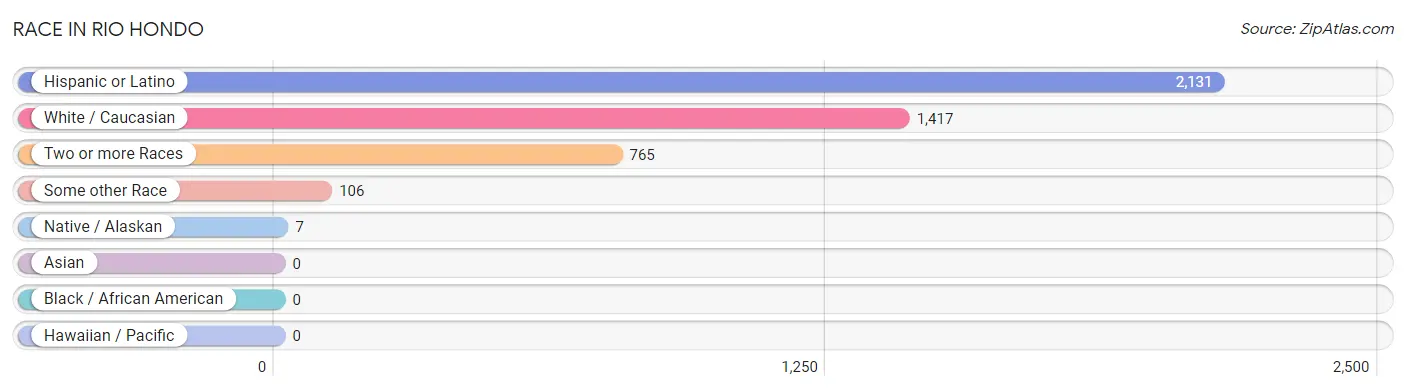
Race in Rio Hondo
The most populous races in Rio Hondo are Hispanic or Latino (2,131 | 92.8%), White / Caucasian (1,417 | 61.7%), and Two or more Races (765 | 33.3%).
| Race | # Population | % Population |
| Asian | 0 | 0.0% |
| Black / African American | 0 | 0.0% |
| Hawaiian / Pacific | 0 | 0.0% |
| Hispanic or Latino | 2,131 | 92.8% |
| Native / Alaskan | 7 | 0.3% |
| White / Caucasian | 1,417 | 61.7% |
| Two or more Races | 765 | 33.3% |
| Some other Race | 106 | 4.6% |
| Total | 2,295 | 100.0% |
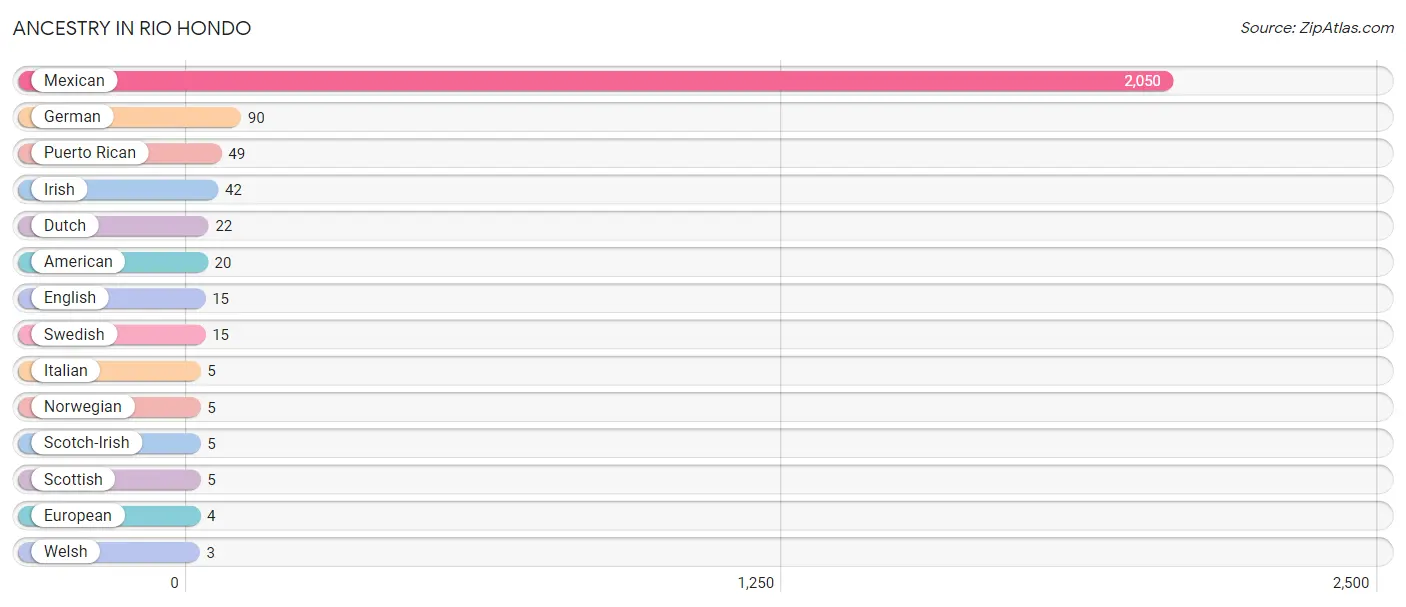
Ancestry in Rio Hondo
The most populous ancestries reported in Rio Hondo are Mexican (2,050 | 89.3%), German (90 | 3.9%), Puerto Rican (49 | 2.1%), Irish (42 | 1.8%), and Dutch (22 | 1.0%), together accounting for 98.2% of all Rio Hondo residents.
| Ancestry | # Population | % Population |
| American | 20 | 0.9% |
| Dutch | 22 | 1.0% |
| English | 15 | 0.6% |
| European | 4 | 0.2% |
| German | 90 | 3.9% |
| Irish | 42 | 1.8% |
| Italian | 5 | 0.2% |
| Mexican | 2,050 | 89.3% |
| Norwegian | 5 | 0.2% |
| Puerto Rican | 49 | 2.1% |
| Scotch-Irish | 5 | 0.2% |
| Scottish | 5 | 0.2% |
| Swedish | 15 | 0.6% |
| Welsh | 3 | 0.1% | View All 14 Rows |
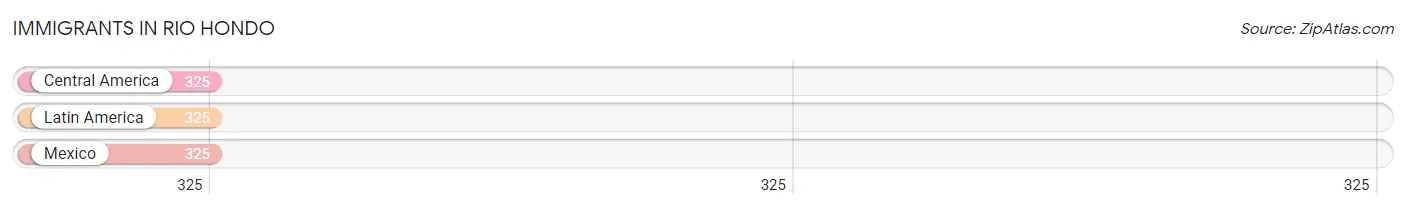
Immigrants in Rio Hondo
The most numerous immigrant groups reported in Rio Hondo came from Central America (325 | 14.2%), Latin America (325 | 14.2%), and Mexico (325 | 14.2%), together accounting for 42.5% of all Rio Hondo residents.
| Immigration Origin | # Population | % Population |
| Central America | 325 | 14.2% |
| Latin America | 325 | 14.2% |
| Mexico | 325 | 14.2% | View All 3 Rows |
Sex and Age in Rio Hondo
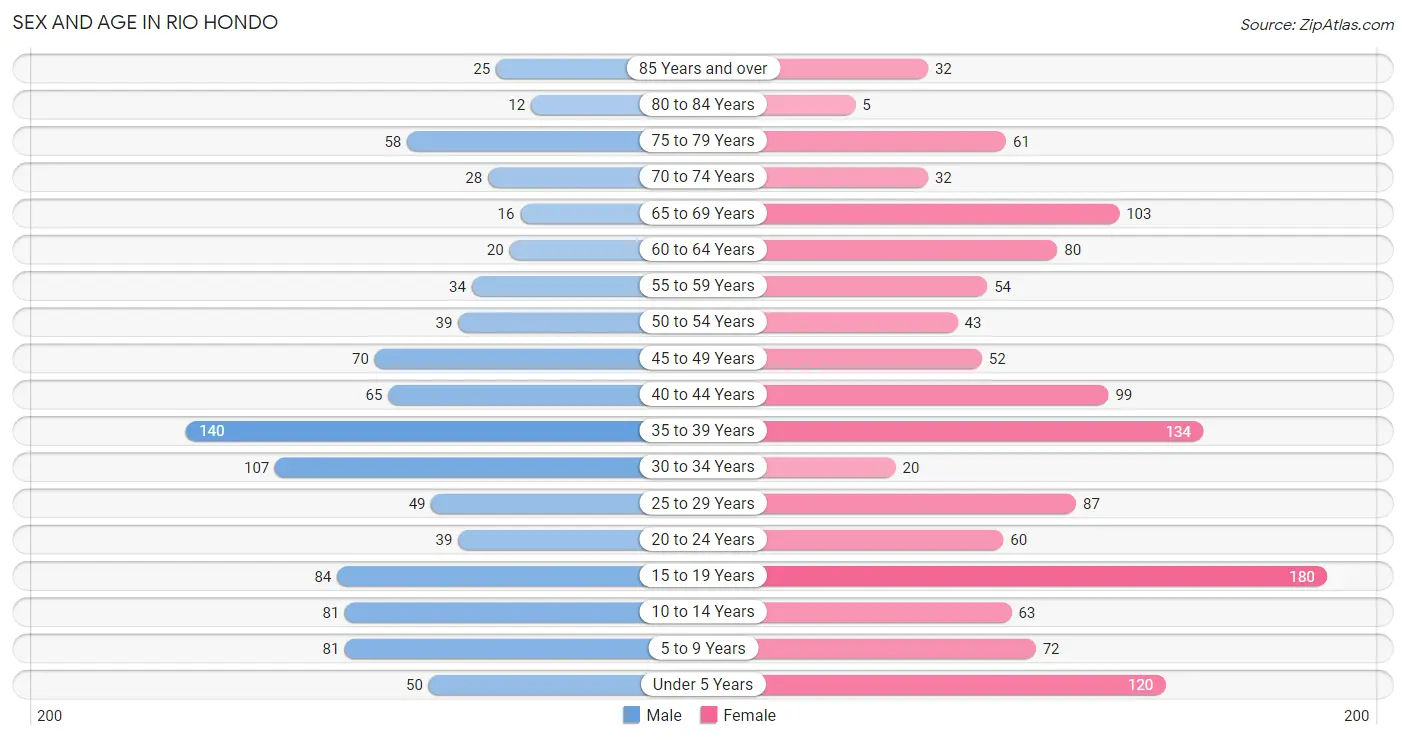
Sex and Age in Rio Hondo
The most populous age groups in Rio Hondo are 35 to 39 Years (140 | 14.0%) for men and 15 to 19 Years (180 | 13.9%) for women.
| Age Bracket | Male | Female |
| Under 5 Years | 50 (5.0%) | 120 (9.2%) |
| 5 to 9 Years | 81 (8.1%) | 72 (5.6%) |
| 10 to 14 Years | 81 (8.1%) | 63 (4.9%) |
| 15 to 19 Years | 84 (8.4%) | 180 (13.9%) |
| 20 to 24 Years | 39 (3.9%) | 60 (4.6%) |
| 25 to 29 Years | 49 (4.9%) | 87 (6.7%) |
| 30 to 34 Years | 107 (10.7%) | 20 (1.5%) |
| 35 to 39 Years | 140 (14.0%) | 134 (10.3%) |
| 40 to 44 Years | 65 (6.5%) | 99 (7.6%) |
| 45 to 49 Years | 70 (7.0%) | 52 (4.0%) |
| 50 to 54 Years | 39 (3.9%) | 43 (3.3%) |
| 55 to 59 Years | 34 (3.4%) | 54 (4.2%) |
| 60 to 64 Years | 20 (2.0%) | 80 (6.2%) |
| 65 to 69 Years | 16 (1.6%) | 103 (7.9%) |
| 70 to 74 Years | 28 (2.8%) | 32 (2.5%) |
| 75 to 79 Years | 58 (5.8%) | 61 (4.7%) |
| 80 to 84 Years | 12 (1.2%) | 5 (0.4%) |
| 85 Years and over | 25 (2.5%) | 32 (2.5%) |
| Total | 998 (100.0%) | 1,297 (100.0%) |
Families and Households in Rio Hondo
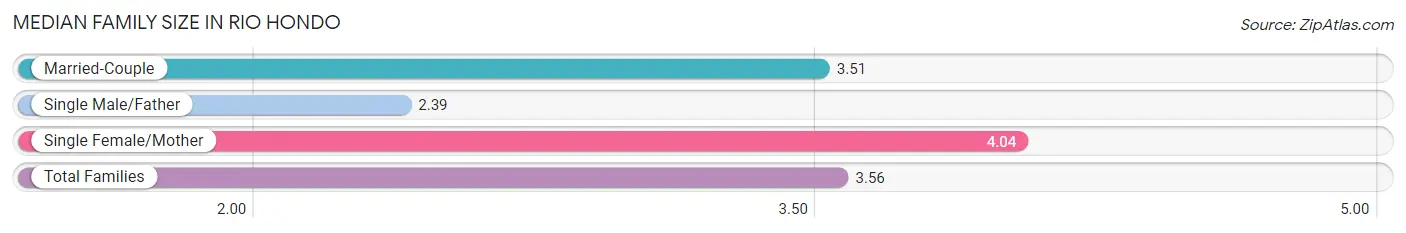
Median Family Size in Rio Hondo
The median family size in Rio Hondo is 3.56 persons per family, with single female/mother families (160 | 28.1%) accounting for the largest median family size of 4.04 persons per family. On the other hand, single male/father families (54 | 9.5%) represent the smallest median family size with 2.39 persons per family.
| Family Type | # Families | Family Size |
| Married-Couple | 356 (62.5%) | 3.51 |
| Single Male/Father | 54 (9.5%) | 2.39 |
| Single Female/Mother | 160 (28.1%) | 4.04 |
| Total Families | 570 (100.0%) | 3.56 |
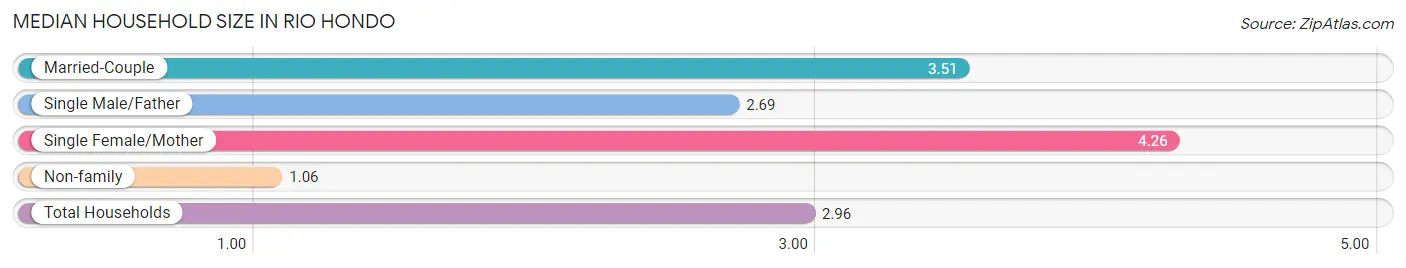
Median Household Size in Rio Hondo
The median household size in Rio Hondo is 2.96 persons per household, with single female/mother households (160 | 20.6%) accounting for the largest median household size of 4.26 persons per household. non-family households (205 | 26.5%) represent the smallest median household size with 1.06 persons per household.
| Household Type | # Households | Household Size |
| Married-Couple | 356 (45.9%) | 3.51 |
| Single Male/Father | 54 (7.0%) | 2.69 |
| Single Female/Mother | 160 (20.6%) | 4.26 |
| Non-family | 205 (26.5%) | 1.06 |
| Total Households | 775 (100.0%) | 2.96 |
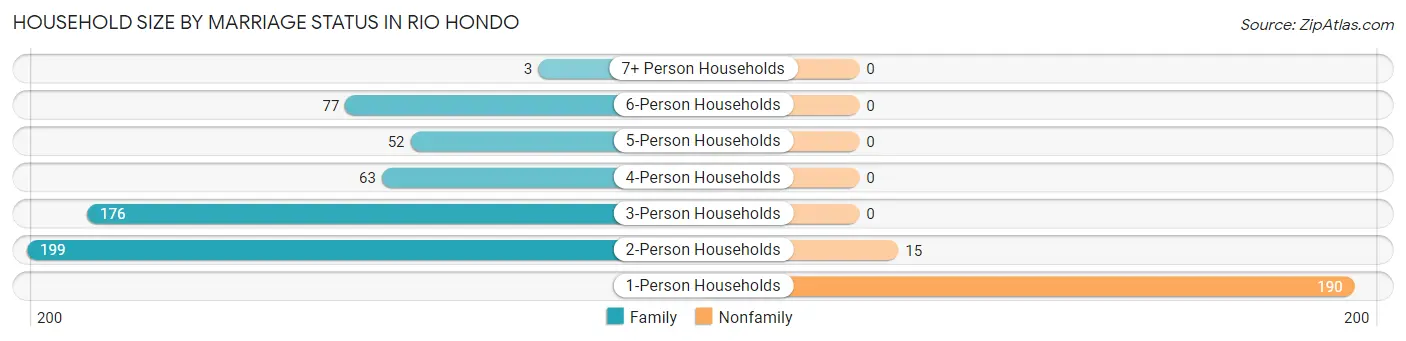
Household Size by Marriage Status in Rio Hondo
Out of a total of 775 households in Rio Hondo, 570 (73.6%) are family households, while 205 (26.5%) are nonfamily households. The most numerous type of family households are 2-person households, comprising 199, and the most common type of nonfamily households are 1-person households, comprising 190.
| Household Size | Family Households | Nonfamily Households |
| 1-Person Households | - | 190 (24.5%) |
| 2-Person Households | 199 (25.7%) | 15 (1.9%) |
| 3-Person Households | 176 (22.7%) | 0 (0.0%) |
| 4-Person Households | 63 (8.1%) | 0 (0.0%) |
| 5-Person Households | 52 (6.7%) | 0 (0.0%) |
| 6-Person Households | 77 (9.9%) | 0 (0.0%) |
| 7+ Person Households | 3 (0.4%) | 0 (0.0%) |
| Total | 570 (73.6%) | 205 (26.5%) |
Female Fertility in Rio Hondo
Fertility by Age in Rio Hondo
| Age Bracket | Women with Births | Births / 1,000 Women |
| 15 to 19 years | 0 (0.0%) | 0.0 |
| 20 to 34 years | 0 (0.0%) | 0.0 |
| 35 to 50 years | 0 (0.0%) | 0.0 |
| Total | 0 (0.0%) | 0.0 |
Fertility by Age by Marriage Status in Rio Hondo
| Age Bracket | Married | Unmarried |
| 15 to 19 years | 0 (0.0%) | 0 (0.0%) |
| 20 to 34 years | 0 (0.0%) | 0 (0.0%) |
| 35 to 50 years | 0 (0.0%) | 0 (0.0%) |
| Total | 0 (0.0%) | 0 (0.0%) |
Fertility by Education in Rio Hondo
| Educational Attainment | Women with Births | Births / 1,000 Women |
| Less than High School | 0 (0.0%) | 0.0 |
| High School Diploma | 0 (0.0%) | 0.0 |
| College or Associate's Degree | 0 (0.0%) | 0.0 |
| Bachelor's Degree | 0 (0.0%) | 0.0 |
| Graduate Degree | 0 (0.0%) | 0.0 |
| Total | 0 (0.0%) | 0.0 |
Fertility by Education by Marriage Status in Rio Hondo
| Educational Attainment | Married | Unmarried |
| Less than High School | 0 (0.0%) | 0 (0.0%) |
| High School Diploma | 0 (0.0%) | 0 (0.0%) |
| College or Associate's Degree | 0 (0.0%) | 0 (0.0%) |
| Bachelor's Degree | 0 (0.0%) | 0 (0.0%) |
| Graduate Degree | 0 (0.0%) | 0 (0.0%) |
| Total | 0 (0.0%) | 0 (0.0%) |
Income in Rio Hondo
Income Overview in Rio Hondo
Per Capita Income in Rio Hondo is $24,188, while median incomes of families and households are $68,125 and $58,487 respectively.
| Characteristic | Number | Measure |
| Per Capita Income | 2,295 | $24,188 |
| Median Family Income | 570 | $68,125 |
| Mean Family Income | 570 | $79,234 |
| Median Household Income | 775 | $58,487 |
| Mean Household Income | 775 | $68,018 |
| Income Deficit | 570 | $0 |
| Wage / Income Gap (%) | 2,295 | 8.36% |
| Wage / Income Gap ($) | 2,295 | 91.64¢ per $1 |
| Gini / Inequality Index | 2,295 | 0.43 |
Earnings by Sex in Rio Hondo
Average Earnings in Rio Hondo are $41,395, $42,286 for men and $38,750 for women, a difference of 8.4%.
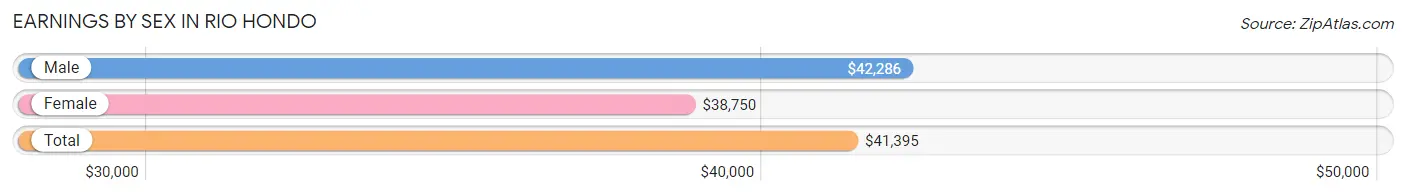
| Sex | Number | Average Earnings |
| Male | 517 (51.6%) | $42,286 |
| Female | 484 (48.3%) | $38,750 |
| Total | 1,001 (100.0%) | $41,395 |
Earnings by Sex by Income Bracket in Rio Hondo
The most common earnings brackets in Rio Hondo are $75,000 to $99,999 for men (107 | 20.7%) and $55,000 to $64,999 for women (52 | 10.7%).
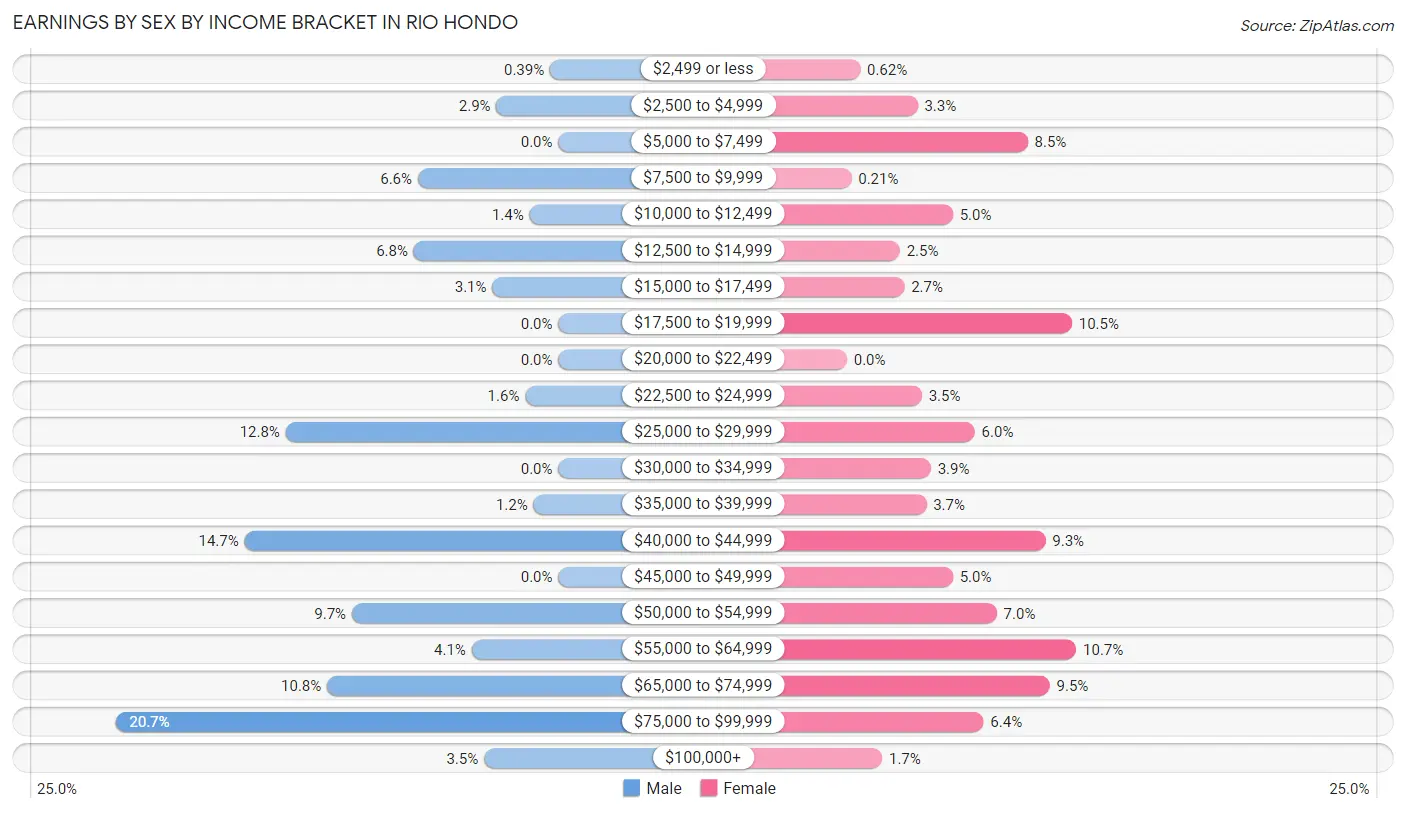
| Income | Male | Female |
| $2,499 or less | 2 (0.4%) | 3 (0.6%) |
| $2,500 to $4,999 | 15 (2.9%) | 16 (3.3%) |
| $5,000 to $7,499 | 0 (0.0%) | 41 (8.5%) |
| $7,500 to $9,999 | 34 (6.6%) | 1 (0.2%) |
| $10,000 to $12,499 | 7 (1.3%) | 24 (5.0%) |
| $12,500 to $14,999 | 35 (6.8%) | 12 (2.5%) |
| $15,000 to $17,499 | 16 (3.1%) | 13 (2.7%) |
| $17,500 to $19,999 | 0 (0.0%) | 51 (10.5%) |
| $20,000 to $22,499 | 0 (0.0%) | 0 (0.0%) |
| $22,500 to $24,999 | 8 (1.5%) | 17 (3.5%) |
| $25,000 to $29,999 | 66 (12.8%) | 29 (6.0%) |
| $30,000 to $34,999 | 0 (0.0%) | 19 (3.9%) |
| $35,000 to $39,999 | 6 (1.2%) | 18 (3.7%) |
| $40,000 to $44,999 | 76 (14.7%) | 45 (9.3%) |
| $45,000 to $49,999 | 0 (0.0%) | 24 (5.0%) |
| $50,000 to $54,999 | 50 (9.7%) | 34 (7.0%) |
| $55,000 to $64,999 | 21 (4.1%) | 52 (10.7%) |
| $65,000 to $74,999 | 56 (10.8%) | 46 (9.5%) |
| $75,000 to $99,999 | 107 (20.7%) | 31 (6.4%) |
| $100,000+ | 18 (3.5%) | 8 (1.7%) |
| Total | 517 (100.0%) | 484 (100.0%) |
Earnings by Sex by Educational Attainment in Rio Hondo
Average earnings in Rio Hondo are $51,477 for men and $39,063 for women, a difference of 24.1%. Men with an educational attainment of bachelor's degree enjoy the highest average annual earnings of $73,319, while those with college or associate's degree education earn the least with $42,333. Women with an educational attainment of high school diploma earn the most with the average annual earnings of $61,071, while those with less than high school education have the smallest earnings of $18,839.
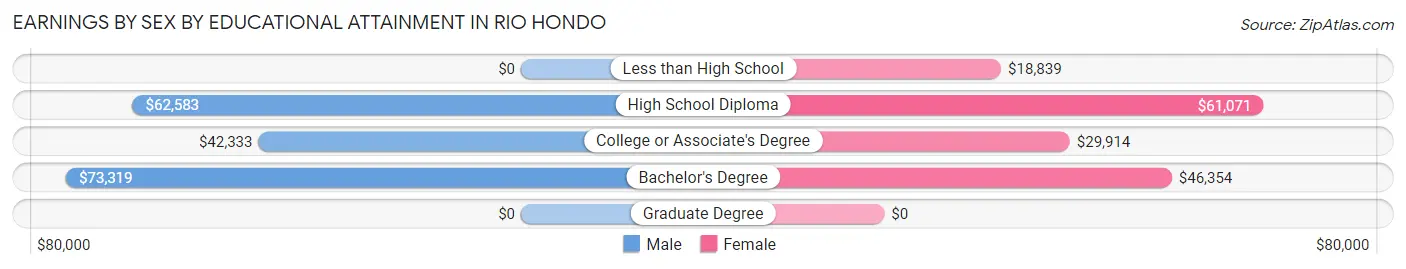
| Educational Attainment | Male Income | Female Income |
| Less than High School | - | - |
| High School Diploma | $62,583 | $61,071 |
| College or Associate's Degree | $42,333 | $29,914 |
| Bachelor's Degree | $73,319 | $46,354 |
| Graduate Degree | - | - |
| Total | $51,477 | $39,063 |
Family Income in Rio Hondo
Family Income Brackets in Rio Hondo
According to the Rio Hondo family income data, there are 145 families falling into the $100,000 to $149,999 income range, which is the most common income bracket and makes up 25.4% of all families. Conversely, the $200,000+ income bracket is the least frequent group with only 22 families (3.9%) belonging to this category.
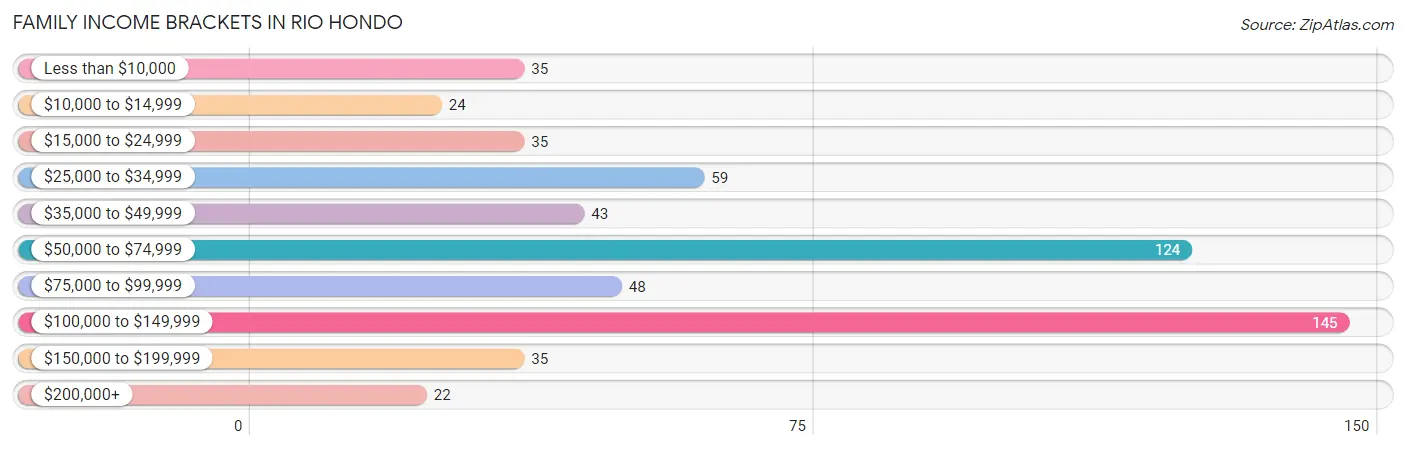
| Income Bracket | # Families | % Families |
| Less than $10,000 | 35 | 6.1% |
| $10,000 to $14,999 | 24 | 4.2% |
| $15,000 to $24,999 | 35 | 6.1% |
| $25,000 to $34,999 | 59 | 10.4% |
| $35,000 to $49,999 | 43 | 7.5% |
| $50,000 to $74,999 | 124 | 21.8% |
| $75,000 to $99,999 | 48 | 8.4% |
| $100,000 to $149,999 | 145 | 25.4% |
| $150,000 to $199,999 | 35 | 6.1% |
| $200,000+ | 22 | 3.9% |
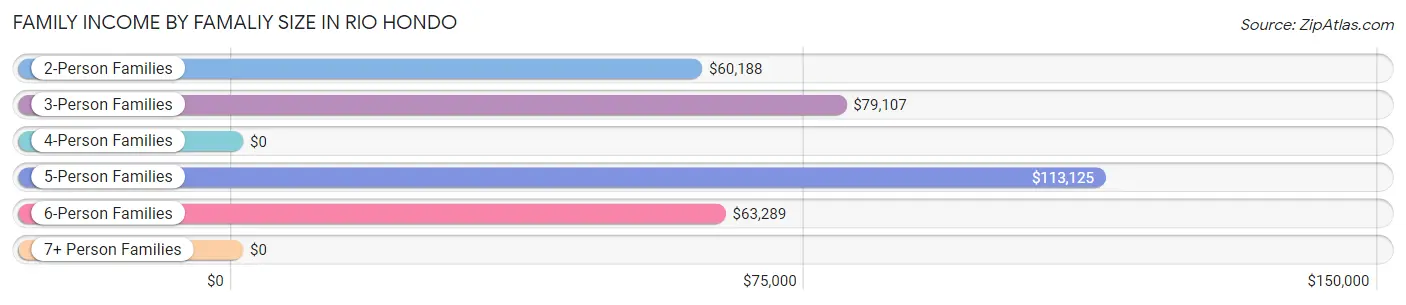
Family Income by Famaliy Size in Rio Hondo
5-person families (53 | 9.3%) account for the highest median family income in Rio Hondo with $113,125 per family, while 2-person families (199 | 34.9%) have the highest median income of $30,094 per family member.
| Income Bracket | # Families | Median Income |
| 2-Person Families | 199 (34.9%) | $60,188 |
| 3-Person Families | 193 (33.9%) | $79,107 |
| 4-Person Families | 55 (9.7%) | $0 |
| 5-Person Families | 53 (9.3%) | $113,125 |
| 6-Person Families | 70 (12.3%) | $63,289 |
| 7+ Person Families | 0 (0.0%) | $0 |
| Total | 570 (100.0%) | $68,125 |
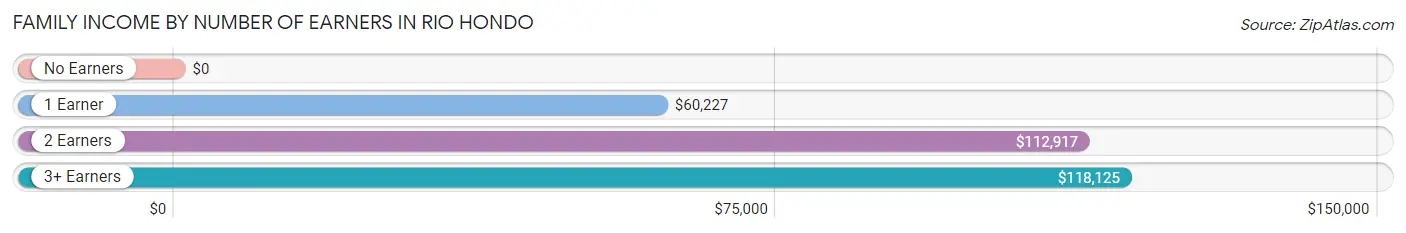
Family Income by Number of Earners in Rio Hondo
| Number of Earners | # Families | Median Income |
| No Earners | 108 (19.0%) | $0 |
| 1 Earner | 168 (29.5%) | $60,227 |
| 2 Earners | 252 (44.2%) | $112,917 |
| 3+ Earners | 42 (7.4%) | $118,125 |
| Total | 570 (100.0%) | $68,125 |
Household Income in Rio Hondo
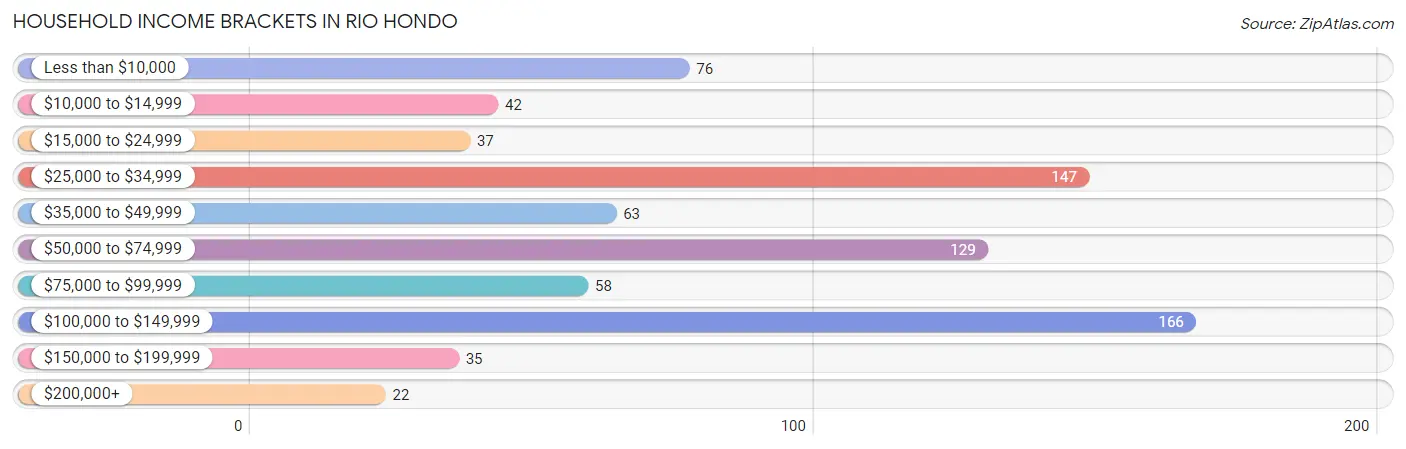
Household Income Brackets in Rio Hondo
With 166 households falling in the category, the $100,000 to $149,999 income range is the most frequent in Rio Hondo, accounting for 21.4% of all households. In contrast, only 22 households (2.8%) fall into the $200,000+ income bracket, making it the least populous group.
| Income Bracket | # Households | % Households |
| Less than $10,000 | 76 | 9.8% |
| $10,000 to $14,999 | 42 | 5.4% |
| $15,000 to $24,999 | 37 | 4.8% |
| $25,000 to $34,999 | 147 | 19.0% |
| $35,000 to $49,999 | 63 | 8.1% |
| $50,000 to $74,999 | 129 | 16.6% |
| $75,000 to $99,999 | 58 | 7.5% |
| $100,000 to $149,999 | 166 | 21.4% |
| $150,000 to $199,999 | 35 | 4.5% |
| $200,000+ | 22 | 2.8% |
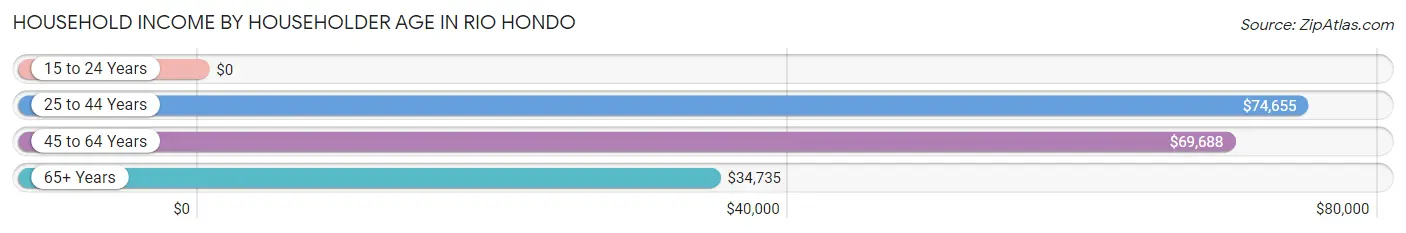
Household Income by Householder Age in Rio Hondo
The median household income in Rio Hondo is $58,487, with the highest median household income of $74,655 found in the 25 to 44 years age bracket for the primary householder. A total of 284 households (36.6%) fall into this category.
| Income Bracket | # Households | Median Income |
| 15 to 24 Years | 0 (0.0%) | $0 |
| 25 to 44 Years | 284 (36.6%) | $74,655 |
| 45 to 64 Years | 200 (25.8%) | $69,688 |
| 65+ Years | 291 (37.6%) | $34,735 |
| Total | 775 (100.0%) | $58,487 |
Poverty in Rio Hondo
Income Below Poverty by Sex and Age in Rio Hondo
With 17.7% poverty level for males and 21.1% for females among the residents of Rio Hondo, 12 to 14 year old males and 6 to 11 year old females are the most vulnerable to poverty, with 29 males (42.6%) and 73 females (64.0%) in their respective age groups living below the poverty level.
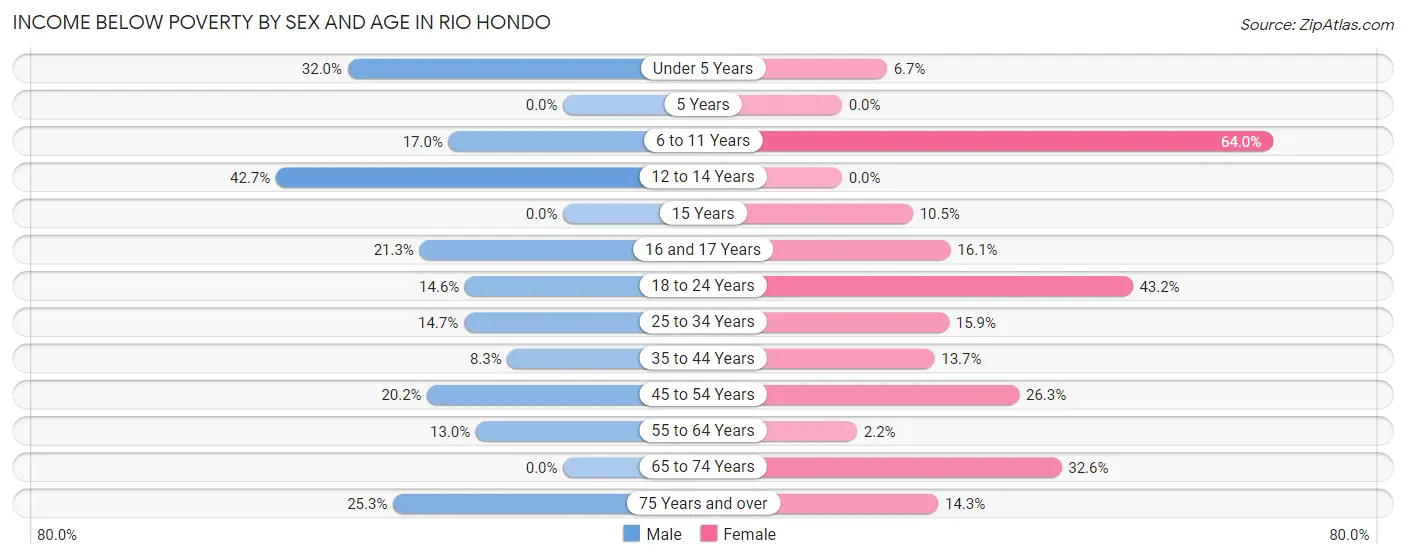
| Age Bracket | Male | Female |
| Under 5 Years | 16 (32.0%) | 8 (6.7%) |
| 5 Years | 0 (0.0%) | 0 (0.0%) |
| 6 to 11 Years | 16 (17.0%) | 73 (64.0%) |
| 12 to 14 Years | 29 (42.6%) | 0 (0.0%) |
| 15 Years | 0 (0.0%) | 12 (10.5%) |
| 16 and 17 Years | 16 (21.3%) | 5 (16.1%) |
| 18 to 24 Years | 7 (14.6%) | 41 (43.2%) |
| 25 to 34 Years | 23 (14.7%) | 17 (15.9%) |
| 35 to 44 Years | 17 (8.3%) | 32 (13.7%) |
| 45 to 54 Years | 22 (20.2%) | 25 (26.3%) |
| 55 to 64 Years | 7 (13.0%) | 3 (2.2%) |
| 65 to 74 Years | 0 (0.0%) | 44 (32.6%) |
| 75 Years and over | 24 (25.3%) | 14 (14.3%) |
| Total | 177 (17.7%) | 274 (21.1%) |
Income Above Poverty by Sex and Age in Rio Hondo
According to the poverty statistics in Rio Hondo, males aged 65 to 74 years and females aged 12 to 14 years are the age groups that are most secure financially, with 100.0% of males and 100.0% of females in these age groups living above the poverty line.
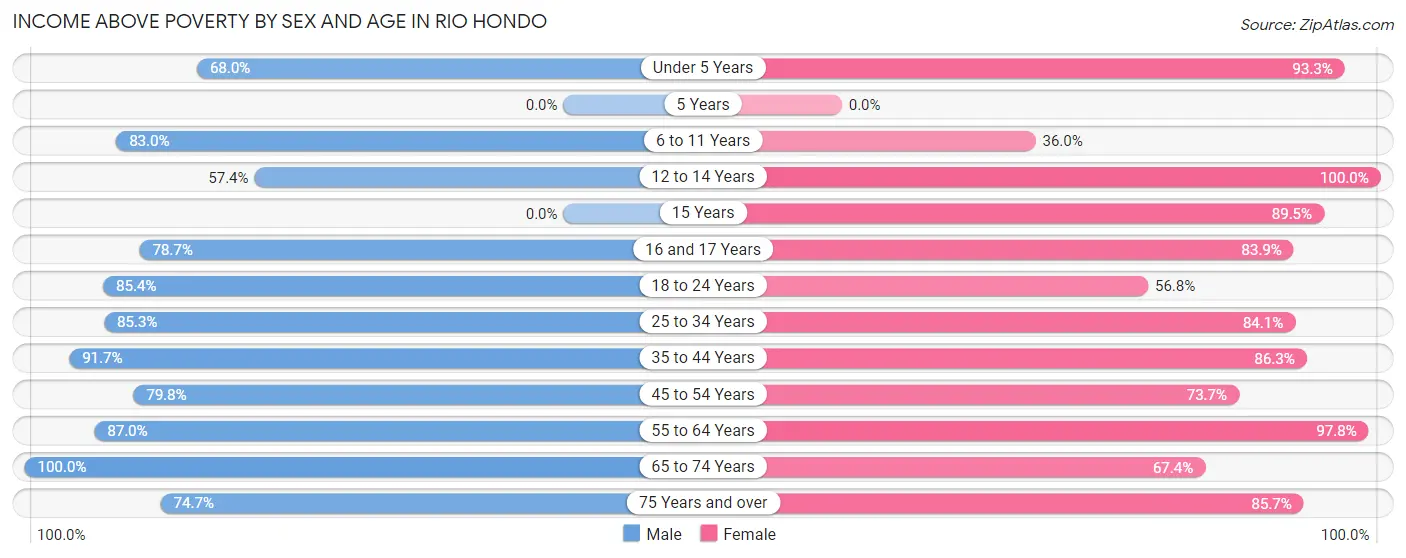
| Age Bracket | Male | Female |
| Under 5 Years | 34 (68.0%) | 112 (93.3%) |
| 5 Years | 0 (0.0%) | 0 (0.0%) |
| 6 to 11 Years | 78 (83.0%) | 41 (36.0%) |
| 12 to 14 Years | 39 (57.4%) | 21 (100.0%) |
| 15 Years | 0 (0.0%) | 102 (89.5%) |
| 16 and 17 Years | 59 (78.7%) | 26 (83.9%) |
| 18 to 24 Years | 41 (85.4%) | 54 (56.8%) |
| 25 to 34 Years | 133 (85.3%) | 90 (84.1%) |
| 35 to 44 Years | 188 (91.7%) | 201 (86.3%) |
| 45 to 54 Years | 87 (79.8%) | 70 (73.7%) |
| 55 to 64 Years | 47 (87.0%) | 131 (97.8%) |
| 65 to 74 Years | 44 (100.0%) | 91 (67.4%) |
| 75 Years and over | 71 (74.7%) | 84 (85.7%) |
| Total | 821 (82.3%) | 1,023 (78.9%) |
Income Below Poverty Among Married-Couple Families in Rio Hondo
The poverty statistics for married-couple families in Rio Hondo show that 8.2% or 29 of the total 356 families live below the poverty line. Families with 1 or 2 children have the highest poverty rate of 9.9%, comprising of 16 families. On the other hand, families with 3 or 4 children have the lowest poverty rate of 0.0%, which includes 0 families.
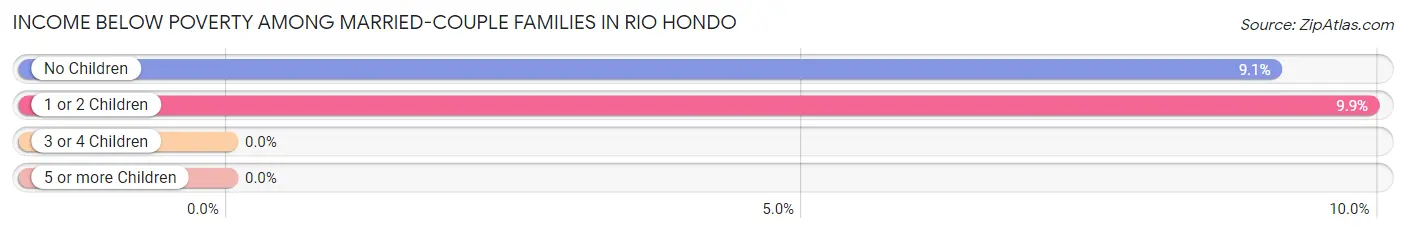
| Children | Above Poverty | Below Poverty |
| No Children | 130 (90.9%) | 13 (9.1%) |
| 1 or 2 Children | 145 (90.1%) | 16 (9.9%) |
| 3 or 4 Children | 52 (100.0%) | 0 (0.0%) |
| 5 or more Children | 0 (0.0%) | 0 (0.0%) |
| Total | 327 (91.8%) | 29 (8.2%) |
Income Below Poverty Among Single-Parent Households in Rio Hondo
According to the poverty data in Rio Hondo, 31.5% or 17 single-father households and 17.5% or 28 single-mother households are living below the poverty line. Among single-father households, those with 1 or 2 children have the highest poverty rate, with 17 households (100.0%) experiencing poverty. Likewise, among single-mother households, those with 3 or 4 children have the highest poverty rate, with 14 households (42.4%) falling below the poverty line.
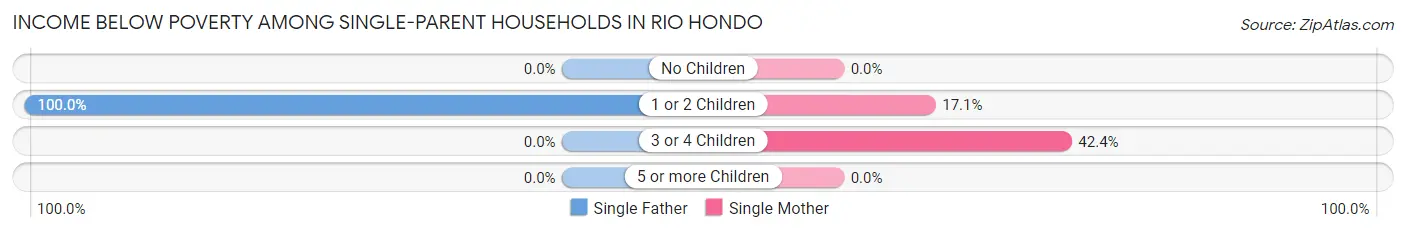
| Children | Single Father | Single Mother |
| No Children | 0 (0.0%) | 0 (0.0%) |
| 1 or 2 Children | 17 (100.0%) | 14 (17.1%) |
| 3 or 4 Children | 0 (0.0%) | 14 (42.4%) |
| 5 or more Children | 0 (0.0%) | 0 (0.0%) |
| Total | 17 (31.5%) | 28 (17.5%) |
Income Below Poverty Among Married-Couple vs Single-Parent Households in Rio Hondo
The poverty data for Rio Hondo shows that 29 of the married-couple family households (8.2%) and 45 of the single-parent households (21.0%) are living below the poverty level. Within the married-couple family households, those with 1 or 2 children have the highest poverty rate, with 16 households (9.9%) falling below the poverty line. Among the single-parent households, those with 3 or 4 children have the highest poverty rate, with 14 household (42.4%) living below poverty.
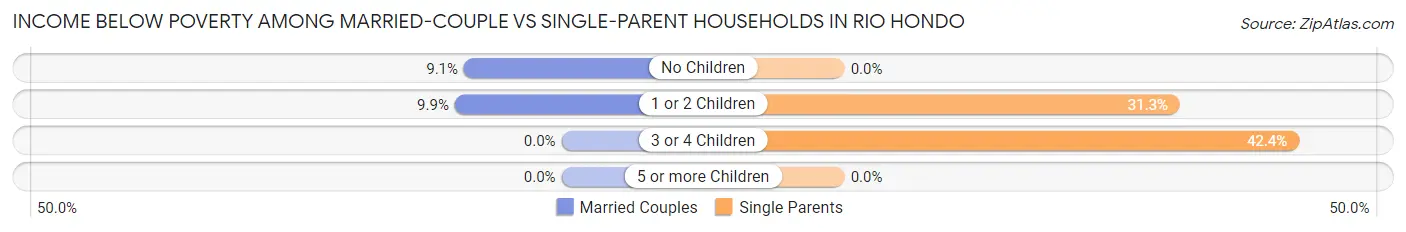
| Children | Married-Couple Families | Single-Parent Households |
| No Children | 13 (9.1%) | 0 (0.0%) |
| 1 or 2 Children | 16 (9.9%) | 31 (31.3%) |
| 3 or 4 Children | 0 (0.0%) | 14 (42.4%) |
| 5 or more Children | 0 (0.0%) | 0 (0.0%) |
| Total | 29 (8.2%) | 45 (21.0%) |
Employment Characteristics in Rio Hondo
Employment by Class of Employer in Rio Hondo
Among the 926 employed individuals in Rio Hondo, private company employees (577 | 62.3%), local government employees (151 | 16.3%), and federal government employees (69 | 7.4%) make up the most common classes of employment.
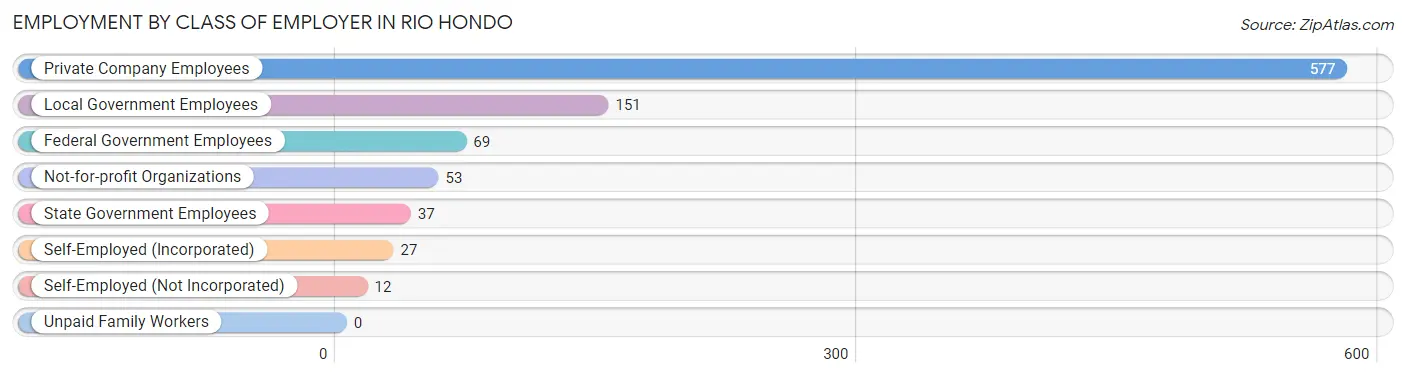
| Employer Class | # Employees | % Employees |
| Private Company Employees | 577 | 62.3% |
| Self-Employed (Incorporated) | 27 | 2.9% |
| Self-Employed (Not Incorporated) | 12 | 1.3% |
| Not-for-profit Organizations | 53 | 5.7% |
| Local Government Employees | 151 | 16.3% |
| State Government Employees | 37 | 4.0% |
| Federal Government Employees | 69 | 7.4% |
| Unpaid Family Workers | 0 | 0.0% |
| Total | 926 | 100.0% |
Employment Status by Age in Rio Hondo
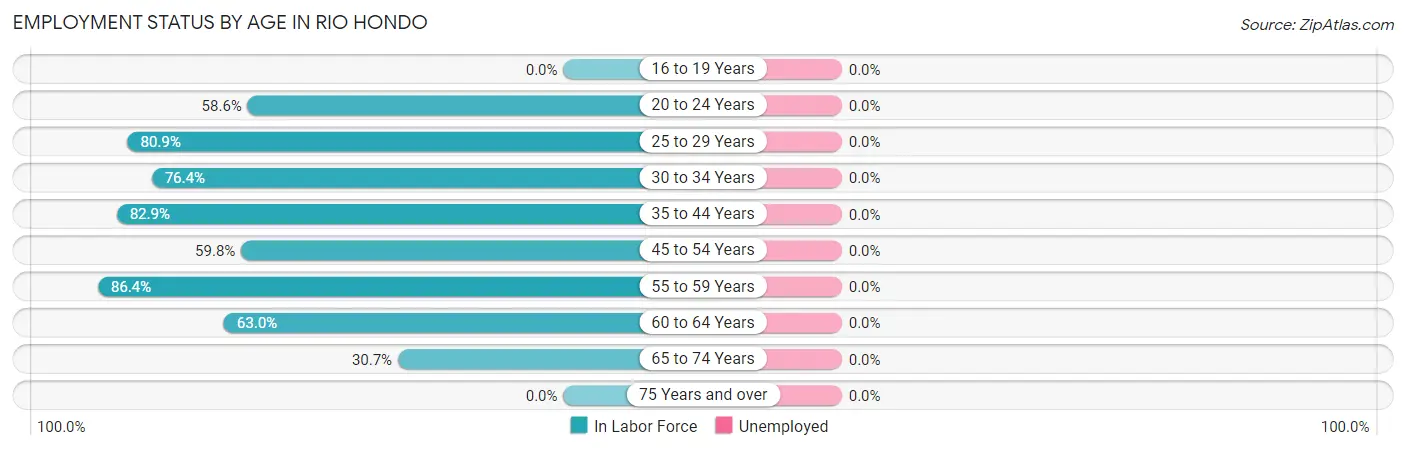
| Age Bracket | In Labor Force | Unemployed |
| 16 to 19 Years | 0 (0.0%) | 0 (0.0%) |
| 20 to 24 Years | 58 (58.6%) | 0 (0.0%) |
| 25 to 29 Years | 110 (80.9%) | 0 (0.0%) |
| 30 to 34 Years | 97 (76.4%) | 0 (0.0%) |
| 35 to 44 Years | 363 (82.9%) | 0 (0.0%) |
| 45 to 54 Years | 122 (59.8%) | 0 (0.0%) |
| 55 to 59 Years | 76 (86.4%) | 0 (0.0%) |
| 60 to 64 Years | 63 (63.0%) | 0 (0.0%) |
| 65 to 74 Years | 55 (30.7%) | 0 (0.0%) |
| 75 Years and over | 0 (0.0%) | 0 (0.0%) |
| Total | 944 (55.1%) | 0 (0.0%) |
Employment Status by Educational Attainment in Rio Hondo
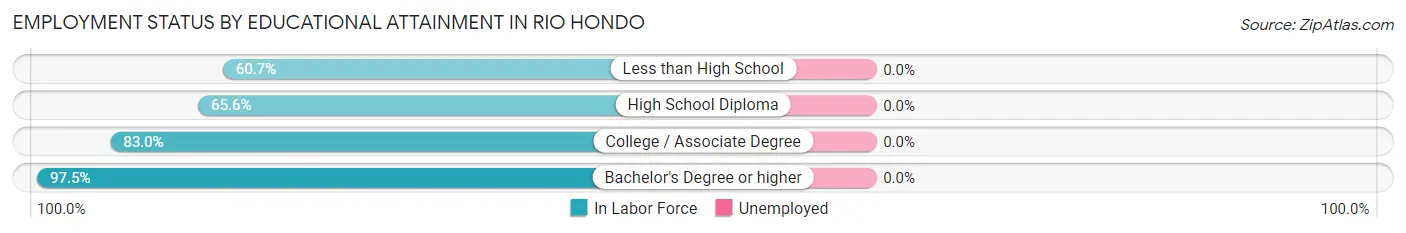
| Educational Attainment | In Labor Force | Unemployed |
| Less than High School | 133 (60.7%) | 0 (0.0%) |
| High School Diploma | 212 (65.6%) | 0 (0.0%) |
| College / Associate Degree | 292 (83.0%) | 0 (0.0%) |
| Bachelor's Degree or higher | 194 (97.5%) | 0 (0.0%) |
| Total | 831 (76.0%) | 0 (0.0%) |
Employment Occupations by Sex in Rio Hondo
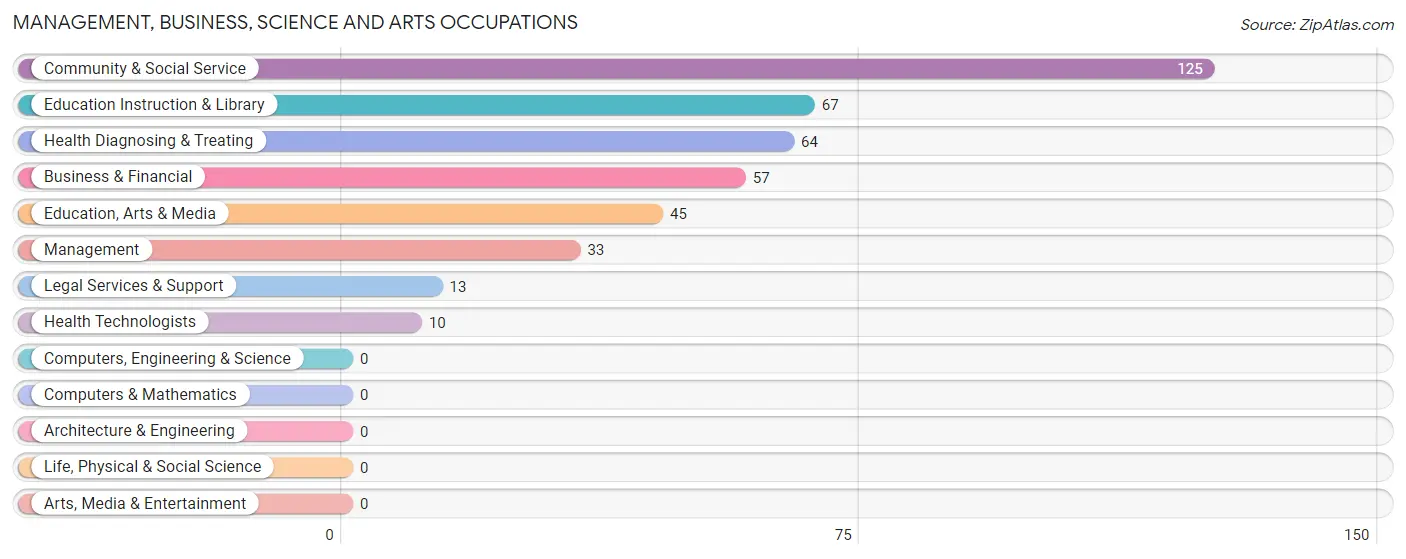
Management, Business, Science and Arts Occupations
The most common Management, Business, Science and Arts occupations in Rio Hondo are Community & Social Service (125 | 13.2%), Education Instruction & Library (67 | 7.1%), Health Diagnosing & Treating (64 | 6.8%), Business & Financial (57 | 6.0%), and Education, Arts & Media (45 | 4.8%).
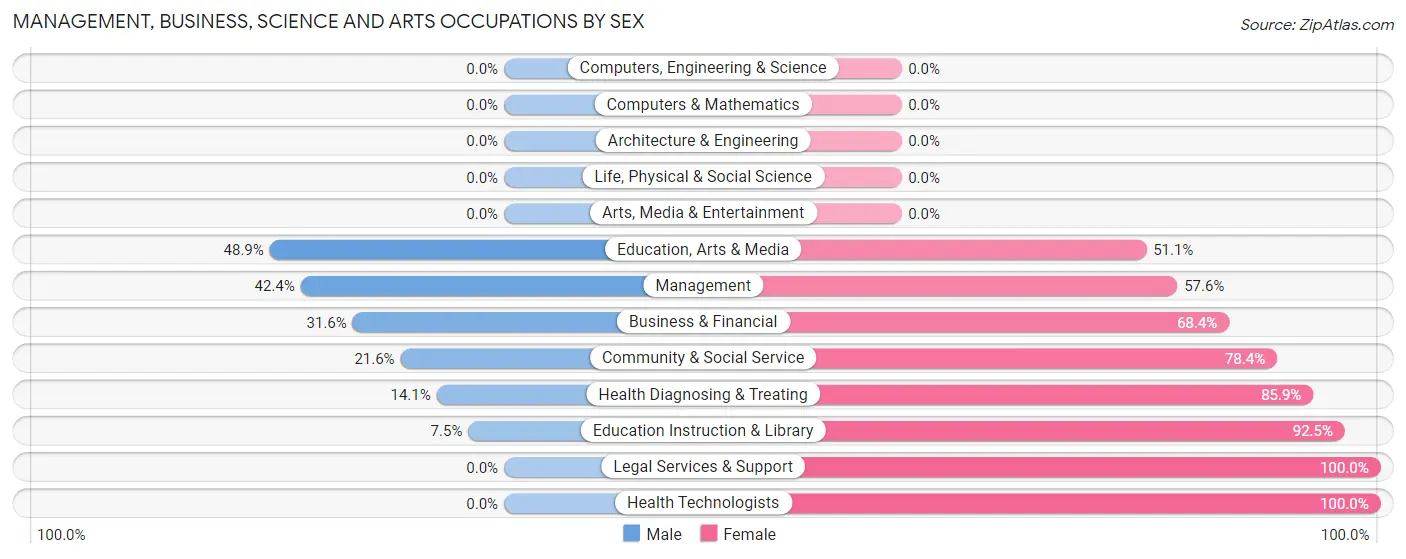
Management, Business, Science and Arts Occupations by Sex
Within the Management, Business, Science and Arts occupations in Rio Hondo, the most male-oriented occupations are Education, Arts & Media (48.9%), Management (42.4%), and Business & Financial (31.6%), while the most female-oriented occupations are Legal Services & Support (100.0%), Health Technologists (100.0%), and Education Instruction & Library (92.5%).
| Occupation | Male | Female |
| Management | 14 (42.4%) | 19 (57.6%) |
| Business & Financial | 18 (31.6%) | 39 (68.4%) |
| Computers, Engineering & Science | 0 (0.0%) | 0 (0.0%) |
| Computers & Mathematics | 0 (0.0%) | 0 (0.0%) |
| Architecture & Engineering | 0 (0.0%) | 0 (0.0%) |
| Life, Physical & Social Science | 0 (0.0%) | 0 (0.0%) |
| Community & Social Service | 27 (21.6%) | 98 (78.4%) |
| Education, Arts & Media | 22 (48.9%) | 23 (51.1%) |
| Legal Services & Support | 0 (0.0%) | 13 (100.0%) |
| Education Instruction & Library | 5 (7.5%) | 62 (92.5%) |
| Arts, Media & Entertainment | 0 (0.0%) | 0 (0.0%) |
| Health Diagnosing & Treating | 9 (14.1%) | 55 (85.9%) |
| Health Technologists | 0 (0.0%) | 10 (100.0%) |
| Total (Category) | 68 (24.4%) | 211 (75.6%) |
| Total (Overall) | 479 (50.7%) | 465 (49.3%) |
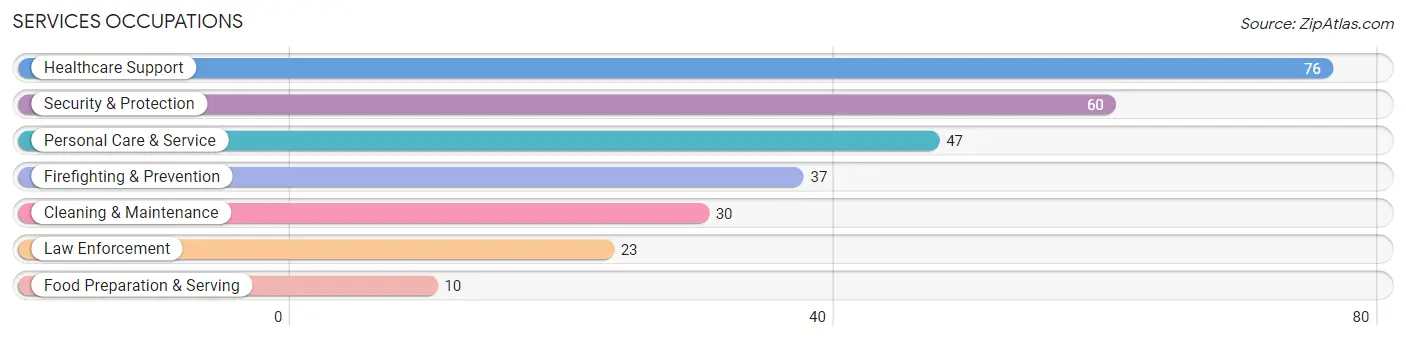
Services Occupations
The most common Services occupations in Rio Hondo are Healthcare Support (76 | 8.1%), Security & Protection (60 | 6.4%), Personal Care & Service (47 | 5.0%), Firefighting & Prevention (37 | 3.9%), and Cleaning & Maintenance (30 | 3.2%).
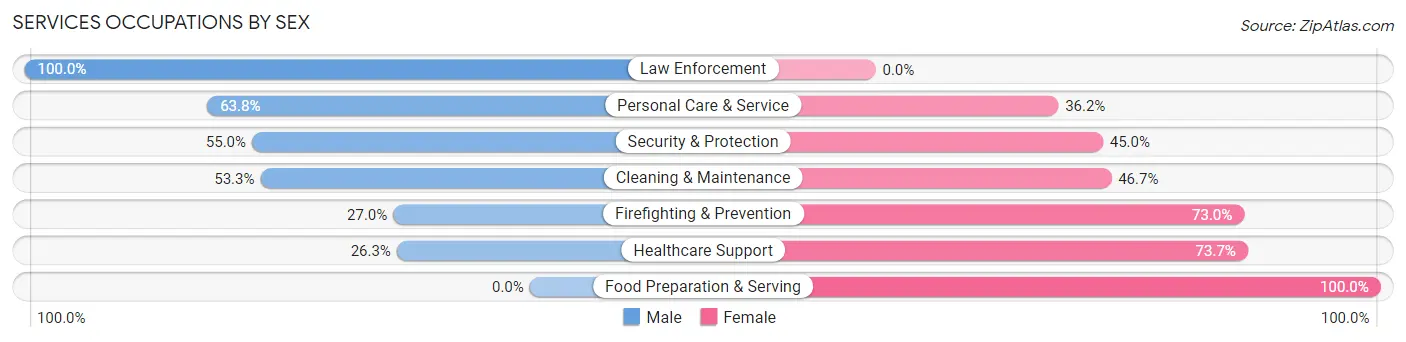
Services Occupations by Sex
Within the Services occupations in Rio Hondo, the most male-oriented occupations are Law Enforcement (100.0%), Personal Care & Service (63.8%), and Security & Protection (55.0%), while the most female-oriented occupations are Food Preparation & Serving (100.0%), Healthcare Support (73.7%), and Firefighting & Prevention (73.0%).
| Occupation | Male | Female |
| Healthcare Support | 20 (26.3%) | 56 (73.7%) |
| Security & Protection | 33 (55.0%) | 27 (45.0%) |
| Firefighting & Prevention | 10 (27.0%) | 27 (73.0%) |
| Law Enforcement | 23 (100.0%) | 0 (0.0%) |
| Food Preparation & Serving | 0 (0.0%) | 10 (100.0%) |
| Cleaning & Maintenance | 16 (53.3%) | 14 (46.7%) |
| Personal Care & Service | 30 (63.8%) | 17 (36.2%) |
| Total (Category) | 99 (44.4%) | 124 (55.6%) |
| Total (Overall) | 479 (50.7%) | 465 (49.3%) |
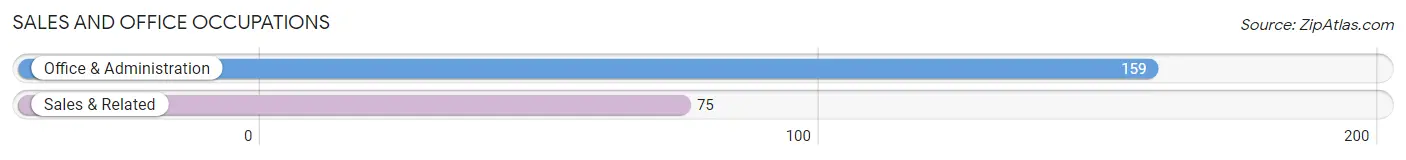
Sales and Office Occupations
The most common Sales and Office occupations in Rio Hondo are Office & Administration (159 | 16.8%), and Sales & Related (75 | 7.9%).
Sales and Office Occupations by Sex
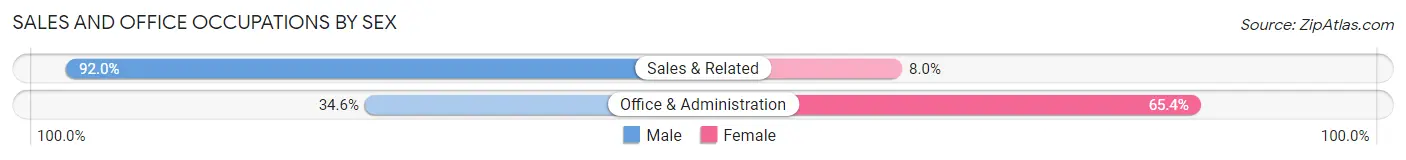
| Occupation | Male | Female |
| Sales & Related | 69 (92.0%) | 6 (8.0%) |
| Office & Administration | 55 (34.6%) | 104 (65.4%) |
| Total (Category) | 124 (53.0%) | 110 (47.0%) |
| Total (Overall) | 479 (50.7%) | 465 (49.3%) |
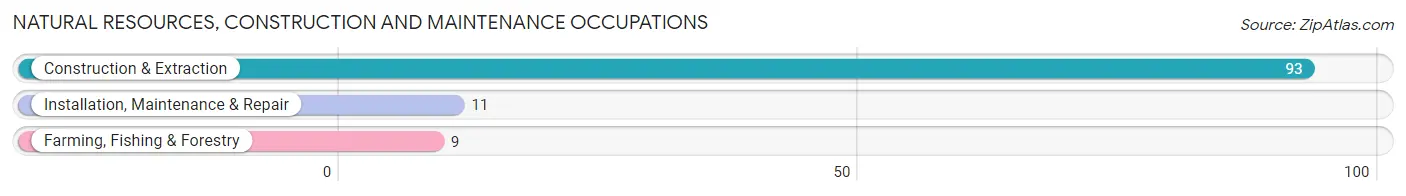
Natural Resources, Construction and Maintenance Occupations
The most common Natural Resources, Construction and Maintenance occupations in Rio Hondo are Construction & Extraction (93 | 9.9%), Installation, Maintenance & Repair (11 | 1.2%), and Farming, Fishing & Forestry (9 | 0.9%).
Natural Resources, Construction and Maintenance Occupations by Sex
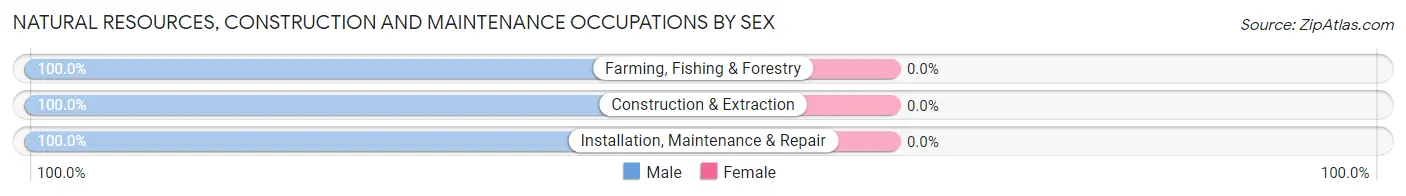
| Occupation | Male | Female |
| Farming, Fishing & Forestry | 9 (100.0%) | 0 (0.0%) |
| Construction & Extraction | 93 (100.0%) | 0 (0.0%) |
| Installation, Maintenance & Repair | 11 (100.0%) | 0 (0.0%) |
| Total (Category) | 113 (100.0%) | 0 (0.0%) |
| Total (Overall) | 479 (50.7%) | 465 (49.3%) |
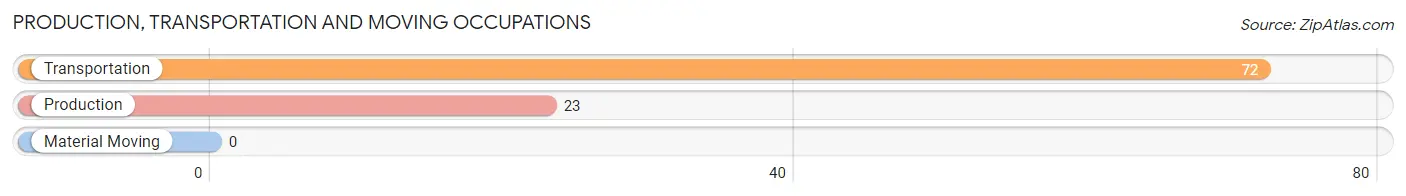
Production, Transportation and Moving Occupations
The most common Production, Transportation and Moving occupations in Rio Hondo are Transportation (72 | 7.6%), and Production (23 | 2.4%).
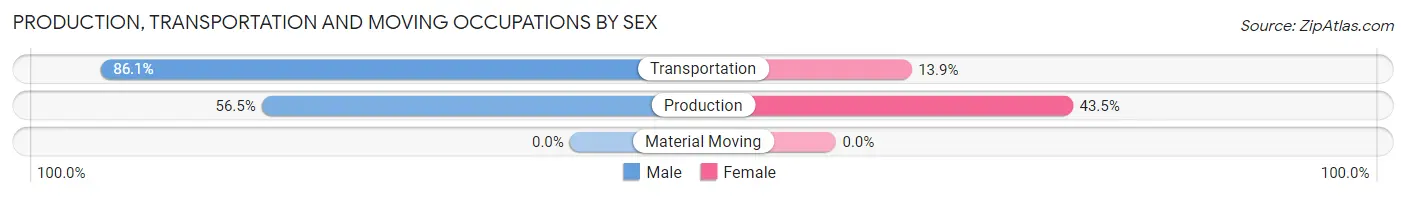
Production, Transportation and Moving Occupations by Sex
| Occupation | Male | Female |
| Production | 13 (56.5%) | 10 (43.5%) |
| Transportation | 62 (86.1%) | 10 (13.9%) |
| Material Moving | 0 (0.0%) | 0 (0.0%) |
| Total (Category) | 75 (78.9%) | 20 (21.0%) |
| Total (Overall) | 479 (50.7%) | 465 (49.3%) |
Employment Industries by Sex in Rio Hondo
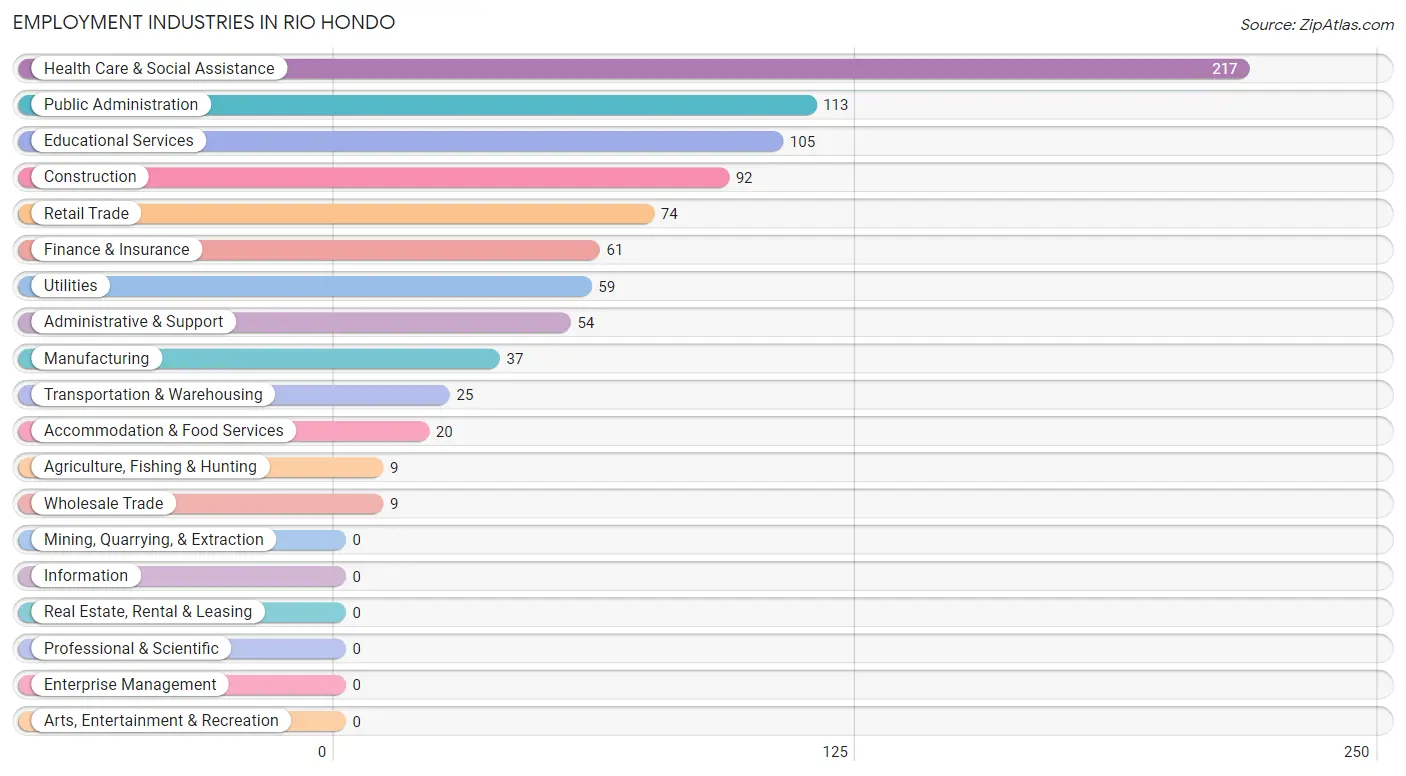
Employment Industries in Rio Hondo
The major employment industries in Rio Hondo include Health Care & Social Assistance (217 | 23.0%), Public Administration (113 | 12.0%), Educational Services (105 | 11.1%), Construction (92 | 9.8%), and Retail Trade (74 | 7.8%).
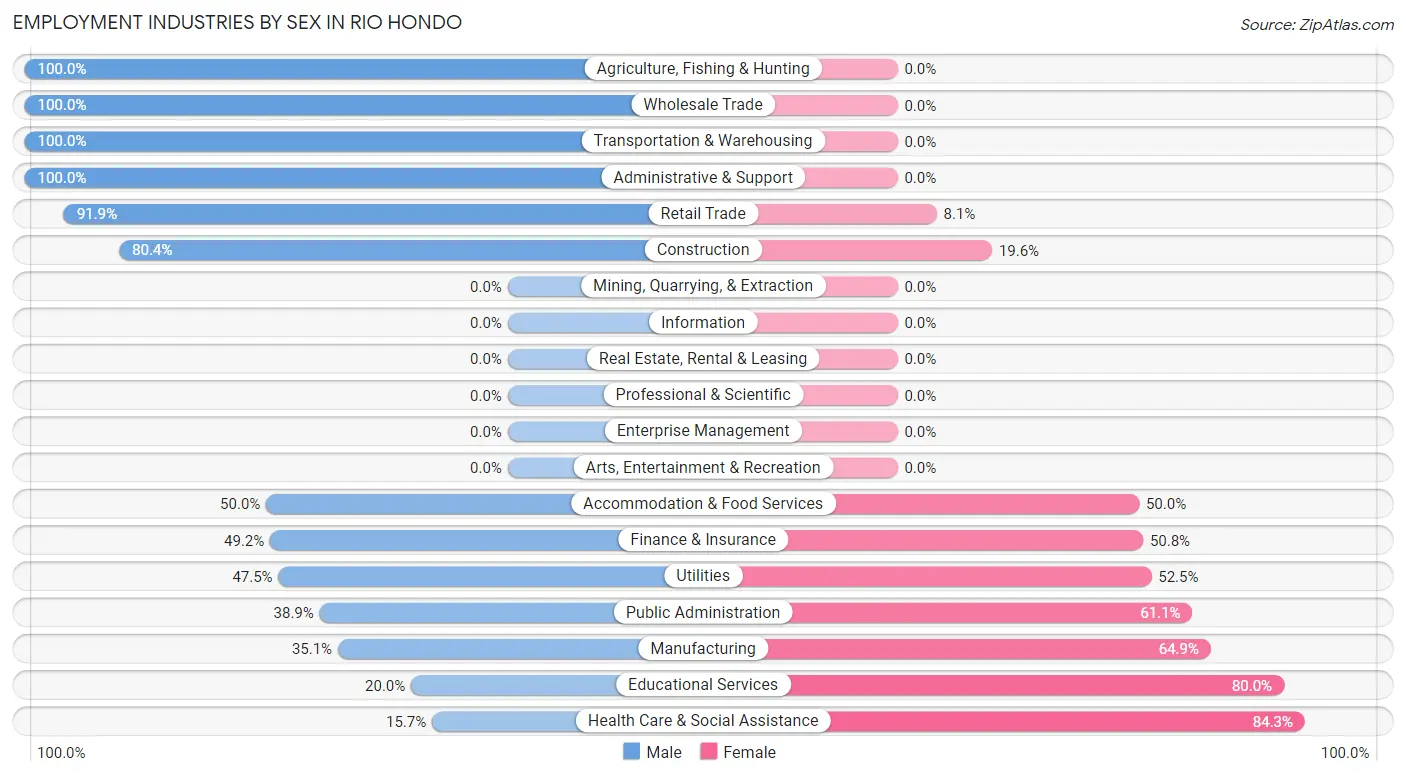
Employment Industries by Sex in Rio Hondo
The Rio Hondo industries that see more men than women are Agriculture, Fishing & Hunting (100.0%), Wholesale Trade (100.0%), and Transportation & Warehousing (100.0%), whereas the industries that tend to have a higher number of women are Health Care & Social Assistance (84.3%), Educational Services (80.0%), and Manufacturing (64.9%).
| Industry | Male | Female |
| Agriculture, Fishing & Hunting | 9 (100.0%) | 0 (0.0%) |
| Mining, Quarrying, & Extraction | 0 (0.0%) | 0 (0.0%) |
| Construction | 74 (80.4%) | 18 (19.6%) |
| Manufacturing | 13 (35.1%) | 24 (64.9%) |
| Wholesale Trade | 9 (100.0%) | 0 (0.0%) |
| Retail Trade | 68 (91.9%) | 6 (8.1%) |
| Transportation & Warehousing | 25 (100.0%) | 0 (0.0%) |
| Utilities | 28 (47.5%) | 31 (52.5%) |
| Information | 0 (0.0%) | 0 (0.0%) |
| Finance & Insurance | 30 (49.2%) | 31 (50.8%) |
| Real Estate, Rental & Leasing | 0 (0.0%) | 0 (0.0%) |
| Professional & Scientific | 0 (0.0%) | 0 (0.0%) |
| Enterprise Management | 0 (0.0%) | 0 (0.0%) |
| Administrative & Support | 54 (100.0%) | 0 (0.0%) |
| Educational Services | 21 (20.0%) | 84 (80.0%) |
| Health Care & Social Assistance | 34 (15.7%) | 183 (84.3%) |
| Arts, Entertainment & Recreation | 0 (0.0%) | 0 (0.0%) |
| Accommodation & Food Services | 10 (50.0%) | 10 (50.0%) |
| Public Administration | 44 (38.9%) | 69 (61.1%) |
| Total | 479 (50.7%) | 465 (49.3%) |
Education in Rio Hondo
School Enrollment in Rio Hondo
The most common levels of schooling among the 627 students in Rio Hondo are high school (215 | 34.3%), middle school (145 | 23.1%), and elementary school (141 | 22.5%).
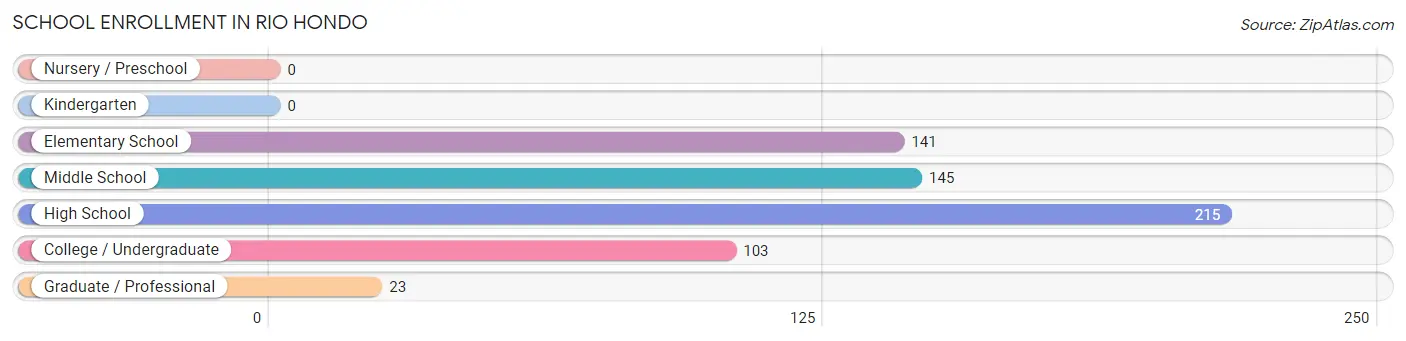
| School Level | # Students | % Students |
| Nursery / Preschool | 0 | 0.0% |
| Kindergarten | 0 | 0.0% |
| Elementary School | 141 | 22.5% |
| Middle School | 145 | 23.1% |
| High School | 215 | 34.3% |
| College / Undergraduate | 103 | 16.4% |
| Graduate / Professional | 23 | 3.7% |
| Total | 627 | 100.0% |
School Enrollment by Age by Funding Source in Rio Hondo
Out of a total of 627 students who are enrolled in schools in Rio Hondo, 7 (1.1%) attend a private institution, while the remaining 620 (98.9%) are enrolled in public schools. The age group of 18 to 19 year olds has the highest likelihood of being enrolled in private schools, with 7 (43.8% in the age bracket) enrolled. Conversely, the age group of 5 to 9 year old has the lowest likelihood of being enrolled in a private school, with 137 (100.0% in the age bracket) attending a public institution.
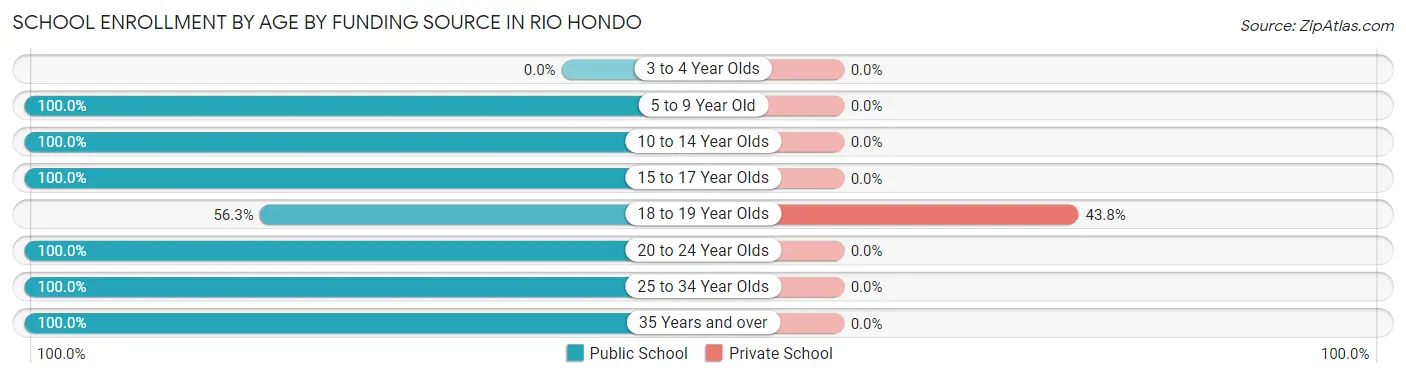
| Age Bracket | Public School | Private School |
| 3 to 4 Year Olds | 0 (0.0%) | 0 (0.0%) |
| 5 to 9 Year Old | 137 (100.0%) | 0 (0.0%) |
| 10 to 14 Year Olds | 144 (100.0%) | 0 (0.0%) |
| 15 to 17 Year Olds | 205 (100.0%) | 0 (0.0%) |
| 18 to 19 Year Olds | 9 (56.2%) | 7 (43.8%) |
| 20 to 24 Year Olds | 54 (100.0%) | 0 (0.0%) |
| 25 to 34 Year Olds | 6 (100.0%) | 0 (0.0%) |
| 35 Years and over | 65 (100.0%) | 0 (0.0%) |
| Total | 620 (98.9%) | 7 (1.1%) |
Educational Attainment by Field of Study in Rio Hondo
Business (48 | 22.3%), education (48 | 22.3%), science & technology (46 | 21.4%), arts & humanities (36 | 16.7%), and bio, nature & agricultural (26 | 12.1%) are the most common fields of study among 215 individuals in Rio Hondo who have obtained a bachelor's degree or higher.
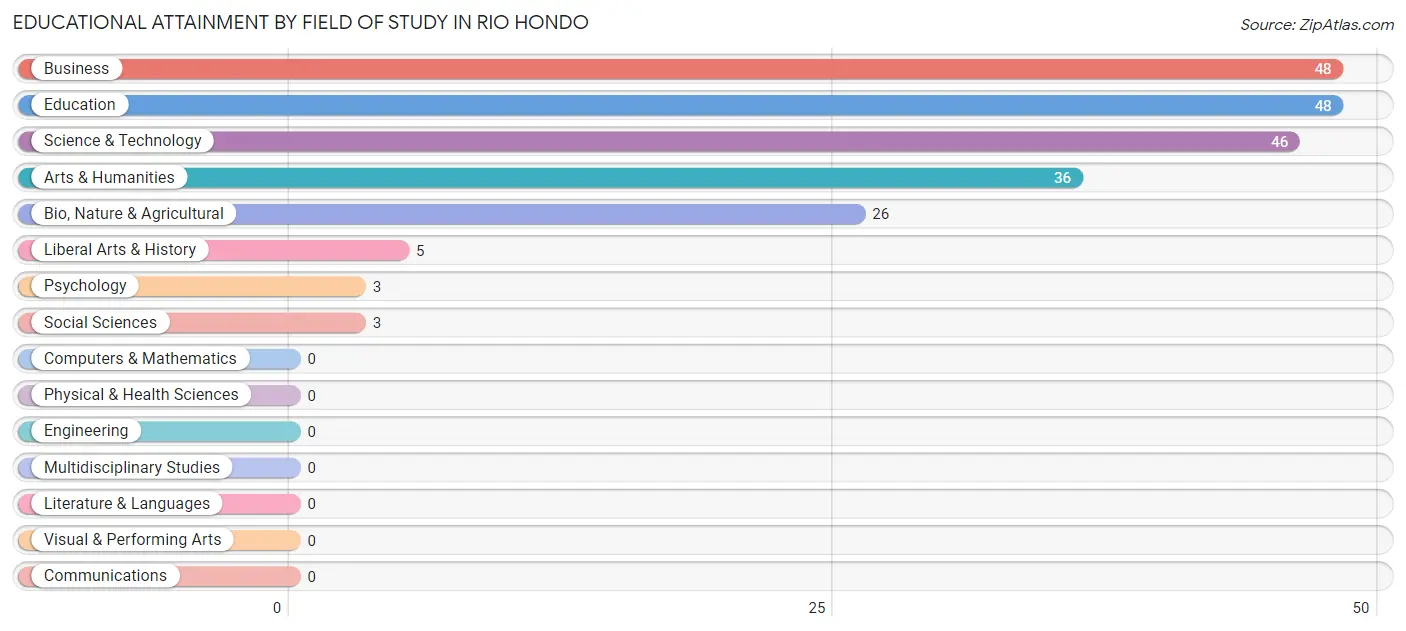
| Field of Study | # Graduates | % Graduates |
| Computers & Mathematics | 0 | 0.0% |
| Bio, Nature & Agricultural | 26 | 12.1% |
| Physical & Health Sciences | 0 | 0.0% |
| Psychology | 3 | 1.4% |
| Social Sciences | 3 | 1.4% |
| Engineering | 0 | 0.0% |
| Multidisciplinary Studies | 0 | 0.0% |
| Science & Technology | 46 | 21.4% |
| Business | 48 | 22.3% |
| Education | 48 | 22.3% |
| Literature & Languages | 0 | 0.0% |
| Liberal Arts & History | 5 | 2.3% |
| Visual & Performing Arts | 0 | 0.0% |
| Communications | 0 | 0.0% |
| Arts & Humanities | 36 | 16.7% |
| Total | 215 | 100.0% |
Transportation & Commute in Rio Hondo
Vehicle Availability by Sex in Rio Hondo
The most prevalent vehicle ownership categories in Rio Hondo are males with 3 vehicles (220, accounting for 46.8%) and females with 3 vehicles (162, making up 48.2%).
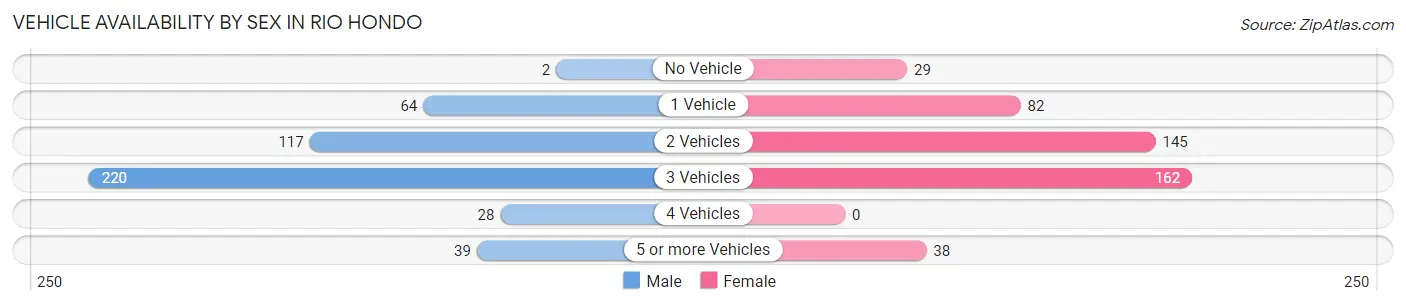
| Vehicles Available | Male | Female |
| No Vehicle | 2 (0.4%) | 29 (6.4%) |
| 1 Vehicle | 64 (13.6%) | 82 (18.0%) |
| 2 Vehicles | 117 (24.9%) | 145 (31.8%) |
| 3 Vehicles | 220 (46.8%) | 162 (35.5%) |
| 4 Vehicles | 28 (6.0%) | 0 (0.0%) |
| 5 or more Vehicles | 39 (8.3%) | 38 (8.3%) |
| Total | 470 (100.0%) | 456 (100.0%) |
Commute Time in Rio Hondo
The most frequently occuring commute durations in Rio Hondo are 20 to 24 minutes (248 commuters, 29.9%), 15 to 19 minutes (132 commuters, 15.9%), and 30 to 34 minutes (130 commuters, 15.7%).
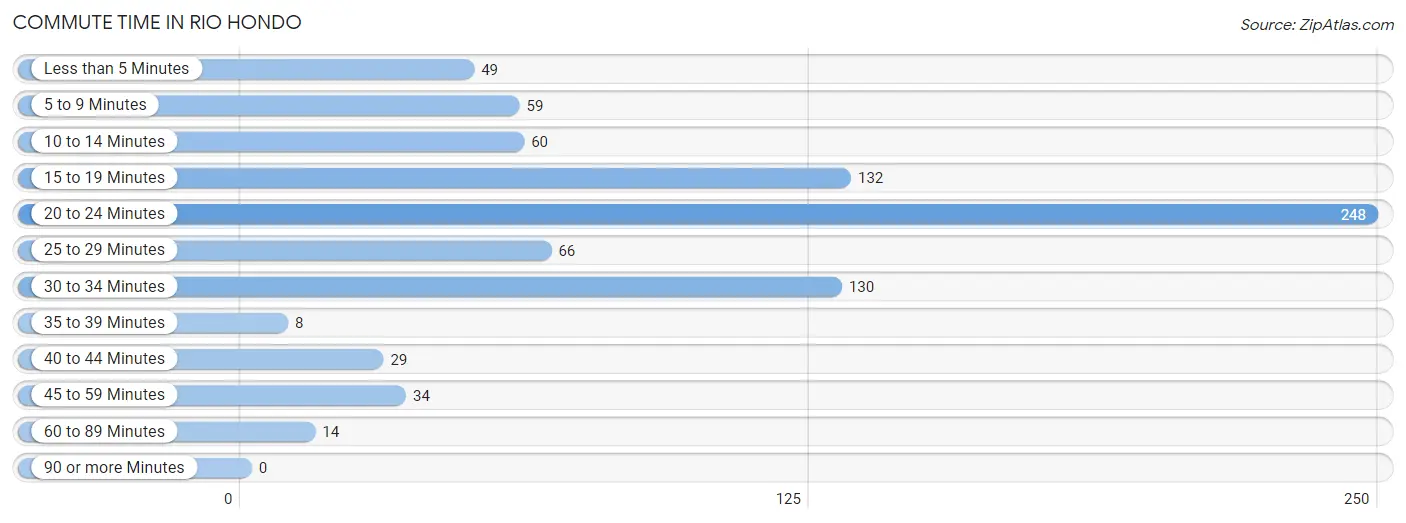
| Commute Time | # Commuters | % Commuters |
| Less than 5 Minutes | 49 | 5.9% |
| 5 to 9 Minutes | 59 | 7.1% |
| 10 to 14 Minutes | 60 | 7.2% |
| 15 to 19 Minutes | 132 | 15.9% |
| 20 to 24 Minutes | 248 | 29.9% |
| 25 to 29 Minutes | 66 | 8.0% |
| 30 to 34 Minutes | 130 | 15.7% |
| 35 to 39 Minutes | 8 | 1.0% |
| 40 to 44 Minutes | 29 | 3.5% |
| 45 to 59 Minutes | 34 | 4.1% |
| 60 to 89 Minutes | 14 | 1.7% |
| 90 or more Minutes | 0 | 0.0% |
Commute Time by Sex in Rio Hondo
The most common commute times in Rio Hondo are 20 to 24 minutes (131 commuters, 31.7%) for males and 20 to 24 minutes (117 commuters, 28.1%) for females.
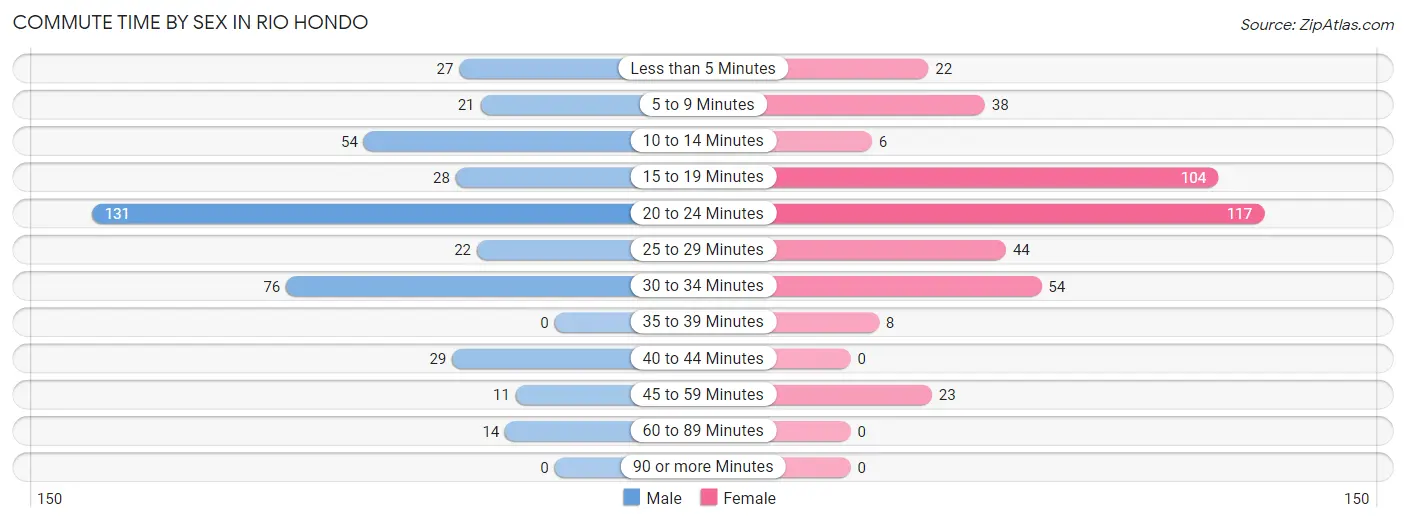
| Commute Time | Male | Female |
| Less than 5 Minutes | 27 (6.5%) | 22 (5.3%) |
| 5 to 9 Minutes | 21 (5.1%) | 38 (9.1%) |
| 10 to 14 Minutes | 54 (13.1%) | 6 (1.4%) |
| 15 to 19 Minutes | 28 (6.8%) | 104 (25.0%) |
| 20 to 24 Minutes | 131 (31.7%) | 117 (28.1%) |
| 25 to 29 Minutes | 22 (5.3%) | 44 (10.6%) |
| 30 to 34 Minutes | 76 (18.4%) | 54 (13.0%) |
| 35 to 39 Minutes | 0 (0.0%) | 8 (1.9%) |
| 40 to 44 Minutes | 29 (7.0%) | 0 (0.0%) |
| 45 to 59 Minutes | 11 (2.7%) | 23 (5.5%) |
| 60 to 89 Minutes | 14 (3.4%) | 0 (0.0%) |
| 90 or more Minutes | 0 (0.0%) | 0 (0.0%) |
Time of Departure to Work by Sex in Rio Hondo
The most frequent times of departure to work in Rio Hondo are 6:00 AM to 6:29 AM (118, 28.6%) for males and 7:00 AM to 7:29 AM (113, 27.2%) for females.
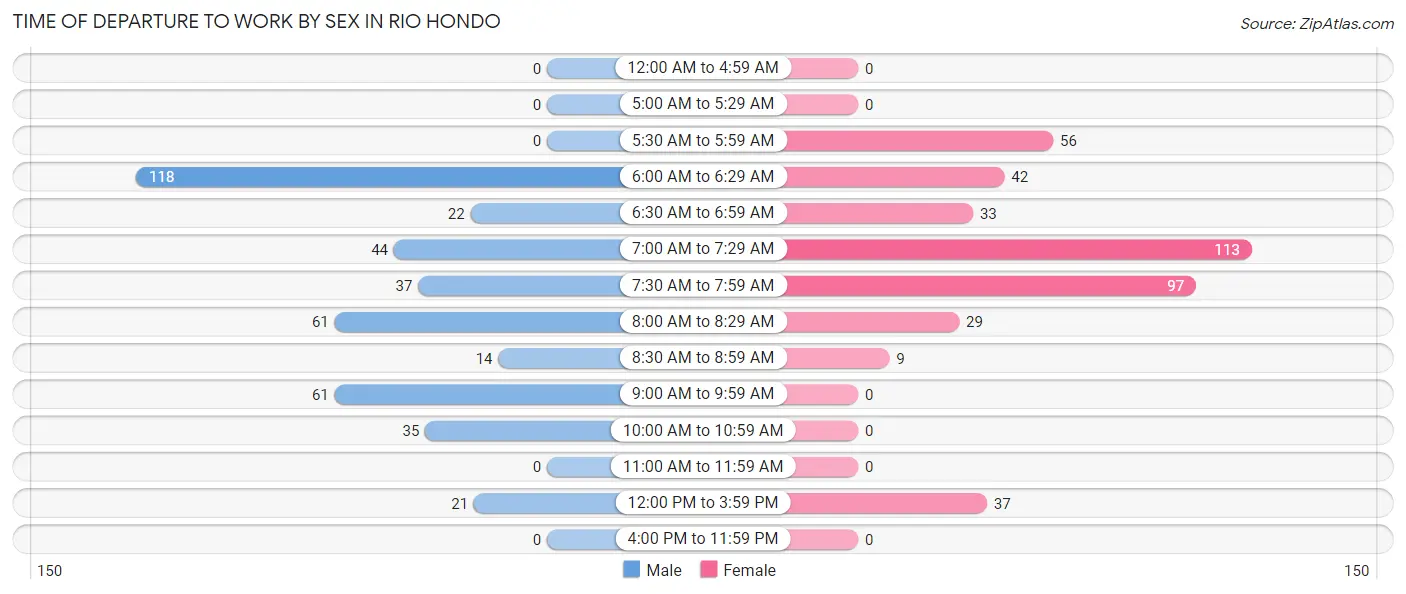
| Time of Departure | Male | Female |
| 12:00 AM to 4:59 AM | 0 (0.0%) | 0 (0.0%) |
| 5:00 AM to 5:29 AM | 0 (0.0%) | 0 (0.0%) |
| 5:30 AM to 5:59 AM | 0 (0.0%) | 56 (13.5%) |
| 6:00 AM to 6:29 AM | 118 (28.6%) | 42 (10.1%) |
| 6:30 AM to 6:59 AM | 22 (5.3%) | 33 (7.9%) |
| 7:00 AM to 7:29 AM | 44 (10.6%) | 113 (27.2%) |
| 7:30 AM to 7:59 AM | 37 (9.0%) | 97 (23.3%) |
| 8:00 AM to 8:29 AM | 61 (14.8%) | 29 (7.0%) |
| 8:30 AM to 8:59 AM | 14 (3.4%) | 9 (2.2%) |
| 9:00 AM to 9:59 AM | 61 (14.8%) | 0 (0.0%) |
| 10:00 AM to 10:59 AM | 35 (8.5%) | 0 (0.0%) |
| 11:00 AM to 11:59 AM | 0 (0.0%) | 0 (0.0%) |
| 12:00 PM to 3:59 PM | 21 (5.1%) | 37 (8.9%) |
| 4:00 PM to 11:59 PM | 0 (0.0%) | 0 (0.0%) |
| Total | 413 (100.0%) | 416 (100.0%) |
Housing Occupancy in Rio Hondo
Occupancy by Ownership in Rio Hondo
Of the total 775 dwellings in Rio Hondo, owner-occupied units account for 525 (67.7%), while renter-occupied units make up 250 (32.3%).
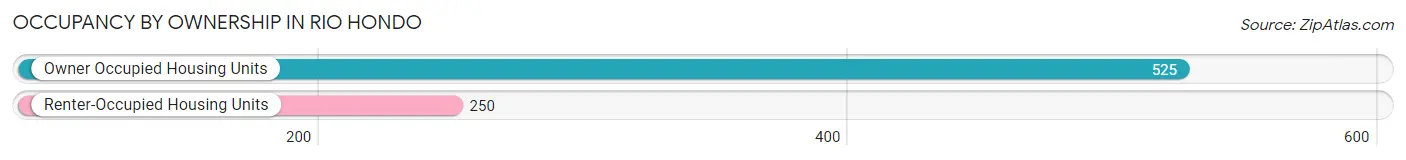
| Occupancy | # Housing Units | % Housing Units |
| Owner Occupied Housing Units | 525 | 67.7% |
| Renter-Occupied Housing Units | 250 | 32.3% |
| Total Occupied Housing Units | 775 | 100.0% |
Occupancy by Household Size in Rio Hondo
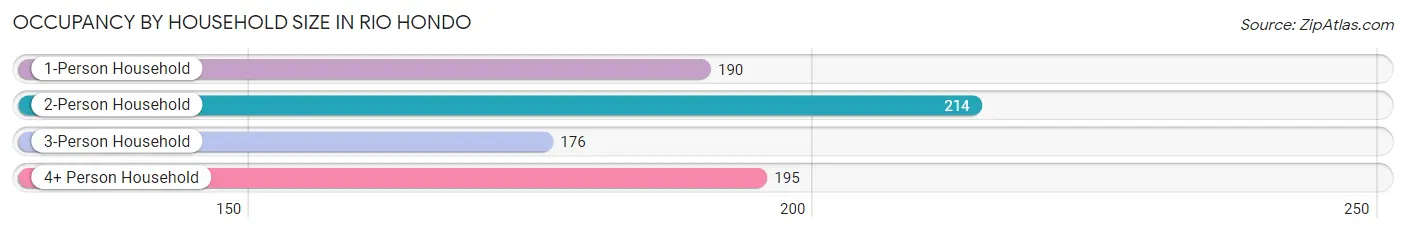
| Household Size | # Housing Units | % Housing Units |
| 1-Person Household | 190 | 24.5% |
| 2-Person Household | 214 | 27.6% |
| 3-Person Household | 176 | 22.7% |
| 4+ Person Household | 195 | 25.2% |
| Total Housing Units | 775 | 100.0% |
Occupancy by Ownership by Household Size in Rio Hondo
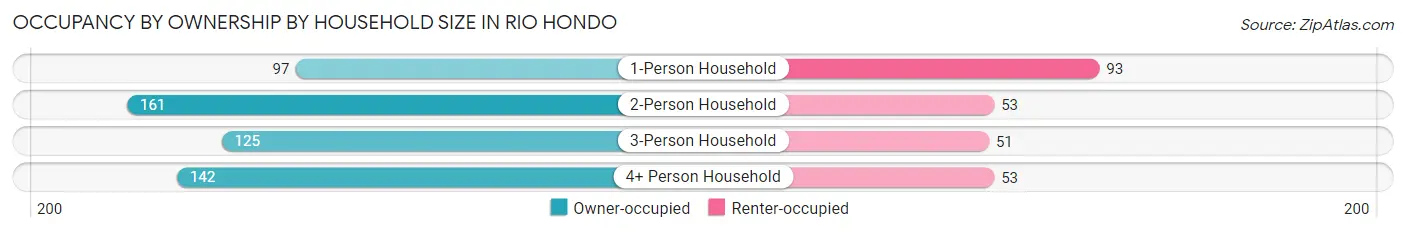
| Household Size | Owner-occupied | Renter-occupied |
| 1-Person Household | 97 (51.0%) | 93 (48.9%) |
| 2-Person Household | 161 (75.2%) | 53 (24.8%) |
| 3-Person Household | 125 (71.0%) | 51 (29.0%) |
| 4+ Person Household | 142 (72.8%) | 53 (27.2%) |
| Total Housing Units | 525 (67.7%) | 250 (32.3%) |
Occupancy by Educational Attainment in Rio Hondo
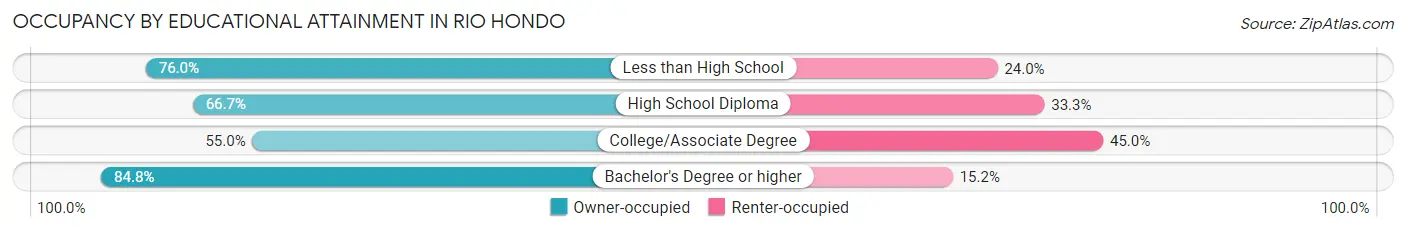
| Household Size | Owner-occupied | Renter-occupied |
| Less than High School | 158 (76.0%) | 50 (24.0%) |
| High School Diploma | 124 (66.7%) | 62 (33.3%) |
| College/Associate Degree | 148 (55.0%) | 121 (45.0%) |
| Bachelor's Degree or higher | 95 (84.8%) | 17 (15.2%) |
Occupancy by Age of Householder in Rio Hondo
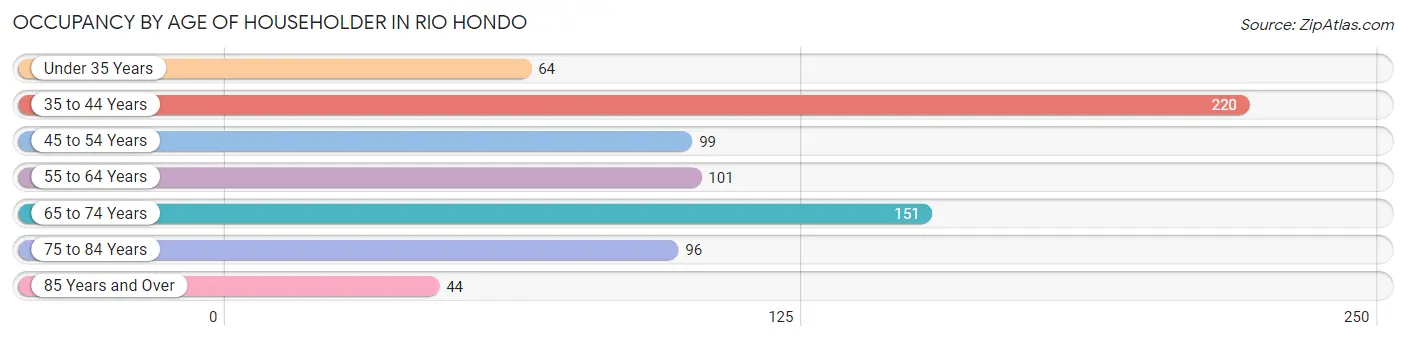
| Age Bracket | # Households | % Households |
| Under 35 Years | 64 | 8.3% |
| 35 to 44 Years | 220 | 28.4% |
| 45 to 54 Years | 99 | 12.8% |
| 55 to 64 Years | 101 | 13.0% |
| 65 to 74 Years | 151 | 19.5% |
| 75 to 84 Years | 96 | 12.4% |
| 85 Years and Over | 44 | 5.7% |
| Total | 775 | 100.0% |
Housing Finances in Rio Hondo
Median Income by Occupancy in Rio Hondo
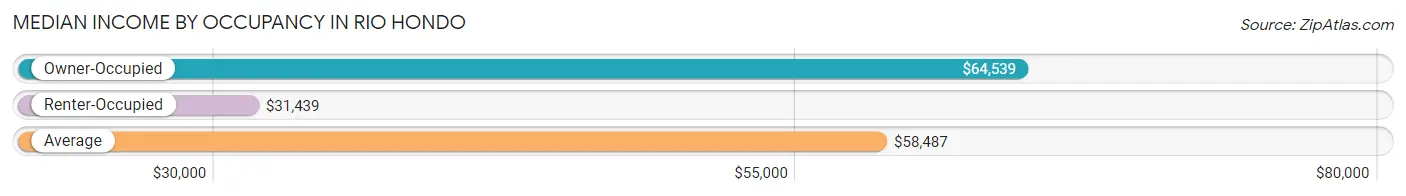
| Occupancy Type | # Households | Median Income |
| Owner-Occupied | 525 (67.7%) | $64,539 |
| Renter-Occupied | 250 (32.3%) | $31,439 |
| Average | 775 (100.0%) | $58,487 |
Occupancy by Householder Income Bracket in Rio Hondo
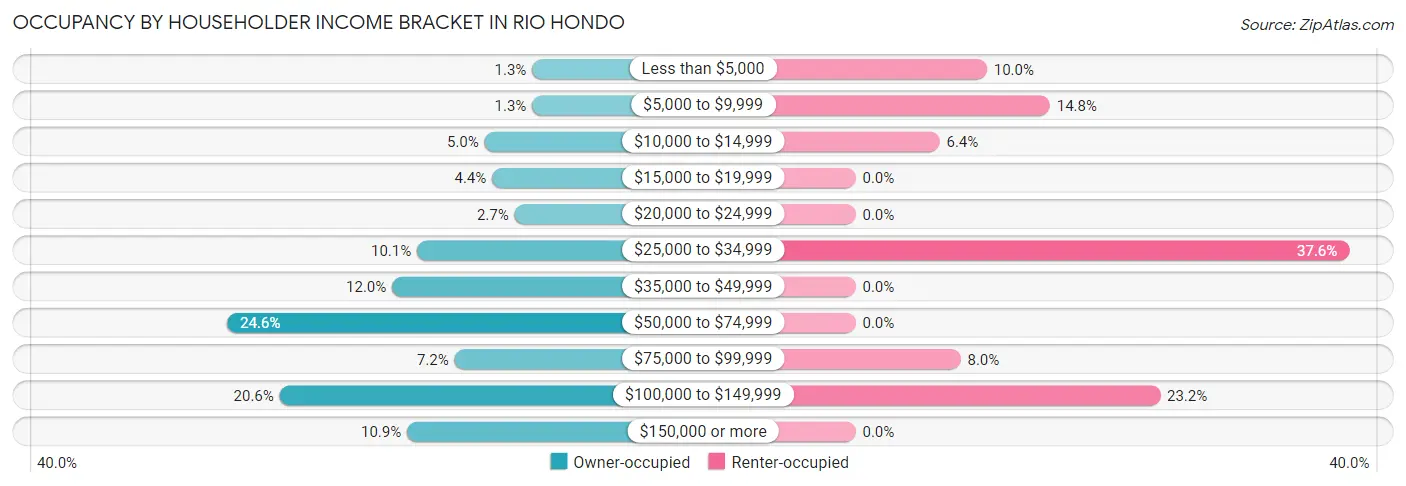
| Income Bracket | Owner-occupied | Renter-occupied |
| Less than $5,000 | 7 (1.3%) | 25 (10.0%) |
| $5,000 to $9,999 | 7 (1.3%) | 37 (14.8%) |
| $10,000 to $14,999 | 26 (5.0%) | 16 (6.4%) |
| $15,000 to $19,999 | 23 (4.4%) | 0 (0.0%) |
| $20,000 to $24,999 | 14 (2.7%) | 0 (0.0%) |
| $25,000 to $34,999 | 53 (10.1%) | 94 (37.6%) |
| $35,000 to $49,999 | 63 (12.0%) | 0 (0.0%) |
| $50,000 to $74,999 | 129 (24.6%) | 0 (0.0%) |
| $75,000 to $99,999 | 38 (7.2%) | 20 (8.0%) |
| $100,000 to $149,999 | 108 (20.6%) | 58 (23.2%) |
| $150,000 or more | 57 (10.9%) | 0 (0.0%) |
| Total | 525 (100.0%) | 250 (100.0%) |
Monthly Housing Cost Tiers in Rio Hondo
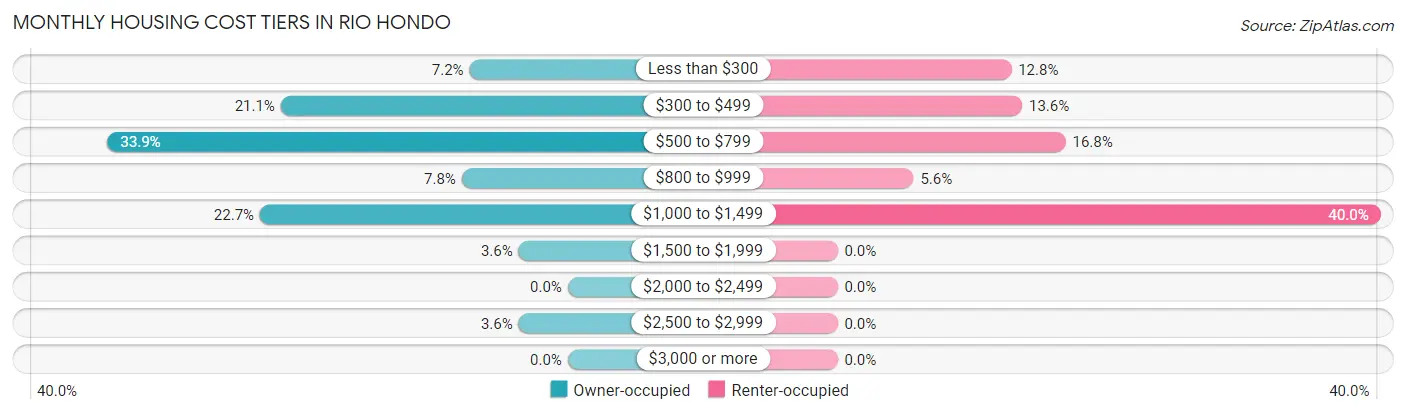
| Monthly Cost | Owner-occupied | Renter-occupied |
| Less than $300 | 38 (7.2%) | 32 (12.8%) |
| $300 to $499 | 111 (21.1%) | 34 (13.6%) |
| $500 to $799 | 178 (33.9%) | 42 (16.8%) |
| $800 to $999 | 41 (7.8%) | 14 (5.6%) |
| $1,000 to $1,499 | 119 (22.7%) | 100 (40.0%) |
| $1,500 to $1,999 | 19 (3.6%) | 0 (0.0%) |
| $2,000 to $2,499 | 0 (0.0%) | 0 (0.0%) |
| $2,500 to $2,999 | 19 (3.6%) | 0 (0.0%) |
| $3,000 or more | 0 (0.0%) | 0 (0.0%) |
| Total | 525 (100.0%) | 250 (100.0%) |
Physical Housing Characteristics in Rio Hondo
Housing Structures in Rio Hondo
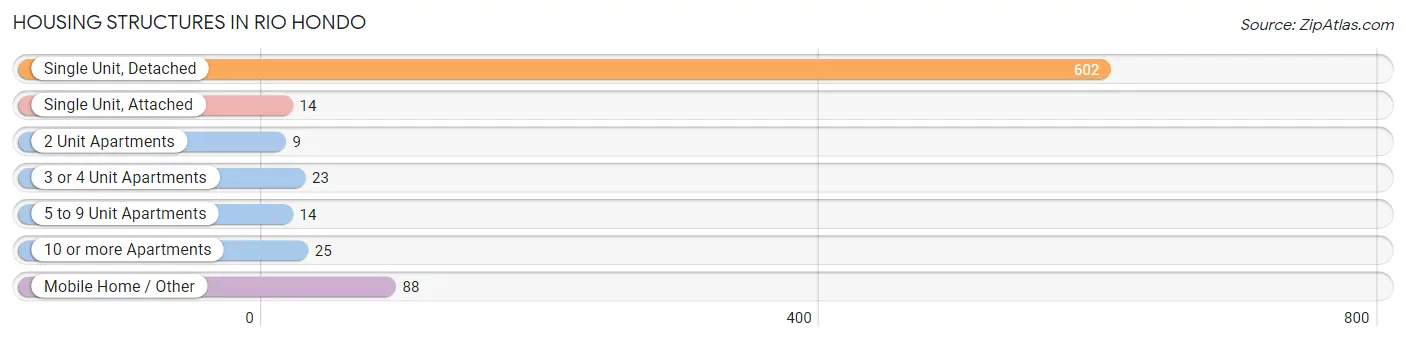
| Structure Type | # Housing Units | % Housing Units |
| Single Unit, Detached | 602 | 77.7% |
| Single Unit, Attached | 14 | 1.8% |
| 2 Unit Apartments | 9 | 1.2% |
| 3 or 4 Unit Apartments | 23 | 3.0% |
| 5 to 9 Unit Apartments | 14 | 1.8% |
| 10 or more Apartments | 25 | 3.2% |
| Mobile Home / Other | 88 | 11.4% |
| Total | 775 | 100.0% |
Housing Structures by Occupancy in Rio Hondo
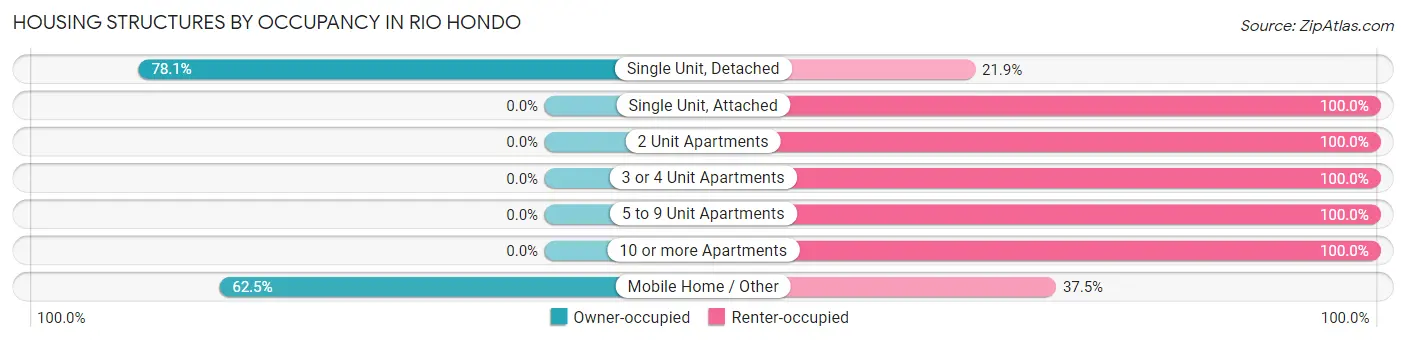
| Structure Type | Owner-occupied | Renter-occupied |
| Single Unit, Detached | 470 (78.1%) | 132 (21.9%) |
| Single Unit, Attached | 0 (0.0%) | 14 (100.0%) |
| 2 Unit Apartments | 0 (0.0%) | 9 (100.0%) |
| 3 or 4 Unit Apartments | 0 (0.0%) | 23 (100.0%) |
| 5 to 9 Unit Apartments | 0 (0.0%) | 14 (100.0%) |
| 10 or more Apartments | 0 (0.0%) | 25 (100.0%) |
| Mobile Home / Other | 55 (62.5%) | 33 (37.5%) |
| Total | 525 (67.7%) | 250 (32.3%) |
Housing Structures by Number of Rooms in Rio Hondo
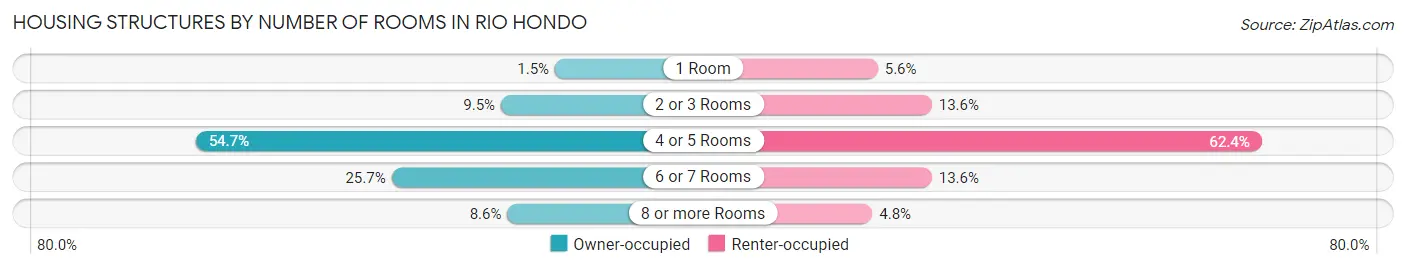
| Number of Rooms | Owner-occupied | Renter-occupied |
| 1 Room | 8 (1.5%) | 14 (5.6%) |
| 2 or 3 Rooms | 50 (9.5%) | 34 (13.6%) |
| 4 or 5 Rooms | 287 (54.7%) | 156 (62.4%) |
| 6 or 7 Rooms | 135 (25.7%) | 34 (13.6%) |
| 8 or more Rooms | 45 (8.6%) | 12 (4.8%) |
| Total | 525 (100.0%) | 250 (100.0%) |
Housing Structure by Heating Type in Rio Hondo
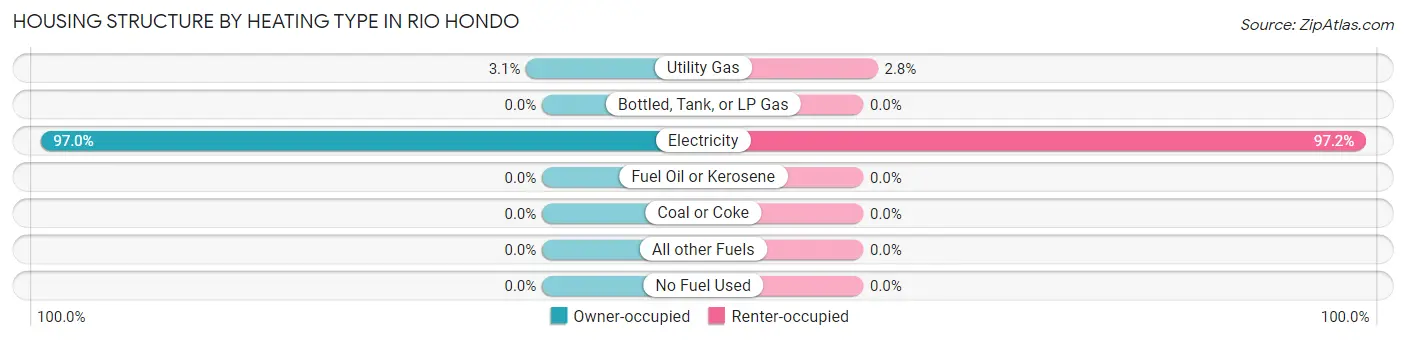
| Heating Type | Owner-occupied | Renter-occupied |
| Utility Gas | 16 (3.0%) | 7 (2.8%) |
| Bottled, Tank, or LP Gas | 0 (0.0%) | 0 (0.0%) |
| Electricity | 509 (97.0%) | 243 (97.2%) |
| Fuel Oil or Kerosene | 0 (0.0%) | 0 (0.0%) |
| Coal or Coke | 0 (0.0%) | 0 (0.0%) |
| All other Fuels | 0 (0.0%) | 0 (0.0%) |
| No Fuel Used | 0 (0.0%) | 0 (0.0%) |
| Total | 525 (100.0%) | 250 (100.0%) |
Household Vehicle Usage in Rio Hondo
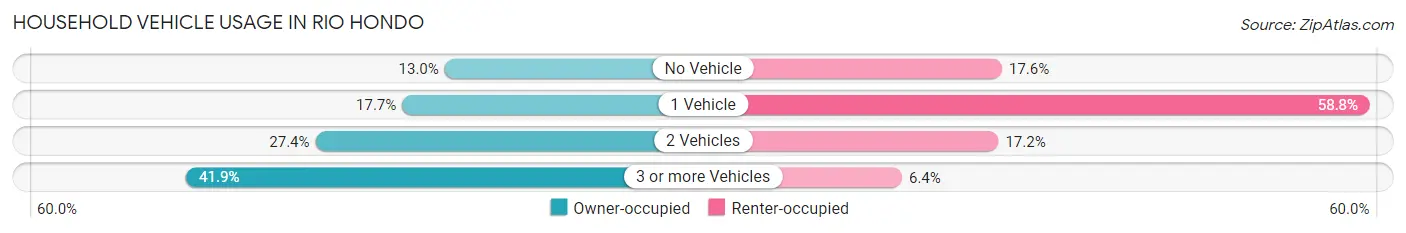
| Vehicles per Household | Owner-occupied | Renter-occupied |
| No Vehicle | 68 (13.0%) | 44 (17.6%) |
| 1 Vehicle | 93 (17.7%) | 147 (58.8%) |
| 2 Vehicles | 144 (27.4%) | 43 (17.2%) |
| 3 or more Vehicles | 220 (41.9%) | 16 (6.4%) |
| Total | 525 (100.0%) | 250 (100.0%) |
Real Estate & Mortgages in Rio Hondo
Real Estate and Mortgage Overview in Rio Hondo
| Characteristic | Without Mortgage | With Mortgage |
| Housing Units | 309 | 216 |
| Median Property Value | $77,300 | $104,200 |
| Median Household Income | $53,472 | $49 |
| Monthly Housing Costs | $504 | $0 |
| Real Estate Taxes | $1,336 | $0 |
Property Value by Mortgage Status in Rio Hondo
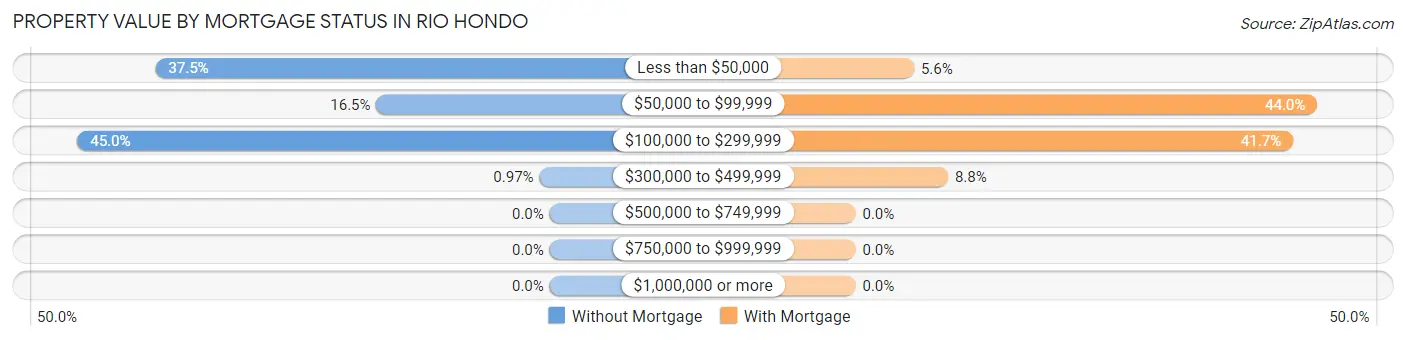
| Property Value | Without Mortgage | With Mortgage |
| Less than $50,000 | 116 (37.5%) | 12 (5.6%) |
| $50,000 to $99,999 | 51 (16.5%) | 95 (44.0%) |
| $100,000 to $299,999 | 139 (45.0%) | 90 (41.7%) |
| $300,000 to $499,999 | 3 (1.0%) | 19 (8.8%) |
| $500,000 to $749,999 | 0 (0.0%) | 0 (0.0%) |
| $750,000 to $999,999 | 0 (0.0%) | 0 (0.0%) |
| $1,000,000 or more | 0 (0.0%) | 0 (0.0%) |
| Total | 309 (100.0%) | 216 (100.0%) |
Household Income by Mortgage Status in Rio Hondo
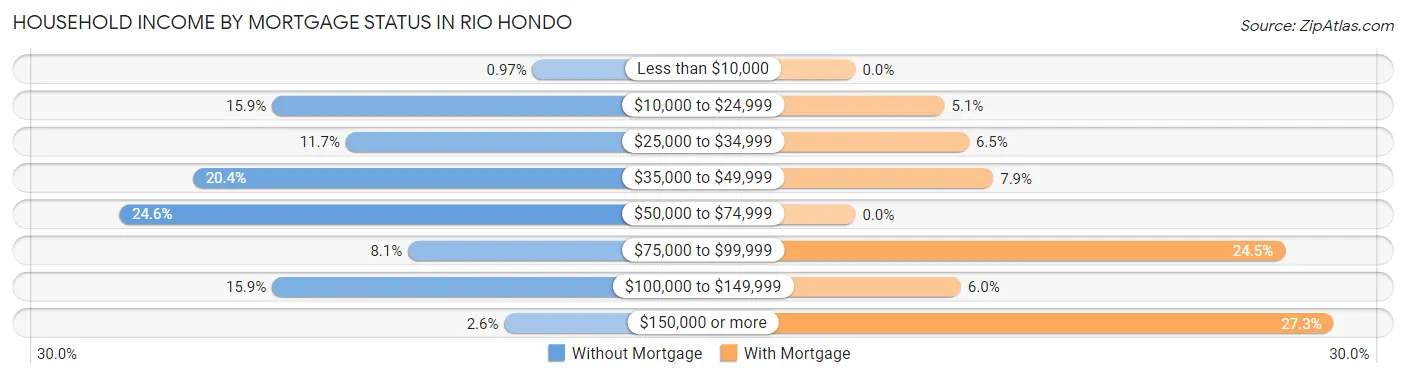
| Household Income | Without Mortgage | With Mortgage |
| Less than $10,000 | 3 (1.0%) | 0 (0.0%) |
| $10,000 to $24,999 | 49 (15.9%) | 11 (5.1%) |
| $25,000 to $34,999 | 36 (11.7%) | 14 (6.5%) |
| $35,000 to $49,999 | 63 (20.4%) | 17 (7.9%) |
| $50,000 to $74,999 | 76 (24.6%) | 0 (0.0%) |
| $75,000 to $99,999 | 25 (8.1%) | 53 (24.5%) |
| $100,000 to $149,999 | 49 (15.9%) | 13 (6.0%) |
| $150,000 or more | 8 (2.6%) | 59 (27.3%) |
| Total | 309 (100.0%) | 216 (100.0%) |
Property Value to Household Income Ratio in Rio Hondo
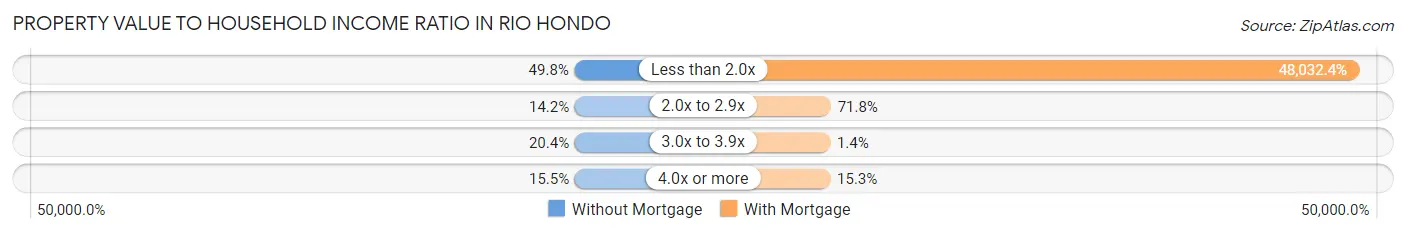
| Value-to-Income Ratio | Without Mortgage | With Mortgage |
| Less than 2.0x | 154 (49.8%) | 103,750 (48,032.4%) |
| 2.0x to 2.9x | 44 (14.2%) | 155 (71.8%) |
| 3.0x to 3.9x | 63 (20.4%) | 3 (1.4%) |
| 4.0x or more | 48 (15.5%) | 33 (15.3%) |
| Total | 309 (100.0%) | 216 (100.0%) |
Real Estate Taxes by Mortgage Status in Rio Hondo
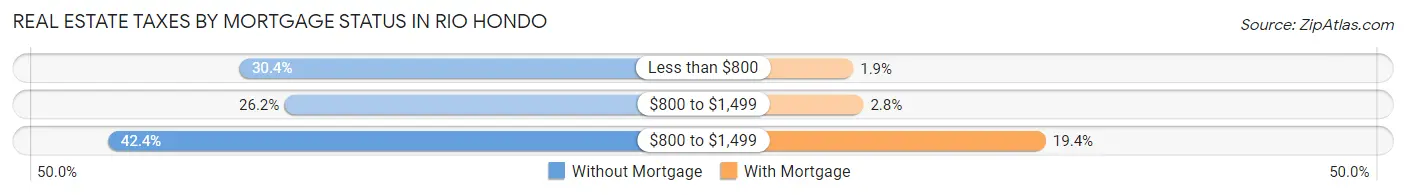
| Property Taxes | Without Mortgage | With Mortgage |
| Less than $800 | 94 (30.4%) | 4 (1.8%) |
| $800 to $1,499 | 81 (26.2%) | 6 (2.8%) |
| $800 to $1,499 | 131 (42.4%) | 42 (19.4%) |
| Total | 309 (100.0%) | 216 (100.0%) |
Health & Disability in Rio Hondo
Health Insurance Coverage by Age in Rio Hondo
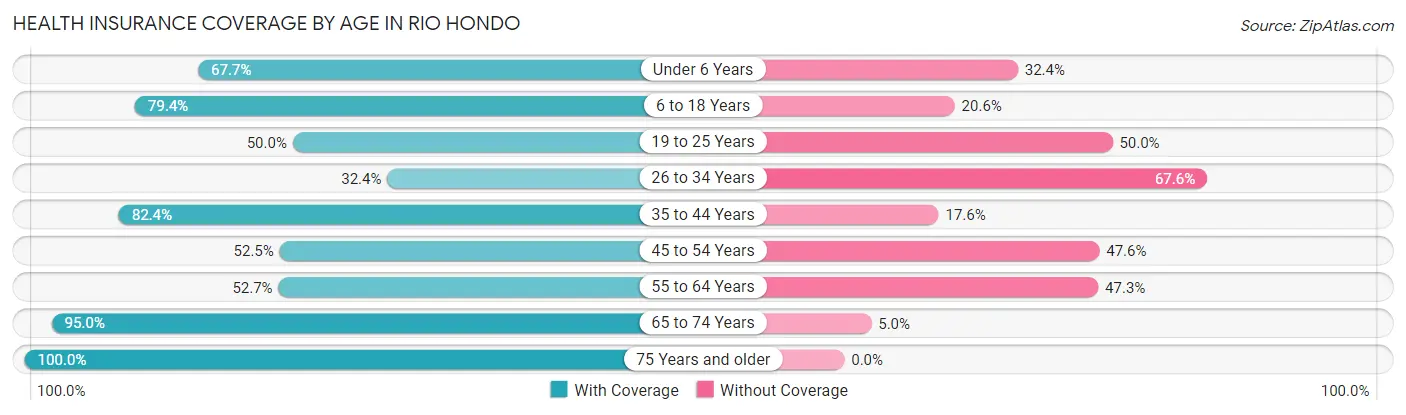
| Age Bracket | With Coverage | Without Coverage |
| Under 6 Years | 115 (67.6%) | 55 (32.4%) |
| 6 to 18 Years | 440 (79.4%) | 114 (20.6%) |
| 19 to 25 Years | 81 (50.0%) | 81 (50.0%) |
| 26 to 34 Years | 67 (32.4%) | 140 (67.6%) |
| 35 to 44 Years | 361 (82.4%) | 77 (17.6%) |
| 45 to 54 Years | 107 (52.4%) | 97 (47.5%) |
| 55 to 64 Years | 99 (52.7%) | 89 (47.3%) |
| 65 to 74 Years | 170 (95.0%) | 9 (5.0%) |
| 75 Years and older | 193 (100.0%) | 0 (0.0%) |
| Total | 1,633 (71.2%) | 662 (28.8%) |
Health Insurance Coverage by Citizenship Status in Rio Hondo
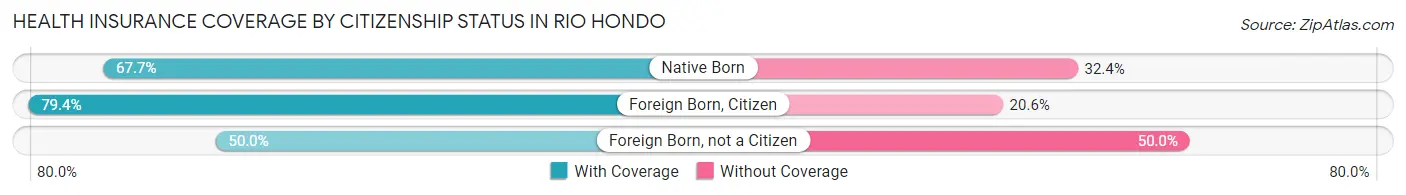
| Citizenship Status | With Coverage | Without Coverage |
| Native Born | 115 (67.6%) | 55 (32.4%) |
| Foreign Born, Citizen | 440 (79.4%) | 114 (20.6%) |
| Foreign Born, not a Citizen | 81 (50.0%) | 81 (50.0%) |
Health Insurance Coverage by Household Income in Rio Hondo
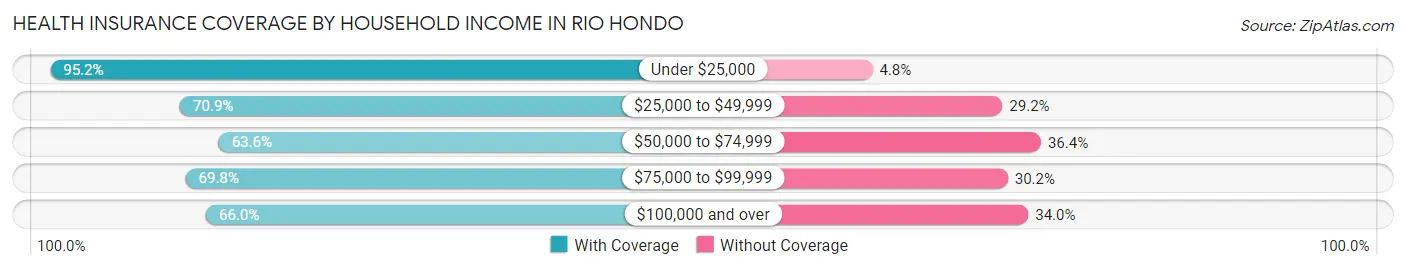
| Household Income | With Coverage | Without Coverage |
| Under $25,000 | 316 (95.2%) | 16 (4.8%) |
| $25,000 to $49,999 | 333 (70.9%) | 137 (29.1%) |
| $50,000 to $74,999 | 285 (63.6%) | 163 (36.4%) |
| $75,000 to $99,999 | 169 (69.8%) | 73 (30.2%) |
| $100,000 and over | 530 (66.0%) | 273 (34.0%) |
Public vs Private Health Insurance Coverage by Age in Rio Hondo

| Age Bracket | Public Insurance | Private Insurance |
| Under 6 | 79 (46.5%) | 36 (21.2%) |
| 6 to 18 Years | 294 (53.1%) | 146 (26.4%) |
| 19 to 25 Years | 28 (17.3%) | 53 (32.7%) |
| 25 to 34 Years | 47 (22.7%) | 37 (17.9%) |
| 35 to 44 Years | 43 (9.8%) | 318 (72.6%) |
| 45 to 54 Years | 29 (14.2%) | 78 (38.2%) |
| 55 to 64 Years | 21 (11.2%) | 81 (43.1%) |
| 65 to 74 Years | 146 (81.6%) | 36 (20.1%) |
| 75 Years and over | 193 (100.0%) | 15 (7.8%) |
| Total | 880 (38.3%) | 800 (34.9%) |
Disability Status by Sex by Age in Rio Hondo
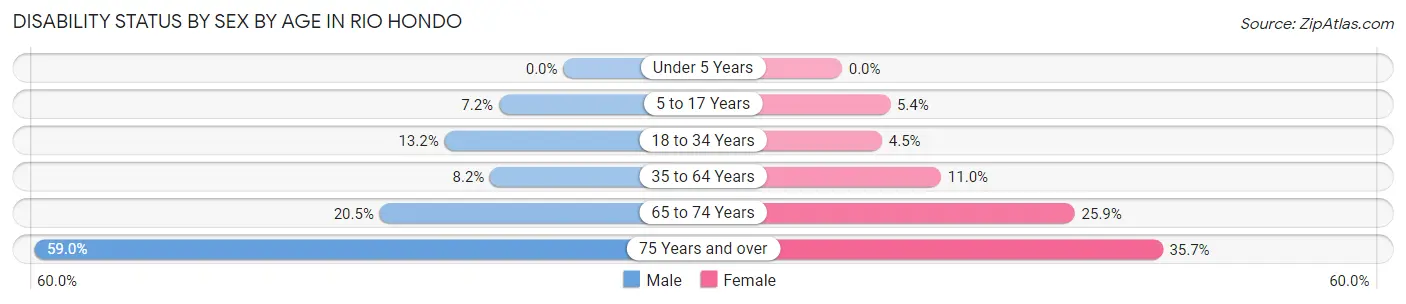
| Age Bracket | Male | Female |
| Under 5 Years | 0 (0.0%) | 0 (0.0%) |
| 5 to 17 Years | 17 (7.2%) | 15 (5.4%) |
| 18 to 34 Years | 27 (13.2%) | 9 (4.5%) |
| 35 to 64 Years | 30 (8.2%) | 51 (11.0%) |
| 65 to 74 Years | 9 (20.4%) | 35 (25.9%) |
| 75 Years and over | 56 (59.0%) | 35 (35.7%) |
Disability Class by Sex by Age in Rio Hondo
Disability Class: Hearing Difficulty
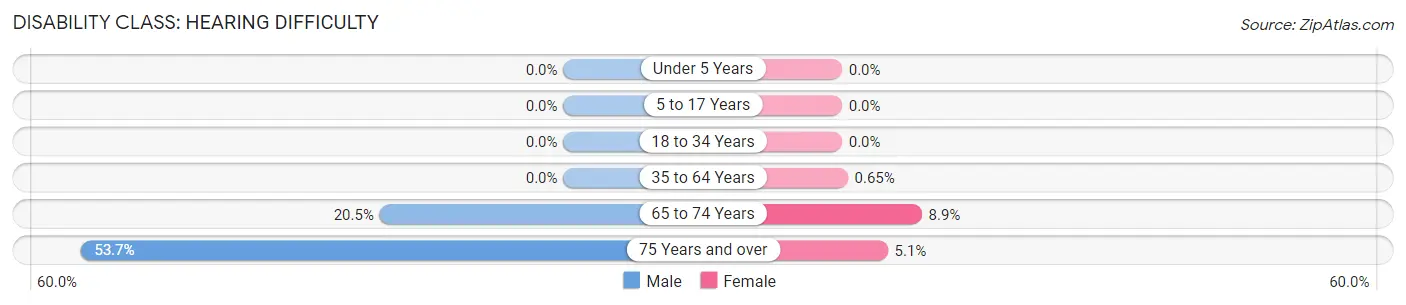
| Age Bracket | Male | Female |
| Under 5 Years | 0 (0.0%) | 0 (0.0%) |
| 5 to 17 Years | 0 (0.0%) | 0 (0.0%) |
| 18 to 34 Years | 0 (0.0%) | 0 (0.0%) |
| 35 to 64 Years | 0 (0.0%) | 3 (0.6%) |
| 65 to 74 Years | 9 (20.4%) | 12 (8.9%) |
| 75 Years and over | 51 (53.7%) | 5 (5.1%) |
Disability Class: Vision Difficulty
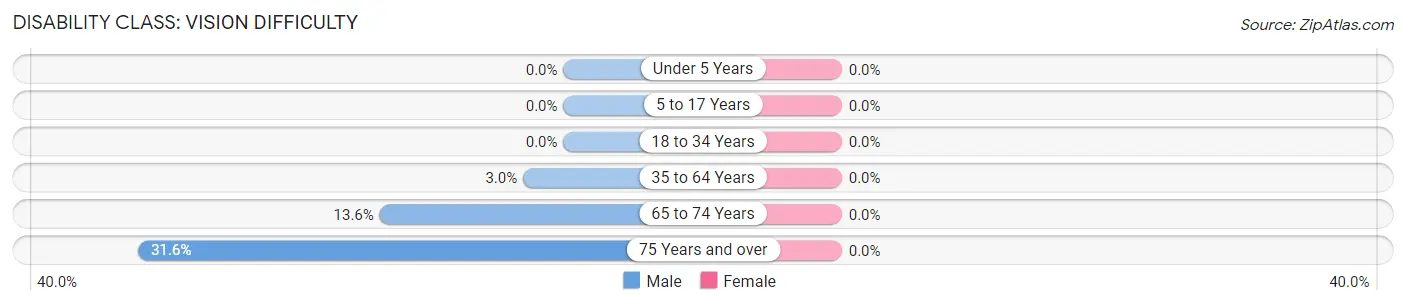
| Age Bracket | Male | Female |
| Under 5 Years | 0 (0.0%) | 0 (0.0%) |
| 5 to 17 Years | 0 (0.0%) | 0 (0.0%) |
| 18 to 34 Years | 0 (0.0%) | 0 (0.0%) |
| 35 to 64 Years | 11 (3.0%) | 0 (0.0%) |
| 65 to 74 Years | 6 (13.6%) | 0 (0.0%) |
| 75 Years and over | 30 (31.6%) | 0 (0.0%) |
Disability Class: Cognitive Difficulty
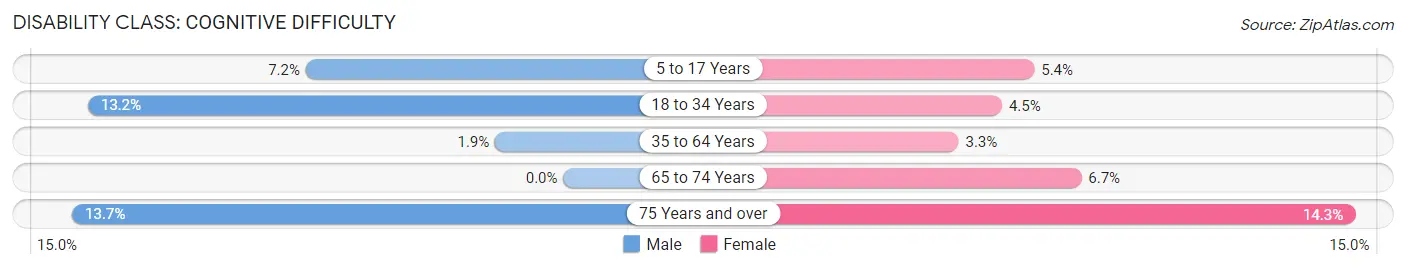
| Age Bracket | Male | Female |
| 5 to 17 Years | 17 (7.2%) | 15 (5.4%) |
| 18 to 34 Years | 27 (13.2%) | 9 (4.5%) |
| 35 to 64 Years | 7 (1.9%) | 15 (3.3%) |
| 65 to 74 Years | 0 (0.0%) | 9 (6.7%) |
| 75 Years and over | 13 (13.7%) | 14 (14.3%) |
Disability Class: Ambulatory Difficulty
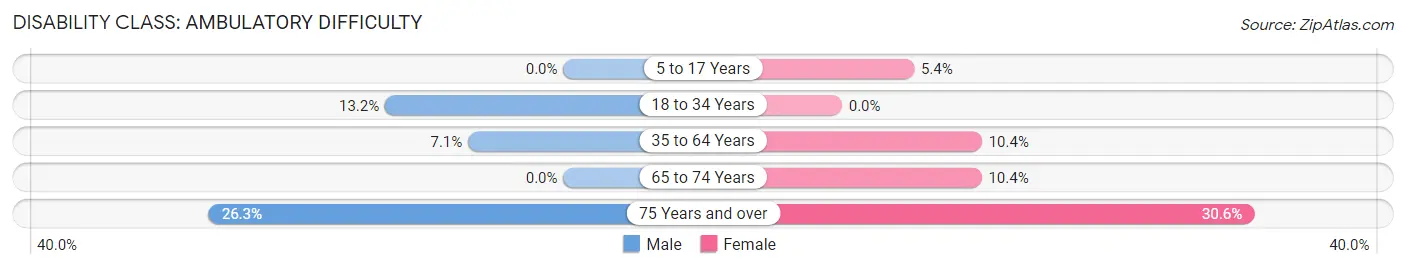
| Age Bracket | Male | Female |
| 5 to 17 Years | 0 (0.0%) | 15 (5.4%) |
| 18 to 34 Years | 27 (13.2%) | 0 (0.0%) |
| 35 to 64 Years | 26 (7.1%) | 48 (10.4%) |
| 65 to 74 Years | 0 (0.0%) | 14 (10.4%) |
| 75 Years and over | 25 (26.3%) | 30 (30.6%) |
Disability Class: Self-Care Difficulty
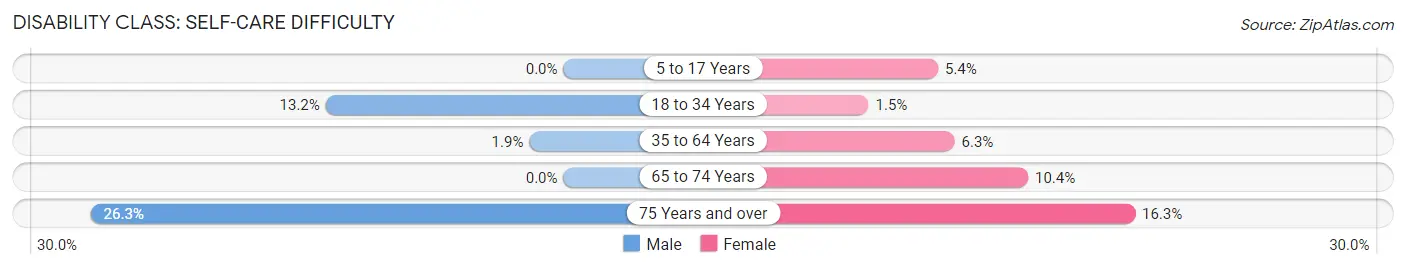
| Age Bracket | Male | Female |
| 5 to 17 Years | 0 (0.0%) | 15 (5.4%) |
| 18 to 34 Years | 27 (13.2%) | 3 (1.5%) |
| 35 to 64 Years | 7 (1.9%) | 29 (6.3%) |
| 65 to 74 Years | 0 (0.0%) | 14 (10.4%) |
| 75 Years and over | 25 (26.3%) | 16 (16.3%) |
Technology Access in Rio Hondo
Computing Device Access in Rio Hondo
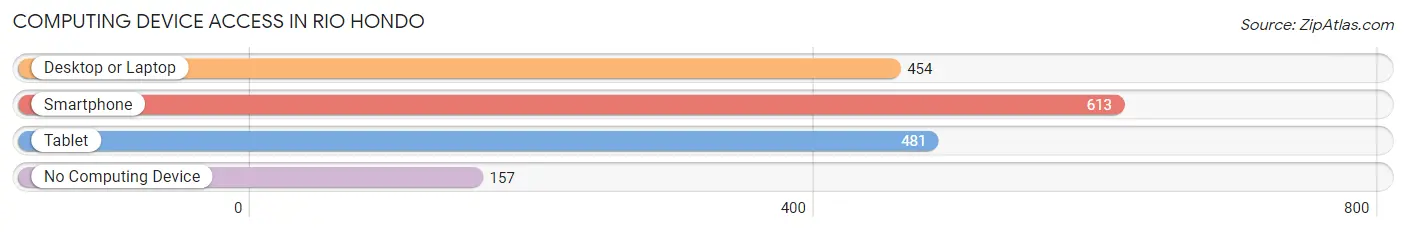
| Device Type | # Households | % Households |
| Desktop or Laptop | 454 | 58.6% |
| Smartphone | 613 | 79.1% |
| Tablet | 481 | 62.1% |
| No Computing Device | 157 | 20.3% |
| Total | 775 | 100.0% |
Internet Access in Rio Hondo
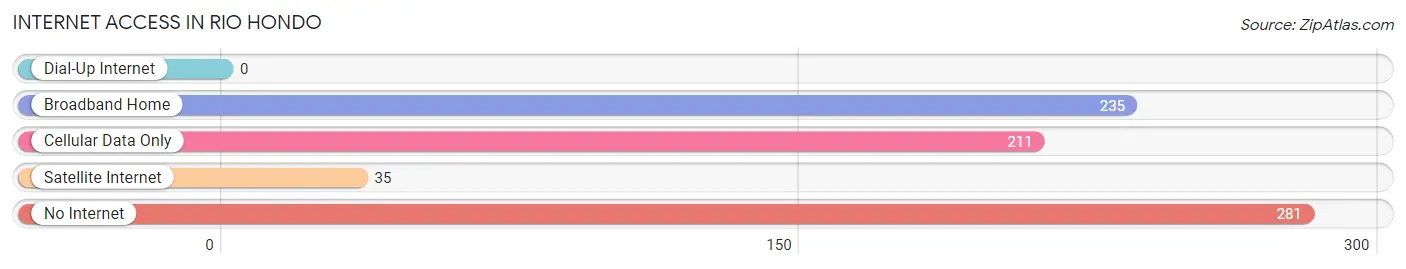
| Internet Type | # Households | % Households |
| Dial-Up Internet | 0 | 0.0% |
| Broadband Home | 235 | 30.3% |
| Cellular Data Only | 211 | 27.2% |
| Satellite Internet | 35 | 4.5% |
| No Internet | 281 | 36.3% |
| Total | 775 | 100.0% |
Rio Hondo Summary
Rio Hondo is a small city located in Cameron County, Texas, United States. It is situated on the banks of the Rio Grande, approximately 20 miles (32 km) north of Brownsville and the Mexican border. The city has a population of approximately 5,000 people and is part of the Brownsville–Harlingen–Raymondville metropolitan area.
History
Rio Hondo was founded in 1848 by a group of Mexican settlers who were looking for a place to settle and farm. The city was originally named “Rio Hondo de los Esteros”, which translates to “Deep River of the Marshes”. The settlers were attracted to the area due to its fertile soil and abundant water supply.
In 1852, the city was officially incorporated and the name was changed to “Rio Hondo”. The city quickly grew and by the late 1800s, it had become a major trading center for the region. The city was also home to several large ranches and farms, which provided the area with much of its economic activity.
In the early 1900s, the city began to experience a decline in population as many of the settlers moved away in search of better opportunities. This trend continued until the 1950s when the city began to experience a resurgence in population growth. This was due in part to the construction of the nearby Falcon Dam, which provided the city with a reliable source of water and electricity.
Geography
Rio Hondo is located in Cameron County, Texas, approximately 20 miles (32 km) north of Brownsville and the Mexican border. The city is situated on the banks of the Rio Grande and is surrounded by a number of small towns and villages. The city has a total area of 1.3 square miles (3.4 km2), all of which is land.
The climate in Rio Hondo is classified as humid subtropical, with hot summers and mild winters. The average annual temperature is 73°F (23°C), with an average high of 92°F (33°C) in July and an average low of 54°F (12°C) in January. The average annual precipitation is 24.5 inches (62 cm).
Economy
Rio Hondo’s economy is largely based on agriculture and tourism. The city is home to several large ranches and farms, which produce a variety of crops, including cotton, corn, sorghum, and wheat. The city is also home to several tourist attractions, including the Falcon Dam, the Rio Hondo Nature Center, and the Rio Hondo Golf Course.
In addition to agriculture and tourism, Rio Hondo is home to a number of small businesses, including restaurants, retail stores, and service providers. The city is also home to a number of manufacturing companies, including a plastics factory and a metal fabrication plant.
Demographics
As of the 2010 census, the population of Rio Hondo was 5,039. The racial makeup of the city was 79.3% White, 0.7% African American, 0.3% Native American, 0.2% Asian, 0.1% Pacific Islander, 17.7% from other races, and 1.9% from two or more races. Hispanic or Latino of any race were 97.2% of the population.
The median household income in Rio Hondo was $25,938, and the median family income was $30,938. The per capita income for the city was $11,938. About 24.3% of families and 28.2% of the population were below the poverty line, including 37.3% of those under age 18 and 16.2% of those age 65 or over.
Common Questions
What is the Total Population of Rio Hondo?
Total Population of Rio Hondo is 2,295.
What is the Total Male Population of Rio Hondo?
Total Male Population of Rio Hondo is 998.
What is the Total Female Population of Rio Hondo?
Total Female Population of Rio Hondo is 1,297.
What is the Ratio of Males per 100 Females in Rio Hondo?
There are 76.95 Males per 100 Females in Rio Hondo.
What is the Ratio of Females per 100 Males in Rio Hondo?
There are 129.96 Females per 100 Males in Rio Hondo.
What is the Median Population Age in Rio Hondo?
Median Population Age in Rio Hondo is 36.2 Years.
What is the Average Family Size in Rio Hondo
Average Family Size in Rio Hondo is 3.6 People.
What is the Average Household Size in Rio Hondo
Average Household Size in Rio Hondo is 3.0 People.
What is Per Capita Income in Rio Hondo?
Per Capita income in Rio Hondo is $24,188.
What is the Median Family Income in Rio Hondo?
Median Family Income in Rio Hondo is $68,125.
What is the Median Household income in Rio Hondo?
Median Household Income in Rio Hondo is $58,487.
What is Income or Wage Gap in Rio Hondo?
Income or Wage Gap in Rio Hondo is 8.4%.
Women in Rio Hondo earn 91.6 cents for every dollar earned by a man.
What is Inequality or Gini Index in Rio Hondo?
Inequality or Gini Index in Rio Hondo is 0.43.
How Large is the Labor Force in Rio Hondo?
There are 944 People in the Labor Forcein in Rio Hondo.
What is the Percentage of People in the Labor Force in Rio Hondo?
55.1% of People are in the Labor Force in Rio Hondo.