Cities with the Highest Percentage of Population Driving Alone to Work in Texas
RELATED REPORTS & OPTIONS
Drive | Alone
Texas
Compare Cities
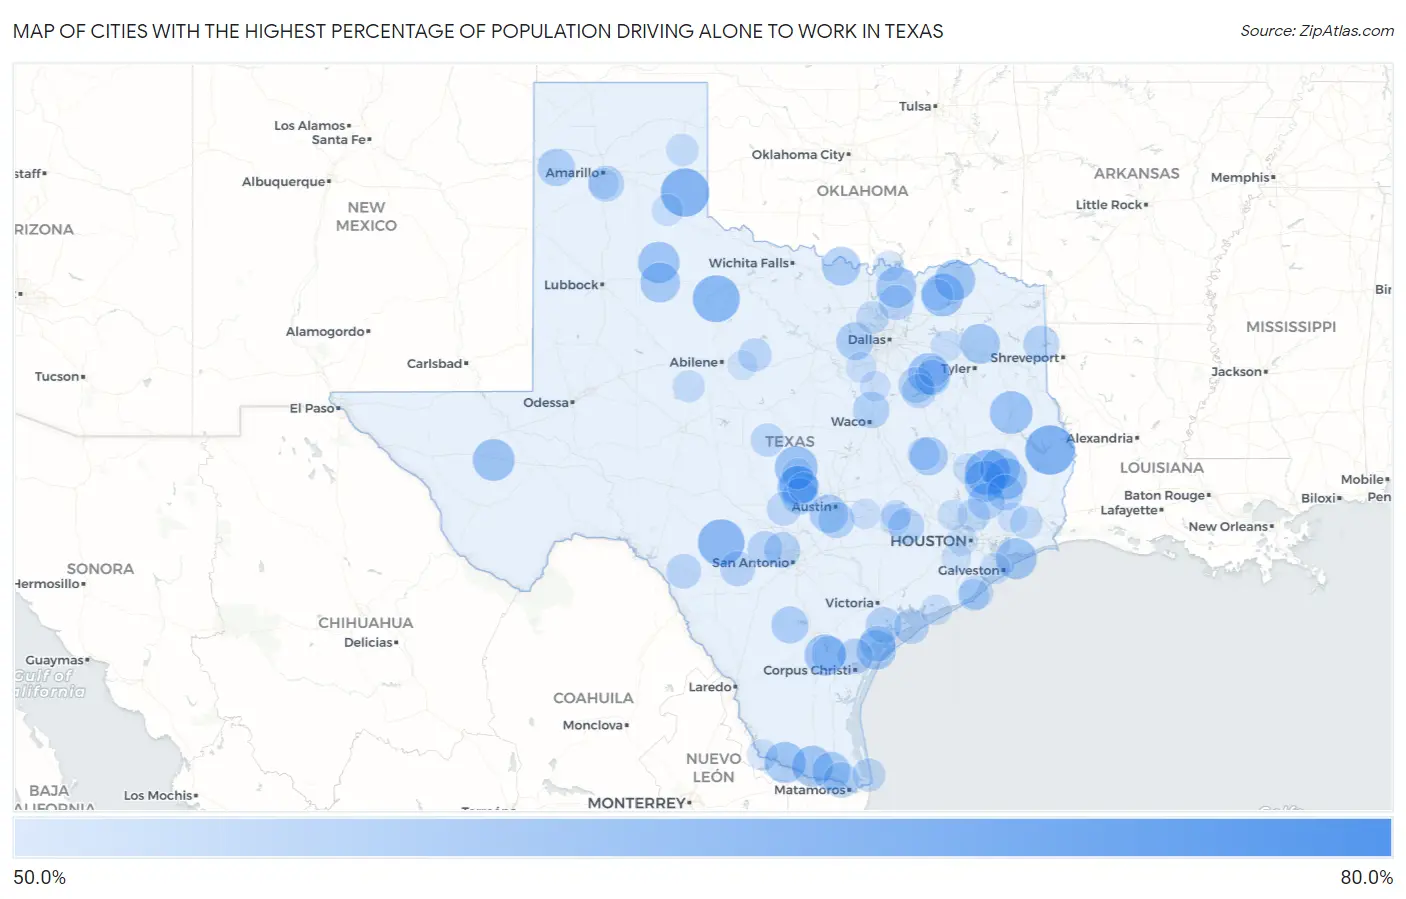
Map of Cities with the Highest Percentage of Population Driving Alone to Work in Texas
0.0%
80.0%
Cities with the Highest Percentage of Population Driving Alone to Work in Texas
| City | % Drive Alone | vs State | vs National | |
| 1. | Sheffield | 77.3% | 40.8%(+36.5)#1 | 42.1%(+35.2)#4 |
| 2. | Browndell | 67.1% | 40.8%(+26.3)#2 | 42.1%(+25.0)#91 |
| 3. | Rowena | 66.6% | 40.8%(+25.8)#3 | 42.1%(+24.5)#98 |
| 4. | Quail | 66.3% | 40.8%(+25.5)#4 | 42.1%(+24.2)#109 |
| 5. | O Brien | 65.3% | 40.8%(+24.5)#5 | 42.1%(+23.2)#142 |
| 6. | Leakey | 65.0% | 40.8%(+24.2)#6 | 42.1%(+22.9)#156 |
| 7. | Kopperl | 64.9% | 40.8%(+24.1)#7 | 42.1%(+22.8)#159 |
| 8. | Shiro | 64.6% | 40.8%(+23.8)#8 | 42.1%(+22.5)#171 |
| 9. | Tow | 64.4% | 40.8%(+23.6)#9 | 42.1%(+22.3)#187 |
| 10. | Cedar Point | 64.0% | 40.8%(+23.2)#10 | 42.1%(+21.9)#215 |
| 11. | Sargent | 63.7% | 40.8%(+22.9)#11 | 42.1%(+21.6)#228 |
| 12. | Buchanan Lake Village | 62.3% | 40.8%(+21.5)#12 | 42.1%(+20.2)#333 |
| 13. | Redfield | 62.3% | 40.8%(+21.5)#13 | 42.1%(+20.2)#336 |
| 14. | Pecan Gap | 62.3% | 40.8%(+21.5)#14 | 42.1%(+20.2)#338 |
| 15. | Balmorhea | 61.6% | 40.8%(+20.8)#15 | 42.1%(+19.5)#399 |
| 16. | Roaring Springs | 61.4% | 40.8%(+20.6)#16 | 42.1%(+19.3)#429 |
| 17. | Indian Springs | 61.3% | 40.8%(+20.5)#17 | 42.1%(+19.2)#434 |
| 18. | Enchanted Oaks | 61.3% | 40.8%(+20.5)#18 | 42.1%(+19.2)#438 |
| 19. | K Bar Ranch | 61.2% | 40.8%(+20.4)#19 | 42.1%(+19.1)#452 |
| 20. | Cape Royale | 61.2% | 40.8%(+20.4)#20 | 42.1%(+19.1)#456 |
| 21. | Villarreal | 61.2% | 40.8%(+20.4)#21 | 42.1%(+19.1)#467 |
| 22. | Bolivar Peninsula | 61.1% | 40.8%(+20.3)#22 | 42.1%(+19.0)#469 |
| 23. | Lopezville | 61.1% | 40.8%(+20.3)#23 | 42.1%(+19.0)#470 |
| 24. | Toco | 60.8% | 40.8%(+20.0)#24 | 42.1%(+18.7)#514 |
| 25. | Sunrise Beach Village | 60.6% | 40.8%(+19.8)#25 | 42.1%(+18.5)#525 |
| 26. | Seven Oaks | 60.5% | 40.8%(+19.7)#26 | 42.1%(+18.4)#547 |
| 27. | Dorchester | 60.5% | 40.8%(+19.7)#27 | 42.1%(+18.4)#561 |
| 28. | Dickens | 60.3% | 40.8%(+19.5)#28 | 42.1%(+18.2)#589 |
| 29. | Holly Lake Ranch | 60.1% | 40.8%(+19.3)#29 | 42.1%(+18.0)#618 |
| 30. | Fulton | 60.0% | 40.8%(+19.2)#30 | 42.1%(+17.9)#634 |
| 31. | Stockton Bend | 59.9% | 40.8%(+19.1)#31 | 42.1%(+17.8)#651 |
| 32. | Alanreed | 59.6% | 40.8%(+18.8)#32 | 42.1%(+17.5)#693 |
| 33. | Highland Haven | 59.4% | 40.8%(+18.6)#33 | 42.1%(+17.3)#722 |
| 34. | Nocona Hills | 59.3% | 40.8%(+18.5)#34 | 42.1%(+17.2)#745 |
| 35. | Normangee | 59.2% | 40.8%(+18.4)#35 | 42.1%(+17.1)#778 |
| 36. | La Feria North | 59.2% | 40.8%(+18.4)#36 | 42.1%(+17.1)#787 |
| 37. | Shady Hollow | 59.1% | 40.8%(+18.3)#37 | 42.1%(+17.0)#796 |
| 38. | Westover Hills | 58.7% | 40.8%(+17.9)#38 | 42.1%(+16.6)#867 |
| 39. | Adrian | 58.5% | 40.8%(+17.7)#39 | 42.1%(+16.4)#908 |
| 40. | Tilden | 58.4% | 40.8%(+17.6)#40 | 42.1%(+16.3)#942 |
| 41. | North Cleveland | 57.9% | 40.8%(+17.1)#41 | 42.1%(+15.8)#1,058 |
| 42. | Ross | 57.9% | 40.8%(+17.1)#42 | 42.1%(+15.8)#1,060 |
| 43. | Creedmoor | 57.7% | 40.8%(+16.9)#43 | 42.1%(+15.6)#1,090 |
| 44. | Round Mountain | 57.7% | 40.8%(+16.9)#44 | 42.1%(+15.6)#1,104 |
| 45. | Uncertain | 57.6% | 40.8%(+16.8)#45 | 42.1%(+15.5)#1,124 |
| 46. | Tivoli | 57.5% | 40.8%(+16.7)#46 | 42.1%(+15.4)#1,138 |
| 47. | Lake Tanglewood | 57.4% | 40.8%(+16.6)#47 | 42.1%(+15.3)#1,178 |
| 48. | Big Thicket Lake Estates | 57.4% | 40.8%(+16.6)#48 | 42.1%(+15.3)#1,179 |
| 49. | Powell | 57.4% | 40.8%(+16.6)#49 | 42.1%(+15.3)#1,193 |
| 50. | Grey Forest | 57.3% | 40.8%(+16.5)#50 | 42.1%(+15.2)#1,208 |
| 51. | Holiday Beach | 57.3% | 40.8%(+16.5)#51 | 42.1%(+15.2)#1,216 |
| 52. | Industry | 57.3% | 40.8%(+16.5)#52 | 42.1%(+15.2)#1,217 |
| 53. | Alamo Beach | 57.3% | 40.8%(+16.5)#53 | 42.1%(+15.2)#1,222 |
| 54. | Encantada Ranchito El Calaboz | 57.2% | 40.8%(+16.4)#54 | 42.1%(+15.1)#1,234 |
| 55. | Taft Southwest | 57.1% | 40.8%(+16.3)#55 | 42.1%(+15.0)#1,258 |
| 56. | Sandia | 57.1% | 40.8%(+16.3)#56 | 42.1%(+15.0)#1,272 |
| 57. | Caney City | 57.1% | 40.8%(+16.3)#57 | 42.1%(+15.0)#1,284 |
| 58. | Port O Connor | 57.0% | 40.8%(+16.2)#58 | 42.1%(+14.9)#1,299 |
| 59. | Lake Medina Shores | 56.9% | 40.8%(+16.1)#59 | 42.1%(+14.8)#1,315 |
| 60. | Sabinal | 56.8% | 40.8%(+16.0)#60 | 42.1%(+14.7)#1,331 |
| 61. | Weston | 56.8% | 40.8%(+16.0)#61 | 42.1%(+14.7)#1,341 |
| 62. | Fort Clark Springs | 56.7% | 40.8%(+15.9)#62 | 42.1%(+14.6)#1,357 |
| 63. | Surfside Beach | 56.2% | 40.8%(+15.4)#63 | 42.1%(+14.1)#1,545 |
| 64. | Eureka | 56.2% | 40.8%(+15.4)#64 | 42.1%(+14.1)#1,554 |
| 65. | Stonewall | 56.0% | 40.8%(+15.2)#65 | 42.1%(+13.9)#1,604 |
| 66. | Richland Springs | 55.7% | 40.8%(+14.9)#66 | 42.1%(+13.6)#1,684 |
| 67. | South Padre Island | 55.6% | 40.8%(+14.8)#67 | 42.1%(+13.5)#1,693 |
| 68. | Moran | 55.6% | 40.8%(+14.8)#68 | 42.1%(+13.5)#1,706 |
| 69. | Porter Heights | 55.4% | 40.8%(+14.6)#69 | 42.1%(+13.3)#1,773 |
| 70. | Hilltop Lakes | 55.3% | 40.8%(+14.5)#70 | 42.1%(+13.2)#1,797 |
| 71. | Copper Canyon | 55.2% | 40.8%(+14.4)#71 | 42.1%(+13.1)#1,837 |
| 72. | Nome | 55.2% | 40.8%(+14.4)#72 | 42.1%(+13.1)#1,855 |
| 73. | Grangerland | 55.0% | 40.8%(+14.2)#73 | 42.1%(+12.9)#1,920 |
| 74. | Mobeetie | 55.0% | 40.8%(+14.2)#74 | 42.1%(+12.9)#1,940 |
| 75. | Blackwell | 54.8% | 40.8%(+14.0)#75 | 42.1%(+12.7)#1,984 |
| 76. | Quintana | 54.7% | 40.8%(+13.9)#76 | 42.1%(+12.6)#2,035 |
| 77. | Ladonia | 54.5% | 40.8%(+13.7)#77 | 42.1%(+12.4)#2,090 |
| 78. | Sheridan | 54.5% | 40.8%(+13.7)#78 | 42.1%(+12.4)#2,110 |
| 79. | Lakeview | 54.5% | 40.8%(+13.7)#79 | 42.1%(+12.4)#2,129 |
| 80. | Round Top | 54.3% | 40.8%(+13.5)#80 | 42.1%(+12.2)#2,219 |
| 81. | Bayou Vista | 54.2% | 40.8%(+13.4)#81 | 42.1%(+12.1)#2,233 |
| 82. | Fronton Ranchettes | 54.2% | 40.8%(+13.4)#82 | 42.1%(+12.1)#2,258 |
| 83. | Buchanan Dam | 54.1% | 40.8%(+13.3)#83 | 42.1%(+12.0)#2,271 |
| 84. | Riverside | 54.1% | 40.8%(+13.3)#84 | 42.1%(+12.0)#2,278 |
| 85. | Fruitvale | 54.1% | 40.8%(+13.3)#85 | 42.1%(+12.0)#2,282 |
| 86. | Cade Lakes | 54.1% | 40.8%(+13.3)#86 | 42.1%(+12.0)#2,286 |
| 87. | Coyote Flats | 54.1% | 40.8%(+13.3)#87 | 42.1%(+12.0)#2,288 |
| 88. | Sherwood Shores | 54.0% | 40.8%(+13.2)#88 | 42.1%(+11.9)#2,321 |
| 89. | Timbercreek Canyon | 54.0% | 40.8%(+13.2)#89 | 42.1%(+11.9)#2,325 |
| 90. | Matagorda | 54.0% | 40.8%(+13.2)#90 | 42.1%(+11.9)#2,329 |
| 91. | Meadowlakes | 53.9% | 40.8%(+13.1)#91 | 42.1%(+11.8)#2,350 |
| 92. | Piney Point Village | 53.8% | 40.8%(+13.0)#92 | 42.1%(+11.7)#2,375 |
| 93. | Circle D Kc Estates | 53.8% | 40.8%(+13.0)#93 | 42.1%(+11.7)#2,376 |
| 94. | Eustace | 53.8% | 40.8%(+13.0)#94 | 42.1%(+11.7)#2,382 |
| 95. | Carl S Corner | 53.8% | 40.8%(+13.0)#95 | 42.1%(+11.7)#2,401 |
| 96. | Stagecoach | 53.7% | 40.8%(+12.9)#96 | 42.1%(+11.6)#2,436 |
| 97. | Carmine | 53.7% | 40.8%(+12.9)#97 | 42.1%(+11.6)#2,447 |
| 98. | Baird | 53.4% | 40.8%(+12.6)#98 | 42.1%(+11.3)#2,590 |
| 99. | Daisetta | 53.4% | 40.8%(+12.6)#99 | 42.1%(+11.3)#2,598 |
| 100. | Thompsons | 53.4% | 40.8%(+12.6)#100 | 42.1%(+11.3)#2,619 |
Common Questions
What are the Top 10 Cities with the Highest Percentage of Population Driving Alone to Work in Texas?
Top 10 Cities with the Highest Percentage of Population Driving Alone to Work in Texas are:
#1
67.1%
#2
66.3%
#3
65.3%
#4
65.0%
#5
64.0%
#6
62.3%
#7
62.3%
#8
62.3%
#9
61.6%
#10
61.4%
What city has the Highest Percentage of Population Driving Alone to Work in Texas?
Browndell has the Highest Percentage of Population Driving Alone to Work in Texas with 67.1%.
What is the Percentage of Population Driving Alone to Work in the State of Texas?
Percentage of Population Driving Alone to Work in Texas is 40.8%.
What is the Percentage of Population Driving Alone to Work in the United States?
Percentage of Population Driving Alone to Work in the United States is 42.1%.