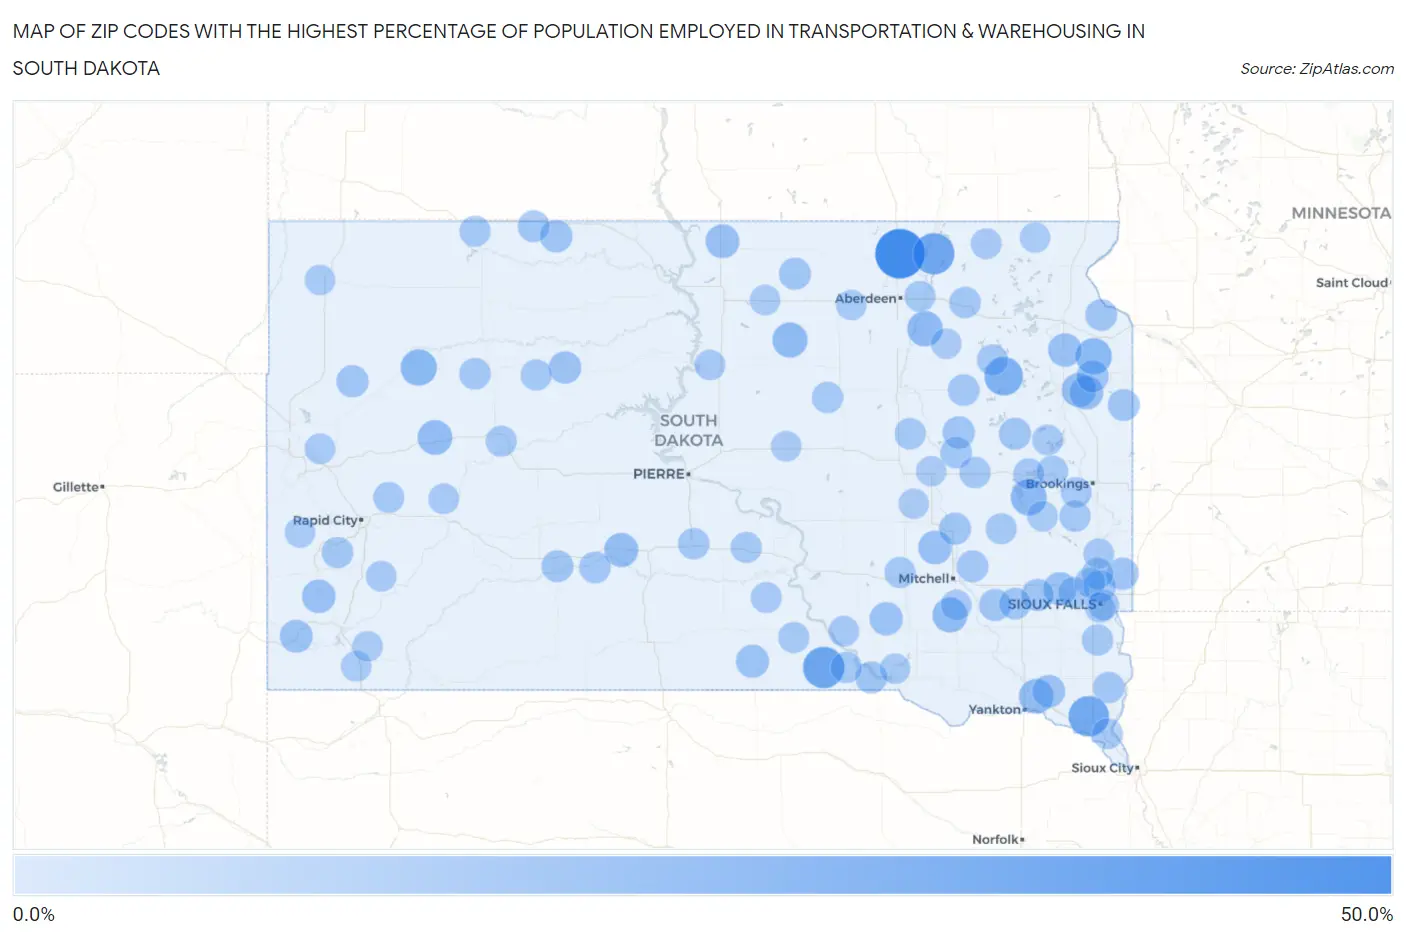
Zip Codes with the Highest Percentage of Population Employed in Transportation & Warehousing in South Dakota
RELATED REPORTS & OPTIONS
Transportation & Warehousing
South Dakota
Compare Zip Codes
Map of Zip Codes with the Highest Percentage of Population Employed in Transportation & Warehousing in South Dakota
0.0%
50.0%
Zip Codes with the Highest Percentage of Population Employed in Transportation & Warehousing in South Dakota
| Zip Code | % Employed | vs State | vs National | |
| 1. | 57426 | 50.0% | 3.5%(+46.5)#1 | 4.9%(+45.1)#79 |
| 2. | 57538 | 30.7% | 3.5%(+27.2)#2 | 4.9%(+25.7)#217 |
| 3. | 57449 | 30.4% | 3.5%(+26.9)#3 | 4.9%(+25.5)#220 |
| 4. | 57010 | 28.4% | 3.5%(+25.0)#4 | 4.9%(+23.5)#262 |
| 5. | 57236 | 23.7% | 3.5%(+20.2)#5 | 4.9%(+18.8)#373 |
| 6. | 57758 | 18.4% | 3.5%(+14.9)#6 | 4.9%(+13.4)#650 |
| 7. | 57264 | 18.3% | 3.5%(+14.8)#7 | 4.9%(+13.3)#655 |
| 8. | 57051 | 17.5% | 3.5%(+14.1)#8 | 4.9%(+12.6)#718 |
| 9. | 57474 | 16.4% | 3.5%(+12.9)#9 | 4.9%(+11.5)#859 |
| 10. | 57466 | 15.7% | 3.5%(+12.2)#10 | 4.9%(+10.8)#949 |
| 11. | 57331 | 15.3% | 3.5%(+11.9)#11 | 4.9%(+10.4)#1,002 |
| 12. | 57787 | 14.9% | 3.5%(+11.5)#12 | 4.9%(+9.99)#1,077 |
| 13. | 57046 | 14.7% | 3.5%(+11.2)#13 | 4.9%(+9.77)#1,120 |
| 14. | 57562 | 13.6% | 3.5%(+10.2)#14 | 4.9%(+8.69)#1,367 |
| 15. | 57245 | 13.4% | 3.5%(+9.96)#15 | 4.9%(+8.50)#1,407 |
| 16. | 57238 | 13.0% | 3.5%(+9.50)#16 | 4.9%(+8.04)#1,535 |
| 17. | 57632 | 12.6% | 3.5%(+9.16)#17 | 4.9%(+7.70)#1,637 |
| 18. | 57359 | 12.3% | 3.5%(+8.83)#18 | 4.9%(+7.37)#1,744 |
| 19. | 57773 | 12.1% | 3.5%(+8.61)#19 | 4.9%(+7.15)#1,812 |
| 20. | 57263 | 12.1% | 3.5%(+8.59)#20 | 4.9%(+7.12)#1,829 |
| 21. | 57035 | 11.6% | 3.5%(+8.12)#21 | 4.9%(+6.65)#2,023 |
| 22. | 57344 | 11.5% | 3.5%(+8.06)#22 | 4.9%(+6.59)#2,059 |
| 23. | 57528 | 11.2% | 3.5%(+7.69)#23 | 4.9%(+6.23)#2,245 |
| 24. | 57735 | 10.8% | 3.5%(+7.34)#24 | 4.9%(+5.87)#2,410 |
| 25. | 57072 | 10.4% | 3.5%(+6.88)#25 | 4.9%(+5.42)#2,663 |
| 26. | 57636 | 9.8% | 3.5%(+6.32)#26 | 4.9%(+4.86)#3,011 |
| 27. | 57660 | 9.6% | 3.5%(+6.13)#27 | 4.9%(+4.67)#3,153 |
| 28. | 57322 | 9.4% | 3.5%(+5.94)#28 | 4.9%(+4.47)#3,295 |
| 29. | 57012 | 9.4% | 3.5%(+5.90)#29 | 4.9%(+4.43)#3,332 |
| 30. | 57265 | 9.3% | 3.5%(+5.78)#30 | 4.9%(+4.31)#3,434 |
| 31. | 57030 | 9.1% | 3.5%(+5.65)#31 | 4.9%(+4.19)#3,554 |
| 32. | 57760 | 9.1% | 3.5%(+5.61)#32 | 4.9%(+4.14)#3,601 |
| 33. | 57055 | 9.0% | 3.5%(+5.57)#33 | 4.9%(+4.10)#3,651 |
| 34. | 57314 | 8.7% | 3.5%(+5.21)#34 | 4.9%(+3.75)#4,049 |
| 35. | 57221 | 8.6% | 3.5%(+5.15)#35 | 4.9%(+3.69)#4,112 |
| 36. | 57448 | 8.6% | 3.5%(+5.10)#36 | 4.9%(+3.64)#4,172 |
| 37. | 57332 | 8.5% | 3.5%(+5.03)#37 | 4.9%(+3.57)#4,257 |
| 38. | 57543 | 8.4% | 3.5%(+4.89)#38 | 4.9%(+3.43)#4,417 |
| 39. | 57335 | 8.3% | 3.5%(+4.85)#39 | 4.9%(+3.39)#4,470 |
| 40. | 57237 | 8.3% | 3.5%(+4.81)#40 | 4.9%(+3.35)#4,521 |
| 41. | 57645 | 8.1% | 3.5%(+4.63)#41 | 4.9%(+3.16)#4,748 |
| 42. | 57319 | 8.0% | 3.5%(+4.53)#42 | 4.9%(+3.07)#4,873 |
| 43. | 57227 | 8.0% | 3.5%(+4.52)#43 | 4.9%(+3.05)#4,894 |
| 44. | 57340 | 7.9% | 3.5%(+4.45)#44 | 4.9%(+2.99)#4,985 |
| 45. | 57258 | 7.9% | 3.5%(+4.41)#45 | 4.9%(+2.95)#5,038 |
| 46. | 57003 | 7.9% | 3.5%(+4.40)#46 | 4.9%(+2.93)#5,060 |
| 47. | 57521 | 7.7% | 3.5%(+4.21)#47 | 4.9%(+2.75)#5,344 |
| 48. | 57626 | 7.6% | 3.5%(+4.09)#48 | 4.9%(+2.63)#5,527 |
| 49. | 57386 | 7.5% | 3.5%(+4.05)#49 | 4.9%(+2.59)#5,584 |
| 50. | 57001 | 7.5% | 3.5%(+4.05)#50 | 4.9%(+2.58)#5,592 |
| 51. | 57422 | 7.5% | 3.5%(+4.02)#51 | 4.9%(+2.55)#5,646 |
| 52. | 57751 | 7.5% | 3.5%(+3.99)#52 | 4.9%(+2.53)#5,690 |
| 53. | 57576 | 7.3% | 3.5%(+3.79)#53 | 4.9%(+2.33)#6,055 |
| 54. | 57348 | 7.1% | 3.5%(+3.60)#54 | 4.9%(+2.13)#6,388 |
| 55. | 57467 | 7.1% | 3.5%(+3.60)#55 | 4.9%(+2.13)#6,390 |
| 56. | 57077 | 7.1% | 3.5%(+3.58)#56 | 4.9%(+2.12)#6,425 |
| 57. | 57057 | 7.0% | 3.5%(+3.52)#57 | 4.9%(+2.05)#6,560 |
| 58. | 57353 | 7.0% | 3.5%(+3.49)#58 | 4.9%(+2.02)#6,614 |
| 59. | 57317 | 6.9% | 3.5%(+3.45)#59 | 4.9%(+1.99)#6,688 |
| 60. | 57212 | 6.8% | 3.5%(+3.29)#60 | 4.9%(+1.83)#7,019 |
| 61. | 57033 | 6.7% | 3.5%(+3.17)#61 | 4.9%(+1.71)#7,264 |
| 62. | 57748 | 6.6% | 3.5%(+3.10)#62 | 4.9%(+1.63)#7,418 |
| 63. | 57217 | 6.5% | 3.5%(+3.04)#63 | 4.9%(+1.58)#7,532 |
| 64. | 57368 | 6.5% | 3.5%(+3.03)#64 | 4.9%(+1.57)#7,549 |
| 65. | 57623 | 6.5% | 3.5%(+3.00)#65 | 4.9%(+1.54)#7,607 |
| 66. | 57638 | 6.5% | 3.5%(+2.98)#66 | 4.9%(+1.52)#7,644 |
| 67. | 57533 | 6.4% | 3.5%(+2.89)#67 | 4.9%(+1.43)#7,867 |
| 68. | 57349 | 6.4% | 3.5%(+2.87)#68 | 4.9%(+1.41)#7,912 |
| 69. | 57427 | 6.3% | 3.5%(+2.84)#69 | 4.9%(+1.38)#7,989 |
| 70. | 57544 | 6.2% | 3.5%(+2.77)#70 | 4.9%(+1.30)#8,171 |
| 71. | 57719 | 6.2% | 3.5%(+2.75)#71 | 4.9%(+1.29)#8,212 |
| 72. | 57249 | 6.2% | 3.5%(+2.68)#72 | 4.9%(+1.22)#8,367 |
| 73. | 57534 | 6.1% | 3.5%(+2.64)#73 | 4.9%(+1.18)#8,481 |
| 74. | 57025 | 5.9% | 3.5%(+2.41)#74 | 4.9%(+0.943)#9,057 |
| 75. | 57248 | 5.8% | 3.5%(+2.34)#75 | 4.9%(+0.875)#9,284 |
| 76. | 57430 | 5.6% | 3.5%(+2.17)#76 | 4.9%(+0.703)#9,815 |
| 77. | 57071 | 5.6% | 3.5%(+2.11)#77 | 4.9%(+0.644)#9,988 |
| 78. | 57022 | 5.6% | 3.5%(+2.11)#78 | 4.9%(+0.644)#9,989 |
| 79. | 57744 | 5.6% | 3.5%(+2.10)#79 | 4.9%(+0.641)#9,994 |
| 80. | 57791 | 5.6% | 3.5%(+2.07)#80 | 4.9%(+0.609)#10,092 |
| 81. | 57369 | 5.6% | 3.5%(+2.07)#81 | 4.9%(+0.605)#10,106 |
| 82. | 57793 | 5.5% | 3.5%(+2.05)#82 | 4.9%(+0.582)#10,157 |
| 83. | 57334 | 5.4% | 3.5%(+1.94)#83 | 4.9%(+0.478)#10,484 |
| 84. | 57442 | 5.4% | 3.5%(+1.90)#84 | 4.9%(+0.433)#10,646 |
| 85. | 57054 | 5.3% | 3.5%(+1.85)#85 | 4.9%(+0.391)#10,784 |
| 86. | 57103 | 5.3% | 3.5%(+1.81)#86 | 4.9%(+0.350)#10,923 |
| 87. | 57763 | 5.3% | 3.5%(+1.81)#87 | 4.9%(+0.342)#10,948 |
| 88. | 57720 | 5.3% | 3.5%(+1.78)#88 | 4.9%(+0.317)#11,025 |
| 89. | 57782 | 5.3% | 3.5%(+1.78)#89 | 4.9%(+0.317)#11,037 |
| 90. | 57428 | 5.2% | 3.5%(+1.70)#90 | 4.9%(+0.233)#11,315 |
| 91. | 57345 | 5.2% | 3.5%(+1.69)#91 | 4.9%(+0.223)#11,358 |
| 92. | 57434 | 5.1% | 3.5%(+1.62)#92 | 4.9%(+0.152)#11,624 |
| 93. | 57020 | 5.1% | 3.5%(+1.61)#93 | 4.9%(+0.146)#11,641 |
| 94. | 57745 | 5.0% | 3.5%(+1.56)#94 | 4.9%(+0.099)#11,800 |
| 95. | 57197 | 5.0% | 3.5%(+1.55)#95 | 4.9%(+0.090)#11,834 |
| 96. | 57451 | 5.0% | 3.5%(+1.55)#96 | 4.9%(+0.084)#11,853 |
| 97. | 57356 | 5.0% | 3.5%(+1.50)#97 | 4.9%(+0.034)#12,005 |
| 98. | 57270 | 4.9% | 3.5%(+1.43)#98 | 4.9%(-0.034)#12,233 |
| 99. | 57350 | 4.9% | 3.5%(+1.42)#99 | 4.9%(-0.047)#12,282 |
| 100. | 57312 | 4.8% | 3.5%(+1.34)#100 | 4.9%(-0.123)#12,540 |
Common Questions
What are the Top 10 Zip Codes with the Highest Percentage of Population Employed in Transportation & Warehousing in South Dakota?
Top 10 Zip Codes with the Highest Percentage of Population Employed in Transportation & Warehousing in South Dakota are:
What zip code has the Highest Percentage of Population Employed in Transportation & Warehousing in South Dakota?
57426 has the Highest Percentage of Population Employed in Transportation & Warehousing in South Dakota with 50.0%.
What is the Percentage of Population Employed in Transportation & Warehousing in the State of South Dakota?
Percentage of Population Employed in Transportation & Warehousing in South Dakota is 3.5%.
What is the Percentage of Population Employed in Transportation & Warehousing in the United States?
Percentage of Population Employed in Transportation & Warehousing in the United States is 4.9%.