Zip Codes with the Highest Percentage of Population Employed in Professional & Scientific Services in Pennsylvania
RELATED REPORTS & OPTIONS
Professional & Scientific Services
Pennsylvania
Compare Zip Codes
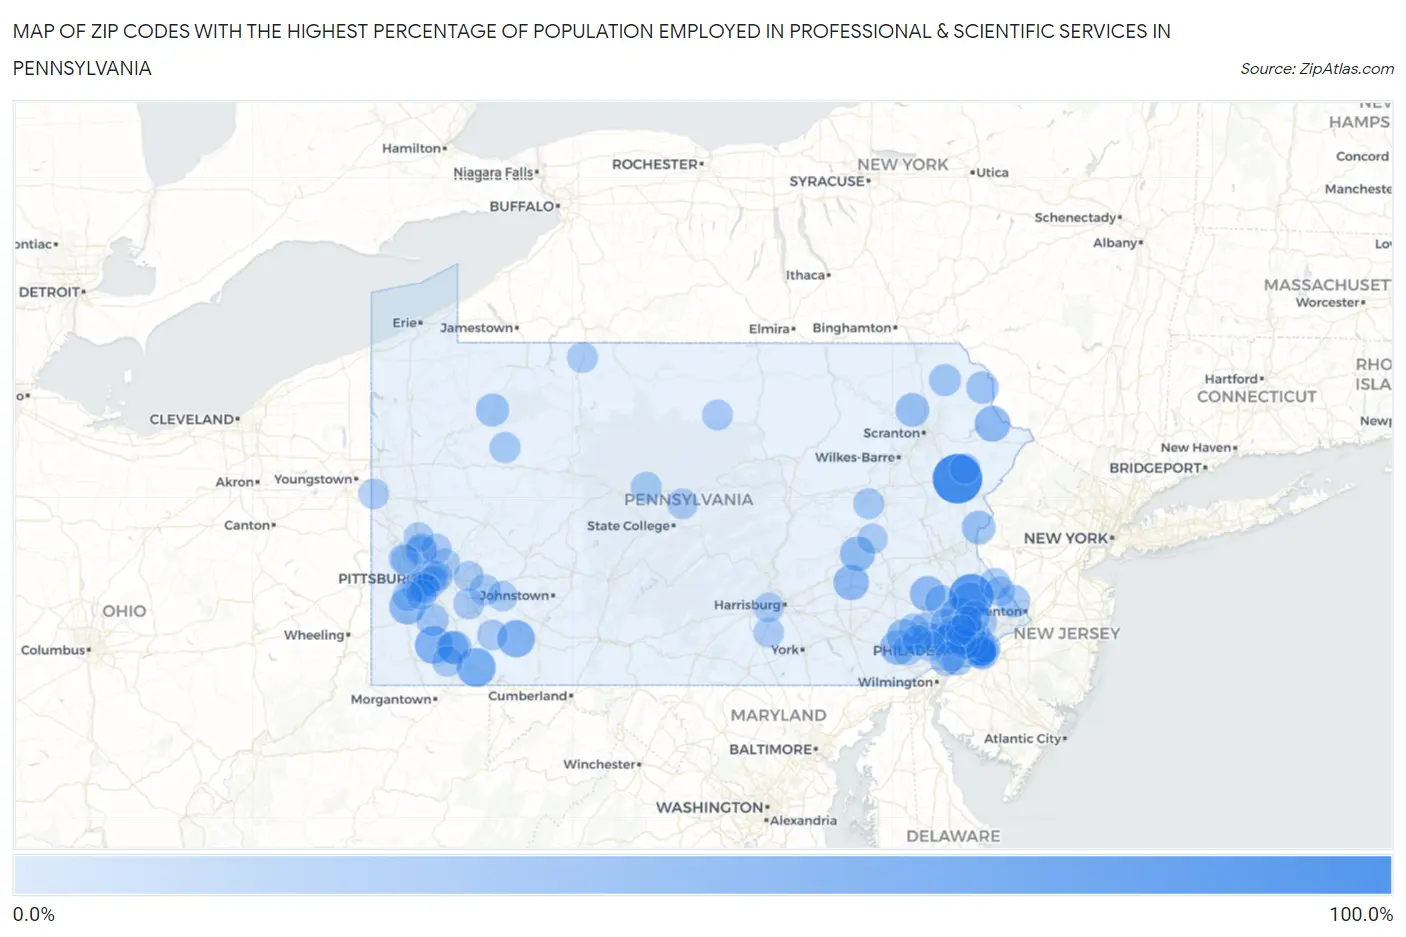
Map of Zip Codes with the Highest Percentage of Population Employed in Professional & Scientific Services in Pennsylvania
0.0%
100.0%
Zip Codes with the Highest Percentage of Population Employed in Professional & Scientific Services in Pennsylvania
| Zip Code | % Employed | vs State | vs National | |
| 1. | 18349 | 100.0% | 7.1%(+92.9)#1 | 7.8%(+92.2)#4 |
| 2. | 18927 | 77.3% | 7.1%(+70.2)#2 | 7.8%(+69.5)#22 |
| 3. | 15421 | 52.1% | 7.1%(+45.0)#3 | 7.8%(+44.2)#50 |
| 4. | 15450 | 46.2% | 7.1%(+39.1)#4 | 7.8%(+38.4)#67 |
| 5. | 15502 | 45.3% | 7.1%(+38.2)#5 | 7.8%(+37.4)#71 |
| 6. | 19490 | 41.7% | 7.1%(+34.6)#6 | 7.8%(+33.9)#84 |
| 7. | 15363 | 40.8% | 7.1%(+33.6)#7 | 7.8%(+32.9)#90 |
| 8. | 18932 | 39.4% | 7.1%(+32.3)#8 | 7.8%(+31.5)#97 |
| 9. | 18457 | 38.1% | 7.1%(+31.0)#9 | 7.8%(+30.2)#104 |
| 10. | 19544 | 36.7% | 7.1%(+29.5)#10 | 7.8%(+28.8)#115 |
| 11. | 19545 | 35.9% | 7.1%(+28.8)#11 | 7.8%(+28.1)#124 |
| 12. | 17933 | 35.1% | 7.1%(+28.0)#12 | 7.8%(+27.2)#133 |
| 13. | 19369 | 34.4% | 7.1%(+27.3)#13 | 7.8%(+26.6)#144 |
| 14. | 19316 | 31.0% | 7.1%(+23.9)#14 | 7.8%(+23.1)#203 |
| 15. | 18440 | 29.5% | 7.1%(+22.4)#15 | 7.8%(+21.7)#231 |
| 16. | 18063 | 28.4% | 7.1%(+21.2)#16 | 7.8%(+20.5)#278 |
| 17. | 15449 | 27.3% | 7.1%(+20.2)#17 | 7.8%(+19.5)#316 |
| 18. | 16370 | 26.9% | 7.1%(+19.8)#18 | 7.8%(+19.1)#331 |
| 19. | 19333 | 25.6% | 7.1%(+18.4)#19 | 7.8%(+17.7)#390 |
| 20. | 19106 | 25.3% | 7.1%(+18.2)#20 | 7.8%(+17.5)#406 |
| 21. | 19425 | 25.2% | 7.1%(+18.1)#21 | 7.8%(+17.4)#409 |
| 22. | 18977 | 24.6% | 7.1%(+17.5)#22 | 7.8%(+16.8)#452 |
| 23. | 15422 | 24.2% | 7.1%(+17.0)#23 | 7.8%(+16.3)#491 |
| 24. | 18469 | 23.7% | 7.1%(+16.6)#24 | 7.8%(+15.9)#516 |
| 25. | 15366 | 23.1% | 7.1%(+15.9)#25 | 7.8%(+15.2)#569 |
| 26. | 15222 | 23.0% | 7.1%(+15.9)#26 | 7.8%(+15.2)#576 |
| 27. | 19492 | 23.0% | 7.1%(+15.8)#27 | 7.8%(+15.1)#578 |
| 28. | 19102 | 22.0% | 7.1%(+14.9)#28 | 7.8%(+14.2)#664 |
| 29. | 19017 | 22.0% | 7.1%(+14.9)#29 | 7.8%(+14.2)#666 |
| 30. | 18430 | 21.6% | 7.1%(+14.5)#30 | 7.8%(+13.8)#708 |
| 31. | 19041 | 20.9% | 7.1%(+13.7)#31 | 7.8%(+13.0)#791 |
| 32. | 19130 | 20.5% | 7.1%(+13.4)#32 | 7.8%(+12.6)#826 |
| 33. | 19066 | 20.1% | 7.1%(+13.0)#33 | 7.8%(+12.3)#872 |
| 34. | 19341 | 20.0% | 7.1%(+12.8)#34 | 7.8%(+12.1)#894 |
| 35. | 19355 | 20.0% | 7.1%(+12.8)#35 | 7.8%(+12.1)#895 |
| 36. | 19072 | 19.9% | 7.1%(+12.7)#36 | 7.8%(+12.0)#904 |
| 37. | 18933 | 19.7% | 7.1%(+12.6)#37 | 7.8%(+11.9)#920 |
| 38. | 19123 | 19.3% | 7.1%(+12.2)#38 | 7.8%(+11.4)#972 |
| 39. | 19129 | 18.5% | 7.1%(+11.4)#39 | 7.8%(+10.7)#1,074 |
| 40. | 15633 | 18.5% | 7.1%(+11.4)#40 | 7.8%(+10.7)#1,076 |
| 41. | 15090 | 18.5% | 7.1%(+11.3)#41 | 7.8%(+10.6)#1,079 |
| 42. | 19103 | 18.4% | 7.1%(+11.3)#42 | 7.8%(+10.6)#1,088 |
| 43. | 19087 | 18.3% | 7.1%(+11.1)#43 | 7.8%(+10.4)#1,113 |
| 44. | 19127 | 18.2% | 7.1%(+11.1)#44 | 7.8%(+10.4)#1,121 |
| 45. | 19035 | 18.2% | 7.1%(+11.0)#45 | 7.8%(+10.3)#1,134 |
| 46. | 19025 | 18.0% | 7.1%(+10.8)#46 | 7.8%(+10.1)#1,166 |
| 47. | 16834 | 17.8% | 7.1%(+10.7)#47 | 7.8%(+9.94)#1,191 |
| 48. | 19358 | 17.6% | 7.1%(+10.5)#48 | 7.8%(+9.80)#1,220 |
| 49. | 15617 | 17.5% | 7.1%(+10.4)#49 | 7.8%(+9.67)#1,252 |
| 50. | 19456 | 17.5% | 7.1%(+10.4)#50 | 7.8%(+9.65)#1,256 |
| 51. | 19108 | 17.4% | 7.1%(+10.3)#51 | 7.8%(+9.54)#1,275 |
| 52. | 19086 | 17.3% | 7.1%(+10.2)#52 | 7.8%(+9.48)#1,285 |
| 53. | 19118 | 17.3% | 7.1%(+10.2)#53 | 7.8%(+9.45)#1,296 |
| 54. | 15458 | 17.3% | 7.1%(+10.2)#54 | 7.8%(+9.45)#1,298 |
| 55. | 16235 | 17.2% | 7.1%(+10.1)#55 | 7.8%(+9.34)#1,319 |
| 56. | 19147 | 17.1% | 7.1%(+9.92)#56 | 7.8%(+9.21)#1,345 |
| 57. | 19096 | 17.0% | 7.1%(+9.90)#57 | 7.8%(+9.19)#1,351 |
| 58. | 18256 | 16.9% | 7.1%(+9.82)#58 | 7.8%(+9.10)#1,375 |
| 59. | 19406 | 16.7% | 7.1%(+9.60)#59 | 7.8%(+8.88)#1,420 |
| 60. | 19004 | 16.7% | 7.1%(+9.56)#60 | 7.8%(+8.85)#1,428 |
| 61. | 16725 | 16.7% | 7.1%(+9.53)#61 | 7.8%(+8.82)#1,443 |
| 62. | 17727 | 16.7% | 7.1%(+9.53)#62 | 7.8%(+8.82)#1,444 |
| 63. | 19125 | 16.6% | 7.1%(+9.51)#63 | 7.8%(+8.79)#1,452 |
| 64. | 15142 | 16.6% | 7.1%(+9.44)#64 | 7.8%(+8.73)#1,462 |
| 65. | 19444 | 16.6% | 7.1%(+9.42)#65 | 7.8%(+8.70)#1,472 |
| 66. | 15490 | 16.5% | 7.1%(+9.38)#66 | 7.8%(+8.67)#1,484 |
| 67. | 19312 | 16.3% | 7.1%(+9.16)#67 | 7.8%(+8.45)#1,542 |
| 68. | 15015 | 16.1% | 7.1%(+9.00)#68 | 7.8%(+8.29)#1,578 |
| 69. | 15243 | 16.1% | 7.1%(+8.99)#69 | 7.8%(+8.28)#1,581 |
| 70. | 19462 | 16.1% | 7.1%(+8.95)#70 | 7.8%(+8.24)#1,592 |
| 71. | 19380 | 16.0% | 7.1%(+8.90)#71 | 7.8%(+8.18)#1,602 |
| 72. | 19003 | 15.9% | 7.1%(+8.75)#72 | 7.8%(+8.03)#1,643 |
| 73. | 19002 | 15.7% | 7.1%(+8.56)#73 | 7.8%(+7.85)#1,697 |
| 74. | 18342 | 15.6% | 7.1%(+8.45)#74 | 7.8%(+7.73)#1,722 |
| 75. | 16853 | 15.6% | 7.1%(+8.44)#75 | 7.8%(+7.72)#1,727 |
| 76. | 15220 | 15.5% | 7.1%(+8.41)#76 | 7.8%(+7.70)#1,731 |
| 77. | 19010 | 15.5% | 7.1%(+8.33)#77 | 7.8%(+7.62)#1,762 |
| 78. | 19063 | 15.4% | 7.1%(+8.29)#78 | 7.8%(+7.57)#1,774 |
| 79. | 15203 | 15.4% | 7.1%(+8.27)#79 | 7.8%(+7.55)#1,777 |
| 80. | 16132 | 15.2% | 7.1%(+8.08)#80 | 7.8%(+7.37)#1,825 |
| 81. | 15056 | 15.1% | 7.1%(+7.96)#81 | 7.8%(+7.24)#1,869 |
| 82. | 15238 | 15.1% | 7.1%(+7.93)#82 | 7.8%(+7.22)#1,878 |
| 83. | 19422 | 15.0% | 7.1%(+7.85)#83 | 7.8%(+7.13)#1,905 |
| 84. | 19343 | 14.9% | 7.1%(+7.72)#84 | 7.8%(+7.01)#1,959 |
| 85. | 17930 | 14.8% | 7.1%(+7.68)#85 | 7.8%(+6.97)#1,969 |
| 86. | 18938 | 14.8% | 7.1%(+7.67)#86 | 7.8%(+6.95)#1,978 |
| 87. | 15668 | 14.8% | 7.1%(+7.66)#87 | 7.8%(+6.95)#1,981 |
| 88. | 15232 | 14.7% | 7.1%(+7.55)#88 | 7.8%(+6.84)#2,014 |
| 89. | 15661 | 14.7% | 7.1%(+7.54)#89 | 7.8%(+6.83)#2,019 |
| 90. | 15241 | 14.6% | 7.1%(+7.50)#90 | 7.8%(+6.78)#2,039 |
| 91. | 15228 | 14.6% | 7.1%(+7.47)#91 | 7.8%(+6.76)#2,052 |
| 92. | 15044 | 14.6% | 7.1%(+7.45)#92 | 7.8%(+6.74)#2,057 |
| 93. | 19405 | 14.6% | 7.1%(+7.45)#93 | 7.8%(+6.73)#2,063 |
| 94. | 17323 | 14.5% | 7.1%(+7.38)#94 | 7.8%(+6.67)#2,085 |
| 95. | 19335 | 14.5% | 7.1%(+7.34)#95 | 7.8%(+6.62)#2,100 |
| 96. | 17050 | 14.4% | 7.1%(+7.28)#96 | 7.8%(+6.57)#2,119 |
| 97. | 19107 | 14.4% | 7.1%(+7.28)#97 | 7.8%(+6.56)#2,123 |
| 98. | 16066 | 14.4% | 7.1%(+7.25)#98 | 7.8%(+6.53)#2,132 |
| 99. | 15321 | 14.3% | 7.1%(+7.19)#99 | 7.8%(+6.48)#2,147 |
| 100. | 15081 | 14.3% | 7.1%(+7.15)#100 | 7.8%(+6.44)#2,160 |
Common Questions
What are the Top 10 Zip Codes with the Highest Percentage of Population Employed in Professional & Scientific Services in Pennsylvania?
Top 10 Zip Codes with the Highest Percentage of Population Employed in Professional & Scientific Services in Pennsylvania are:
What zip code has the Highest Percentage of Population Employed in Professional & Scientific Services in Pennsylvania?
18349 has the Highest Percentage of Population Employed in Professional & Scientific Services in Pennsylvania with 100.0%.
What is the Percentage of Population Employed in Professional & Scientific Services in the State of Pennsylvania?
Percentage of Population Employed in Professional & Scientific Services in Pennsylvania is 7.1%.
What is the Percentage of Population Employed in Professional & Scientific Services in the United States?
Percentage of Population Employed in Professional & Scientific Services in the United States is 7.8%.