Paxtonville, PA
Paxtonville Map
Paxtonville Overview
198
TOTAL POPULATION
87
MALE POPULATION
111
FEMALE POPULATION
78.38
MALES / 100 FEMALES
127.59
FEMALES / 100 MALES
36.4
MEDIAN AGE
2.6
AVG FAMILY SIZE
2.3
AVG HOUSEHOLD SIZE
$28,009
PER CAPITA INCOME
$63,173
AVG FAMILY INCOME
$57,386
AVG HOUSEHOLD INCOME
2.0%
WAGE / INCOME GAP [ % ]
98.0¢/ $1
WAGE / INCOME GAP [ $ ]
0.23
INEQUALITY / GINI INDEX
112
LABOR FORCE [ PEOPLE ]
73.7%
PERCENT IN LABOR FORCE
Paxtonville Zip Codes
Paxtonville Area Codes
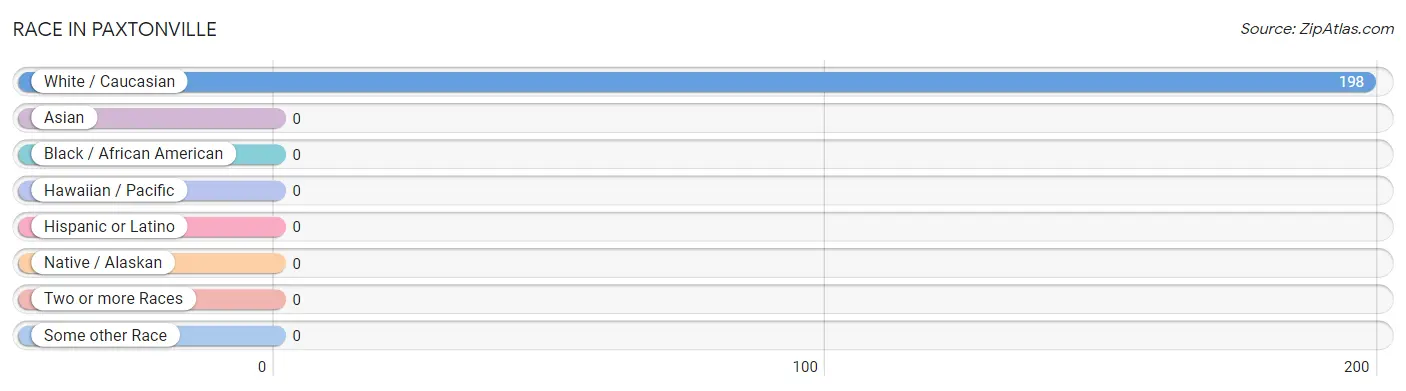
Race in Paxtonville
The most populous races in Paxtonville are , and White / Caucasian (198 | 100.0%).
| Race | # Population | % Population |
| Asian | 0 | 0.0% |
| Black / African American | 0 | 0.0% |
| Hawaiian / Pacific | 0 | 0.0% |
| Hispanic or Latino | 0 | 0.0% |
| Native / Alaskan | 0 | 0.0% |
| White / Caucasian | 198 | 100.0% |
| Two or more Races | 0 | 0.0% |
| Some other Race | 0 | 0.0% |
| Total | 198 | 100.0% |
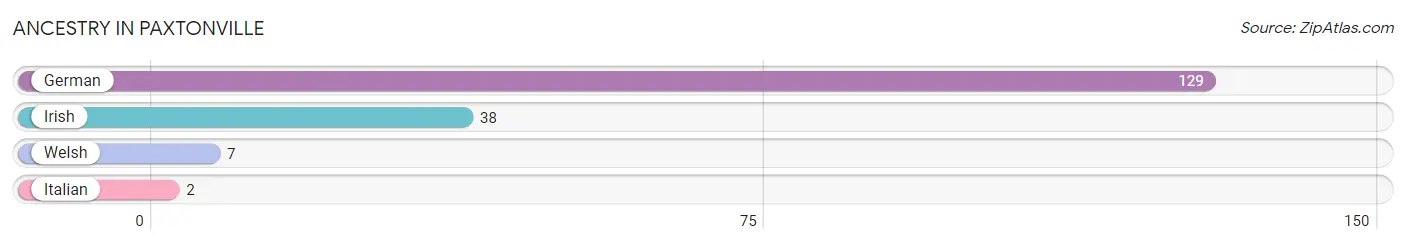
Ancestry in Paxtonville
The most populous ancestries reported in Paxtonville are German (129 | 65.1%), Irish (38 | 19.2%), Welsh (7 | 3.5%), and Italian (2 | 1.0%), together accounting for 88.9% of all Paxtonville residents.
| Ancestry | # Population | % Population |
| German | 129 | 65.1% |
| Irish | 38 | 19.2% |
| Italian | 2 | 1.0% |
| Welsh | 7 | 3.5% | View All 4 Rows |
Immigrants in Paxtonville

| Immigration Origin | # Population | % Population | View All 0 Rows |
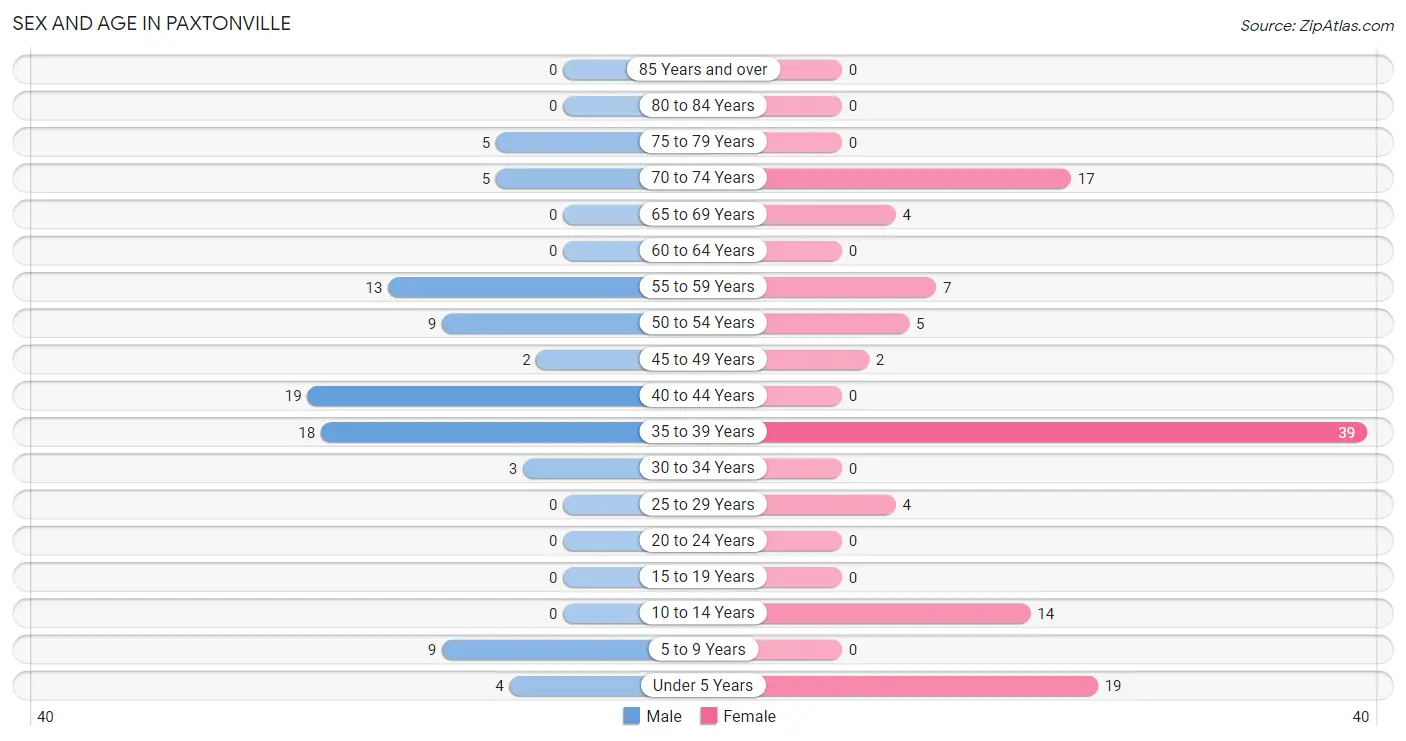
Sex and Age in Paxtonville
Sex and Age in Paxtonville
The most populous age groups in Paxtonville are 40 to 44 Years (19 | 21.8%) for men and 35 to 39 Years (39 | 35.1%) for women.
| Age Bracket | Male | Female |
| Under 5 Years | 4 (4.6%) | 19 (17.1%) |
| 5 to 9 Years | 9 (10.3%) | 0 (0.0%) |
| 10 to 14 Years | 0 (0.0%) | 14 (12.6%) |
| 15 to 19 Years | 0 (0.0%) | 0 (0.0%) |
| 20 to 24 Years | 0 (0.0%) | 0 (0.0%) |
| 25 to 29 Years | 0 (0.0%) | 4 (3.6%) |
| 30 to 34 Years | 3 (3.5%) | 0 (0.0%) |
| 35 to 39 Years | 18 (20.7%) | 39 (35.1%) |
| 40 to 44 Years | 19 (21.8%) | 0 (0.0%) |
| 45 to 49 Years | 2 (2.3%) | 2 (1.8%) |
| 50 to 54 Years | 9 (10.3%) | 5 (4.5%) |
| 55 to 59 Years | 13 (14.9%) | 7 (6.3%) |
| 60 to 64 Years | 0 (0.0%) | 0 (0.0%) |
| 65 to 69 Years | 0 (0.0%) | 4 (3.6%) |
| 70 to 74 Years | 5 (5.8%) | 17 (15.3%) |
| 75 to 79 Years | 5 (5.8%) | 0 (0.0%) |
| 80 to 84 Years | 0 (0.0%) | 0 (0.0%) |
| 85 Years and over | 0 (0.0%) | 0 (0.0%) |
| Total | 87 (100.0%) | 111 (100.0%) |
Families and Households in Paxtonville
Median Family Size in Paxtonville
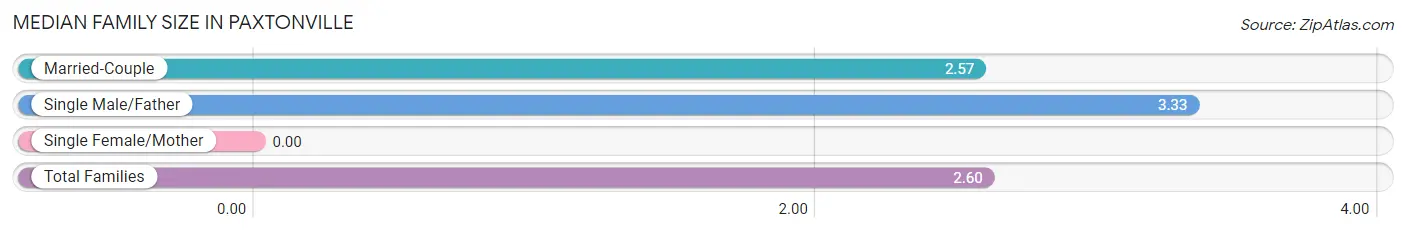
| Family Type | # Families | Family Size |
| Married-Couple | 67 (95.7%) | 2.57 |
| Single Male/Father | 3 (4.3%) | 3.33 |
| Single Female/Mother | 0 (0.0%) | - |
| Total Families | 70 (100.0%) | 2.60 |
Median Household Size in Paxtonville
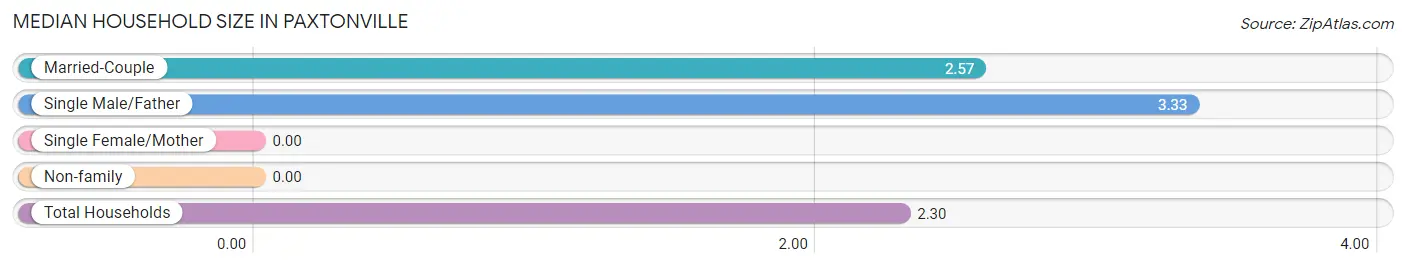
| Household Type | # Households | Household Size |
| Married-Couple | 67 (77.9%) | 2.57 |
| Single Male/Father | 3 (3.5%) | 3.33 |
| Single Female/Mother | 0 (0.0%) | - |
| Non-family | 16 (18.6%) | - |
| Total Households | 86 (100.0%) | 2.30 |
Household Size by Marriage Status in Paxtonville
Out of a total of 86 households in Paxtonville, 70 (81.4%) are family households, while 16 (18.6%) are nonfamily households. The most numerous type of family households are 3-person households, comprising 42, and the most common type of nonfamily households are 1-person households, comprising 16.
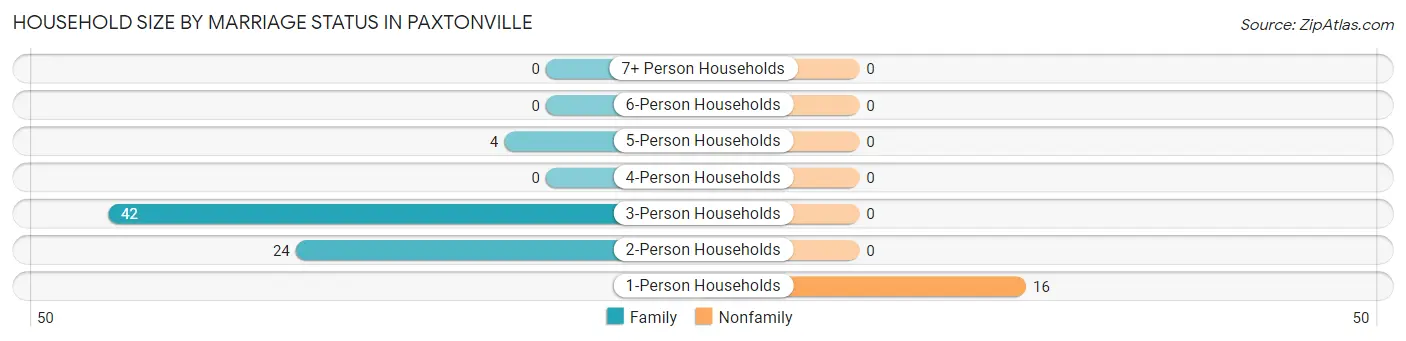
| Household Size | Family Households | Nonfamily Households |
| 1-Person Households | - | 16 (18.6%) |
| 2-Person Households | 24 (27.9%) | 0 (0.0%) |
| 3-Person Households | 42 (48.8%) | 0 (0.0%) |
| 4-Person Households | 0 (0.0%) | 0 (0.0%) |
| 5-Person Households | 4 (4.6%) | 0 (0.0%) |
| 6-Person Households | 0 (0.0%) | 0 (0.0%) |
| 7+ Person Households | 0 (0.0%) | 0 (0.0%) |
| Total | 70 (81.4%) | 16 (18.6%) |
Female Fertility in Paxtonville
Fertility by Age in Paxtonville
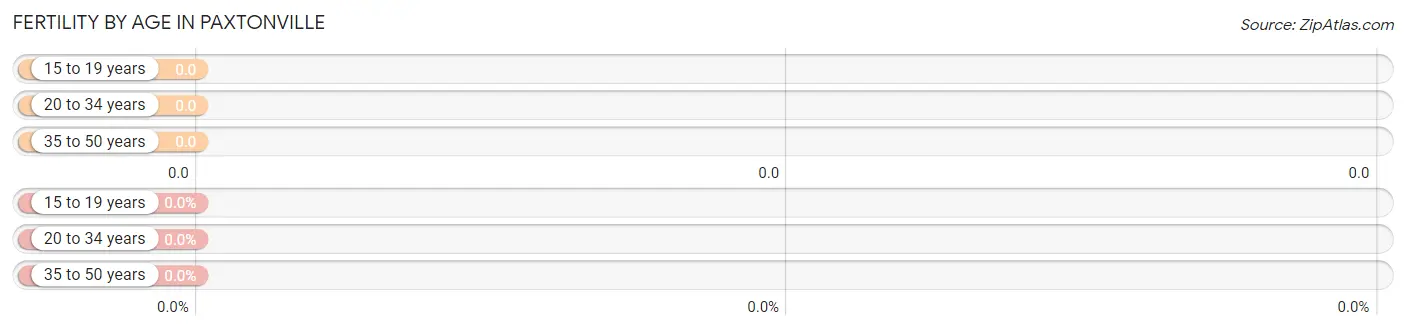
| Age Bracket | Women with Births | Births / 1,000 Women |
| 15 to 19 years | 0 (0.0%) | 0.0 |
| 20 to 34 years | 0 (0.0%) | 0.0 |
| 35 to 50 years | 0 (0.0%) | 0.0 |
| Total | 0 (0.0%) | 0.0 |
Fertility by Age by Marriage Status in Paxtonville
| Age Bracket | Married | Unmarried |
| 15 to 19 years | 0 (0.0%) | 0 (0.0%) |
| 20 to 34 years | 0 (0.0%) | 0 (0.0%) |
| 35 to 50 years | 0 (0.0%) | 0 (0.0%) |
| Total | 0 (0.0%) | 0 (0.0%) |
Fertility by Education in Paxtonville
| Educational Attainment | Women with Births | Births / 1,000 Women |
| Less than High School | 0 (0.0%) | 0.0 |
| High School Diploma | 0 (0.0%) | 0.0 |
| College or Associate's Degree | 0 (0.0%) | 0.0 |
| Bachelor's Degree | 0 (0.0%) | 0.0 |
| Graduate Degree | 0 (0.0%) | 0.0 |
| Total | 0 (0.0%) | 0.0 |
Fertility by Education by Marriage Status in Paxtonville
| Educational Attainment | Married | Unmarried |
| Less than High School | 0 (0.0%) | 0 (0.0%) |
| High School Diploma | 0 (0.0%) | 0 (0.0%) |
| College or Associate's Degree | 0 (0.0%) | 0 (0.0%) |
| Bachelor's Degree | 0 (0.0%) | 0 (0.0%) |
| Graduate Degree | 0 (0.0%) | 0 (0.0%) |
| Total | 0 (0.0%) | 0 (0.0%) |
Income in Paxtonville
Income Overview in Paxtonville
Per Capita Income in Paxtonville is $28,009, while median incomes of families and households are $63,173 and $57,386 respectively.
| Characteristic | Number | Measure |
| Per Capita Income | 198 | $28,009 |
| Median Family Income | 70 | $63,173 |
| Mean Family Income | 70 | $70,964 |
| Median Household Income | 86 | $57,386 |
| Mean Household Income | 86 | $64,510 |
| Income Deficit | 70 | $0 |
| Wage / Income Gap (%) | 198 | 2.04% |
| Wage / Income Gap ($) | 198 | 97.96¢ per $1 |
| Gini / Inequality Index | 198 | 0.23 |
Earnings by Sex in Paxtonville
Average Earnings in Paxtonville are $45,893, $46,607 for men and $45,655 for women, a difference of 2.0%.
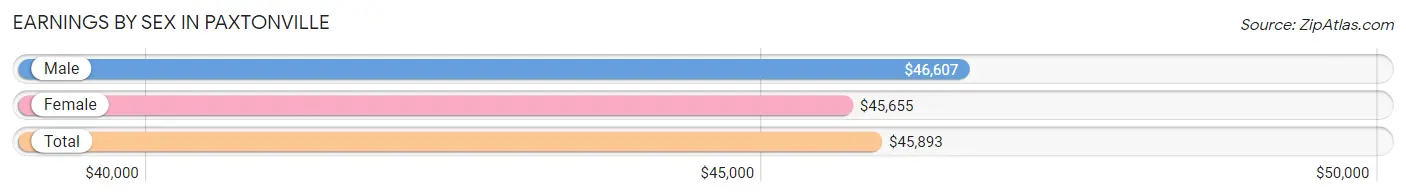
| Sex | Number | Average Earnings |
| Male | 69 (61.6%) | $46,607 |
| Female | 43 (38.4%) | $45,655 |
| Total | 112 (100.0%) | $45,893 |
Earnings by Sex by Income Bracket in Paxtonville
The most common earnings brackets in Paxtonville are $55,000 to $64,999 for men (22 | 31.9%) and $45,000 to $49,999 for women (21 | 48.8%).
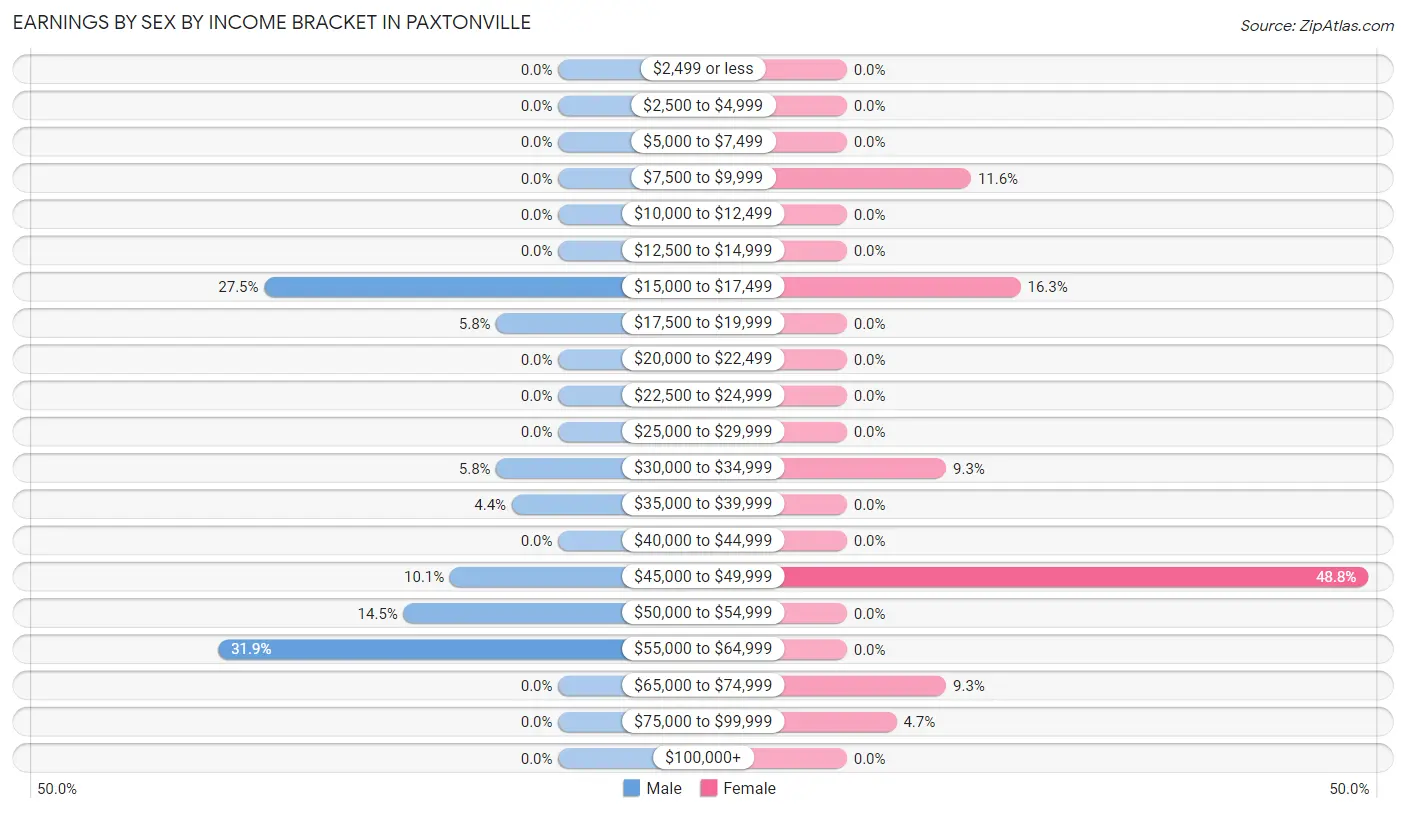
| Income | Male | Female |
| $2,499 or less | 0 (0.0%) | 0 (0.0%) |
| $2,500 to $4,999 | 0 (0.0%) | 0 (0.0%) |
| $5,000 to $7,499 | 0 (0.0%) | 0 (0.0%) |
| $7,500 to $9,999 | 0 (0.0%) | 5 (11.6%) |
| $10,000 to $12,499 | 0 (0.0%) | 0 (0.0%) |
| $12,500 to $14,999 | 0 (0.0%) | 0 (0.0%) |
| $15,000 to $17,499 | 19 (27.5%) | 7 (16.3%) |
| $17,500 to $19,999 | 4 (5.8%) | 0 (0.0%) |
| $20,000 to $22,499 | 0 (0.0%) | 0 (0.0%) |
| $22,500 to $24,999 | 0 (0.0%) | 0 (0.0%) |
| $25,000 to $29,999 | 0 (0.0%) | 0 (0.0%) |
| $30,000 to $34,999 | 4 (5.8%) | 4 (9.3%) |
| $35,000 to $39,999 | 3 (4.3%) | 0 (0.0%) |
| $40,000 to $44,999 | 0 (0.0%) | 0 (0.0%) |
| $45,000 to $49,999 | 7 (10.1%) | 21 (48.8%) |
| $50,000 to $54,999 | 10 (14.5%) | 0 (0.0%) |
| $55,000 to $64,999 | 22 (31.9%) | 0 (0.0%) |
| $65,000 to $74,999 | 0 (0.0%) | 4 (9.3%) |
| $75,000 to $99,999 | 0 (0.0%) | 2 (4.6%) |
| $100,000+ | 0 (0.0%) | 0 (0.0%) |
| Total | 69 (100.0%) | 43 (100.0%) |
Earnings by Sex by Educational Attainment in Paxtonville
Average earnings in Paxtonville are $46,607 for men and $45,655 for women, a difference of 2.0%. Men with an educational attainment of less than high school enjoy the highest average annual earnings of $55,625, while those with less than high school education earn the least with $55,625. Women with an educational attainment of high school diploma earn the most with the average annual earnings of $45,476, while those with high school diploma education have the smallest earnings of $45,476.
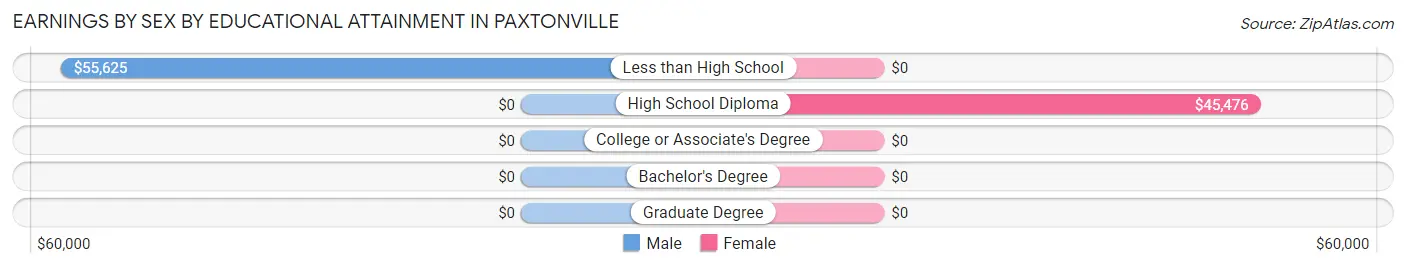
| Educational Attainment | Male Income | Female Income |
| Less than High School | $55,625 | $0 |
| High School Diploma | - | - |
| College or Associate's Degree | - | - |
| Bachelor's Degree | - | - |
| Graduate Degree | - | - |
| Total | $46,607 | $45,655 |
Family Income in Paxtonville
Family Income Brackets in Paxtonville
According to the Paxtonville family income data, there are 44 families falling into the $50,000 to $74,999 income range, which is the most common income bracket and makes up 62.9% of all families.
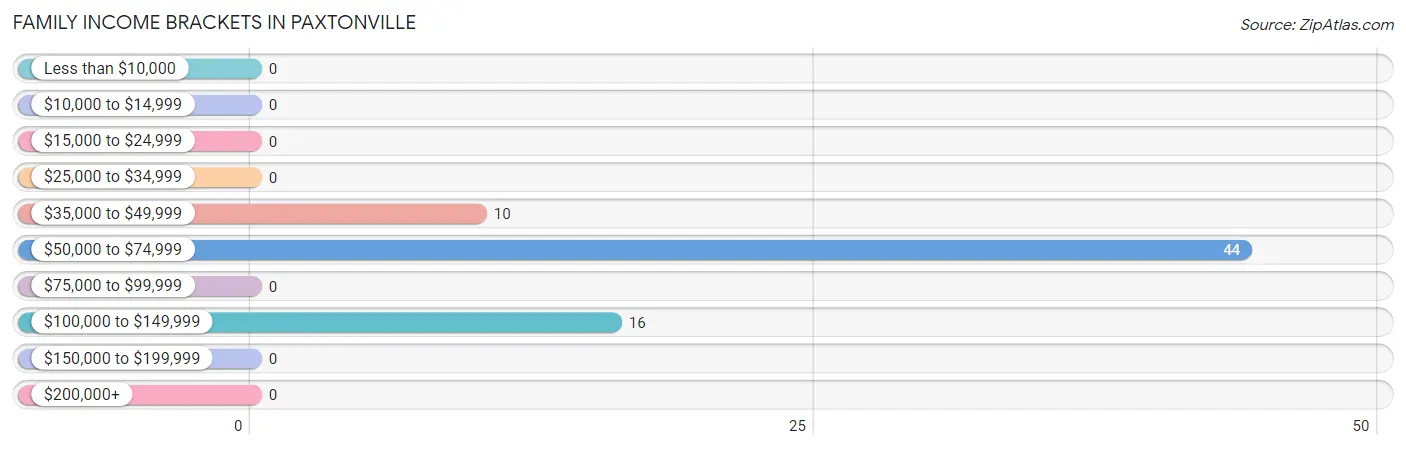
| Income Bracket | # Families | % Families |
| Less than $10,000 | 0 | 0.0% |
| $10,000 to $14,999 | 0 | 0.0% |
| $15,000 to $24,999 | 0 | 0.0% |
| $25,000 to $34,999 | 0 | 0.0% |
| $35,000 to $49,999 | 10 | 14.3% |
| $50,000 to $74,999 | 44 | 62.9% |
| $75,000 to $99,999 | 0 | 0.0% |
| $100,000 to $149,999 | 16 | 22.9% |
| $150,000 to $199,999 | 0 | 0.0% |
| $200,000+ | 0 | 0.0% |
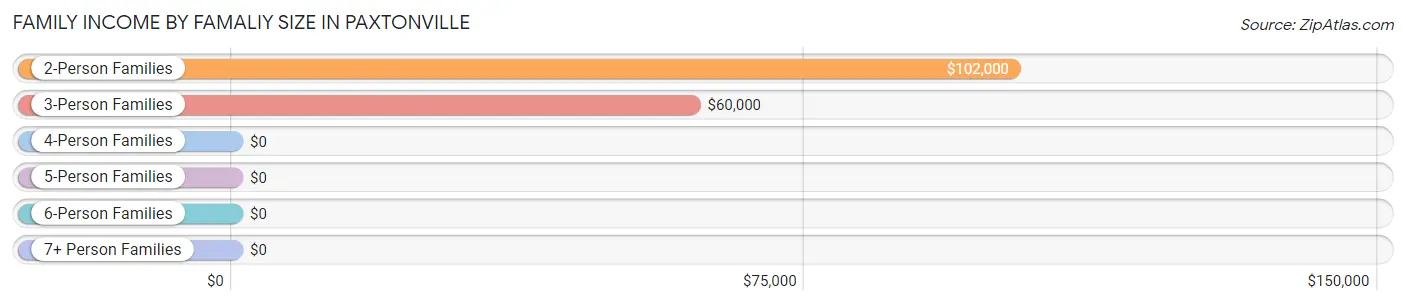
Family Income by Famaliy Size in Paxtonville
2-person families (24 | 34.3%) account for the highest median family income in Paxtonville with $102,000 per family, while 2-person families (24 | 34.3%) have the highest median income of $51,000 per family member.
| Income Bracket | # Families | Median Income |
| 2-Person Families | 24 (34.3%) | $102,000 |
| 3-Person Families | 42 (60.0%) | $60,000 |
| 4-Person Families | 0 (0.0%) | $0 |
| 5-Person Families | 4 (5.7%) | $0 |
| 6-Person Families | 0 (0.0%) | $0 |
| 7+ Person Families | 0 (0.0%) | $0 |
| Total | 70 (100.0%) | $63,173 |
Family Income by Number of Earners in Paxtonville
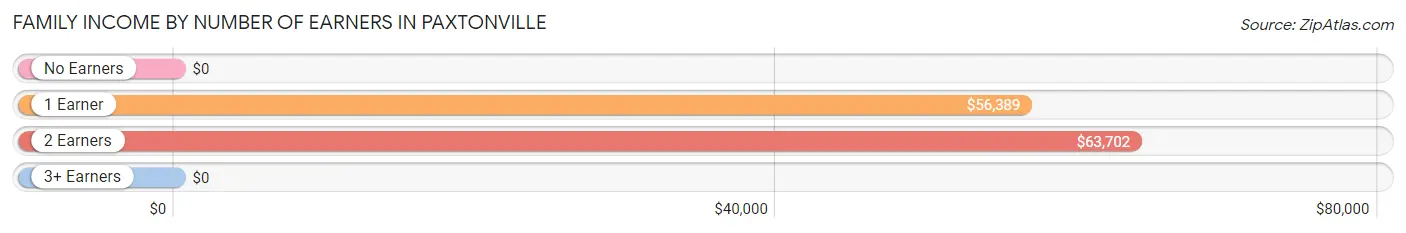
| Number of Earners | # Families | Median Income |
| No Earners | 5 (7.1%) | $0 |
| 1 Earner | 26 (37.1%) | $56,389 |
| 2 Earners | 39 (55.7%) | $63,702 |
| 3+ Earners | 0 (0.0%) | $0 |
| Total | 70 (100.0%) | $63,173 |
Household Income in Paxtonville
Household Income Brackets in Paxtonville
With 48 households falling in the category, the $50,000 to $74,999 income range is the most frequent in Paxtonville, accounting for 55.8% of all households.
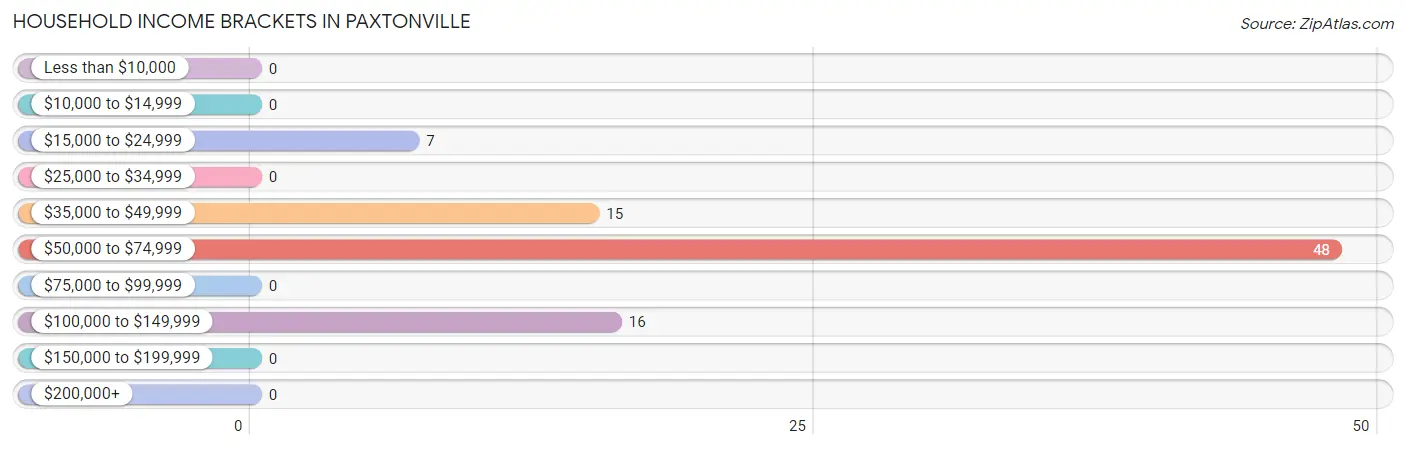
| Income Bracket | # Households | % Households |
| Less than $10,000 | 0 | 0.0% |
| $10,000 to $14,999 | 0 | 0.0% |
| $15,000 to $24,999 | 7 | 8.1% |
| $25,000 to $34,999 | 0 | 0.0% |
| $35,000 to $49,999 | 15 | 17.4% |
| $50,000 to $74,999 | 48 | 55.8% |
| $75,000 to $99,999 | 0 | 0.0% |
| $100,000 to $149,999 | 16 | 18.6% |
| $150,000 to $199,999 | 0 | 0.0% |
| $200,000+ | 0 | 0.0% |
Household Income by Householder Age in Paxtonville
The median household income in Paxtonville is $57,386, with the highest median household income of $60,000 found in the 25 to 44 years age bracket for the primary householder. A total of 42 households (48.8%) fall into this category.
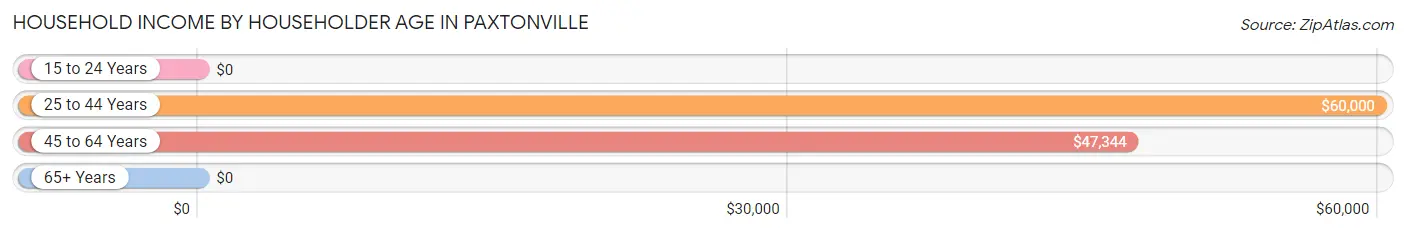
| Income Bracket | # Households | Median Income |
| 15 to 24 Years | 0 (0.0%) | $0 |
| 25 to 44 Years | 42 (48.8%) | $60,000 |
| 45 to 64 Years | 23 (26.7%) | $47,344 |
| 65+ Years | 21 (24.4%) | $0 |
| Total | 86 (100.0%) | $57,386 |
Poverty in Paxtonville
Income Below Poverty by Sex and Age in Paxtonville
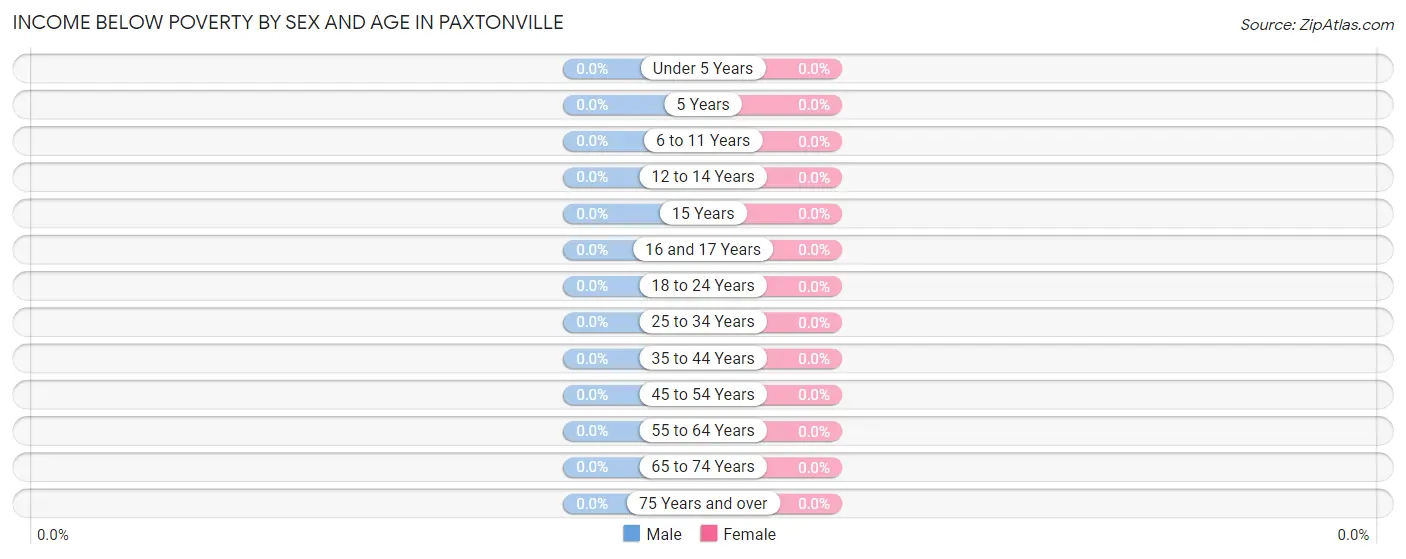
| Age Bracket | Male | Female |
| Under 5 Years | 0 (0.0%) | 0 (0.0%) |
| 5 Years | 0 (0.0%) | 0 (0.0%) |
| 6 to 11 Years | 0 (0.0%) | 0 (0.0%) |
| 12 to 14 Years | 0 (0.0%) | 0 (0.0%) |
| 15 Years | 0 (0.0%) | 0 (0.0%) |
| 16 and 17 Years | 0 (0.0%) | 0 (0.0%) |
| 18 to 24 Years | 0 (0.0%) | 0 (0.0%) |
| 25 to 34 Years | 0 (0.0%) | 0 (0.0%) |
| 35 to 44 Years | 0 (0.0%) | 0 (0.0%) |
| 45 to 54 Years | 0 (0.0%) | 0 (0.0%) |
| 55 to 64 Years | 0 (0.0%) | 0 (0.0%) |
| 65 to 74 Years | 0 (0.0%) | 0 (0.0%) |
| 75 Years and over | 0 (0.0%) | 0 (0.0%) |
| Total | 0 (0.0%) | 0 (0.0%) |
Income Above Poverty by Sex and Age in Paxtonville
According to the poverty statistics in Paxtonville, males aged under 5 years and females aged under 5 years are the age groups that are most secure financially, with 100.0% of males and 100.0% of females in these age groups living above the poverty line.
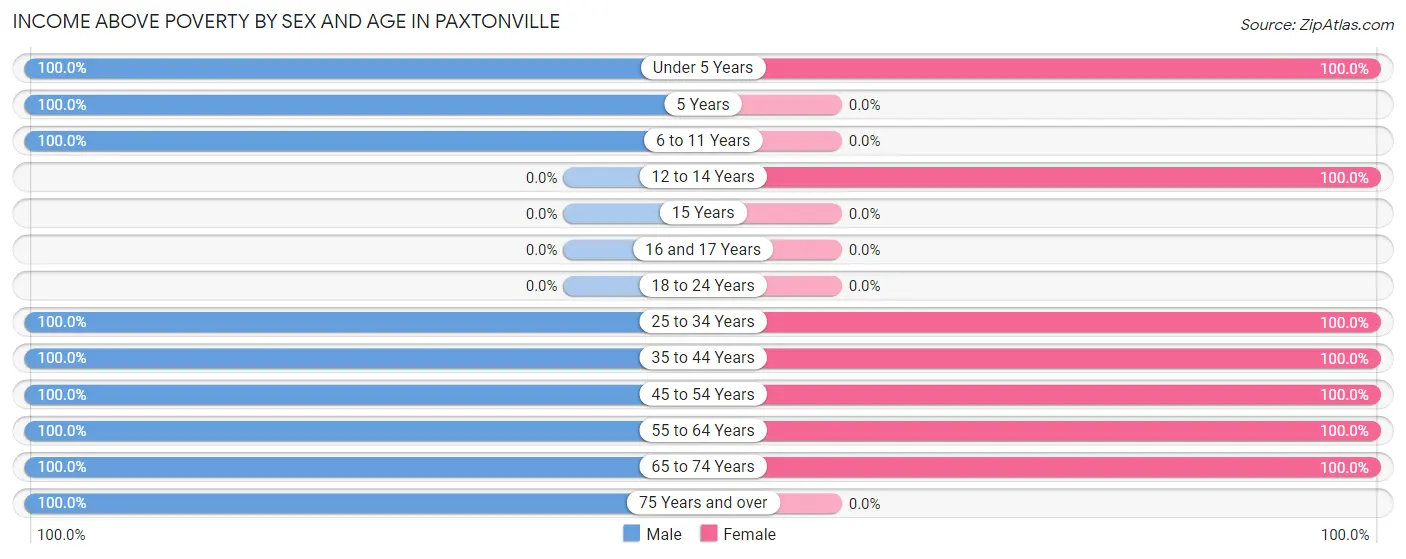
| Age Bracket | Male | Female |
| Under 5 Years | 4 (100.0%) | 19 (100.0%) |
| 5 Years | 4 (100.0%) | 0 (0.0%) |
| 6 to 11 Years | 5 (100.0%) | 0 (0.0%) |
| 12 to 14 Years | 0 (0.0%) | 14 (100.0%) |
| 15 Years | 0 (0.0%) | 0 (0.0%) |
| 16 and 17 Years | 0 (0.0%) | 0 (0.0%) |
| 18 to 24 Years | 0 (0.0%) | 0 (0.0%) |
| 25 to 34 Years | 3 (100.0%) | 4 (100.0%) |
| 35 to 44 Years | 37 (100.0%) | 39 (100.0%) |
| 45 to 54 Years | 11 (100.0%) | 7 (100.0%) |
| 55 to 64 Years | 13 (100.0%) | 7 (100.0%) |
| 65 to 74 Years | 5 (100.0%) | 21 (100.0%) |
| 75 Years and over | 5 (100.0%) | 0 (0.0%) |
| Total | 87 (100.0%) | 111 (100.0%) |
Income Below Poverty Among Married-Couple Families in Paxtonville
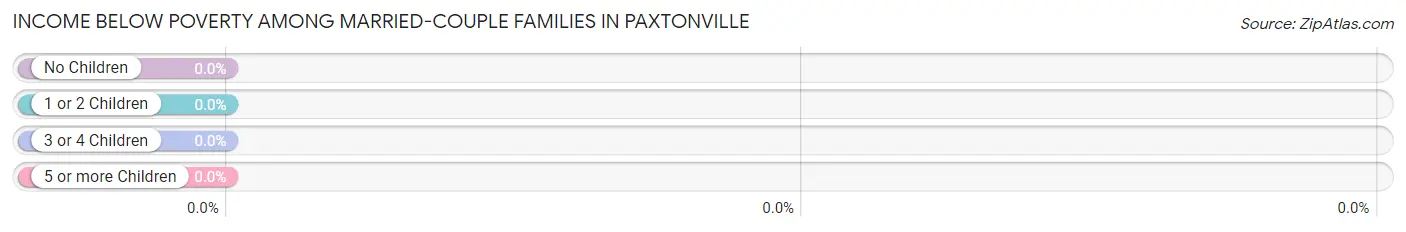
| Children | Above Poverty | Below Poverty |
| No Children | 24 (100.0%) | 0 (0.0%) |
| 1 or 2 Children | 39 (100.0%) | 0 (0.0%) |
| 3 or 4 Children | 4 (100.0%) | 0 (0.0%) |
| 5 or more Children | 0 (0.0%) | 0 (0.0%) |
| Total | 67 (100.0%) | 0 (0.0%) |
Income Below Poverty Among Single-Parent Households in Paxtonville
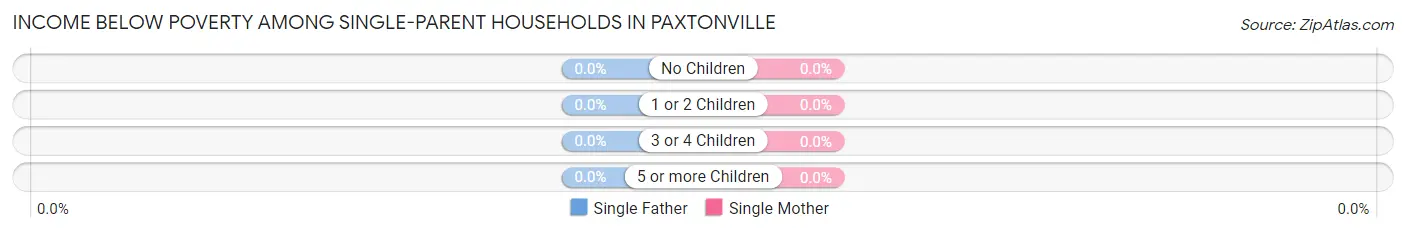
| Children | Single Father | Single Mother |
| No Children | 0 (0.0%) | 0 (0.0%) |
| 1 or 2 Children | 0 (0.0%) | 0 (0.0%) |
| 3 or 4 Children | 0 (0.0%) | 0 (0.0%) |
| 5 or more Children | 0 (0.0%) | 0 (0.0%) |
| Total | 0 (0.0%) | 0 (0.0%) |
Income Below Poverty Among Married-Couple vs Single-Parent Households in Paxtonville
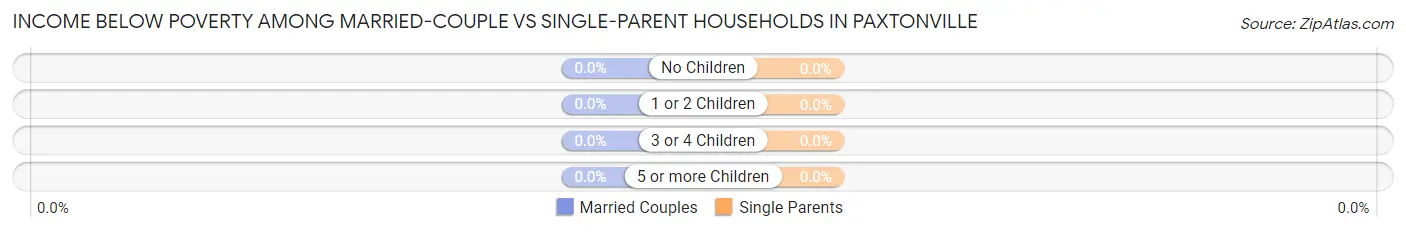
| Children | Married-Couple Families | Single-Parent Households |
| No Children | 0 (0.0%) | 0 (0.0%) |
| 1 or 2 Children | 0 (0.0%) | 0 (0.0%) |
| 3 or 4 Children | 0 (0.0%) | 0 (0.0%) |
| 5 or more Children | 0 (0.0%) | 0 (0.0%) |
| Total | 0 (0.0%) | 0 (0.0%) |
Employment Characteristics in Paxtonville
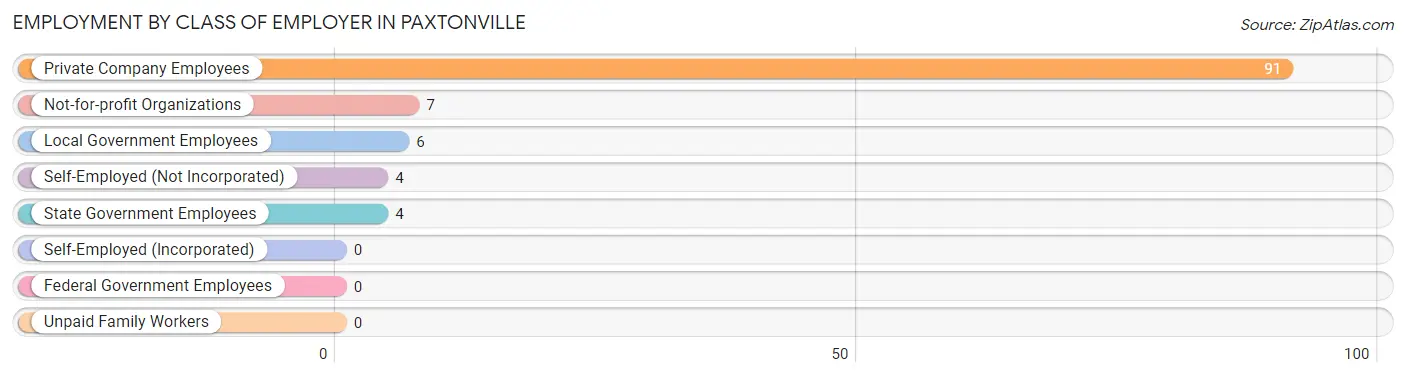
Employment by Class of Employer in Paxtonville
Among the 112 employed individuals in Paxtonville, private company employees (91 | 81.2%), not-for-profit organizations (7 | 6.2%), and local government employees (6 | 5.4%) make up the most common classes of employment.
| Employer Class | # Employees | % Employees |
| Private Company Employees | 91 | 81.2% |
| Self-Employed (Incorporated) | 0 | 0.0% |
| Self-Employed (Not Incorporated) | 4 | 3.6% |
| Not-for-profit Organizations | 7 | 6.2% |
| Local Government Employees | 6 | 5.4% |
| State Government Employees | 4 | 3.6% |
| Federal Government Employees | 0 | 0.0% |
| Unpaid Family Workers | 0 | 0.0% |
| Total | 112 | 100.0% |
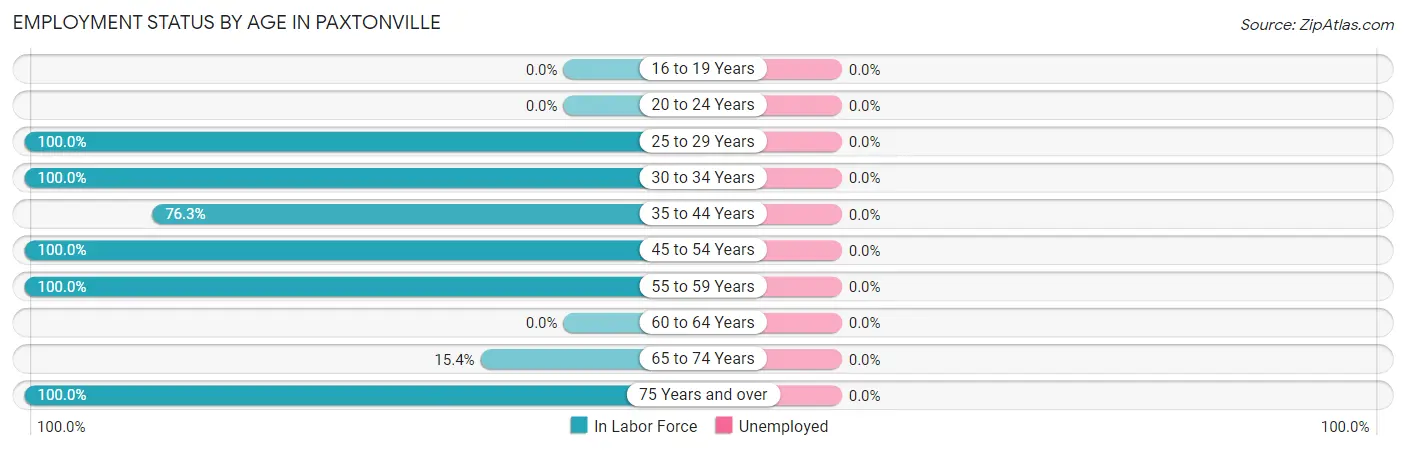
Employment Status by Age in Paxtonville
| Age Bracket | In Labor Force | Unemployed |
| 16 to 19 Years | 0 (0.0%) | 0 (0.0%) |
| 20 to 24 Years | 0 (0.0%) | 0 (0.0%) |
| 25 to 29 Years | 4 (100.0%) | 0 (0.0%) |
| 30 to 34 Years | 3 (100.0%) | 0 (0.0%) |
| 35 to 44 Years | 58 (76.3%) | 0 (0.0%) |
| 45 to 54 Years | 18 (100.0%) | 0 (0.0%) |
| 55 to 59 Years | 20 (100.0%) | 0 (0.0%) |
| 60 to 64 Years | 0 (0.0%) | 0 (0.0%) |
| 65 to 74 Years | 4 (15.4%) | 0 (0.0%) |
| 75 Years and over | 5 (100.0%) | 0 (0.0%) |
| Total | 112 (73.7%) | 0 (0.0%) |
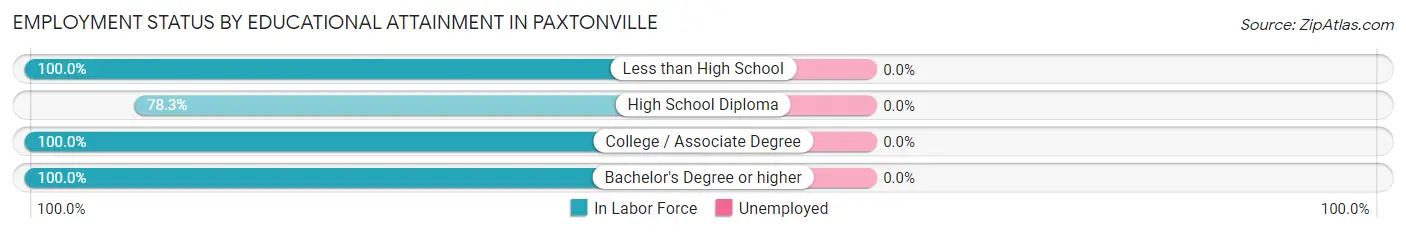
Employment Status by Educational Attainment in Paxtonville
| Educational Attainment | In Labor Force | Unemployed |
| Less than High School | 27 (100.0%) | 0 (0.0%) |
| High School Diploma | 65 (78.3%) | 0 (0.0%) |
| College / Associate Degree | 9 (100.0%) | 0 (0.0%) |
| Bachelor's Degree or higher | 2 (100.0%) | 0 (0.0%) |
| Total | 103 (85.1%) | 0 (0.0%) |
Employment Occupations by Sex in Paxtonville
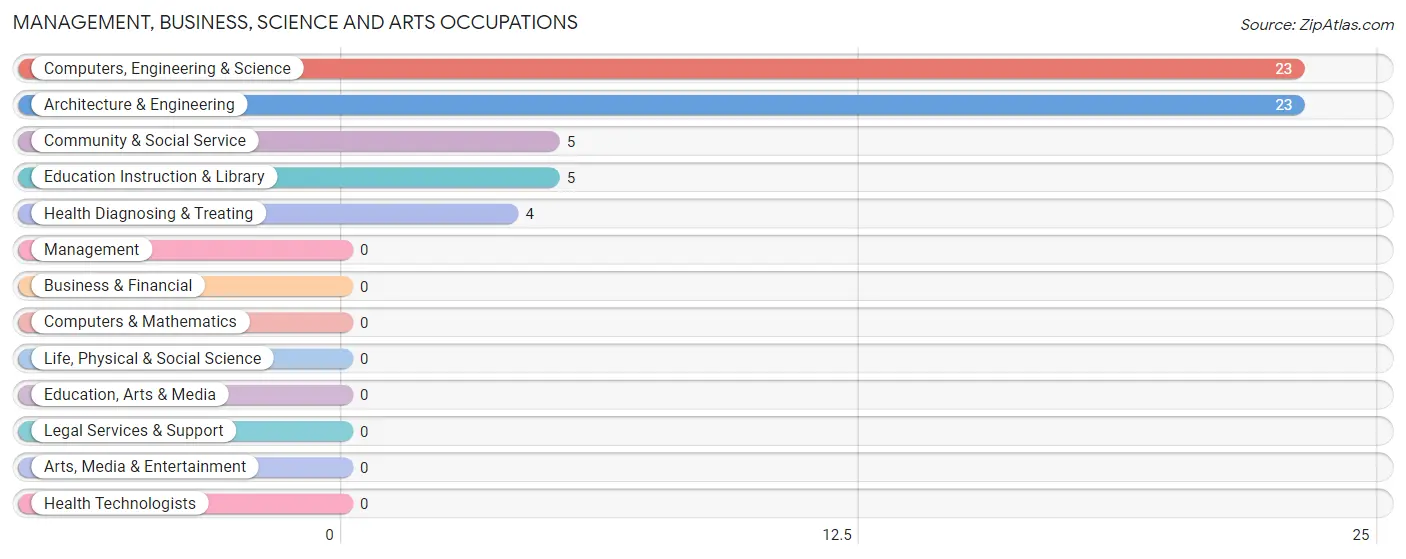
Management, Business, Science and Arts Occupations
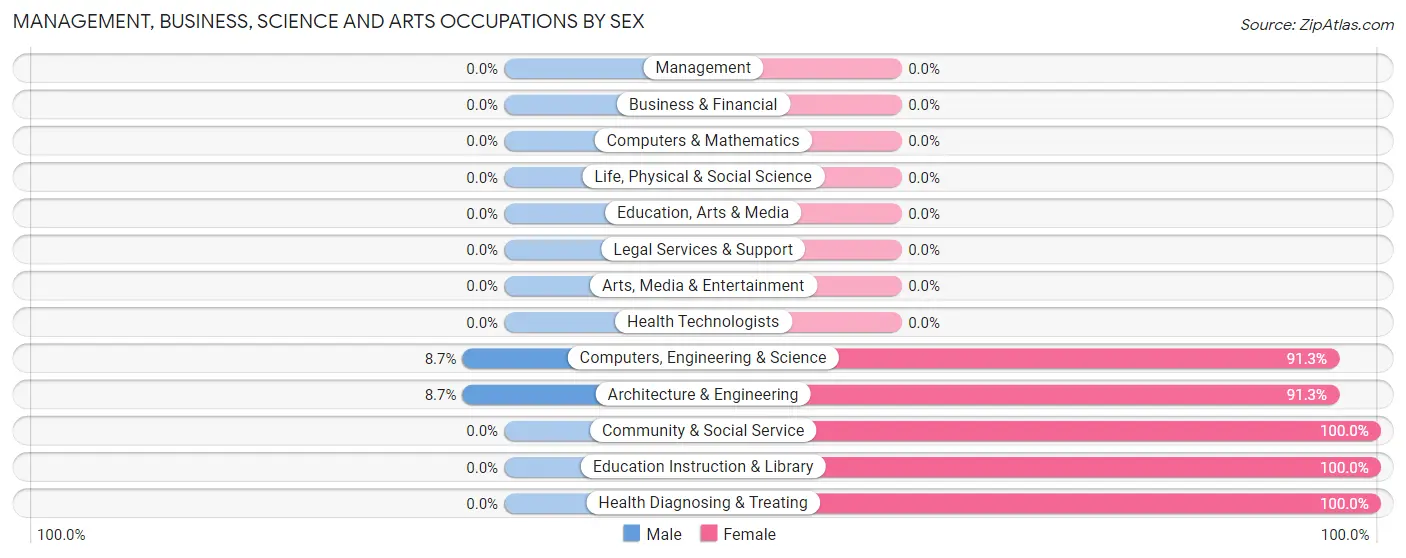
The most common Management, Business, Science and Arts occupations in Paxtonville are Computers, Engineering & Science (23 | 20.5%), Architecture & Engineering (23 | 20.5%), Community & Social Service (5 | 4.5%), Education Instruction & Library (5 | 4.5%), and Health Diagnosing & Treating (4 | 3.6%).
Management, Business, Science and Arts Occupations by Sex
Within the Management, Business, Science and Arts occupations in Paxtonville, the most male-oriented occupations are Computers, Engineering & Science (8.7%), and Architecture & Engineering (8.7%), while the most female-oriented occupations are Community & Social Service (100.0%), Education Instruction & Library (100.0%), and Health Diagnosing & Treating (100.0%).
| Occupation | Male | Female |
| Management | 0 (0.0%) | 0 (0.0%) |
| Business & Financial | 0 (0.0%) | 0 (0.0%) |
| Computers, Engineering & Science | 2 (8.7%) | 21 (91.3%) |
| Computers & Mathematics | 0 (0.0%) | 0 (0.0%) |
| Architecture & Engineering | 2 (8.7%) | 21 (91.3%) |
| Life, Physical & Social Science | 0 (0.0%) | 0 (0.0%) |
| Community & Social Service | 0 (0.0%) | 5 (100.0%) |
| Education, Arts & Media | 0 (0.0%) | 0 (0.0%) |
| Legal Services & Support | 0 (0.0%) | 0 (0.0%) |
| Education Instruction & Library | 0 (0.0%) | 5 (100.0%) |
| Arts, Media & Entertainment | 0 (0.0%) | 0 (0.0%) |
| Health Diagnosing & Treating | 0 (0.0%) | 4 (100.0%) |
| Health Technologists | 0 (0.0%) | 0 (0.0%) |
| Total (Category) | 2 (6.2%) | 30 (93.8%) |
| Total (Overall) | 69 (61.6%) | 43 (38.4%) |
Services Occupations
The most common Services occupations in Paxtonville are , and Food Preparation & Serving (5 | 4.5%).
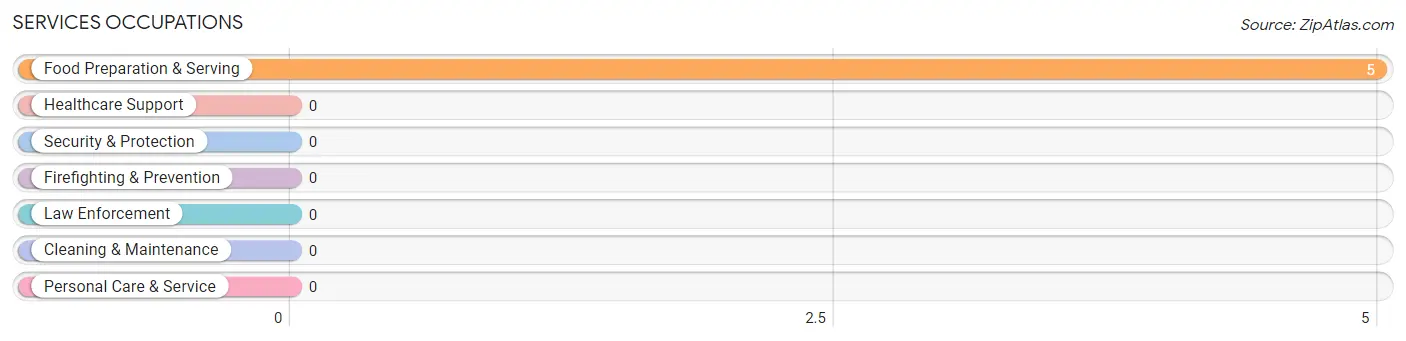
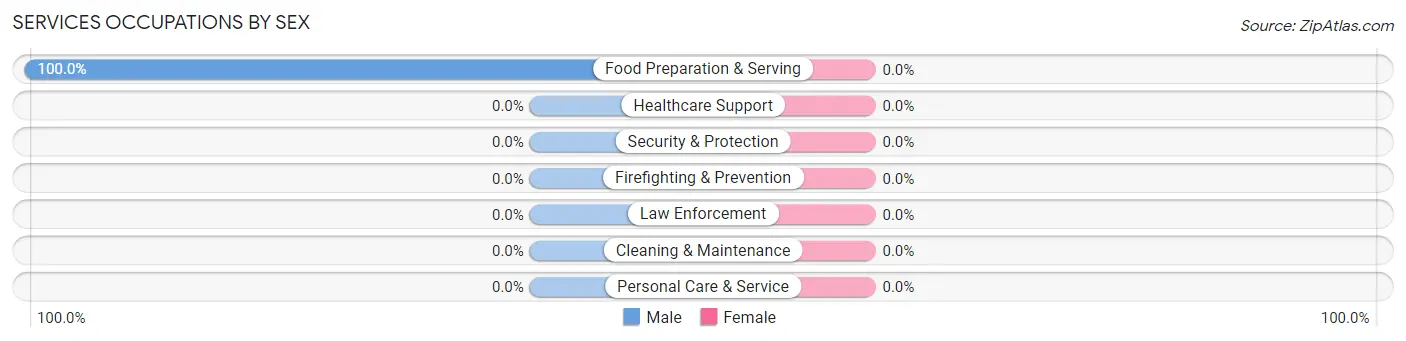
Services Occupations by Sex
| Occupation | Male | Female |
| Healthcare Support | 0 (0.0%) | 0 (0.0%) |
| Security & Protection | 0 (0.0%) | 0 (0.0%) |
| Firefighting & Prevention | 0 (0.0%) | 0 (0.0%) |
| Law Enforcement | 0 (0.0%) | 0 (0.0%) |
| Food Preparation & Serving | 5 (100.0%) | 0 (0.0%) |
| Cleaning & Maintenance | 0 (0.0%) | 0 (0.0%) |
| Personal Care & Service | 0 (0.0%) | 0 (0.0%) |
| Total (Category) | 5 (100.0%) | 0 (0.0%) |
| Total (Overall) | 69 (61.6%) | 43 (38.4%) |
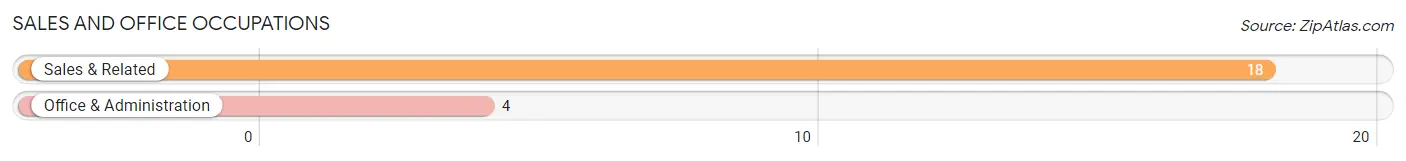
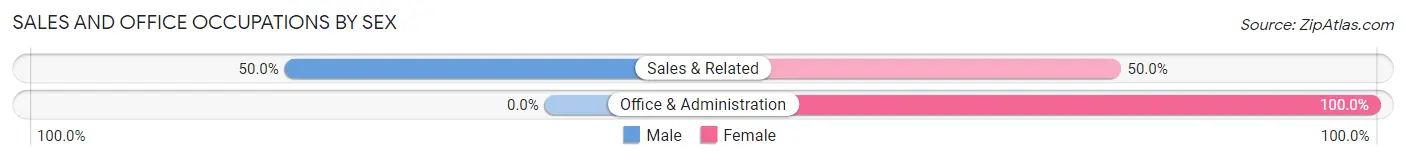
Sales and Office Occupations
The most common Sales and Office occupations in Paxtonville are Sales & Related (18 | 16.1%), and Office & Administration (4 | 3.6%).
Sales and Office Occupations by Sex
| Occupation | Male | Female |
| Sales & Related | 9 (50.0%) | 9 (50.0%) |
| Office & Administration | 0 (0.0%) | 4 (100.0%) |
| Total (Category) | 9 (40.9%) | 13 (59.1%) |
| Total (Overall) | 69 (61.6%) | 43 (38.4%) |
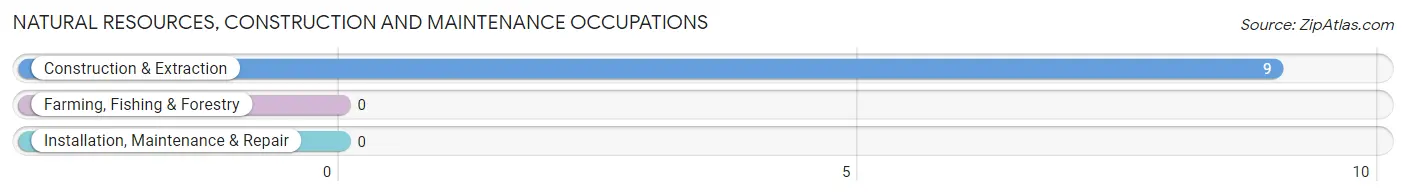
Natural Resources, Construction and Maintenance Occupations
The most common Natural Resources, Construction and Maintenance occupations in Paxtonville are , and Construction & Extraction (9 | 8.0%).
Natural Resources, Construction and Maintenance Occupations by Sex
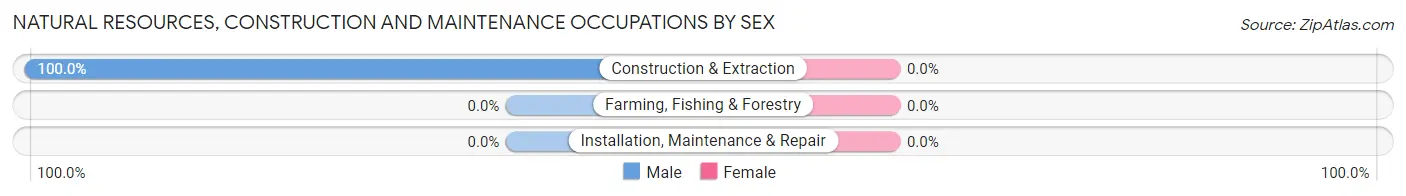
| Occupation | Male | Female |
| Farming, Fishing & Forestry | 0 (0.0%) | 0 (0.0%) |
| Construction & Extraction | 9 (100.0%) | 0 (0.0%) |
| Installation, Maintenance & Repair | 0 (0.0%) | 0 (0.0%) |
| Total (Category) | 9 (100.0%) | 0 (0.0%) |
| Total (Overall) | 69 (61.6%) | 43 (38.4%) |
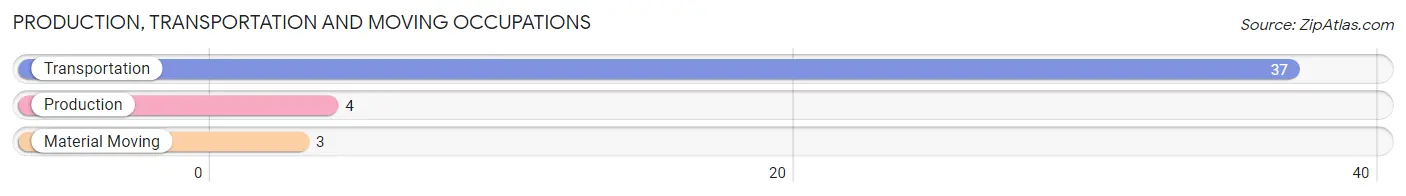
Production, Transportation and Moving Occupations
The most common Production, Transportation and Moving occupations in Paxtonville are Transportation (37 | 33.0%), Production (4 | 3.6%), and Material Moving (3 | 2.7%).
Production, Transportation and Moving Occupations by Sex
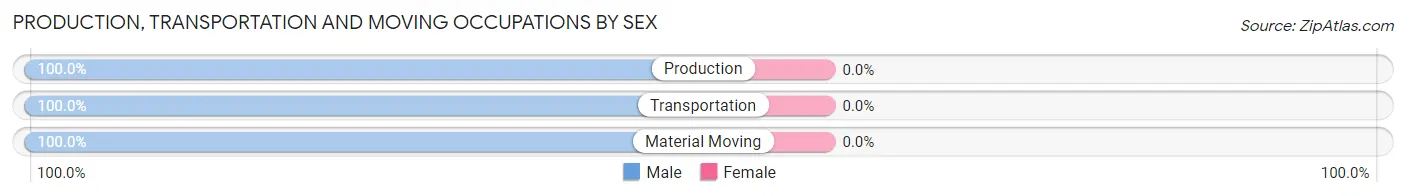
| Occupation | Male | Female |
| Production | 4 (100.0%) | 0 (0.0%) |
| Transportation | 37 (100.0%) | 0 (0.0%) |
| Material Moving | 3 (100.0%) | 0 (0.0%) |
| Total (Category) | 44 (100.0%) | 0 (0.0%) |
| Total (Overall) | 69 (61.6%) | 43 (38.4%) |
Employment Industries by Sex in Paxtonville
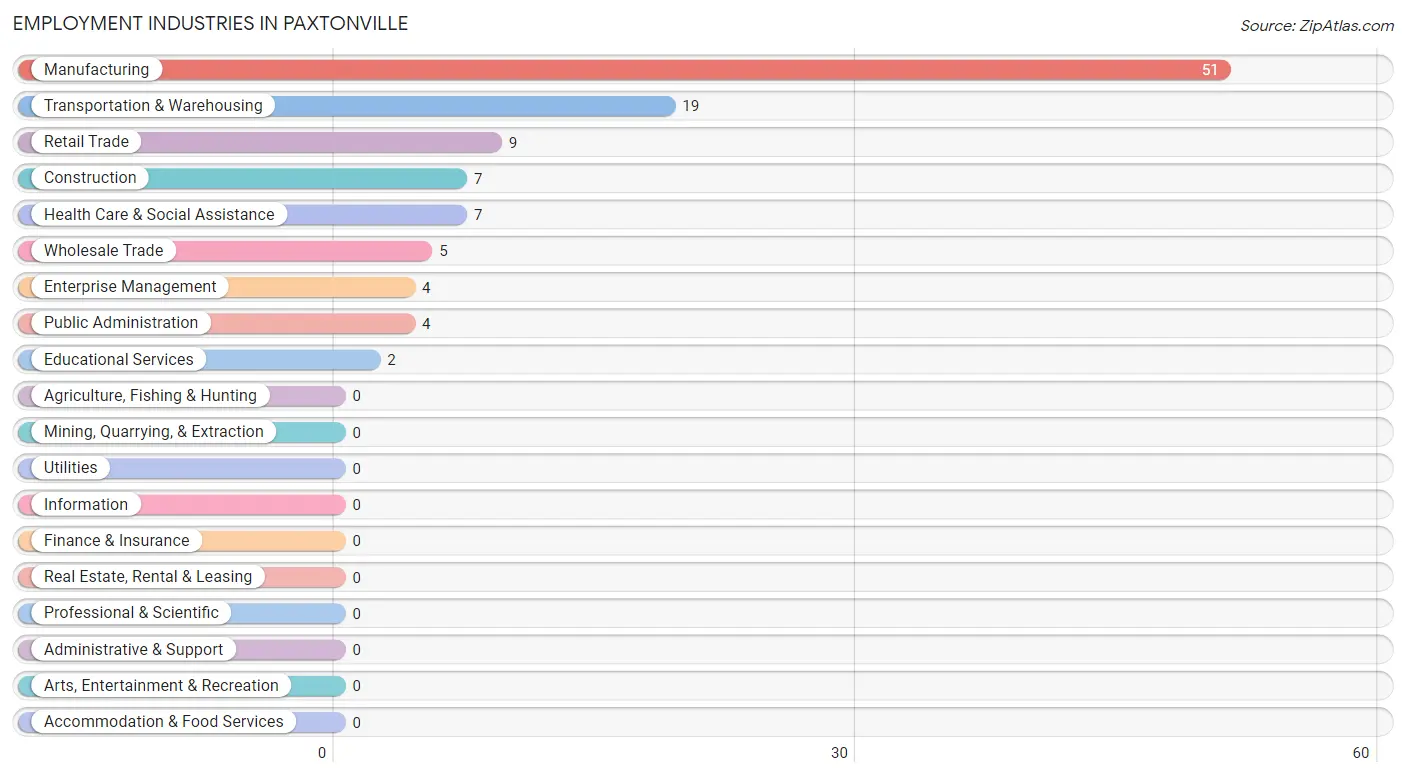
Employment Industries in Paxtonville
The major employment industries in Paxtonville include Manufacturing (51 | 45.5%), Transportation & Warehousing (19 | 17.0%), Retail Trade (9 | 8.0%), Construction (7 | 6.2%), and Health Care & Social Assistance (7 | 6.2%).
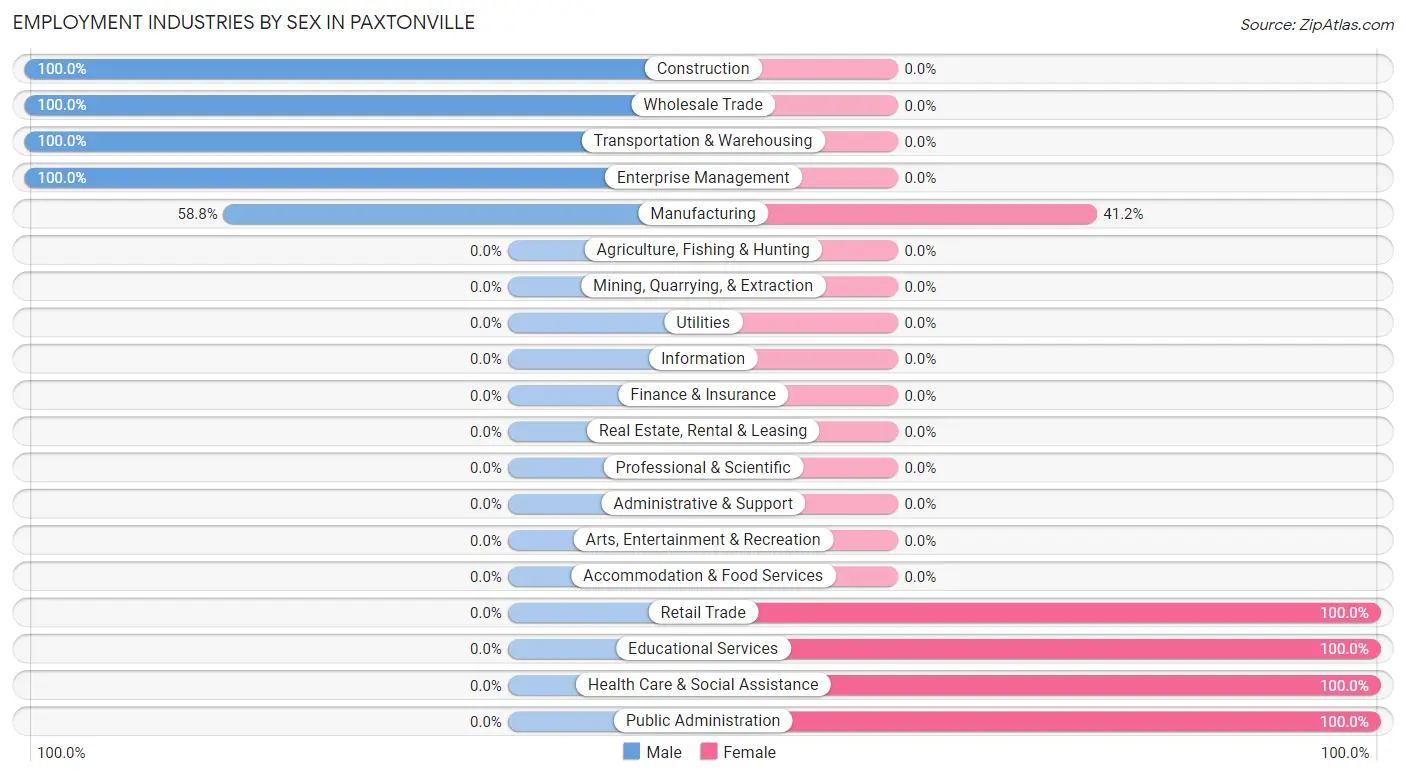
Employment Industries by Sex in Paxtonville
The Paxtonville industries that see more men than women are Construction (100.0%), Wholesale Trade (100.0%), and Transportation & Warehousing (100.0%), whereas the industries that tend to have a higher number of women are Retail Trade (100.0%), Educational Services (100.0%), and Health Care & Social Assistance (100.0%).
| Industry | Male | Female |
| Agriculture, Fishing & Hunting | 0 (0.0%) | 0 (0.0%) |
| Mining, Quarrying, & Extraction | 0 (0.0%) | 0 (0.0%) |
| Construction | 7 (100.0%) | 0 (0.0%) |
| Manufacturing | 30 (58.8%) | 21 (41.2%) |
| Wholesale Trade | 5 (100.0%) | 0 (0.0%) |
| Retail Trade | 0 (0.0%) | 9 (100.0%) |
| Transportation & Warehousing | 19 (100.0%) | 0 (0.0%) |
| Utilities | 0 (0.0%) | 0 (0.0%) |
| Information | 0 (0.0%) | 0 (0.0%) |
| Finance & Insurance | 0 (0.0%) | 0 (0.0%) |
| Real Estate, Rental & Leasing | 0 (0.0%) | 0 (0.0%) |
| Professional & Scientific | 0 (0.0%) | 0 (0.0%) |
| Enterprise Management | 4 (100.0%) | 0 (0.0%) |
| Administrative & Support | 0 (0.0%) | 0 (0.0%) |
| Educational Services | 0 (0.0%) | 2 (100.0%) |
| Health Care & Social Assistance | 0 (0.0%) | 7 (100.0%) |
| Arts, Entertainment & Recreation | 0 (0.0%) | 0 (0.0%) |
| Accommodation & Food Services | 0 (0.0%) | 0 (0.0%) |
| Public Administration | 0 (0.0%) | 4 (100.0%) |
| Total | 69 (61.6%) | 43 (38.4%) |
Education in Paxtonville
School Enrollment in Paxtonville
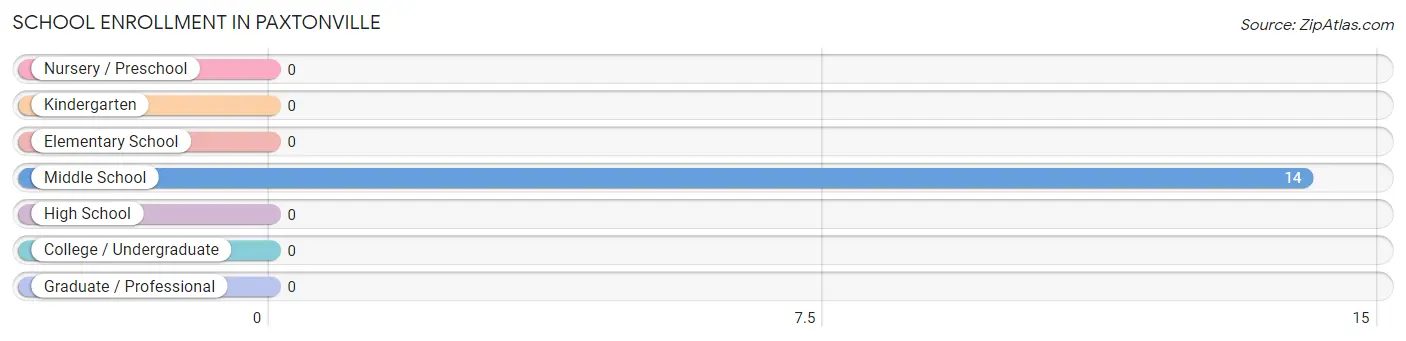
| School Level | # Students | % Students |
| Nursery / Preschool | 0 | 0.0% |
| Kindergarten | 0 | 0.0% |
| Elementary School | 0 | 0.0% |
| Middle School | 14 | 100.0% |
| High School | 0 | 0.0% |
| College / Undergraduate | 0 | 0.0% |
| Graduate / Professional | 0 | 0.0% |
| Total | 14 | 100.0% |
School Enrollment by Age by Funding Source in Paxtonville
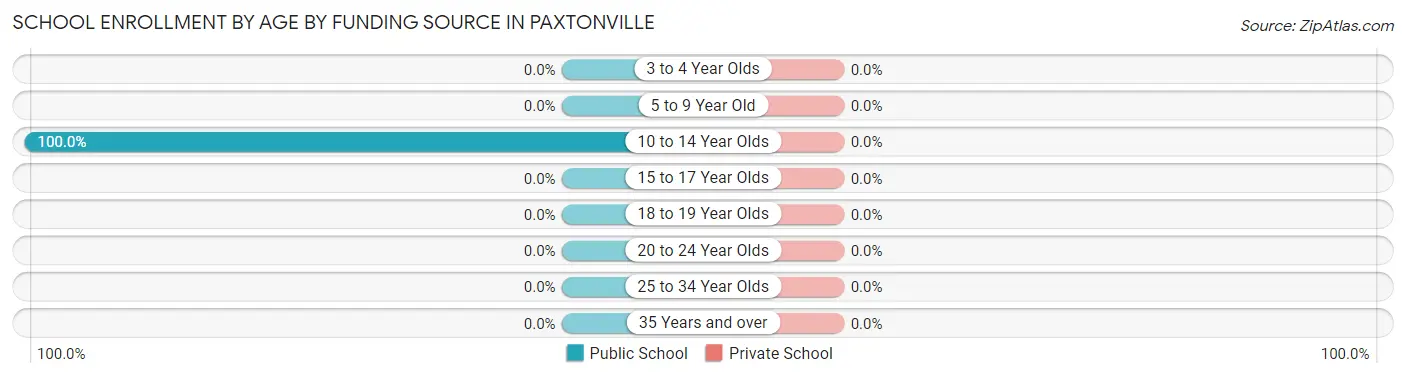
| Age Bracket | Public School | Private School |
| 3 to 4 Year Olds | 0 (0.0%) | 0 (0.0%) |
| 5 to 9 Year Old | 0 (0.0%) | 0 (0.0%) |
| 10 to 14 Year Olds | 14 (100.0%) | 0 (0.0%) |
| 15 to 17 Year Olds | 0 (0.0%) | 0 (0.0%) |
| 18 to 19 Year Olds | 0 (0.0%) | 0 (0.0%) |
| 20 to 24 Year Olds | 0 (0.0%) | 0 (0.0%) |
| 25 to 34 Year Olds | 0 (0.0%) | 0 (0.0%) |
| 35 Years and over | 0 (0.0%) | 0 (0.0%) |
| Total | 14 (100.0%) | 0 (0.0%) |
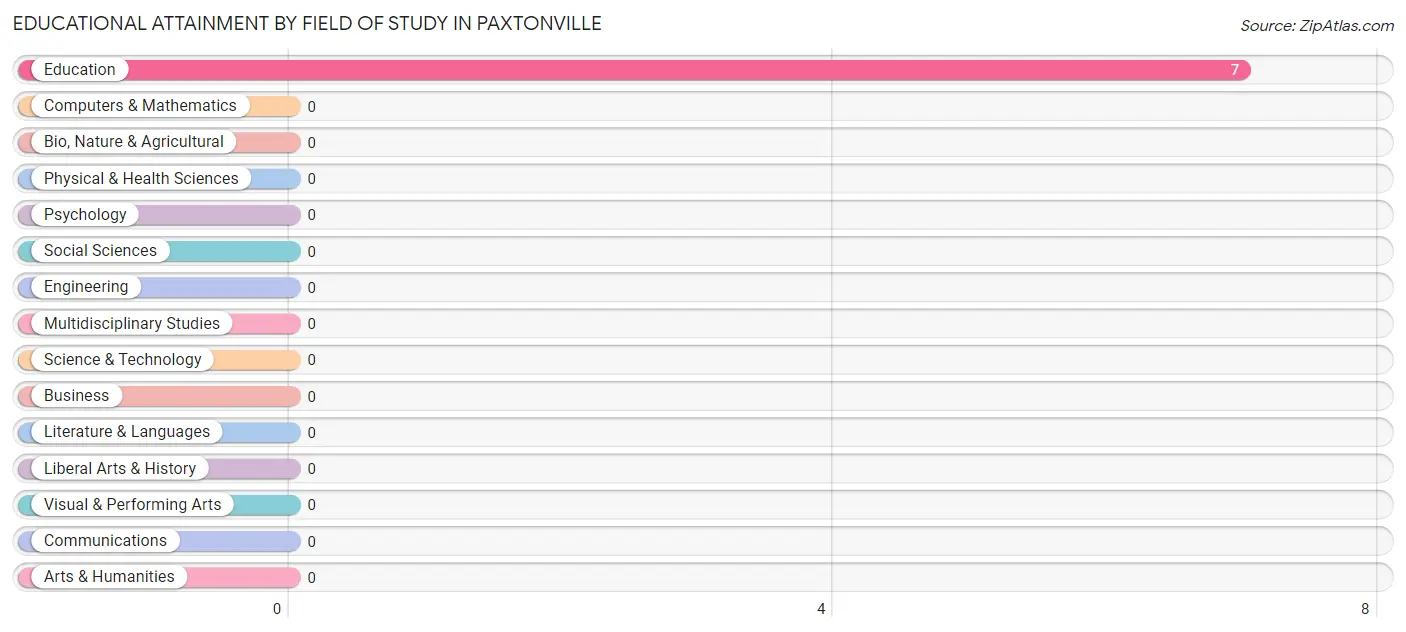
Educational Attainment by Field of Study in Paxtonville
, and education (7 | 100.0%) are the most common fields of study among 7 individuals in Paxtonville who have obtained a bachelor's degree or higher.
| Field of Study | # Graduates | % Graduates |
| Computers & Mathematics | 0 | 0.0% |
| Bio, Nature & Agricultural | 0 | 0.0% |
| Physical & Health Sciences | 0 | 0.0% |
| Psychology | 0 | 0.0% |
| Social Sciences | 0 | 0.0% |
| Engineering | 0 | 0.0% |
| Multidisciplinary Studies | 0 | 0.0% |
| Science & Technology | 0 | 0.0% |
| Business | 0 | 0.0% |
| Education | 7 | 100.0% |
| Literature & Languages | 0 | 0.0% |
| Liberal Arts & History | 0 | 0.0% |
| Visual & Performing Arts | 0 | 0.0% |
| Communications | 0 | 0.0% |
| Arts & Humanities | 0 | 0.0% |
| Total | 7 | 100.0% |
Transportation & Commute in Paxtonville
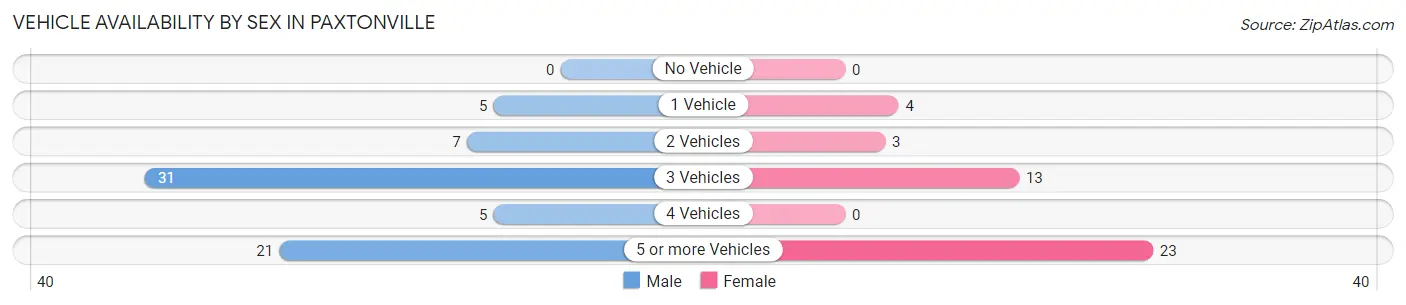
Vehicle Availability by Sex in Paxtonville
The most prevalent vehicle ownership categories in Paxtonville are males with 3 vehicles (31, accounting for 44.9%) and females with 3 vehicles (13, making up 72.1%).
| Vehicles Available | Male | Female |
| No Vehicle | 0 (0.0%) | 0 (0.0%) |
| 1 Vehicle | 5 (7.2%) | 4 (9.3%) |
| 2 Vehicles | 7 (10.1%) | 3 (7.0%) |
| 3 Vehicles | 31 (44.9%) | 13 (30.2%) |
| 4 Vehicles | 5 (7.2%) | 0 (0.0%) |
| 5 or more Vehicles | 21 (30.4%) | 23 (53.5%) |
| Total | 69 (100.0%) | 43 (100.0%) |
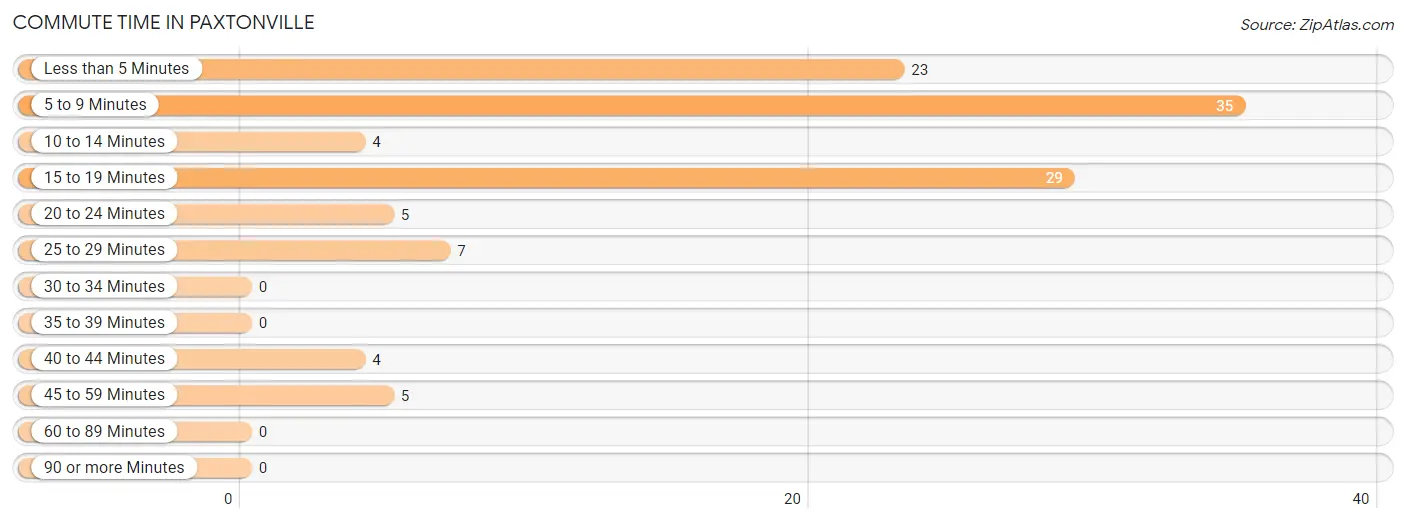
Commute Time in Paxtonville
The most frequently occuring commute durations in Paxtonville are 5 to 9 minutes (35 commuters, 31.2%), 15 to 19 minutes (29 commuters, 25.9%), and less than 5 minutes (23 commuters, 20.5%).
| Commute Time | # Commuters | % Commuters |
| Less than 5 Minutes | 23 | 20.5% |
| 5 to 9 Minutes | 35 | 31.2% |
| 10 to 14 Minutes | 4 | 3.6% |
| 15 to 19 Minutes | 29 | 25.9% |
| 20 to 24 Minutes | 5 | 4.5% |
| 25 to 29 Minutes | 7 | 6.2% |
| 30 to 34 Minutes | 0 | 0.0% |
| 35 to 39 Minutes | 0 | 0.0% |
| 40 to 44 Minutes | 4 | 3.6% |
| 45 to 59 Minutes | 5 | 4.5% |
| 60 to 89 Minutes | 0 | 0.0% |
| 90 or more Minutes | 0 | 0.0% |
Commute Time by Sex in Paxtonville
The most common commute times in Paxtonville are 15 to 19 minutes (29 commuters, 42.0%) for males and less than 5 minutes (23 commuters, 53.5%) for females.

| Commute Time | Male | Female |
| Less than 5 Minutes | 0 (0.0%) | 23 (53.5%) |
| 5 to 9 Minutes | 26 (37.7%) | 9 (20.9%) |
| 10 to 14 Minutes | 4 (5.8%) | 0 (0.0%) |
| 15 to 19 Minutes | 29 (42.0%) | 0 (0.0%) |
| 20 to 24 Minutes | 5 (7.2%) | 0 (0.0%) |
| 25 to 29 Minutes | 0 (0.0%) | 7 (16.3%) |
| 30 to 34 Minutes | 0 (0.0%) | 0 (0.0%) |
| 35 to 39 Minutes | 0 (0.0%) | 0 (0.0%) |
| 40 to 44 Minutes | 0 (0.0%) | 4 (9.3%) |
| 45 to 59 Minutes | 5 (7.2%) | 0 (0.0%) |
| 60 to 89 Minutes | 0 (0.0%) | 0 (0.0%) |
| 90 or more Minutes | 0 (0.0%) | 0 (0.0%) |
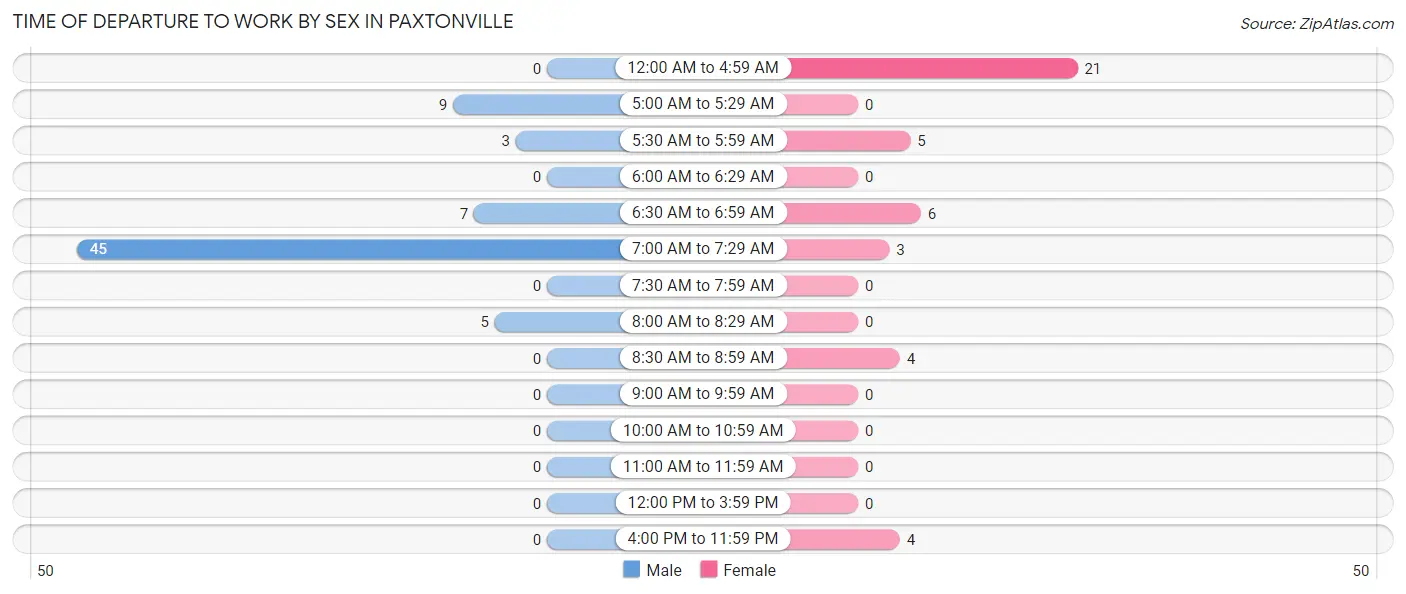
Time of Departure to Work by Sex in Paxtonville
The most frequent times of departure to work in Paxtonville are 7:00 AM to 7:29 AM (45, 65.2%) for males and 12:00 AM to 4:59 AM (21, 48.8%) for females.
| Time of Departure | Male | Female |
| 12:00 AM to 4:59 AM | 0 (0.0%) | 21 (48.8%) |
| 5:00 AM to 5:29 AM | 9 (13.0%) | 0 (0.0%) |
| 5:30 AM to 5:59 AM | 3 (4.3%) | 5 (11.6%) |
| 6:00 AM to 6:29 AM | 0 (0.0%) | 0 (0.0%) |
| 6:30 AM to 6:59 AM | 7 (10.1%) | 6 (14.0%) |
| 7:00 AM to 7:29 AM | 45 (65.2%) | 3 (7.0%) |
| 7:30 AM to 7:59 AM | 0 (0.0%) | 0 (0.0%) |
| 8:00 AM to 8:29 AM | 5 (7.2%) | 0 (0.0%) |
| 8:30 AM to 8:59 AM | 0 (0.0%) | 4 (9.3%) |
| 9:00 AM to 9:59 AM | 0 (0.0%) | 0 (0.0%) |
| 10:00 AM to 10:59 AM | 0 (0.0%) | 0 (0.0%) |
| 11:00 AM to 11:59 AM | 0 (0.0%) | 0 (0.0%) |
| 12:00 PM to 3:59 PM | 0 (0.0%) | 0 (0.0%) |
| 4:00 PM to 11:59 PM | 0 (0.0%) | 4 (9.3%) |
| Total | 69 (100.0%) | 43 (100.0%) |
Housing Occupancy in Paxtonville
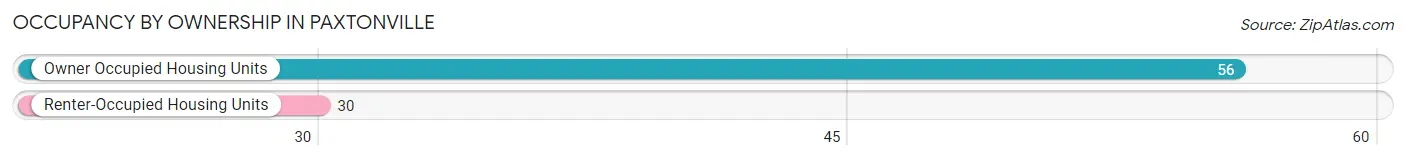
Occupancy by Ownership in Paxtonville
Of the total 86 dwellings in Paxtonville, owner-occupied units account for 56 (65.1%), while renter-occupied units make up 30 (34.9%).
| Occupancy | # Housing Units | % Housing Units |
| Owner Occupied Housing Units | 56 | 65.1% |
| Renter-Occupied Housing Units | 30 | 34.9% |
| Total Occupied Housing Units | 86 | 100.0% |
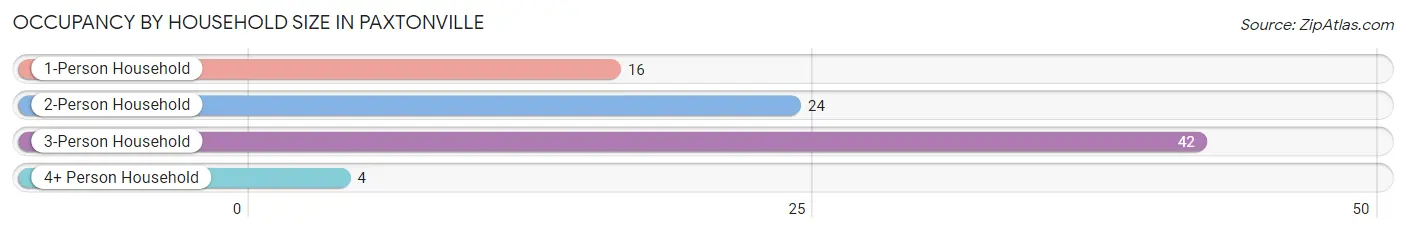
Occupancy by Household Size in Paxtonville
| Household Size | # Housing Units | % Housing Units |
| 1-Person Household | 16 | 18.6% |
| 2-Person Household | 24 | 27.9% |
| 3-Person Household | 42 | 48.8% |
| 4+ Person Household | 4 | 4.6% |
| Total Housing Units | 86 | 100.0% |
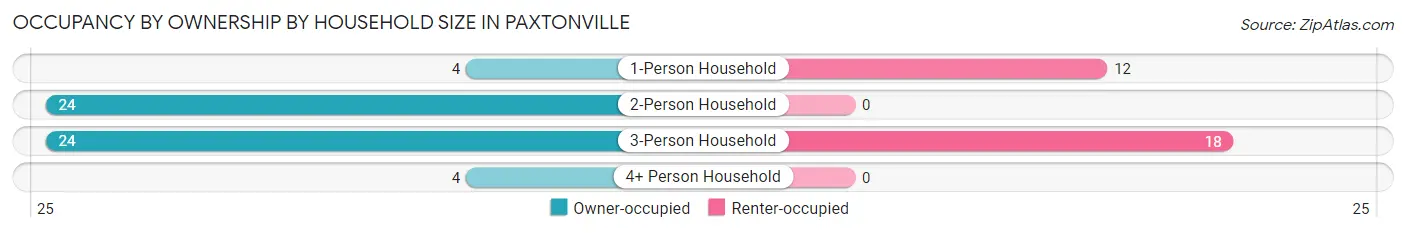
Occupancy by Ownership by Household Size in Paxtonville
| Household Size | Owner-occupied | Renter-occupied |
| 1-Person Household | 4 (25.0%) | 12 (75.0%) |
| 2-Person Household | 24 (100.0%) | 0 (0.0%) |
| 3-Person Household | 24 (57.1%) | 18 (42.9%) |
| 4+ Person Household | 4 (100.0%) | 0 (0.0%) |
| Total Housing Units | 56 (65.1%) | 30 (34.9%) |
Occupancy by Educational Attainment in Paxtonville
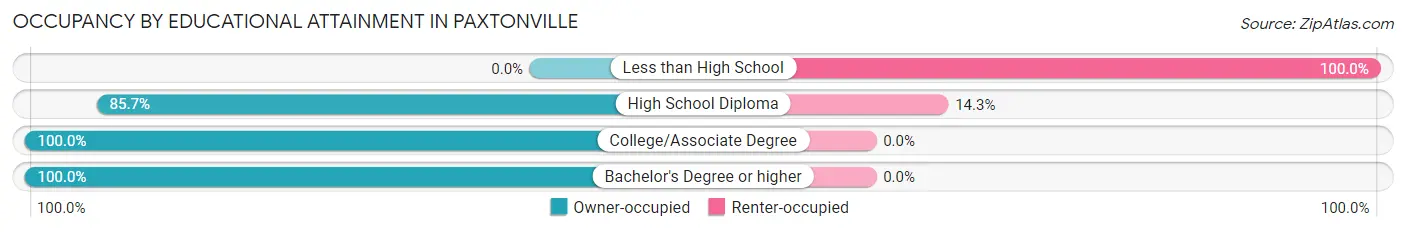
| Household Size | Owner-occupied | Renter-occupied |
| Less than High School | 0 (0.0%) | 23 (100.0%) |
| High School Diploma | 42 (85.7%) | 7 (14.3%) |
| College/Associate Degree | 7 (100.0%) | 0 (0.0%) |
| Bachelor's Degree or higher | 7 (100.0%) | 0 (0.0%) |
Occupancy by Age of Householder in Paxtonville
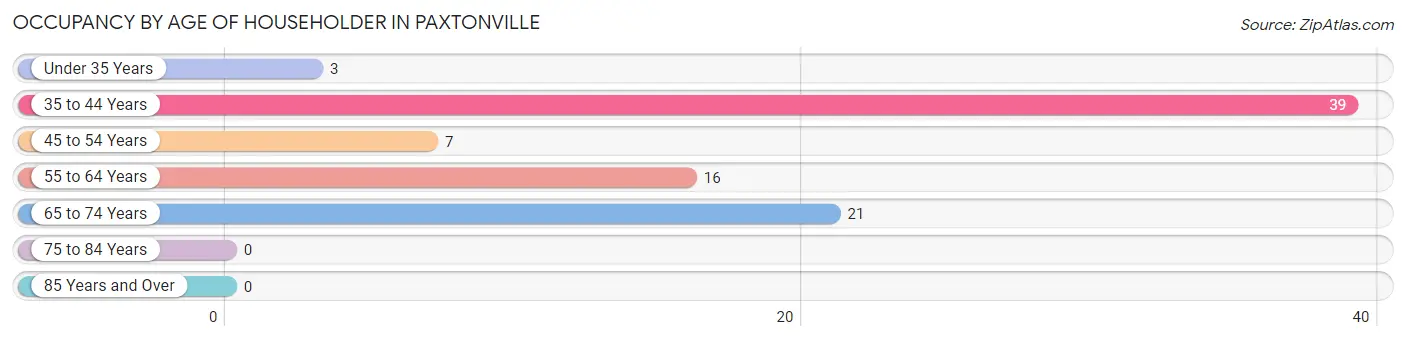
| Age Bracket | # Households | % Households |
| Under 35 Years | 3 | 3.5% |
| 35 to 44 Years | 39 | 45.4% |
| 45 to 54 Years | 7 | 8.1% |
| 55 to 64 Years | 16 | 18.6% |
| 65 to 74 Years | 21 | 24.4% |
| 75 to 84 Years | 0 | 0.0% |
| 85 Years and Over | 0 | 0.0% |
| Total | 86 | 100.0% |
Housing Finances in Paxtonville
Median Income by Occupancy in Paxtonville
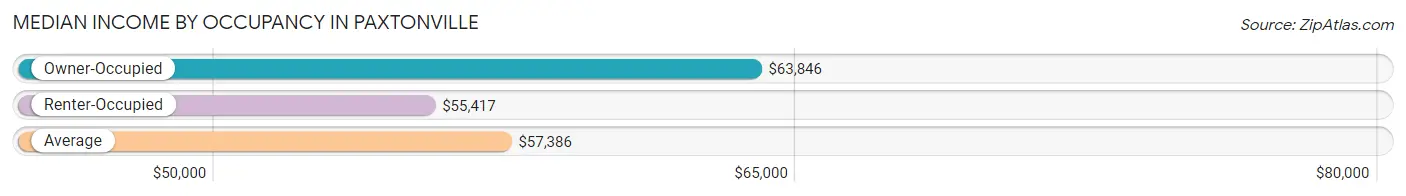
| Occupancy Type | # Households | Median Income |
| Owner-Occupied | 56 (65.1%) | $63,846 |
| Renter-Occupied | 30 (34.9%) | $55,417 |
| Average | 86 (100.0%) | $57,386 |
Occupancy by Householder Income Bracket in Paxtonville
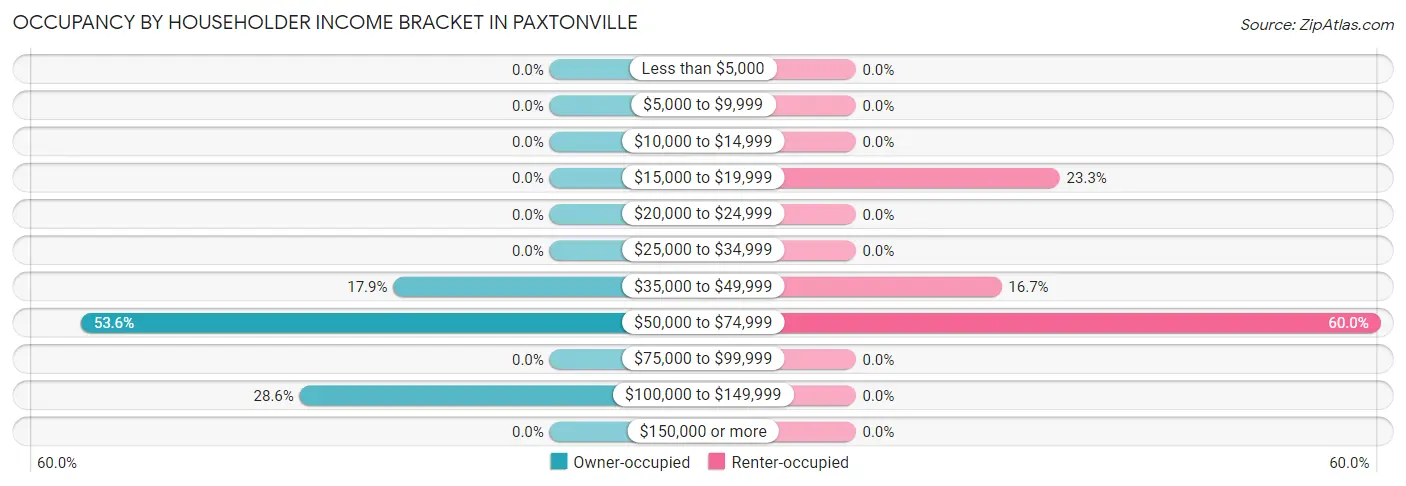
| Income Bracket | Owner-occupied | Renter-occupied |
| Less than $5,000 | 0 (0.0%) | 0 (0.0%) |
| $5,000 to $9,999 | 0 (0.0%) | 0 (0.0%) |
| $10,000 to $14,999 | 0 (0.0%) | 0 (0.0%) |
| $15,000 to $19,999 | 0 (0.0%) | 7 (23.3%) |
| $20,000 to $24,999 | 0 (0.0%) | 0 (0.0%) |
| $25,000 to $34,999 | 0 (0.0%) | 0 (0.0%) |
| $35,000 to $49,999 | 10 (17.9%) | 5 (16.7%) |
| $50,000 to $74,999 | 30 (53.6%) | 18 (60.0%) |
| $75,000 to $99,999 | 0 (0.0%) | 0 (0.0%) |
| $100,000 to $149,999 | 16 (28.6%) | 0 (0.0%) |
| $150,000 or more | 0 (0.0%) | 0 (0.0%) |
| Total | 56 (100.0%) | 30 (100.0%) |
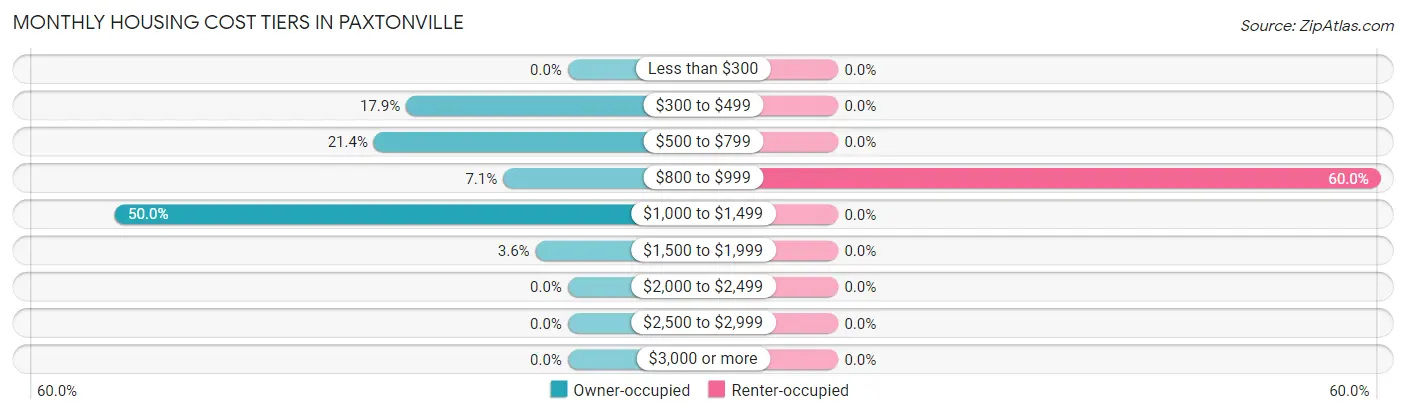
Monthly Housing Cost Tiers in Paxtonville
| Monthly Cost | Owner-occupied | Renter-occupied |
| Less than $300 | 0 (0.0%) | 0 (0.0%) |
| $300 to $499 | 10 (17.9%) | 0 (0.0%) |
| $500 to $799 | 12 (21.4%) | 0 (0.0%) |
| $800 to $999 | 4 (7.1%) | 18 (60.0%) |
| $1,000 to $1,499 | 28 (50.0%) | 0 (0.0%) |
| $1,500 to $1,999 | 2 (3.6%) | 0 (0.0%) |
| $2,000 to $2,499 | 0 (0.0%) | 0 (0.0%) |
| $2,500 to $2,999 | 0 (0.0%) | 0 (0.0%) |
| $3,000 or more | 0 (0.0%) | 0 (0.0%) |
| Total | 56 (100.0%) | 30 (100.0%) |
Physical Housing Characteristics in Paxtonville
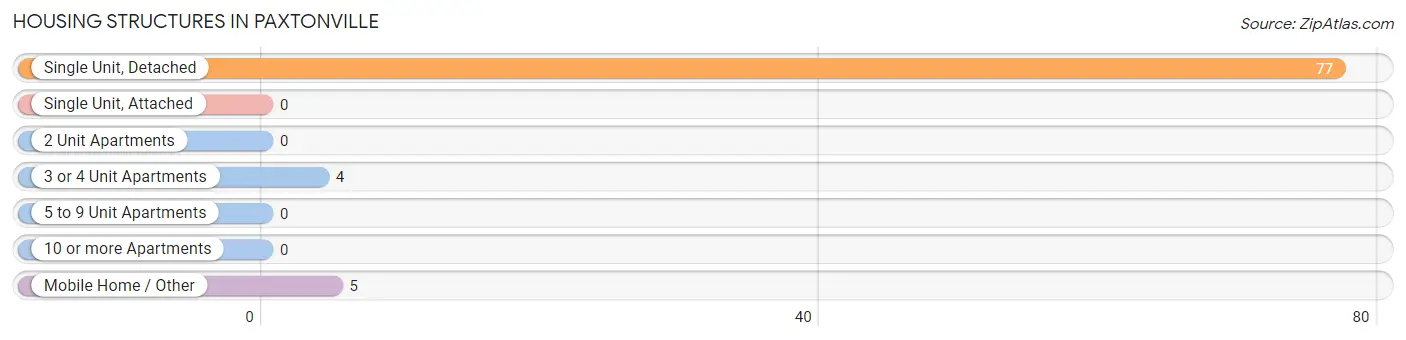
Housing Structures in Paxtonville
| Structure Type | # Housing Units | % Housing Units |
| Single Unit, Detached | 77 | 89.5% |
| Single Unit, Attached | 0 | 0.0% |
| 2 Unit Apartments | 0 | 0.0% |
| 3 or 4 Unit Apartments | 4 | 4.6% |
| 5 to 9 Unit Apartments | 0 | 0.0% |
| 10 or more Apartments | 0 | 0.0% |
| Mobile Home / Other | 5 | 5.8% |
| Total | 86 | 100.0% |
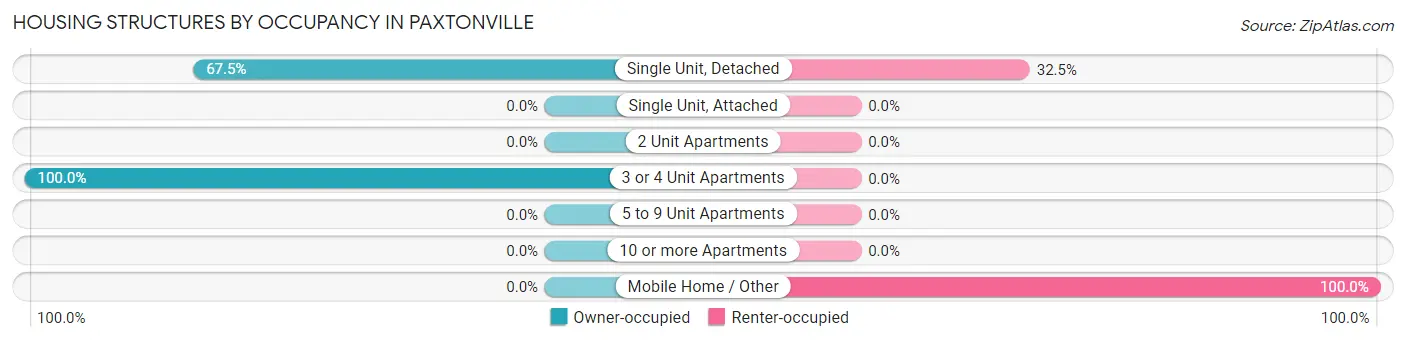
Housing Structures by Occupancy in Paxtonville
| Structure Type | Owner-occupied | Renter-occupied |
| Single Unit, Detached | 52 (67.5%) | 25 (32.5%) |
| Single Unit, Attached | 0 (0.0%) | 0 (0.0%) |
| 2 Unit Apartments | 0 (0.0%) | 0 (0.0%) |
| 3 or 4 Unit Apartments | 4 (100.0%) | 0 (0.0%) |
| 5 to 9 Unit Apartments | 0 (0.0%) | 0 (0.0%) |
| 10 or more Apartments | 0 (0.0%) | 0 (0.0%) |
| Mobile Home / Other | 0 (0.0%) | 5 (100.0%) |
| Total | 56 (65.1%) | 30 (34.9%) |
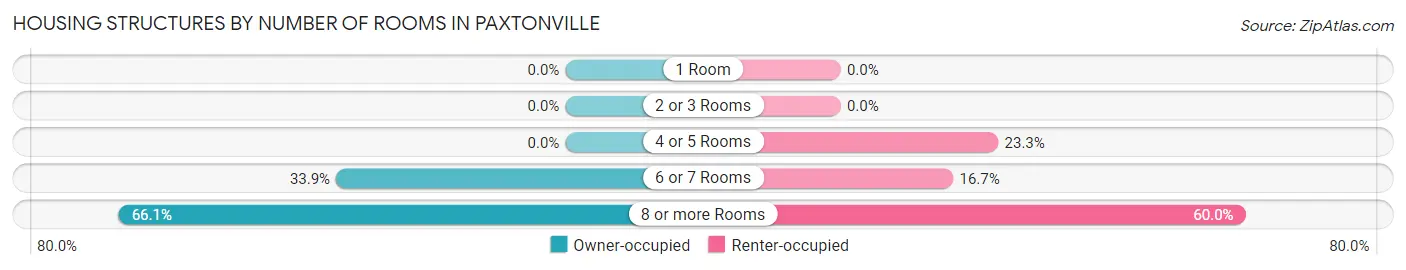
Housing Structures by Number of Rooms in Paxtonville
| Number of Rooms | Owner-occupied | Renter-occupied |
| 1 Room | 0 (0.0%) | 0 (0.0%) |
| 2 or 3 Rooms | 0 (0.0%) | 0 (0.0%) |
| 4 or 5 Rooms | 0 (0.0%) | 7 (23.3%) |
| 6 or 7 Rooms | 19 (33.9%) | 5 (16.7%) |
| 8 or more Rooms | 37 (66.1%) | 18 (60.0%) |
| Total | 56 (100.0%) | 30 (100.0%) |
Housing Structure by Heating Type in Paxtonville
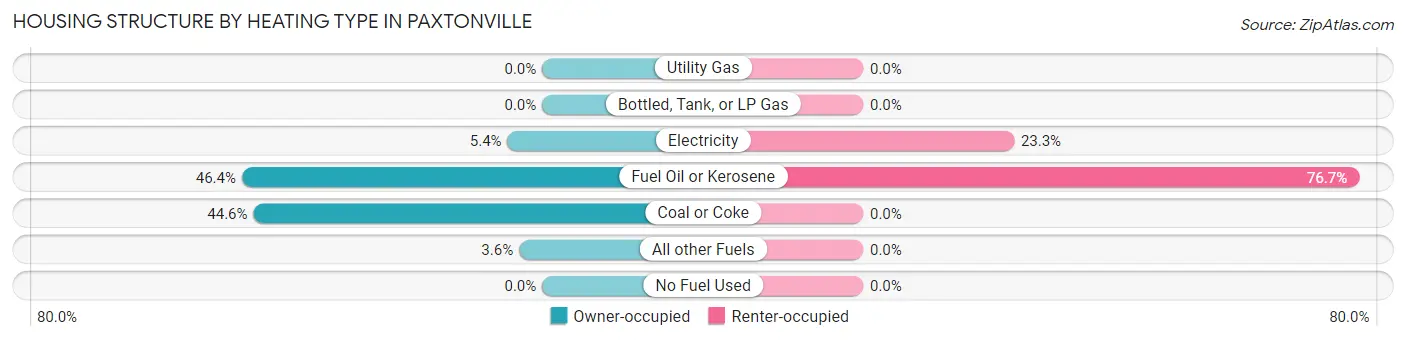
| Heating Type | Owner-occupied | Renter-occupied |
| Utility Gas | 0 (0.0%) | 0 (0.0%) |
| Bottled, Tank, or LP Gas | 0 (0.0%) | 0 (0.0%) |
| Electricity | 3 (5.4%) | 7 (23.3%) |
| Fuel Oil or Kerosene | 26 (46.4%) | 23 (76.7%) |
| Coal or Coke | 25 (44.6%) | 0 (0.0%) |
| All other Fuels | 2 (3.6%) | 0 (0.0%) |
| No Fuel Used | 0 (0.0%) | 0 (0.0%) |
| Total | 56 (100.0%) | 30 (100.0%) |
Household Vehicle Usage in Paxtonville
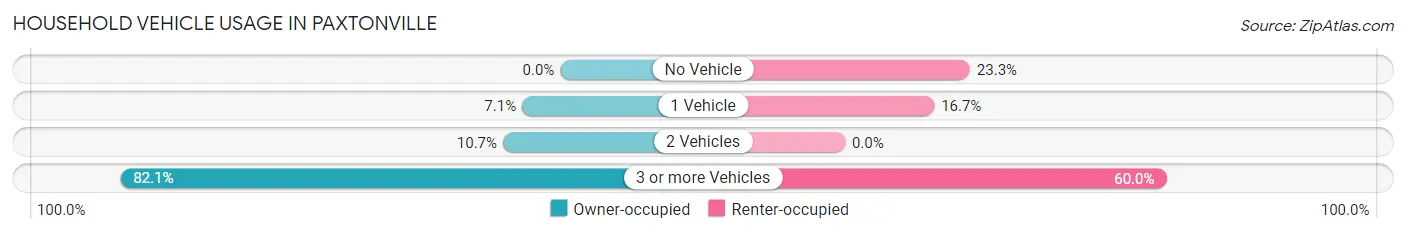
| Vehicles per Household | Owner-occupied | Renter-occupied |
| No Vehicle | 0 (0.0%) | 7 (23.3%) |
| 1 Vehicle | 4 (7.1%) | 5 (16.7%) |
| 2 Vehicles | 6 (10.7%) | 0 (0.0%) |
| 3 or more Vehicles | 46 (82.1%) | 18 (60.0%) |
| Total | 56 (100.0%) | 30 (100.0%) |
Real Estate & Mortgages in Paxtonville
Real Estate and Mortgage Overview in Paxtonville
| Characteristic | Without Mortgage | With Mortgage |
| Housing Units | 26 | 30 |
| Median Property Value | $143,800 | $184,500 |
| Median Household Income | $100,500 | $0 |
| Monthly Housing Costs | $650 | $0 |
| Real Estate Taxes | $1,444 | $0 |
Property Value by Mortgage Status in Paxtonville
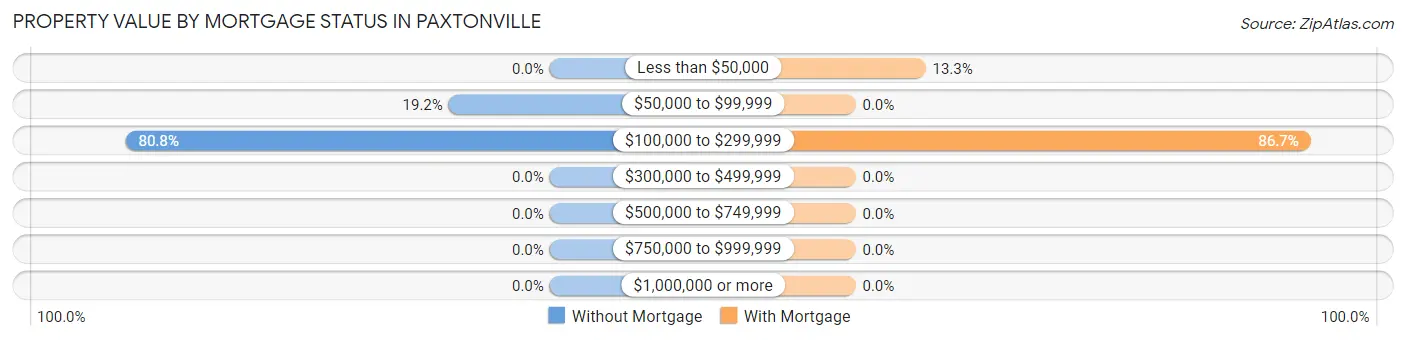
| Property Value | Without Mortgage | With Mortgage |
| Less than $50,000 | 0 (0.0%) | 4 (13.3%) |
| $50,000 to $99,999 | 5 (19.2%) | 0 (0.0%) |
| $100,000 to $299,999 | 21 (80.8%) | 26 (86.7%) |
| $300,000 to $499,999 | 0 (0.0%) | 0 (0.0%) |
| $500,000 to $749,999 | 0 (0.0%) | 0 (0.0%) |
| $750,000 to $999,999 | 0 (0.0%) | 0 (0.0%) |
| $1,000,000 or more | 0 (0.0%) | 0 (0.0%) |
| Total | 26 (100.0%) | 30 (100.0%) |
Household Income by Mortgage Status in Paxtonville
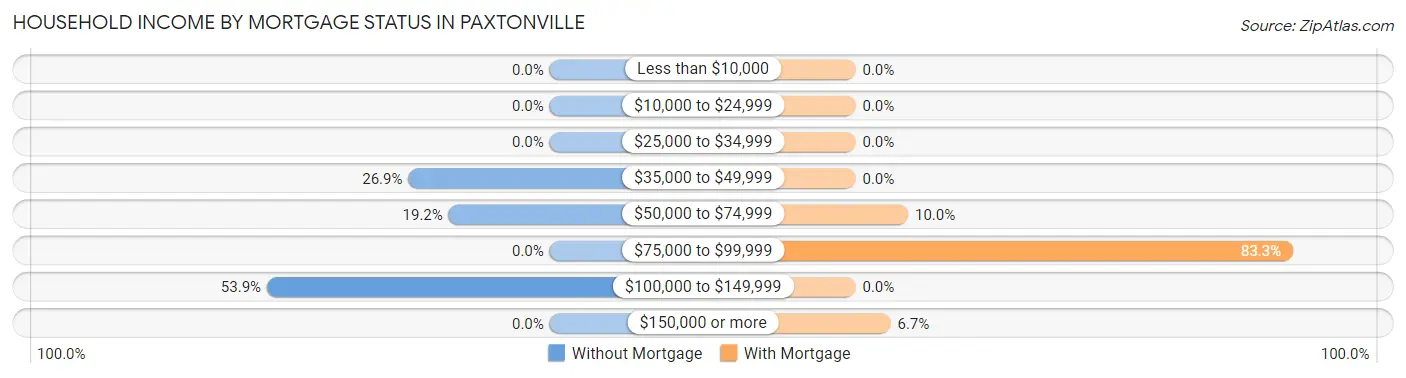
| Household Income | Without Mortgage | With Mortgage |
| Less than $10,000 | 0 (0.0%) | 0 (0.0%) |
| $10,000 to $24,999 | 0 (0.0%) | 0 (0.0%) |
| $25,000 to $34,999 | 0 (0.0%) | 0 (0.0%) |
| $35,000 to $49,999 | 7 (26.9%) | 0 (0.0%) |
| $50,000 to $74,999 | 5 (19.2%) | 3 (10.0%) |
| $75,000 to $99,999 | 0 (0.0%) | 25 (83.3%) |
| $100,000 to $149,999 | 14 (53.8%) | 0 (0.0%) |
| $150,000 or more | 0 (0.0%) | 2 (6.7%) |
| Total | 26 (100.0%) | 30 (100.0%) |
Property Value to Household Income Ratio in Paxtonville
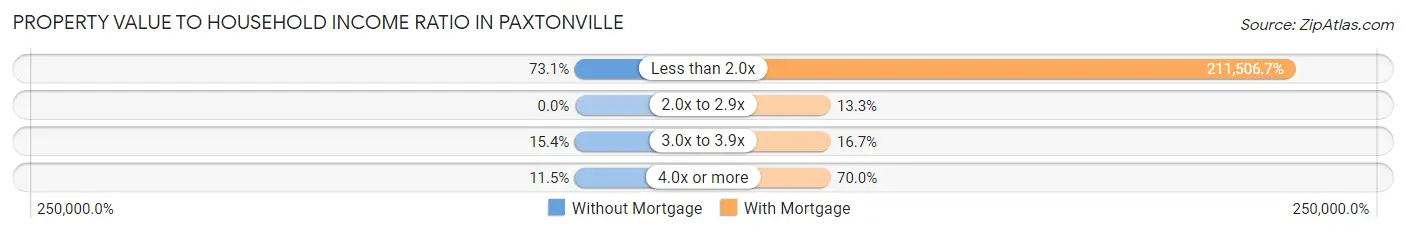
| Value-to-Income Ratio | Without Mortgage | With Mortgage |
| Less than 2.0x | 19 (73.1%) | 63,452 (211,506.7%) |
| 2.0x to 2.9x | 0 (0.0%) | 4 (13.3%) |
| 3.0x to 3.9x | 4 (15.4%) | 5 (16.7%) |
| 4.0x or more | 3 (11.5%) | 21 (70.0%) |
| Total | 26 (100.0%) | 30 (100.0%) |
Real Estate Taxes by Mortgage Status in Paxtonville
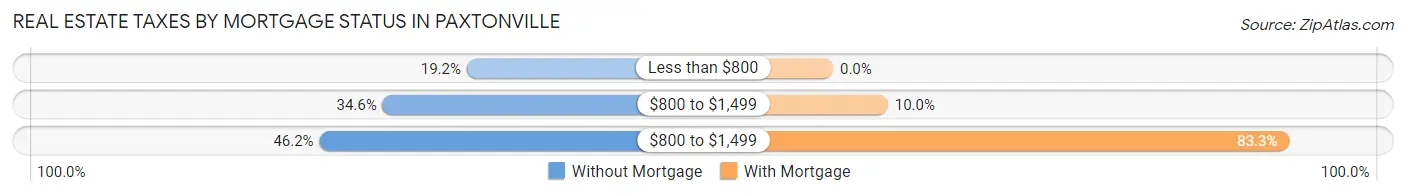
| Property Taxes | Without Mortgage | With Mortgage |
| Less than $800 | 5 (19.2%) | 0 (0.0%) |
| $800 to $1,499 | 9 (34.6%) | 3 (10.0%) |
| $800 to $1,499 | 12 (46.2%) | 25 (83.3%) |
| Total | 26 (100.0%) | 30 (100.0%) |
Health & Disability in Paxtonville
Health Insurance Coverage by Age in Paxtonville
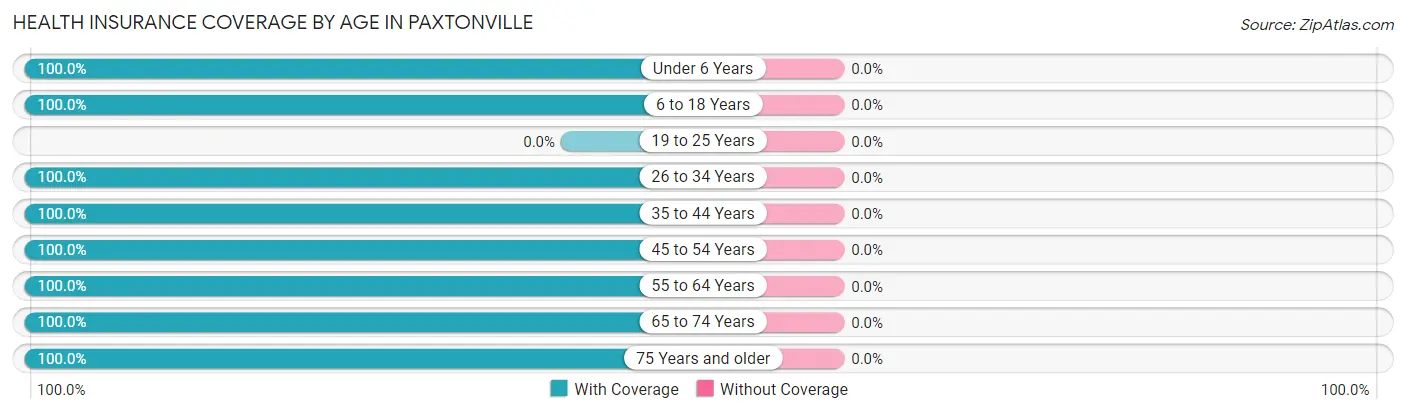
| Age Bracket | With Coverage | Without Coverage |
| Under 6 Years | 27 (100.0%) | 0 (0.0%) |
| 6 to 18 Years | 19 (100.0%) | 0 (0.0%) |
| 19 to 25 Years | 0 (0.0%) | 0 (0.0%) |
| 26 to 34 Years | 7 (100.0%) | 0 (0.0%) |
| 35 to 44 Years | 76 (100.0%) | 0 (0.0%) |
| 45 to 54 Years | 18 (100.0%) | 0 (0.0%) |
| 55 to 64 Years | 20 (100.0%) | 0 (0.0%) |
| 65 to 74 Years | 26 (100.0%) | 0 (0.0%) |
| 75 Years and older | 5 (100.0%) | 0 (0.0%) |
| Total | 198 (100.0%) | 0 (0.0%) |
Health Insurance Coverage by Citizenship Status in Paxtonville
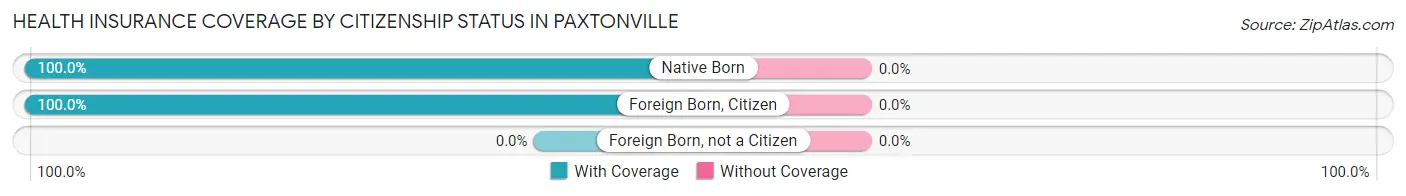
| Citizenship Status | With Coverage | Without Coverage |
| Native Born | 27 (100.0%) | 0 (0.0%) |
| Foreign Born, Citizen | 19 (100.0%) | 0 (0.0%) |
| Foreign Born, not a Citizen | 0 (0.0%) | 0 (0.0%) |
Health Insurance Coverage by Household Income in Paxtonville
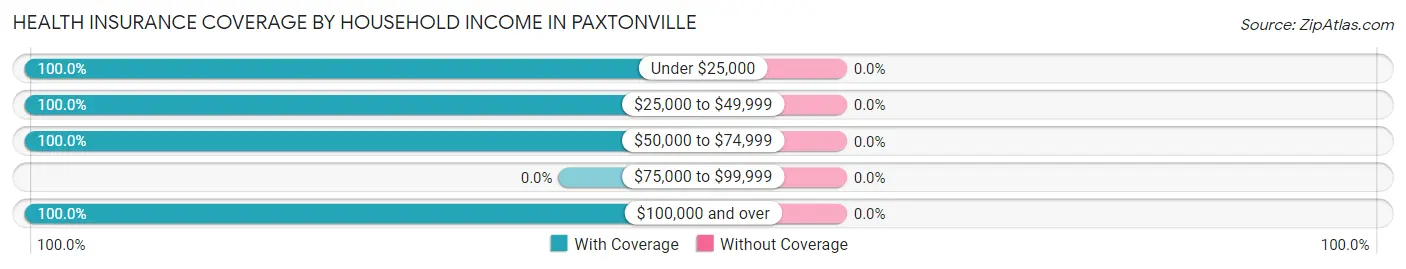
| Household Income | With Coverage | Without Coverage |
| Under $25,000 | 7 (100.0%) | 0 (0.0%) |
| $25,000 to $49,999 | 44 (100.0%) | 0 (0.0%) |
| $50,000 to $74,999 | 115 (100.0%) | 0 (0.0%) |
| $75,000 to $99,999 | 0 (0.0%) | 0 (0.0%) |
| $100,000 and over | 32 (100.0%) | 0 (0.0%) |
Public vs Private Health Insurance Coverage by Age in Paxtonville
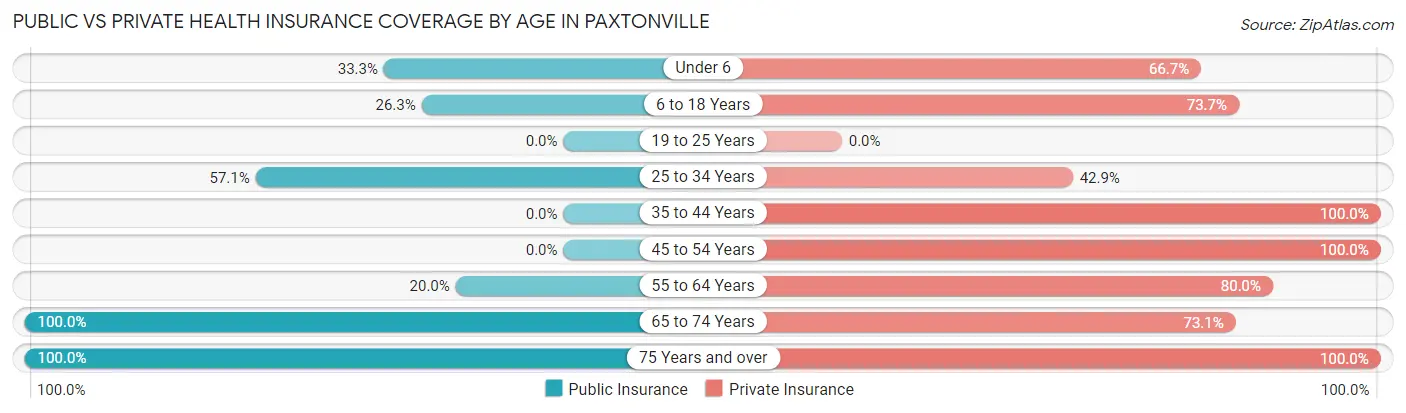
| Age Bracket | Public Insurance | Private Insurance |
| Under 6 | 9 (33.3%) | 18 (66.7%) |
| 6 to 18 Years | 5 (26.3%) | 14 (73.7%) |
| 19 to 25 Years | 0 (0.0%) | 0 (0.0%) |
| 25 to 34 Years | 4 (57.1%) | 3 (42.9%) |
| 35 to 44 Years | 0 (0.0%) | 76 (100.0%) |
| 45 to 54 Years | 0 (0.0%) | 18 (100.0%) |
| 55 to 64 Years | 4 (20.0%) | 16 (80.0%) |
| 65 to 74 Years | 26 (100.0%) | 19 (73.1%) |
| 75 Years and over | 5 (100.0%) | 5 (100.0%) |
| Total | 53 (26.8%) | 169 (85.4%) |
Disability Status by Sex by Age in Paxtonville
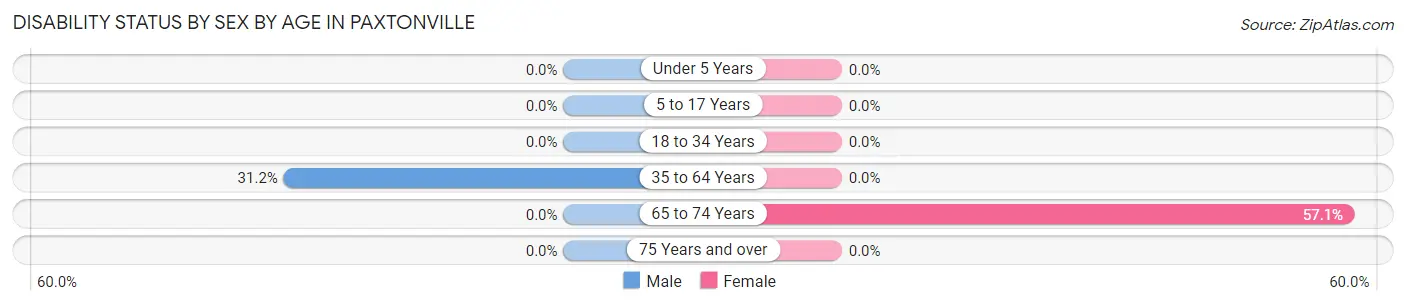
| Age Bracket | Male | Female |
| Under 5 Years | 0 (0.0%) | 0 (0.0%) |
| 5 to 17 Years | 0 (0.0%) | 0 (0.0%) |
| 18 to 34 Years | 0 (0.0%) | 0 (0.0%) |
| 35 to 64 Years | 19 (31.1%) | 0 (0.0%) |
| 65 to 74 Years | 0 (0.0%) | 12 (57.1%) |
| 75 Years and over | 0 (0.0%) | 0 (0.0%) |
Disability Class by Sex by Age in Paxtonville
Disability Class: Hearing Difficulty
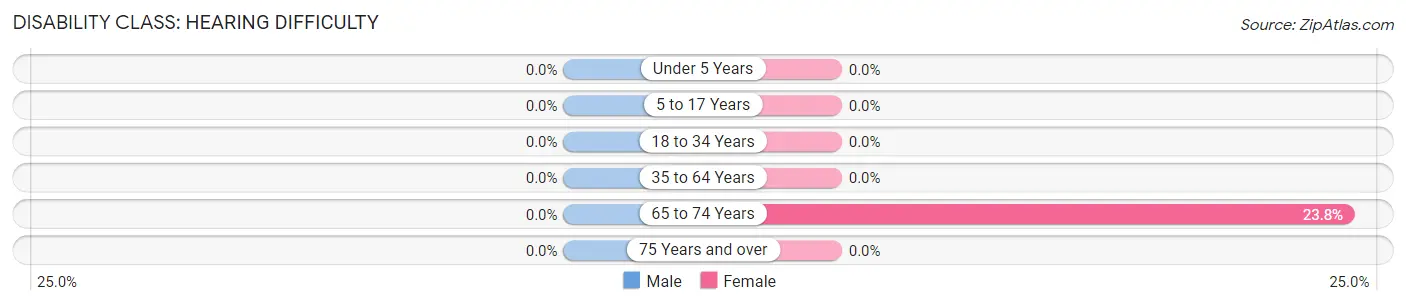
| Age Bracket | Male | Female |
| Under 5 Years | 0 (0.0%) | 0 (0.0%) |
| 5 to 17 Years | 0 (0.0%) | 0 (0.0%) |
| 18 to 34 Years | 0 (0.0%) | 0 (0.0%) |
| 35 to 64 Years | 0 (0.0%) | 0 (0.0%) |
| 65 to 74 Years | 0 (0.0%) | 5 (23.8%) |
| 75 Years and over | 0 (0.0%) | 0 (0.0%) |
Disability Class: Vision Difficulty
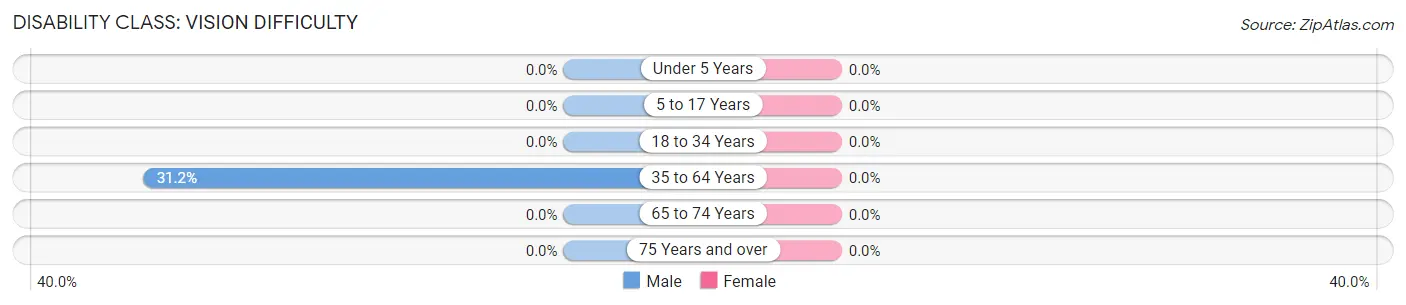
| Age Bracket | Male | Female |
| Under 5 Years | 0 (0.0%) | 0 (0.0%) |
| 5 to 17 Years | 0 (0.0%) | 0 (0.0%) |
| 18 to 34 Years | 0 (0.0%) | 0 (0.0%) |
| 35 to 64 Years | 19 (31.1%) | 0 (0.0%) |
| 65 to 74 Years | 0 (0.0%) | 0 (0.0%) |
| 75 Years and over | 0 (0.0%) | 0 (0.0%) |
Disability Class: Cognitive Difficulty
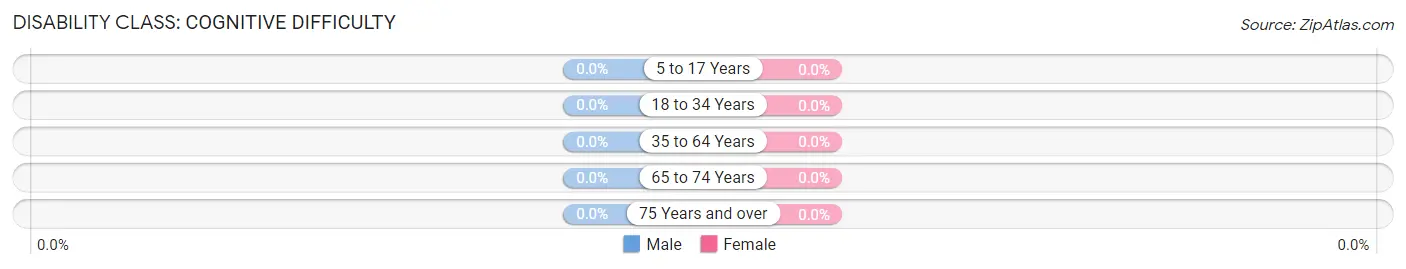
| Age Bracket | Male | Female |
| 5 to 17 Years | 0 (0.0%) | 0 (0.0%) |
| 18 to 34 Years | 0 (0.0%) | 0 (0.0%) |
| 35 to 64 Years | 0 (0.0%) | 0 (0.0%) |
| 65 to 74 Years | 0 (0.0%) | 0 (0.0%) |
| 75 Years and over | 0 (0.0%) | 0 (0.0%) |
Disability Class: Ambulatory Difficulty
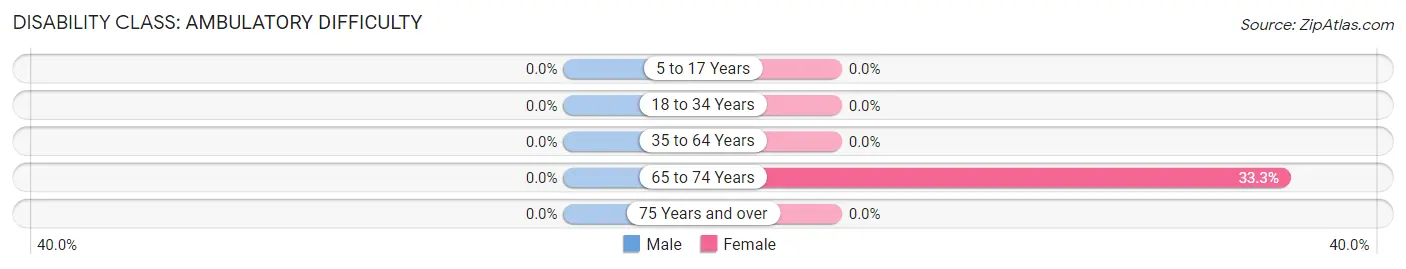
| Age Bracket | Male | Female |
| 5 to 17 Years | 0 (0.0%) | 0 (0.0%) |
| 18 to 34 Years | 0 (0.0%) | 0 (0.0%) |
| 35 to 64 Years | 0 (0.0%) | 0 (0.0%) |
| 65 to 74 Years | 0 (0.0%) | 7 (33.3%) |
| 75 Years and over | 0 (0.0%) | 0 (0.0%) |
Disability Class: Self-Care Difficulty

| Age Bracket | Male | Female |
| 5 to 17 Years | 0 (0.0%) | 0 (0.0%) |
| 18 to 34 Years | 0 (0.0%) | 0 (0.0%) |
| 35 to 64 Years | 0 (0.0%) | 0 (0.0%) |
| 65 to 74 Years | 0 (0.0%) | 0 (0.0%) |
| 75 Years and over | 0 (0.0%) | 0 (0.0%) |
Technology Access in Paxtonville
Computing Device Access in Paxtonville
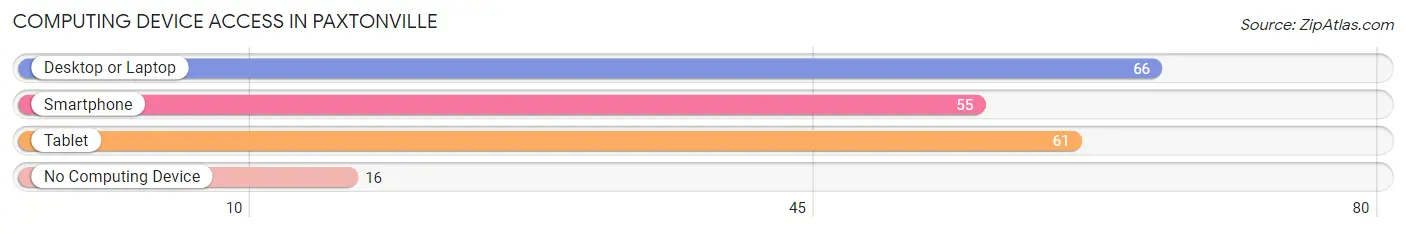
| Device Type | # Households | % Households |
| Desktop or Laptop | 66 | 76.7% |
| Smartphone | 55 | 63.9% |
| Tablet | 61 | 70.9% |
| No Computing Device | 16 | 18.6% |
| Total | 86 | 100.0% |
Internet Access in Paxtonville
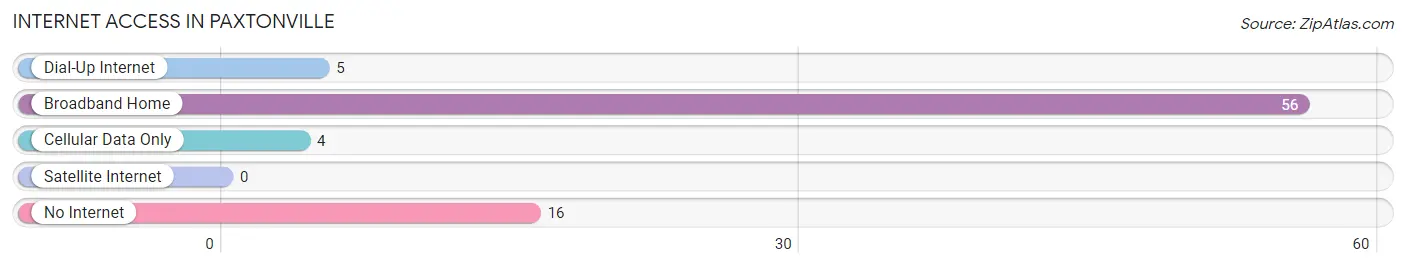
| Internet Type | # Households | % Households |
| Dial-Up Internet | 5 | 5.8% |
| Broadband Home | 56 | 65.1% |
| Cellular Data Only | 4 | 4.6% |
| Satellite Internet | 0 | 0.0% |
| No Internet | 16 | 18.6% |
| Total | 86 | 100.0% |
Paxtonville Summary
Paxtonville is a small unincorporated community located in Snyder County, Pennsylvania. It is situated in the western part of the county, approximately 8 miles south of Selinsgrove and 8 miles north of Middleburg. The population of Paxtonville was estimated to be around 500 in 2020.
History
Paxtonville was founded in 1817 by John Paxton, a Revolutionary War veteran. He purchased the land from the local Native Americans and named the settlement after himself. The town was originally a farming community, but it soon developed into a small industrial center. The first industry in Paxtonville was a sawmill, which was built in 1820. This was followed by a gristmill, a tannery, and a distillery.
In 1845, the Pennsylvania and Reading Railroad was built through Paxtonville, connecting it to the larger cities of Harrisburg and Reading. This allowed the town to become a stop on the railroad and to benefit from the increased trade and commerce that came with it.
In the late 19th century, Paxtonville was home to several factories, including a cigar factory, a furniture factory, and a brickyard. These industries provided employment for many of the town’s residents.
Geography
Paxtonville is located in the western part of Snyder County, Pennsylvania. It is situated in the Susquehanna River Valley, approximately 8 miles south of Selinsgrove and 8 miles north of Middleburg. The town is surrounded by rolling hills and farmland.
The climate in Paxtonville is humid continental, with hot summers and cold winters. The average temperature in the summer is around 75°F, while the average temperature in the winter is around 30°F.
Economy
The economy of Paxtonville is largely based on agriculture and tourism. The town is home to several farms, which produce a variety of crops, including corn, soybeans, and hay.
In addition, Paxtonville is a popular tourist destination. The town is home to several historic sites, including the Paxtonville Historic District, which is listed on the National Register of Historic Places. The district includes several 19th-century buildings, including the Paxton House, which was built in 1820.
The town also has several restaurants shops and other businesses that cater to tourists
Demographics
As of the 2010 census, the population of Paxtonville was estimated to be around 500. The racial makeup of the town was 97.2% White, 0.8% African American, 0.4% Native American, 0.2% Asian, and 1.4% from other races.
The median household income in Paxtonville was $41,250, and the median family income was $50,000. The per capita income was $20,000.
Conclusion
Paxtonville is a small unincorporated community located in Snyder County, Pennsylvania. It was founded in 1817 by John Paxton and has since developed into a small industrial center. The town is surrounded by rolling hills and farmland, and its economy is largely based on agriculture and tourism. The population of Paxtonville was estimated to be around 500 in 2020.
Common Questions
What is the Total Population of Paxtonville?
Total Population of Paxtonville is 198.
What is the Total Male Population of Paxtonville?
Total Male Population of Paxtonville is 87.
What is the Total Female Population of Paxtonville?
Total Female Population of Paxtonville is 111.
What is the Ratio of Males per 100 Females in Paxtonville?
There are 78.38 Males per 100 Females in Paxtonville.
What is the Ratio of Females per 100 Males in Paxtonville?
There are 127.59 Females per 100 Males in Paxtonville.
What is the Median Population Age in Paxtonville?
Median Population Age in Paxtonville is 36.4 Years.
What is the Average Family Size in Paxtonville
Average Family Size in Paxtonville is 2.6 People.
What is the Average Household Size in Paxtonville
Average Household Size in Paxtonville is 2.3 People.
What is Per Capita Income in Paxtonville?
Per Capita income in Paxtonville is $28,009.
What is the Median Family Income in Paxtonville?
Median Family Income in Paxtonville is $63,173.
What is the Median Household income in Paxtonville?
Median Household Income in Paxtonville is $57,386.
What is Income or Wage Gap in Paxtonville?
Income or Wage Gap in Paxtonville is 2.0%.
Women in Paxtonville earn 98.0 cents for every dollar earned by a man.
What is Inequality or Gini Index in Paxtonville?
Inequality or Gini Index in Paxtonville is 0.23.
How Large is the Labor Force in Paxtonville?
There are 112 People in the Labor Forcein in Paxtonville.
What is the Percentage of People in the Labor Force in Paxtonville?
73.7% of People are in the Labor Force in Paxtonville.