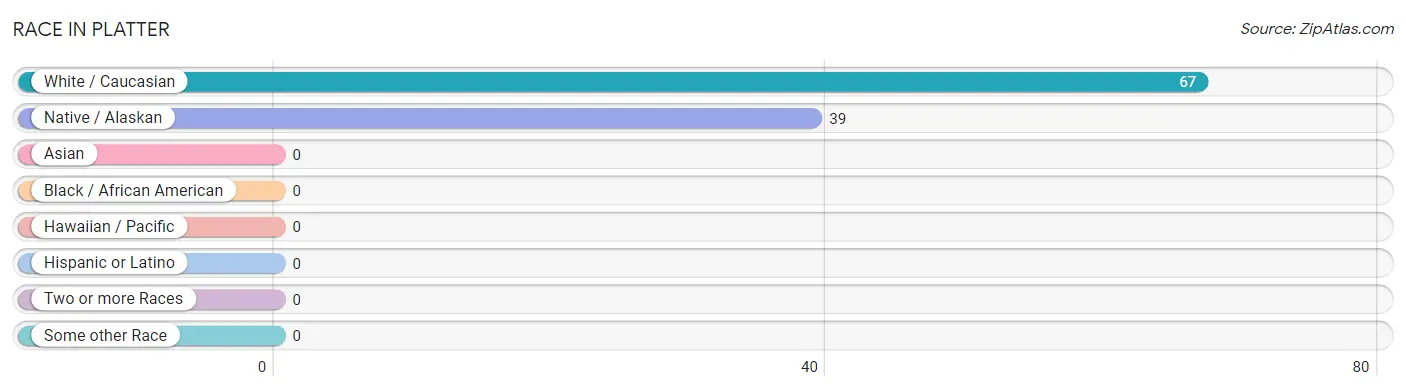
The most populous races in Platter are White / Caucasian (67 | 63.2%), and Native / Alaskan (39 | 36.8%).
Race
# Population
% Population
Asian
0
0.0%
Black / African American
0
0.0%
Hawaiian / Pacific
0
0.0%
Hispanic or Latino
0
0.0%
Native / Alaskan
39
36.8%
White / Caucasian
67
63.2%
Two or more Races
0
0.0%
Some other Race
0
0.0%
Total
106
100.0%
Ancestry in Platter
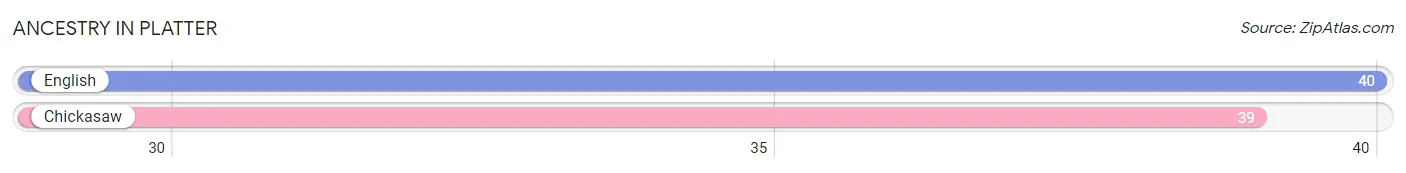
The most populous ancestries reported in Platter are English (40 | 37.7%), and Chickasaw (39 | 36.8%), together accounting for 74.5% of all Platter residents.
Ancestry
# Population
% Population
Chickasaw
39
36.8%
English
40
37.7%
View All 2 Rows
Immigrants in Platter
Immigration Origin
# Population
% Population
View All 0 Rows
Sex and Age in Platter
Sex and Age in Platter
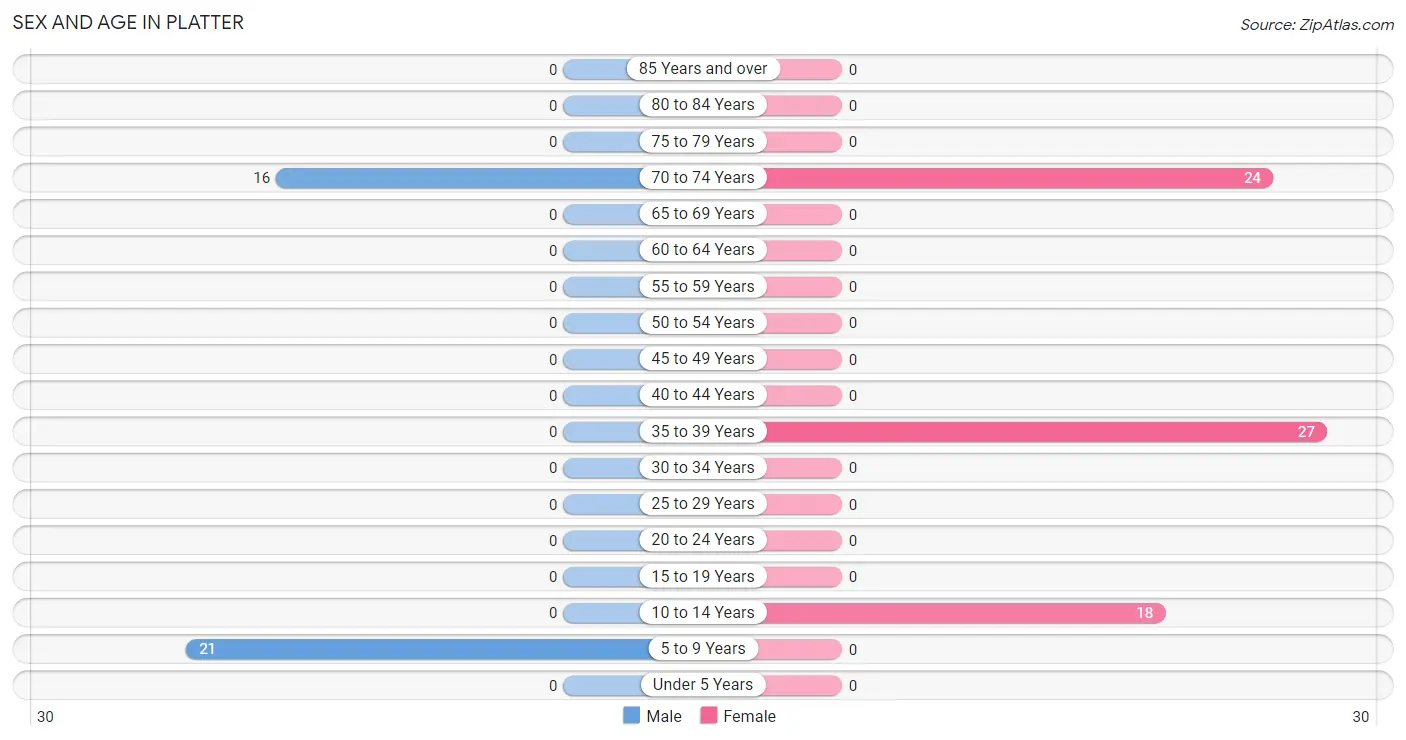
The most populous age groups in Platter are 5 to 9 Years (21 | 56.8%) for men and 35 to 39 Years (27 | 39.1%) for women.
Age Bracket
Male
Female
Under 5 Years
0 (0.0%)
0 (0.0%)
5 to 9 Years
21 (56.8%)
0 (0.0%)
10 to 14 Years
0 (0.0%)
18 (26.1%)
15 to 19 Years
0 (0.0%)
0 (0.0%)
20 to 24 Years
0 (0.0%)
0 (0.0%)
25 to 29 Years
0 (0.0%)
0 (0.0%)
30 to 34 Years
0 (0.0%)
0 (0.0%)
35 to 39 Years
0 (0.0%)
27 (39.1%)
40 to 44 Years
0 (0.0%)
0 (0.0%)
45 to 49 Years
0 (0.0%)
0 (0.0%)
50 to 54 Years
0 (0.0%)
0 (0.0%)
55 to 59 Years
0 (0.0%)
0 (0.0%)
60 to 64 Years
0 (0.0%)
0 (0.0%)
65 to 69 Years
0 (0.0%)
0 (0.0%)
70 to 74 Years
16 (43.2%)
24 (34.8%)
75 to 79 Years
0 (0.0%)
0 (0.0%)
80 to 84 Years
0 (0.0%)
0 (0.0%)
85 Years and over
0 (0.0%)
0 (0.0%)
Total
37 (100.0%)
69 (100.0%)
Families and Households in Platter
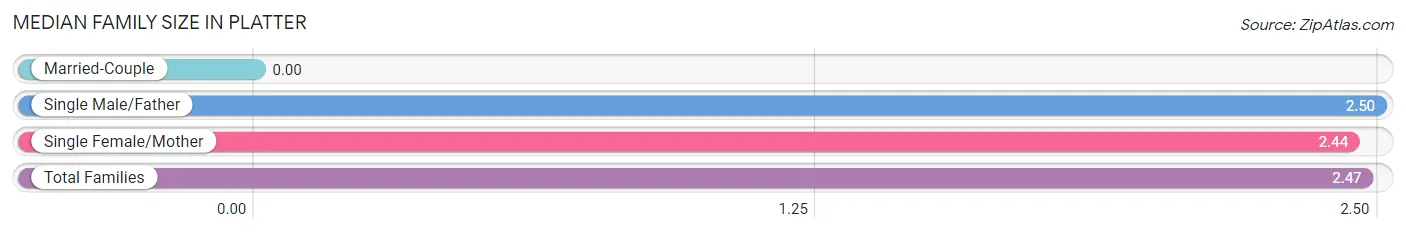
Median Family Size in Platter
Family Type
# Families
Family Size
Married-Couple
0 (0.0%)
-
Single Male/Father
16 (37.2%)
2.50
Single Female/Mother
27 (62.8%)
2.44
Total Families
43 (100.0%)
2.47
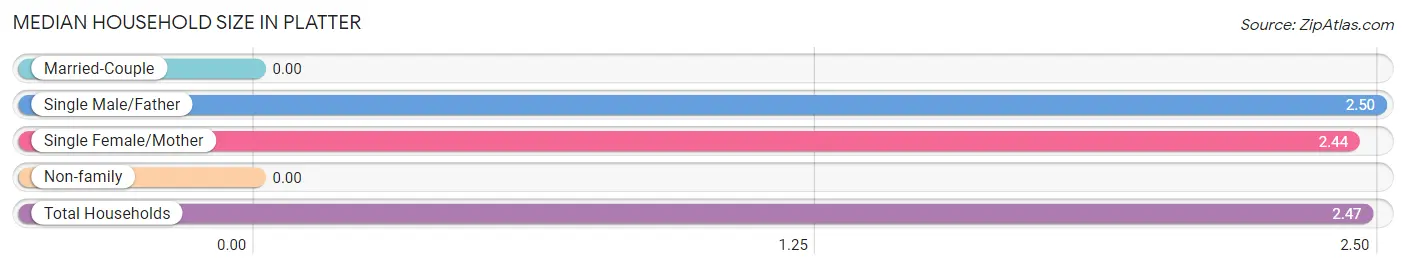
Median Household Size in Platter
Household Type
# Households
Household Size
Married-Couple
0 (0.0%)
-
Single Male/Father
16 (37.2%)
2.50
Single Female/Mother
27 (62.8%)
2.44
Non-family
0 (0.0%)
-
Total Households
43 (100.0%)
2.47
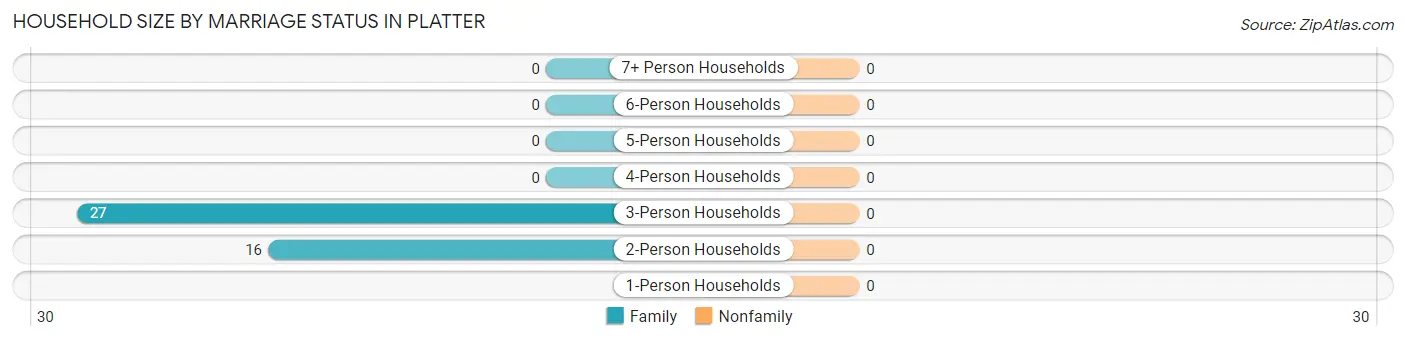
Household Size by Marriage Status in Platter
Household Size
Family Households
Nonfamily Households
1-Person Households
-
0 (0.0%)
2-Person Households
16 (37.2%)
0 (0.0%)
3-Person Households
27 (62.8%)
0 (0.0%)
4-Person Households
0 (0.0%)
0 (0.0%)
5-Person Households
0 (0.0%)
0 (0.0%)
6-Person Households
0 (0.0%)
0 (0.0%)
7+ Person Households
0 (0.0%)
0 (0.0%)
Total
43 (100.0%)
0 (0.0%)
Female Fertility in Platter
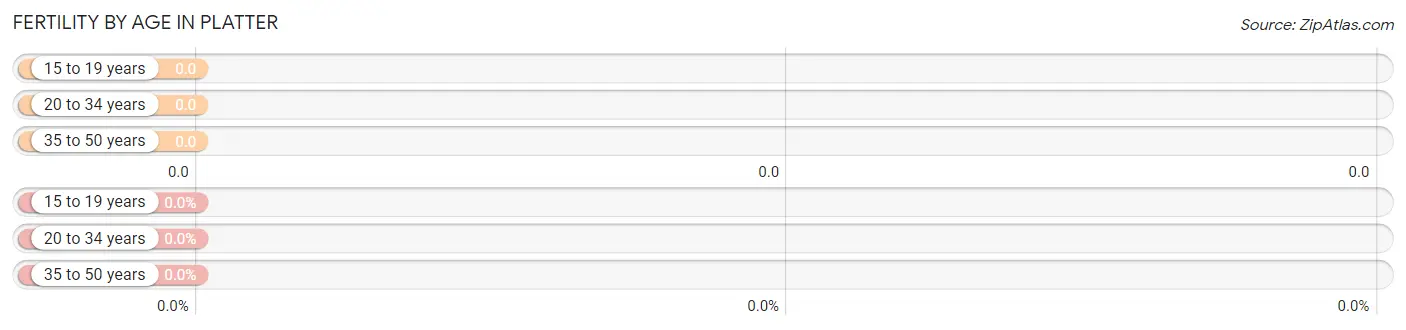
Fertility by Age in Platter
Age Bracket
Women with Births
Births / 1,000 Women
15 to 19 years
0 (0.0%)
0.0
20 to 34 years
0 (0.0%)
0.0
35 to 50 years
0 (0.0%)
0.0
Total
0 (0.0%)
0.0
Fertility by Age by Marriage Status in Platter
Age Bracket
Married
Unmarried
15 to 19 years
0 (0.0%)
0 (0.0%)
20 to 34 years
0 (0.0%)
0 (0.0%)
35 to 50 years
0 (0.0%)
0 (0.0%)
Total
0 (0.0%)
0 (0.0%)
Fertility by Education in Platter
Educational Attainment
Women with Births
Births / 1,000 Women
Less than High School
0 (0.0%)
0.0
High School Diploma
0 (0.0%)
0.0
College or Associate's Degree
0 (0.0%)
0.0
Bachelor's Degree
0 (0.0%)
0.0
Graduate Degree
0 (0.0%)
0.0
Total
0 (0.0%)
0.0
Fertility by Education by Marriage Status in Platter
Educational Attainment
Married
Unmarried
Less than High School
0 (0.0%)
0 (0.0%)
High School Diploma
0 (0.0%)
0 (0.0%)
College or Associate's Degree
0 (0.0%)
0 (0.0%)
Bachelor's Degree
0 (0.0%)
0 (0.0%)
Graduate Degree
0 (0.0%)
0 (0.0%)
Total
0 (0.0%)
0 (0.0%)
Income in Platter
Income Overview in Platter
Characteristic
Number
Measure
Per Capita Income
106
$10,758
Median Family Income
43
$0
Mean Family Income
43
$0
Median Household Income
43
$0
Mean Household Income
43
$0
Income Deficit
43
$0
Wage / Income Gap (%)
106
0.00%
Wage / Income Gap ($)
106
100.00¢ per $1
Gini / Inequality Index
106
0.09
Earnings by Sex in Platter
Sex
Number
Average Earnings
Male
0 (0.0%)
$0
Female
51 (100.0%)
$0
Total
51 (100.0%)
$0
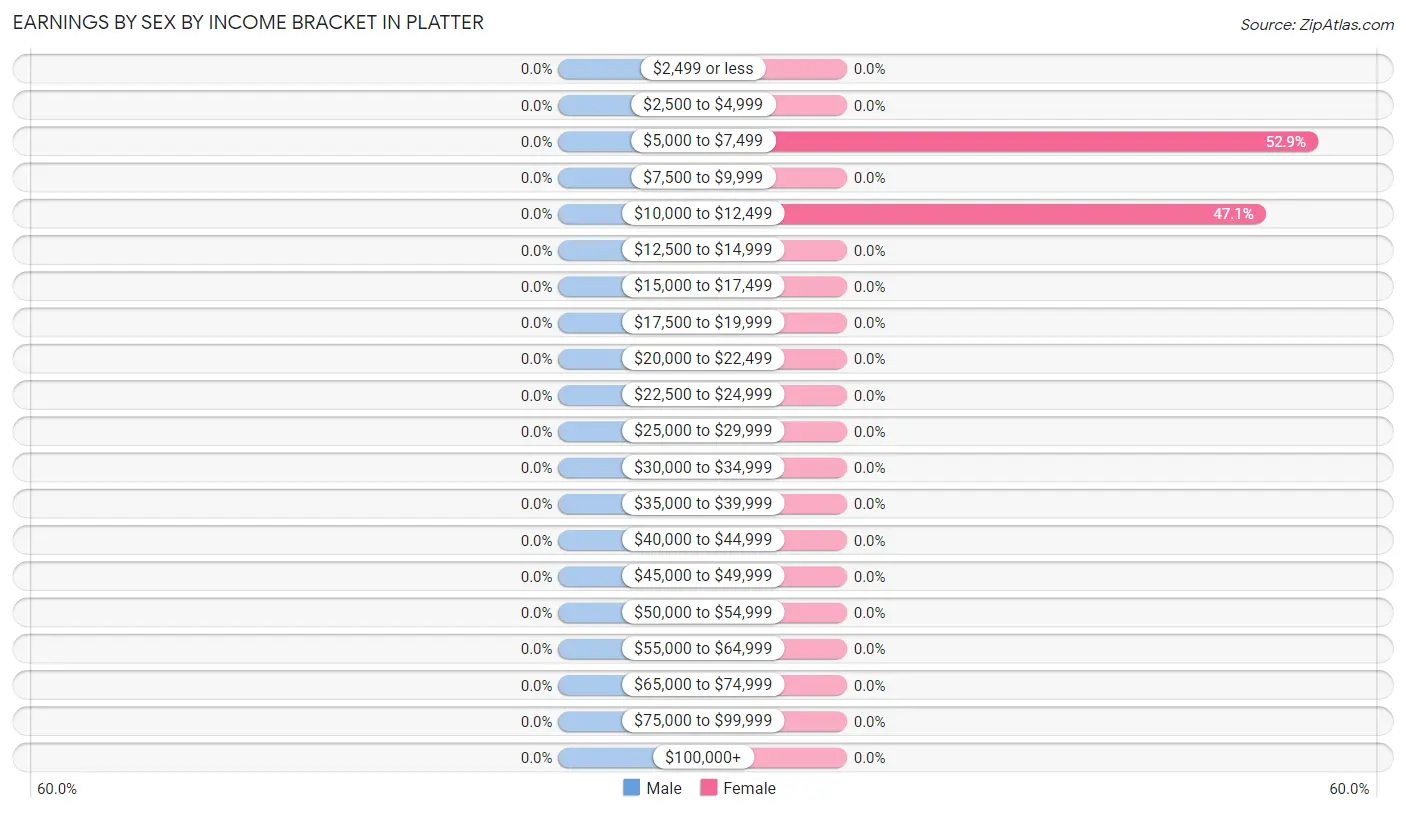
Earnings by Sex by Income Bracket in Platter
Income
Male
Female
$2,499 or less
0 (0.0%)
0 (0.0%)
$2,500 to $4,999
0 (0.0%)
0 (0.0%)
$5,000 to $7,499
0 (0.0%)
27 (52.9%)
$7,500 to $9,999
0 (0.0%)
0 (0.0%)
$10,000 to $12,499
0 (0.0%)
24 (47.1%)
$12,500 to $14,999
0 (0.0%)
0 (0.0%)
$15,000 to $17,499
0 (0.0%)
0 (0.0%)
$17,500 to $19,999
0 (0.0%)
0 (0.0%)
$20,000 to $22,499
0 (0.0%)
0 (0.0%)
$22,500 to $24,999
0 (0.0%)
0 (0.0%)
$25,000 to $29,999
0 (0.0%)
0 (0.0%)
$30,000 to $34,999
0 (0.0%)
0 (0.0%)
$35,000 to $39,999
0 (0.0%)
0 (0.0%)
$40,000 to $44,999
0 (0.0%)
0 (0.0%)
$45,000 to $49,999
0 (0.0%)
0 (0.0%)
$50,000 to $54,999
0 (0.0%)
0 (0.0%)
$55,000 to $64,999
0 (0.0%)
0 (0.0%)
$65,000 to $74,999
0 (0.0%)
0 (0.0%)
$75,000 to $99,999
0 (0.0%)
0 (0.0%)
$100,000+
0 (0.0%)
0 (0.0%)
Total
0 (0.0%)
51 (100.0%)
Earnings by Sex by Educational Attainment in Platter
Educational Attainment
Male Income
Female Income
Less than High School
-
-
High School Diploma
-
-
College or Associate's Degree
-
-
Bachelor's Degree
-
-
Graduate Degree
-
-
Total
-
-
Family Income in Platter
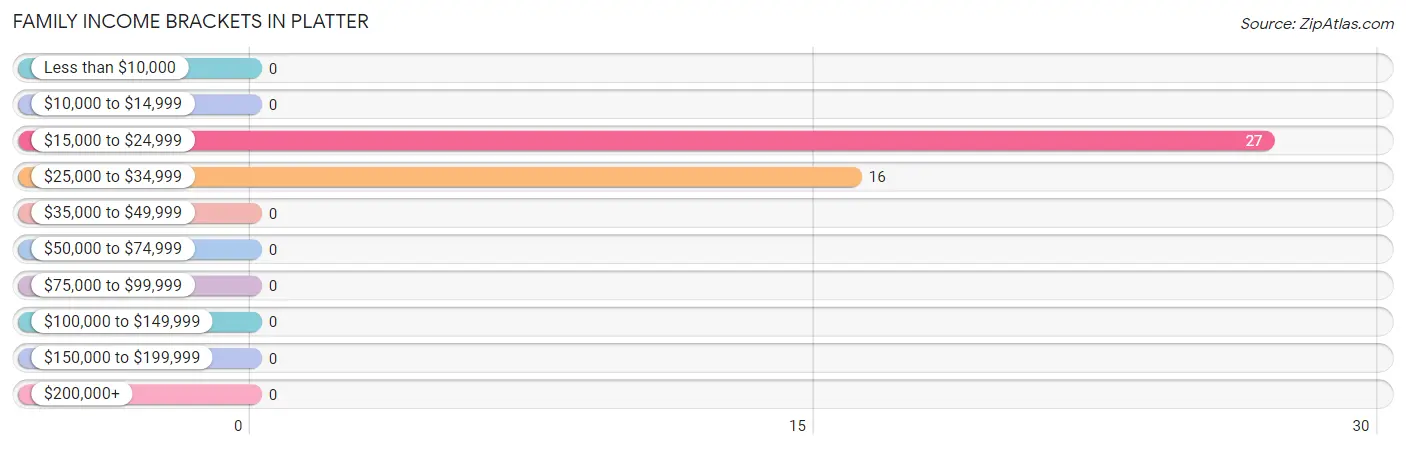
Family Income Brackets in Platter
According to the Platter family income data, there are 27 families falling into the $15,000 to $24,999 income range, which is the most common income bracket and makes up 62.8% of all families.
Income Bracket
# Families
% Families
Less than $10,000
0
0.0%
$10,000 to $14,999
0
0.0%
$15,000 to $24,999
27
62.8%
$25,000 to $34,999
16
37.2%
$35,000 to $49,999
0
0.0%
$50,000 to $74,999
0
0.0%
$75,000 to $99,999
0
0.0%
$100,000 to $149,999
0
0.0%
$150,000 to $199,999
0
0.0%
$200,000+
0
0.0%
Family Income by Famaliy Size in Platter
Income Bracket
# Families
Median Income
2-Person Families
16 (37.2%)
$0
3-Person Families
27 (62.8%)
$0
4-Person Families
0 (0.0%)
$0
5-Person Families
0 (0.0%)
$0
6-Person Families
0 (0.0%)
$0
7+ Person Families
0 (0.0%)
$0
Total
43 (100.0%)
$0
Family Income by Number of Earners in Platter
Number of Earners
# Families
Median Income
No Earners
0 (0.0%)
$0
1 Earner
43 (100.0%)
$0
2 Earners
0 (0.0%)
$0
3+ Earners
0 (0.0%)
$0
Total
43 (100.0%)
$0
Household Income in Platter
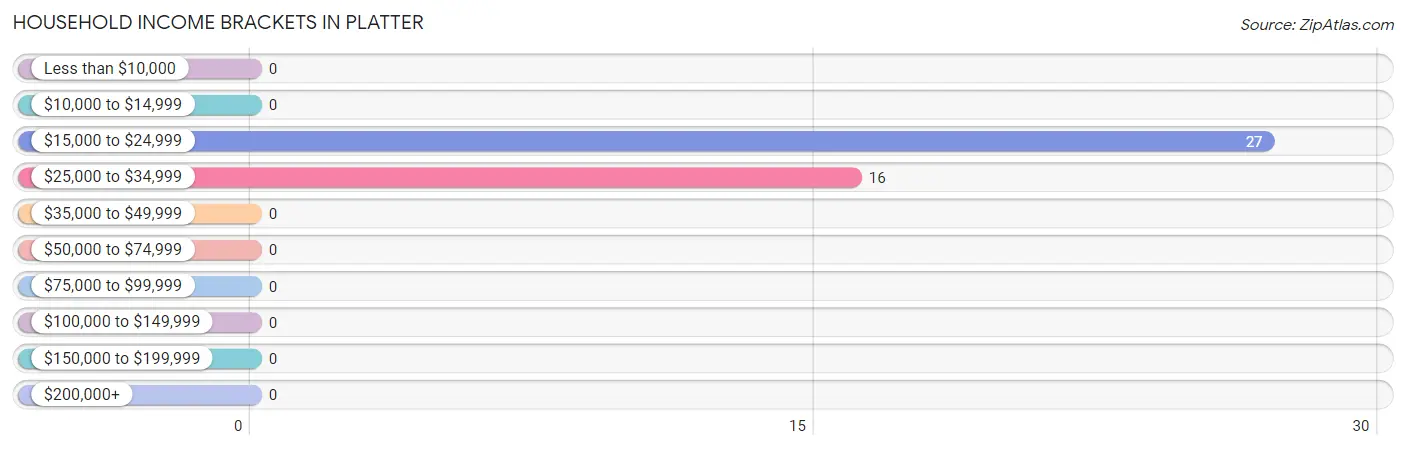
Household Income Brackets in Platter
With 27 households falling in the category, the $15,000 to $24,999 income range is the most frequent in Platter, accounting for 62.8% of all households.
Income Bracket
# Households
% Households
Less than $10,000
0
0.0%
$10,000 to $14,999
0
0.0%
$15,000 to $24,999
27
62.8%
$25,000 to $34,999
16
37.2%
$35,000 to $49,999
0
0.0%
$50,000 to $74,999
0
0.0%
$75,000 to $99,999
0
0.0%
$100,000 to $149,999
0
0.0%
$150,000 to $199,999
0
0.0%
$200,000+
0
0.0%
Household Income by Householder Age in Platter
Income Bracket
# Households
Median Income
15 to 24 Years
0 (0.0%)
$0
25 to 44 Years
27 (62.8%)
$0
45 to 64 Years
0 (0.0%)
$0
65+ Years
16 (37.2%)
$0
Total
43 (100.0%)
$0
Poverty in Platter
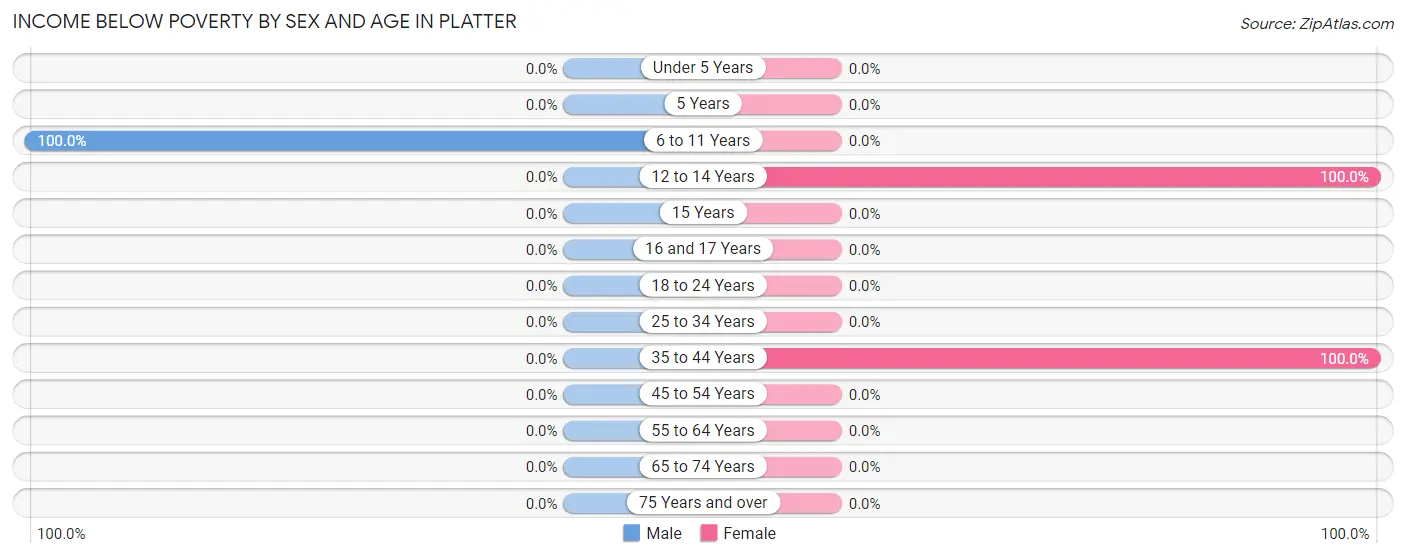
Income Below Poverty by Sex and Age in Platter
With 56.8% poverty level for males and 65.2% for females among the residents of Platter, 6 to 11 year old males and 12 to 14 year old females are the most vulnerable to poverty, with 21 males (100.0%) and 18 females (100.0%) in their respective age groups living below the poverty level.
Age Bracket
Male
Female
Under 5 Years
0 (0.0%)
0 (0.0%)
5 Years
0 (0.0%)
0 (0.0%)
6 to 11 Years
21 (100.0%)
0 (0.0%)
12 to 14 Years
0 (0.0%)
18 (100.0%)
15 Years
0 (0.0%)
0 (0.0%)
16 and 17 Years
0 (0.0%)
0 (0.0%)
18 to 24 Years
0 (0.0%)
0 (0.0%)
25 to 34 Years
0 (0.0%)
0 (0.0%)
35 to 44 Years
0 (0.0%)
27 (100.0%)
45 to 54 Years
0 (0.0%)
0 (0.0%)
55 to 64 Years
0 (0.0%)
0 (0.0%)
65 to 74 Years
0 (0.0%)
0 (0.0%)
75 Years and over
0 (0.0%)
0 (0.0%)
Total
21 (56.8%)
45 (65.2%)
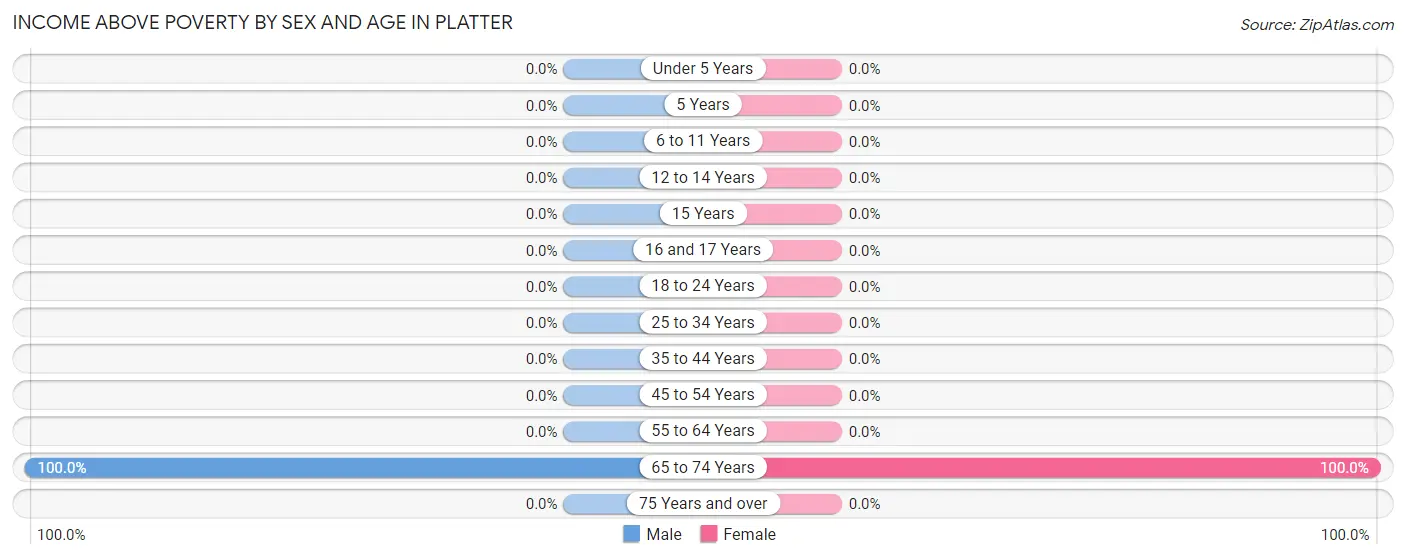
Income Above Poverty by Sex and Age in Platter
According to the poverty statistics in Platter, males aged 65 to 74 years and females aged 65 to 74 years are the age groups that are most secure financially, with 100.0% of males and 100.0% of females in these age groups living above the poverty line.
Age Bracket
Male
Female
Under 5 Years
0 (0.0%)
0 (0.0%)
5 Years
0 (0.0%)
0 (0.0%)
6 to 11 Years
0 (0.0%)
0 (0.0%)
12 to 14 Years
0 (0.0%)
0 (0.0%)
15 Years
0 (0.0%)
0 (0.0%)
16 and 17 Years
0 (0.0%)
0 (0.0%)
18 to 24 Years
0 (0.0%)
0 (0.0%)
25 to 34 Years
0 (0.0%)
0 (0.0%)
35 to 44 Years
0 (0.0%)
0 (0.0%)
45 to 54 Years
0 (0.0%)
0 (0.0%)
55 to 64 Years
0 (0.0%)
0 (0.0%)
65 to 74 Years
16 (100.0%)
24 (100.0%)
75 Years and over
0 (0.0%)
0 (0.0%)
Total
16 (43.2%)
24 (34.8%)
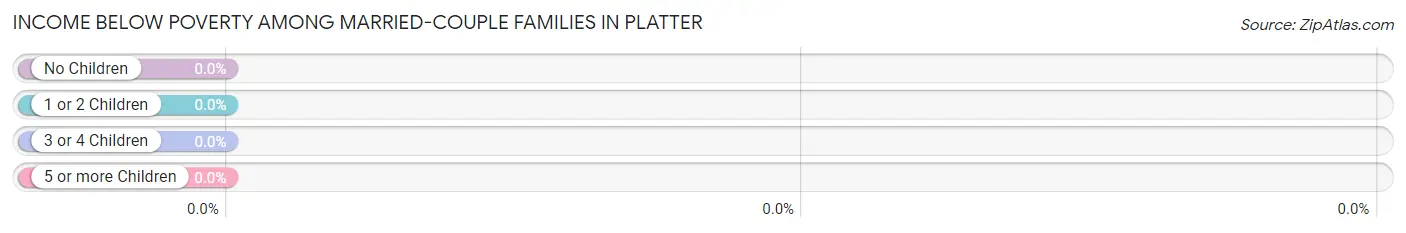
Income Below Poverty Among Married-Couple Families in Platter
Children
Above Poverty
Below Poverty
No Children
0 (0.0%)
0 (0.0%)
1 or 2 Children
0 (0.0%)
0 (0.0%)
3 or 4 Children
0 (0.0%)
0 (0.0%)
5 or more Children
0 (0.0%)
0 (0.0%)
Total
0 (0.0%)
0 (0.0%)
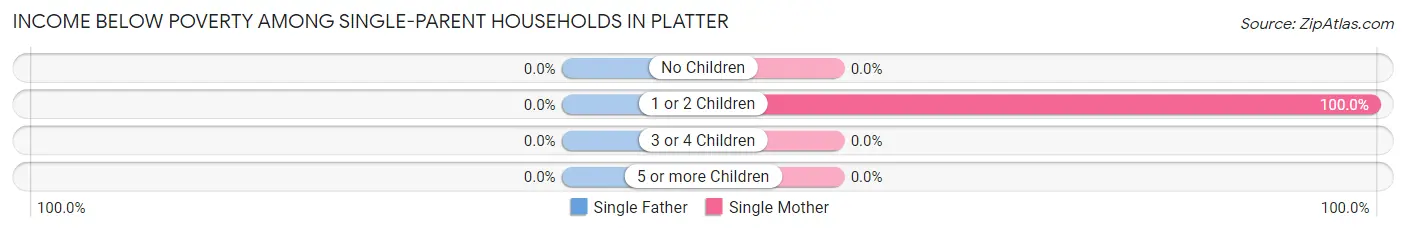
Income Below Poverty Among Single-Parent Households in Platter
Children
Single Father
Single Mother
No Children
0 (0.0%)
0 (0.0%)
1 or 2 Children
0 (0.0%)
27 (100.0%)
3 or 4 Children
0 (0.0%)
0 (0.0%)
5 or more Children
0 (0.0%)
0 (0.0%)
Total
0 (0.0%)
27 (100.0%)
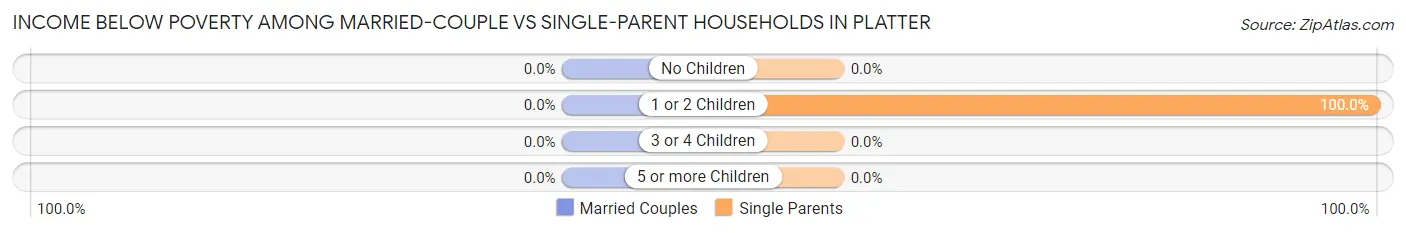
Income Below Poverty Among Married-Couple vs Single-Parent Households in Platter
Children
Married-Couple Families
Single-Parent Households
No Children
0 (0.0%)
0 (0.0%)
1 or 2 Children
0 (0.0%)
27 (100.0%)
3 or 4 Children
0 (0.0%)
0 (0.0%)
5 or more Children
0 (0.0%)
0 (0.0%)
Total
0 (0.0%)
27 (62.8%)
Employment Characteristics in Platter
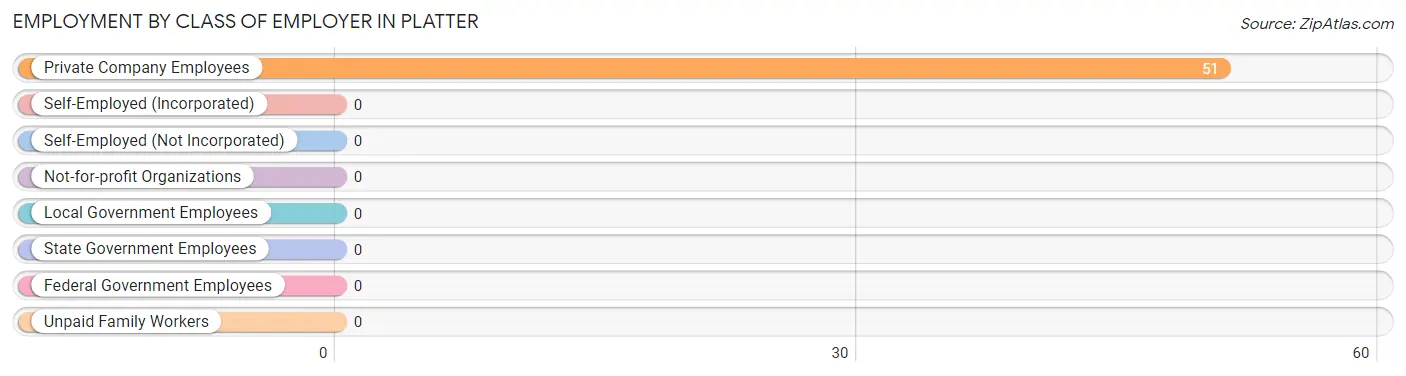
Employment by Class of Employer in Platter
Among the 51 employed individuals in Platter, , and private company employees (51 | 100.0%) make up the most common classes of employment.
Employer Class
# Employees
% Employees
Private Company Employees
51
100.0%
Self-Employed (Incorporated)
0
0.0%
Self-Employed (Not Incorporated)
0
0.0%
Not-for-profit Organizations
0
0.0%
Local Government Employees
0
0.0%
State Government Employees
0
0.0%
Federal Government Employees
0
0.0%
Unpaid Family Workers
0
0.0%
Total
51
100.0%
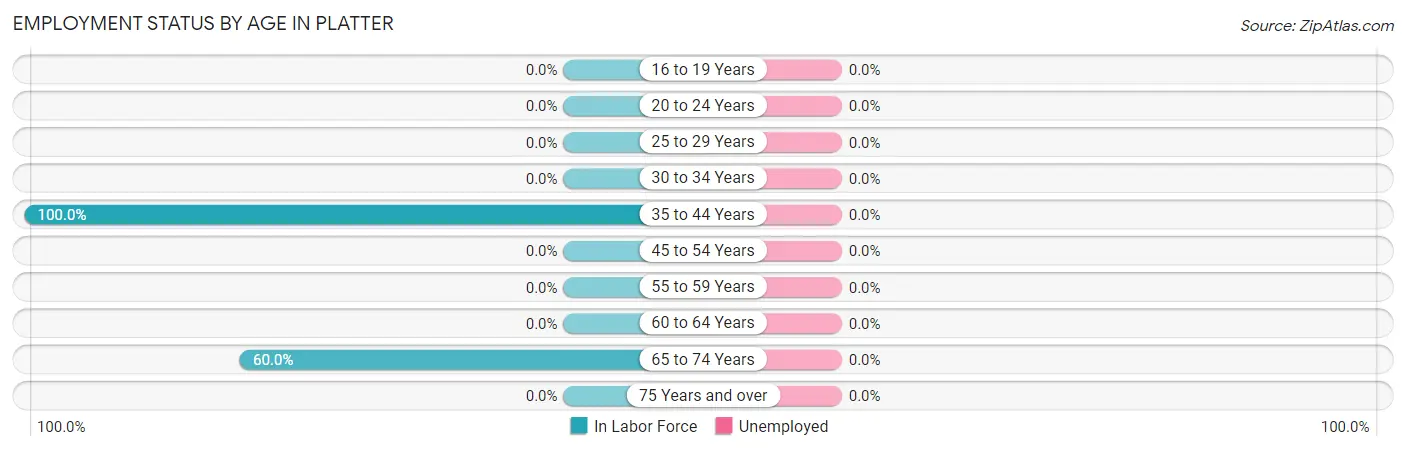
Employment Status by Age in Platter
Age Bracket
In Labor Force
Unemployed
16 to 19 Years
0 (0.0%)
0 (0.0%)
20 to 24 Years
0 (0.0%)
0 (0.0%)
25 to 29 Years
0 (0.0%)
0 (0.0%)
30 to 34 Years
0 (0.0%)
0 (0.0%)
35 to 44 Years
27 (100.0%)
0 (0.0%)
45 to 54 Years
0 (0.0%)
0 (0.0%)
55 to 59 Years
0 (0.0%)
0 (0.0%)
60 to 64 Years
0 (0.0%)
0 (0.0%)
65 to 74 Years
24 (60.0%)
0 (0.0%)
75 Years and over
0 (0.0%)
0 (0.0%)
Total
51 (76.1%)
0 (0.0%)
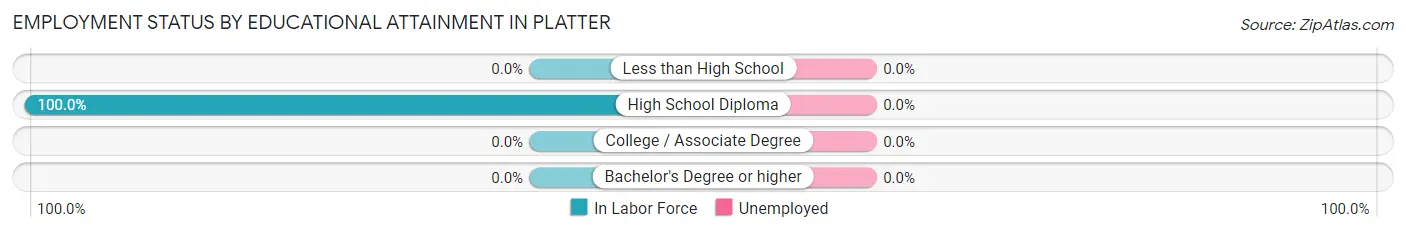
Employment Status by Educational Attainment in Platter
Educational Attainment
In Labor Force
Unemployed
Less than High School
0 (0.0%)
0 (0.0%)
High School Diploma
27 (100.0%)
0 (0.0%)
College / Associate Degree
0 (0.0%)
0 (0.0%)
Bachelor's Degree or higher
0 (0.0%)
0 (0.0%)
Total
27 (100.0%)
0 (0.0%)
Employment Occupations by Sex in Platter
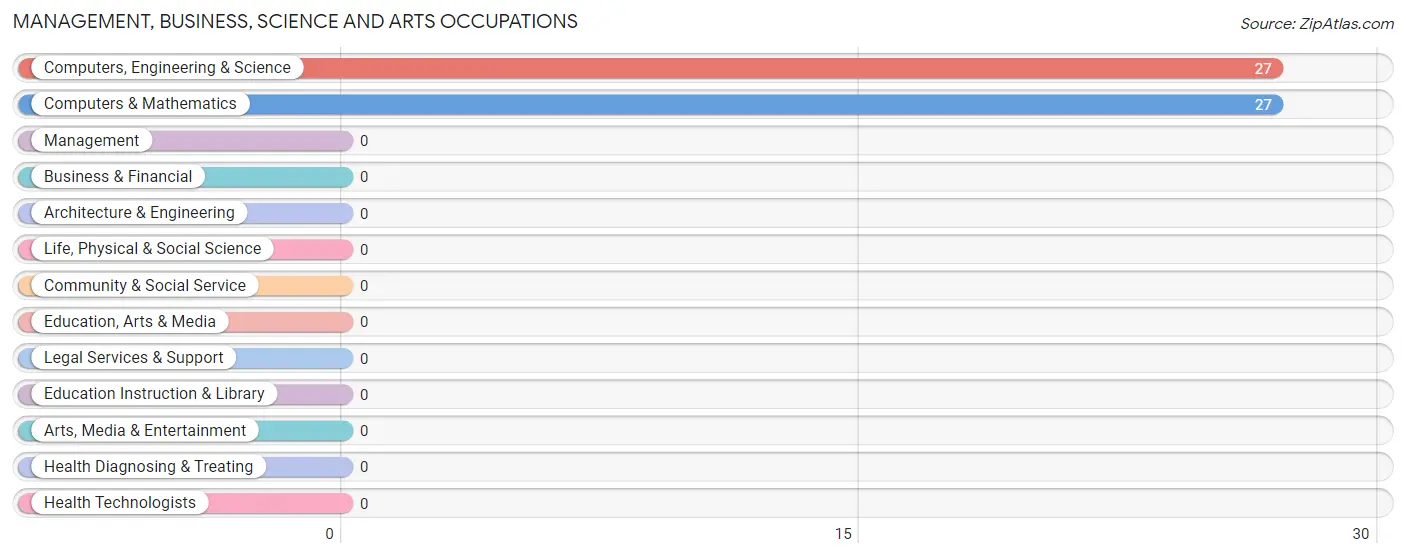
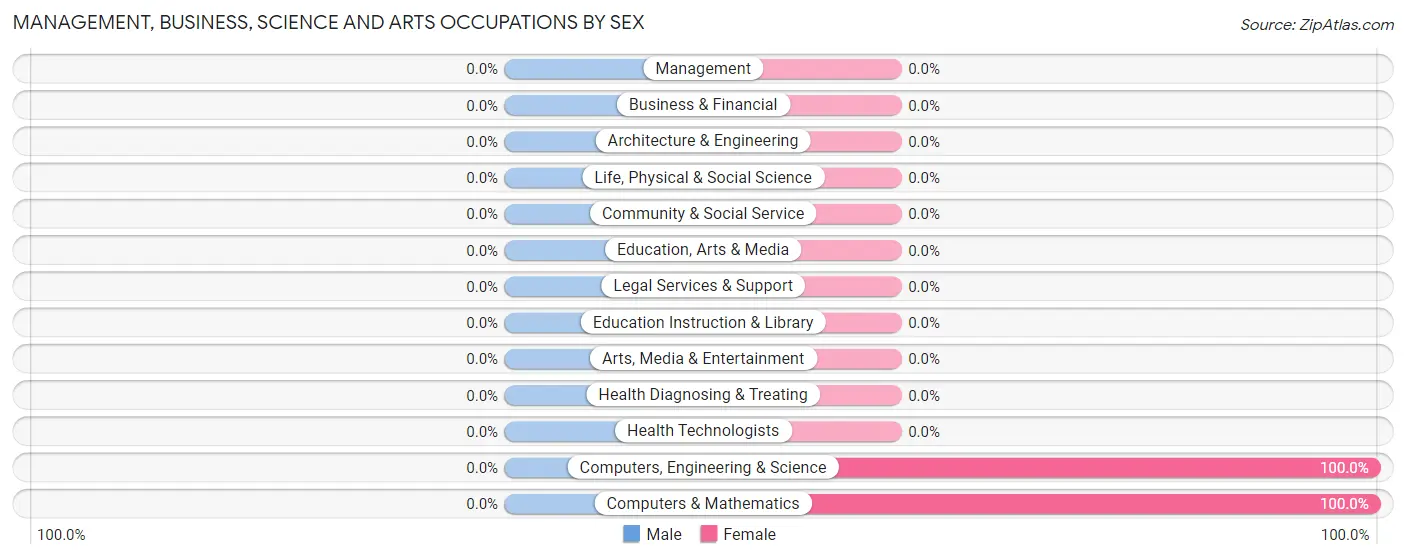
Management, Business, Science and Arts Occupations
The most common Management, Business, Science and Arts occupations in Platter are Computers, Engineering & Science (27 | 52.9%), and Computers & Mathematics (27 | 52.9%).
Management, Business, Science and Arts Occupations by Sex
Occupation
Male
Female
Management
0 (0.0%)
0 (0.0%)
Business & Financial
0 (0.0%)
0 (0.0%)
Computers, Engineering & Science
0 (0.0%)
27 (100.0%)
Computers & Mathematics
0 (0.0%)
27 (100.0%)
Architecture & Engineering
0 (0.0%)
0 (0.0%)
Life, Physical & Social Science
0 (0.0%)
0 (0.0%)
Community & Social Service
0 (0.0%)
0 (0.0%)
Education, Arts & Media
0 (0.0%)
0 (0.0%)
Legal Services & Support
0 (0.0%)
0 (0.0%)
Education Instruction & Library
0 (0.0%)
0 (0.0%)
Arts, Media & Entertainment
0 (0.0%)
0 (0.0%)
Health Diagnosing & Treating
0 (0.0%)
0 (0.0%)
Health Technologists
0 (0.0%)
0 (0.0%)
Total (Category)
0 (0.0%)
27 (100.0%)
Total (Overall)
0 (0.0%)
51 (100.0%)
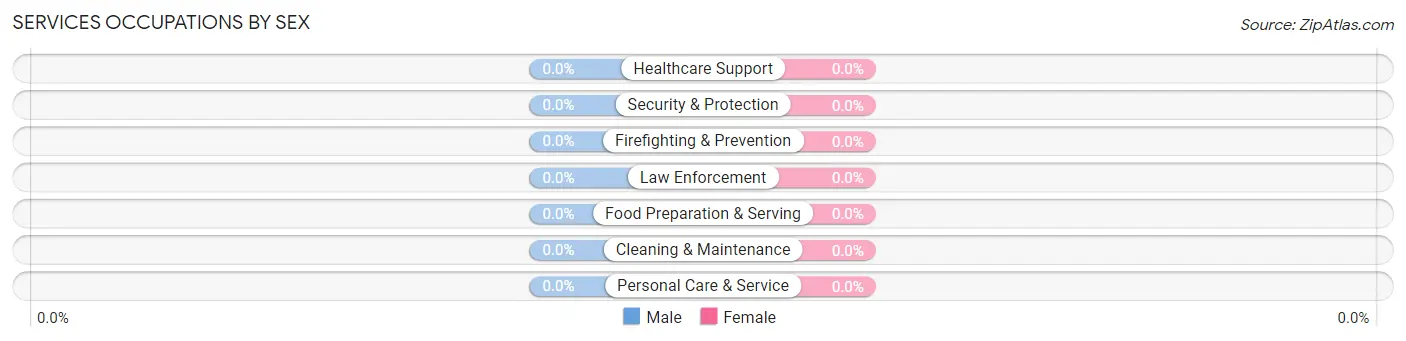
Services Occupations
Services Occupations by Sex
Occupation
Male
Female
Healthcare Support
0 (0.0%)
0 (0.0%)
Security & Protection
0 (0.0%)
0 (0.0%)
Firefighting & Prevention
0 (0.0%)
0 (0.0%)
Law Enforcement
0 (0.0%)
0 (0.0%)
Food Preparation & Serving
0 (0.0%)
0 (0.0%)
Cleaning & Maintenance
0 (0.0%)
0 (0.0%)
Personal Care & Service
0 (0.0%)
0 (0.0%)
Total (Category)
0 (0.0%)
0 (0.0%)
Total (Overall)
0 (0.0%)
51 (100.0%)
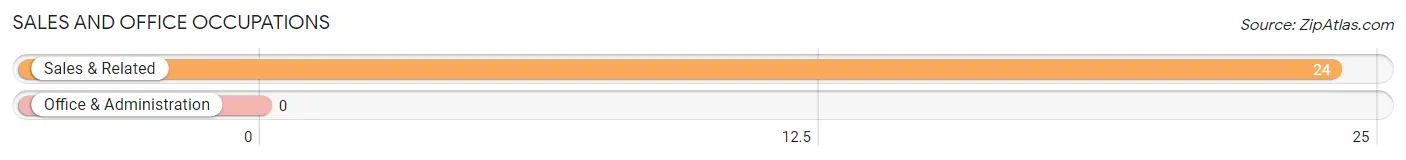
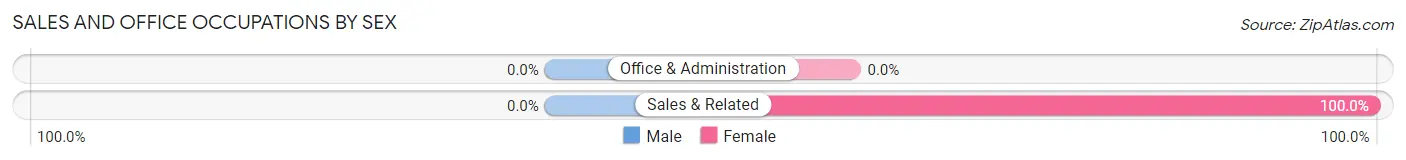
Sales and Office Occupations
The most common Sales and Office occupations in Platter are , and Sales & Related (24 | 47.1%).
Sales and Office Occupations by Sex
Occupation
Male
Female
Sales & Related
0 (0.0%)
24 (100.0%)
Office & Administration
0 (0.0%)
0 (0.0%)
Total (Category)
0 (0.0%)
24 (100.0%)
Total (Overall)
0 (0.0%)
51 (100.0%)
Natural Resources, Construction and Maintenance Occupations
Natural Resources, Construction and Maintenance Occupations by Sex
Occupation
Male
Female
Farming, Fishing & Forestry
0 (0.0%)
0 (0.0%)
Construction & Extraction
0 (0.0%)
0 (0.0%)
Installation, Maintenance & Repair
0 (0.0%)
0 (0.0%)
Total (Category)
0 (0.0%)
0 (0.0%)
Total (Overall)
0 (0.0%)
51 (100.0%)
Production, Transportation and Moving Occupations
Production, Transportation and Moving Occupations by Sex
Occupation
Male
Female
Production
0 (0.0%)
0 (0.0%)
Transportation
0 (0.0%)
0 (0.0%)
Material Moving
0 (0.0%)
0 (0.0%)
Total (Category)
0 (0.0%)
0 (0.0%)
Total (Overall)
0 (0.0%)
51 (100.0%)
Employment Industries by Sex in Platter
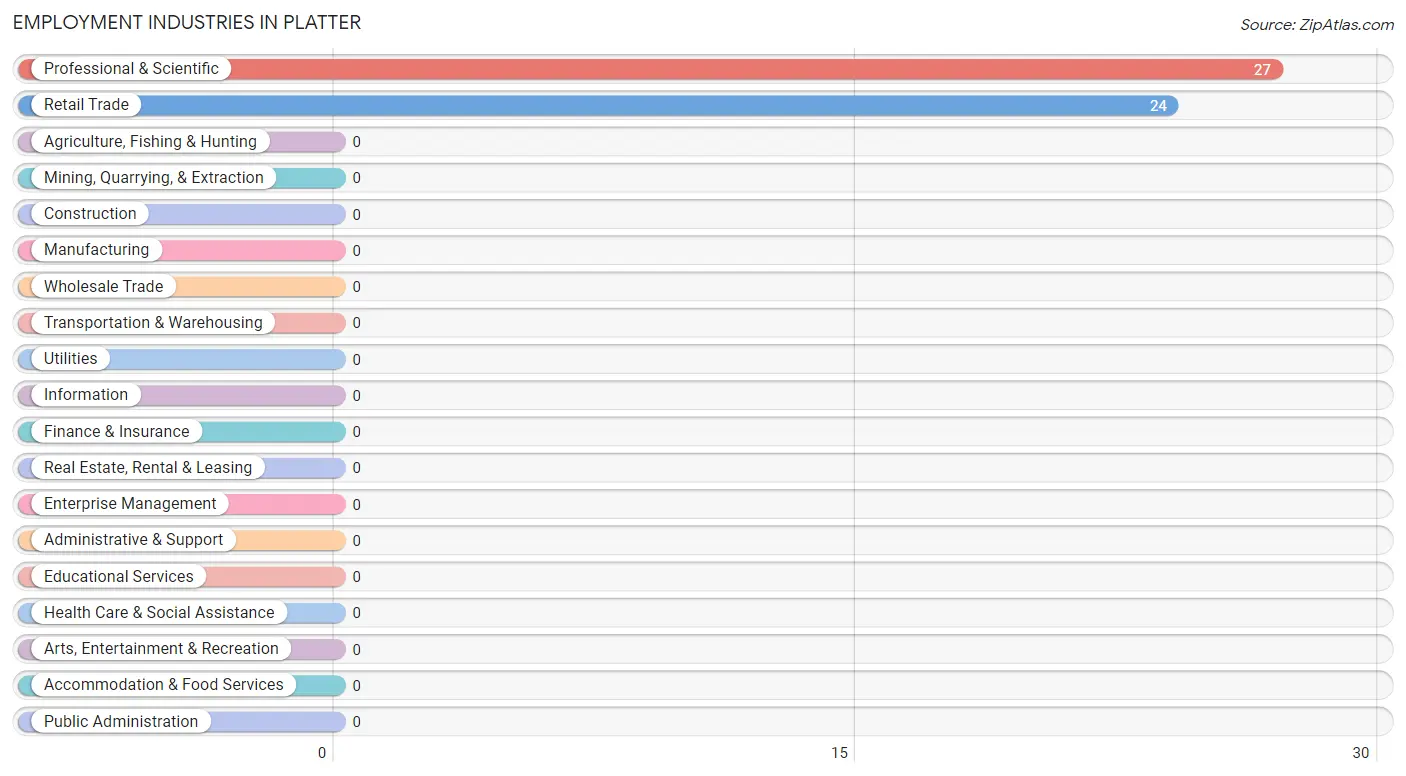
Employment Industries in Platter
The major employment industries in Platter include Professional & Scientific (27 | 52.9%), and Retail Trade (24 | 47.1%).
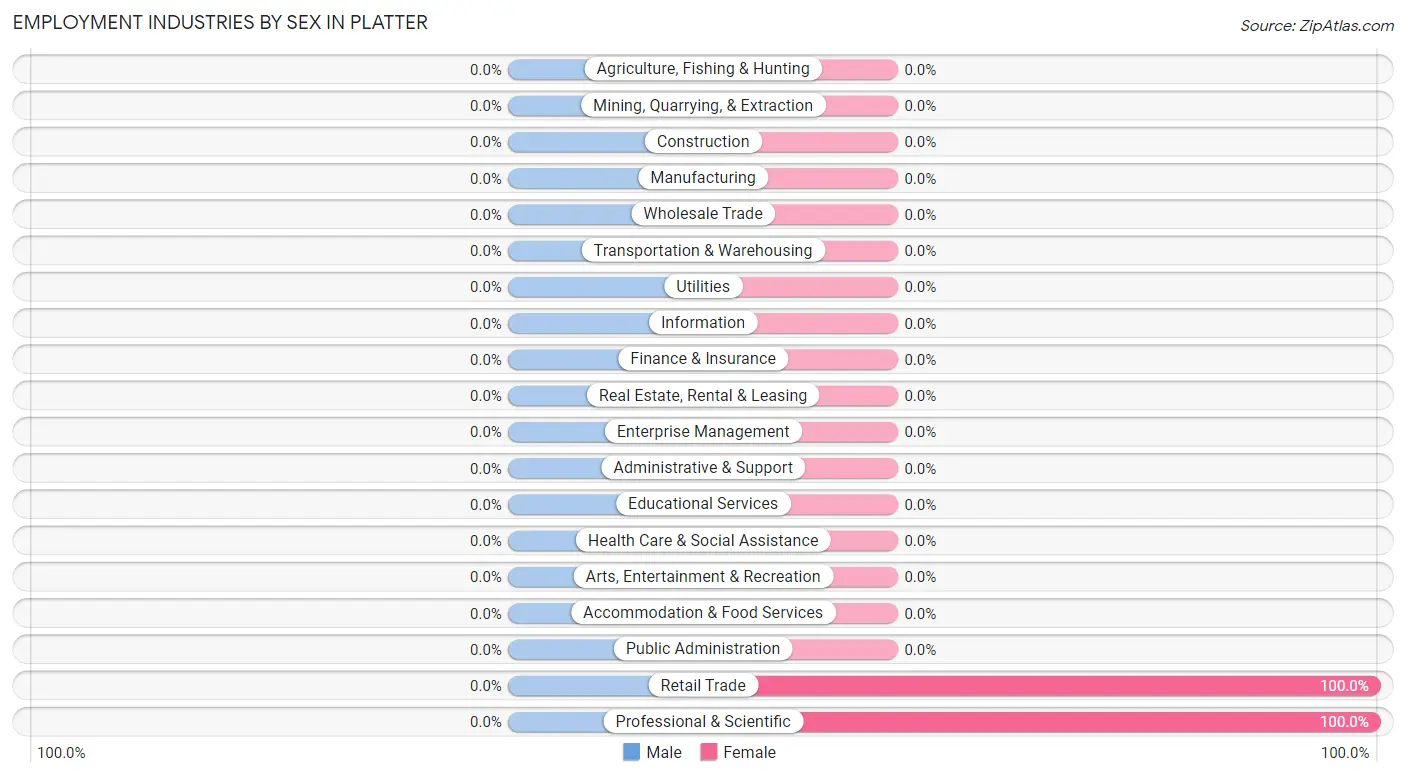
Employment Industries by Sex in Platter
Industry
Male
Female
Agriculture, Fishing & Hunting
0 (0.0%)
0 (0.0%)
Mining, Quarrying, & Extraction
0 (0.0%)
0 (0.0%)
Construction
0 (0.0%)
0 (0.0%)
Manufacturing
0 (0.0%)
0 (0.0%)
Wholesale Trade
0 (0.0%)
0 (0.0%)
Retail Trade
0 (0.0%)
24 (100.0%)
Transportation & Warehousing
0 (0.0%)
0 (0.0%)
Utilities
0 (0.0%)
0 (0.0%)
Information
0 (0.0%)
0 (0.0%)
Finance & Insurance
0 (0.0%)
0 (0.0%)
Real Estate, Rental & Leasing
0 (0.0%)
0 (0.0%)
Professional & Scientific
0 (0.0%)
27 (100.0%)
Enterprise Management
0 (0.0%)
0 (0.0%)
Administrative & Support
0 (0.0%)
0 (0.0%)
Educational Services
0 (0.0%)
0 (0.0%)
Health Care & Social Assistance
0 (0.0%)
0 (0.0%)
Arts, Entertainment & Recreation
0 (0.0%)
0 (0.0%)
Accommodation & Food Services
0 (0.0%)
0 (0.0%)
Public Administration
0 (0.0%)
0 (0.0%)
Total
0 (0.0%)
51 (100.0%)
Education in Platter
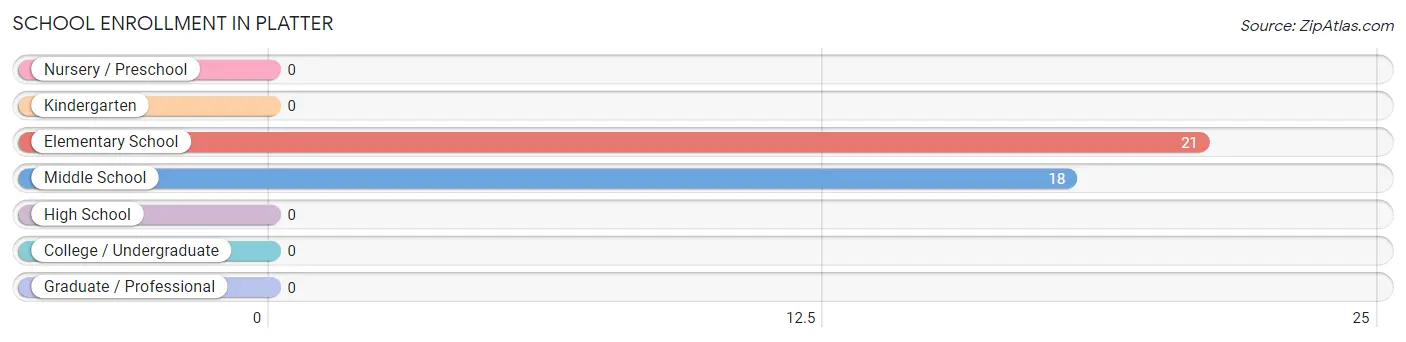
School Enrollment in Platter
The most common levels of schooling among the 39 students in Platter are elementary school (21 | 53.8%), and middle school (18 | 46.2%).
School Level
# Students
% Students
Nursery / Preschool
0
0.0%
Kindergarten
0
0.0%
Elementary School
21
53.8%
Middle School
18
46.2%
High School
0
0.0%
College / Undergraduate
0
0.0%
Graduate / Professional
0
0.0%
Total
39
100.0%
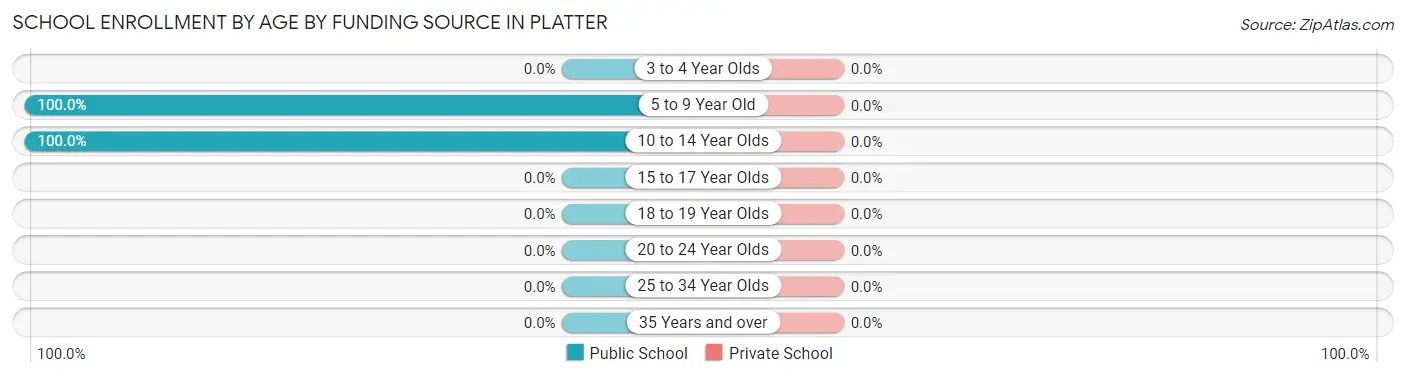
School Enrollment by Age by Funding Source in Platter
Age Bracket
Public School
Private School
3 to 4 Year Olds
0 (0.0%)
0 (0.0%)
5 to 9 Year Old
21 (100.0%)
0 (0.0%)
10 to 14 Year Olds
18 (100.0%)
0 (0.0%)
15 to 17 Year Olds
0 (0.0%)
0 (0.0%)
18 to 19 Year Olds
0 (0.0%)
0 (0.0%)
20 to 24 Year Olds
0 (0.0%)
0 (0.0%)
25 to 34 Year Olds
0 (0.0%)
0 (0.0%)
35 Years and over
0 (0.0%)
0 (0.0%)
Total
39 (100.0%)
0 (0.0%)
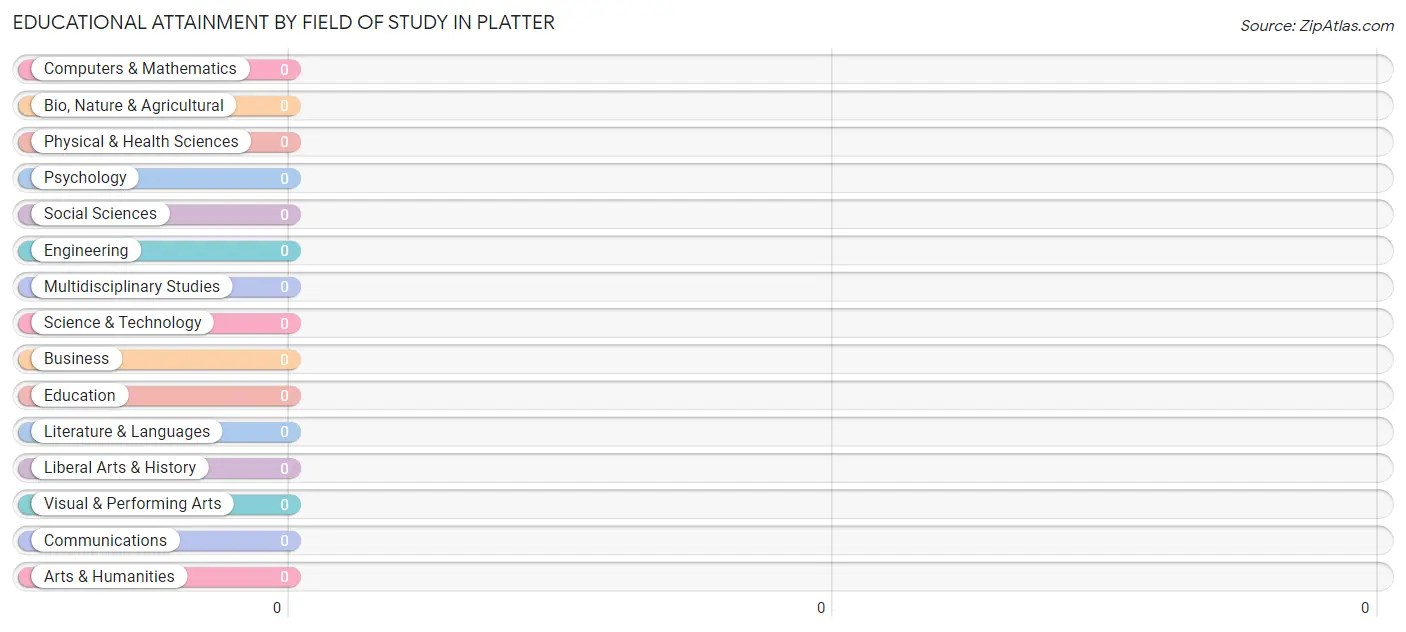
Educational Attainment by Field of Study in Platter
Field of Study
# Graduates
% Graduates
Computers & Mathematics
0
0.0%
Bio, Nature & Agricultural
0
0.0%
Physical & Health Sciences
0
0.0%
Psychology
0
0.0%
Social Sciences
0
0.0%
Engineering
0
0.0%
Multidisciplinary Studies
0
0.0%
Science & Technology
0
0.0%
Business
0
0.0%
Education
0
0.0%
Literature & Languages
0
0.0%
Liberal Arts & History
0
0.0%
Visual & Performing Arts
0
0.0%
Communications
0
0.0%
Arts & Humanities
0
0.0%
Total
0
0.0%
Transportation & Commute in Platter
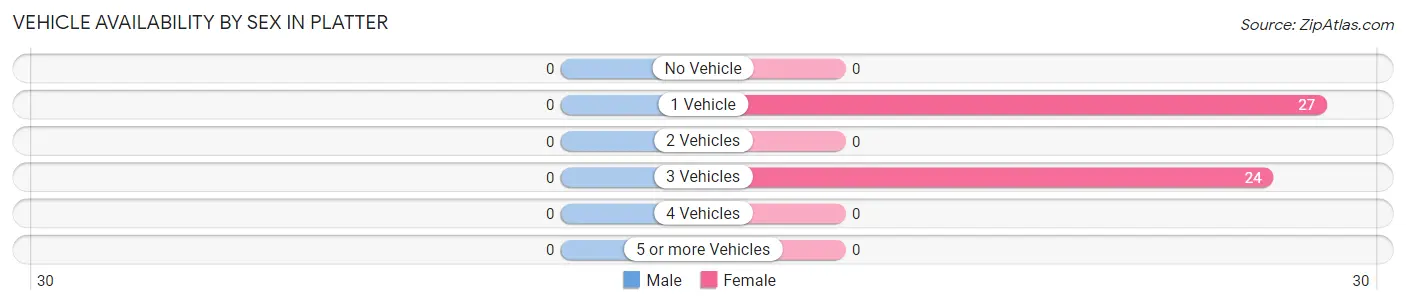
Vehicle Availability by Sex in Platter
Vehicles Available
Male
Female
No Vehicle
0 (0.0%)
0 (0.0%)
1 Vehicle
0 (0.0%)
27 (52.9%)
2 Vehicles
0 (0.0%)
0 (0.0%)
3 Vehicles
0 (0.0%)
24 (47.1%)
4 Vehicles
0 (0.0%)
0 (0.0%)
5 or more Vehicles
0 (0.0%)
0 (0.0%)
Total
0 (0.0%)
51 (100.0%)
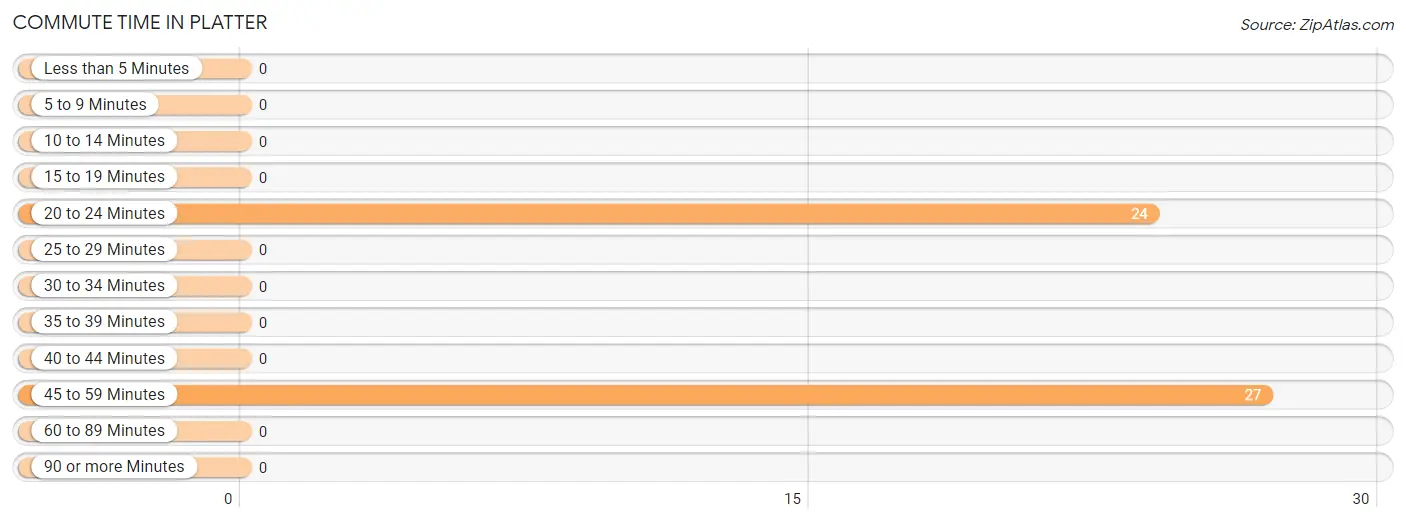
Commute Time in Platter
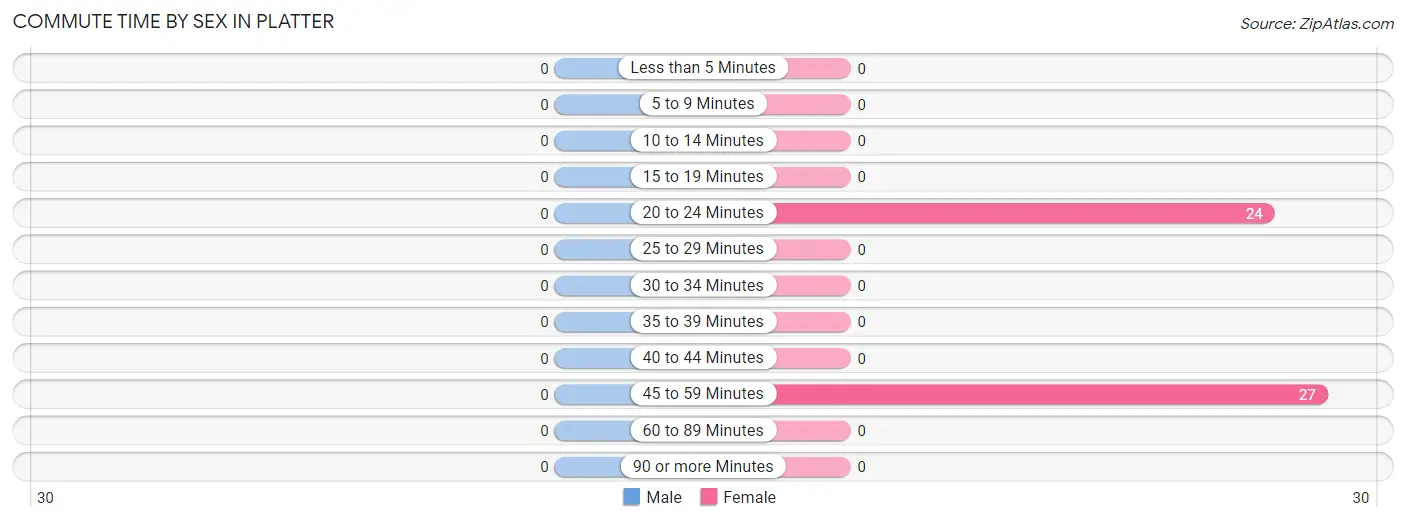
The most frequently occuring commute durations in Platter are 45 to 59 minutes (27 commuters, 52.9%), 20 to 24 minutes (24 commuters, 47.1%), and less than 5 minutes (0 commuters, 0.0%).
Commute Time
# Commuters
% Commuters
Less than 5 Minutes
0
0.0%
5 to 9 Minutes
0
0.0%
10 to 14 Minutes
0
0.0%
15 to 19 Minutes
0
0.0%
20 to 24 Minutes
24
47.1%
25 to 29 Minutes
0
0.0%
30 to 34 Minutes
0
0.0%
35 to 39 Minutes
0
0.0%
40 to 44 Minutes
0
0.0%
45 to 59 Minutes
27
52.9%
60 to 89 Minutes
0
0.0%
90 or more Minutes
0
0.0%
Commute Time by Sex in Platter
Commute Time
Male
Female
Less than 5 Minutes
0 (0.0%)
0 (0.0%)
5 to 9 Minutes
0 (0.0%)
0 (0.0%)
10 to 14 Minutes
0 (0.0%)
0 (0.0%)
15 to 19 Minutes
0 (0.0%)
0 (0.0%)
20 to 24 Minutes
0 (0.0%)
24 (47.1%)
25 to 29 Minutes
0 (0.0%)
0 (0.0%)
30 to 34 Minutes
0 (0.0%)
0 (0.0%)
35 to 39 Minutes
0 (0.0%)
0 (0.0%)
40 to 44 Minutes
0 (0.0%)
0 (0.0%)
45 to 59 Minutes
0 (0.0%)
27 (52.9%)
60 to 89 Minutes
0 (0.0%)
0 (0.0%)
90 or more Minutes
0 (0.0%)
0 (0.0%)
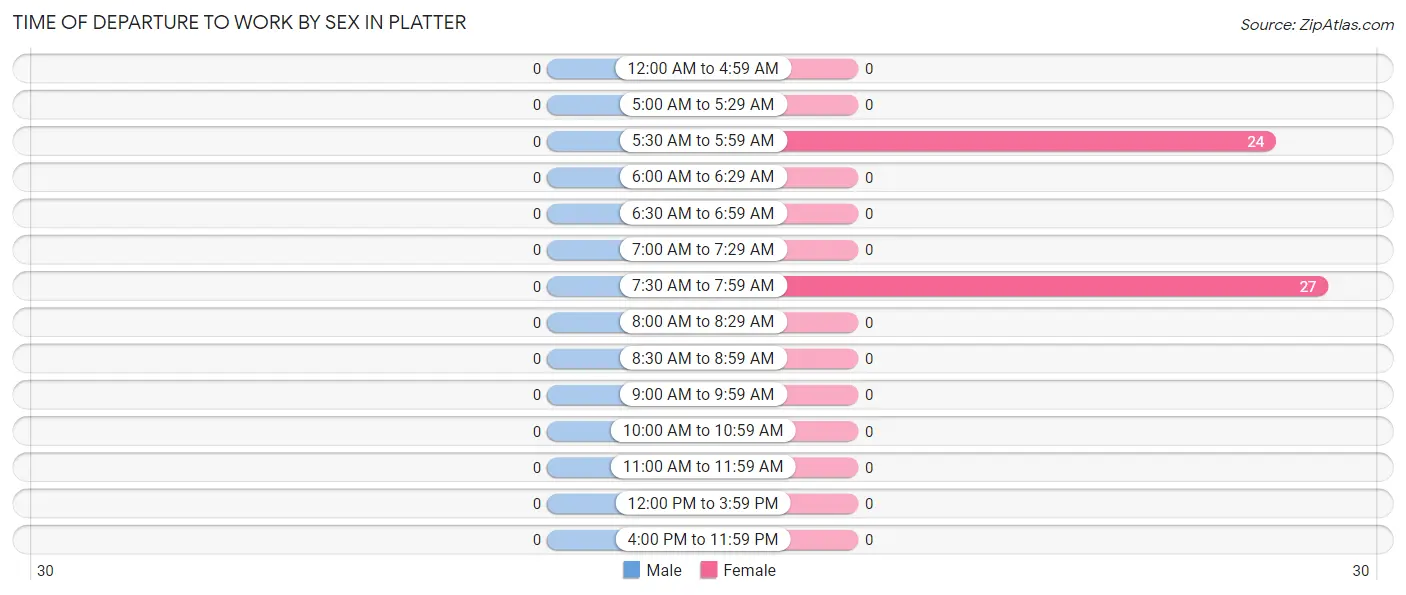
Time of Departure to Work by Sex in Platter
Time of Departure
Male
Female
12:00 AM to 4:59 AM
0 (0.0%)
0 (0.0%)
5:00 AM to 5:29 AM
0 (0.0%)
0 (0.0%)
5:30 AM to 5:59 AM
0 (0.0%)
24 (47.1%)
6:00 AM to 6:29 AM
0 (0.0%)
0 (0.0%)
6:30 AM to 6:59 AM
0 (0.0%)
0 (0.0%)
7:00 AM to 7:29 AM
0 (0.0%)
0 (0.0%)
7:30 AM to 7:59 AM
0 (0.0%)
27 (52.9%)
8:00 AM to 8:29 AM
0 (0.0%)
0 (0.0%)
8:30 AM to 8:59 AM
0 (0.0%)
0 (0.0%)
9:00 AM to 9:59 AM
0 (0.0%)
0 (0.0%)
10:00 AM to 10:59 AM
0 (0.0%)
0 (0.0%)
11:00 AM to 11:59 AM
0 (0.0%)
0 (0.0%)
12:00 PM to 3:59 PM
0 (0.0%)
0 (0.0%)
4:00 PM to 11:59 PM
0 (0.0%)
0 (0.0%)
Total
0 (0.0%)
51 (100.0%)
Housing Occupancy in Platter
Occupancy by Ownership in Platter
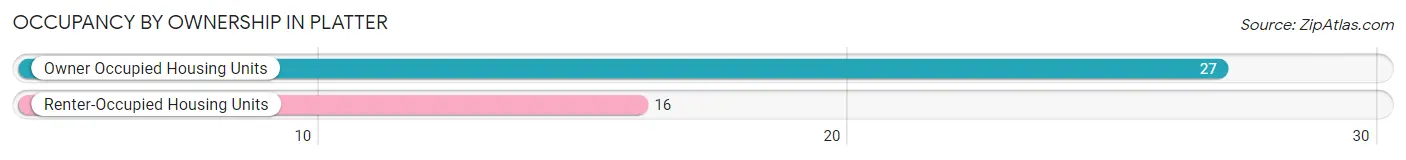
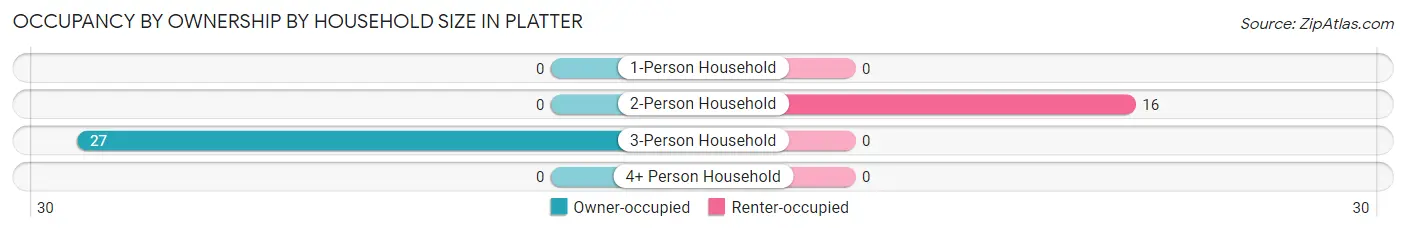
Of the total 43 dwellings in Platter, owner-occupied units account for 27 (62.8%), while renter-occupied units make up 16 (37.2%).
Occupancy
# Housing Units
% Housing Units
Owner Occupied Housing Units
27
62.8%
Renter-Occupied Housing Units
16
37.2%
Total Occupied Housing Units
43
100.0%
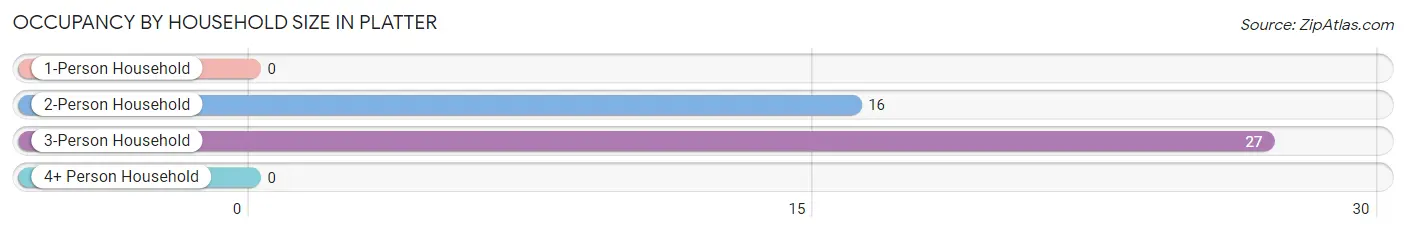
Occupancy by Household Size in Platter
Household Size
# Housing Units
% Housing Units
1-Person Household
0
0.0%
2-Person Household
16
37.2%
3-Person Household
27
62.8%
4+ Person Household
0
0.0%
Total Housing Units
43
100.0%
Occupancy by Ownership by Household Size in Platter
Household Size
Owner-occupied
Renter-occupied
1-Person Household
0 (0.0%)
0 (0.0%)
2-Person Household
0 (0.0%)
16 (100.0%)
3-Person Household
27 (100.0%)
0 (0.0%)
4+ Person Household
0 (0.0%)
0 (0.0%)
Total Housing Units
27 (62.8%)
16 (37.2%)
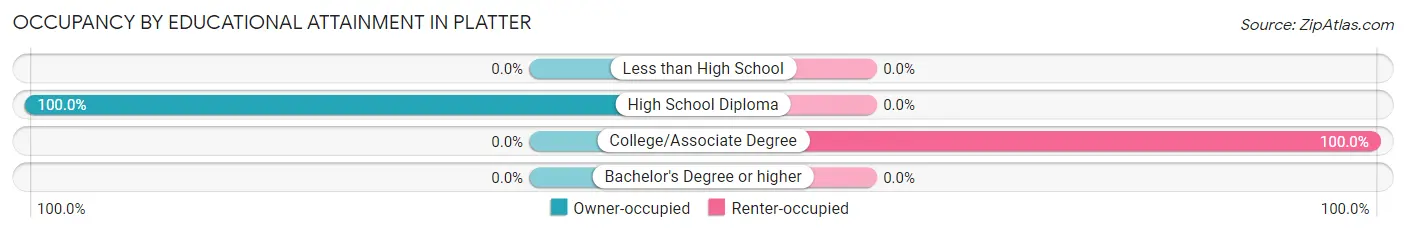
Occupancy by Educational Attainment in Platter
Household Size
Owner-occupied
Renter-occupied
Less than High School
0 (0.0%)
0 (0.0%)
High School Diploma
27 (100.0%)
0 (0.0%)
College/Associate Degree
0 (0.0%)
16 (100.0%)
Bachelor's Degree or higher
0 (0.0%)
0 (0.0%)
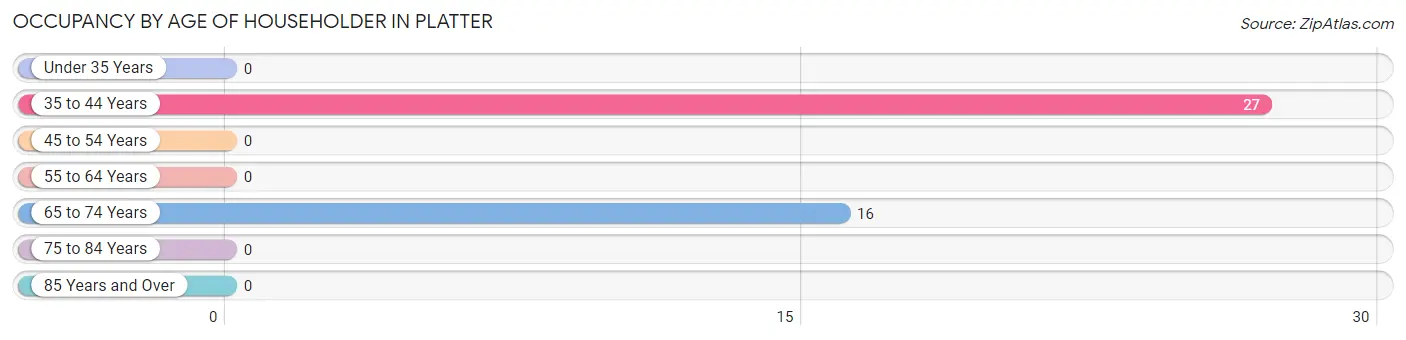
Occupancy by Age of Householder in Platter
Age Bracket
# Households
% Households
Under 35 Years
0
0.0%
35 to 44 Years
27
62.8%
45 to 54 Years
0
0.0%
55 to 64 Years
0
0.0%
65 to 74 Years
16
37.2%
75 to 84 Years
0
0.0%
85 Years and Over
0
0.0%
Total
43
100.0%
Housing Finances in Platter
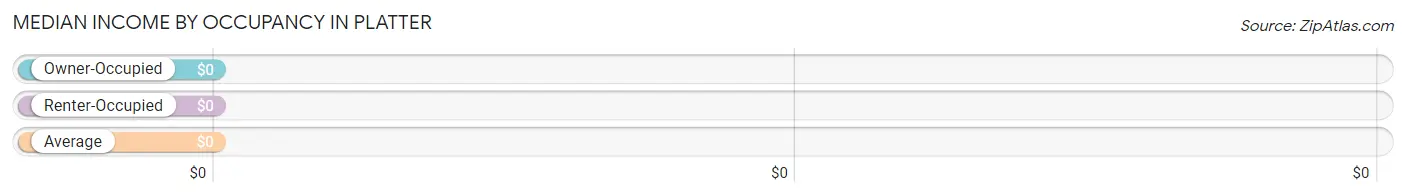
Median Income by Occupancy in Platter
Occupancy Type
# Households
Median Income
Owner-Occupied
27 (62.8%)
$0
Renter-Occupied
16 (37.2%)
$0
Average
43 (100.0%)
$0
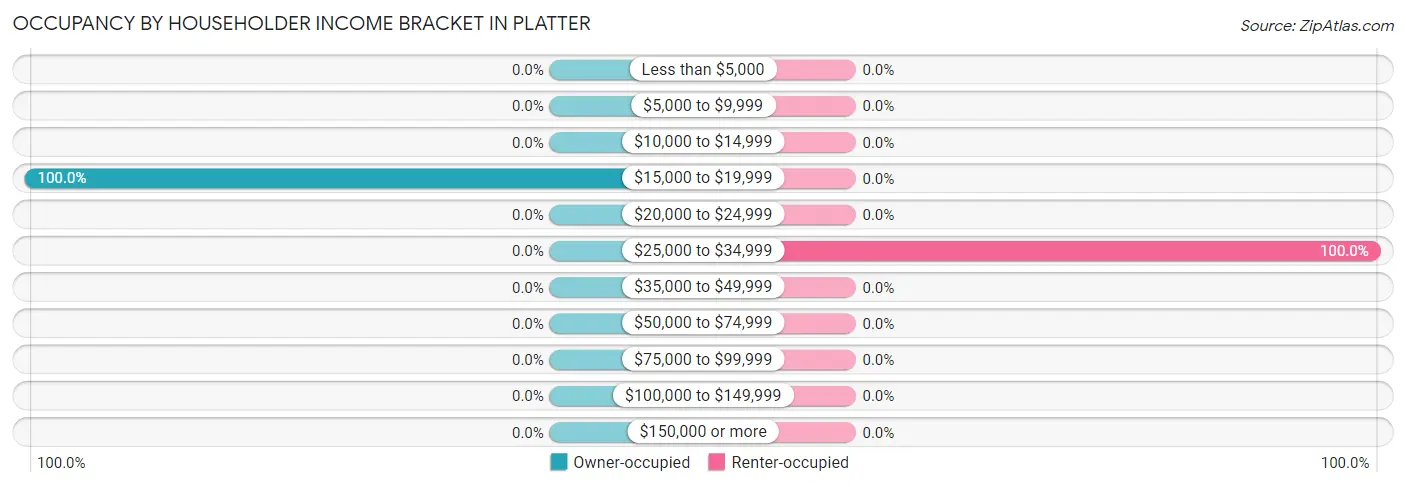
Occupancy by Householder Income Bracket in Platter
Income Bracket
Owner-occupied
Renter-occupied
Less than $5,000
0 (0.0%)
0 (0.0%)
$5,000 to $9,999
0 (0.0%)
0 (0.0%)
$10,000 to $14,999
0 (0.0%)
0 (0.0%)
$15,000 to $19,999
27 (100.0%)
0 (0.0%)
$20,000 to $24,999
0 (0.0%)
0 (0.0%)
$25,000 to $34,999
0 (0.0%)
16 (100.0%)
$35,000 to $49,999
0 (0.0%)
0 (0.0%)
$50,000 to $74,999
0 (0.0%)
0 (0.0%)
$75,000 to $99,999
0 (0.0%)
0 (0.0%)
$100,000 to $149,999
0 (0.0%)
0 (0.0%)
$150,000 or more
0 (0.0%)
0 (0.0%)
Total
27 (100.0%)
16 (100.0%)
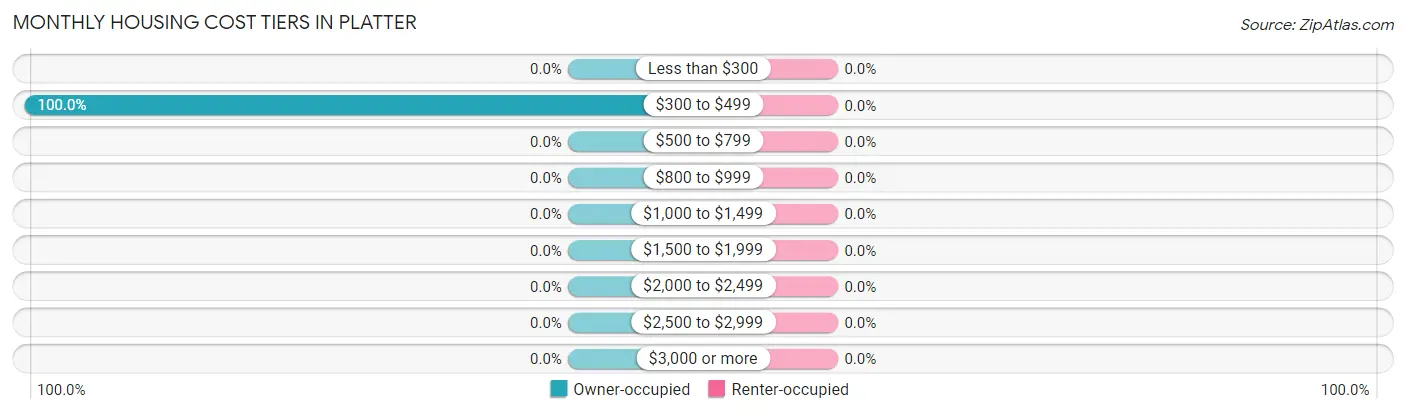
Monthly Housing Cost Tiers in Platter
Monthly Cost
Owner-occupied
Renter-occupied
Less than $300
0 (0.0%)
0 (0.0%)
$300 to $499
27 (100.0%)
0 (0.0%)
$500 to $799
0 (0.0%)
0 (0.0%)
$800 to $999
0 (0.0%)
0 (0.0%)
$1,000 to $1,499
0 (0.0%)
0 (0.0%)
$1,500 to $1,999
0 (0.0%)
0 (0.0%)
$2,000 to $2,499
0 (0.0%)
0 (0.0%)
$2,500 to $2,999
0 (0.0%)
0 (0.0%)
$3,000 or more
0 (0.0%)
0 (0.0%)
Total
27 (100.0%)
16 (100.0%)
Physical Housing Characteristics in Platter
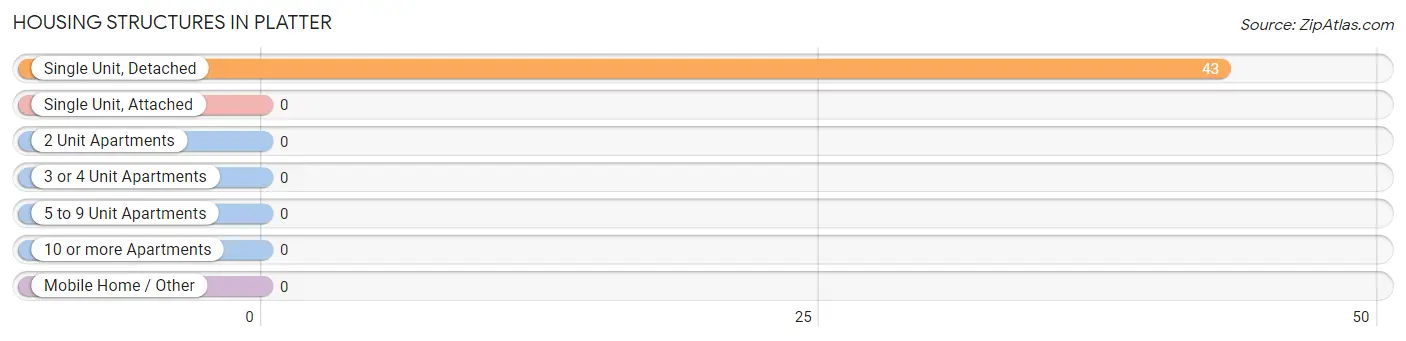
Housing Structures in Platter
Structure Type
# Housing Units
% Housing Units
Single Unit, Detached
43
100.0%
Single Unit, Attached
0
0.0%
2 Unit Apartments
0
0.0%
3 or 4 Unit Apartments
0
0.0%
5 to 9 Unit Apartments
0
0.0%
10 or more Apartments
0
0.0%
Mobile Home / Other
0
0.0%
Total
43
100.0%
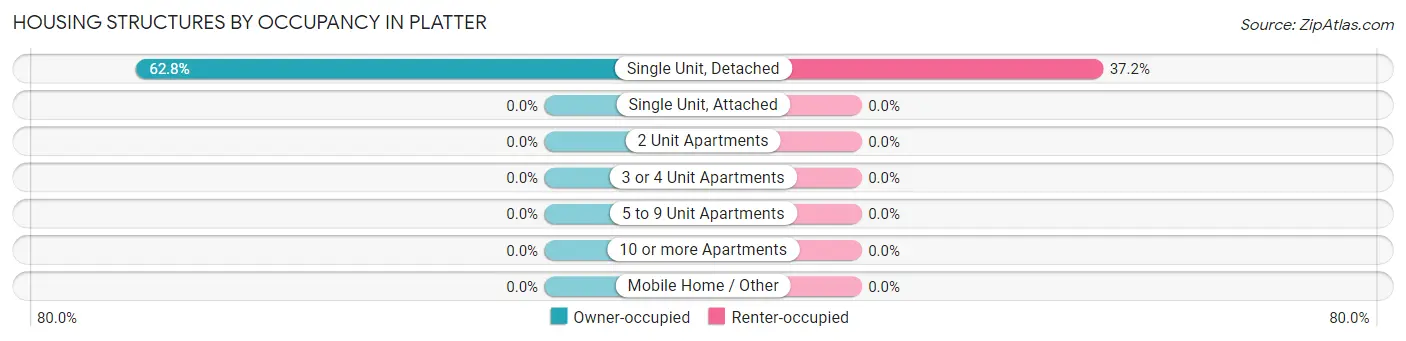
Housing Structures by Occupancy in Platter
Structure Type
Owner-occupied
Renter-occupied
Single Unit, Detached
27 (62.8%)
16 (37.2%)
Single Unit, Attached
0 (0.0%)
0 (0.0%)
2 Unit Apartments
0 (0.0%)
0 (0.0%)
3 or 4 Unit Apartments
0 (0.0%)
0 (0.0%)
5 to 9 Unit Apartments
0 (0.0%)
0 (0.0%)
10 or more Apartments
0 (0.0%)
0 (0.0%)
Mobile Home / Other
0 (0.0%)
0 (0.0%)
Total
27 (62.8%)
16 (37.2%)
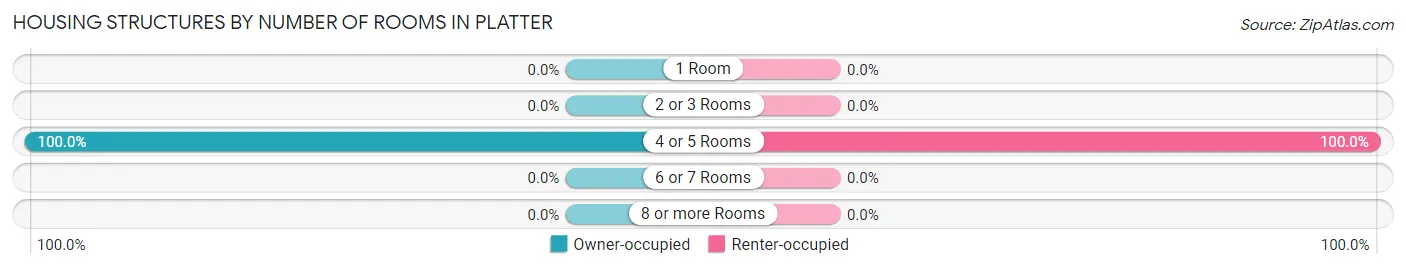
Housing Structures by Number of Rooms in Platter
Number of Rooms
Owner-occupied
Renter-occupied
1 Room
0 (0.0%)
0 (0.0%)
2 or 3 Rooms
0 (0.0%)
0 (0.0%)
4 or 5 Rooms
27 (100.0%)
16 (100.0%)
6 or 7 Rooms
0 (0.0%)
0 (0.0%)
8 or more Rooms
0 (0.0%)
0 (0.0%)
Total
27 (100.0%)
16 (100.0%)
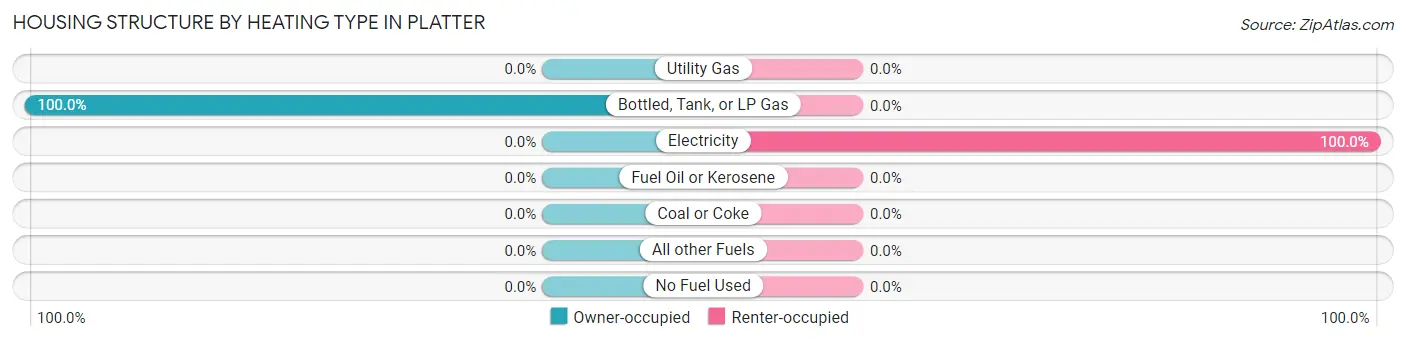
Housing Structure by Heating Type in Platter
Heating Type
Owner-occupied
Renter-occupied
Utility Gas
0 (0.0%)
0 (0.0%)
Bottled, Tank, or LP Gas
27 (100.0%)
0 (0.0%)
Electricity
0 (0.0%)
16 (100.0%)
Fuel Oil or Kerosene
0 (0.0%)
0 (0.0%)
Coal or Coke
0 (0.0%)
0 (0.0%)
All other Fuels
0 (0.0%)
0 (0.0%)
No Fuel Used
0 (0.0%)
0 (0.0%)
Total
27 (100.0%)
16 (100.0%)
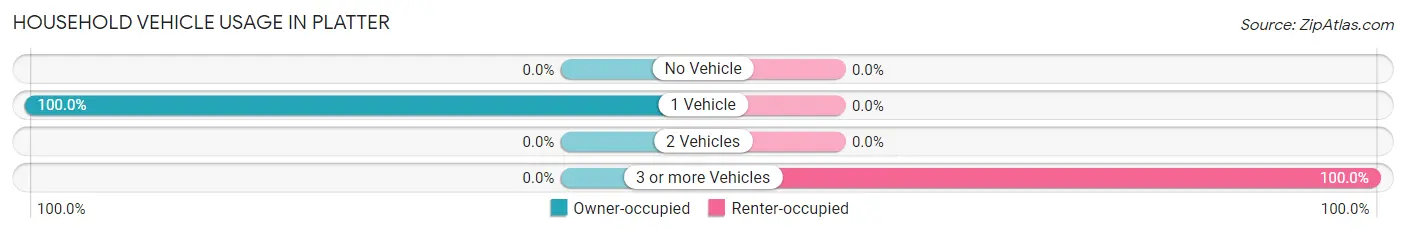
Household Vehicle Usage in Platter
Vehicles per Household
Owner-occupied
Renter-occupied
No Vehicle
0 (0.0%)
0 (0.0%)
1 Vehicle
27 (100.0%)
0 (0.0%)
2 Vehicles
0 (0.0%)
0 (0.0%)
3 or more Vehicles
0 (0.0%)
16 (100.0%)
Total
27 (100.0%)
16 (100.0%)
Real Estate & Mortgages in Platter
Real Estate and Mortgage Overview in Platter
Characteristic
Without Mortgage
With Mortgage
Housing Units
27
0
Median Property Value
-
-
Median Household Income
-
-
Monthly Housing Costs
-
-
Real Estate Taxes
-
-
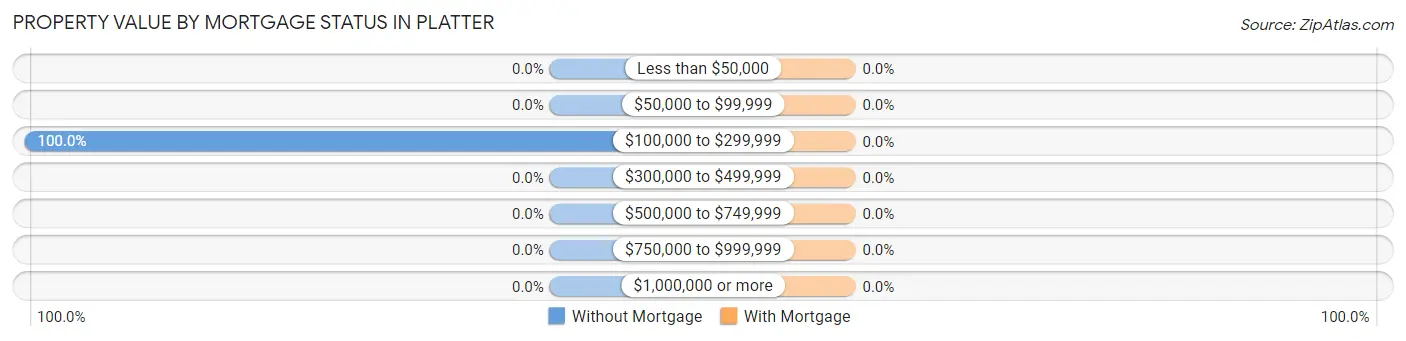
Property Value by Mortgage Status in Platter
Property Value
Without Mortgage
With Mortgage
Less than $50,000
0 (0.0%)
0 (0.0%)
$50,000 to $99,999
0 (0.0%)
0 (0.0%)
$100,000 to $299,999
27 (100.0%)
0 (0.0%)
$300,000 to $499,999
0 (0.0%)
0 (0.0%)
$500,000 to $749,999
0 (0.0%)
0 (0.0%)
$750,000 to $999,999
0 (0.0%)
0 (0.0%)
$1,000,000 or more
0 (0.0%)
0 (0.0%)
Total
27 (100.0%)
0 (0.0%)
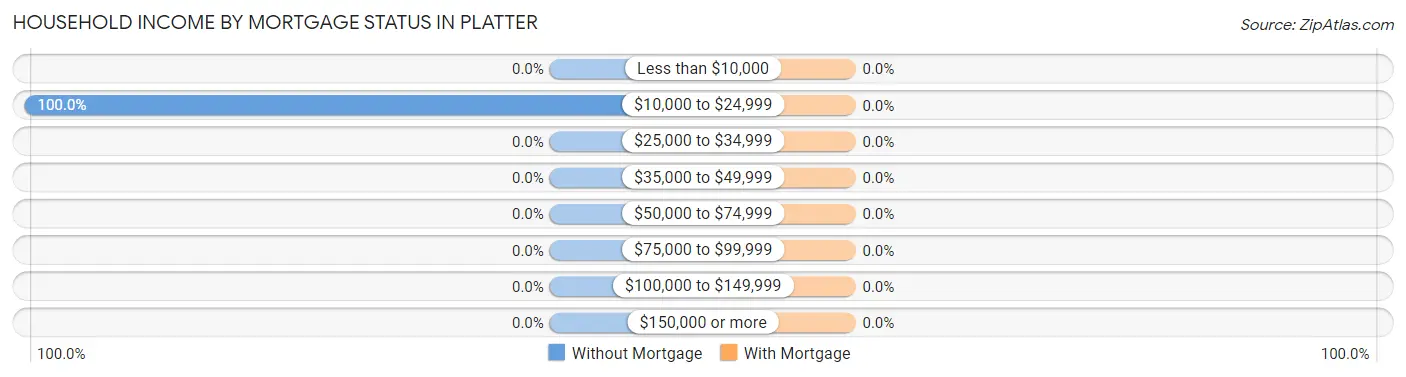
Household Income by Mortgage Status in Platter
Household Income
Without Mortgage
With Mortgage
Less than $10,000
0 (0.0%)
0 (0.0%)
$10,000 to $24,999
27 (100.0%)
0 (0.0%)
$25,000 to $34,999
0 (0.0%)
0 (0.0%)
$35,000 to $49,999
0 (0.0%)
0 (0.0%)
$50,000 to $74,999
0 (0.0%)
0 (0.0%)
$75,000 to $99,999
0 (0.0%)
0 (0.0%)
$100,000 to $149,999
0 (0.0%)
0 (0.0%)
$150,000 or more
0 (0.0%)
0 (0.0%)
Total
27 (100.0%)
0 (0.0%)
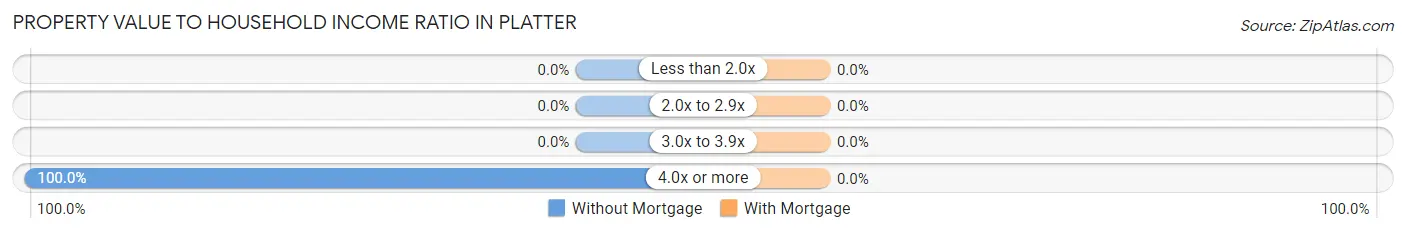
Property Value to Household Income Ratio in Platter
Value-to-Income Ratio
Without Mortgage
With Mortgage
Less than 2.0x
0 (0.0%)
0 (0.0%)
2.0x to 2.9x
0 (0.0%)
0 (0.0%)
3.0x to 3.9x
0 (0.0%)
0 (0.0%)
4.0x or more
27 (100.0%)
0 (0.0%)
Total
27 (100.0%)
0 (0.0%)
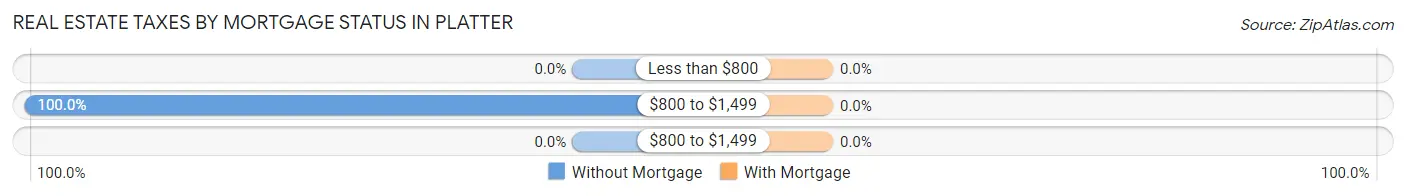
Real Estate Taxes by Mortgage Status in Platter
Property Taxes
Without Mortgage
With Mortgage
Less than $800
0 (0.0%)
0 (0.0%)
$800 to $1,499
27 (100.0%)
0 (0.0%)
$800 to $1,499
0 (0.0%)
0 (0.0%)
Total
27 (100.0%)
0 (0.0%)
Health & Disability in Platter
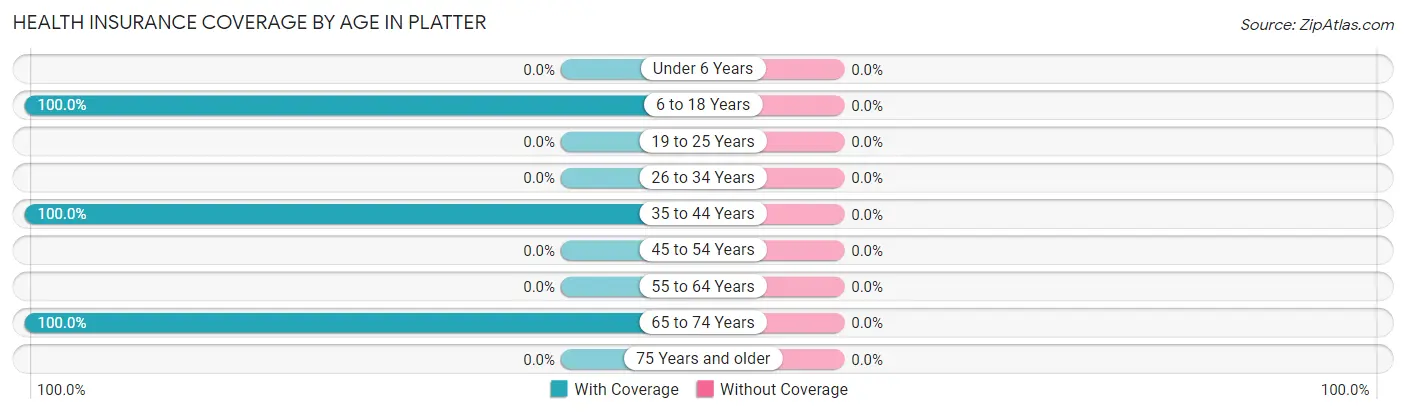
Health Insurance Coverage by Age in Platter
Age Bracket
With Coverage
Without Coverage
Under 6 Years
0 (0.0%)
0 (0.0%)
6 to 18 Years
39 (100.0%)
0 (0.0%)
19 to 25 Years
0 (0.0%)
0 (0.0%)
26 to 34 Years
0 (0.0%)
0 (0.0%)
35 to 44 Years
27 (100.0%)
0 (0.0%)
45 to 54 Years
0 (0.0%)
0 (0.0%)
55 to 64 Years
0 (0.0%)
0 (0.0%)
65 to 74 Years
40 (100.0%)
0 (0.0%)
75 Years and older
0 (0.0%)
0 (0.0%)
Total
106 (100.0%)
0 (0.0%)
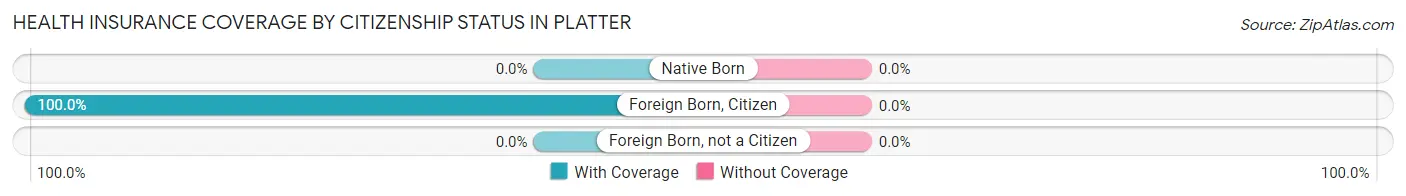
Health Insurance Coverage by Citizenship Status in Platter
Citizenship Status
With Coverage
Without Coverage
Native Born
0 (0.0%)
0 (0.0%)
Foreign Born, Citizen
39 (100.0%)
0 (0.0%)
Foreign Born, not a Citizen
0 (0.0%)
0 (0.0%)
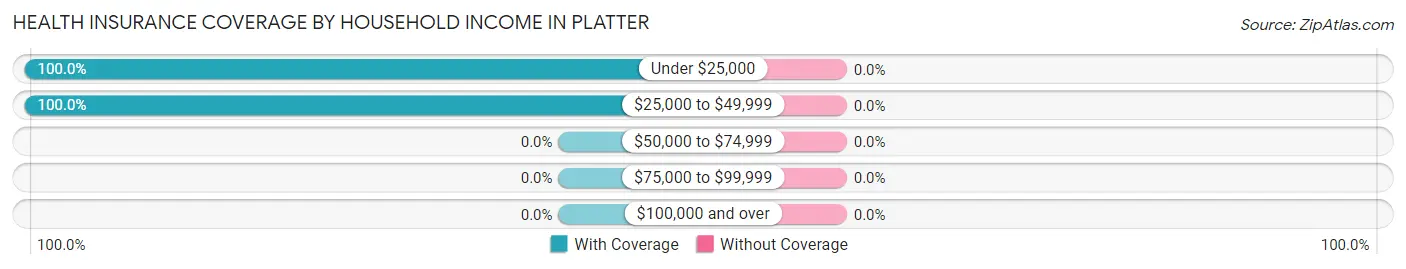
Health Insurance Coverage by Household Income in Platter
Household Income
With Coverage
Without Coverage
Under $25,000
66 (100.0%)
0 (0.0%)
$25,000 to $49,999
40 (100.0%)
0 (0.0%)
$50,000 to $74,999
0 (0.0%)
0 (0.0%)
$75,000 to $99,999
0 (0.0%)
0 (0.0%)
$100,000 and over
0 (0.0%)
0 (0.0%)
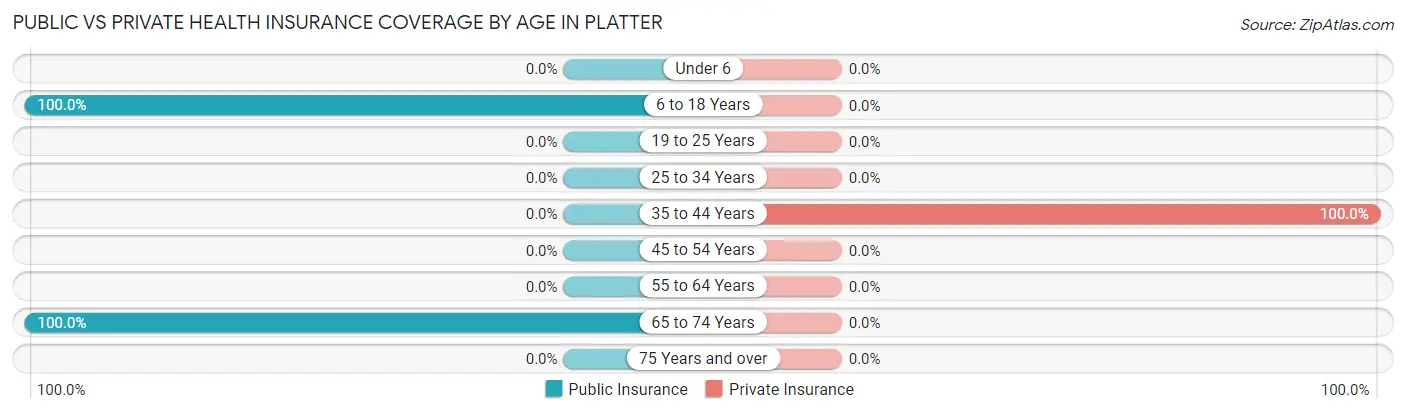
Public vs Private Health Insurance Coverage by Age in Platter
Age Bracket
Public Insurance
Private Insurance
Under 6
0 (0.0%)
0 (0.0%)
6 to 18 Years
39 (100.0%)
0 (0.0%)
19 to 25 Years
0 (0.0%)
0 (0.0%)
25 to 34 Years
0 (0.0%)
0 (0.0%)
35 to 44 Years
0 (0.0%)
27 (100.0%)
45 to 54 Years
0 (0.0%)
0 (0.0%)
55 to 64 Years
0 (0.0%)
0 (0.0%)
65 to 74 Years
40 (100.0%)
0 (0.0%)
75 Years and over
0 (0.0%)
0 (0.0%)
Total
79 (74.5%)
27 (25.5%)
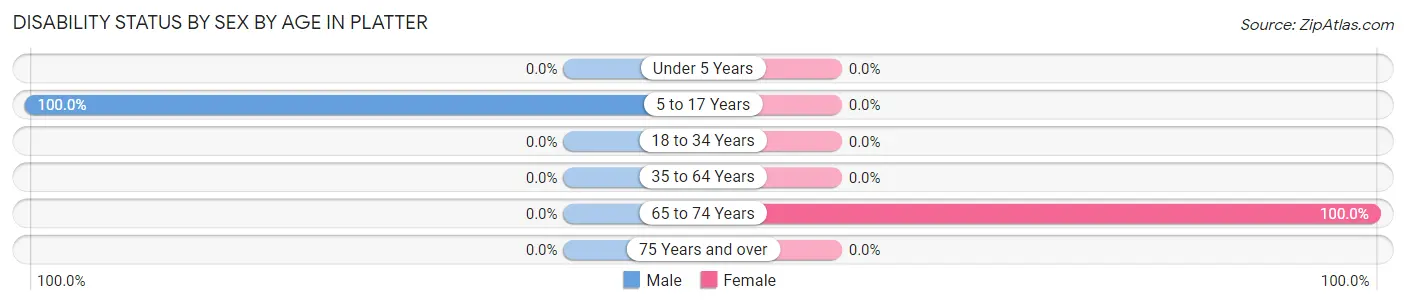
Disability Status by Sex by Age in Platter
Age Bracket
Male
Female
Under 5 Years
0 (0.0%)
0 (0.0%)
5 to 17 Years
21 (100.0%)
0 (0.0%)
18 to 34 Years
0 (0.0%)
0 (0.0%)
35 to 64 Years
0 (0.0%)
0 (0.0%)
65 to 74 Years
0 (0.0%)
24 (100.0%)
75 Years and over
0 (0.0%)
0 (0.0%)
Disability Class by Sex by Age in Platter
Disability Class: Hearing Difficulty
Age Bracket
Male
Female
Under 5 Years
0 (0.0%)
0 (0.0%)
5 to 17 Years
0 (0.0%)
0 (0.0%)
18 to 34 Years
0 (0.0%)
0 (0.0%)
35 to 64 Years
0 (0.0%)
0 (0.0%)
65 to 74 Years
0 (0.0%)
0 (0.0%)
75 Years and over
0 (0.0%)
0 (0.0%)
Disability Class: Vision Difficulty
Age Bracket
Male
Female
Under 5 Years
0 (0.0%)
0 (0.0%)
5 to 17 Years
0 (0.0%)
0 (0.0%)
18 to 34 Years
0 (0.0%)
0 (0.0%)
35 to 64 Years
0 (0.0%)
0 (0.0%)
65 to 74 Years
0 (0.0%)
0 (0.0%)
75 Years and over
0 (0.0%)
0 (0.0%)
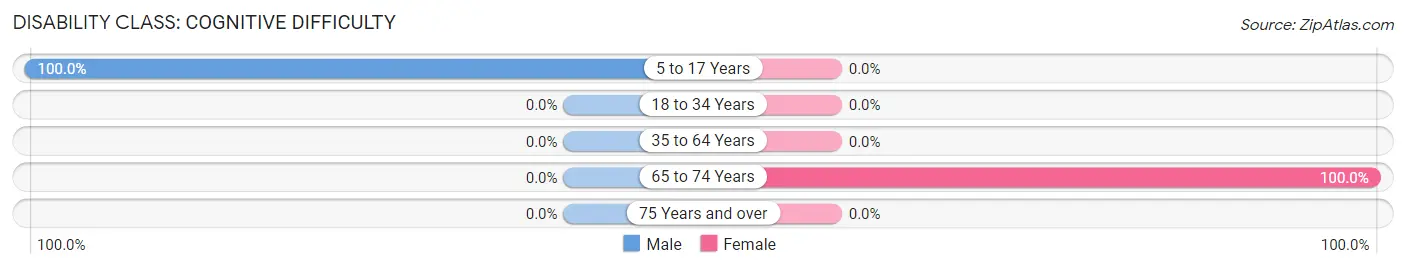
Disability Class: Cognitive Difficulty
Age Bracket
Male
Female
5 to 17 Years
21 (100.0%)
0 (0.0%)
18 to 34 Years
0 (0.0%)
0 (0.0%)
35 to 64 Years
0 (0.0%)
0 (0.0%)
65 to 74 Years
0 (0.0%)
24 (100.0%)
75 Years and over
0 (0.0%)
0 (0.0%)
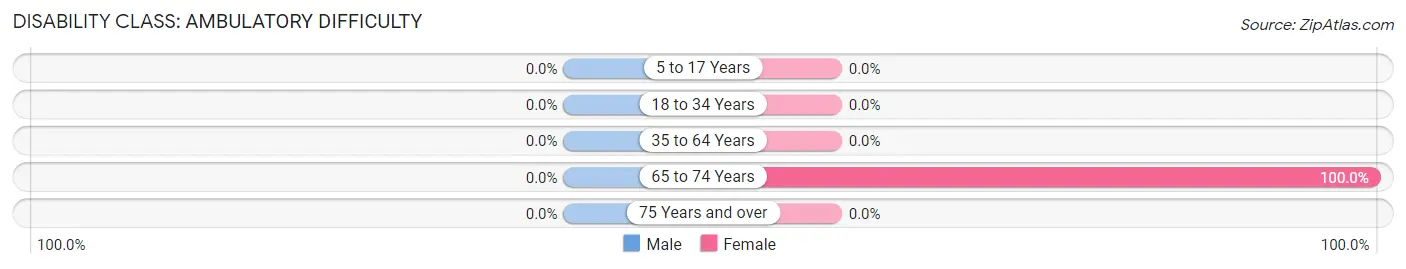
Disability Class: Ambulatory Difficulty
Age Bracket
Male
Female
5 to 17 Years
0 (0.0%)
0 (0.0%)
18 to 34 Years
0 (0.0%)
0 (0.0%)
35 to 64 Years
0 (0.0%)
0 (0.0%)
65 to 74 Years
0 (0.0%)
24 (100.0%)
75 Years and over
0 (0.0%)
0 (0.0%)
Disability Class: Self-Care Difficulty
Age Bracket
Male
Female
5 to 17 Years
0 (0.0%)
0 (0.0%)
18 to 34 Years
0 (0.0%)
0 (0.0%)
35 to 64 Years
0 (0.0%)
0 (0.0%)
65 to 74 Years
0 (0.0%)
0 (0.0%)
75 Years and over
0 (0.0%)
0 (0.0%)
Technology Access in Platter
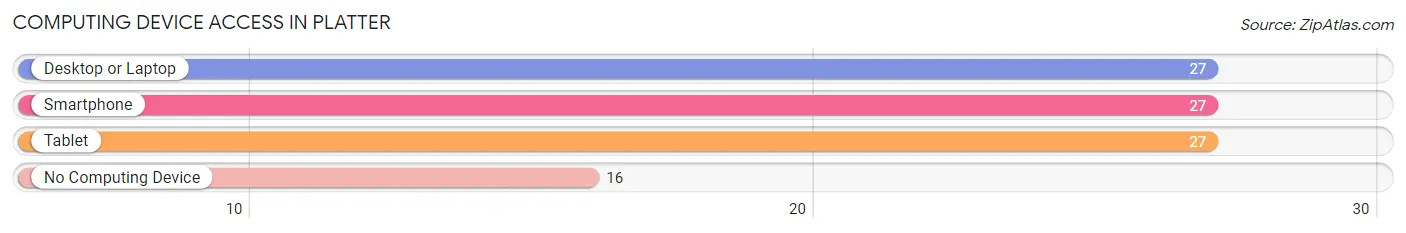
Computing Device Access in Platter
Device Type
# Households
% Households
Desktop or Laptop
27
62.8%
Smartphone
27
62.8%
Tablet
27
62.8%
No Computing Device
16
37.2%
Total
43
100.0%
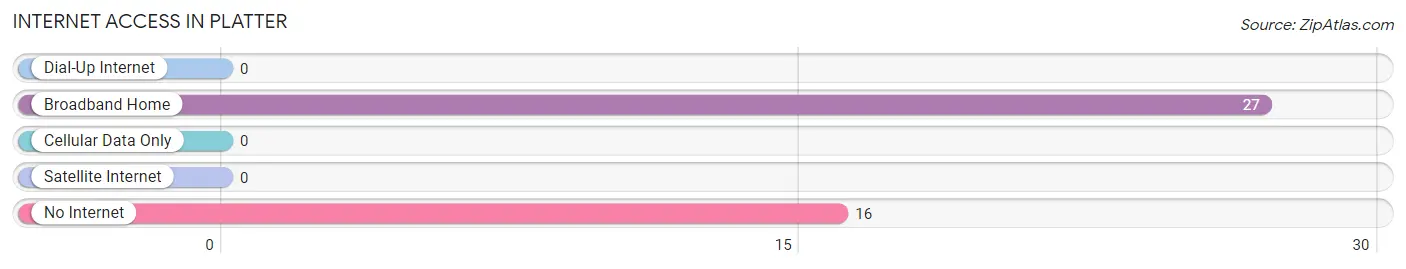
Internet Access in Platter
Internet Type
# Households
% Households
Dial-Up Internet
0
0.0%
Broadband Home
27
62.8%
Cellular Data Only
0
0.0%
Satellite Internet
0
0.0%
No Internet
16
37.2%
Total
43
100.0%
Platter Summary
Platter is a small town located in southeastern Oklahoma, in the United States. It is situated in Pushmataha County, and is part of the Antlers Micropolitan Statistical Area. The town has a population of approximately 500 people, and is located about 20 miles south of Antlers, the county seat.
Geography
Platter is located in the foothills of the Ouachita Mountains, and is surrounded by rolling hills and forests. The town is situated on the banks of the Kiamichi River, and is bordered by the towns of Rattan and Clayton to the north, and the towns of Albion and Tuskahoma to the south. The town is located about 20 miles south of Antlers, the county seat, and about 80 miles east of Oklahoma City.
Climate
Platter has a humid subtropical climate, with hot summers and mild winters. The average annual temperature is around 64°F, with an average high of around 90°F in the summer months and an average low of around 40°F in the winter months. The town receives an average of around 45 inches of precipitation per year, with most of it falling in the spring and summer months.
Economy
The economy of Platter is largely based on agriculture and forestry. The town is home to several small farms, which produce a variety of crops, including corn, soybeans, wheat, and hay. The town is also home to several timber companies, which harvest and process timber from the surrounding forests. In addition, the town is home to several small businesses, including a grocery store, a hardware store, and a few restaurants.
Demographics
As of the 2010 census, Platter had a population of 498 people. The racial makeup of the town was 95.2% White, 0.2% African American, 0.4% Native American, 0.2% Asian, 0.2% from other races, and 3.8% from two or more races. The median household income was $30,000, and the median family income was $35,000. The per capita income was $14,000.
Education
Platter is served by the Pushmataha County School District, which operates one elementary school and one high school in the town. The elementary school serves students in grades K-5, while the high school serves students in grades 6-12. The town is also home to a branch of the Eastern Oklahoma State College, which offers a variety of associate degree and certificate programs.
Conclusion
Platter is a small town located in southeastern Oklahoma, in the United States. It is situated in Pushmataha County, and is part of the Antlers Micropolitan Statistical Area. The town has a population of approximately 500 people, and is surrounded by rolling hills and forests. The economy of Platter is largely based on agriculture and forestry, and the town is served by the Pushmataha County School District. Platter is a quiet, rural town with a rich history and a bright future.
Common Questions
What is the Total Population of Platter?
Total Population of Platter is 106.
What is the Total Male Population of Platter?
Total Male Population of Platter is 37.
What is the Total Female Population of Platter?
Total Female Population of Platter is 69.
What is the Ratio of Males per 100 Females in Platter?
There are 53.62 Males per 100 Females in Platter.
What is the Ratio of Females per 100 Males in Platter?
There are 186.49 Females per 100 Males in Platter.
What is the Median Population Age in Platter?
Median Population Age in Platter is 39.5 Years.
What is the Average Family Size in Platter
Average Family Size in Platter is 2.5 People.
What is the Average Household Size in Platter
Average Household Size in Platter is 2.5 People.
What is Per Capita Income in Platter?
Per Capita income in Platter is $10,758.
What is Inequality or Gini Index in Platter?
Inequality or Gini Index in Platter is 0.09.
How Large is the Labor Force in Platter?
There are 51 People in the Labor Forcein in Platter.
What is the Percentage of People in the Labor Force in Platter?
76.1% of People are in the Labor Force in Platter.
Report Title
Report Link
HTML Copy & Paste Link
Social Media
Copy and paste the folowing code into any webpage where you would like this interactive chart to display