Zip Codes with the Highest Percentage of Population Employed in Transportation & Warehousing in Ohio
RELATED REPORTS & OPTIONS
Transportation & Warehousing
Ohio
Compare Zip Codes
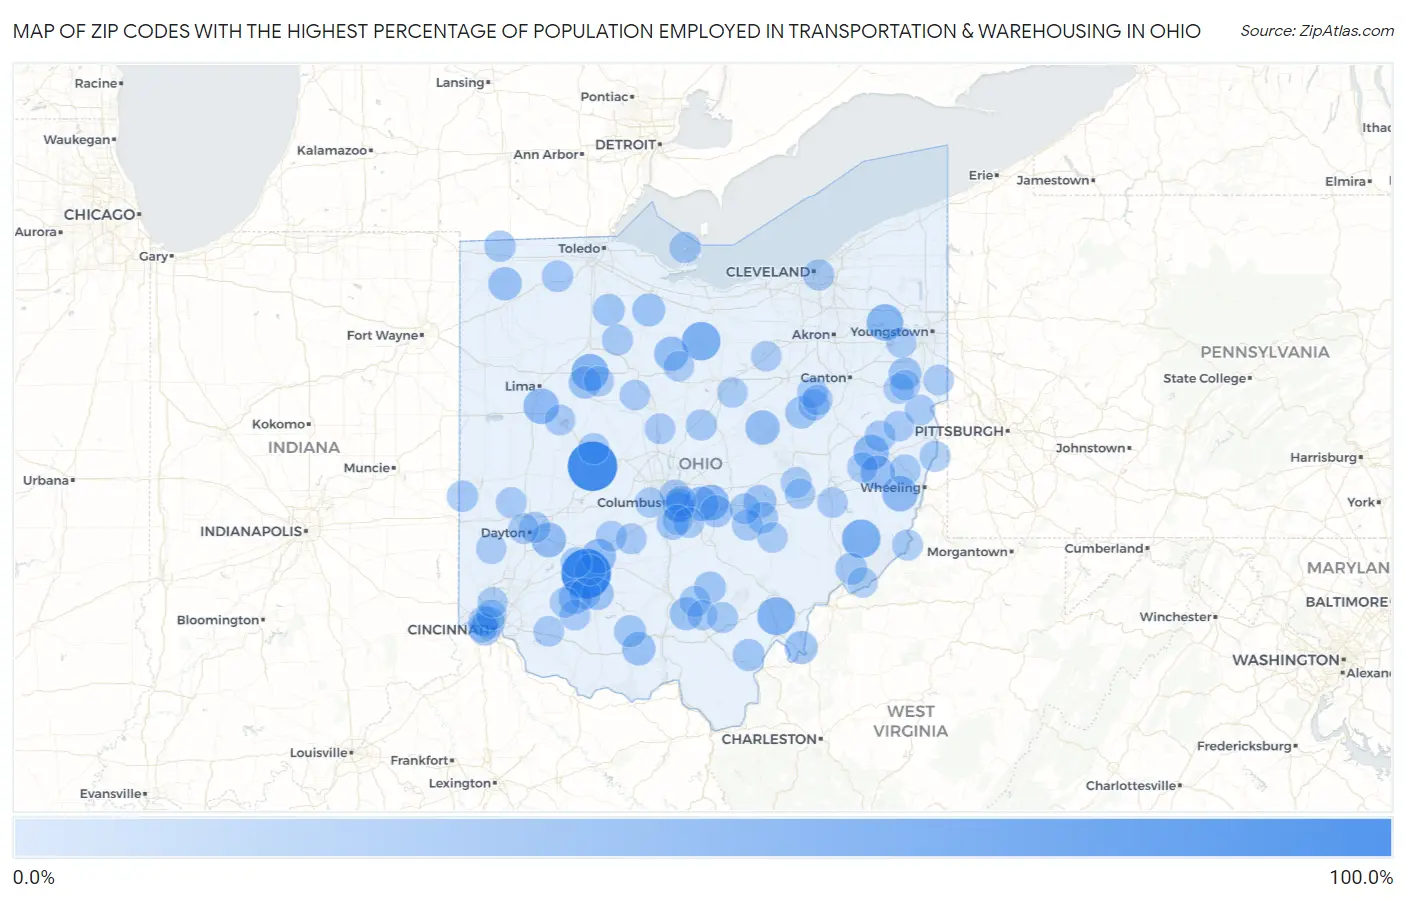
Map of Zip Codes with the Highest Percentage of Population Employed in Transportation & Warehousing in Ohio
0.0%
100.0%
Zip Codes with the Highest Percentage of Population Employed in Transportation & Warehousing in Ohio
| Zip Code | % Employed | vs State | vs National | |
| 1. | 45166 | 100.0% | 4.9%(+95.1)#1 | 4.9%(+95.1)#8 |
| 2. | 43047 | 100.0% | 4.9%(+95.1)#2 | 4.9%(+95.1)#25 |
| 3. | 44850 | 47.8% | 4.9%(+42.8)#3 | 4.9%(+42.8)#89 |
| 4. | 43786 | 47.6% | 4.9%(+42.7)#4 | 4.9%(+42.7)#93 |
| 5. | 45776 | 45.0% | 4.9%(+40.1)#5 | 4.9%(+40.1)#104 |
| 6. | 45897 | 41.2% | 4.9%(+36.2)#6 | 4.9%(+36.2)#123 |
| 7. | 44285 | 38.6% | 4.9%(+33.7)#7 | 4.9%(+33.7)#142 |
| 8. | 45888 | 34.0% | 4.9%(+29.0)#8 | 4.9%(+29.0)#176 |
| 9. | 43967 | 33.6% | 4.9%(+28.6)#9 | 4.9%(+28.6)#181 |
| 10. | 44693 | 33.3% | 4.9%(+28.4)#10 | 4.9%(+28.4)#184 |
| 11. | 43033 | 33.0% | 4.9%(+28.1)#11 | 4.9%(+28.0)#190 |
| 12. | 43142 | 30.0% | 4.9%(+25.1)#12 | 4.9%(+25.1)#226 |
| 13. | 45301 | 29.8% | 4.9%(+24.9)#13 | 4.9%(+24.8)#234 |
| 14. | 43018 | 28.9% | 4.9%(+24.0)#14 | 4.9%(+23.9)#251 |
| 15. | 43006 | 28.7% | 4.9%(+23.7)#15 | 4.9%(+23.7)#253 |
| 16. | 44825 | 27.8% | 4.9%(+22.8)#16 | 4.9%(+22.8)#273 |
| 17. | 43985 | 27.0% | 4.9%(+22.0)#17 | 4.9%(+22.0)#291 |
| 18. | 45671 | 24.2% | 4.9%(+19.2)#18 | 4.9%(+19.2)#357 |
| 19. | 43519 | 24.0% | 4.9%(+19.0)#19 | 4.9%(+19.0)#367 |
| 20. | 44861 | 22.4% | 4.9%(+17.5)#20 | 4.9%(+17.5)#413 |
| 21. | 45770 | 22.4% | 4.9%(+17.5)#21 | 4.9%(+17.4)#415 |
| 22. | 45673 | 22.1% | 4.9%(+17.2)#22 | 4.9%(+17.2)#432 |
| 23. | 43746 | 21.2% | 4.9%(+16.3)#23 | 4.9%(+16.3)#464 |
| 24. | 44493 | 20.6% | 4.9%(+15.7)#24 | 4.9%(+15.7)#500 |
| 25. | 45146 | 20.6% | 4.9%(+15.7)#25 | 4.9%(+15.6)#501 |
| 26. | 43227 | 20.3% | 4.9%(+15.3)#26 | 4.9%(+15.3)#528 |
| 27. | 45835 | 20.1% | 4.9%(+15.2)#27 | 4.9%(+15.2)#533 |
| 28. | 45132 | 20.0% | 4.9%(+15.1)#28 | 4.9%(+15.1)#540 |
| 29. | 43046 | 18.5% | 4.9%(+13.6)#29 | 4.9%(+13.6)#634 |
| 30. | 43467 | 18.5% | 4.9%(+13.5)#30 | 4.9%(+13.5)#642 |
| 31. | 44610 | 18.2% | 4.9%(+13.2)#31 | 4.9%(+13.2)#664 |
| 32. | 45614 | 18.0% | 4.9%(+13.1)#32 | 4.9%(+13.1)#681 |
| 33. | 45646 | 17.8% | 4.9%(+12.8)#33 | 4.9%(+12.8)#704 |
| 34. | 43217 | 17.6% | 4.9%(+12.6)#34 | 4.9%(+12.6)#715 |
| 35. | 43152 | 17.4% | 4.9%(+12.4)#35 | 4.9%(+12.4)#733 |
| 36. | 45225 | 16.6% | 4.9%(+11.7)#36 | 4.9%(+11.7)#831 |
| 37. | 45788 | 16.4% | 4.9%(+11.5)#37 | 4.9%(+11.5)#858 |
| 38. | 43510 | 15.2% | 4.9%(+10.2)#38 | 4.9%(+10.2)#1,029 |
| 39. | 45159 | 15.0% | 4.9%(+10.0)#39 | 4.9%(+10.0)#1,071 |
| 40. | 43501 | 14.7% | 4.9%(+9.73)#40 | 4.9%(+9.72)#1,129 |
| 41. | 45332 | 14.6% | 4.9%(+9.68)#41 | 4.9%(+9.67)#1,139 |
| 42. | 43738 | 14.6% | 4.9%(+9.65)#42 | 4.9%(+9.64)#1,146 |
| 43. | 44690 | 14.3% | 4.9%(+9.35)#43 | 4.9%(+9.34)#1,214 |
| 44. | 43456 | 14.2% | 4.9%(+9.26)#44 | 4.9%(+9.25)#1,238 |
| 45. | 44127 | 14.1% | 4.9%(+9.14)#45 | 4.9%(+9.13)#1,267 |
| 46. | 43360 | 14.1% | 4.9%(+9.13)#46 | 4.9%(+9.12)#1,268 |
| 47. | 43232 | 13.7% | 4.9%(+8.81)#47 | 4.9%(+8.80)#1,334 |
| 48. | 43317 | 13.6% | 4.9%(+8.70)#48 | 4.9%(+8.69)#1,366 |
| 49. | 43974 | 13.6% | 4.9%(+8.70)#49 | 4.9%(+8.69)#1,369 |
| 50. | 43783 | 13.4% | 4.9%(+8.49)#50 | 4.9%(+8.48)#1,417 |
| 51. | 45204 | 13.4% | 4.9%(+8.49)#51 | 4.9%(+8.48)#1,419 |
| 52. | 45647 | 13.4% | 4.9%(+8.46)#52 | 4.9%(+8.45)#1,425 |
| 53. | 45404 | 13.4% | 4.9%(+8.46)#53 | 4.9%(+8.45)#1,426 |
| 54. | 45634 | 13.3% | 4.9%(+8.41)#54 | 4.9%(+8.40)#1,431 |
| 55. | 43913 | 13.3% | 4.9%(+8.40)#55 | 4.9%(+8.39)#1,438 |
| 56. | 44802 | 13.3% | 4.9%(+8.40)#56 | 4.9%(+8.39)#1,439 |
| 57. | 43988 | 13.3% | 4.9%(+8.36)#57 | 4.9%(+8.35)#1,455 |
| 58. | 43219 | 13.2% | 4.9%(+8.22)#58 | 4.9%(+8.21)#1,495 |
| 59. | 43931 | 13.1% | 4.9%(+8.18)#59 | 4.9%(+8.17)#1,501 |
| 60. | 43739 | 13.0% | 4.9%(+8.04)#60 | 4.9%(+8.03)#1,538 |
| 61. | 45169 | 13.0% | 4.9%(+8.04)#61 | 4.9%(+8.03)#1,539 |
| 62. | 45164 | 12.9% | 4.9%(+7.94)#62 | 4.9%(+7.92)#1,571 |
| 63. | 43802 | 12.8% | 4.9%(+7.82)#63 | 4.9%(+7.81)#1,608 |
| 64. | 43213 | 12.7% | 4.9%(+7.78)#64 | 4.9%(+7.77)#1,621 |
| 65. | 43151 | 12.4% | 4.9%(+7.45)#65 | 4.9%(+7.44)#1,715 |
| 66. | 44659 | 12.2% | 4.9%(+7.26)#66 | 4.9%(+7.25)#1,786 |
| 67. | 45383 | 12.1% | 4.9%(+7.17)#67 | 4.9%(+7.16)#1,807 |
| 68. | 43973 | 12.1% | 4.9%(+7.16)#68 | 4.9%(+7.15)#1,813 |
| 69. | 43143 | 11.9% | 4.9%(+6.98)#69 | 4.9%(+6.96)#1,901 |
| 70. | 43356 | 11.9% | 4.9%(+6.96)#70 | 4.9%(+6.95)#1,905 |
| 71. | 43331 | 11.8% | 4.9%(+6.84)#71 | 4.9%(+6.82)#1,961 |
| 72. | 44689 | 11.7% | 4.9%(+6.78)#72 | 4.9%(+6.77)#1,987 |
| 73. | 43110 | 11.6% | 4.9%(+6.70)#73 | 4.9%(+6.69)#2,012 |
| 74. | 45406 | 11.6% | 4.9%(+6.63)#74 | 4.9%(+6.62)#2,045 |
| 75. | 45176 | 11.4% | 4.9%(+6.46)#75 | 4.9%(+6.45)#2,124 |
| 76. | 43337 | 11.4% | 4.9%(+6.45)#76 | 4.9%(+6.44)#2,129 |
| 77. | 43903 | 11.3% | 4.9%(+6.40)#77 | 4.9%(+6.38)#2,158 |
| 78. | 45142 | 11.3% | 4.9%(+6.37)#78 | 4.9%(+6.36)#2,176 |
| 79. | 44455 | 11.3% | 4.9%(+6.34)#79 | 4.9%(+6.33)#2,194 |
| 80. | 44881 | 11.3% | 4.9%(+6.31)#80 | 4.9%(+6.30)#2,206 |
| 81. | 43723 | 11.2% | 4.9%(+6.30)#81 | 4.9%(+6.29)#2,213 |
| 82. | 43930 | 11.0% | 4.9%(+6.06)#82 | 4.9%(+6.05)#2,329 |
| 83. | 45211 | 11.0% | 4.9%(+6.05)#83 | 4.9%(+6.04)#2,333 |
| 84. | 43125 | 10.9% | 4.9%(+5.99)#84 | 4.9%(+5.98)#2,356 |
| 85. | 45672 | 10.9% | 4.9%(+5.94)#85 | 4.9%(+5.93)#2,377 |
| 86. | 45843 | 10.8% | 4.9%(+5.91)#86 | 4.9%(+5.90)#2,396 |
| 87. | 43731 | 10.8% | 4.9%(+5.89)#87 | 4.9%(+5.88)#2,406 |
| 88. | 44843 | 10.8% | 4.9%(+5.85)#88 | 4.9%(+5.84)#2,434 |
| 89. | 43767 | 10.7% | 4.9%(+5.76)#89 | 4.9%(+5.75)#2,478 |
| 90. | 45330 | 10.6% | 4.9%(+5.67)#90 | 4.9%(+5.65)#2,527 |
| 91. | 44427 | 10.6% | 4.9%(+5.64)#91 | 4.9%(+5.63)#2,535 |
| 92. | 44423 | 10.6% | 4.9%(+5.63)#92 | 4.9%(+5.62)#2,545 |
| 93. | 45238 | 10.5% | 4.9%(+5.53)#93 | 4.9%(+5.52)#2,606 |
| 94. | 44401 | 10.4% | 4.9%(+5.51)#94 | 4.9%(+5.50)#2,616 |
| 95. | 45148 | 10.4% | 4.9%(+5.49)#95 | 4.9%(+5.48)#2,623 |
| 96. | 44287 | 10.4% | 4.9%(+5.43)#96 | 4.9%(+5.42)#2,664 |
| 97. | 45224 | 10.3% | 4.9%(+5.41)#97 | 4.9%(+5.40)#2,683 |
| 98. | 45768 | 10.3% | 4.9%(+5.35)#98 | 4.9%(+5.34)#2,714 |
| 99. | 43228 | 10.1% | 4.9%(+5.17)#99 | 4.9%(+5.16)#2,825 |
| 100. | 45240 | 10.1% | 4.9%(+5.14)#100 | 4.9%(+5.13)#2,841 |
Common Questions
What are the Top 10 Zip Codes with the Highest Percentage of Population Employed in Transportation & Warehousing in Ohio?
Top 10 Zip Codes with the Highest Percentage of Population Employed in Transportation & Warehousing in Ohio are:
What zip code has the Highest Percentage of Population Employed in Transportation & Warehousing in Ohio?
45166 has the Highest Percentage of Population Employed in Transportation & Warehousing in Ohio with 100.0%.
What is the Percentage of Population Employed in Transportation & Warehousing in the State of Ohio?
Percentage of Population Employed in Transportation & Warehousing in Ohio is 4.9%.
What is the Percentage of Population Employed in Transportation & Warehousing in the United States?
Percentage of Population Employed in Transportation & Warehousing in the United States is 4.9%.