Lisbon, OH
Lisbon Map
Lisbon Overview
2,582
TOTAL POPULATION
1,222
MALE POPULATION
1,360
FEMALE POPULATION
89.85
MALES / 100 FEMALES
111.29
FEMALES / 100 MALES
42.1
MEDIAN AGE
3.1
AVG FAMILY SIZE
2.2
AVG HOUSEHOLD SIZE
$25,613
PER CAPITA INCOME
$71,763
AVG FAMILY INCOME
$52,457
AVG HOUSEHOLD INCOME
23.4%
WAGE / INCOME GAP [ % ]
76.6¢/ $1
WAGE / INCOME GAP [ $ ]
0.43
INEQUALITY / GINI INDEX
987
LABOR FORCE [ PEOPLE ]
49.0%
PERCENT IN LABOR FORCE
2.2%
UNEMPLOYMENT RATE
Lisbon Zip Codes
Lisbon Area Codes
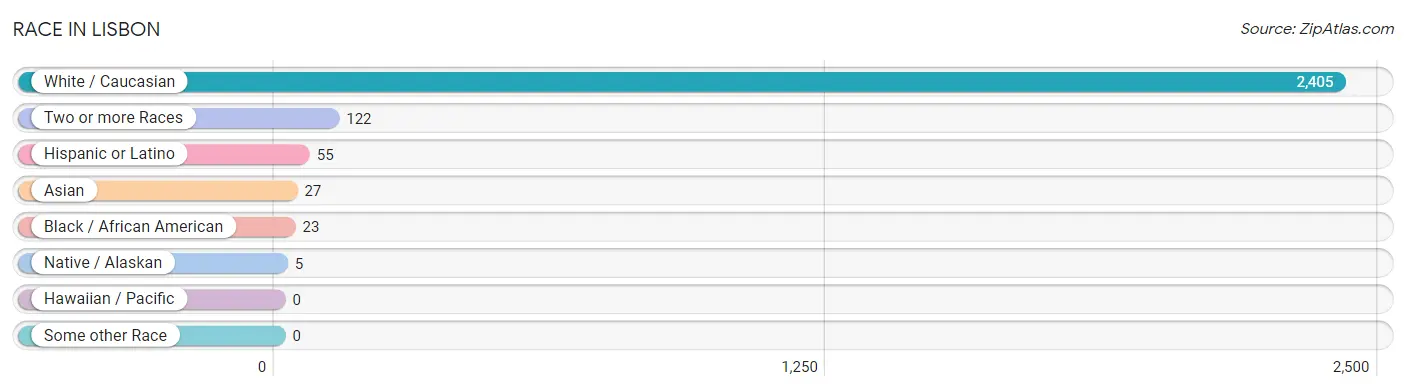
Race in Lisbon
The most populous races in Lisbon are White / Caucasian (2,405 | 93.1%), Two or more Races (122 | 4.7%), and Hispanic or Latino (55 | 2.1%).
| Race | # Population | % Population |
| Asian | 27 | 1.1% |
| Black / African American | 23 | 0.9% |
| Hawaiian / Pacific | 0 | 0.0% |
| Hispanic or Latino | 55 | 2.1% |
| Native / Alaskan | 5 | 0.2% |
| White / Caucasian | 2,405 | 93.1% |
| Two or more Races | 122 | 4.7% |
| Some other Race | 0 | 0.0% |
| Total | 2,582 | 100.0% |
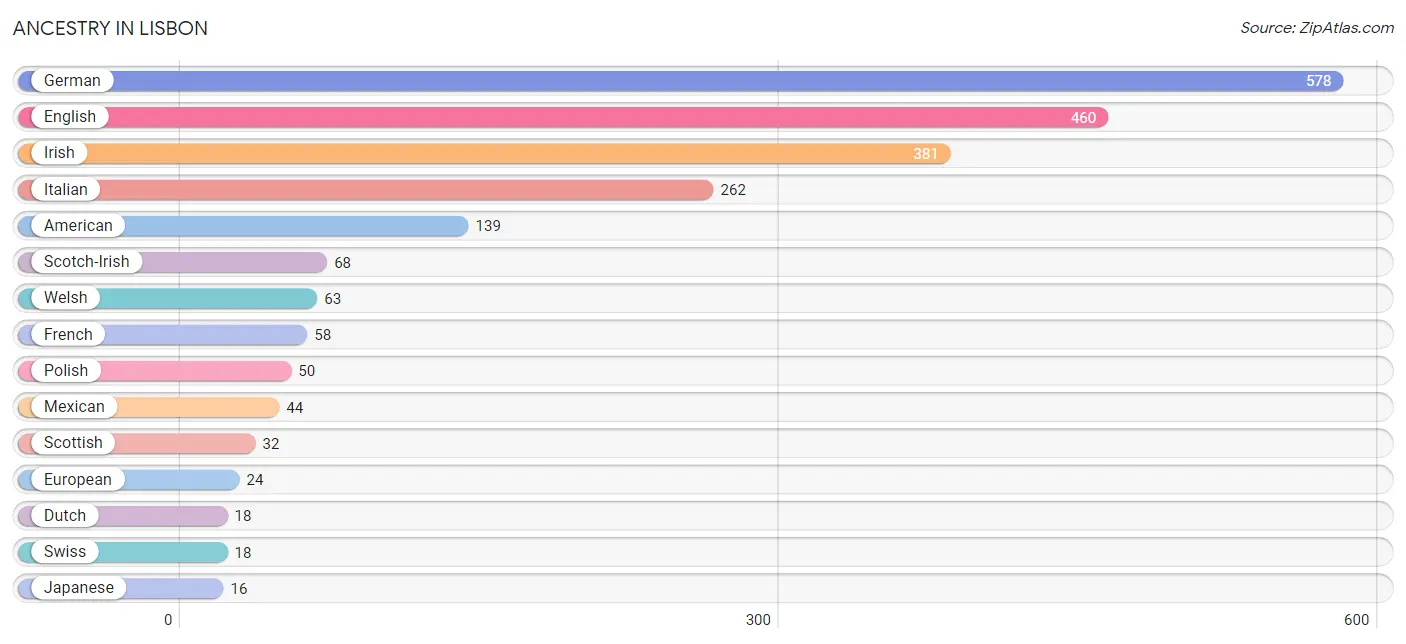
Ancestry in Lisbon
The most populous ancestries reported in Lisbon are German (578 | 22.4%), English (460 | 17.8%), Irish (381 | 14.8%), Italian (262 | 10.2%), and American (139 | 5.4%), together accounting for 70.5% of all Lisbon residents.
| Ancestry | # Population | % Population |
| American | 139 | 5.4% |
| Austrian | 5 | 0.2% |
| Blackfeet | 3 | 0.1% |
| British | 9 | 0.4% |
| Cherokee | 8 | 0.3% |
| Choctaw | 6 | 0.2% |
| Croatian | 9 | 0.4% |
| Czech | 5 | 0.2% |
| Dutch | 18 | 0.7% |
| Eastern European | 8 | 0.3% |
| English | 460 | 17.8% |
| European | 24 | 0.9% |
| French | 58 | 2.2% |
| German | 578 | 22.4% |
| Greek | 5 | 0.2% |
| Indian (Asian) | 11 | 0.4% |
| Irish | 381 | 14.8% |
| Italian | 262 | 10.2% |
| Japanese | 16 | 0.6% |
| Latvian | 6 | 0.2% |
| Mexican | 44 | 1.7% |
| Pennsylvania German | 6 | 0.2% |
| Polish | 50 | 1.9% |
| Portuguese | 5 | 0.2% |
| Puerto Rican | 3 | 0.1% |
| Romanian | 5 | 0.2% |
| Scotch-Irish | 68 | 2.6% |
| Scottish | 32 | 1.2% |
| Slovak | 15 | 0.6% |
| Slovene | 4 | 0.2% |
| Swedish | 11 | 0.4% |
| Swiss | 18 | 0.7% |
| Ukrainian | 5 | 0.2% |
| Welsh | 63 | 2.4% | View All 34 Rows |
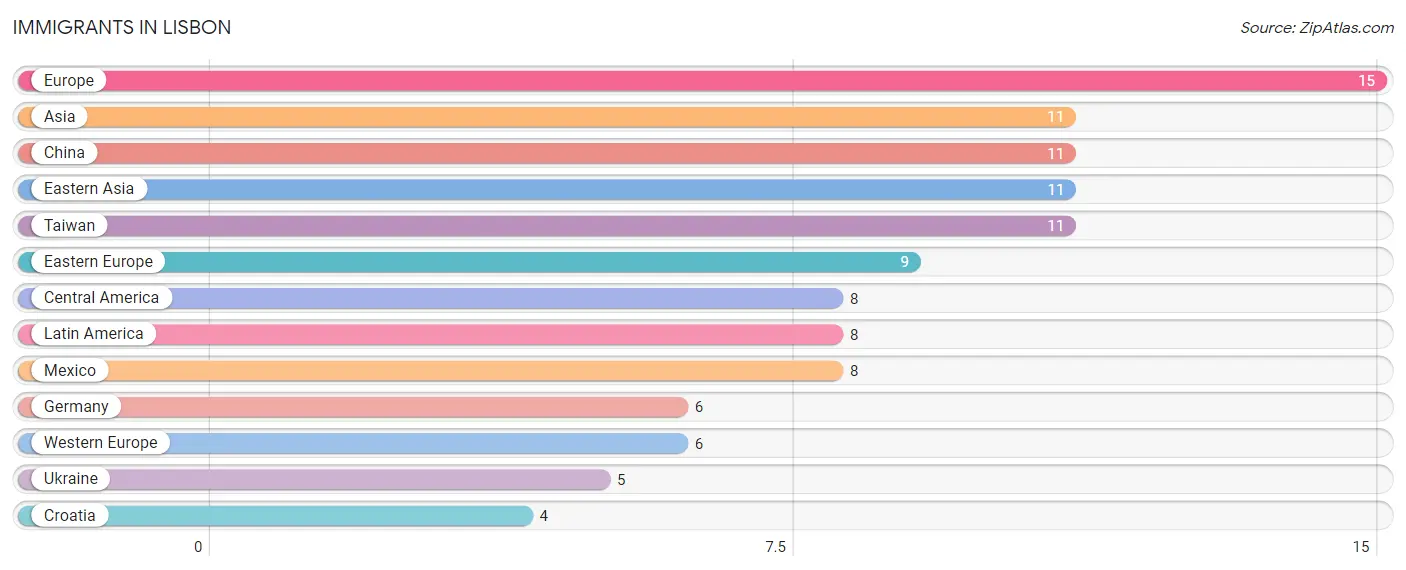
Immigrants in Lisbon
The most numerous immigrant groups reported in Lisbon came from Europe (15 | 0.6%), Asia (11 | 0.4%), China (11 | 0.4%), Eastern Asia (11 | 0.4%), and Taiwan (11 | 0.4%), together accounting for 2.3% of all Lisbon residents.
| Immigration Origin | # Population | % Population |
| Asia | 11 | 0.4% |
| Central America | 8 | 0.3% |
| China | 11 | 0.4% |
| Croatia | 4 | 0.2% |
| Eastern Asia | 11 | 0.4% |
| Eastern Europe | 9 | 0.4% |
| Europe | 15 | 0.6% |
| Germany | 6 | 0.2% |
| Latin America | 8 | 0.3% |
| Mexico | 8 | 0.3% |
| Taiwan | 11 | 0.4% |
| Ukraine | 5 | 0.2% |
| Western Europe | 6 | 0.2% | View All 13 Rows |
Sex and Age in Lisbon
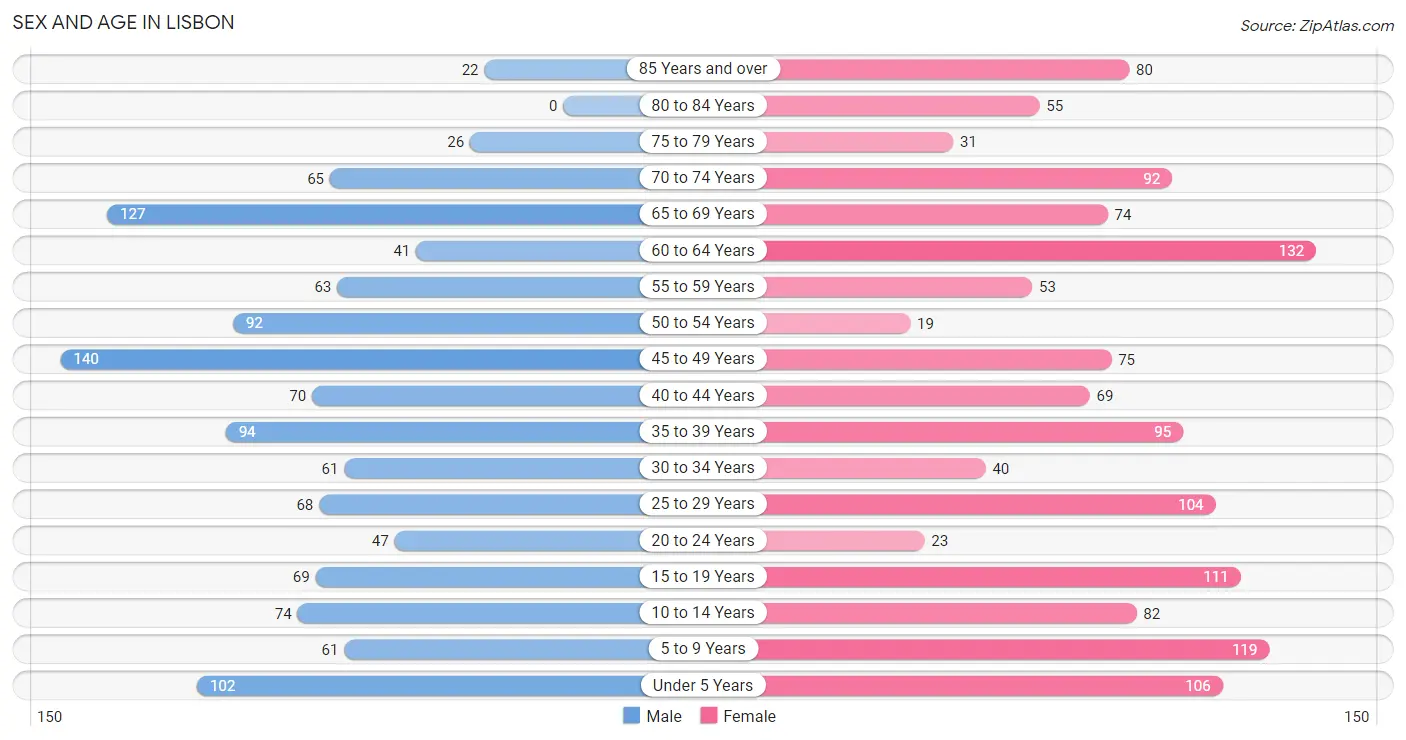
Sex and Age in Lisbon
The most populous age groups in Lisbon are 45 to 49 Years (140 | 11.5%) for men and 60 to 64 Years (132 | 9.7%) for women.
| Age Bracket | Male | Female |
| Under 5 Years | 102 (8.4%) | 106 (7.8%) |
| 5 to 9 Years | 61 (5.0%) | 119 (8.7%) |
| 10 to 14 Years | 74 (6.1%) | 82 (6.0%) |
| 15 to 19 Years | 69 (5.7%) | 111 (8.2%) |
| 20 to 24 Years | 47 (3.8%) | 23 (1.7%) |
| 25 to 29 Years | 68 (5.6%) | 104 (7.6%) |
| 30 to 34 Years | 61 (5.0%) | 40 (2.9%) |
| 35 to 39 Years | 94 (7.7%) | 95 (7.0%) |
| 40 to 44 Years | 70 (5.7%) | 69 (5.1%) |
| 45 to 49 Years | 140 (11.5%) | 75 (5.5%) |
| 50 to 54 Years | 92 (7.5%) | 19 (1.4%) |
| 55 to 59 Years | 63 (5.2%) | 53 (3.9%) |
| 60 to 64 Years | 41 (3.4%) | 132 (9.7%) |
| 65 to 69 Years | 127 (10.4%) | 74 (5.4%) |
| 70 to 74 Years | 65 (5.3%) | 92 (6.8%) |
| 75 to 79 Years | 26 (2.1%) | 31 (2.3%) |
| 80 to 84 Years | 0 (0.0%) | 55 (4.0%) |
| 85 Years and over | 22 (1.8%) | 80 (5.9%) |
| Total | 1,222 (100.0%) | 1,360 (100.0%) |
Families and Households in Lisbon
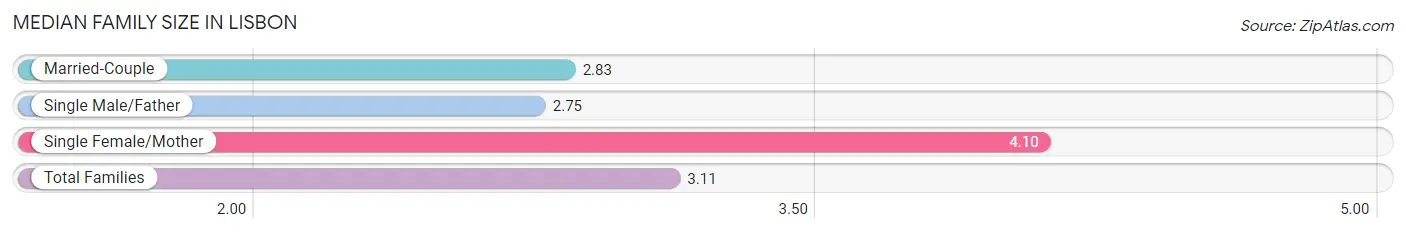
Median Family Size in Lisbon
The median family size in Lisbon is 3.11 persons per family, with single female/mother families (133 | 22.5%) accounting for the largest median family size of 4.1 persons per family. On the other hand, single male/father families (69 | 11.7%) represent the smallest median family size with 2.75 persons per family.
| Family Type | # Families | Family Size |
| Married-Couple | 389 (65.8%) | 2.83 |
| Single Male/Father | 69 (11.7%) | 2.75 |
| Single Female/Mother | 133 (22.5%) | 4.10 |
| Total Families | 591 (100.0%) | 3.11 |
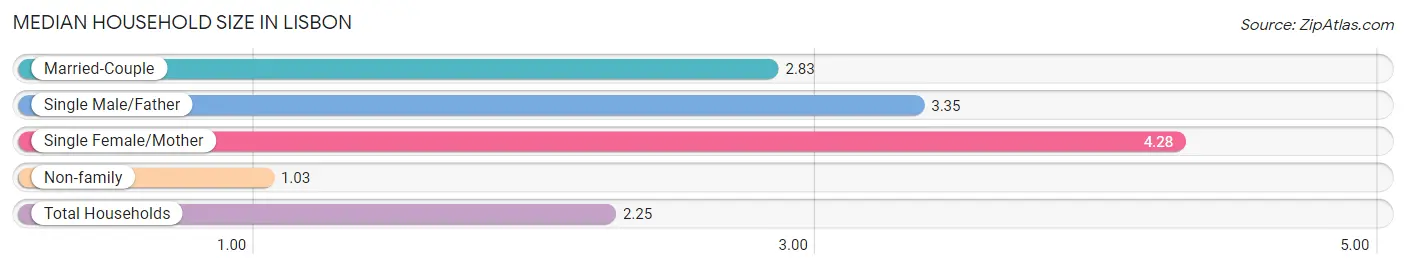
Median Household Size in Lisbon
The median household size in Lisbon is 2.25 persons per household, with single female/mother households (133 | 12.6%) accounting for the largest median household size of 4.28 persons per household. non-family households (464 | 44.0%) represent the smallest median household size with 1.03 persons per household.
| Household Type | # Households | Household Size |
| Married-Couple | 389 (36.9%) | 2.83 |
| Single Male/Father | 69 (6.5%) | 3.35 |
| Single Female/Mother | 133 (12.6%) | 4.28 |
| Non-family | 464 (44.0%) | 1.03 |
| Total Households | 1,055 (100.0%) | 2.25 |
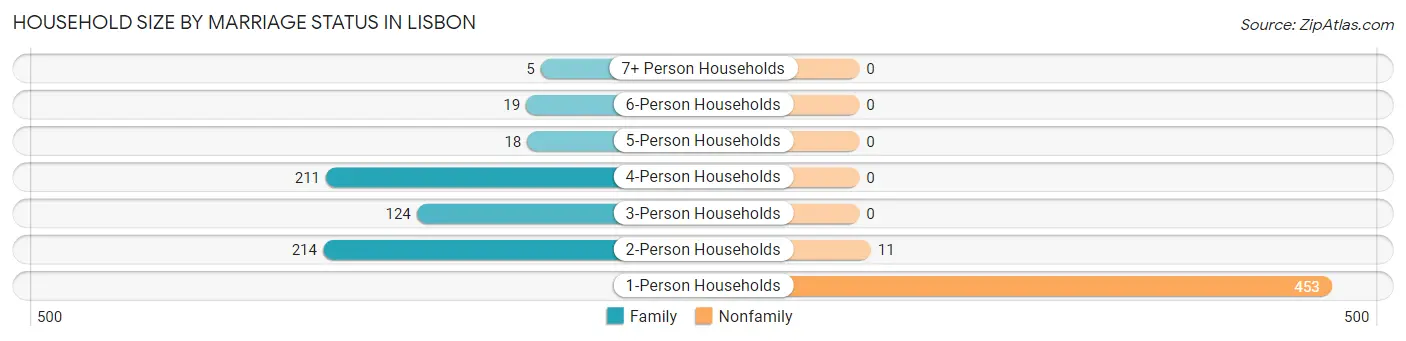
Household Size by Marriage Status in Lisbon
Out of a total of 1,055 households in Lisbon, 591 (56.0%) are family households, while 464 (44.0%) are nonfamily households. The most numerous type of family households are 2-person households, comprising 214, and the most common type of nonfamily households are 1-person households, comprising 453.
| Household Size | Family Households | Nonfamily Households |
| 1-Person Households | - | 453 (42.9%) |
| 2-Person Households | 214 (20.3%) | 11 (1.0%) |
| 3-Person Households | 124 (11.7%) | 0 (0.0%) |
| 4-Person Households | 211 (20.0%) | 0 (0.0%) |
| 5-Person Households | 18 (1.7%) | 0 (0.0%) |
| 6-Person Households | 19 (1.8%) | 0 (0.0%) |
| 7+ Person Households | 5 (0.5%) | 0 (0.0%) |
| Total | 591 (56.0%) | 464 (44.0%) |
Female Fertility in Lisbon
Fertility by Age in Lisbon
Average fertility rate in Lisbon is 134.0 births per 1,000 women. Women in the age bracket of 20 to 34 years have the highest fertility rate with 419.0 births per 1,000 women. Women in the age bracket of 20 to 34 years acount for 100.0% of all women with births.
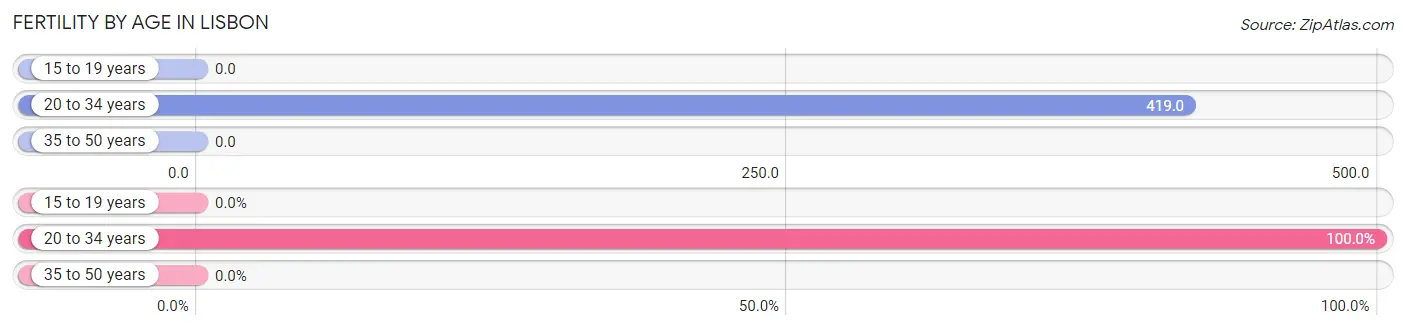
| Age Bracket | Women with Births | Births / 1,000 Women |
| 15 to 19 years | 0 (0.0%) | 0.0 |
| 20 to 34 years | 70 (100.0%) | 419.0 |
| 35 to 50 years | 0 (0.0%) | 0.0 |
| Total | 70 (100.0%) | 134.0 |
Fertility by Age by Marriage Status in Lisbon
62.9% of women with births (70) in Lisbon are married. The highest percentage of unmarried women with births falls into 20 to 34 years age bracket with 37.1% of them unmarried at the time of birth, while the lowest percentage of unmarried women with births belong to 20 to 34 years age bracket with 37.1% of them unmarried.
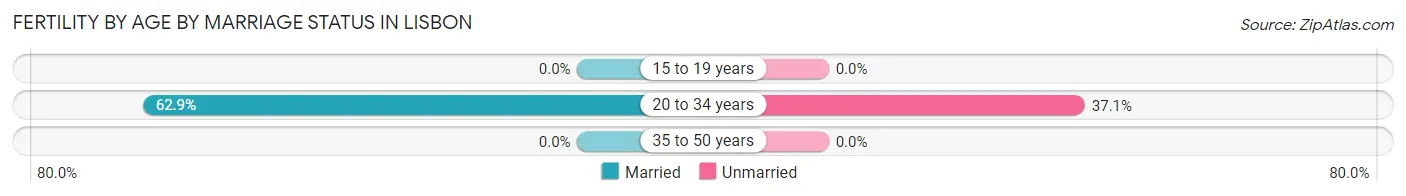
| Age Bracket | Married | Unmarried |
| 15 to 19 years | 0 (0.0%) | 0 (0.0%) |
| 20 to 34 years | 44 (62.9%) | 26 (37.1%) |
| 35 to 50 years | 0 (0.0%) | 0 (0.0%) |
| Total | 44 (62.9%) | 26 (37.1%) |
Fertility by Education in Lisbon
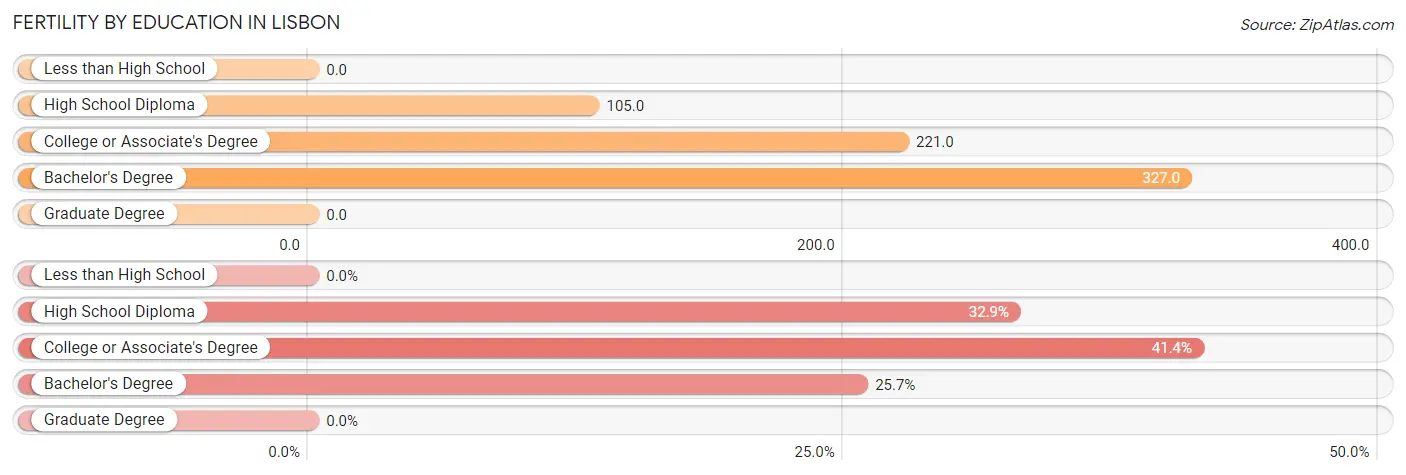
| Educational Attainment | Women with Births | Births / 1,000 Women |
| Less than High School | 0 (0.0%) | 0.0 |
| High School Diploma | 23 (32.9%) | 105.0 |
| College or Associate's Degree | 29 (41.4%) | 221.0 |
| Bachelor's Degree | 18 (25.7%) | 327.0 |
| Graduate Degree | 0 (0.0%) | 0.0 |
| Total | 70 (100.0%) | 134.0 |
Fertility by Education by Marriage Status in Lisbon
37.1% of women with births in Lisbon are unmarried. Women with the educational attainment of bachelor's degree are most likely to be married with 100.0% of them married at childbirth, while women with the educational attainment of high school diploma are least likely to be married with 56.5% of them unmarried at childbirth.
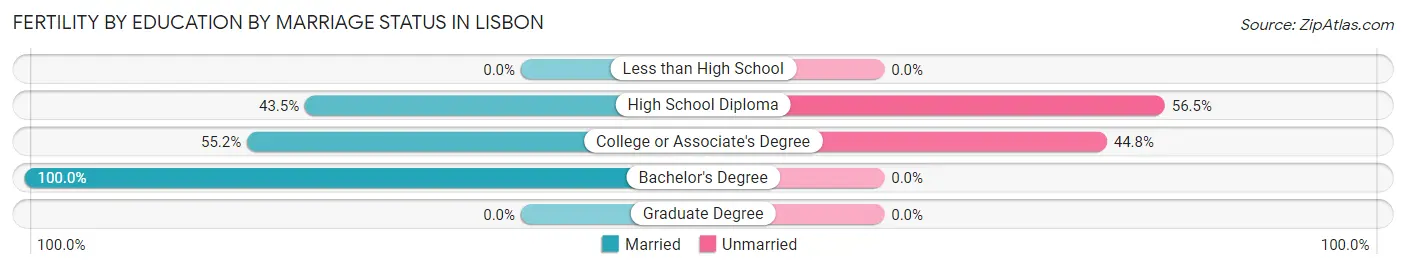
| Educational Attainment | Married | Unmarried |
| Less than High School | 0 (0.0%) | 0 (0.0%) |
| High School Diploma | 10 (43.5%) | 13 (56.5%) |
| College or Associate's Degree | 16 (55.2%) | 13 (44.8%) |
| Bachelor's Degree | 18 (100.0%) | 0 (0.0%) |
| Graduate Degree | 0 (0.0%) | 0 (0.0%) |
| Total | 44 (62.9%) | 26 (37.1%) |
Income in Lisbon
Income Overview in Lisbon
Per Capita Income in Lisbon is $25,613, while median incomes of families and households are $71,763 and $52,457 respectively.
| Characteristic | Number | Measure |
| Per Capita Income | 2,582 | $25,613 |
| Median Family Income | 591 | $71,763 |
| Mean Family Income | 591 | $76,677 |
| Median Household Income | 1,055 | $52,457 |
| Mean Household Income | 1,055 | $58,677 |
| Income Deficit | 591 | $0 |
| Wage / Income Gap (%) | 2,582 | 23.36% |
| Wage / Income Gap ($) | 2,582 | 76.64¢ per $1 |
| Gini / Inequality Index | 2,582 | 0.43 |
Earnings by Sex in Lisbon
Average Earnings in Lisbon are $35,068, $37,188 for men and $28,500 for women, a difference of 23.4%.
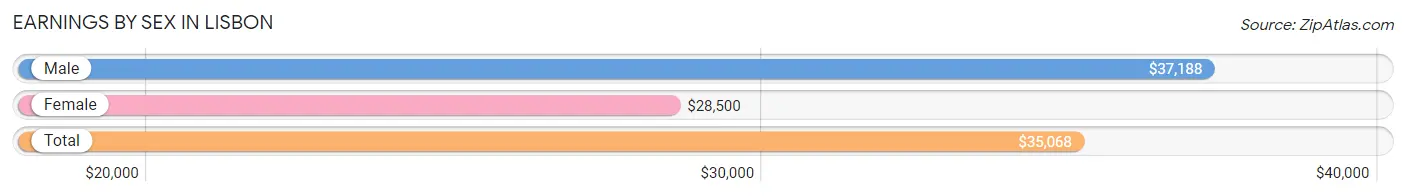
| Sex | Number | Average Earnings |
| Male | 635 (58.0%) | $37,188 |
| Female | 460 (42.0%) | $28,500 |
| Total | 1,095 (100.0%) | $35,068 |
Earnings by Sex by Income Bracket in Lisbon
The most common earnings brackets in Lisbon are $75,000 to $99,999 for men (133 | 20.9%) and $2,499 or less for women (64 | 13.9%).
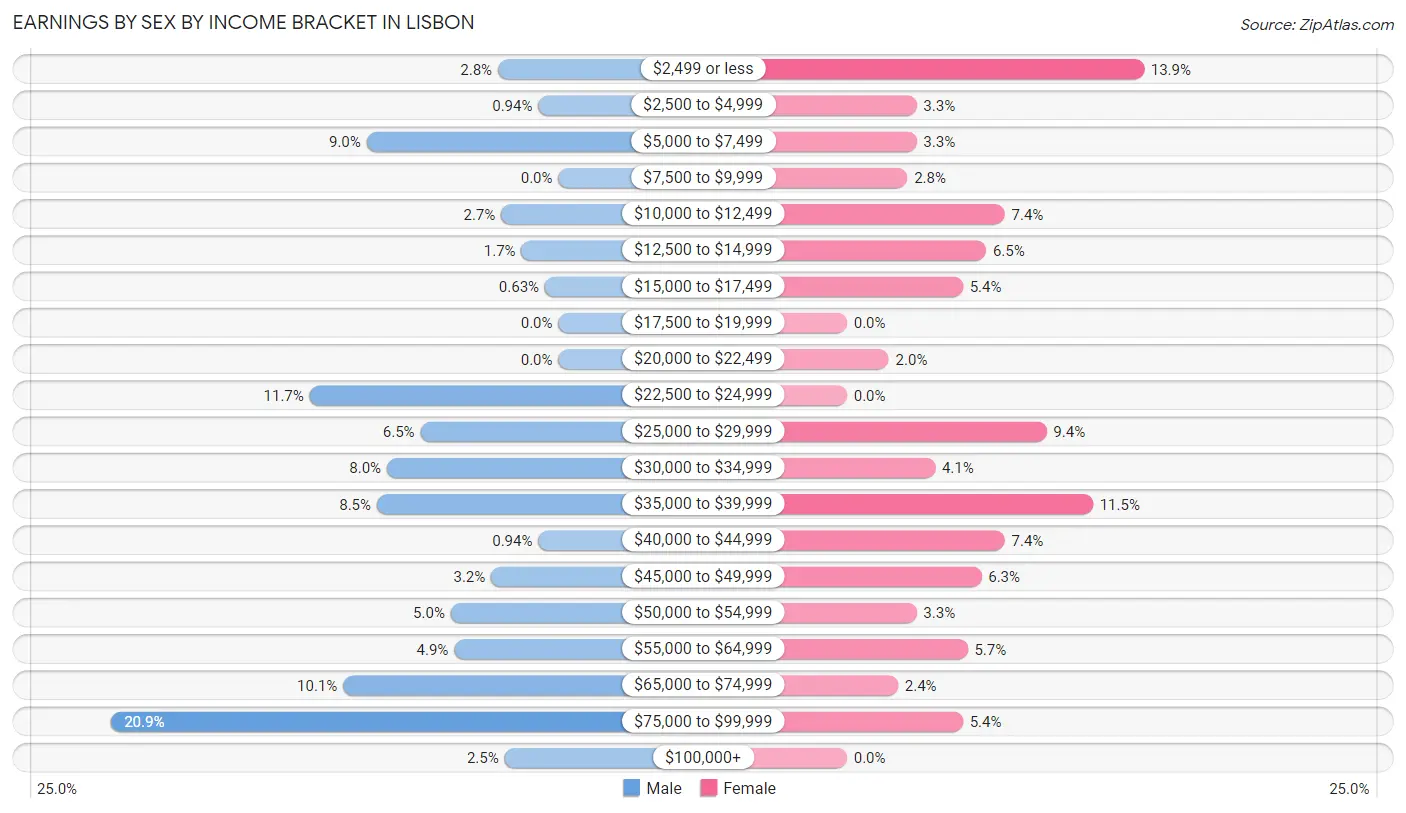
| Income | Male | Female |
| $2,499 or less | 18 (2.8%) | 64 (13.9%) |
| $2,500 to $4,999 | 6 (0.9%) | 15 (3.3%) |
| $5,000 to $7,499 | 57 (9.0%) | 15 (3.3%) |
| $7,500 to $9,999 | 0 (0.0%) | 13 (2.8%) |
| $10,000 to $12,499 | 17 (2.7%) | 34 (7.4%) |
| $12,500 to $14,999 | 11 (1.7%) | 30 (6.5%) |
| $15,000 to $17,499 | 4 (0.6%) | 25 (5.4%) |
| $17,500 to $19,999 | 0 (0.0%) | 0 (0.0%) |
| $20,000 to $22,499 | 0 (0.0%) | 9 (2.0%) |
| $22,500 to $24,999 | 74 (11.7%) | 0 (0.0%) |
| $25,000 to $29,999 | 41 (6.5%) | 43 (9.3%) |
| $30,000 to $34,999 | 51 (8.0%) | 19 (4.1%) |
| $35,000 to $39,999 | 54 (8.5%) | 53 (11.5%) |
| $40,000 to $44,999 | 6 (0.9%) | 34 (7.4%) |
| $45,000 to $49,999 | 20 (3.2%) | 29 (6.3%) |
| $50,000 to $54,999 | 32 (5.0%) | 15 (3.3%) |
| $55,000 to $64,999 | 31 (4.9%) | 26 (5.7%) |
| $65,000 to $74,999 | 64 (10.1%) | 11 (2.4%) |
| $75,000 to $99,999 | 133 (20.9%) | 25 (5.4%) |
| $100,000+ | 16 (2.5%) | 0 (0.0%) |
| Total | 635 (100.0%) | 460 (100.0%) |
Earnings by Sex by Educational Attainment in Lisbon
Average earnings in Lisbon are $47,857 for men and $35,000 for women, a difference of 26.9%. Men with an educational attainment of less than high school enjoy the highest average annual earnings of $85,469, while those with high school diploma education earn the least with $31,797. Women with an educational attainment of graduate degree earn the most with the average annual earnings of $71,000, while those with high school diploma education have the smallest earnings of $27,083.
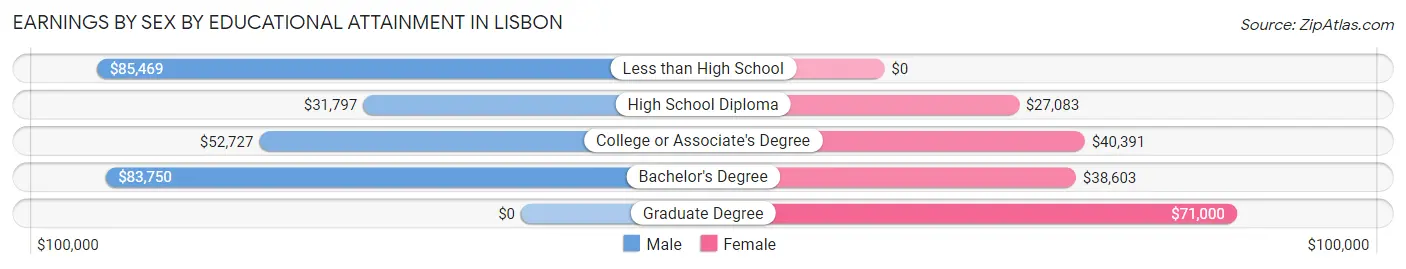
| Educational Attainment | Male Income | Female Income |
| Less than High School | $85,469 | $0 |
| High School Diploma | $31,797 | $27,083 |
| College or Associate's Degree | $52,727 | $40,391 |
| Bachelor's Degree | $83,750 | $38,603 |
| Graduate Degree | - | - |
| Total | $47,857 | $35,000 |
Family Income in Lisbon
Family Income Brackets in Lisbon
According to the Lisbon family income data, there are 135 families falling into the $50,000 to $74,999 income range, which is the most common income bracket and makes up 22.8% of all families. Conversely, the $200,000+ income bracket is the least frequent group with only 5 families (0.9%) belonging to this category.
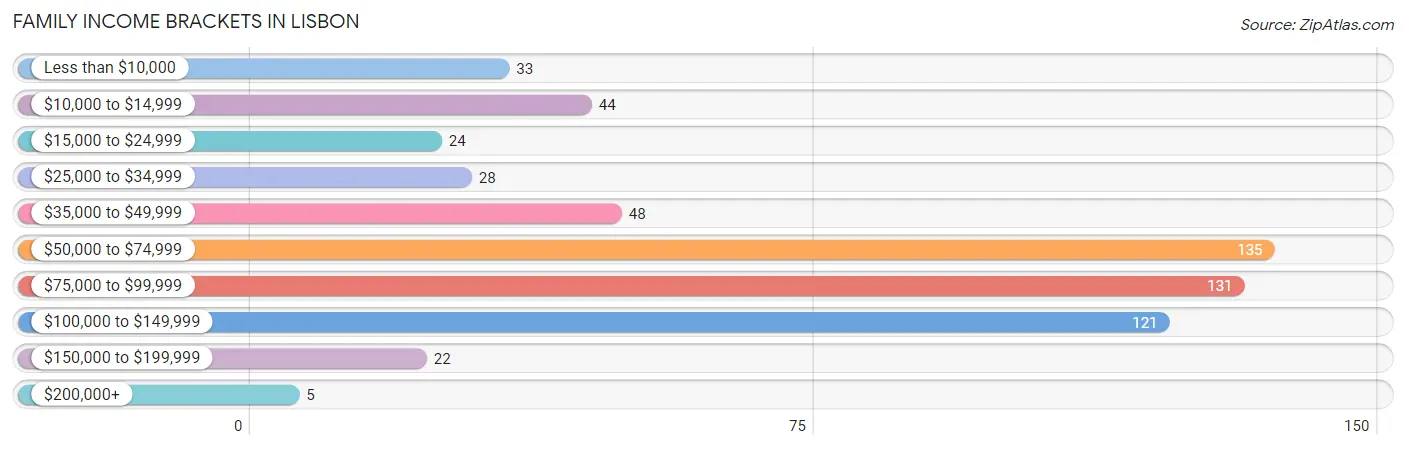
| Income Bracket | # Families | % Families |
| Less than $10,000 | 33 | 5.6% |
| $10,000 to $14,999 | 44 | 7.4% |
| $15,000 to $24,999 | 24 | 4.1% |
| $25,000 to $34,999 | 28 | 4.7% |
| $35,000 to $49,999 | 48 | 8.1% |
| $50,000 to $74,999 | 135 | 22.8% |
| $75,000 to $99,999 | 131 | 22.2% |
| $100,000 to $149,999 | 121 | 20.5% |
| $150,000 to $199,999 | 22 | 3.7% |
| $200,000+ | 5 | 0.8% |
Family Income by Famaliy Size in Lisbon
4-person families (222 | 37.6%) account for the highest median family income in Lisbon with $85,682 per family, while 2-person families (248 | 42.0%) have the highest median income of $35,416 per family member.
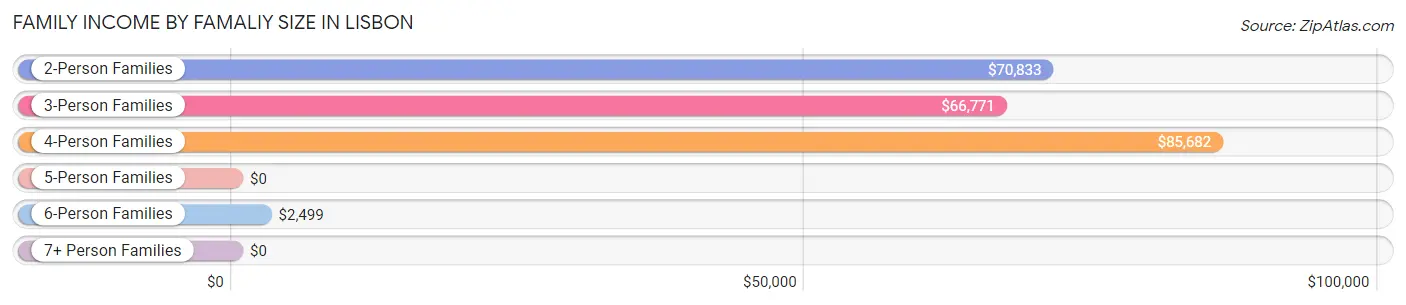
| Income Bracket | # Families | Median Income |
| 2-Person Families | 248 (42.0%) | $70,833 |
| 3-Person Families | 97 (16.4%) | $66,771 |
| 4-Person Families | 222 (37.6%) | $85,682 |
| 5-Person Families | 0 (0.0%) | $0 |
| 6-Person Families | 24 (4.1%) | $2,499 |
| 7+ Person Families | 0 (0.0%) | $0 |
| Total | 591 (100.0%) | $71,763 |
Family Income by Number of Earners in Lisbon
The median family income in Lisbon is $71,763, with families comprising 3+ earners (82) having the highest median family income of $86,424, while families with no earners (103) have the lowest median family income of $22,813, accounting for 13.9% and 17.4% of families, respectively.
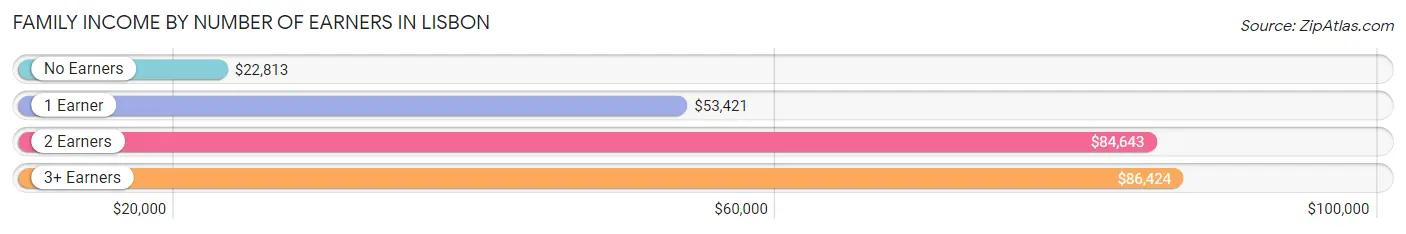
| Number of Earners | # Families | Median Income |
| No Earners | 103 (17.4%) | $22,813 |
| 1 Earner | 188 (31.8%) | $53,421 |
| 2 Earners | 218 (36.9%) | $84,643 |
| 3+ Earners | 82 (13.9%) | $86,424 |
| Total | 591 (100.0%) | $71,763 |
Household Income in Lisbon
Household Income Brackets in Lisbon
With 228 households falling in the category, the $50,000 to $74,999 income range is the most frequent in Lisbon, accounting for 21.6% of all households. In contrast, only 5 households (0.5%) fall into the $200,000+ income bracket, making it the least populous group.
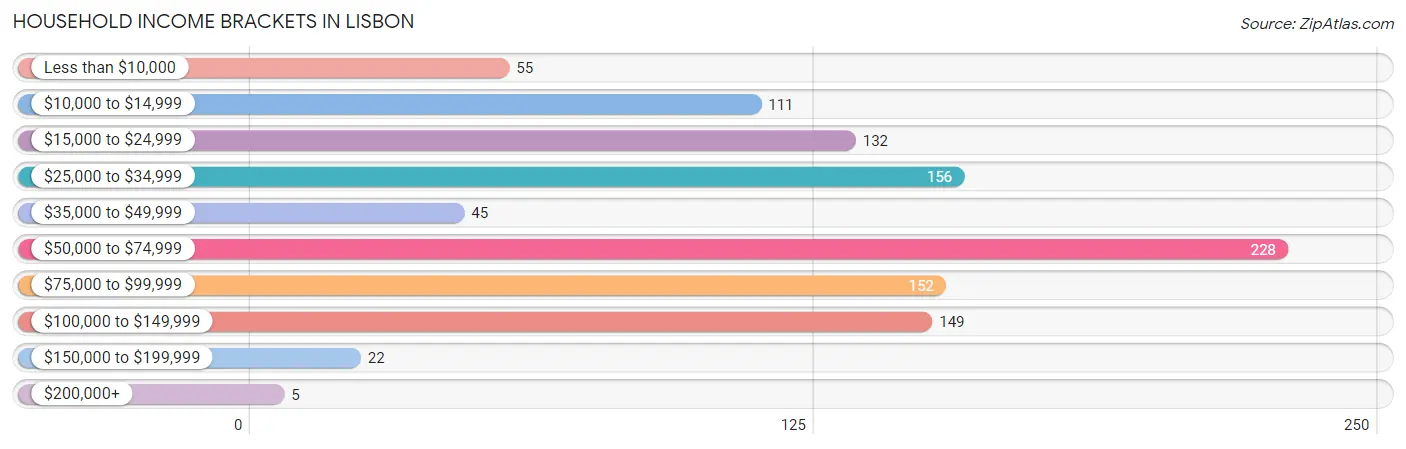
| Income Bracket | # Households | % Households |
| Less than $10,000 | 55 | 5.2% |
| $10,000 to $14,999 | 111 | 10.5% |
| $15,000 to $24,999 | 132 | 12.5% |
| $25,000 to $34,999 | 156 | 14.8% |
| $35,000 to $49,999 | 45 | 4.3% |
| $50,000 to $74,999 | 228 | 21.6% |
| $75,000 to $99,999 | 152 | 14.4% |
| $100,000 to $149,999 | 149 | 14.1% |
| $150,000 to $199,999 | 22 | 2.1% |
| $200,000+ | 5 | 0.5% |
Household Income by Householder Age in Lisbon
The median household income in Lisbon is $52,457, with the highest median household income of $70,673 found in the 25 to 44 years age bracket for the primary householder. A total of 291 households (27.6%) fall into this category. Meanwhile, the 15 to 24 years age bracket for the primary householder has the lowest median household income of $0, with 15 households (1.4%) in this group.
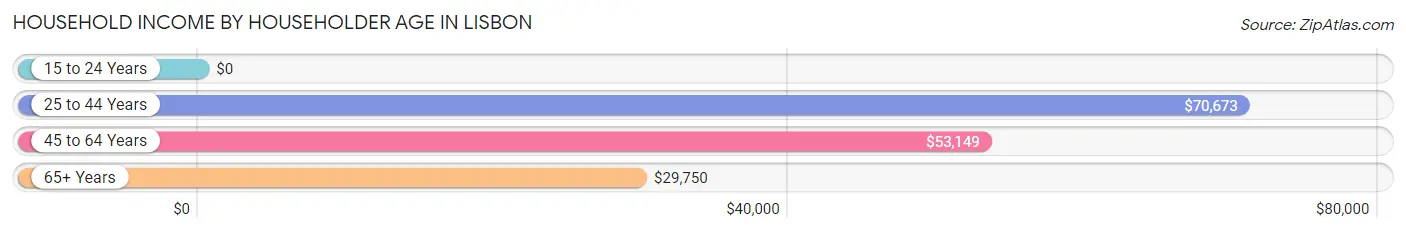
| Income Bracket | # Households | Median Income |
| 15 to 24 Years | 15 (1.4%) | $0 |
| 25 to 44 Years | 291 (27.6%) | $70,673 |
| 45 to 64 Years | 416 (39.4%) | $53,149 |
| 65+ Years | 333 (31.6%) | $29,750 |
| Total | 1,055 (100.0%) | $52,457 |
Poverty in Lisbon
Income Below Poverty by Sex and Age in Lisbon
With 25.4% poverty level for males and 21.8% for females among the residents of Lisbon, 12 to 14 year old males and 12 to 14 year old females are the most vulnerable to poverty, with 33 males (86.8%) and 20 females (57.1%) in their respective age groups living below the poverty level.
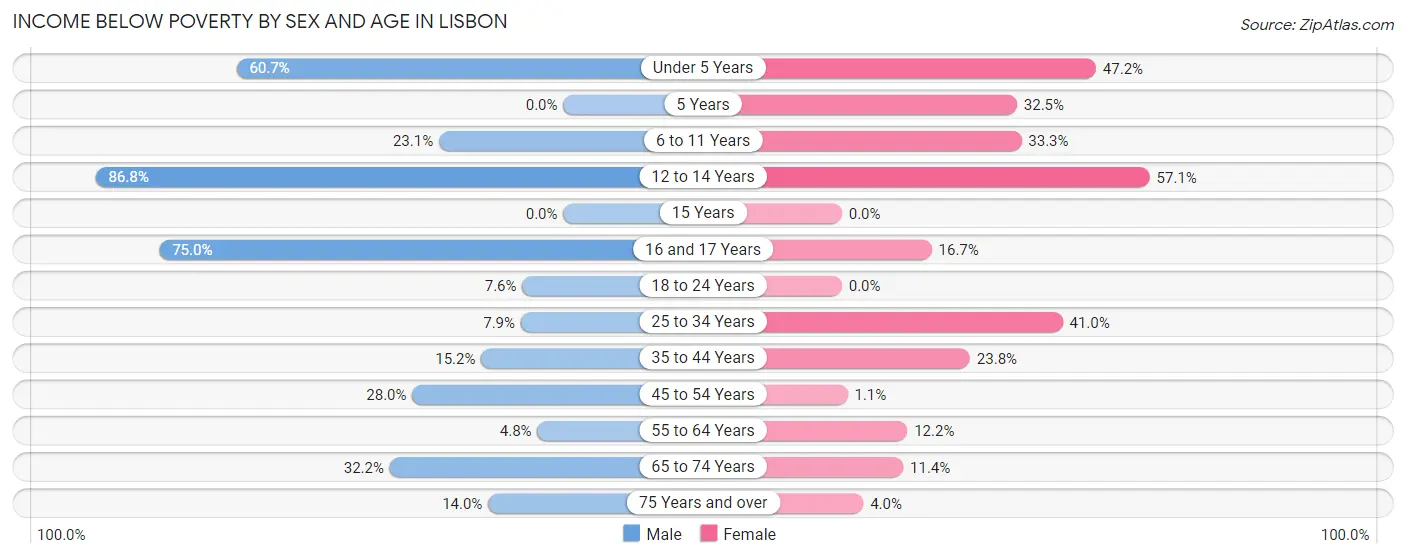
| Age Bracket | Male | Female |
| Under 5 Years | 54 (60.7%) | 50 (47.2%) |
| 5 Years | 0 (0.0%) | 13 (32.5%) |
| 6 to 11 Years | 18 (23.1%) | 42 (33.3%) |
| 12 to 14 Years | 33 (86.8%) | 20 (57.1%) |
| 15 Years | 0 (0.0%) | 0 (0.0%) |
| 16 and 17 Years | 18 (75.0%) | 12 (16.7%) |
| 18 to 24 Years | 7 (7.6%) | 0 (0.0%) |
| 25 to 34 Years | 9 (7.9%) | 59 (41.0%) |
| 35 to 44 Years | 23 (15.2%) | 39 (23.8%) |
| 45 to 54 Years | 65 (28.0%) | 1 (1.1%) |
| 55 to 64 Years | 5 (4.8%) | 22 (12.1%) |
| 65 to 74 Years | 58 (32.2%) | 14 (11.4%) |
| 75 Years and over | 6 (14.0%) | 5 (4.0%) |
| Total | 296 (25.4%) | 277 (21.8%) |
Income Above Poverty by Sex and Age in Lisbon
According to the poverty statistics in Lisbon, males aged 5 years and females aged 15 years are the age groups that are most secure financially, with 100.0% of males and 100.0% of females in these age groups living above the poverty line.
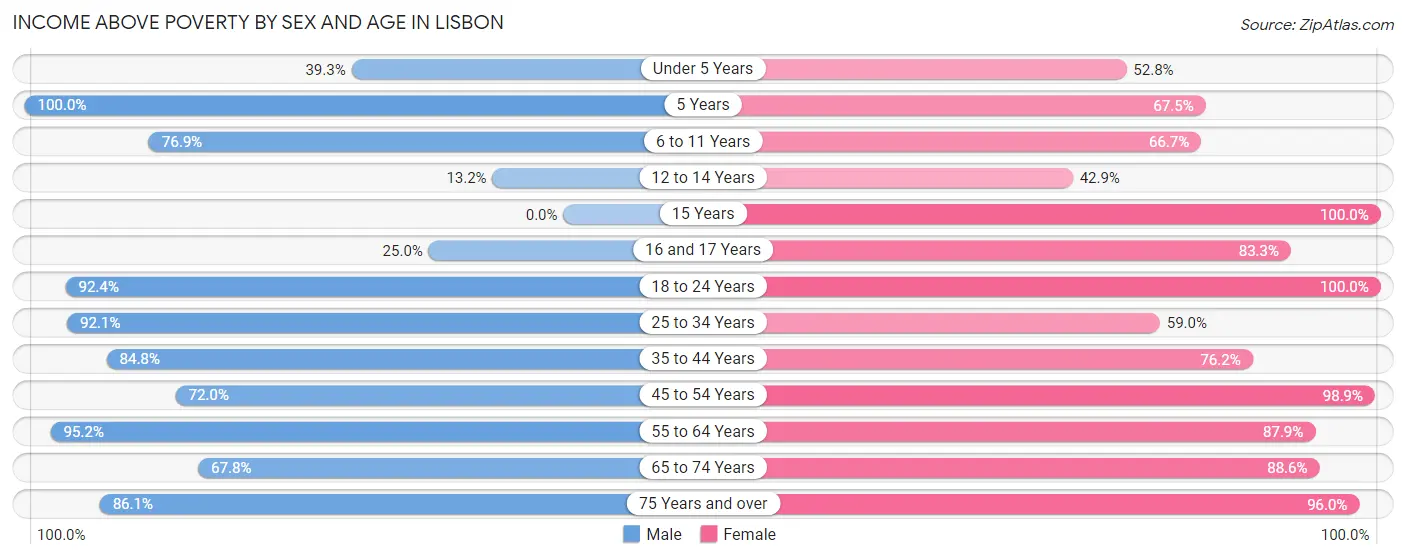
| Age Bracket | Male | Female |
| Under 5 Years | 35 (39.3%) | 56 (52.8%) |
| 5 Years | 19 (100.0%) | 27 (67.5%) |
| 6 to 11 Years | 60 (76.9%) | 84 (66.7%) |
| 12 to 14 Years | 5 (13.2%) | 15 (42.9%) |
| 15 Years | 0 (0.0%) | 24 (100.0%) |
| 16 and 17 Years | 6 (25.0%) | 60 (83.3%) |
| 18 to 24 Years | 85 (92.4%) | 38 (100.0%) |
| 25 to 34 Years | 105 (92.1%) | 85 (59.0%) |
| 35 to 44 Years | 128 (84.8%) | 125 (76.2%) |
| 45 to 54 Years | 167 (72.0%) | 93 (98.9%) |
| 55 to 64 Years | 99 (95.2%) | 159 (87.8%) |
| 65 to 74 Years | 122 (67.8%) | 109 (88.6%) |
| 75 Years and over | 37 (86.1%) | 121 (96.0%) |
| Total | 868 (74.6%) | 996 (78.2%) |
Income Below Poverty Among Married-Couple Families in Lisbon
The poverty statistics for married-couple families in Lisbon show that 7.2% or 28 of the total 389 families live below the poverty line. Families with 3 or 4 children have the highest poverty rate of 100.0%, comprising of 6 families. On the other hand, families with no children have the lowest poverty rate of 4.1%, which includes 7 families.
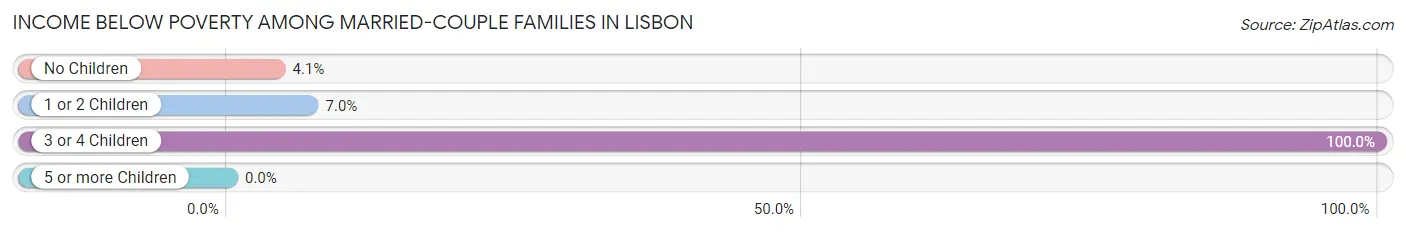
| Children | Above Poverty | Below Poverty |
| No Children | 162 (95.9%) | 7 (4.1%) |
| 1 or 2 Children | 199 (93.0%) | 15 (7.0%) |
| 3 or 4 Children | 0 (0.0%) | 6 (100.0%) |
| 5 or more Children | 0 (0.0%) | 0 (0.0%) |
| Total | 361 (92.8%) | 28 (7.2%) |
Income Below Poverty Among Single-Parent Households in Lisbon
According to the poverty data in Lisbon, 18.8% or 13 single-father households and 39.1% or 52 single-mother households are living below the poverty line. Among single-father households, those with 3 or 4 children have the highest poverty rate, with 13 households (100.0%) experiencing poverty. Likewise, among single-mother households, those with 5 or more children have the highest poverty rate, with 13 households (100.0%) falling below the poverty line.
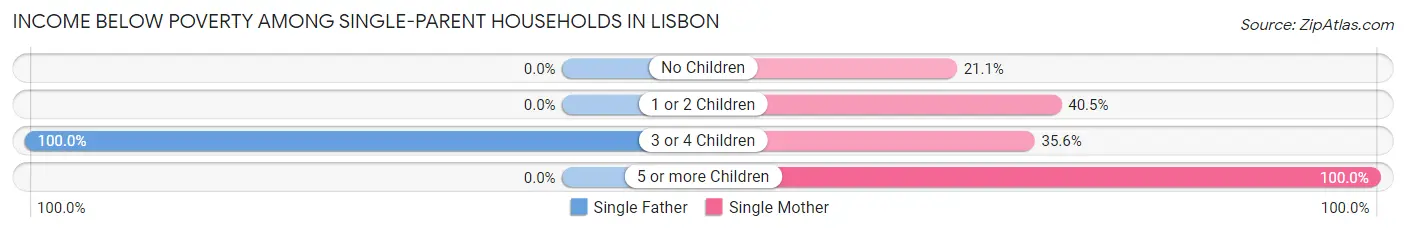
| Children | Single Father | Single Mother |
| No Children | 0 (0.0%) | 8 (21.0%) |
| 1 or 2 Children | 0 (0.0%) | 15 (40.5%) |
| 3 or 4 Children | 13 (100.0%) | 16 (35.6%) |
| 5 or more Children | 0 (0.0%) | 13 (100.0%) |
| Total | 13 (18.8%) | 52 (39.1%) |
Income Below Poverty Among Married-Couple vs Single-Parent Households in Lisbon
The poverty data for Lisbon shows that 28 of the married-couple family households (7.2%) and 65 of the single-parent households (32.2%) are living below the poverty level. Within the married-couple family households, those with 3 or 4 children have the highest poverty rate, with 6 households (100.0%) falling below the poverty line. Among the single-parent households, those with 5 or more children have the highest poverty rate, with 13 household (100.0%) living below poverty.
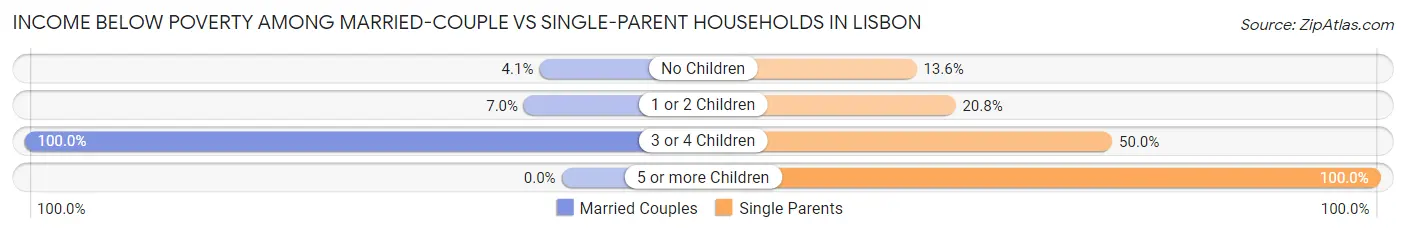
| Children | Married-Couple Families | Single-Parent Households |
| No Children | 7 (4.1%) | 8 (13.6%) |
| 1 or 2 Children | 15 (7.0%) | 15 (20.8%) |
| 3 or 4 Children | 6 (100.0%) | 29 (50.0%) |
| 5 or more Children | 0 (0.0%) | 13 (100.0%) |
| Total | 28 (7.2%) | 65 (32.2%) |
Employment Characteristics in Lisbon
Employment by Class of Employer in Lisbon
Among the 961 employed individuals in Lisbon, private company employees (714 | 74.3%), local government employees (66 | 6.9%), and not-for-profit organizations (61 | 6.4%) make up the most common classes of employment.
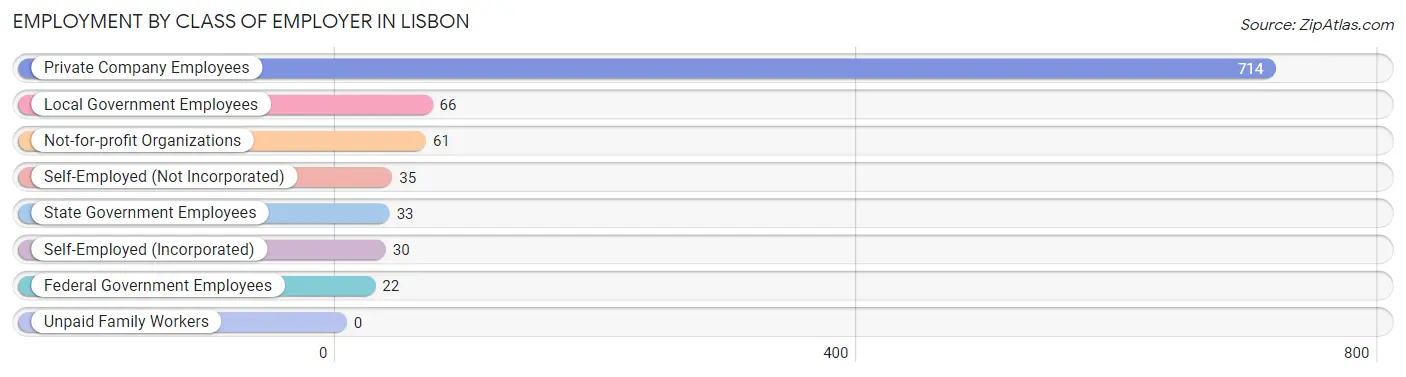
| Employer Class | # Employees | % Employees |
| Private Company Employees | 714 | 74.3% |
| Self-Employed (Incorporated) | 30 | 3.1% |
| Self-Employed (Not Incorporated) | 35 | 3.6% |
| Not-for-profit Organizations | 61 | 6.4% |
| Local Government Employees | 66 | 6.9% |
| State Government Employees | 33 | 3.4% |
| Federal Government Employees | 22 | 2.3% |
| Unpaid Family Workers | 0 | 0.0% |
| Total | 961 | 100.0% |
Employment Status by Age in Lisbon
According to the labor force statistics for Lisbon, out of the total population over 16 years of age (2,014), 49.0% or 987 individuals are in the labor force, with 2.2% or 22 of them unemployed. The age group with the highest labor force participation rate is 35 to 44 years, with 84.8% or 278 individuals in the labor force. Within the labor force, the 25 to 29 years age range has the highest percentage of unemployed individuals, with 9.8% or 13 of them being unemployed.
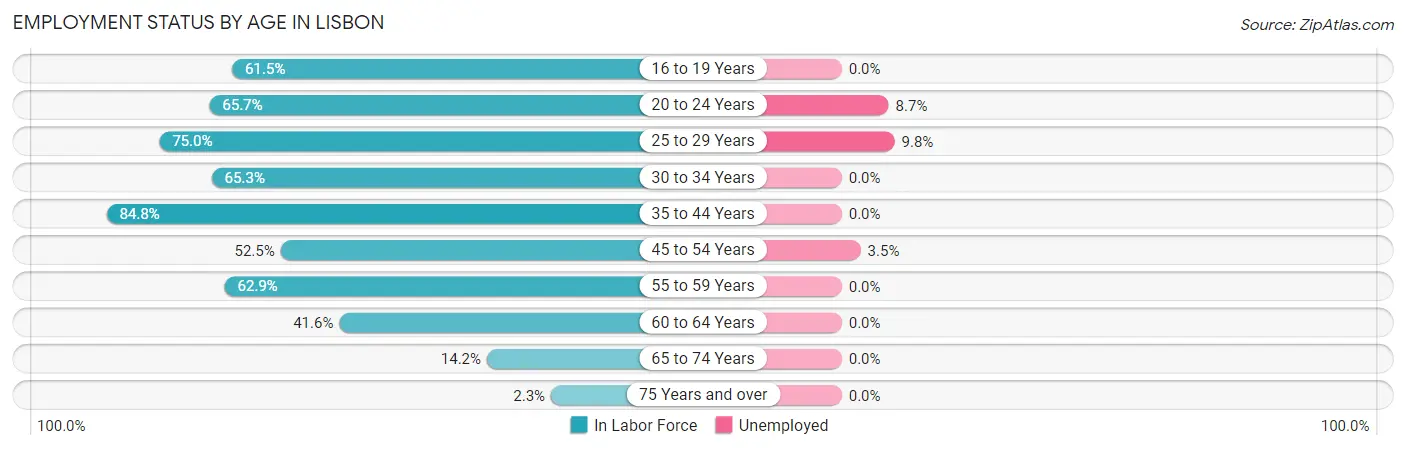
| Age Bracket | In Labor Force | Unemployed |
| 16 to 19 Years | 96 (61.5%) | 0 (0.0%) |
| 20 to 24 Years | 46 (65.7%) | 4 (8.7%) |
| 25 to 29 Years | 129 (75.0%) | 13 (9.8%) |
| 30 to 34 Years | 66 (65.3%) | 0 (0.0%) |
| 35 to 44 Years | 278 (84.8%) | 0 (0.0%) |
| 45 to 54 Years | 171 (52.5%) | 6 (3.5%) |
| 55 to 59 Years | 73 (62.9%) | 0 (0.0%) |
| 60 to 64 Years | 72 (41.6%) | 0 (0.0%) |
| 65 to 74 Years | 51 (14.2%) | 0 (0.0%) |
| 75 Years and over | 5 (2.3%) | 0 (0.0%) |
| Total | 987 (49.0%) | 22 (2.2%) |
Employment Status by Educational Attainment in Lisbon
According to labor force statistics for Lisbon, 64.9% of individuals (789) out of the total population between 25 and 64 years of age (1,216) are in the labor force, with 2.3% or 18 of them being unemployed. The group with the highest labor force participation rate are those with the educational attainment of college / associate degree, with 81.1% or 361 individuals in the labor force. Within the labor force, individuals with high school diploma education have the highest percentage of unemployment, with 6.0% or 18 of them being unemployed.
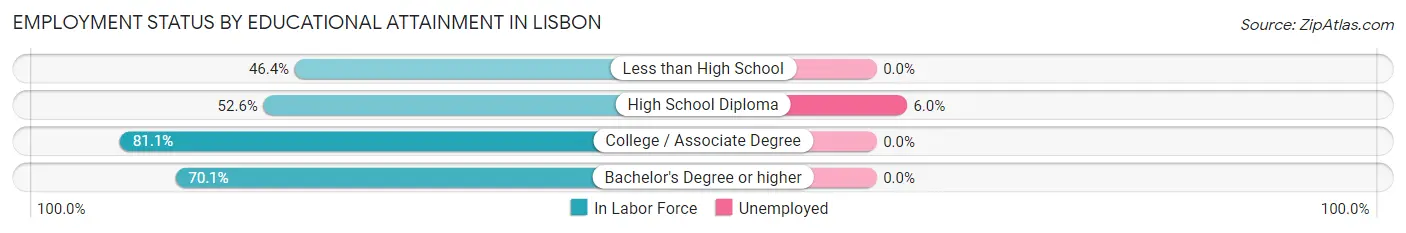
| Educational Attainment | In Labor Force | Unemployed |
| Less than High School | 26 (46.4%) | 0 (0.0%) |
| High School Diploma | 299 (52.6%) | 34 (6.0%) |
| College / Associate Degree | 361 (81.1%) | 0 (0.0%) |
| Bachelor's Degree or higher | 103 (70.1%) | 0 (0.0%) |
| Total | 789 (64.9%) | 28 (2.3%) |
Employment Occupations by Sex in Lisbon
Management, Business, Science and Arts Occupations
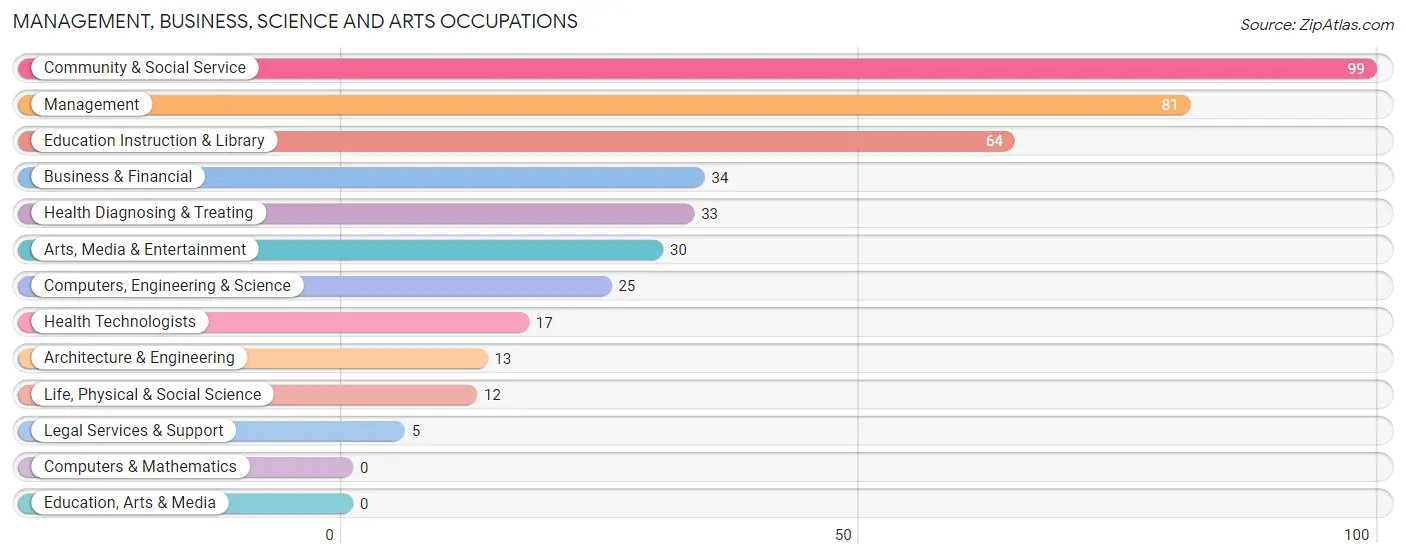
The most common Management, Business, Science and Arts occupations in Lisbon are Community & Social Service (99 | 10.3%), Management (81 | 8.5%), Education Instruction & Library (64 | 6.7%), Business & Financial (34 | 3.5%), and Health Diagnosing & Treating (33 | 3.4%).
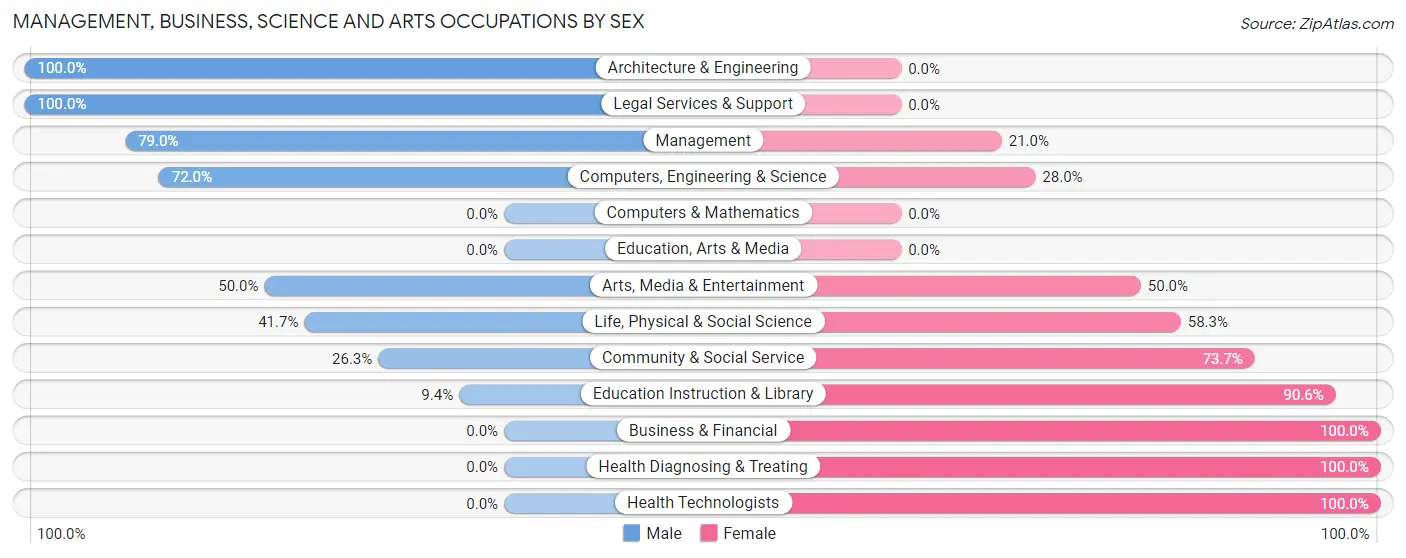
Management, Business, Science and Arts Occupations by Sex
Within the Management, Business, Science and Arts occupations in Lisbon, the most male-oriented occupations are Architecture & Engineering (100.0%), Legal Services & Support (100.0%), and Management (79.0%), while the most female-oriented occupations are Business & Financial (100.0%), Health Diagnosing & Treating (100.0%), and Health Technologists (100.0%).
| Occupation | Male | Female |
| Management | 64 (79.0%) | 17 (21.0%) |
| Business & Financial | 0 (0.0%) | 34 (100.0%) |
| Computers, Engineering & Science | 18 (72.0%) | 7 (28.0%) |
| Computers & Mathematics | 0 (0.0%) | 0 (0.0%) |
| Architecture & Engineering | 13 (100.0%) | 0 (0.0%) |
| Life, Physical & Social Science | 5 (41.7%) | 7 (58.3%) |
| Community & Social Service | 26 (26.3%) | 73 (73.7%) |
| Education, Arts & Media | 0 (0.0%) | 0 (0.0%) |
| Legal Services & Support | 5 (100.0%) | 0 (0.0%) |
| Education Instruction & Library | 6 (9.4%) | 58 (90.6%) |
| Arts, Media & Entertainment | 15 (50.0%) | 15 (50.0%) |
| Health Diagnosing & Treating | 0 (0.0%) | 33 (100.0%) |
| Health Technologists | 0 (0.0%) | 17 (100.0%) |
| Total (Category) | 108 (39.7%) | 164 (60.3%) |
| Total (Overall) | 560 (58.4%) | 399 (41.6%) |
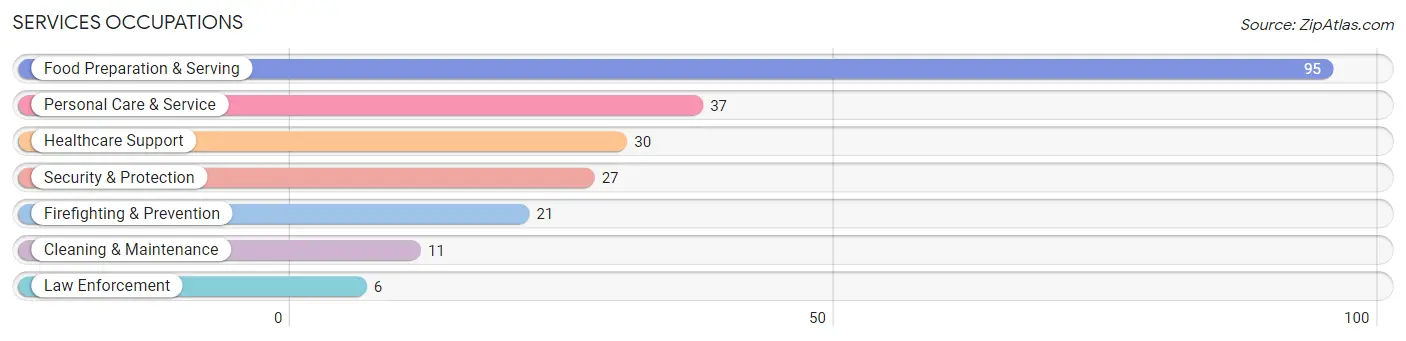
Services Occupations
The most common Services occupations in Lisbon are Food Preparation & Serving (95 | 9.9%), Personal Care & Service (37 | 3.9%), Healthcare Support (30 | 3.1%), Security & Protection (27 | 2.8%), and Firefighting & Prevention (21 | 2.2%).
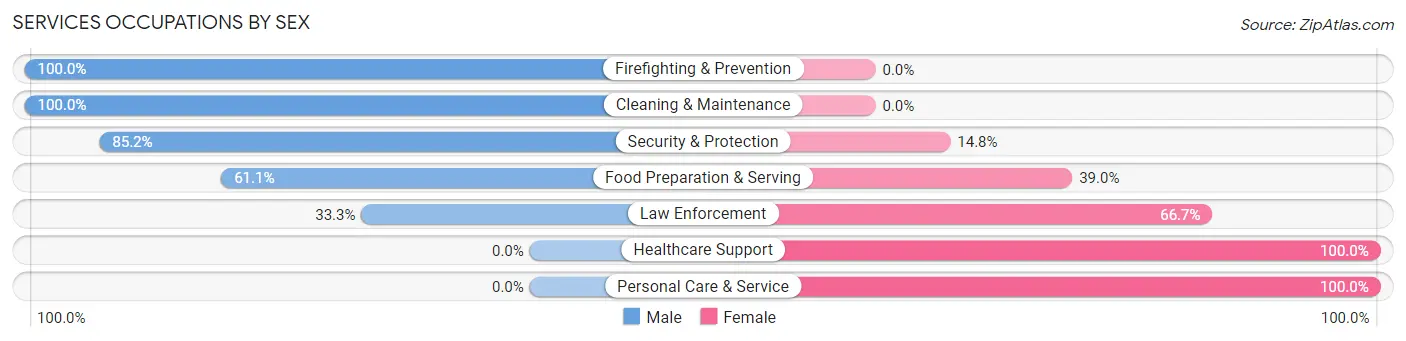
Services Occupations by Sex
Within the Services occupations in Lisbon, the most male-oriented occupations are Firefighting & Prevention (100.0%), Cleaning & Maintenance (100.0%), and Security & Protection (85.2%), while the most female-oriented occupations are Healthcare Support (100.0%), Personal Care & Service (100.0%), and Law Enforcement (66.7%).
| Occupation | Male | Female |
| Healthcare Support | 0 (0.0%) | 30 (100.0%) |
| Security & Protection | 23 (85.2%) | 4 (14.8%) |
| Firefighting & Prevention | 21 (100.0%) | 0 (0.0%) |
| Law Enforcement | 2 (33.3%) | 4 (66.7%) |
| Food Preparation & Serving | 58 (61.1%) | 37 (39.0%) |
| Cleaning & Maintenance | 11 (100.0%) | 0 (0.0%) |
| Personal Care & Service | 0 (0.0%) | 37 (100.0%) |
| Total (Category) | 92 (46.0%) | 108 (54.0%) |
| Total (Overall) | 560 (58.4%) | 399 (41.6%) |
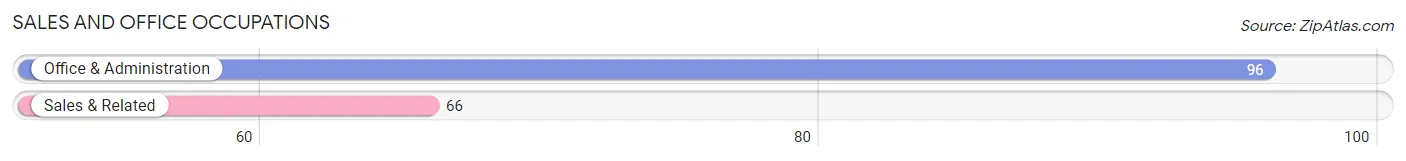
Sales and Office Occupations
The most common Sales and Office occupations in Lisbon are Office & Administration (96 | 10.0%), and Sales & Related (66 | 6.9%).
Sales and Office Occupations by Sex
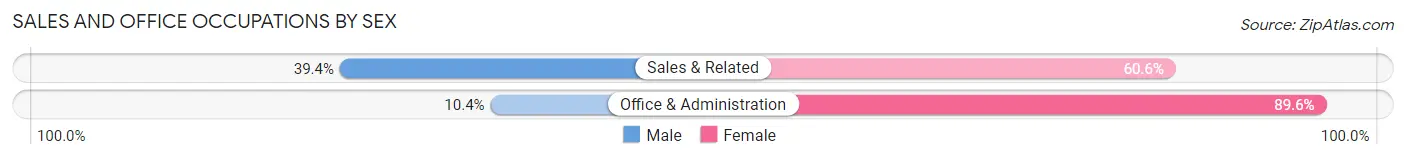
| Occupation | Male | Female |
| Sales & Related | 26 (39.4%) | 40 (60.6%) |
| Office & Administration | 10 (10.4%) | 86 (89.6%) |
| Total (Category) | 36 (22.2%) | 126 (77.8%) |
| Total (Overall) | 560 (58.4%) | 399 (41.6%) |
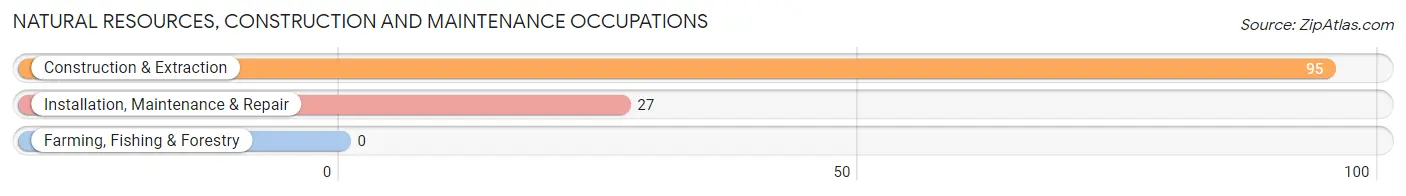
Natural Resources, Construction and Maintenance Occupations
The most common Natural Resources, Construction and Maintenance occupations in Lisbon are Construction & Extraction (95 | 9.9%), and Installation, Maintenance & Repair (27 | 2.8%).
Natural Resources, Construction and Maintenance Occupations by Sex
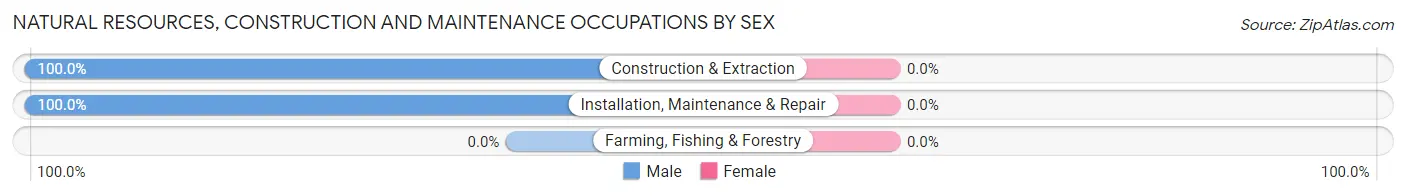
| Occupation | Male | Female |
| Farming, Fishing & Forestry | 0 (0.0%) | 0 (0.0%) |
| Construction & Extraction | 95 (100.0%) | 0 (0.0%) |
| Installation, Maintenance & Repair | 27 (100.0%) | 0 (0.0%) |
| Total (Category) | 122 (100.0%) | 0 (0.0%) |
| Total (Overall) | 560 (58.4%) | 399 (41.6%) |
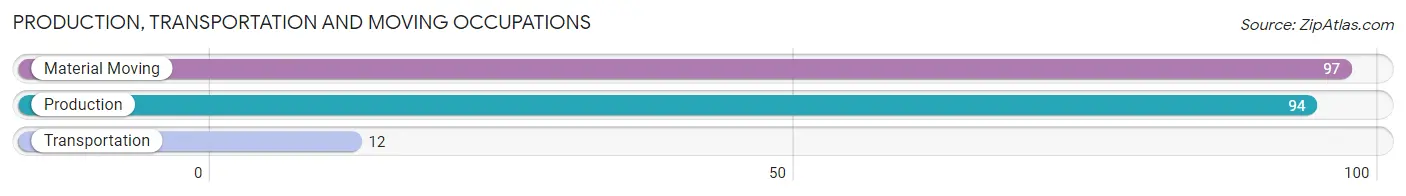
Production, Transportation and Moving Occupations
The most common Production, Transportation and Moving occupations in Lisbon are Material Moving (97 | 10.1%), Production (94 | 9.8%), and Transportation (12 | 1.3%).
Production, Transportation and Moving Occupations by Sex
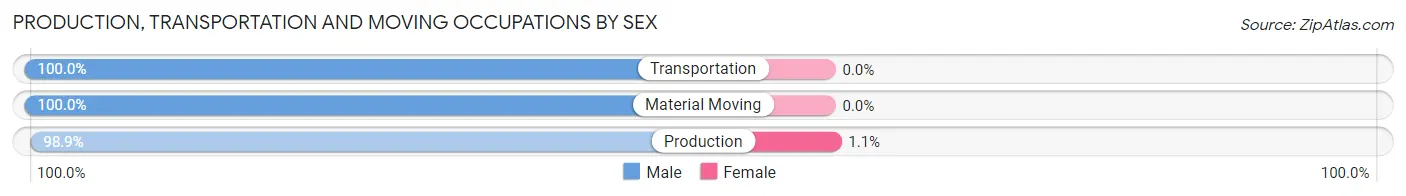
| Occupation | Male | Female |
| Production | 93 (98.9%) | 1 (1.1%) |
| Transportation | 12 (100.0%) | 0 (0.0%) |
| Material Moving | 97 (100.0%) | 0 (0.0%) |
| Total (Category) | 202 (99.5%) | 1 (0.5%) |
| Total (Overall) | 560 (58.4%) | 399 (41.6%) |
Employment Industries by Sex in Lisbon
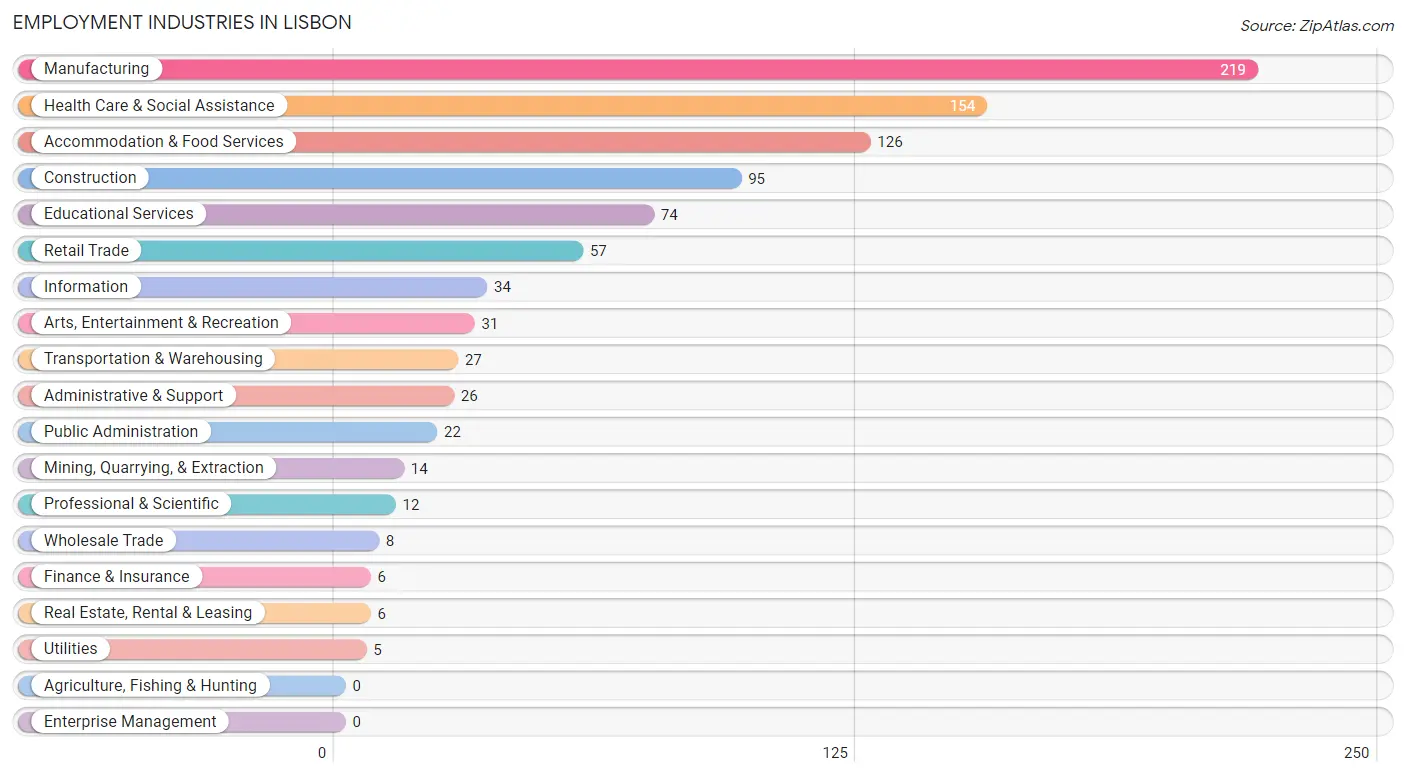
Employment Industries in Lisbon
The major employment industries in Lisbon include Manufacturing (219 | 22.8%), Health Care & Social Assistance (154 | 16.1%), Accommodation & Food Services (126 | 13.1%), Construction (95 | 9.9%), and Educational Services (74 | 7.7%).
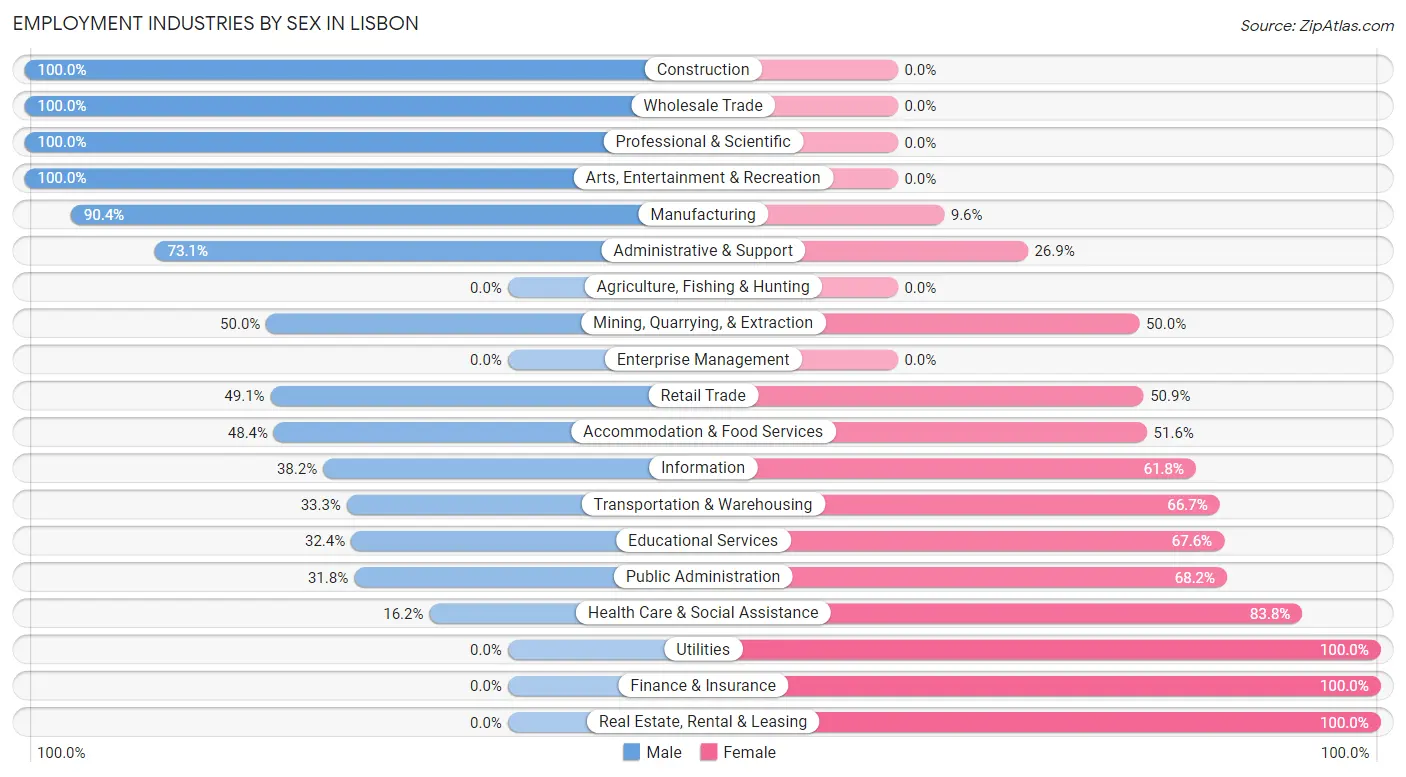
Employment Industries by Sex in Lisbon
The Lisbon industries that see more men than women are Construction (100.0%), Wholesale Trade (100.0%), and Professional & Scientific (100.0%), whereas the industries that tend to have a higher number of women are Utilities (100.0%), Finance & Insurance (100.0%), and Real Estate, Rental & Leasing (100.0%).
| Industry | Male | Female |
| Agriculture, Fishing & Hunting | 0 (0.0%) | 0 (0.0%) |
| Mining, Quarrying, & Extraction | 7 (50.0%) | 7 (50.0%) |
| Construction | 95 (100.0%) | 0 (0.0%) |
| Manufacturing | 198 (90.4%) | 21 (9.6%) |
| Wholesale Trade | 8 (100.0%) | 0 (0.0%) |
| Retail Trade | 28 (49.1%) | 29 (50.9%) |
| Transportation & Warehousing | 9 (33.3%) | 18 (66.7%) |
| Utilities | 0 (0.0%) | 5 (100.0%) |
| Information | 13 (38.2%) | 21 (61.8%) |
| Finance & Insurance | 0 (0.0%) | 6 (100.0%) |
| Real Estate, Rental & Leasing | 0 (0.0%) | 6 (100.0%) |
| Professional & Scientific | 12 (100.0%) | 0 (0.0%) |
| Enterprise Management | 0 (0.0%) | 0 (0.0%) |
| Administrative & Support | 19 (73.1%) | 7 (26.9%) |
| Educational Services | 24 (32.4%) | 50 (67.6%) |
| Health Care & Social Assistance | 25 (16.2%) | 129 (83.8%) |
| Arts, Entertainment & Recreation | 31 (100.0%) | 0 (0.0%) |
| Accommodation & Food Services | 61 (48.4%) | 65 (51.6%) |
| Public Administration | 7 (31.8%) | 15 (68.2%) |
| Total | 560 (58.4%) | 399 (41.6%) |
Education in Lisbon
School Enrollment in Lisbon
The most common levels of schooling among the 556 students in Lisbon are elementary school (137 | 24.6%), high school (132 | 23.7%), and middle school (117 | 21.0%).
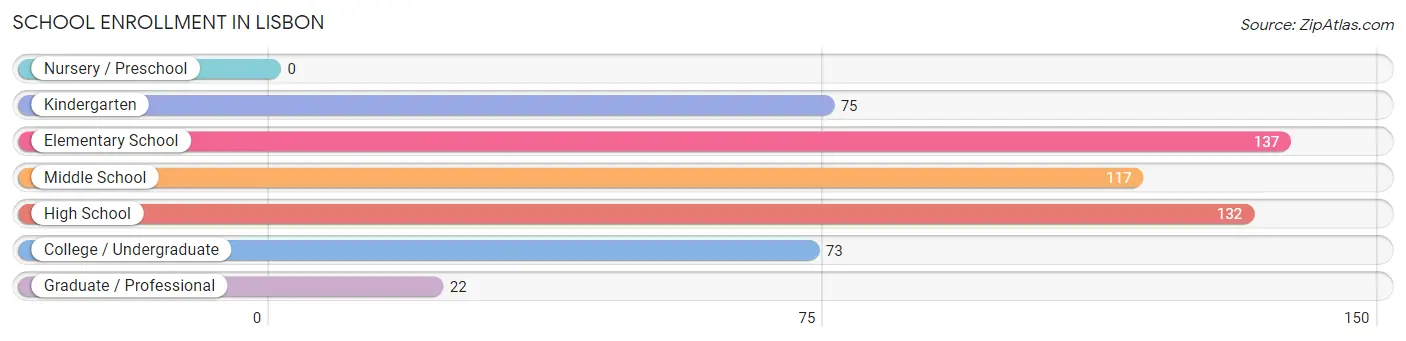
| School Level | # Students | % Students |
| Nursery / Preschool | 0 | 0.0% |
| Kindergarten | 75 | 13.5% |
| Elementary School | 137 | 24.6% |
| Middle School | 117 | 21.0% |
| High School | 132 | 23.7% |
| College / Undergraduate | 73 | 13.1% |
| Graduate / Professional | 22 | 4.0% |
| Total | 556 | 100.0% |
School Enrollment by Age by Funding Source in Lisbon
Out of a total of 556 students who are enrolled in schools in Lisbon, 38 (6.8%) attend a private institution, while the remaining 518 (93.2%) are enrolled in public schools. The age group of 18 to 19 year olds has the highest likelihood of being enrolled in private schools, with 13 (65.0% in the age bracket) enrolled. Conversely, the age group of 10 to 14 year olds has the lowest likelihood of being enrolled in a private school, with 156 (100.0% in the age bracket) attending a public institution.
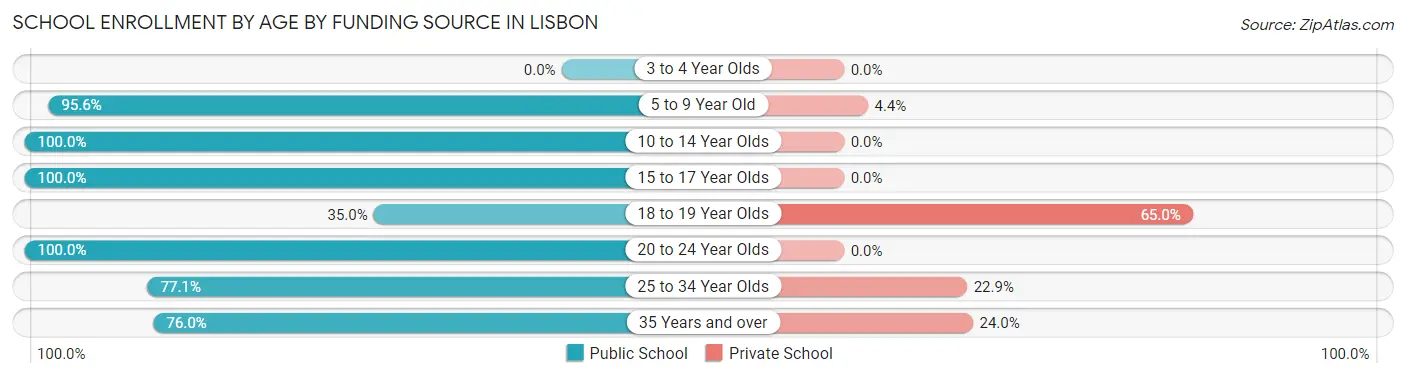
| Age Bracket | Public School | Private School |
| 3 to 4 Year Olds | 0 (0.0%) | 0 (0.0%) |
| 5 to 9 Year Old | 172 (95.6%) | 8 (4.4%) |
| 10 to 14 Year Olds | 156 (100.0%) | 0 (0.0%) |
| 15 to 17 Year Olds | 120 (100.0%) | 0 (0.0%) |
| 18 to 19 Year Olds | 7 (35.0%) | 13 (65.0%) |
| 20 to 24 Year Olds | 7 (100.0%) | 0 (0.0%) |
| 25 to 34 Year Olds | 37 (77.1%) | 11 (22.9%) |
| 35 Years and over | 19 (76.0%) | 6 (24.0%) |
| Total | 518 (93.2%) | 38 (6.8%) |
Educational Attainment by Field of Study in Lisbon
Education (76 | 26.6%), engineering (42 | 14.7%), business (36 | 12.6%), computers & mathematics (31 | 10.8%), and social sciences (23 | 8.0%) are the most common fields of study among 286 individuals in Lisbon who have obtained a bachelor's degree or higher.
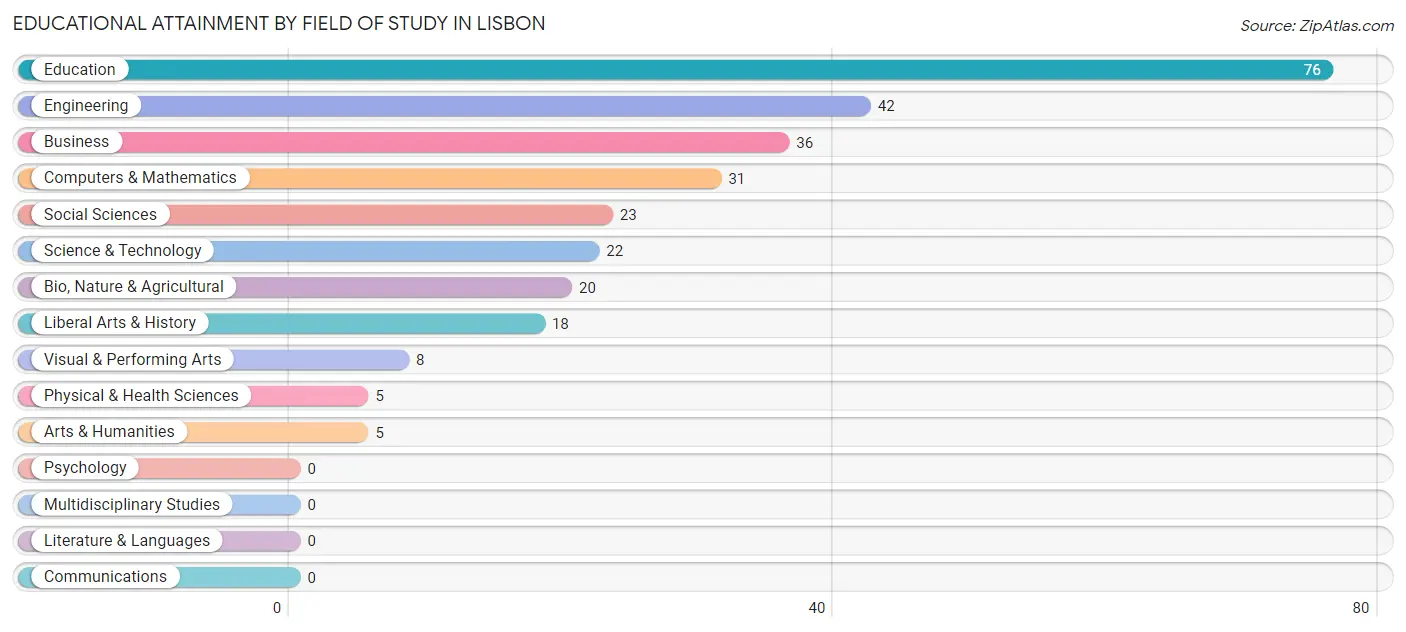
| Field of Study | # Graduates | % Graduates |
| Computers & Mathematics | 31 | 10.8% |
| Bio, Nature & Agricultural | 20 | 7.0% |
| Physical & Health Sciences | 5 | 1.8% |
| Psychology | 0 | 0.0% |
| Social Sciences | 23 | 8.0% |
| Engineering | 42 | 14.7% |
| Multidisciplinary Studies | 0 | 0.0% |
| Science & Technology | 22 | 7.7% |
| Business | 36 | 12.6% |
| Education | 76 | 26.6% |
| Literature & Languages | 0 | 0.0% |
| Liberal Arts & History | 18 | 6.3% |
| Visual & Performing Arts | 8 | 2.8% |
| Communications | 0 | 0.0% |
| Arts & Humanities | 5 | 1.8% |
| Total | 286 | 100.0% |
Transportation & Commute in Lisbon
Vehicle Availability by Sex in Lisbon
The most prevalent vehicle ownership categories in Lisbon are males with 2 vehicles (318, accounting for 59.9%) and females with 2 vehicles (243, making up 79.7%).
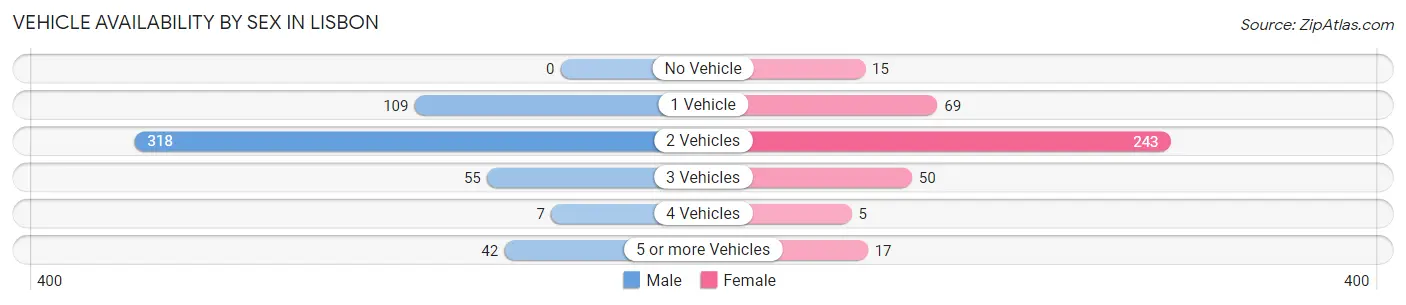
| Vehicles Available | Male | Female |
| No Vehicle | 0 (0.0%) | 15 (3.8%) |
| 1 Vehicle | 109 (20.5%) | 69 (17.3%) |
| 2 Vehicles | 318 (59.9%) | 243 (60.9%) |
| 3 Vehicles | 55 (10.4%) | 50 (12.5%) |
| 4 Vehicles | 7 (1.3%) | 5 (1.3%) |
| 5 or more Vehicles | 42 (7.9%) | 17 (4.3%) |
| Total | 531 (100.0%) | 399 (100.0%) |
Commute Time in Lisbon
The most frequently occuring commute durations in Lisbon are 5 to 9 minutes (151 commuters, 16.1%), less than 5 minutes (129 commuters, 13.7%), and 20 to 24 minutes (118 commuters, 12.5%).
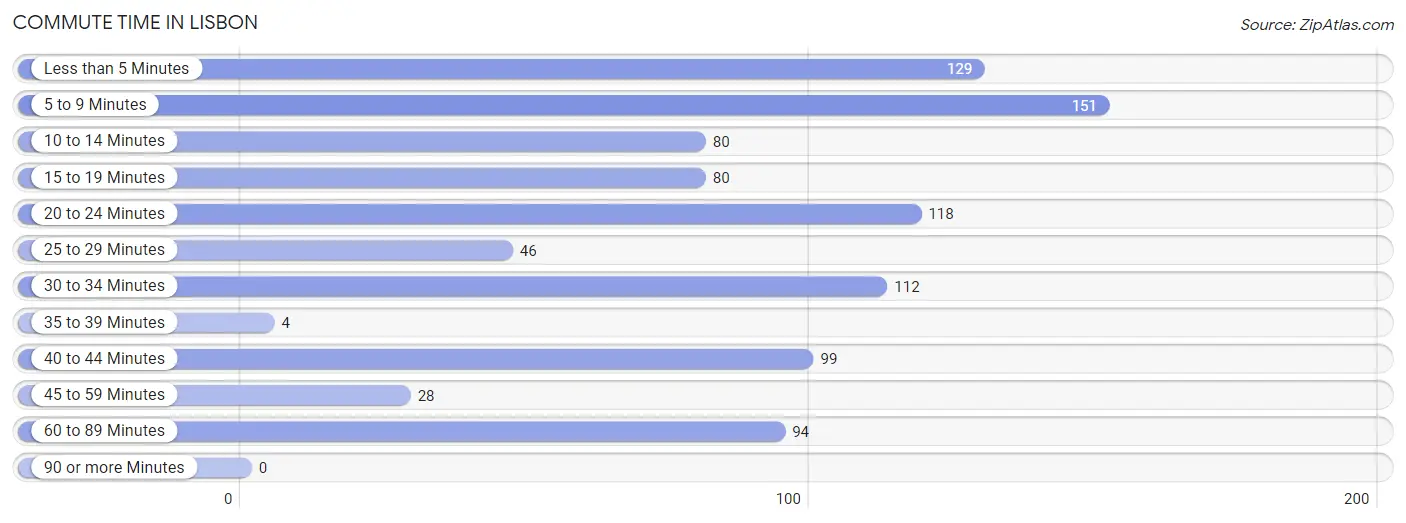
| Commute Time | # Commuters | % Commuters |
| Less than 5 Minutes | 129 | 13.7% |
| 5 to 9 Minutes | 151 | 16.1% |
| 10 to 14 Minutes | 80 | 8.5% |
| 15 to 19 Minutes | 80 | 8.5% |
| 20 to 24 Minutes | 118 | 12.5% |
| 25 to 29 Minutes | 46 | 4.9% |
| 30 to 34 Minutes | 112 | 11.9% |
| 35 to 39 Minutes | 4 | 0.4% |
| 40 to 44 Minutes | 99 | 10.5% |
| 45 to 59 Minutes | 28 | 3.0% |
| 60 to 89 Minutes | 94 | 10.0% |
| 90 or more Minutes | 0 | 0.0% |
Commute Time by Sex in Lisbon
The most common commute times in Lisbon are 40 to 44 minutes (98 commuters, 17.9%) for males and 5 to 9 minutes (113 commuters, 28.6%) for females.
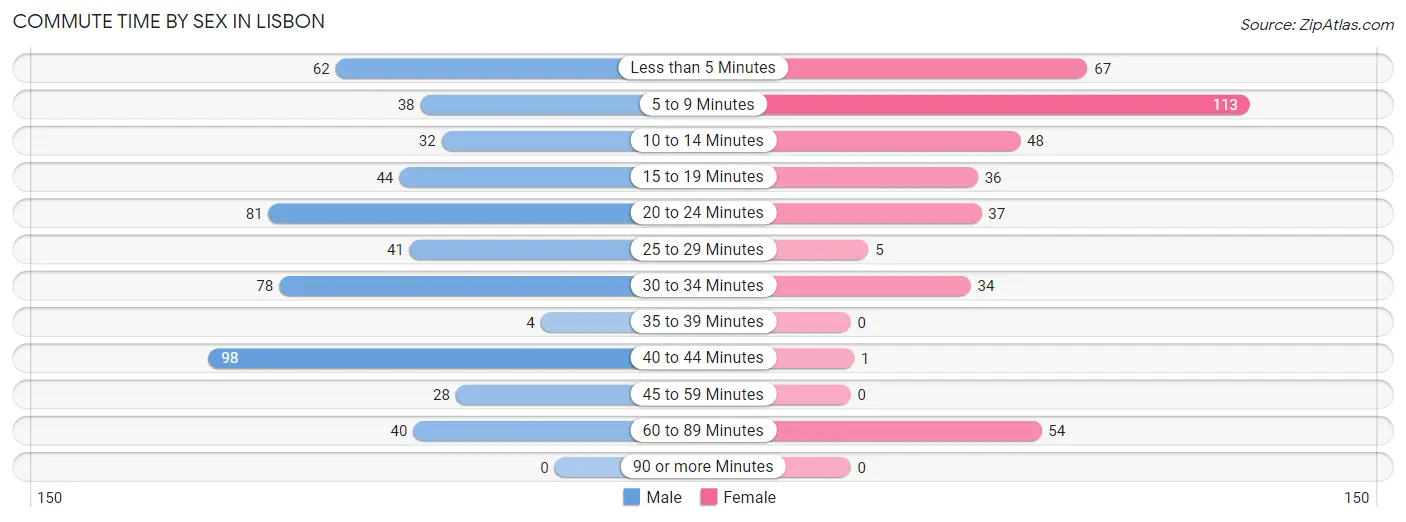
| Commute Time | Male | Female |
| Less than 5 Minutes | 62 (11.4%) | 67 (17.0%) |
| 5 to 9 Minutes | 38 (7.0%) | 113 (28.6%) |
| 10 to 14 Minutes | 32 (5.9%) | 48 (12.1%) |
| 15 to 19 Minutes | 44 (8.1%) | 36 (9.1%) |
| 20 to 24 Minutes | 81 (14.8%) | 37 (9.4%) |
| 25 to 29 Minutes | 41 (7.5%) | 5 (1.3%) |
| 30 to 34 Minutes | 78 (14.3%) | 34 (8.6%) |
| 35 to 39 Minutes | 4 (0.7%) | 0 (0.0%) |
| 40 to 44 Minutes | 98 (17.9%) | 1 (0.3%) |
| 45 to 59 Minutes | 28 (5.1%) | 0 (0.0%) |
| 60 to 89 Minutes | 40 (7.3%) | 54 (13.7%) |
| 90 or more Minutes | 0 (0.0%) | 0 (0.0%) |
Time of Departure to Work by Sex in Lisbon
The most frequent times of departure to work in Lisbon are 5:00 AM to 5:29 AM (120, 22.0%) for males and 7:30 AM to 7:59 AM (97, 24.6%) for females.
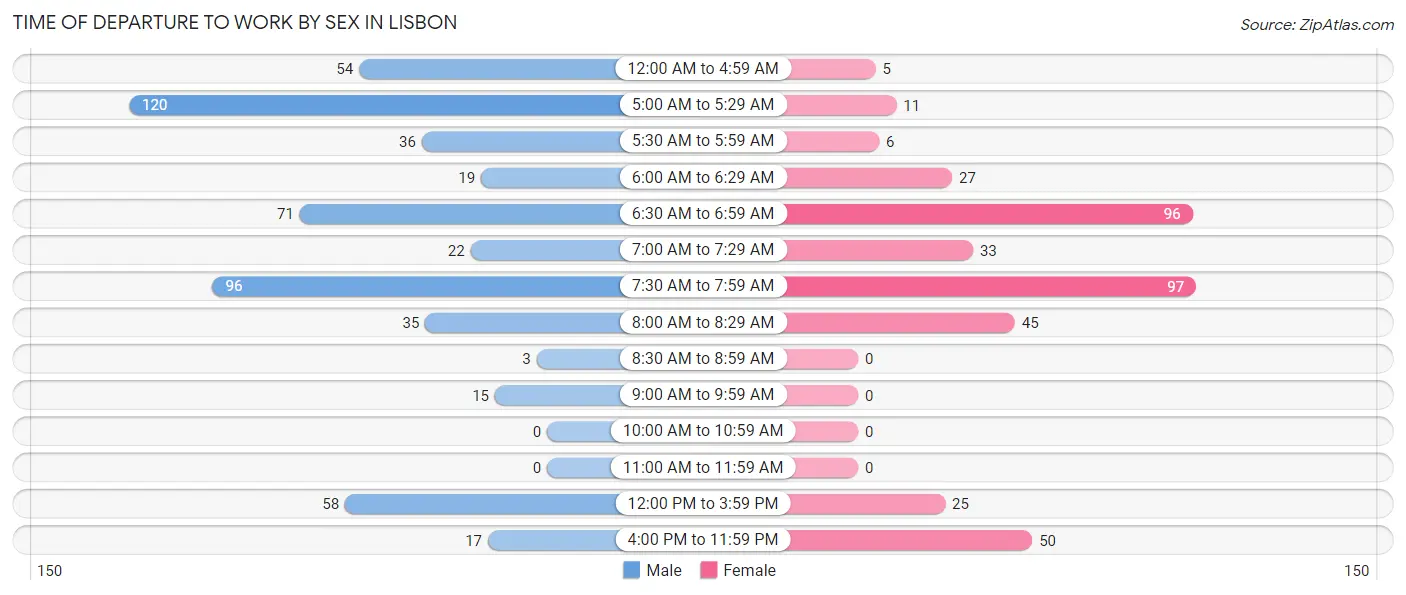
| Time of Departure | Male | Female |
| 12:00 AM to 4:59 AM | 54 (9.9%) | 5 (1.3%) |
| 5:00 AM to 5:29 AM | 120 (22.0%) | 11 (2.8%) |
| 5:30 AM to 5:59 AM | 36 (6.6%) | 6 (1.5%) |
| 6:00 AM to 6:29 AM | 19 (3.5%) | 27 (6.8%) |
| 6:30 AM to 6:59 AM | 71 (13.0%) | 96 (24.3%) |
| 7:00 AM to 7:29 AM | 22 (4.0%) | 33 (8.4%) |
| 7:30 AM to 7:59 AM | 96 (17.6%) | 97 (24.6%) |
| 8:00 AM to 8:29 AM | 35 (6.4%) | 45 (11.4%) |
| 8:30 AM to 8:59 AM | 3 (0.5%) | 0 (0.0%) |
| 9:00 AM to 9:59 AM | 15 (2.8%) | 0 (0.0%) |
| 10:00 AM to 10:59 AM | 0 (0.0%) | 0 (0.0%) |
| 11:00 AM to 11:59 AM | 0 (0.0%) | 0 (0.0%) |
| 12:00 PM to 3:59 PM | 58 (10.6%) | 25 (6.3%) |
| 4:00 PM to 11:59 PM | 17 (3.1%) | 50 (12.7%) |
| Total | 546 (100.0%) | 395 (100.0%) |
Housing Occupancy in Lisbon
Occupancy by Ownership in Lisbon
Of the total 1,055 dwellings in Lisbon, owner-occupied units account for 669 (63.4%), while renter-occupied units make up 386 (36.6%).
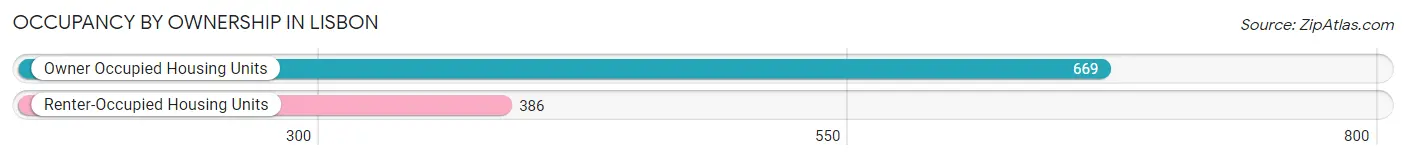
| Occupancy | # Housing Units | % Housing Units |
| Owner Occupied Housing Units | 669 | 63.4% |
| Renter-Occupied Housing Units | 386 | 36.6% |
| Total Occupied Housing Units | 1,055 | 100.0% |
Occupancy by Household Size in Lisbon
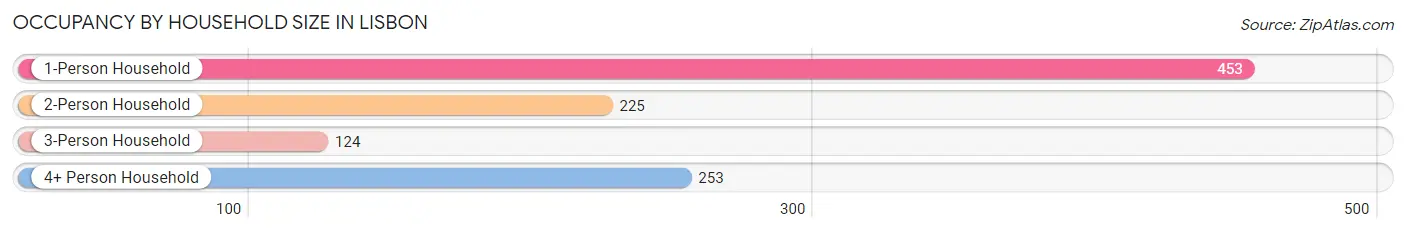
| Household Size | # Housing Units | % Housing Units |
| 1-Person Household | 453 | 42.9% |
| 2-Person Household | 225 | 21.3% |
| 3-Person Household | 124 | 11.7% |
| 4+ Person Household | 253 | 24.0% |
| Total Housing Units | 1,055 | 100.0% |
Occupancy by Ownership by Household Size in Lisbon
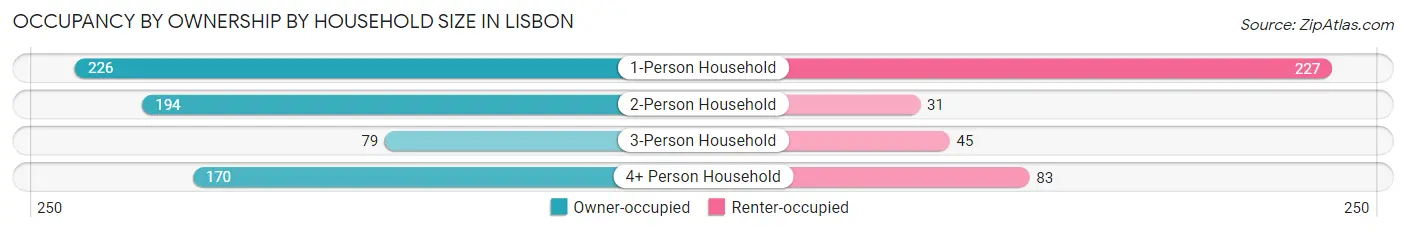
| Household Size | Owner-occupied | Renter-occupied |
| 1-Person Household | 226 (49.9%) | 227 (50.1%) |
| 2-Person Household | 194 (86.2%) | 31 (13.8%) |
| 3-Person Household | 79 (63.7%) | 45 (36.3%) |
| 4+ Person Household | 170 (67.2%) | 83 (32.8%) |
| Total Housing Units | 669 (63.4%) | 386 (36.6%) |
Occupancy by Educational Attainment in Lisbon
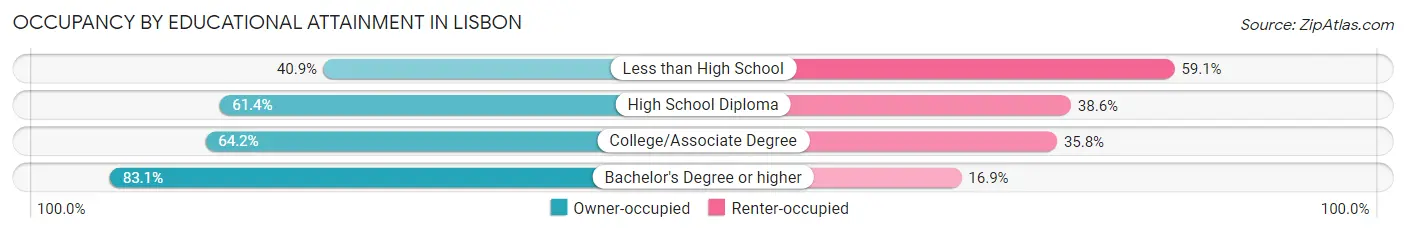
| Household Size | Owner-occupied | Renter-occupied |
| Less than High School | 38 (40.9%) | 55 (59.1%) |
| High School Diploma | 291 (61.4%) | 183 (38.6%) |
| College/Associate Degree | 222 (64.2%) | 124 (35.8%) |
| Bachelor's Degree or higher | 118 (83.1%) | 24 (16.9%) |
Occupancy by Age of Householder in Lisbon
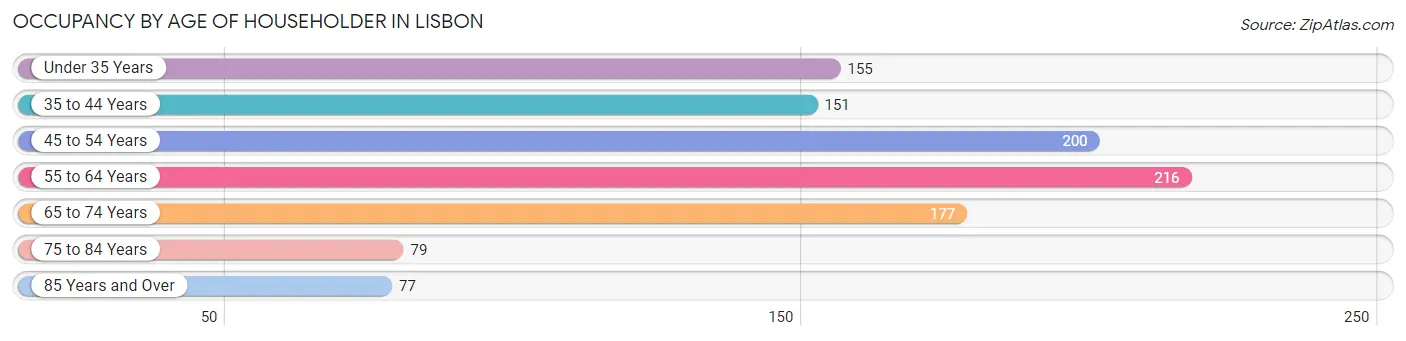
| Age Bracket | # Households | % Households |
| Under 35 Years | 155 | 14.7% |
| 35 to 44 Years | 151 | 14.3% |
| 45 to 54 Years | 200 | 19.0% |
| 55 to 64 Years | 216 | 20.5% |
| 65 to 74 Years | 177 | 16.8% |
| 75 to 84 Years | 79 | 7.5% |
| 85 Years and Over | 77 | 7.3% |
| Total | 1,055 | 100.0% |
Housing Finances in Lisbon
Median Income by Occupancy in Lisbon
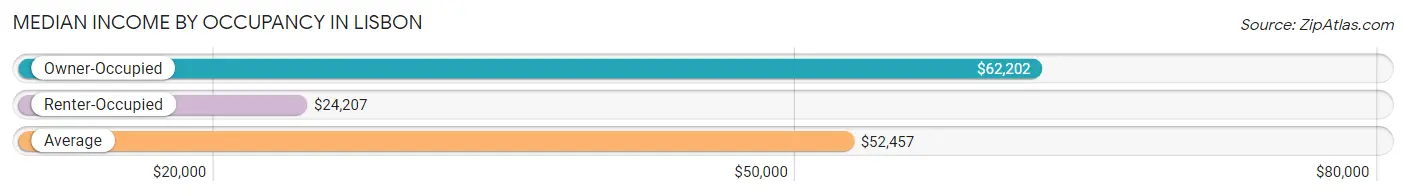
| Occupancy Type | # Households | Median Income |
| Owner-Occupied | 669 (63.4%) | $62,202 |
| Renter-Occupied | 386 (36.6%) | $24,207 |
| Average | 1,055 (100.0%) | $52,457 |
Occupancy by Householder Income Bracket in Lisbon
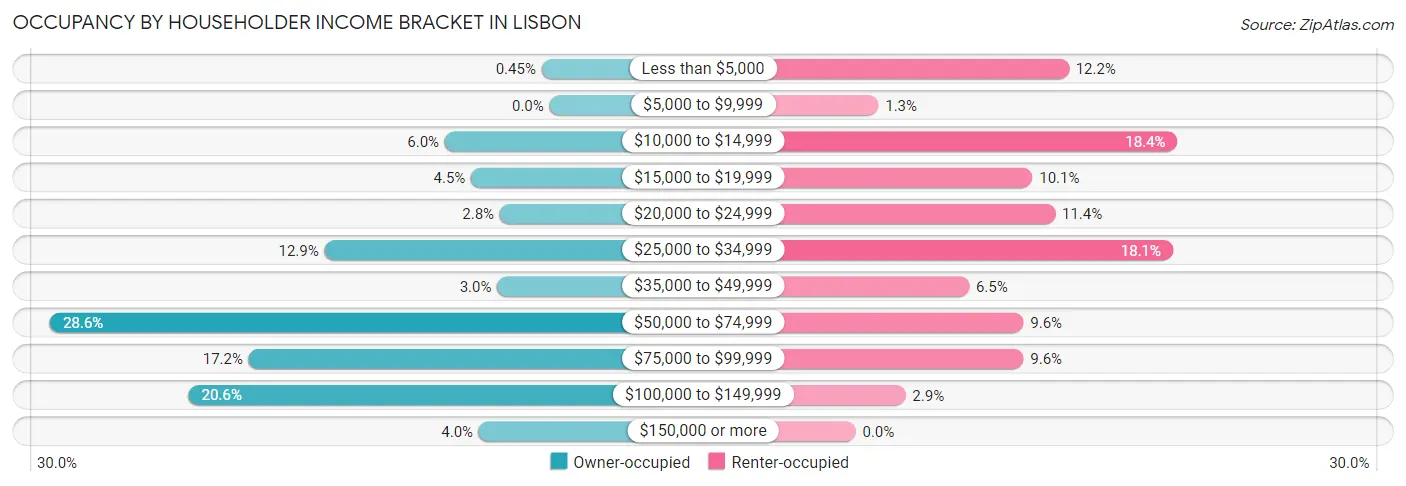
| Income Bracket | Owner-occupied | Renter-occupied |
| Less than $5,000 | 3 (0.4%) | 47 (12.2%) |
| $5,000 to $9,999 | 0 (0.0%) | 5 (1.3%) |
| $10,000 to $14,999 | 40 (6.0%) | 71 (18.4%) |
| $15,000 to $19,999 | 30 (4.5%) | 39 (10.1%) |
| $20,000 to $24,999 | 19 (2.8%) | 44 (11.4%) |
| $25,000 to $34,999 | 86 (12.9%) | 70 (18.1%) |
| $35,000 to $49,999 | 20 (3.0%) | 25 (6.5%) |
| $50,000 to $74,999 | 191 (28.5%) | 37 (9.6%) |
| $75,000 to $99,999 | 115 (17.2%) | 37 (9.6%) |
| $100,000 to $149,999 | 138 (20.6%) | 11 (2.9%) |
| $150,000 or more | 27 (4.0%) | 0 (0.0%) |
| Total | 669 (100.0%) | 386 (100.0%) |
Monthly Housing Cost Tiers in Lisbon
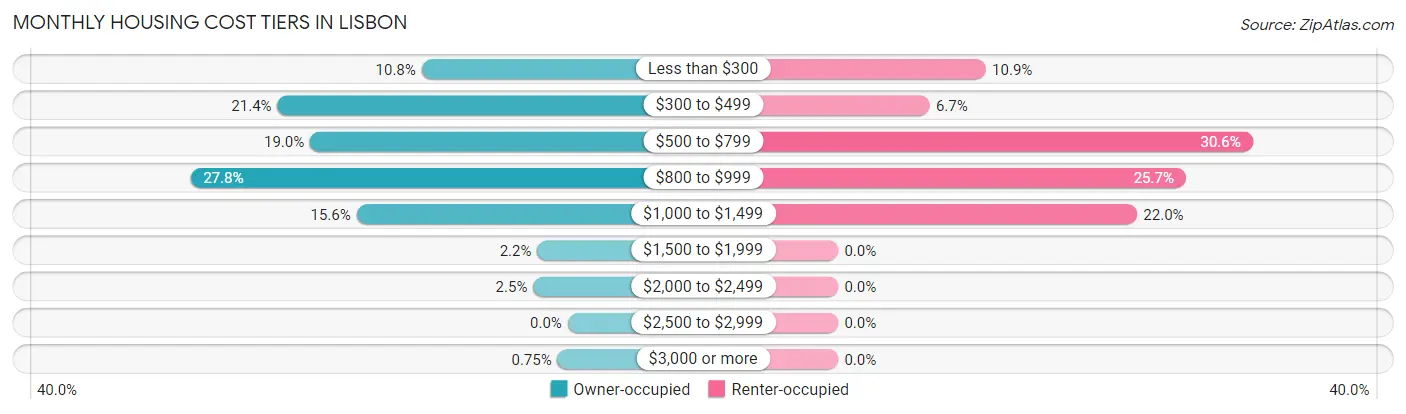
| Monthly Cost | Owner-occupied | Renter-occupied |
| Less than $300 | 72 (10.8%) | 42 (10.9%) |
| $300 to $499 | 143 (21.4%) | 26 (6.7%) |
| $500 to $799 | 127 (19.0%) | 118 (30.6%) |
| $800 to $999 | 186 (27.8%) | 99 (25.7%) |
| $1,000 to $1,499 | 104 (15.5%) | 85 (22.0%) |
| $1,500 to $1,999 | 15 (2.2%) | 0 (0.0%) |
| $2,000 to $2,499 | 17 (2.5%) | 0 (0.0%) |
| $2,500 to $2,999 | 0 (0.0%) | 0 (0.0%) |
| $3,000 or more | 5 (0.7%) | 0 (0.0%) |
| Total | 669 (100.0%) | 386 (100.0%) |
Physical Housing Characteristics in Lisbon
Housing Structures in Lisbon
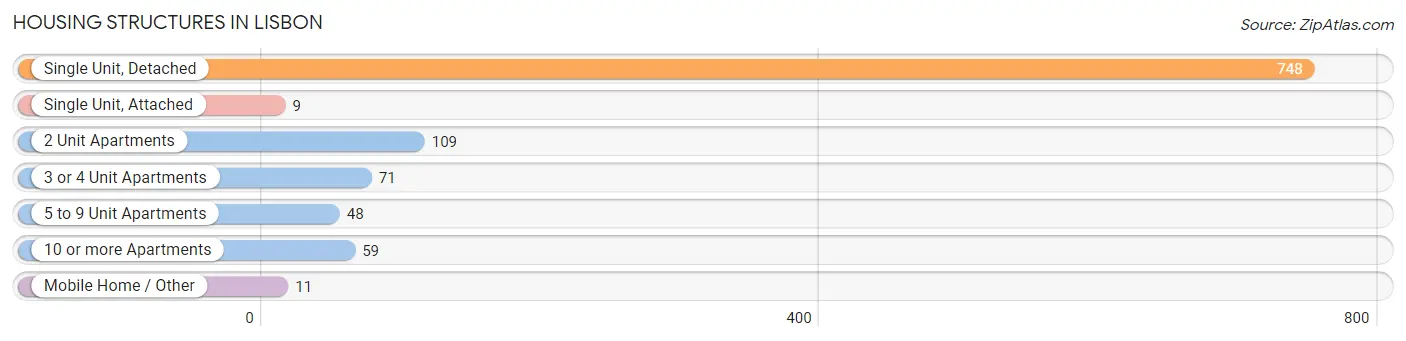
| Structure Type | # Housing Units | % Housing Units |
| Single Unit, Detached | 748 | 70.9% |
| Single Unit, Attached | 9 | 0.9% |
| 2 Unit Apartments | 109 | 10.3% |
| 3 or 4 Unit Apartments | 71 | 6.7% |
| 5 to 9 Unit Apartments | 48 | 4.5% |
| 10 or more Apartments | 59 | 5.6% |
| Mobile Home / Other | 11 | 1.0% |
| Total | 1,055 | 100.0% |
Housing Structures by Occupancy in Lisbon
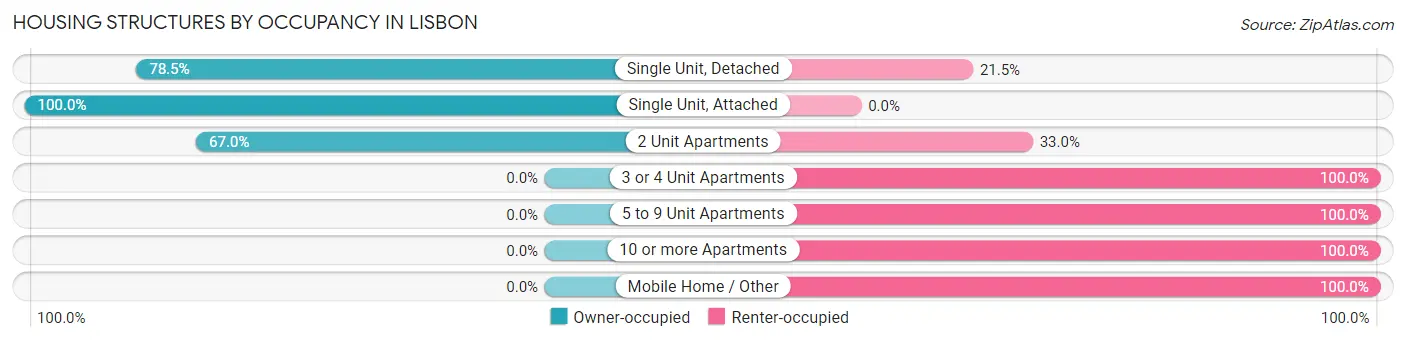
| Structure Type | Owner-occupied | Renter-occupied |
| Single Unit, Detached | 587 (78.5%) | 161 (21.5%) |
| Single Unit, Attached | 9 (100.0%) | 0 (0.0%) |
| 2 Unit Apartments | 73 (67.0%) | 36 (33.0%) |
| 3 or 4 Unit Apartments | 0 (0.0%) | 71 (100.0%) |
| 5 to 9 Unit Apartments | 0 (0.0%) | 48 (100.0%) |
| 10 or more Apartments | 0 (0.0%) | 59 (100.0%) |
| Mobile Home / Other | 0 (0.0%) | 11 (100.0%) |
| Total | 669 (63.4%) | 386 (36.6%) |
Housing Structures by Number of Rooms in Lisbon
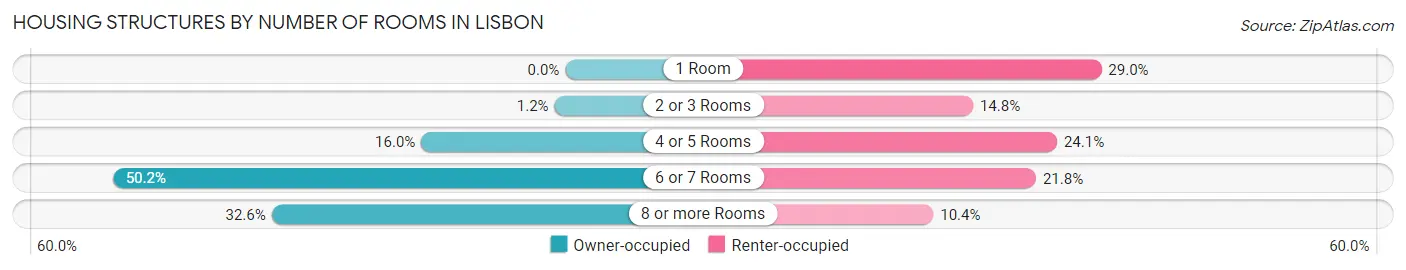
| Number of Rooms | Owner-occupied | Renter-occupied |
| 1 Room | 0 (0.0%) | 112 (29.0%) |
| 2 or 3 Rooms | 8 (1.2%) | 57 (14.8%) |
| 4 or 5 Rooms | 107 (16.0%) | 93 (24.1%) |
| 6 or 7 Rooms | 336 (50.2%) | 84 (21.8%) |
| 8 or more Rooms | 218 (32.6%) | 40 (10.4%) |
| Total | 669 (100.0%) | 386 (100.0%) |
Housing Structure by Heating Type in Lisbon
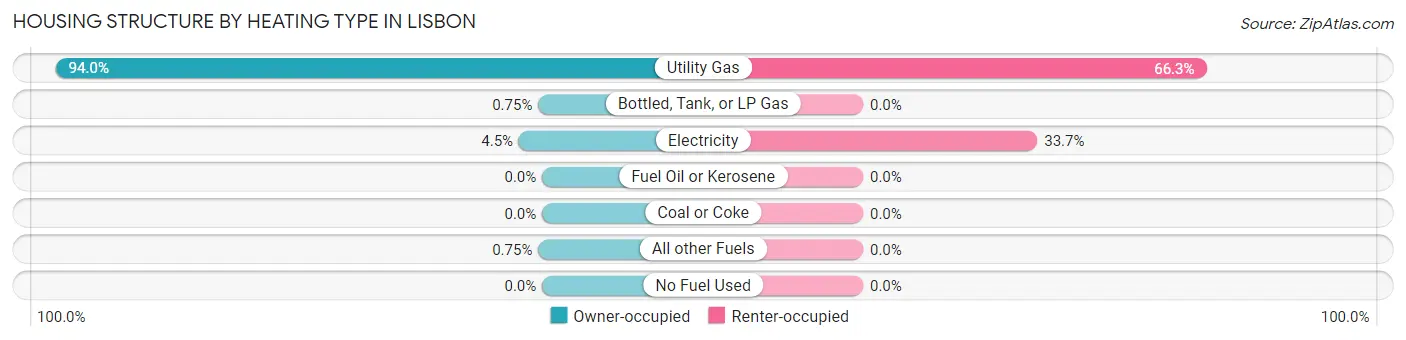
| Heating Type | Owner-occupied | Renter-occupied |
| Utility Gas | 629 (94.0%) | 256 (66.3%) |
| Bottled, Tank, or LP Gas | 5 (0.7%) | 0 (0.0%) |
| Electricity | 30 (4.5%) | 130 (33.7%) |
| Fuel Oil or Kerosene | 0 (0.0%) | 0 (0.0%) |
| Coal or Coke | 0 (0.0%) | 0 (0.0%) |
| All other Fuels | 5 (0.7%) | 0 (0.0%) |
| No Fuel Used | 0 (0.0%) | 0 (0.0%) |
| Total | 669 (100.0%) | 386 (100.0%) |
Household Vehicle Usage in Lisbon
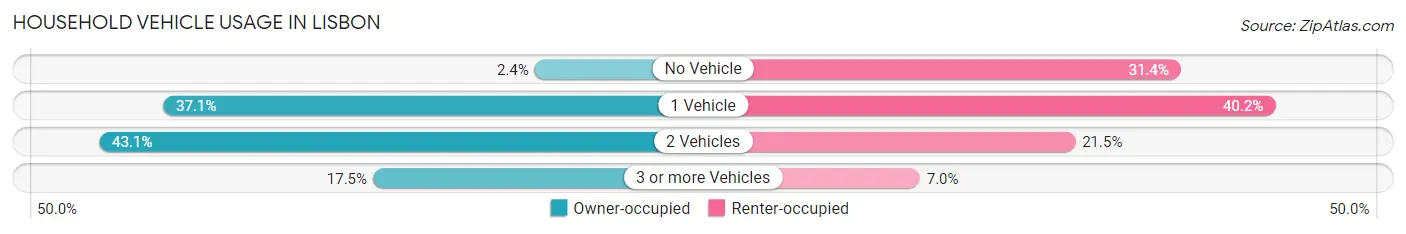
| Vehicles per Household | Owner-occupied | Renter-occupied |
| No Vehicle | 16 (2.4%) | 121 (31.4%) |
| 1 Vehicle | 248 (37.1%) | 155 (40.2%) |
| 2 Vehicles | 288 (43.0%) | 83 (21.5%) |
| 3 or more Vehicles | 117 (17.5%) | 27 (7.0%) |
| Total | 669 (100.0%) | 386 (100.0%) |
Real Estate & Mortgages in Lisbon
Real Estate and Mortgage Overview in Lisbon
| Characteristic | Without Mortgage | With Mortgage |
| Housing Units | 312 | 357 |
| Median Property Value | $97,900 | $118,500 |
| Median Household Income | $53,115 | $11 |
| Monthly Housing Costs | $379 | $0 |
| Real Estate Taxes | $933 | $0 |
Property Value by Mortgage Status in Lisbon
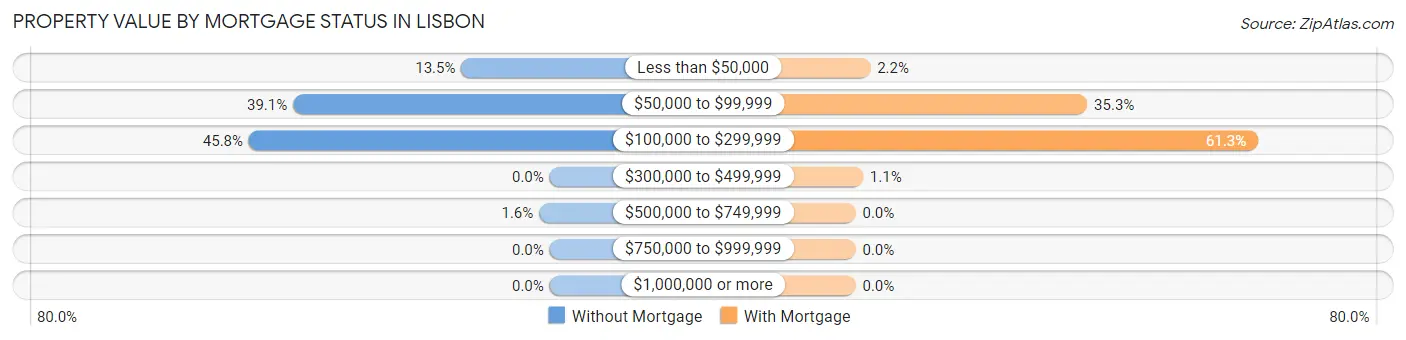
| Property Value | Without Mortgage | With Mortgage |
| Less than $50,000 | 42 (13.5%) | 8 (2.2%) |
| $50,000 to $99,999 | 122 (39.1%) | 126 (35.3%) |
| $100,000 to $299,999 | 143 (45.8%) | 219 (61.3%) |
| $300,000 to $499,999 | 0 (0.0%) | 4 (1.1%) |
| $500,000 to $749,999 | 5 (1.6%) | 0 (0.0%) |
| $750,000 to $999,999 | 0 (0.0%) | 0 (0.0%) |
| $1,000,000 or more | 0 (0.0%) | 0 (0.0%) |
| Total | 312 (100.0%) | 357 (100.0%) |
Household Income by Mortgage Status in Lisbon
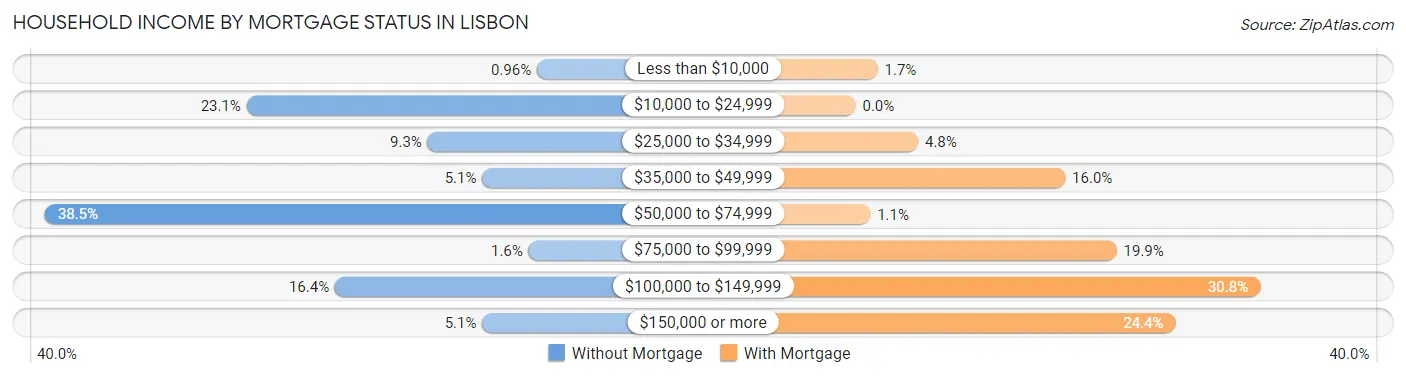
| Household Income | Without Mortgage | With Mortgage |
| Less than $10,000 | 3 (1.0%) | 6 (1.7%) |
| $10,000 to $24,999 | 72 (23.1%) | 0 (0.0%) |
| $25,000 to $34,999 | 29 (9.3%) | 17 (4.8%) |
| $35,000 to $49,999 | 16 (5.1%) | 57 (16.0%) |
| $50,000 to $74,999 | 120 (38.5%) | 4 (1.1%) |
| $75,000 to $99,999 | 5 (1.6%) | 71 (19.9%) |
| $100,000 to $149,999 | 51 (16.4%) | 110 (30.8%) |
| $150,000 or more | 16 (5.1%) | 87 (24.4%) |
| Total | 312 (100.0%) | 357 (100.0%) |
Property Value to Household Income Ratio in Lisbon
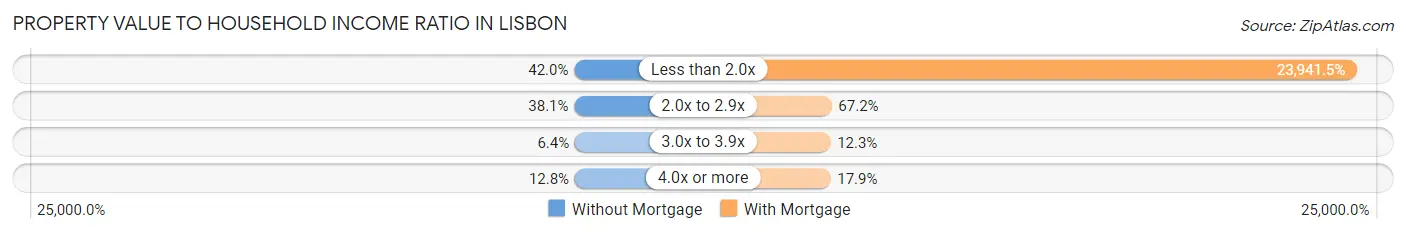
| Value-to-Income Ratio | Without Mortgage | With Mortgage |
| Less than 2.0x | 131 (42.0%) | 85,471 (23,941.5%) |
| 2.0x to 2.9x | 119 (38.1%) | 240 (67.2%) |
| 3.0x to 3.9x | 20 (6.4%) | 44 (12.3%) |
| 4.0x or more | 40 (12.8%) | 64 (17.9%) |
| Total | 312 (100.0%) | 357 (100.0%) |
Real Estate Taxes by Mortgage Status in Lisbon
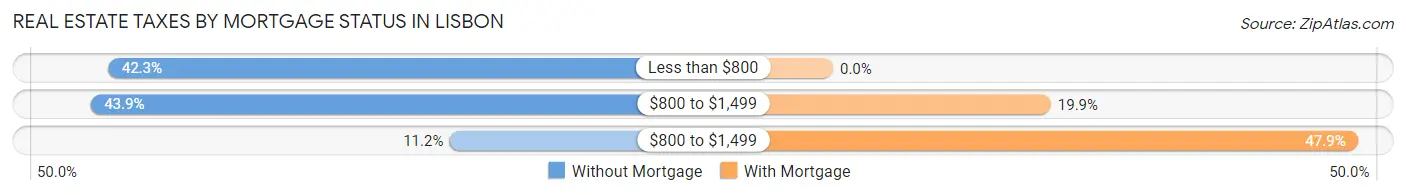
| Property Taxes | Without Mortgage | With Mortgage |
| Less than $800 | 132 (42.3%) | 0 (0.0%) |
| $800 to $1,499 | 137 (43.9%) | 71 (19.9%) |
| $800 to $1,499 | 35 (11.2%) | 171 (47.9%) |
| Total | 312 (100.0%) | 357 (100.0%) |
Health & Disability in Lisbon
Health Insurance Coverage by Age in Lisbon
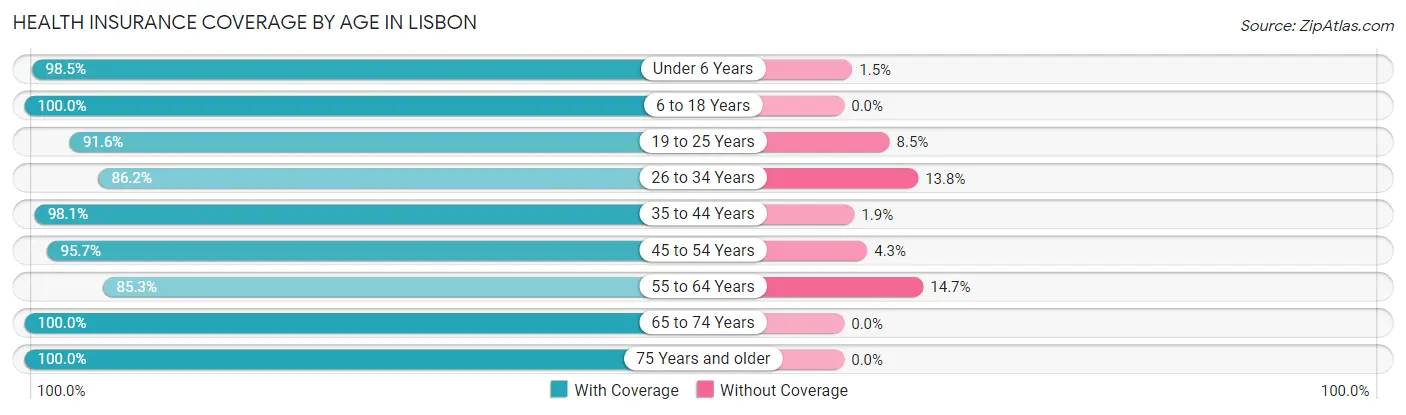
| Age Bracket | With Coverage | Without Coverage |
| Under 6 Years | 263 (98.5%) | 4 (1.5%) |
| 6 to 18 Years | 405 (100.0%) | 0 (0.0%) |
| 19 to 25 Years | 130 (91.5%) | 12 (8.5%) |
| 26 to 34 Years | 200 (86.2%) | 32 (13.8%) |
| 35 to 44 Years | 309 (98.1%) | 6 (1.9%) |
| 45 to 54 Years | 312 (95.7%) | 14 (4.3%) |
| 55 to 64 Years | 243 (85.3%) | 42 (14.7%) |
| 65 to 74 Years | 303 (100.0%) | 0 (0.0%) |
| 75 Years and older | 169 (100.0%) | 0 (0.0%) |
| Total | 2,334 (95.5%) | 110 (4.5%) |
Health Insurance Coverage by Citizenship Status in Lisbon
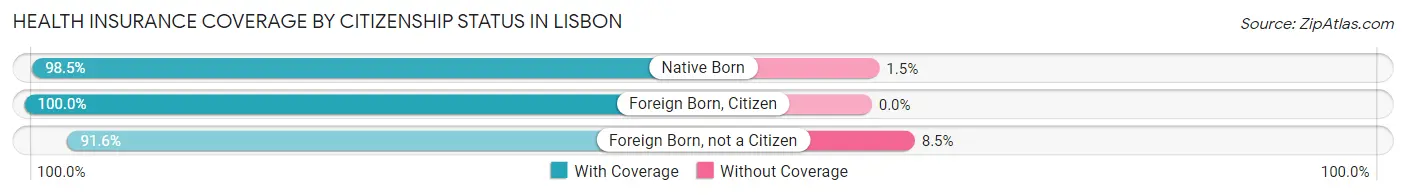
| Citizenship Status | With Coverage | Without Coverage |
| Native Born | 263 (98.5%) | 4 (1.5%) |
| Foreign Born, Citizen | 405 (100.0%) | 0 (0.0%) |
| Foreign Born, not a Citizen | 130 (91.5%) | 12 (8.5%) |
Health Insurance Coverage by Household Income in Lisbon
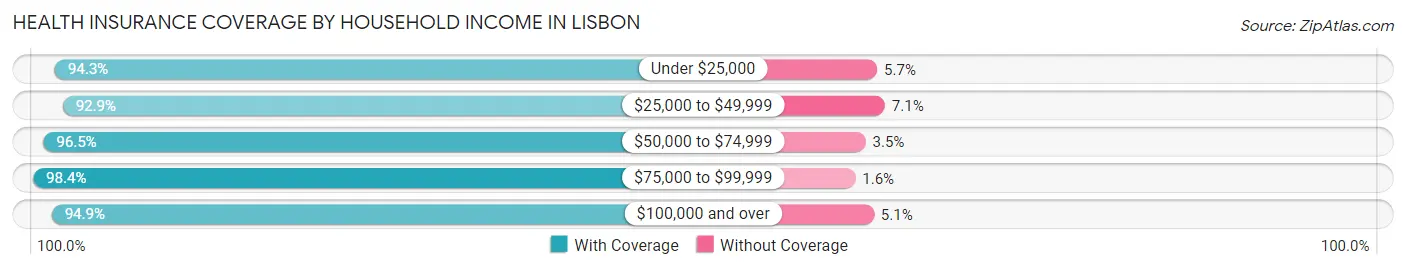
| Household Income | With Coverage | Without Coverage |
| Under $25,000 | 530 (94.3%) | 32 (5.7%) |
| $25,000 to $49,999 | 364 (92.9%) | 28 (7.1%) |
| $50,000 to $74,999 | 437 (96.5%) | 16 (3.5%) |
| $75,000 to $99,999 | 428 (98.4%) | 7 (1.6%) |
| $100,000 and over | 504 (94.9%) | 27 (5.1%) |
Public vs Private Health Insurance Coverage by Age in Lisbon
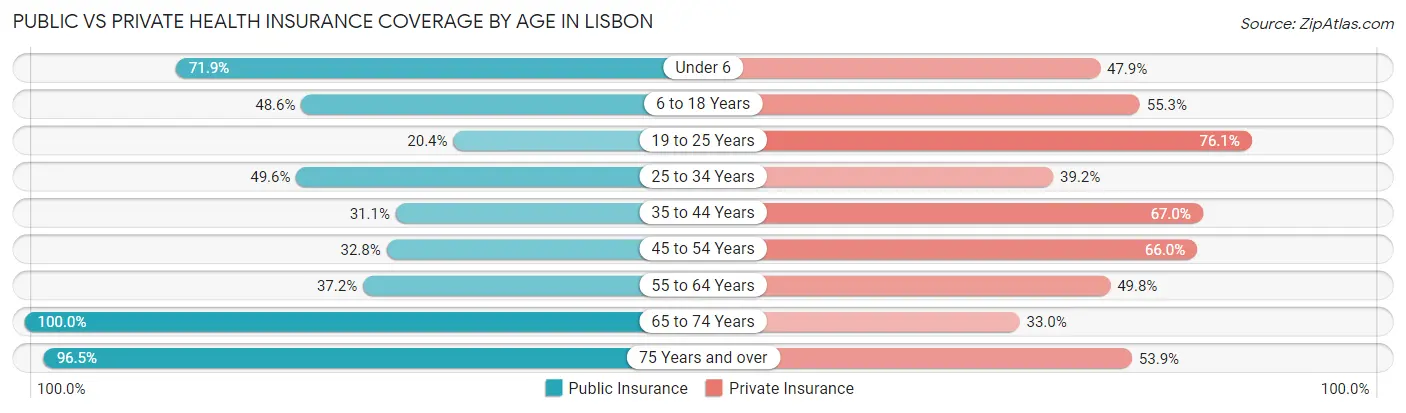
| Age Bracket | Public Insurance | Private Insurance |
| Under 6 | 192 (71.9%) | 128 (47.9%) |
| 6 to 18 Years | 197 (48.6%) | 224 (55.3%) |
| 19 to 25 Years | 29 (20.4%) | 108 (76.1%) |
| 25 to 34 Years | 115 (49.6%) | 91 (39.2%) |
| 35 to 44 Years | 98 (31.1%) | 211 (67.0%) |
| 45 to 54 Years | 107 (32.8%) | 215 (65.9%) |
| 55 to 64 Years | 106 (37.2%) | 142 (49.8%) |
| 65 to 74 Years | 303 (100.0%) | 100 (33.0%) |
| 75 Years and over | 163 (96.5%) | 91 (53.8%) |
| Total | 1,310 (53.6%) | 1,310 (53.6%) |
Disability Status by Sex by Age in Lisbon
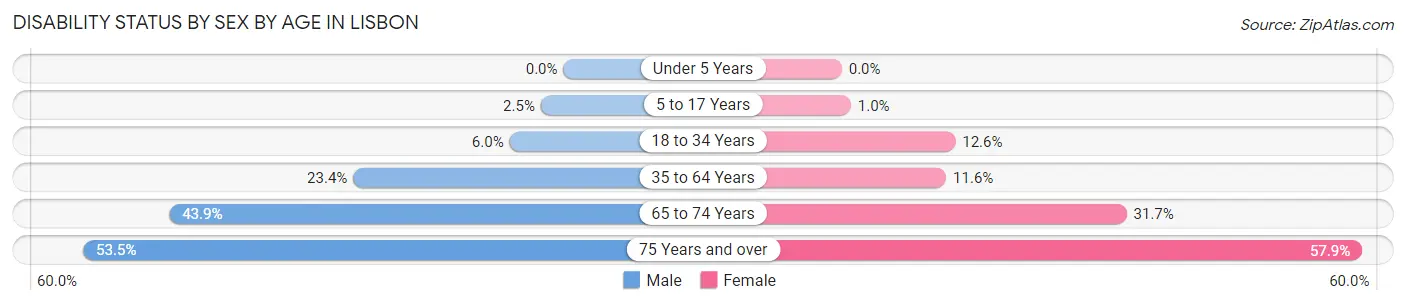
| Age Bracket | Male | Female |
| Under 5 Years | 0 (0.0%) | 0 (0.0%) |
| 5 to 17 Years | 4 (2.5%) | 3 (1.0%) |
| 18 to 34 Years | 12 (6.0%) | 23 (12.6%) |
| 35 to 64 Years | 114 (23.4%) | 51 (11.6%) |
| 65 to 74 Years | 79 (43.9%) | 39 (31.7%) |
| 75 Years and over | 23 (53.5%) | 73 (57.9%) |
Disability Class by Sex by Age in Lisbon
Disability Class: Hearing Difficulty
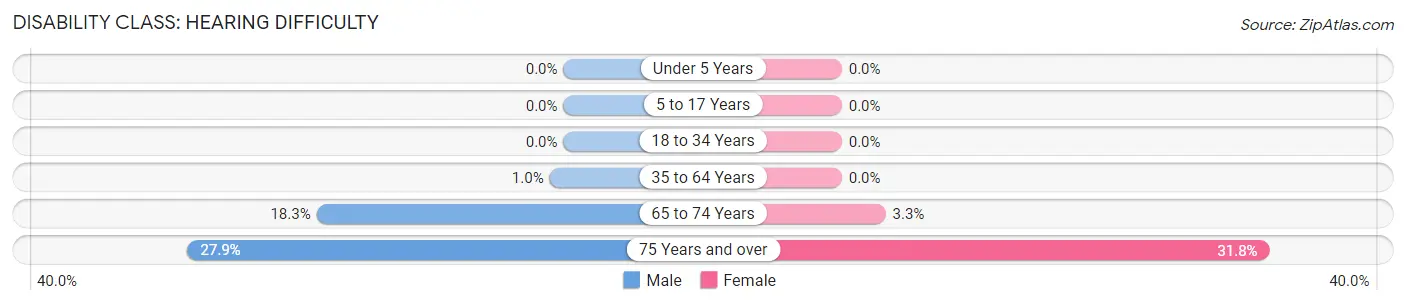
| Age Bracket | Male | Female |
| Under 5 Years | 0 (0.0%) | 0 (0.0%) |
| 5 to 17 Years | 0 (0.0%) | 0 (0.0%) |
| 18 to 34 Years | 0 (0.0%) | 0 (0.0%) |
| 35 to 64 Years | 5 (1.0%) | 0 (0.0%) |
| 65 to 74 Years | 33 (18.3%) | 4 (3.3%) |
| 75 Years and over | 12 (27.9%) | 40 (31.8%) |
Disability Class: Vision Difficulty
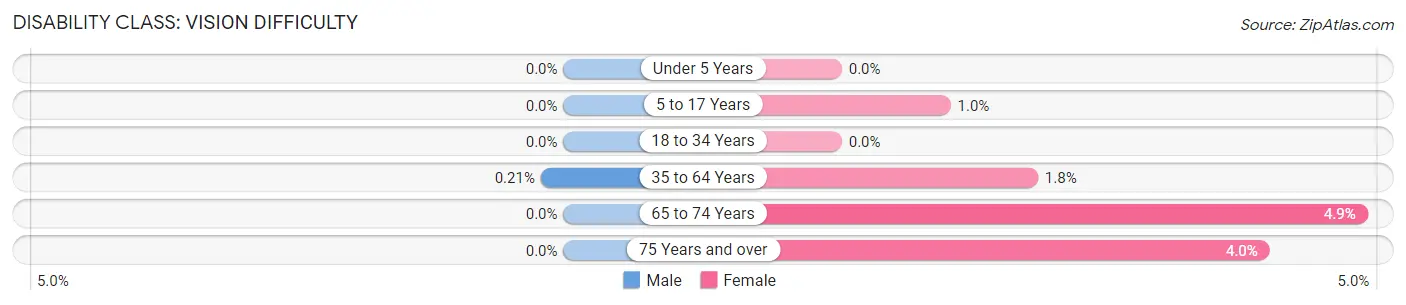
| Age Bracket | Male | Female |
| Under 5 Years | 0 (0.0%) | 0 (0.0%) |
| 5 to 17 Years | 0 (0.0%) | 3 (1.0%) |
| 18 to 34 Years | 0 (0.0%) | 0 (0.0%) |
| 35 to 64 Years | 1 (0.2%) | 8 (1.8%) |
| 65 to 74 Years | 0 (0.0%) | 6 (4.9%) |
| 75 Years and over | 0 (0.0%) | 5 (4.0%) |
Disability Class: Cognitive Difficulty
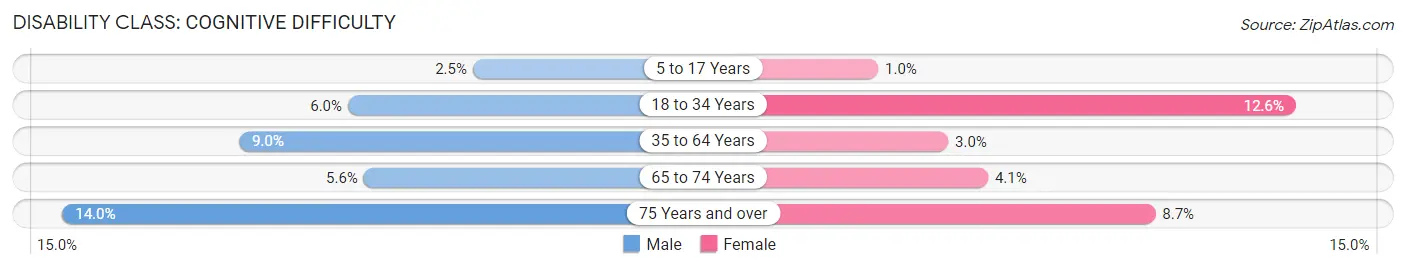
| Age Bracket | Male | Female |
| 5 to 17 Years | 4 (2.5%) | 3 (1.0%) |
| 18 to 34 Years | 12 (6.0%) | 23 (12.6%) |
| 35 to 64 Years | 44 (9.0%) | 13 (3.0%) |
| 65 to 74 Years | 10 (5.6%) | 5 (4.1%) |
| 75 Years and over | 6 (14.0%) | 11 (8.7%) |
Disability Class: Ambulatory Difficulty
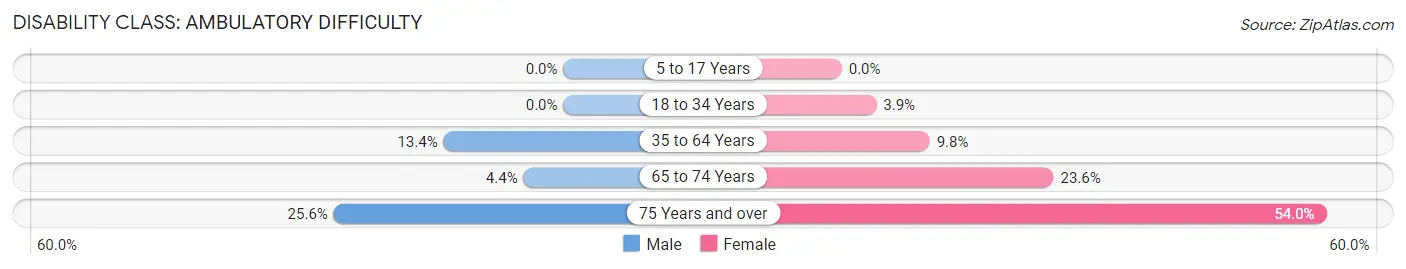
| Age Bracket | Male | Female |
| 5 to 17 Years | 0 (0.0%) | 0 (0.0%) |
| 18 to 34 Years | 0 (0.0%) | 7 (3.8%) |
| 35 to 64 Years | 65 (13.4%) | 43 (9.8%) |
| 65 to 74 Years | 8 (4.4%) | 29 (23.6%) |
| 75 Years and over | 11 (25.6%) | 68 (54.0%) |
Disability Class: Self-Care Difficulty
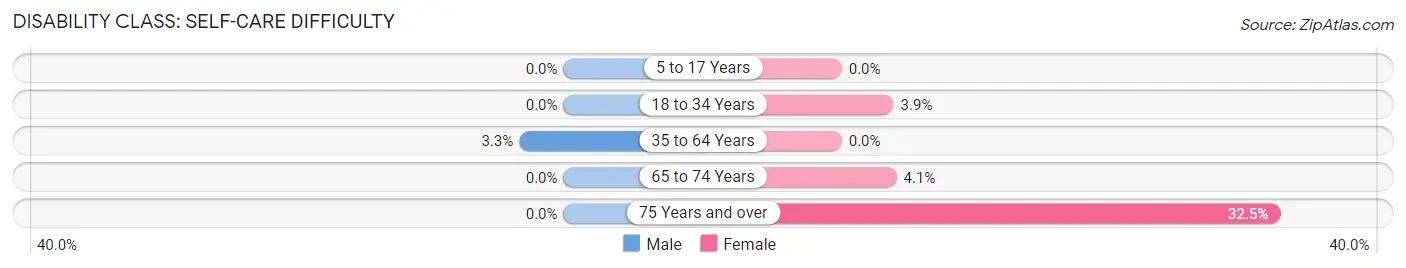
| Age Bracket | Male | Female |
| 5 to 17 Years | 0 (0.0%) | 0 (0.0%) |
| 18 to 34 Years | 0 (0.0%) | 7 (3.8%) |
| 35 to 64 Years | 16 (3.3%) | 0 (0.0%) |
| 65 to 74 Years | 0 (0.0%) | 5 (4.1%) |
| 75 Years and over | 0 (0.0%) | 41 (32.5%) |
Technology Access in Lisbon
Computing Device Access in Lisbon
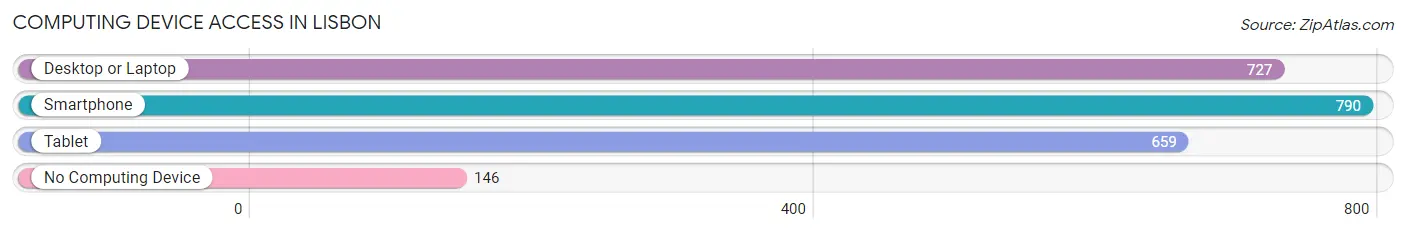
| Device Type | # Households | % Households |
| Desktop or Laptop | 727 | 68.9% |
| Smartphone | 790 | 74.9% |
| Tablet | 659 | 62.5% |
| No Computing Device | 146 | 13.8% |
| Total | 1,055 | 100.0% |
Internet Access in Lisbon
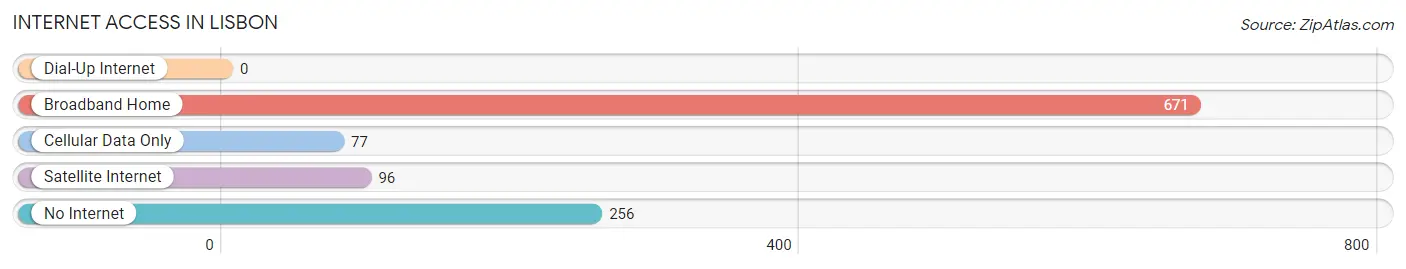
| Internet Type | # Households | % Households |
| Dial-Up Internet | 0 | 0.0% |
| Broadband Home | 671 | 63.6% |
| Cellular Data Only | 77 | 7.3% |
| Satellite Internet | 96 | 9.1% |
| No Internet | 256 | 24.3% |
| Total | 1,055 | 100.0% |
Lisbon Summary
Lisbon, Ohio is a small village located in Columbiana County in the eastern part of the state. It is situated on the banks of the Little Beaver Creek, a tributary of the Beaver River. The village is located approximately 30 miles south of Youngstown and 60 miles northwest of Pittsburgh. The population of Lisbon was 2,621 at the 2010 census.
History
Lisbon was founded in 1802 by a group of settlers from Connecticut. The village was named after Lisbon, Portugal, and was incorporated in 1831. The first settlers were primarily farmers, and the village was a small agricultural center. In the mid-1800s, the village began to grow and develop as a commercial center. The first bank was established in 1845, and the first newspaper was published in 1848.
The village was an important stop on the Underground Railroad, and many escaped slaves passed through Lisbon on their way to freedom. In the late 1800s, the village was home to several factories, including a woolen mill, a sawmill, and a gristmill.
Geography
Lisbon is located at 40°45'N, 80°45'W (40.75, -80.75). The village is situated on the banks of the Little Beaver Creek, a tributary of the Beaver River. The village is located approximately 30 miles south of Youngstown and 60 miles northwest of Pittsburgh.
The village has a total area of 1.2 square miles, all of which is land. The village is located in the Appalachian Plateau region of Ohio. The terrain is mostly flat, with some rolling hills. The climate is humid continental, with hot summers and cold winters.
Economy
Lisbon’s economy is largely based on agriculture and manufacturing. The village is home to several factories, including a woolen mill, a sawmill, and a gristmill. The village also has several retail stores, restaurants, and other businesses.
The village is also home to several educational institutions, including the Columbiana County Career and Technical Center, the Columbiana County Educational Service Center, and the Lisbon Exempted Village School District.
Demographics
As of the 2010 census, the population of Lisbon was 2,621. The racial makeup of the village was 97.2% White, 0.8% African American, 0.2% Native American, 0.2% Asian, 0.2% from other races, and 1.2% from two or more races. Hispanic or Latino of any race were 0.8% of the population.
The median income for a household in the village was $37,917, and the median income for a family was $45,000. The per capita income for the village was $17,917. About 11.2% of families and 14.2% of the population were below the poverty line, including 19.2% of those under age 18 and 8.2% of those age 65 or over.
Common Questions
What is the Total Population of Lisbon?
Total Population of Lisbon is 2,582.
What is the Total Male Population of Lisbon?
Total Male Population of Lisbon is 1,222.
What is the Total Female Population of Lisbon?
Total Female Population of Lisbon is 1,360.
What is the Ratio of Males per 100 Females in Lisbon?
There are 89.85 Males per 100 Females in Lisbon.
What is the Ratio of Females per 100 Males in Lisbon?
There are 111.29 Females per 100 Males in Lisbon.
What is the Median Population Age in Lisbon?
Median Population Age in Lisbon is 42.1 Years.
What is the Average Family Size in Lisbon
Average Family Size in Lisbon is 3.1 People.
What is the Average Household Size in Lisbon
Average Household Size in Lisbon is 2.2 People.
What is Per Capita Income in Lisbon?
Per Capita income in Lisbon is $25,613.
What is the Median Family Income in Lisbon?
Median Family Income in Lisbon is $71,763.
What is the Median Household income in Lisbon?
Median Household Income in Lisbon is $52,457.
What is Income or Wage Gap in Lisbon?
Income or Wage Gap in Lisbon is 23.4%.
Women in Lisbon earn 76.6 cents for every dollar earned by a man.
What is Inequality or Gini Index in Lisbon?
Inequality or Gini Index in Lisbon is 0.43.
How Large is the Labor Force in Lisbon?
There are 987 People in the Labor Forcein in Lisbon.
What is the Percentage of People in the Labor Force in Lisbon?
49.0% of People are in the Labor Force in Lisbon.
What is the Unemployment Rate in Lisbon?
Unemployment Rate in Lisbon is 2.2%.