Latty, OH
Latty Map
Latty Overview
145
TOTAL POPULATION
72
MALE POPULATION
73
FEMALE POPULATION
98.63
MALES / 100 FEMALES
101.39
FEMALES / 100 MALES
38.5
MEDIAN AGE
2.9
AVG FAMILY SIZE
3.0
AVG HOUSEHOLD SIZE
$32,468
PER CAPITA INCOME
$78,929
AVG FAMILY INCOME
$78,393
AVG HOUSEHOLD INCOME
58.2%
WAGE / INCOME GAP [ % ]
41.8¢/ $1
WAGE / INCOME GAP [ $ ]
0.32
INEQUALITY / GINI INDEX
71
LABOR FORCE [ PEOPLE ]
59.7%
PERCENT IN LABOR FORCE
Latty Zip Codes
Latty Area Codes
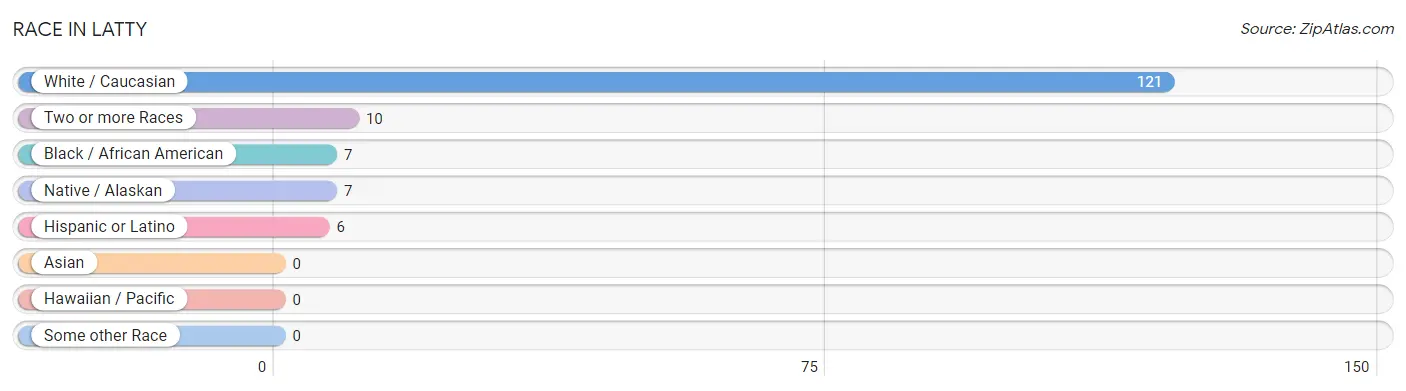
Race in Latty
The most populous races in Latty are White / Caucasian (121 | 83.5%), Two or more Races (10 | 6.9%), and Black / African American (7 | 4.8%).
| Race | # Population | % Population |
| Asian | 0 | 0.0% |
| Black / African American | 7 | 4.8% |
| Hawaiian / Pacific | 0 | 0.0% |
| Hispanic or Latino | 6 | 4.1% |
| Native / Alaskan | 7 | 4.8% |
| White / Caucasian | 121 | 83.5% |
| Two or more Races | 10 | 6.9% |
| Some other Race | 0 | 0.0% |
| Total | 145 | 100.0% |
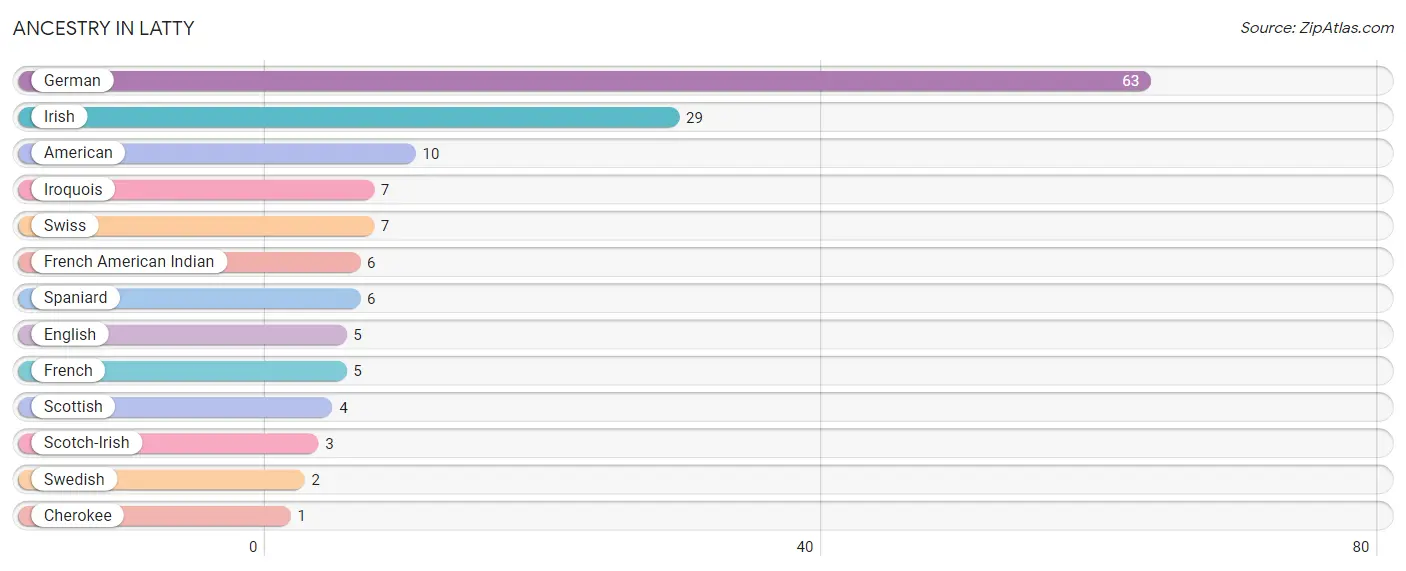
Ancestry in Latty
The most populous ancestries reported in Latty are German (63 | 43.4%), Irish (29 | 20.0%), American (10 | 6.9%), Iroquois (7 | 4.8%), and Swiss (7 | 4.8%), together accounting for 80.0% of all Latty residents.
| Ancestry | # Population | % Population |
| American | 10 | 6.9% |
| Cherokee | 1 | 0.7% |
| English | 5 | 3.5% |
| French | 5 | 3.5% |
| French American Indian | 6 | 4.1% |
| German | 63 | 43.4% |
| Irish | 29 | 20.0% |
| Iroquois | 7 | 4.8% |
| Scotch-Irish | 3 | 2.1% |
| Scottish | 4 | 2.8% |
| Spaniard | 6 | 4.1% |
| Swedish | 2 | 1.4% |
| Swiss | 7 | 4.8% | View All 13 Rows |
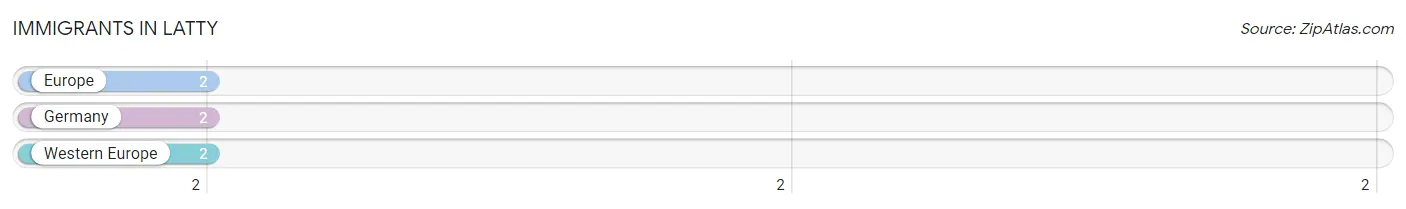
Immigrants in Latty
The most numerous immigrant groups reported in Latty came from Europe (2 | 1.4%), Germany (2 | 1.4%), and Western Europe (2 | 1.4%), together accounting for 4.1% of all Latty residents.
| Immigration Origin | # Population | % Population |
| Europe | 2 | 1.4% |
| Germany | 2 | 1.4% |
| Western Europe | 2 | 1.4% | View All 3 Rows |
Sex and Age in Latty
Sex and Age in Latty
The most populous age groups in Latty are 35 to 39 Years (13 | 18.1%) for men and 35 to 39 Years (12 | 16.4%) for women.
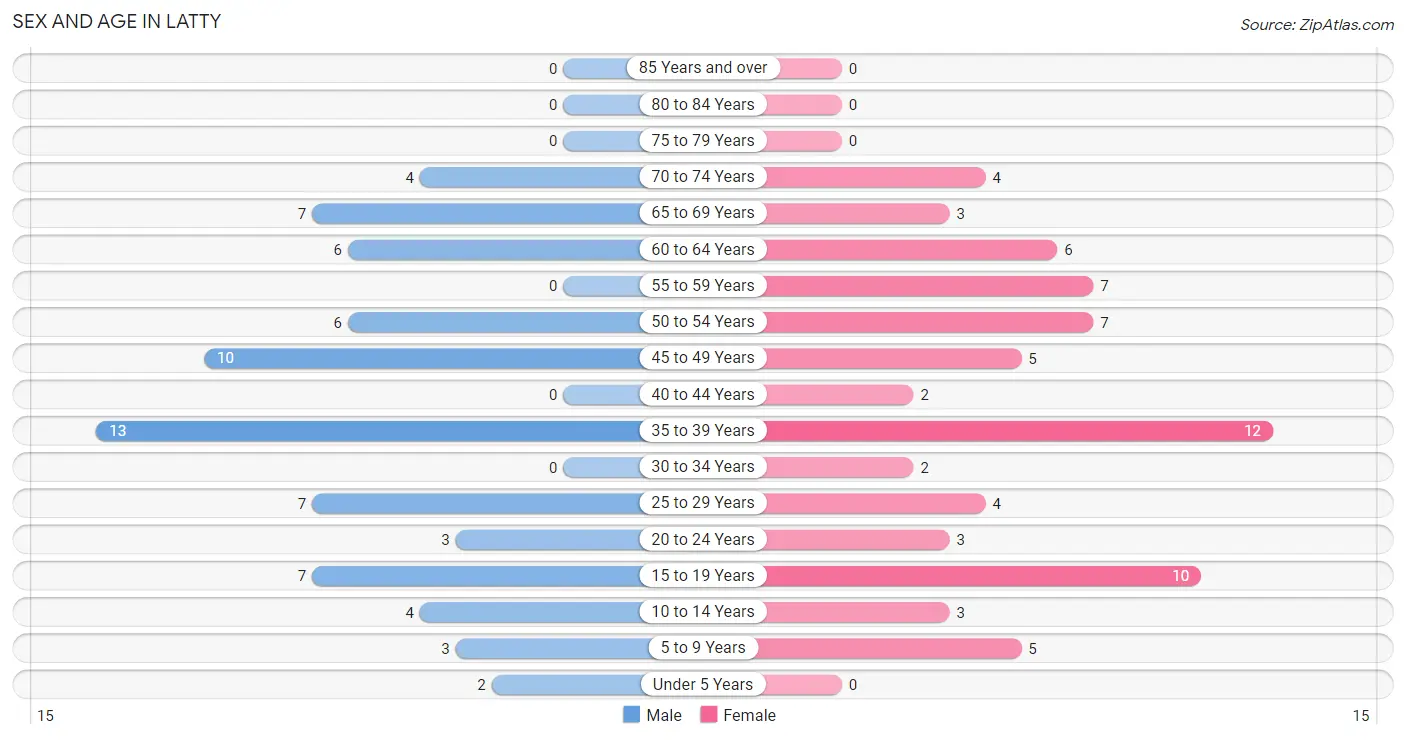
| Age Bracket | Male | Female |
| Under 5 Years | 2 (2.8%) | 0 (0.0%) |
| 5 to 9 Years | 3 (4.2%) | 5 (6.9%) |
| 10 to 14 Years | 4 (5.6%) | 3 (4.1%) |
| 15 to 19 Years | 7 (9.7%) | 10 (13.7%) |
| 20 to 24 Years | 3 (4.2%) | 3 (4.1%) |
| 25 to 29 Years | 7 (9.7%) | 4 (5.5%) |
| 30 to 34 Years | 0 (0.0%) | 2 (2.7%) |
| 35 to 39 Years | 13 (18.1%) | 12 (16.4%) |
| 40 to 44 Years | 0 (0.0%) | 2 (2.7%) |
| 45 to 49 Years | 10 (13.9%) | 5 (6.9%) |
| 50 to 54 Years | 6 (8.3%) | 7 (9.6%) |
| 55 to 59 Years | 0 (0.0%) | 7 (9.6%) |
| 60 to 64 Years | 6 (8.3%) | 6 (8.2%) |
| 65 to 69 Years | 7 (9.7%) | 3 (4.1%) |
| 70 to 74 Years | 4 (5.6%) | 4 (5.5%) |
| 75 to 79 Years | 0 (0.0%) | 0 (0.0%) |
| 80 to 84 Years | 0 (0.0%) | 0 (0.0%) |
| 85 Years and over | 0 (0.0%) | 0 (0.0%) |
| Total | 72 (100.0%) | 73 (100.0%) |
Families and Households in Latty
Median Family Size in Latty
The median family size in Latty is 2.88 persons per family, with single female/mother families (11 | 26.2%) accounting for the largest median family size of 3.36 persons per family. On the other hand, single male/father families (5 | 11.9%) represent the smallest median family size with 1.40 persons per family.
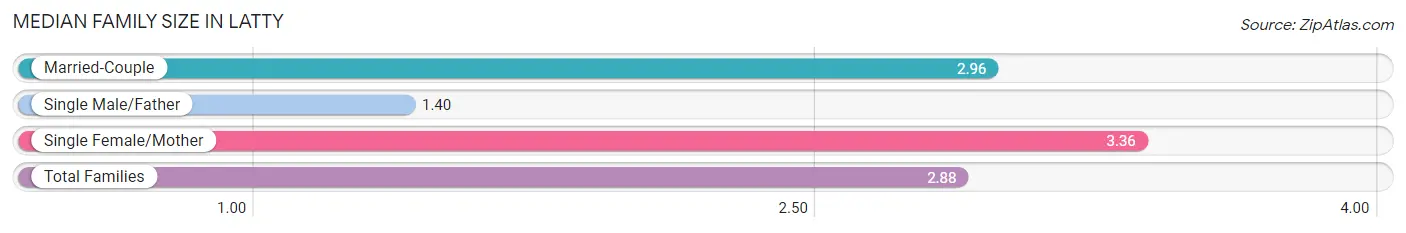
| Family Type | # Families | Family Size |
| Married-Couple | 26 (61.9%) | 2.96 |
| Single Male/Father | 5 (11.9%) | 1.40 |
| Single Female/Mother | 11 (26.2%) | 3.36 |
| Total Families | 42 (100.0%) | 2.88 |
Median Household Size in Latty
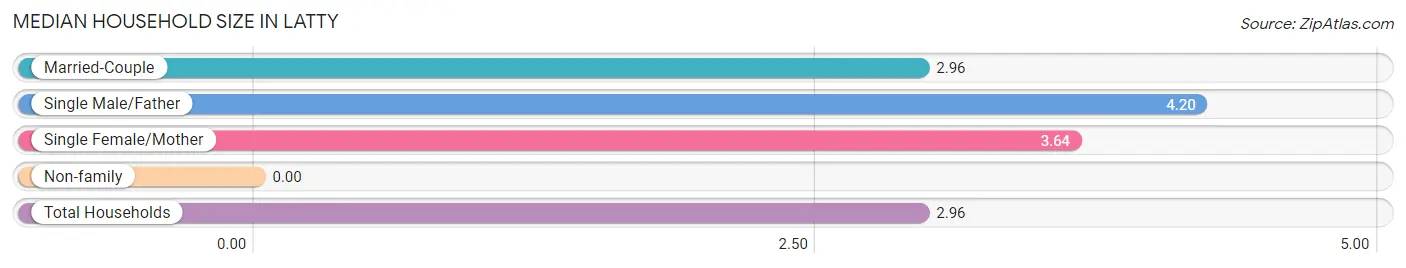
| Household Type | # Households | Household Size |
| Married-Couple | 26 (53.1%) | 2.96 |
| Single Male/Father | 5 (10.2%) | 4.20 |
| Single Female/Mother | 11 (22.5%) | 3.64 |
| Non-family | 7 (14.3%) | - |
| Total Households | 49 (100.0%) | 2.96 |
Household Size by Marriage Status in Latty
Out of a total of 49 households in Latty, 42 (85.7%) are family households, while 7 (14.3%) are nonfamily households. The most numerous type of family households are 2-person households, comprising 16, and the most common type of nonfamily households are 1-person households, comprising 7.
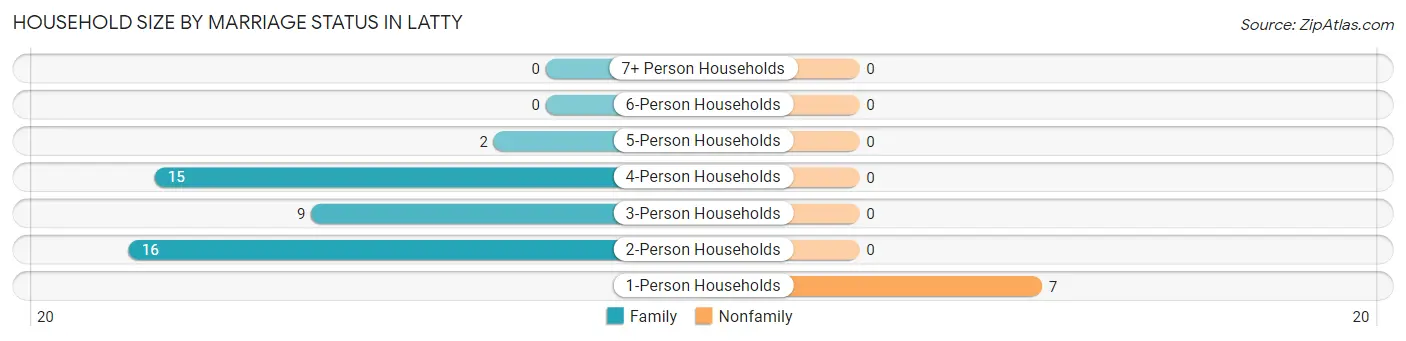
| Household Size | Family Households | Nonfamily Households |
| 1-Person Households | - | 7 (14.3%) |
| 2-Person Households | 16 (32.7%) | 0 (0.0%) |
| 3-Person Households | 9 (18.4%) | 0 (0.0%) |
| 4-Person Households | 15 (30.6%) | 0 (0.0%) |
| 5-Person Households | 2 (4.1%) | 0 (0.0%) |
| 6-Person Households | 0 (0.0%) | 0 (0.0%) |
| 7+ Person Households | 0 (0.0%) | 0 (0.0%) |
| Total | 42 (85.7%) | 7 (14.3%) |
Female Fertility in Latty
Fertility by Age in Latty
| Age Bracket | Women with Births | Births / 1,000 Women |
| 15 to 19 years | 0 (0.0%) | 0.0 |
| 20 to 34 years | 0 (0.0%) | 0.0 |
| 35 to 50 years | 0 (0.0%) | 0.0 |
| Total | 0 (0.0%) | 0.0 |
Fertility by Age by Marriage Status in Latty
| Age Bracket | Married | Unmarried |
| 15 to 19 years | 0 (0.0%) | 0 (0.0%) |
| 20 to 34 years | 0 (0.0%) | 0 (0.0%) |
| 35 to 50 years | 0 (0.0%) | 0 (0.0%) |
| Total | 0 (0.0%) | 0 (0.0%) |
Fertility by Education in Latty
| Educational Attainment | Women with Births | Births / 1,000 Women |
| Less than High School | 0 (0.0%) | 0.0 |
| High School Diploma | 0 (0.0%) | 0.0 |
| College or Associate's Degree | 0 (0.0%) | 0.0 |
| Bachelor's Degree | 0 (0.0%) | 0.0 |
| Graduate Degree | 0 (0.0%) | 0.0 |
| Total | 0 (0.0%) | 0.0 |
Fertility by Education by Marriage Status in Latty
| Educational Attainment | Married | Unmarried |
| Less than High School | 0 (0.0%) | 0 (0.0%) |
| High School Diploma | 0 (0.0%) | 0 (0.0%) |
| College or Associate's Degree | 0 (0.0%) | 0 (0.0%) |
| Bachelor's Degree | 0 (0.0%) | 0 (0.0%) |
| Graduate Degree | 0 (0.0%) | 0 (0.0%) |
| Total | 0 (0.0%) | 0 (0.0%) |
Income in Latty
Income Overview in Latty
Per Capita Income in Latty is $32,468, while median incomes of families and households are $78,929 and $78,393 respectively.
| Characteristic | Number | Measure |
| Per Capita Income | 145 | $32,468 |
| Median Family Income | 42 | $78,929 |
| Mean Family Income | 42 | $86,067 |
| Median Household Income | 49 | $78,393 |
| Mean Household Income | 49 | $84,582 |
| Income Deficit | 42 | $0 |
| Wage / Income Gap (%) | 145 | 58.19% |
| Wage / Income Gap ($) | 145 | 41.81¢ per $1 |
| Gini / Inequality Index | 145 | 0.32 |
Earnings by Sex in Latty
Average Earnings in Latty are $34,688, $67,917 for men and $28,393 for women, a difference of 58.2%.
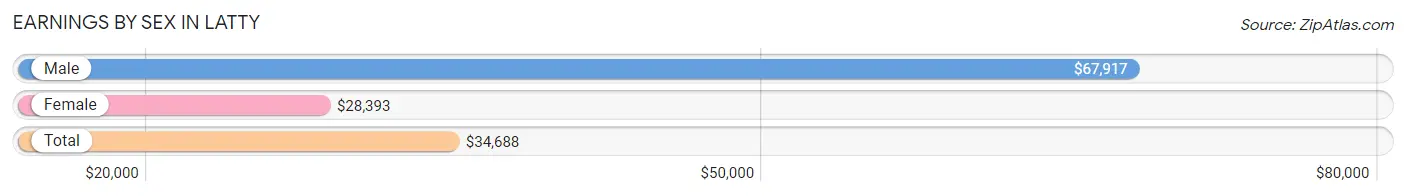
| Sex | Number | Average Earnings |
| Male | 38 (52.0%) | $67,917 |
| Female | 35 (47.9%) | $28,393 |
| Total | 73 (100.0%) | $34,688 |
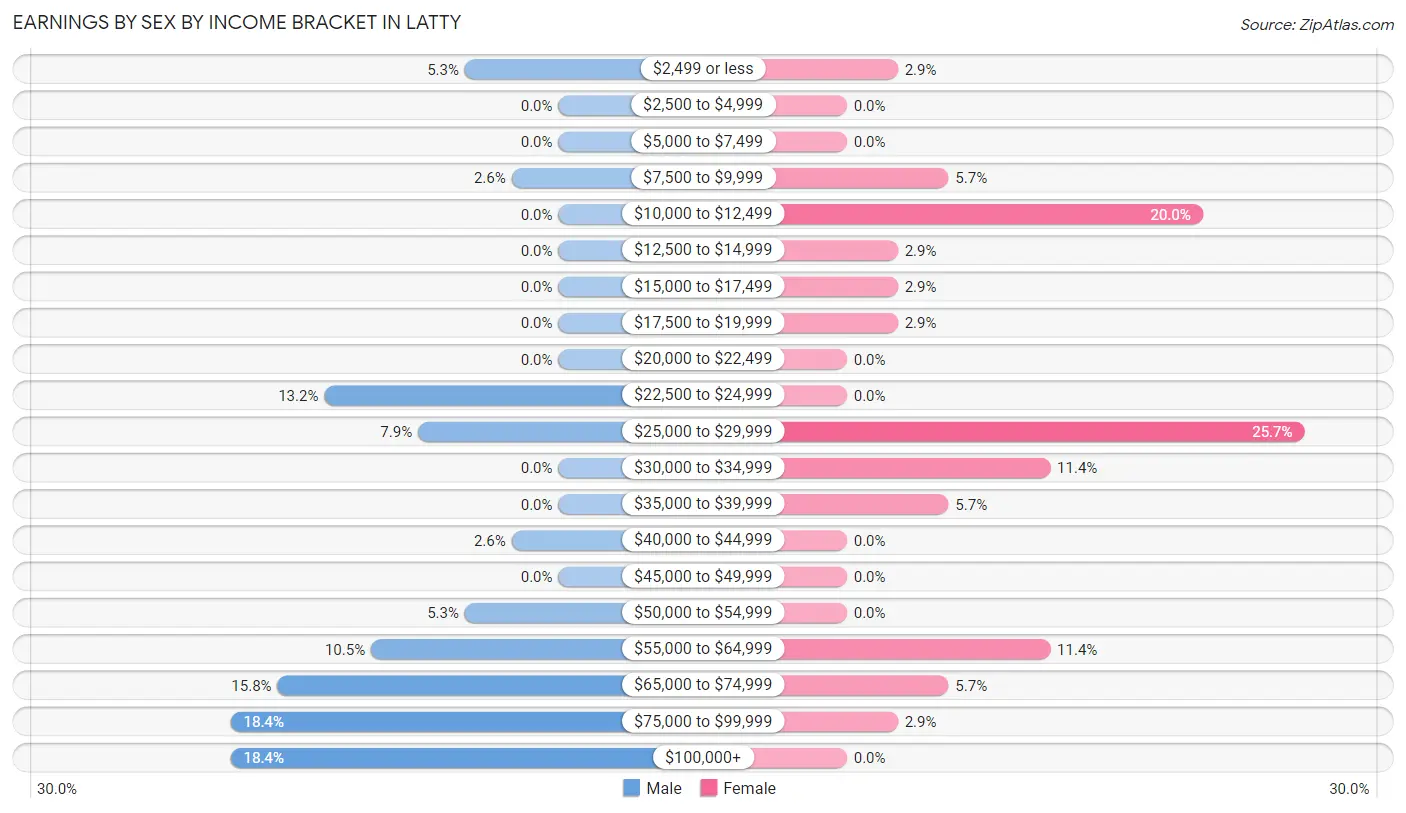
Earnings by Sex by Income Bracket in Latty
The most common earnings brackets in Latty are $75,000 to $99,999 for men (7 | 18.4%) and $25,000 to $29,999 for women (9 | 25.7%).
| Income | Male | Female |
| $2,499 or less | 2 (5.3%) | 1 (2.9%) |
| $2,500 to $4,999 | 0 (0.0%) | 0 (0.0%) |
| $5,000 to $7,499 | 0 (0.0%) | 0 (0.0%) |
| $7,500 to $9,999 | 1 (2.6%) | 2 (5.7%) |
| $10,000 to $12,499 | 0 (0.0%) | 7 (20.0%) |
| $12,500 to $14,999 | 0 (0.0%) | 1 (2.9%) |
| $15,000 to $17,499 | 0 (0.0%) | 1 (2.9%) |
| $17,500 to $19,999 | 0 (0.0%) | 1 (2.9%) |
| $20,000 to $22,499 | 0 (0.0%) | 0 (0.0%) |
| $22,500 to $24,999 | 5 (13.2%) | 0 (0.0%) |
| $25,000 to $29,999 | 3 (7.9%) | 9 (25.7%) |
| $30,000 to $34,999 | 0 (0.0%) | 4 (11.4%) |
| $35,000 to $39,999 | 0 (0.0%) | 2 (5.7%) |
| $40,000 to $44,999 | 1 (2.6%) | 0 (0.0%) |
| $45,000 to $49,999 | 0 (0.0%) | 0 (0.0%) |
| $50,000 to $54,999 | 2 (5.3%) | 0 (0.0%) |
| $55,000 to $64,999 | 4 (10.5%) | 4 (11.4%) |
| $65,000 to $74,999 | 6 (15.8%) | 2 (5.7%) |
| $75,000 to $99,999 | 7 (18.4%) | 1 (2.9%) |
| $100,000+ | 7 (18.4%) | 0 (0.0%) |
| Total | 38 (100.0%) | 35 (100.0%) |
Earnings by Sex by Educational Attainment in Latty
Average earnings in Latty are $68,542 for men and $29,107 for women, a difference of 57.5%. Men with an educational attainment of high school diploma enjoy the highest average annual earnings of $83,333, while those with high school diploma education earn the least with $83,333. Women with an educational attainment of high school diploma earn the most with the average annual earnings of $28,438, while those with high school diploma education have the smallest earnings of $28,438.
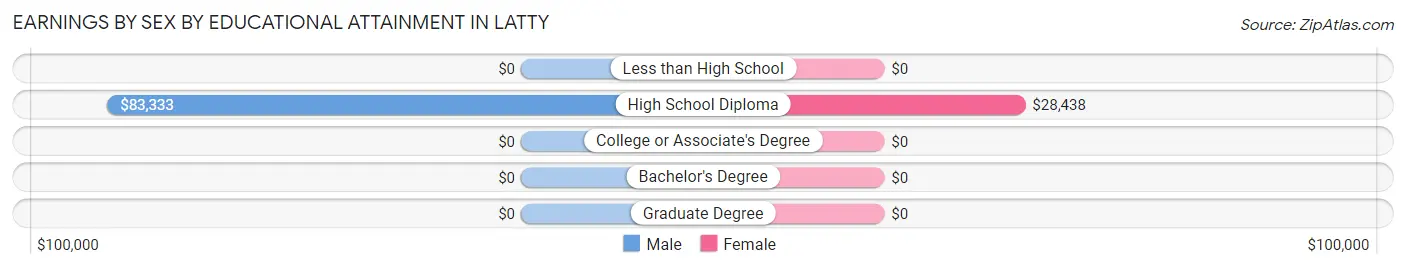
| Educational Attainment | Male Income | Female Income |
| Less than High School | - | - |
| High School Diploma | $83,333 | $28,438 |
| College or Associate's Degree | - | - |
| Bachelor's Degree | - | - |
| Graduate Degree | - | - |
| Total | $68,542 | $29,107 |
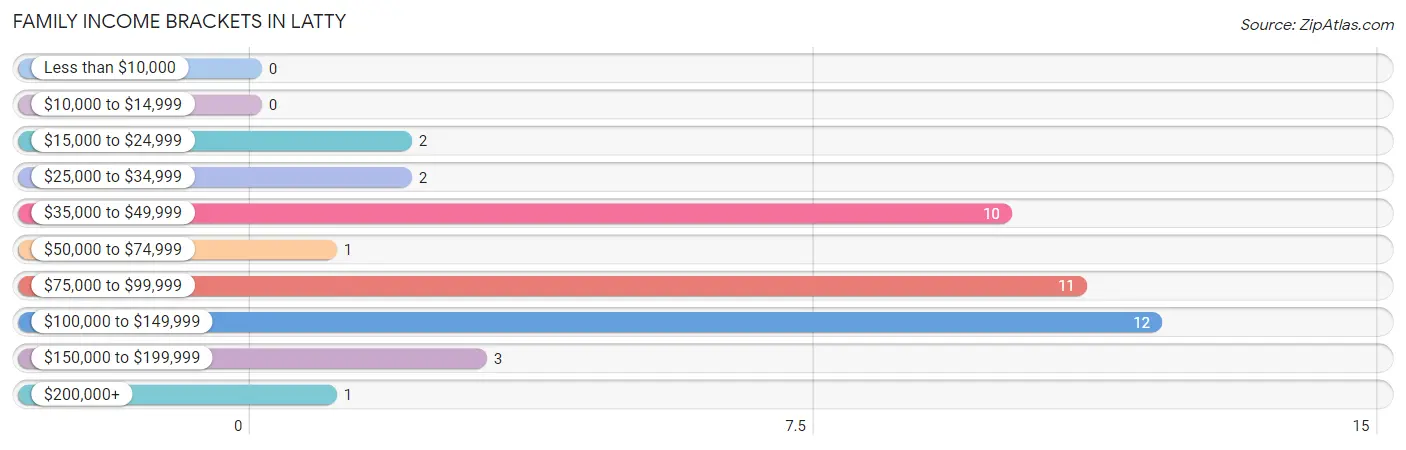
Family Income in Latty
Family Income Brackets in Latty
According to the Latty family income data, there are 12 families falling into the $100,000 to $149,999 income range, which is the most common income bracket and makes up 28.6% of all families.
| Income Bracket | # Families | % Families |
| Less than $10,000 | 0 | 0.0% |
| $10,000 to $14,999 | 0 | 0.0% |
| $15,000 to $24,999 | 2 | 4.8% |
| $25,000 to $34,999 | 2 | 4.8% |
| $35,000 to $49,999 | 10 | 23.8% |
| $50,000 to $74,999 | 1 | 2.4% |
| $75,000 to $99,999 | 11 | 26.2% |
| $100,000 to $149,999 | 12 | 28.6% |
| $150,000 to $199,999 | 3 | 7.1% |
| $200,000+ | 1 | 2.4% |
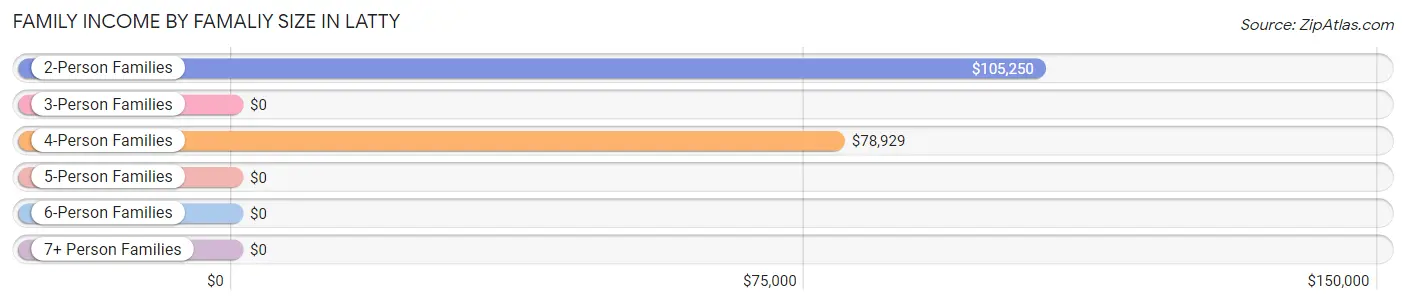
Family Income by Famaliy Size in Latty
2-person families (21 | 50.0%) account for the highest median family income in Latty with $105,250 per family, while 2-person families (21 | 50.0%) have the highest median income of $52,625 per family member.
| Income Bracket | # Families | Median Income |
| 2-Person Families | 21 (50.0%) | $105,250 |
| 3-Person Families | 9 (21.4%) | $0 |
| 4-Person Families | 12 (28.6%) | $78,929 |
| 5-Person Families | 0 (0.0%) | $0 |
| 6-Person Families | 0 (0.0%) | $0 |
| 7+ Person Families | 0 (0.0%) | $0 |
| Total | 42 (100.0%) | $78,929 |
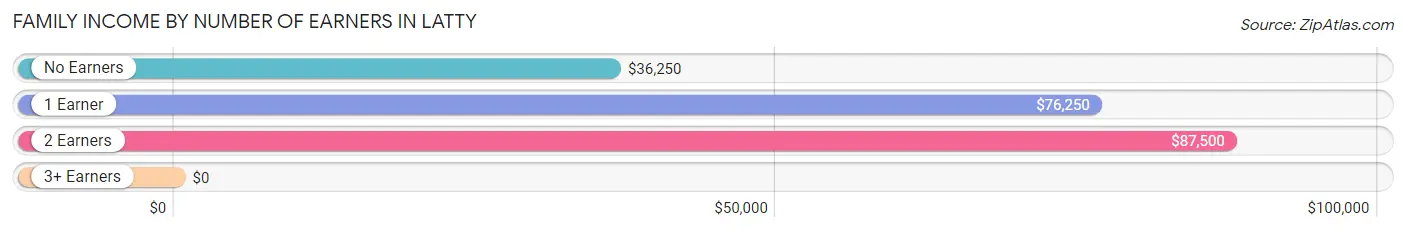
Family Income by Number of Earners in Latty
| Number of Earners | # Families | Median Income |
| No Earners | 7 (16.7%) | $36,250 |
| 1 Earner | 18 (42.9%) | $76,250 |
| 2 Earners | 14 (33.3%) | $87,500 |
| 3+ Earners | 3 (7.1%) | $0 |
| Total | 42 (100.0%) | $78,929 |
Household Income in Latty
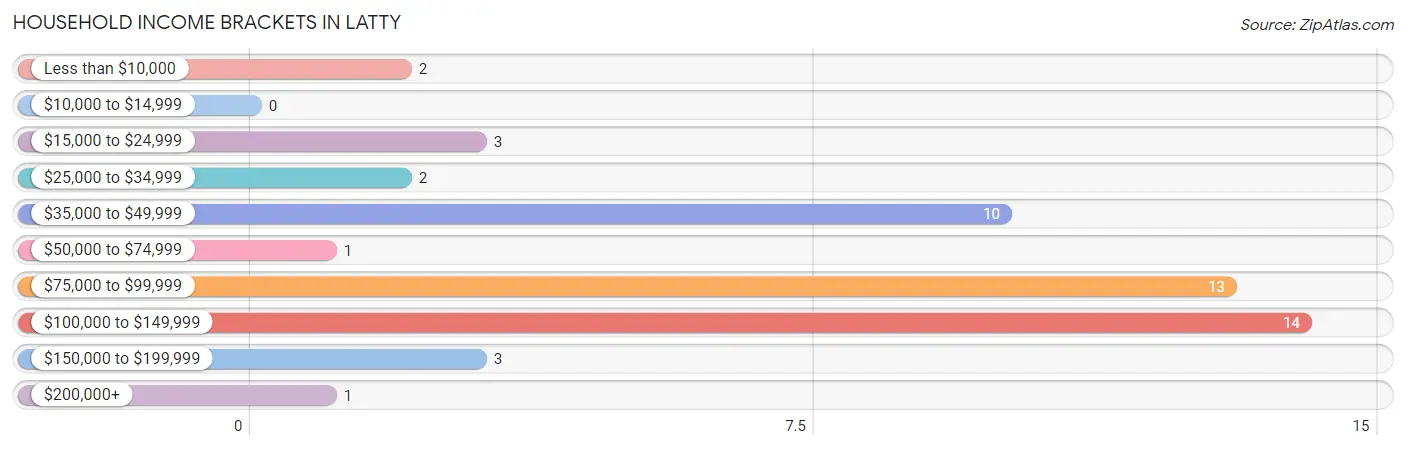
Household Income Brackets in Latty
With 14 households falling in the category, the $100,000 to $149,999 income range is the most frequent in Latty, accounting for 28.6% of all households.
| Income Bracket | # Households | % Households |
| Less than $10,000 | 2 | 4.1% |
| $10,000 to $14,999 | 0 | 0.0% |
| $15,000 to $24,999 | 3 | 6.1% |
| $25,000 to $34,999 | 2 | 4.1% |
| $35,000 to $49,999 | 10 | 20.4% |
| $50,000 to $74,999 | 1 | 2.0% |
| $75,000 to $99,999 | 13 | 26.5% |
| $100,000 to $149,999 | 14 | 28.6% |
| $150,000 to $199,999 | 3 | 6.1% |
| $200,000+ | 1 | 2.0% |
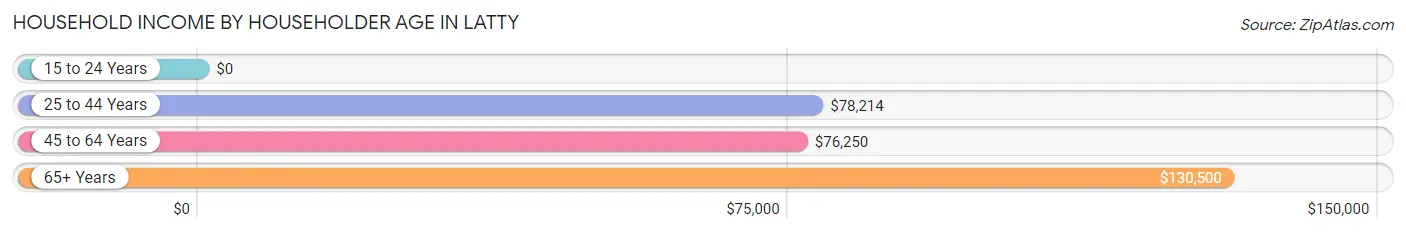
Household Income by Householder Age in Latty
The median household income in Latty is $78,393, with the highest median household income of $130,500 found in the 65+ years age bracket for the primary householder. A total of 12 households (24.5%) fall into this category. Meanwhile, the 15 to 24 years age bracket for the primary householder has the lowest median household income of $0, with 1 households (2.0%) in this group.
| Income Bracket | # Households | Median Income |
| 15 to 24 Years | 1 (2.0%) | $0 |
| 25 to 44 Years | 18 (36.7%) | $78,214 |
| 45 to 64 Years | 18 (36.7%) | $76,250 |
| 65+ Years | 12 (24.5%) | $130,500 |
| Total | 49 (100.0%) | $78,393 |
Poverty in Latty
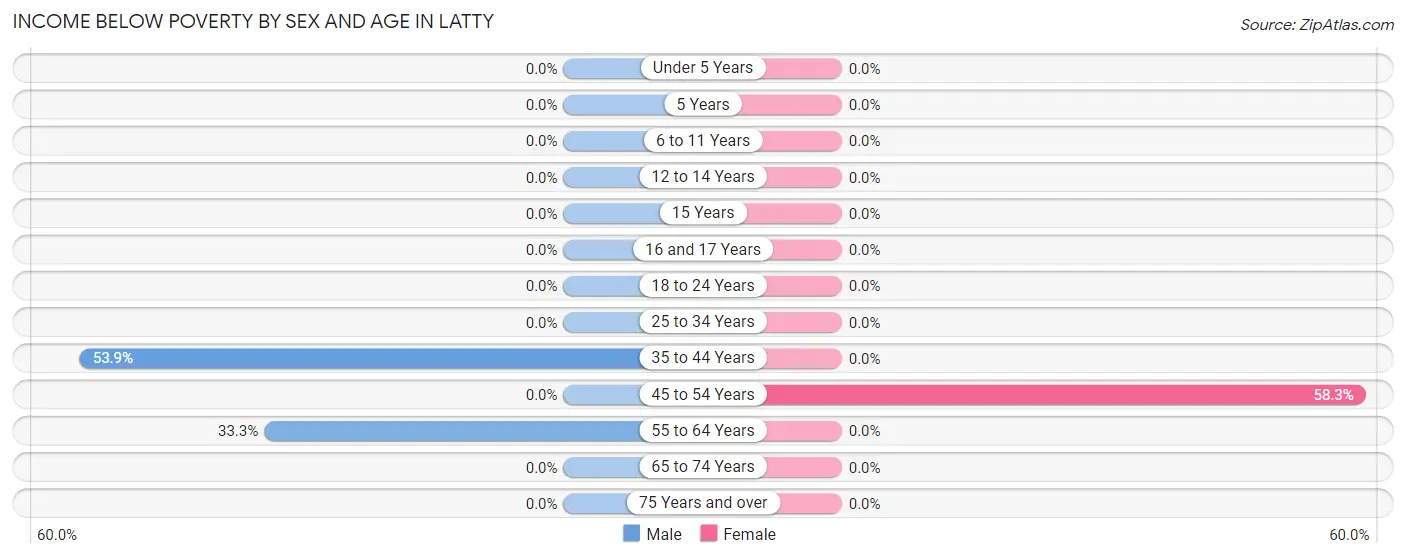
Income Below Poverty by Sex and Age in Latty
With 12.5% poverty level for males and 9.6% for females among the residents of Latty, 35 to 44 year old males and 45 to 54 year old females are the most vulnerable to poverty, with 7 males (53.8%) and 7 females (58.3%) in their respective age groups living below the poverty level.
| Age Bracket | Male | Female |
| Under 5 Years | 0 (0.0%) | 0 (0.0%) |
| 5 Years | 0 (0.0%) | 0 (0.0%) |
| 6 to 11 Years | 0 (0.0%) | 0 (0.0%) |
| 12 to 14 Years | 0 (0.0%) | 0 (0.0%) |
| 15 Years | 0 (0.0%) | 0 (0.0%) |
| 16 and 17 Years | 0 (0.0%) | 0 (0.0%) |
| 18 to 24 Years | 0 (0.0%) | 0 (0.0%) |
| 25 to 34 Years | 0 (0.0%) | 0 (0.0%) |
| 35 to 44 Years | 7 (53.8%) | 0 (0.0%) |
| 45 to 54 Years | 0 (0.0%) | 7 (58.3%) |
| 55 to 64 Years | 2 (33.3%) | 0 (0.0%) |
| 65 to 74 Years | 0 (0.0%) | 0 (0.0%) |
| 75 Years and over | 0 (0.0%) | 0 (0.0%) |
| Total | 9 (12.5%) | 7 (9.6%) |
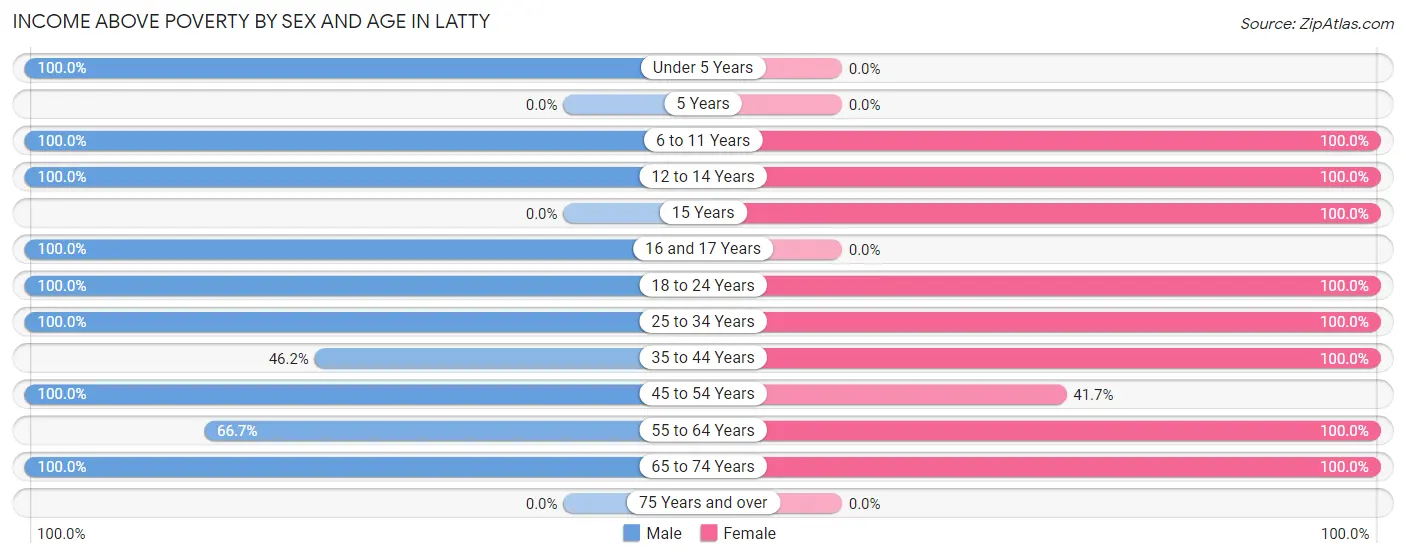
Income Above Poverty by Sex and Age in Latty
According to the poverty statistics in Latty, males aged under 5 years and females aged 6 to 11 years are the age groups that are most secure financially, with 100.0% of males and 100.0% of females in these age groups living above the poverty line.
| Age Bracket | Male | Female |
| Under 5 Years | 2 (100.0%) | 0 (0.0%) |
| 5 Years | 0 (0.0%) | 0 (0.0%) |
| 6 to 11 Years | 3 (100.0%) | 6 (100.0%) |
| 12 to 14 Years | 4 (100.0%) | 2 (100.0%) |
| 15 Years | 0 (0.0%) | 9 (100.0%) |
| 16 and 17 Years | 7 (100.0%) | 0 (0.0%) |
| 18 to 24 Years | 3 (100.0%) | 4 (100.0%) |
| 25 to 34 Years | 7 (100.0%) | 6 (100.0%) |
| 35 to 44 Years | 6 (46.2%) | 14 (100.0%) |
| 45 to 54 Years | 16 (100.0%) | 5 (41.7%) |
| 55 to 64 Years | 4 (66.7%) | 13 (100.0%) |
| 65 to 74 Years | 11 (100.0%) | 7 (100.0%) |
| 75 Years and over | 0 (0.0%) | 0 (0.0%) |
| Total | 63 (87.5%) | 66 (90.4%) |
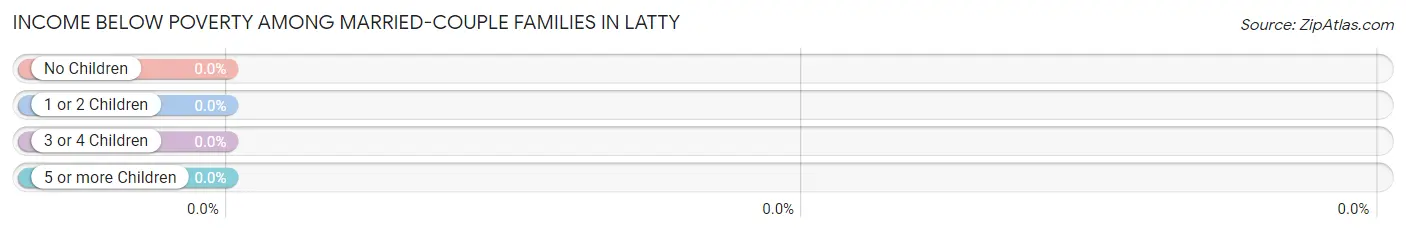
Income Below Poverty Among Married-Couple Families in Latty
| Children | Above Poverty | Below Poverty |
| No Children | 19 (100.0%) | 0 (0.0%) |
| 1 or 2 Children | 7 (100.0%) | 0 (0.0%) |
| 3 or 4 Children | 0 (0.0%) | 0 (0.0%) |
| 5 or more Children | 0 (0.0%) | 0 (0.0%) |
| Total | 26 (100.0%) | 0 (0.0%) |
Income Below Poverty Among Single-Parent Households in Latty
| Children | Single Father | Single Mother |
| No Children | 0 (0.0%) | 0 (0.0%) |
| 1 or 2 Children | 0 (0.0%) | 0 (0.0%) |
| 3 or 4 Children | 0 (0.0%) | 0 (0.0%) |
| 5 or more Children | 0 (0.0%) | 0 (0.0%) |
| Total | 0 (0.0%) | 0 (0.0%) |
Income Below Poverty Among Married-Couple vs Single-Parent Households in Latty
| Children | Married-Couple Families | Single-Parent Households |
| No Children | 0 (0.0%) | 0 (0.0%) |
| 1 or 2 Children | 0 (0.0%) | 0 (0.0%) |
| 3 or 4 Children | 0 (0.0%) | 0 (0.0%) |
| 5 or more Children | 0 (0.0%) | 0 (0.0%) |
| Total | 0 (0.0%) | 0 (0.0%) |
Employment Characteristics in Latty
Employment by Class of Employer in Latty
Among the 71 employed individuals in Latty, private company employees (46 | 64.8%), local government employees (7 | 9.9%), and federal government employees (6 | 8.5%) make up the most common classes of employment.
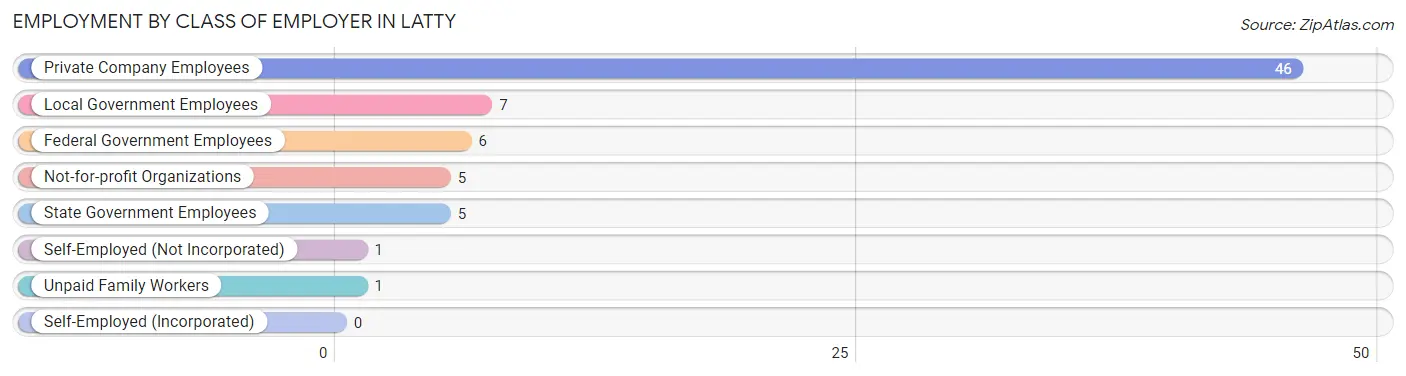
| Employer Class | # Employees | % Employees |
| Private Company Employees | 46 | 64.8% |
| Self-Employed (Incorporated) | 0 | 0.0% |
| Self-Employed (Not Incorporated) | 1 | 1.4% |
| Not-for-profit Organizations | 5 | 7.0% |
| Local Government Employees | 7 | 9.9% |
| State Government Employees | 5 | 7.0% |
| Federal Government Employees | 6 | 8.5% |
| Unpaid Family Workers | 1 | 1.4% |
| Total | 71 | 100.0% |
Employment Status by Age in Latty
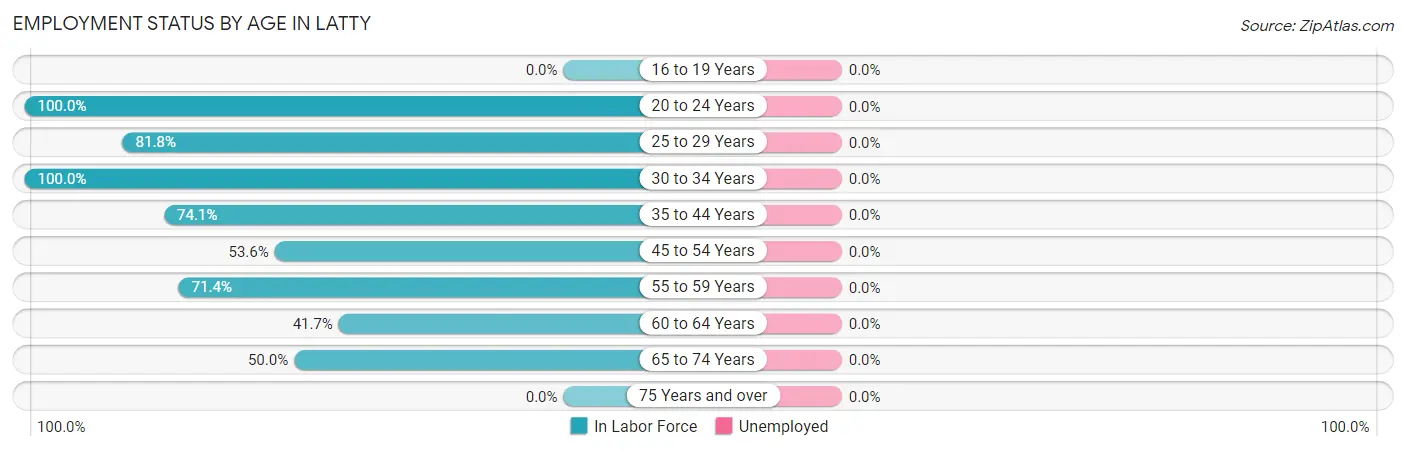
| Age Bracket | In Labor Force | Unemployed |
| 16 to 19 Years | 0 (0.0%) | 0 (0.0%) |
| 20 to 24 Years | 6 (100.0%) | 0 (0.0%) |
| 25 to 29 Years | 9 (81.8%) | 0 (0.0%) |
| 30 to 34 Years | 2 (100.0%) | 0 (0.0%) |
| 35 to 44 Years | 20 (74.1%) | 0 (0.0%) |
| 45 to 54 Years | 15 (53.6%) | 0 (0.0%) |
| 55 to 59 Years | 5 (71.4%) | 0 (0.0%) |
| 60 to 64 Years | 5 (41.7%) | 0 (0.0%) |
| 65 to 74 Years | 9 (50.0%) | 0 (0.0%) |
| 75 Years and over | 0 (0.0%) | 0 (0.0%) |
| Total | 71 (59.7%) | 0 (0.0%) |
Employment Status by Educational Attainment in Latty
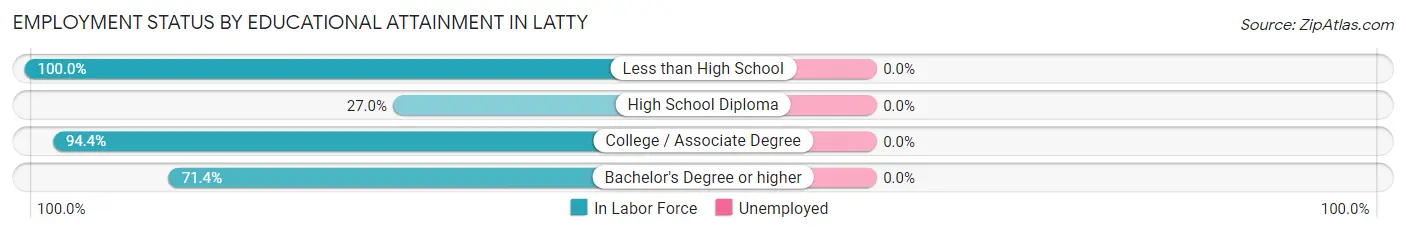
| Educational Attainment | In Labor Force | Unemployed |
| Less than High School | 7 (100.0%) | 0 (0.0%) |
| High School Diploma | 10 (27.0%) | 0 (0.0%) |
| College / Associate Degree | 34 (94.4%) | 0 (0.0%) |
| Bachelor's Degree or higher | 5 (71.4%) | 0 (0.0%) |
| Total | 56 (64.4%) | 0 (0.0%) |
Employment Occupations by Sex in Latty
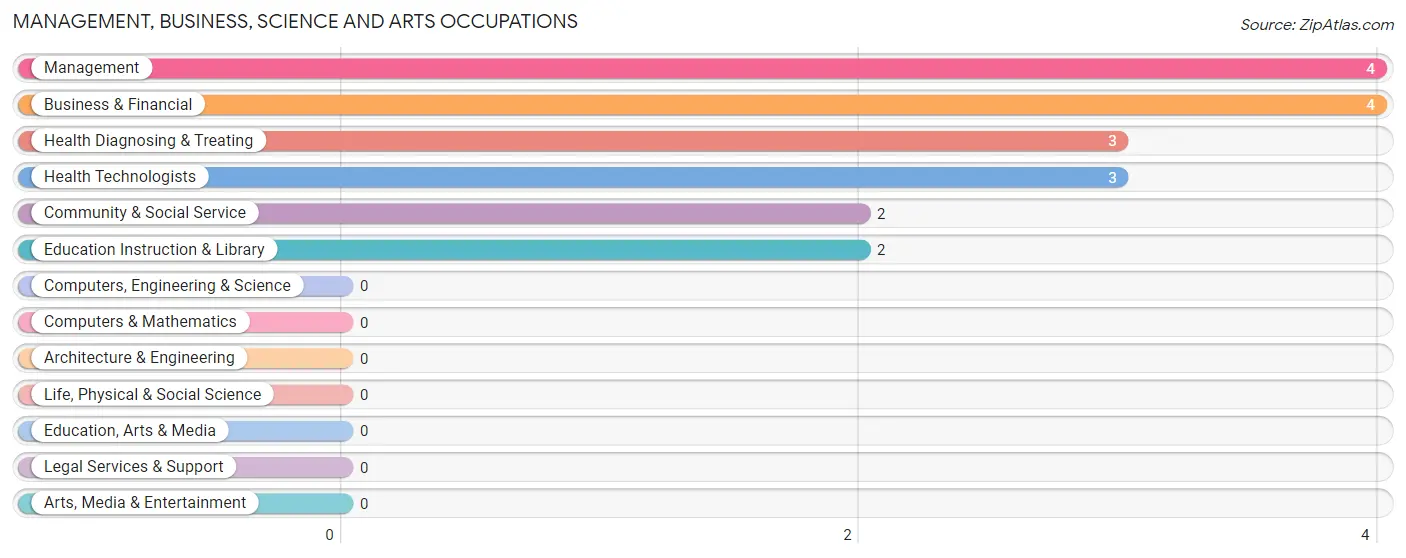
Management, Business, Science and Arts Occupations
The most common Management, Business, Science and Arts occupations in Latty are Management (4 | 5.6%), Business & Financial (4 | 5.6%), Health Diagnosing & Treating (3 | 4.2%), Health Technologists (3 | 4.2%), and Community & Social Service (2 | 2.8%).
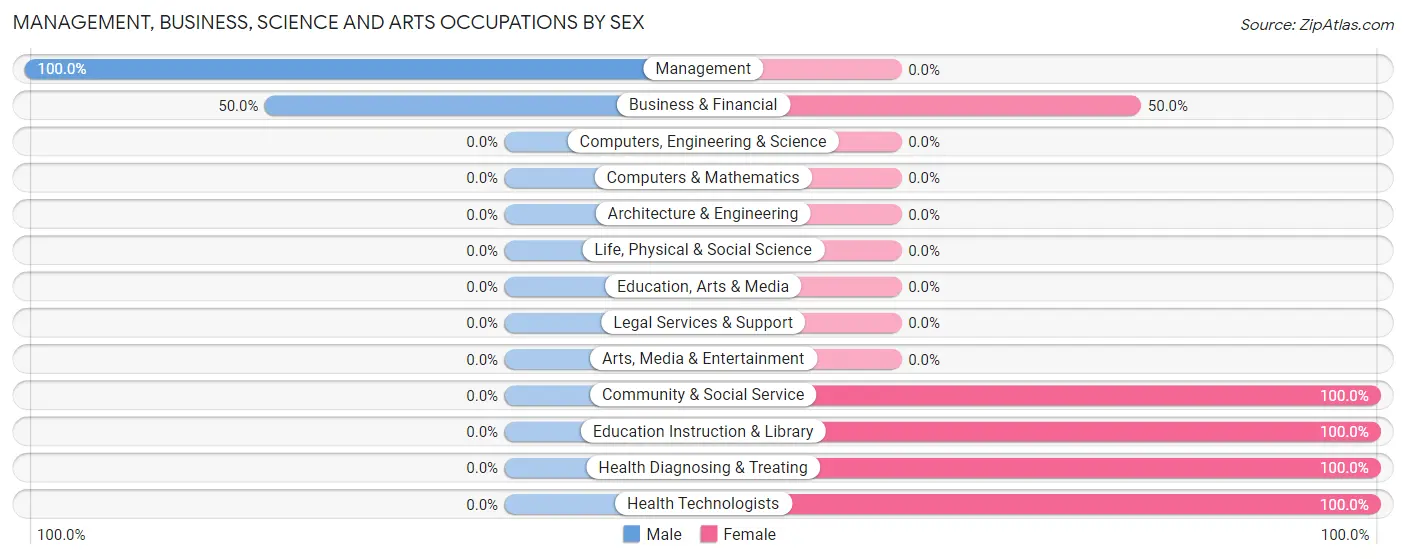
Management, Business, Science and Arts Occupations by Sex
Within the Management, Business, Science and Arts occupations in Latty, the most male-oriented occupations are Management (100.0%), and Business & Financial (50.0%), while the most female-oriented occupations are Community & Social Service (100.0%), Education Instruction & Library (100.0%), and Health Diagnosing & Treating (100.0%).
| Occupation | Male | Female |
| Management | 4 (100.0%) | 0 (0.0%) |
| Business & Financial | 2 (50.0%) | 2 (50.0%) |
| Computers, Engineering & Science | 0 (0.0%) | 0 (0.0%) |
| Computers & Mathematics | 0 (0.0%) | 0 (0.0%) |
| Architecture & Engineering | 0 (0.0%) | 0 (0.0%) |
| Life, Physical & Social Science | 0 (0.0%) | 0 (0.0%) |
| Community & Social Service | 0 (0.0%) | 2 (100.0%) |
| Education, Arts & Media | 0 (0.0%) | 0 (0.0%) |
| Legal Services & Support | 0 (0.0%) | 0 (0.0%) |
| Education Instruction & Library | 0 (0.0%) | 2 (100.0%) |
| Arts, Media & Entertainment | 0 (0.0%) | 0 (0.0%) |
| Health Diagnosing & Treating | 0 (0.0%) | 3 (100.0%) |
| Health Technologists | 0 (0.0%) | 3 (100.0%) |
| Total (Category) | 6 (46.2%) | 7 (53.8%) |
| Total (Overall) | 39 (54.9%) | 32 (45.1%) |
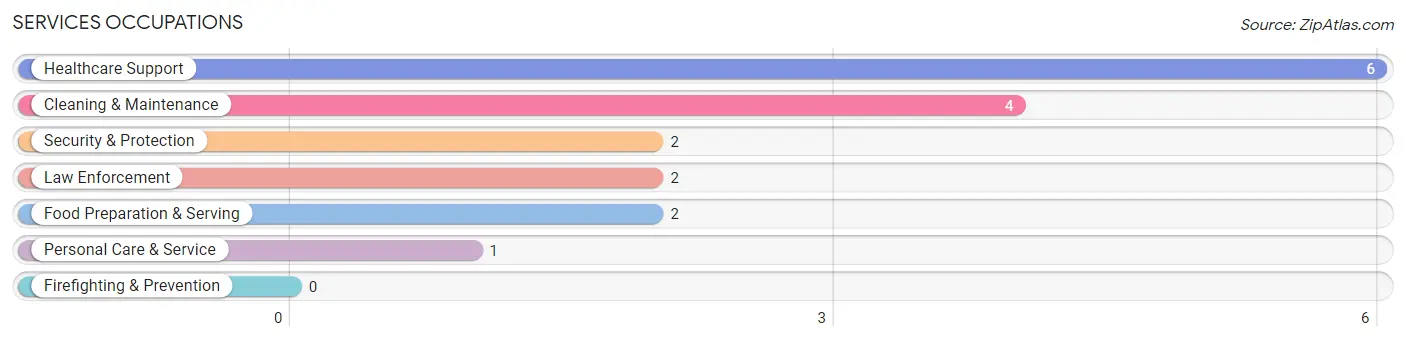
Services Occupations
The most common Services occupations in Latty are Healthcare Support (6 | 8.5%), Cleaning & Maintenance (4 | 5.6%), Security & Protection (2 | 2.8%), Law Enforcement (2 | 2.8%), and Food Preparation & Serving (2 | 2.8%).
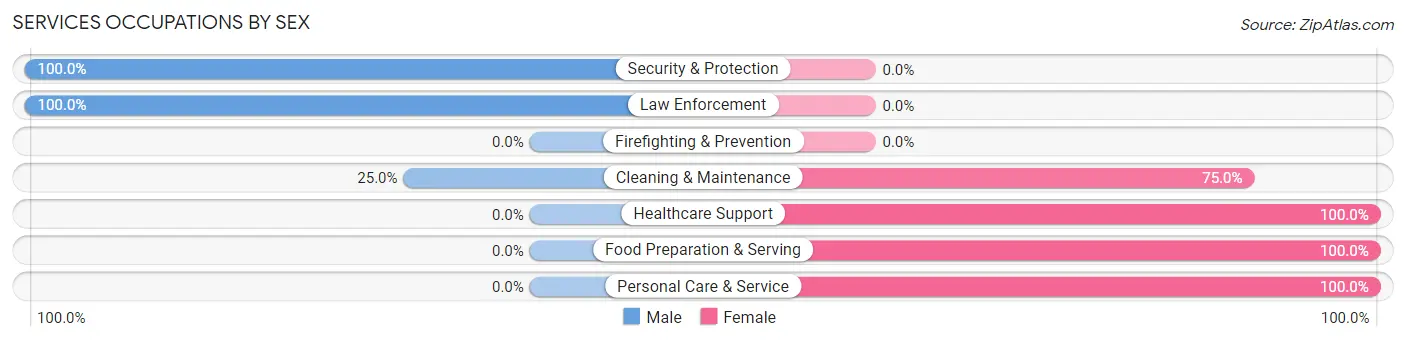
Services Occupations by Sex
Within the Services occupations in Latty, the most male-oriented occupations are Security & Protection (100.0%), Law Enforcement (100.0%), and Cleaning & Maintenance (25.0%), while the most female-oriented occupations are Healthcare Support (100.0%), Food Preparation & Serving (100.0%), and Personal Care & Service (100.0%).
| Occupation | Male | Female |
| Healthcare Support | 0 (0.0%) | 6 (100.0%) |
| Security & Protection | 2 (100.0%) | 0 (0.0%) |
| Firefighting & Prevention | 0 (0.0%) | 0 (0.0%) |
| Law Enforcement | 2 (100.0%) | 0 (0.0%) |
| Food Preparation & Serving | 0 (0.0%) | 2 (100.0%) |
| Cleaning & Maintenance | 1 (25.0%) | 3 (75.0%) |
| Personal Care & Service | 0 (0.0%) | 1 (100.0%) |
| Total (Category) | 3 (20.0%) | 12 (80.0%) |
| Total (Overall) | 39 (54.9%) | 32 (45.1%) |
Sales and Office Occupations
The most common Sales and Office occupations in Latty are Office & Administration (8 | 11.3%), and Sales & Related (1 | 1.4%).
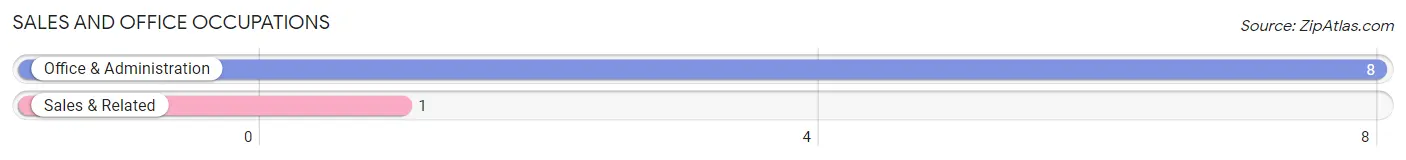
Sales and Office Occupations by Sex

| Occupation | Male | Female |
| Sales & Related | 1 (100.0%) | 0 (0.0%) |
| Office & Administration | 0 (0.0%) | 8 (100.0%) |
| Total (Category) | 1 (11.1%) | 8 (88.9%) |
| Total (Overall) | 39 (54.9%) | 32 (45.1%) |
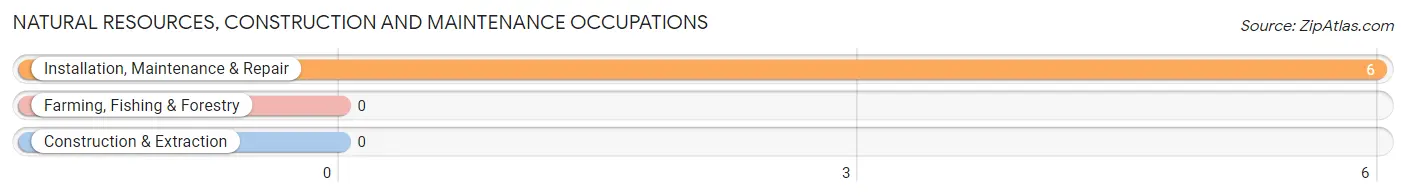
Natural Resources, Construction and Maintenance Occupations
The most common Natural Resources, Construction and Maintenance occupations in Latty are , and Installation, Maintenance & Repair (6 | 8.5%).
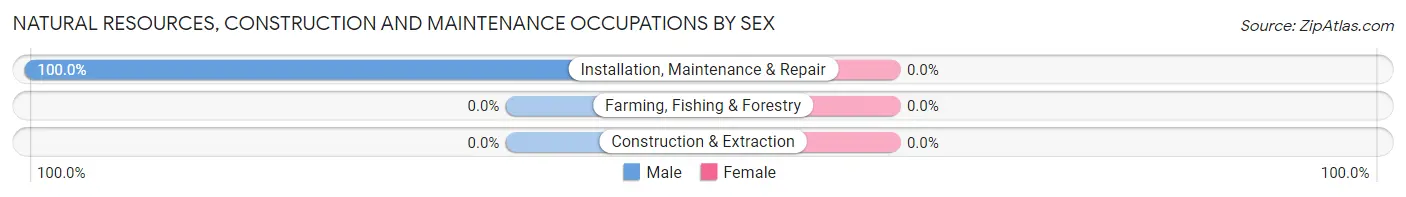
Natural Resources, Construction and Maintenance Occupations by Sex
| Occupation | Male | Female |
| Farming, Fishing & Forestry | 0 (0.0%) | 0 (0.0%) |
| Construction & Extraction | 0 (0.0%) | 0 (0.0%) |
| Installation, Maintenance & Repair | 6 (100.0%) | 0 (0.0%) |
| Total (Category) | 6 (100.0%) | 0 (0.0%) |
| Total (Overall) | 39 (54.9%) | 32 (45.1%) |
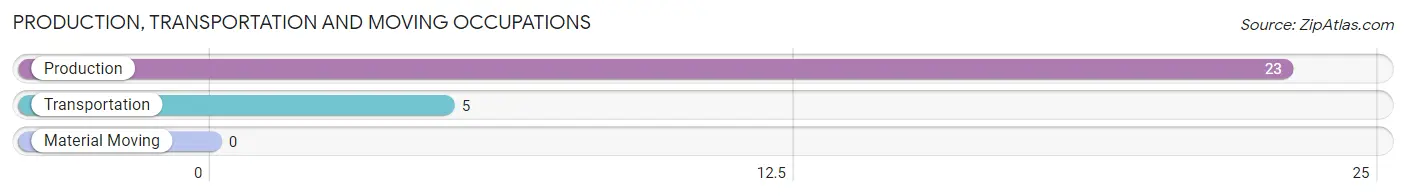
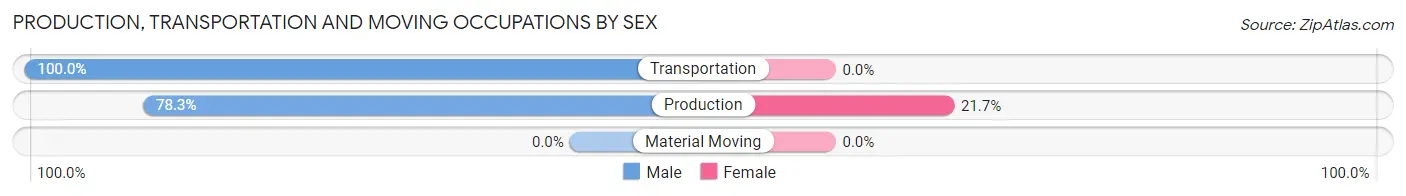
Production, Transportation and Moving Occupations
The most common Production, Transportation and Moving occupations in Latty are Production (23 | 32.4%), and Transportation (5 | 7.0%).
Production, Transportation and Moving Occupations by Sex
| Occupation | Male | Female |
| Production | 18 (78.3%) | 5 (21.7%) |
| Transportation | 5 (100.0%) | 0 (0.0%) |
| Material Moving | 0 (0.0%) | 0 (0.0%) |
| Total (Category) | 23 (82.1%) | 5 (17.9%) |
| Total (Overall) | 39 (54.9%) | 32 (45.1%) |
Employment Industries by Sex in Latty
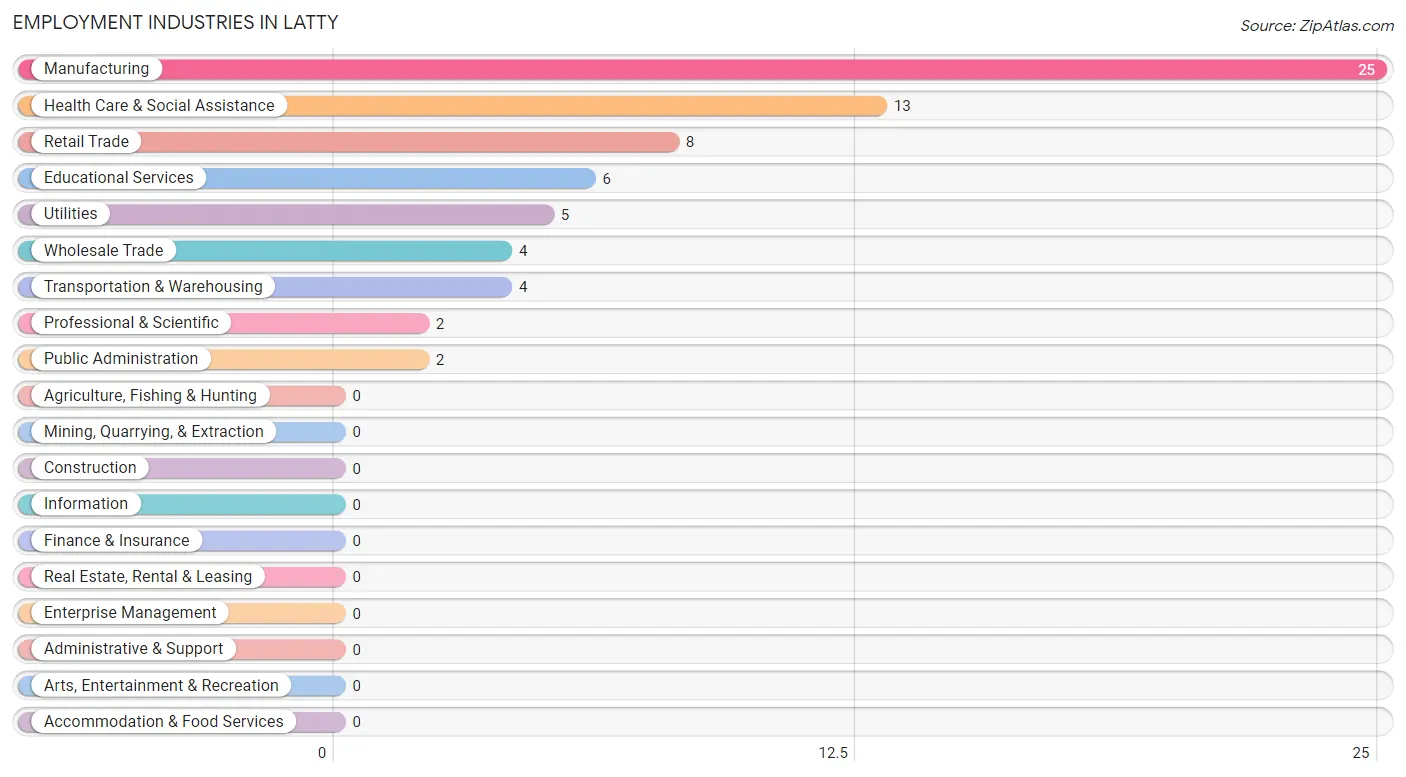
Employment Industries in Latty
The major employment industries in Latty include Manufacturing (25 | 35.2%), Health Care & Social Assistance (13 | 18.3%), Retail Trade (8 | 11.3%), Educational Services (6 | 8.5%), and Utilities (5 | 7.0%).
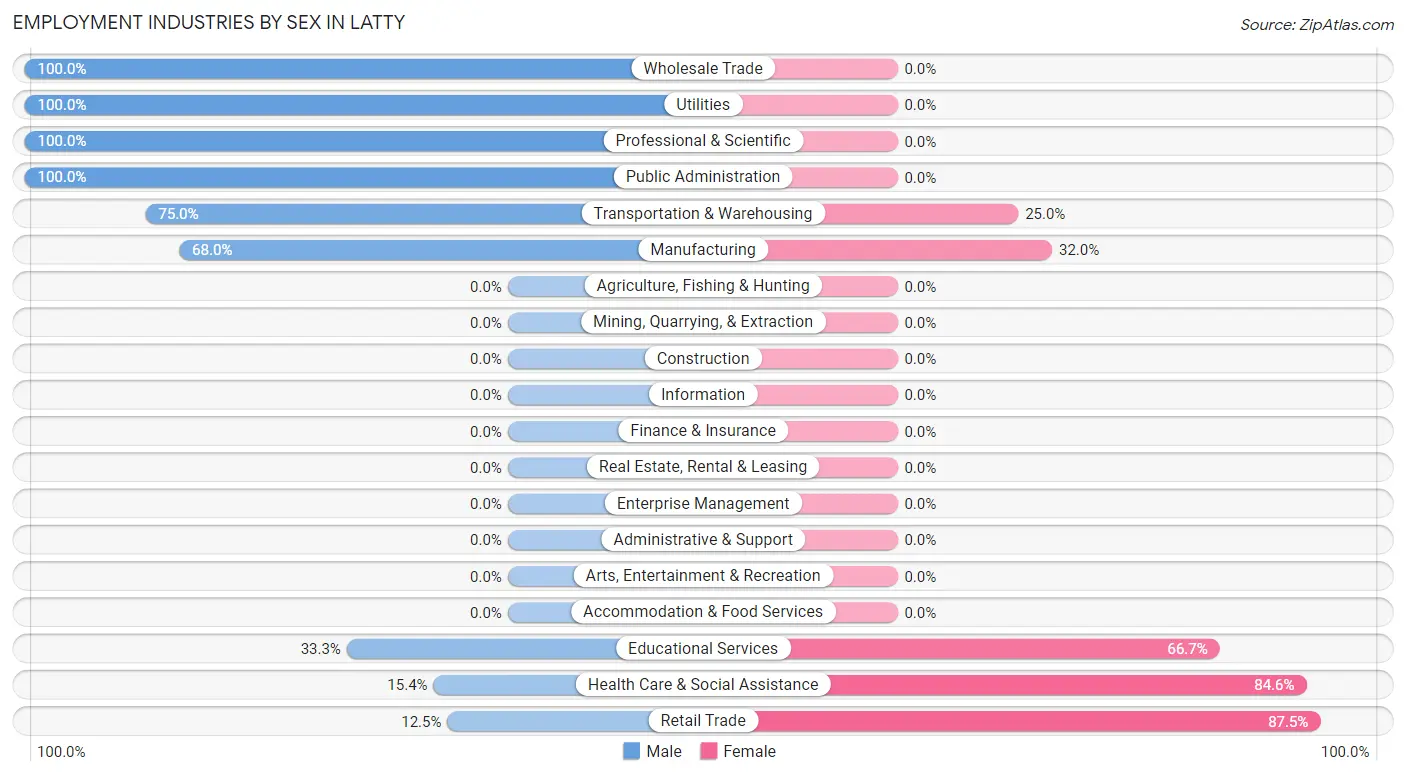
Employment Industries by Sex in Latty
The Latty industries that see more men than women are Wholesale Trade (100.0%), Utilities (100.0%), and Professional & Scientific (100.0%), whereas the industries that tend to have a higher number of women are Retail Trade (87.5%), Health Care & Social Assistance (84.6%), and Educational Services (66.7%).
| Industry | Male | Female |
| Agriculture, Fishing & Hunting | 0 (0.0%) | 0 (0.0%) |
| Mining, Quarrying, & Extraction | 0 (0.0%) | 0 (0.0%) |
| Construction | 0 (0.0%) | 0 (0.0%) |
| Manufacturing | 17 (68.0%) | 8 (32.0%) |
| Wholesale Trade | 4 (100.0%) | 0 (0.0%) |
| Retail Trade | 1 (12.5%) | 7 (87.5%) |
| Transportation & Warehousing | 3 (75.0%) | 1 (25.0%) |
| Utilities | 5 (100.0%) | 0 (0.0%) |
| Information | 0 (0.0%) | 0 (0.0%) |
| Finance & Insurance | 0 (0.0%) | 0 (0.0%) |
| Real Estate, Rental & Leasing | 0 (0.0%) | 0 (0.0%) |
| Professional & Scientific | 2 (100.0%) | 0 (0.0%) |
| Enterprise Management | 0 (0.0%) | 0 (0.0%) |
| Administrative & Support | 0 (0.0%) | 0 (0.0%) |
| Educational Services | 2 (33.3%) | 4 (66.7%) |
| Health Care & Social Assistance | 2 (15.4%) | 11 (84.6%) |
| Arts, Entertainment & Recreation | 0 (0.0%) | 0 (0.0%) |
| Accommodation & Food Services | 0 (0.0%) | 0 (0.0%) |
| Public Administration | 2 (100.0%) | 0 (0.0%) |
| Total | 39 (54.9%) | 32 (45.1%) |
Education in Latty
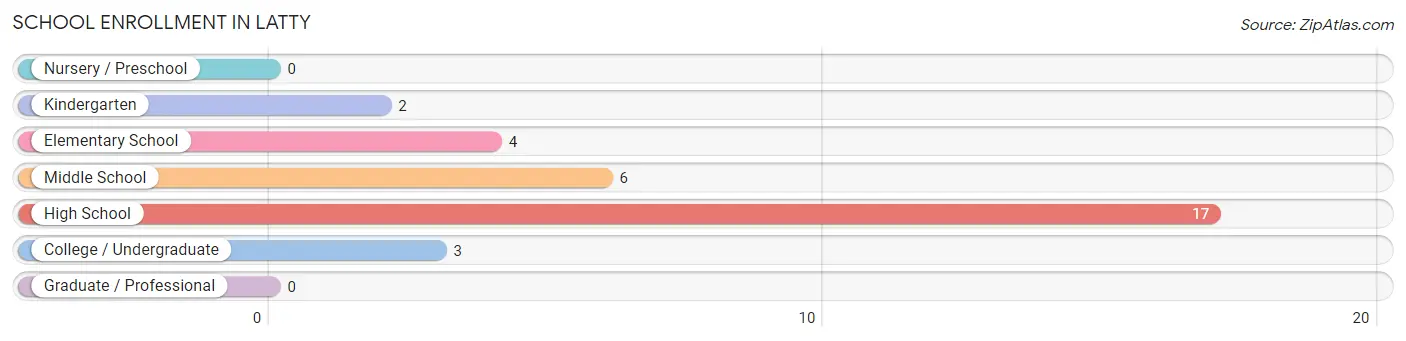
School Enrollment in Latty
The most common levels of schooling among the 32 students in Latty are high school (17 | 53.1%), middle school (6 | 18.8%), and elementary school (4 | 12.5%).
| School Level | # Students | % Students |
| Nursery / Preschool | 0 | 0.0% |
| Kindergarten | 2 | 6.2% |
| Elementary School | 4 | 12.5% |
| Middle School | 6 | 18.8% |
| High School | 17 | 53.1% |
| College / Undergraduate | 3 | 9.4% |
| Graduate / Professional | 0 | 0.0% |
| Total | 32 | 100.0% |
School Enrollment by Age by Funding Source in Latty
Out of a total of 32 students who are enrolled in schools in Latty, 1 (3.1%) attend a private institution, while the remaining 31 (96.9%) are enrolled in public schools. The age group of 20 to 24 year olds has the highest likelihood of being enrolled in private schools, with 1 (33.3% in the age bracket) enrolled. Conversely, the age group of 5 to 9 year old has the lowest likelihood of being enrolled in a private school, with 5 (100.0% in the age bracket) attending a public institution.
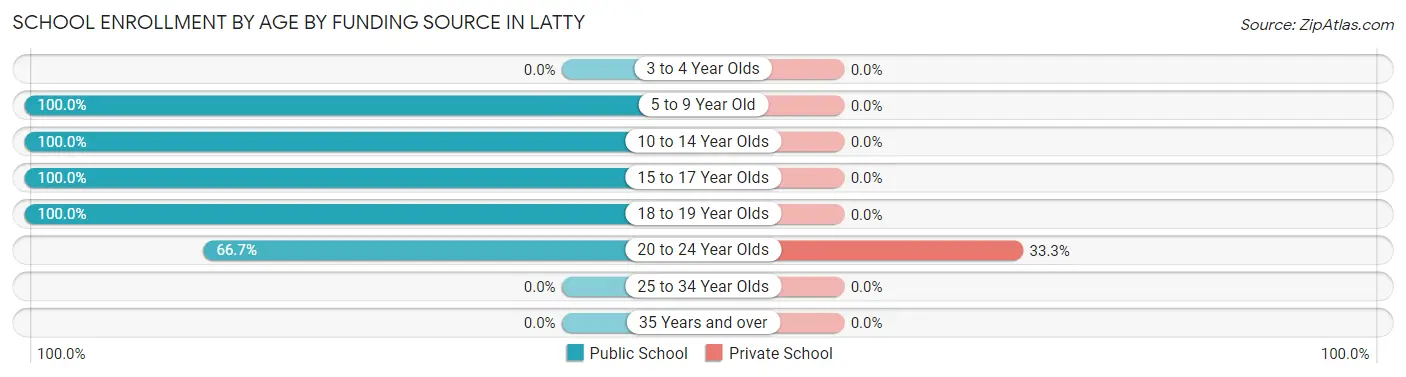
| Age Bracket | Public School | Private School |
| 3 to 4 Year Olds | 0 (0.0%) | 0 (0.0%) |
| 5 to 9 Year Old | 5 (100.0%) | 0 (0.0%) |
| 10 to 14 Year Olds | 7 (100.0%) | 0 (0.0%) |
| 15 to 17 Year Olds | 16 (100.0%) | 0 (0.0%) |
| 18 to 19 Year Olds | 1 (100.0%) | 0 (0.0%) |
| 20 to 24 Year Olds | 2 (66.7%) | 1 (33.3%) |
| 25 to 34 Year Olds | 0 (0.0%) | 0 (0.0%) |
| 35 Years and over | 0 (0.0%) | 0 (0.0%) |
| Total | 31 (96.9%) | 1 (3.1%) |
Educational Attainment by Field of Study in Latty
Social sciences (2 | 25.0%), visual & performing arts (2 | 25.0%), arts & humanities (2 | 25.0%), science & technology (1 | 12.5%), and education (1 | 12.5%) are the most common fields of study among 8 individuals in Latty who have obtained a bachelor's degree or higher.
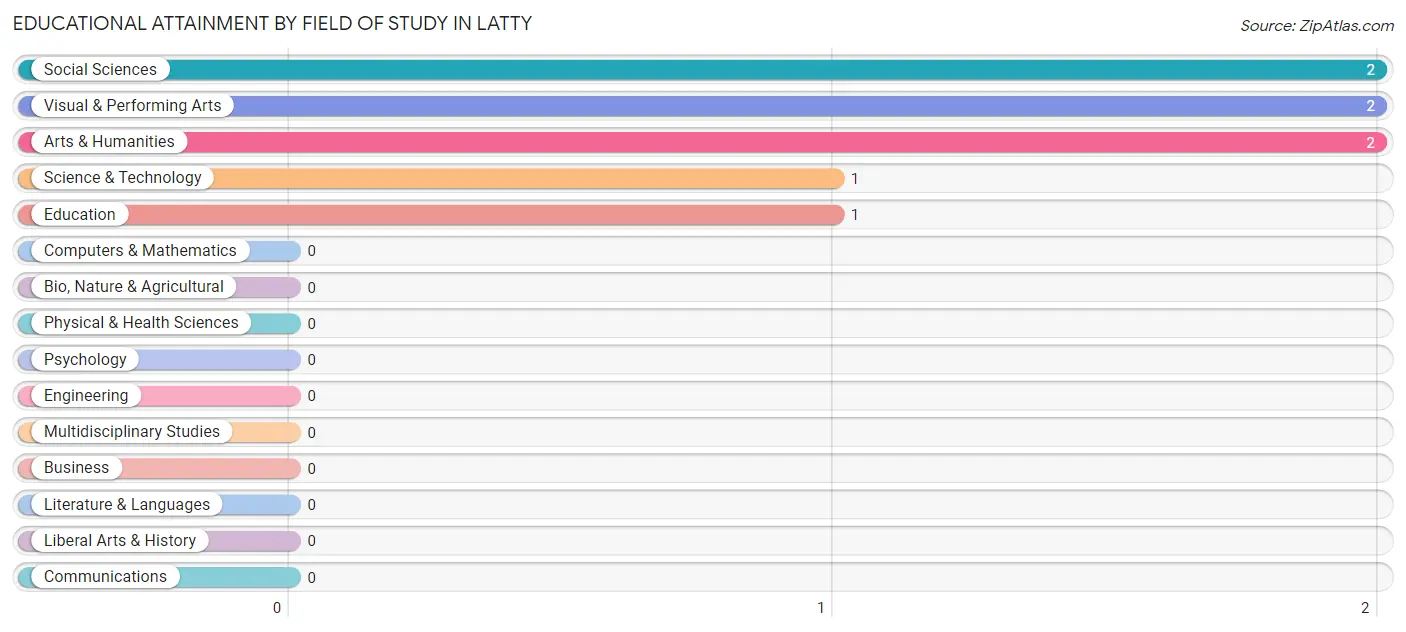
| Field of Study | # Graduates | % Graduates |
| Computers & Mathematics | 0 | 0.0% |
| Bio, Nature & Agricultural | 0 | 0.0% |
| Physical & Health Sciences | 0 | 0.0% |
| Psychology | 0 | 0.0% |
| Social Sciences | 2 | 25.0% |
| Engineering | 0 | 0.0% |
| Multidisciplinary Studies | 0 | 0.0% |
| Science & Technology | 1 | 12.5% |
| Business | 0 | 0.0% |
| Education | 1 | 12.5% |
| Literature & Languages | 0 | 0.0% |
| Liberal Arts & History | 0 | 0.0% |
| Visual & Performing Arts | 2 | 25.0% |
| Communications | 0 | 0.0% |
| Arts & Humanities | 2 | 25.0% |
| Total | 8 | 100.0% |
Transportation & Commute in Latty
Vehicle Availability by Sex in Latty
The most prevalent vehicle ownership categories in Latty are males with 2 vehicles (16, accounting for 41.0%) and females with 2 vehicles (20, making up 50.0%).
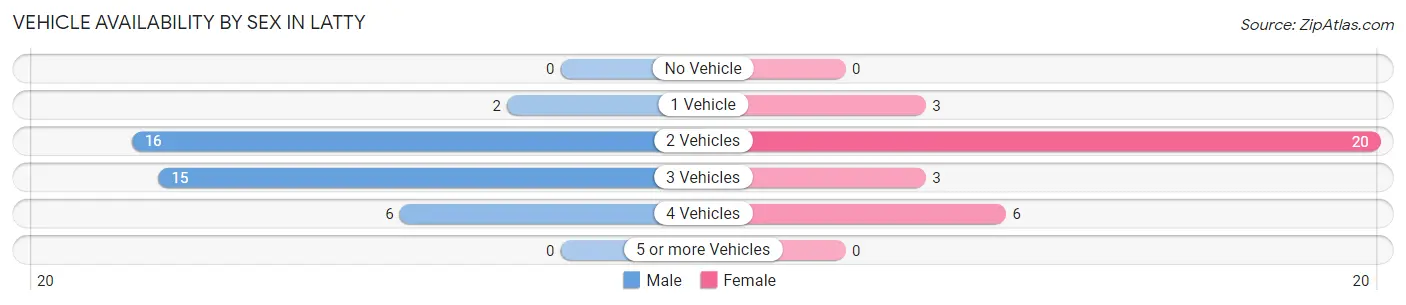
| Vehicles Available | Male | Female |
| No Vehicle | 0 (0.0%) | 0 (0.0%) |
| 1 Vehicle | 2 (5.1%) | 3 (9.4%) |
| 2 Vehicles | 16 (41.0%) | 20 (62.5%) |
| 3 Vehicles | 15 (38.5%) | 3 (9.4%) |
| 4 Vehicles | 6 (15.4%) | 6 (18.8%) |
| 5 or more Vehicles | 0 (0.0%) | 0 (0.0%) |
| Total | 39 (100.0%) | 32 (100.0%) |
Commute Time in Latty
The most frequently occuring commute durations in Latty are 5 to 9 minutes (16 commuters, 22.5%), 10 to 14 minutes (13 commuters, 18.3%), and 30 to 34 minutes (8 commuters, 11.3%).
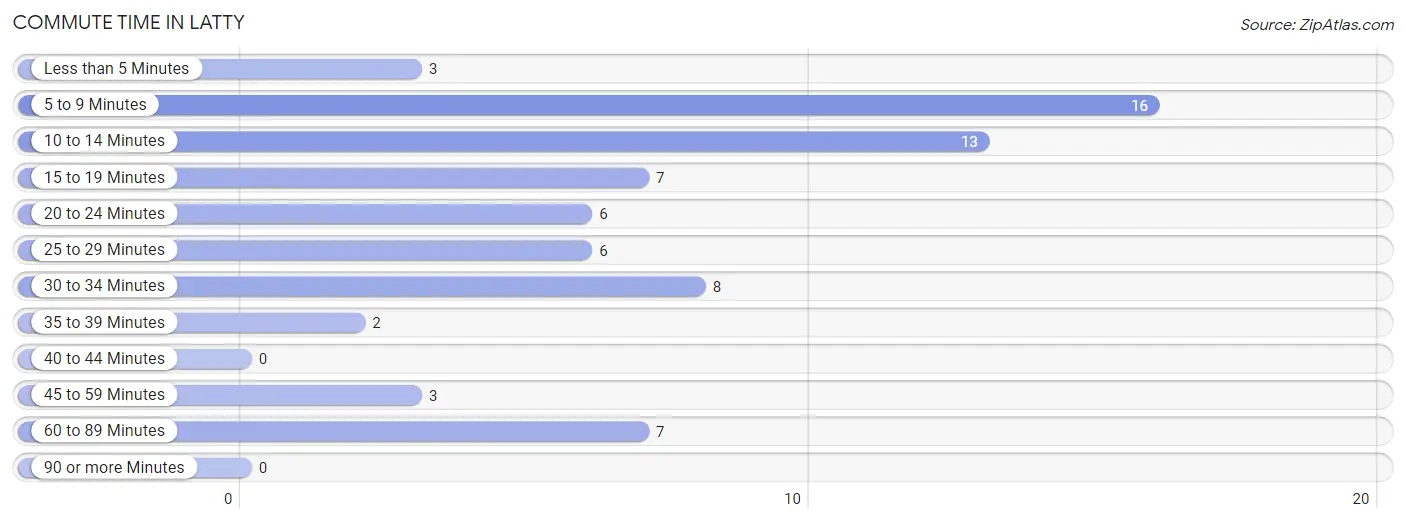
| Commute Time | # Commuters | % Commuters |
| Less than 5 Minutes | 3 | 4.2% |
| 5 to 9 Minutes | 16 | 22.5% |
| 10 to 14 Minutes | 13 | 18.3% |
| 15 to 19 Minutes | 7 | 9.9% |
| 20 to 24 Minutes | 6 | 8.5% |
| 25 to 29 Minutes | 6 | 8.5% |
| 30 to 34 Minutes | 8 | 11.3% |
| 35 to 39 Minutes | 2 | 2.8% |
| 40 to 44 Minutes | 0 | 0.0% |
| 45 to 59 Minutes | 3 | 4.2% |
| 60 to 89 Minutes | 7 | 9.9% |
| 90 or more Minutes | 0 | 0.0% |
Commute Time by Sex in Latty
The most common commute times in Latty are 10 to 14 minutes (9 commuters, 23.1%) for males and 5 to 9 minutes (13 commuters, 40.6%) for females.
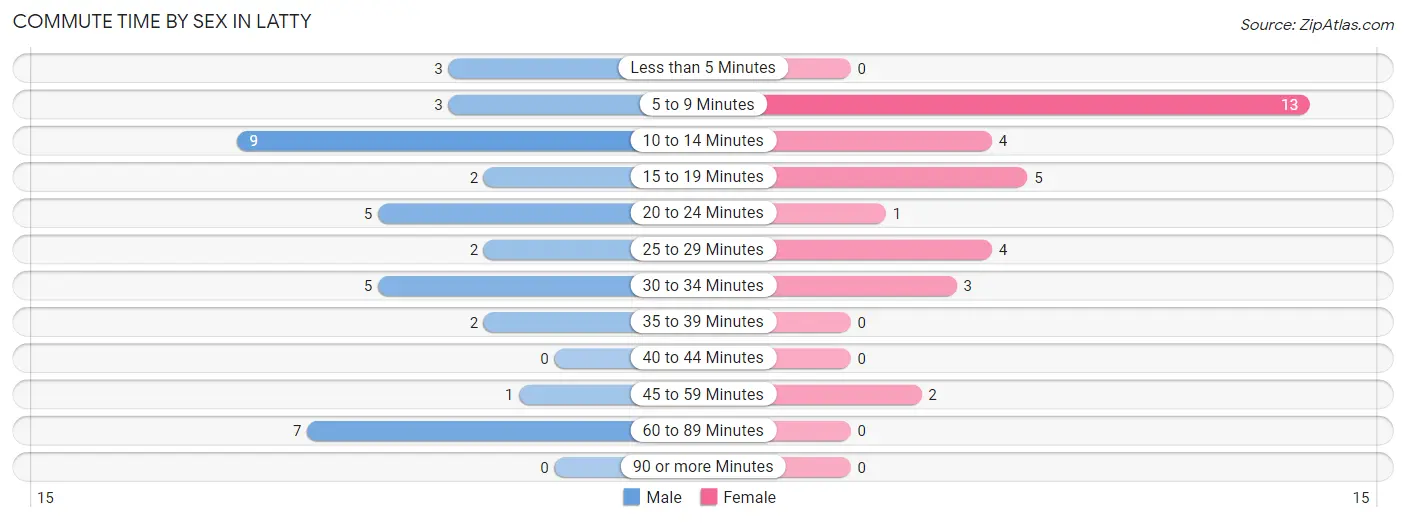
| Commute Time | Male | Female |
| Less than 5 Minutes | 3 (7.7%) | 0 (0.0%) |
| 5 to 9 Minutes | 3 (7.7%) | 13 (40.6%) |
| 10 to 14 Minutes | 9 (23.1%) | 4 (12.5%) |
| 15 to 19 Minutes | 2 (5.1%) | 5 (15.6%) |
| 20 to 24 Minutes | 5 (12.8%) | 1 (3.1%) |
| 25 to 29 Minutes | 2 (5.1%) | 4 (12.5%) |
| 30 to 34 Minutes | 5 (12.8%) | 3 (9.4%) |
| 35 to 39 Minutes | 2 (5.1%) | 0 (0.0%) |
| 40 to 44 Minutes | 0 (0.0%) | 0 (0.0%) |
| 45 to 59 Minutes | 1 (2.6%) | 2 (6.2%) |
| 60 to 89 Minutes | 7 (17.9%) | 0 (0.0%) |
| 90 or more Minutes | 0 (0.0%) | 0 (0.0%) |
Time of Departure to Work by Sex in Latty
The most frequent times of departure to work in Latty are 7:00 AM to 7:29 AM (10, 25.6%) for males and 4:00 PM to 11:59 PM (10, 31.2%) for females.

| Time of Departure | Male | Female |
| 12:00 AM to 4:59 AM | 3 (7.7%) | 0 (0.0%) |
| 5:00 AM to 5:29 AM | 5 (12.8%) | 2 (6.2%) |
| 5:30 AM to 5:59 AM | 4 (10.3%) | 3 (9.4%) |
| 6:00 AM to 6:29 AM | 6 (15.4%) | 0 (0.0%) |
| 6:30 AM to 6:59 AM | 1 (2.6%) | 3 (9.4%) |
| 7:00 AM to 7:29 AM | 10 (25.6%) | 7 (21.9%) |
| 7:30 AM to 7:59 AM | 0 (0.0%) | 2 (6.2%) |
| 8:00 AM to 8:29 AM | 2 (5.1%) | 3 (9.4%) |
| 8:30 AM to 8:59 AM | 1 (2.6%) | 0 (0.0%) |
| 9:00 AM to 9:59 AM | 1 (2.6%) | 0 (0.0%) |
| 10:00 AM to 10:59 AM | 0 (0.0%) | 0 (0.0%) |
| 11:00 AM to 11:59 AM | 0 (0.0%) | 2 (6.2%) |
| 12:00 PM to 3:59 PM | 0 (0.0%) | 0 (0.0%) |
| 4:00 PM to 11:59 PM | 6 (15.4%) | 10 (31.2%) |
| Total | 39 (100.0%) | 32 (100.0%) |
Housing Occupancy in Latty
Occupancy by Ownership in Latty
Of the total 49 dwellings in Latty, owner-occupied units account for 36 (73.5%), while renter-occupied units make up 13 (26.5%).
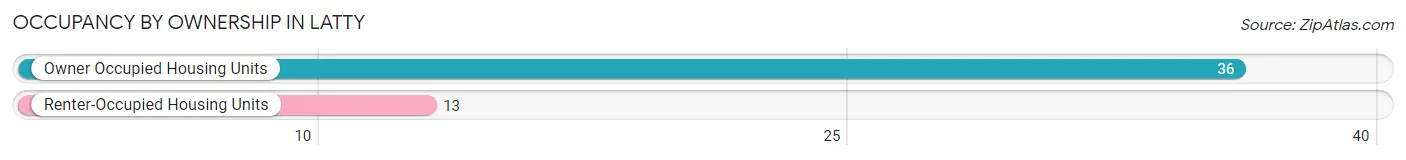
| Occupancy | # Housing Units | % Housing Units |
| Owner Occupied Housing Units | 36 | 73.5% |
| Renter-Occupied Housing Units | 13 | 26.5% |
| Total Occupied Housing Units | 49 | 100.0% |
Occupancy by Household Size in Latty
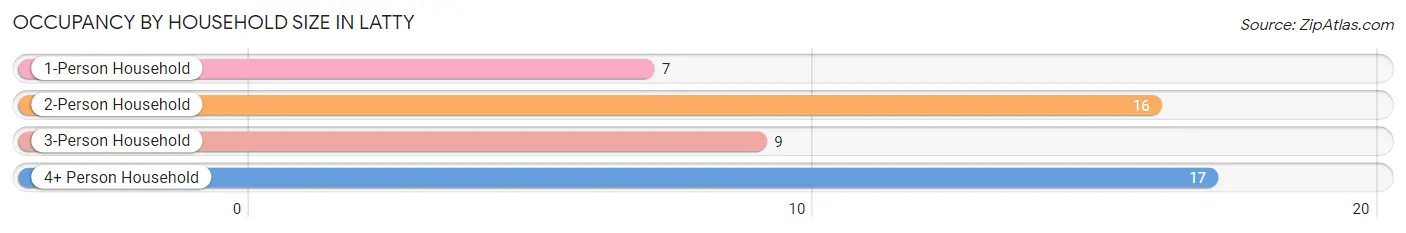
| Household Size | # Housing Units | % Housing Units |
| 1-Person Household | 7 | 14.3% |
| 2-Person Household | 16 | 32.7% |
| 3-Person Household | 9 | 18.4% |
| 4+ Person Household | 17 | 34.7% |
| Total Housing Units | 49 | 100.0% |
Occupancy by Ownership by Household Size in Latty
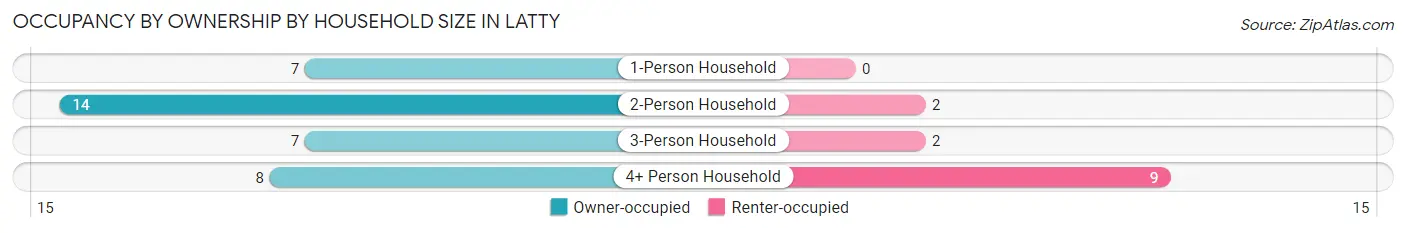
| Household Size | Owner-occupied | Renter-occupied |
| 1-Person Household | 7 (100.0%) | 0 (0.0%) |
| 2-Person Household | 14 (87.5%) | 2 (12.5%) |
| 3-Person Household | 7 (77.8%) | 2 (22.2%) |
| 4+ Person Household | 8 (47.1%) | 9 (52.9%) |
| Total Housing Units | 36 (73.5%) | 13 (26.5%) |
Occupancy by Educational Attainment in Latty
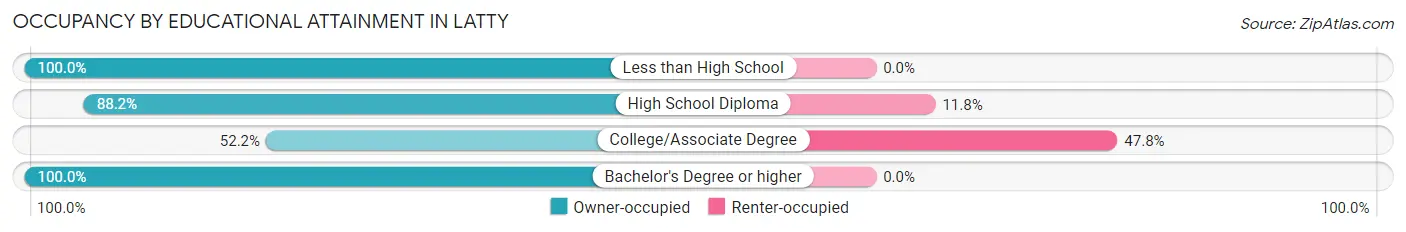
| Household Size | Owner-occupied | Renter-occupied |
| Less than High School | 5 (100.0%) | 0 (0.0%) |
| High School Diploma | 15 (88.2%) | 2 (11.8%) |
| College/Associate Degree | 12 (52.2%) | 11 (47.8%) |
| Bachelor's Degree or higher | 4 (100.0%) | 0 (0.0%) |
Occupancy by Age of Householder in Latty
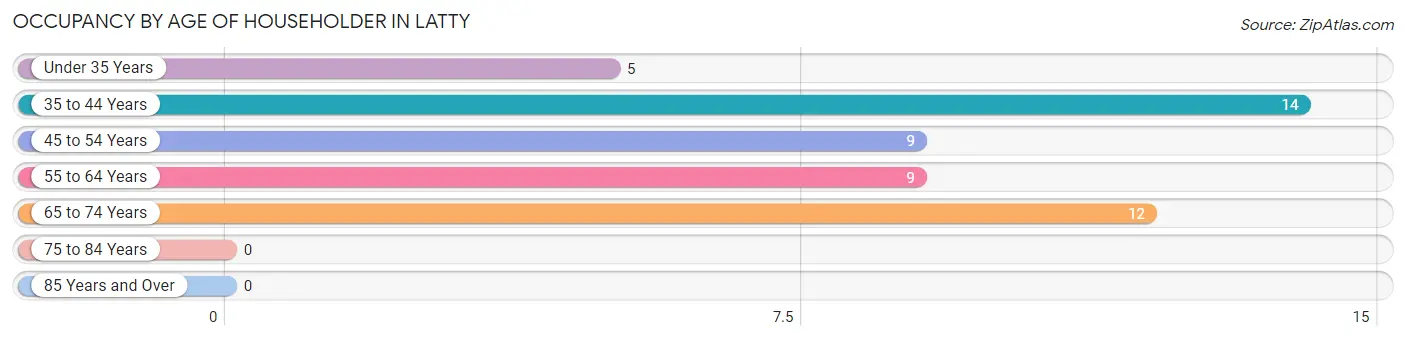
| Age Bracket | # Households | % Households |
| Under 35 Years | 5 | 10.2% |
| 35 to 44 Years | 14 | 28.6% |
| 45 to 54 Years | 9 | 18.4% |
| 55 to 64 Years | 9 | 18.4% |
| 65 to 74 Years | 12 | 24.5% |
| 75 to 84 Years | 0 | 0.0% |
| 85 Years and Over | 0 | 0.0% |
| Total | 49 | 100.0% |
Housing Finances in Latty
Median Income by Occupancy in Latty
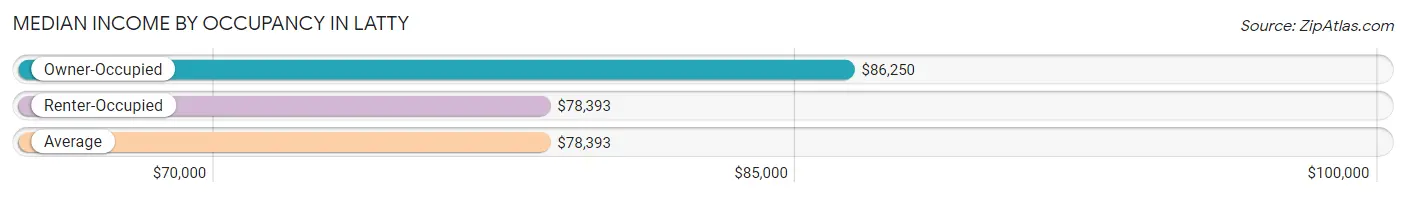
| Occupancy Type | # Households | Median Income |
| Owner-Occupied | 36 (73.5%) | $86,250 |
| Renter-Occupied | 13 (26.5%) | $78,393 |
| Average | 49 (100.0%) | $78,393 |
Occupancy by Householder Income Bracket in Latty
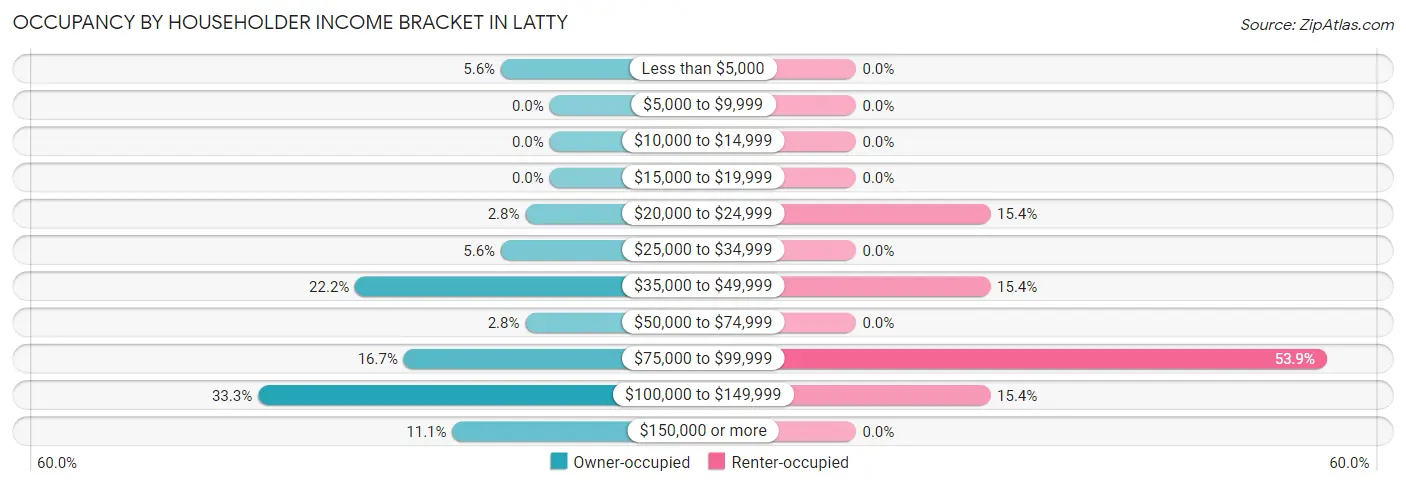
| Income Bracket | Owner-occupied | Renter-occupied |
| Less than $5,000 | 2 (5.6%) | 0 (0.0%) |
| $5,000 to $9,999 | 0 (0.0%) | 0 (0.0%) |
| $10,000 to $14,999 | 0 (0.0%) | 0 (0.0%) |
| $15,000 to $19,999 | 0 (0.0%) | 0 (0.0%) |
| $20,000 to $24,999 | 1 (2.8%) | 2 (15.4%) |
| $25,000 to $34,999 | 2 (5.6%) | 0 (0.0%) |
| $35,000 to $49,999 | 8 (22.2%) | 2 (15.4%) |
| $50,000 to $74,999 | 1 (2.8%) | 0 (0.0%) |
| $75,000 to $99,999 | 6 (16.7%) | 7 (53.8%) |
| $100,000 to $149,999 | 12 (33.3%) | 2 (15.4%) |
| $150,000 or more | 4 (11.1%) | 0 (0.0%) |
| Total | 36 (100.0%) | 13 (100.0%) |
Monthly Housing Cost Tiers in Latty
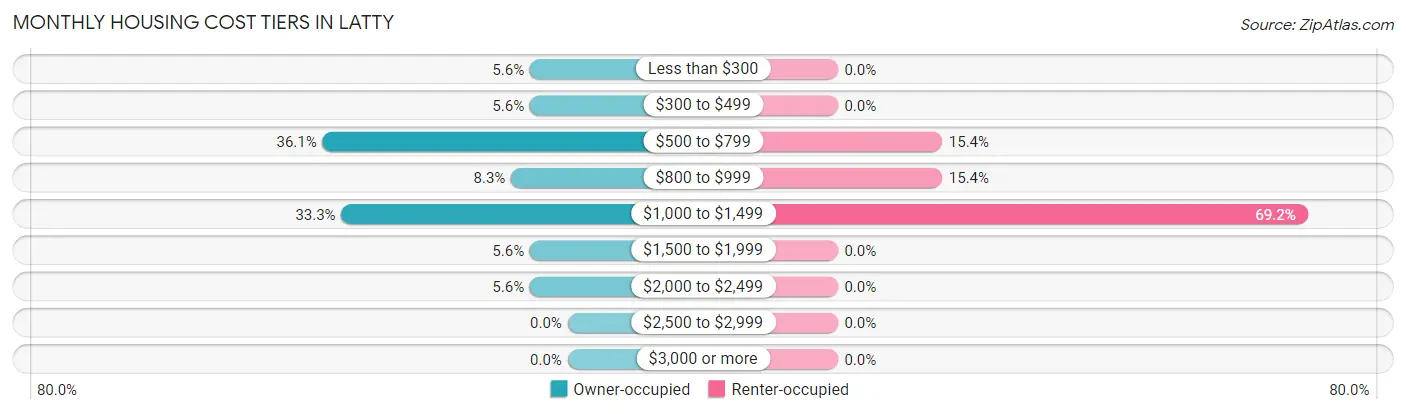
| Monthly Cost | Owner-occupied | Renter-occupied |
| Less than $300 | 2 (5.6%) | 0 (0.0%) |
| $300 to $499 | 2 (5.6%) | 0 (0.0%) |
| $500 to $799 | 13 (36.1%) | 2 (15.4%) |
| $800 to $999 | 3 (8.3%) | 2 (15.4%) |
| $1,000 to $1,499 | 12 (33.3%) | 9 (69.2%) |
| $1,500 to $1,999 | 2 (5.6%) | 0 (0.0%) |
| $2,000 to $2,499 | 2 (5.6%) | 0 (0.0%) |
| $2,500 to $2,999 | 0 (0.0%) | 0 (0.0%) |
| $3,000 or more | 0 (0.0%) | 0 (0.0%) |
| Total | 36 (100.0%) | 13 (100.0%) |
Physical Housing Characteristics in Latty
Housing Structures in Latty
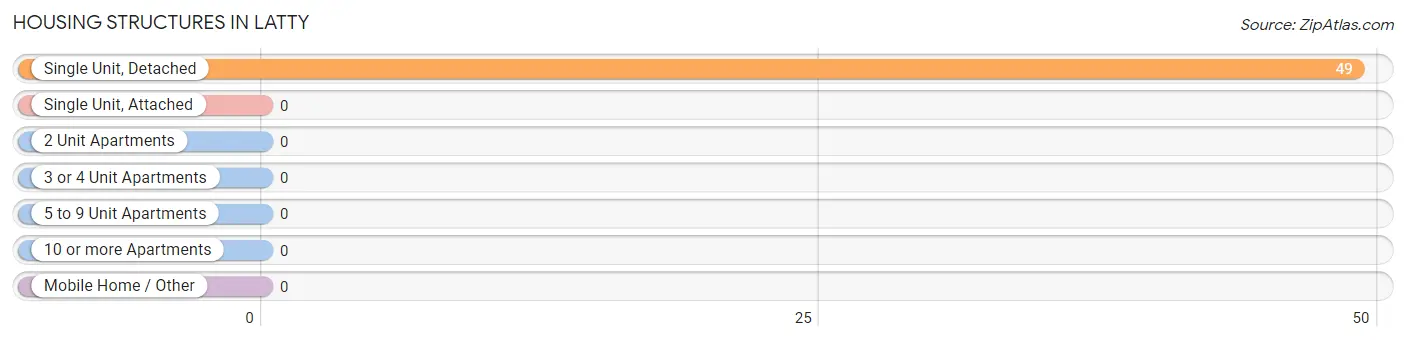
| Structure Type | # Housing Units | % Housing Units |
| Single Unit, Detached | 49 | 100.0% |
| Single Unit, Attached | 0 | 0.0% |
| 2 Unit Apartments | 0 | 0.0% |
| 3 or 4 Unit Apartments | 0 | 0.0% |
| 5 to 9 Unit Apartments | 0 | 0.0% |
| 10 or more Apartments | 0 | 0.0% |
| Mobile Home / Other | 0 | 0.0% |
| Total | 49 | 100.0% |
Housing Structures by Occupancy in Latty
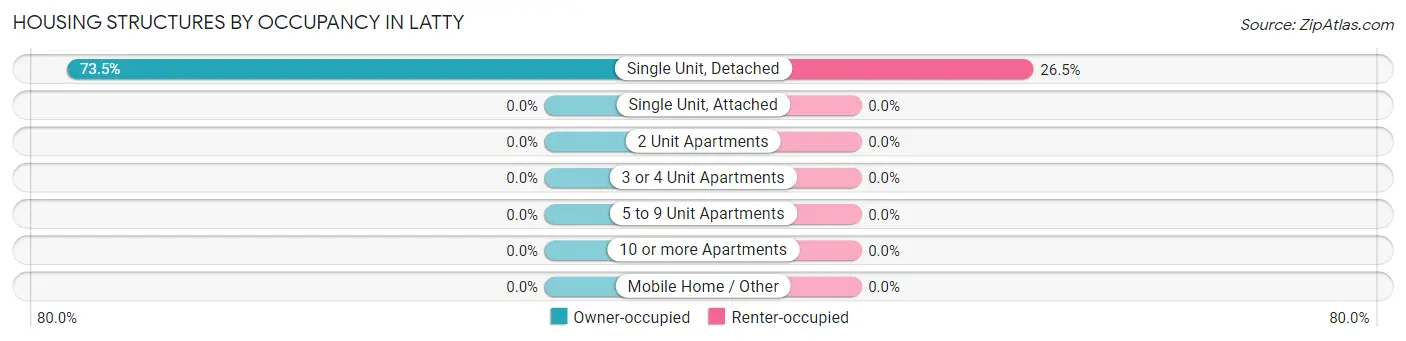
| Structure Type | Owner-occupied | Renter-occupied |
| Single Unit, Detached | 36 (73.5%) | 13 (26.5%) |
| Single Unit, Attached | 0 (0.0%) | 0 (0.0%) |
| 2 Unit Apartments | 0 (0.0%) | 0 (0.0%) |
| 3 or 4 Unit Apartments | 0 (0.0%) | 0 (0.0%) |
| 5 to 9 Unit Apartments | 0 (0.0%) | 0 (0.0%) |
| 10 or more Apartments | 0 (0.0%) | 0 (0.0%) |
| Mobile Home / Other | 0 (0.0%) | 0 (0.0%) |
| Total | 36 (73.5%) | 13 (26.5%) |
Housing Structures by Number of Rooms in Latty
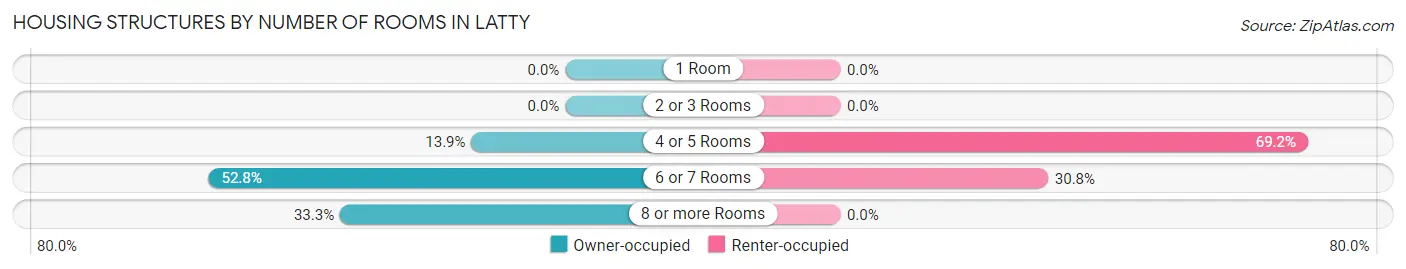
| Number of Rooms | Owner-occupied | Renter-occupied |
| 1 Room | 0 (0.0%) | 0 (0.0%) |
| 2 or 3 Rooms | 0 (0.0%) | 0 (0.0%) |
| 4 or 5 Rooms | 5 (13.9%) | 9 (69.2%) |
| 6 or 7 Rooms | 19 (52.8%) | 4 (30.8%) |
| 8 or more Rooms | 12 (33.3%) | 0 (0.0%) |
| Total | 36 (100.0%) | 13 (100.0%) |
Housing Structure by Heating Type in Latty
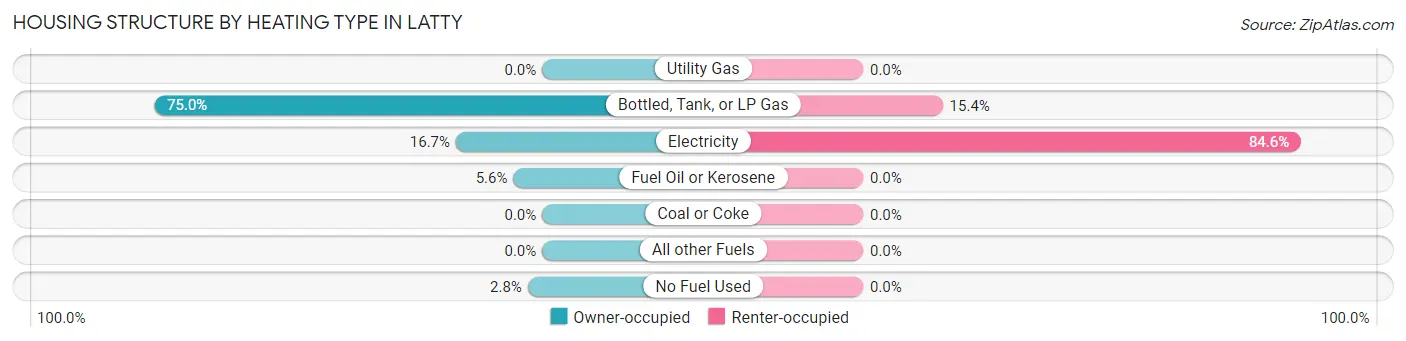
| Heating Type | Owner-occupied | Renter-occupied |
| Utility Gas | 0 (0.0%) | 0 (0.0%) |
| Bottled, Tank, or LP Gas | 27 (75.0%) | 2 (15.4%) |
| Electricity | 6 (16.7%) | 11 (84.6%) |
| Fuel Oil or Kerosene | 2 (5.6%) | 0 (0.0%) |
| Coal or Coke | 0 (0.0%) | 0 (0.0%) |
| All other Fuels | 0 (0.0%) | 0 (0.0%) |
| No Fuel Used | 1 (2.8%) | 0 (0.0%) |
| Total | 36 (100.0%) | 13 (100.0%) |
Household Vehicle Usage in Latty
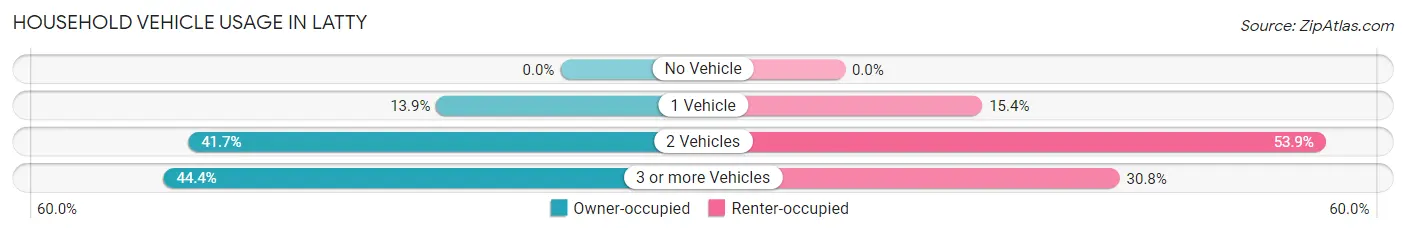
| Vehicles per Household | Owner-occupied | Renter-occupied |
| No Vehicle | 0 (0.0%) | 0 (0.0%) |
| 1 Vehicle | 5 (13.9%) | 2 (15.4%) |
| 2 Vehicles | 15 (41.7%) | 7 (53.8%) |
| 3 or more Vehicles | 16 (44.4%) | 4 (30.8%) |
| Total | 36 (100.0%) | 13 (100.0%) |
Real Estate & Mortgages in Latty
Real Estate and Mortgage Overview in Latty
| Characteristic | Without Mortgage | With Mortgage |
| Housing Units | 14 | 22 |
| Median Property Value | $125,000 | $93,300 |
| Median Household Income | - | - |
| Monthly Housing Costs | $538 | $0 |
| Real Estate Taxes | $1,200 | $0 |
Property Value by Mortgage Status in Latty
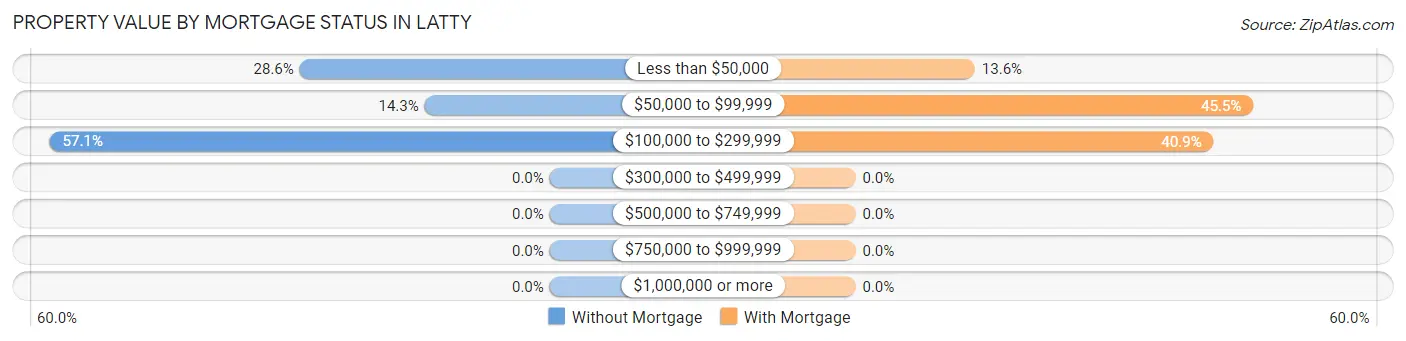
| Property Value | Without Mortgage | With Mortgage |
| Less than $50,000 | 4 (28.6%) | 3 (13.6%) |
| $50,000 to $99,999 | 2 (14.3%) | 10 (45.5%) |
| $100,000 to $299,999 | 8 (57.1%) | 9 (40.9%) |
| $300,000 to $499,999 | 0 (0.0%) | 0 (0.0%) |
| $500,000 to $749,999 | 0 (0.0%) | 0 (0.0%) |
| $750,000 to $999,999 | 0 (0.0%) | 0 (0.0%) |
| $1,000,000 or more | 0 (0.0%) | 0 (0.0%) |
| Total | 14 (100.0%) | 22 (100.0%) |
Household Income by Mortgage Status in Latty
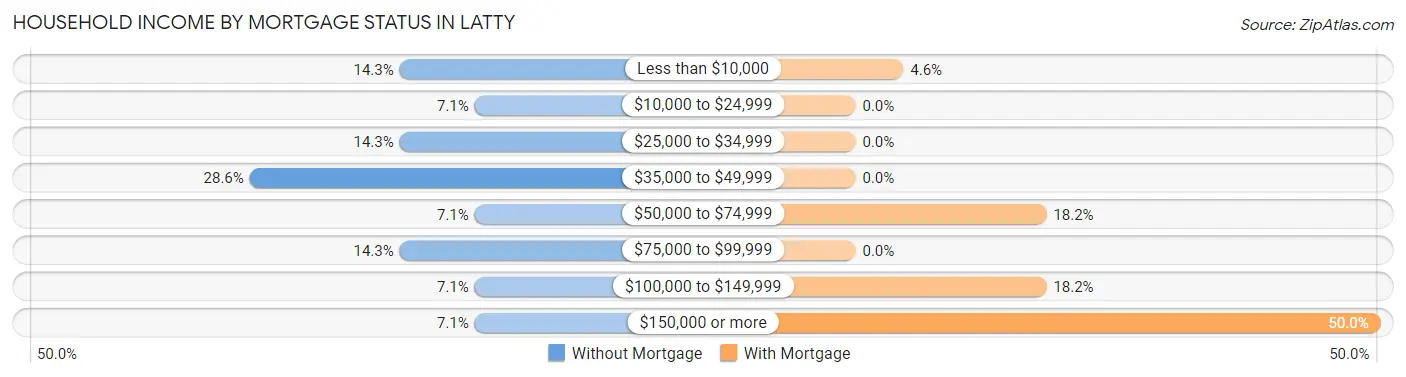
| Household Income | Without Mortgage | With Mortgage |
| Less than $10,000 | 2 (14.3%) | 1 (4.5%) |
| $10,000 to $24,999 | 1 (7.1%) | 0 (0.0%) |
| $25,000 to $34,999 | 2 (14.3%) | 0 (0.0%) |
| $35,000 to $49,999 | 4 (28.6%) | 0 (0.0%) |
| $50,000 to $74,999 | 1 (7.1%) | 4 (18.2%) |
| $75,000 to $99,999 | 2 (14.3%) | 0 (0.0%) |
| $100,000 to $149,999 | 1 (7.1%) | 4 (18.2%) |
| $150,000 or more | 1 (7.1%) | 11 (50.0%) |
| Total | 14 (100.0%) | 22 (100.0%) |
Property Value to Household Income Ratio in Latty
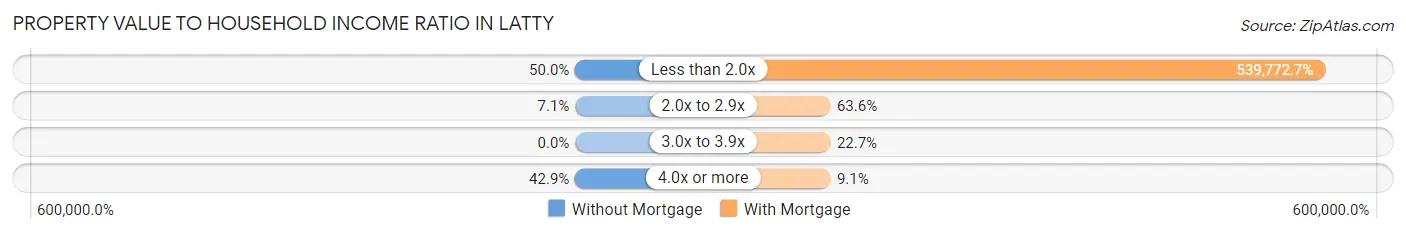
| Value-to-Income Ratio | Without Mortgage | With Mortgage |
| Less than 2.0x | 7 (50.0%) | 118,750 (539,772.7%) |
| 2.0x to 2.9x | 1 (7.1%) | 14 (63.6%) |
| 3.0x to 3.9x | 0 (0.0%) | 5 (22.7%) |
| 4.0x or more | 6 (42.9%) | 2 (9.1%) |
| Total | 14 (100.0%) | 22 (100.0%) |
Real Estate Taxes by Mortgage Status in Latty
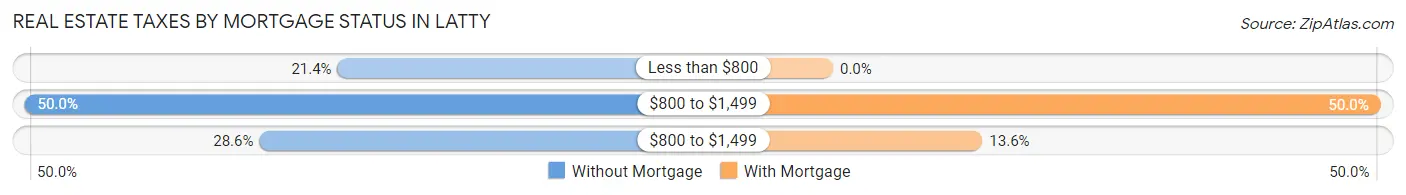
| Property Taxes | Without Mortgage | With Mortgage |
| Less than $800 | 3 (21.4%) | 0 (0.0%) |
| $800 to $1,499 | 7 (50.0%) | 11 (50.0%) |
| $800 to $1,499 | 4 (28.6%) | 3 (13.6%) |
| Total | 14 (100.0%) | 22 (100.0%) |
Health & Disability in Latty
Health Insurance Coverage by Age in Latty
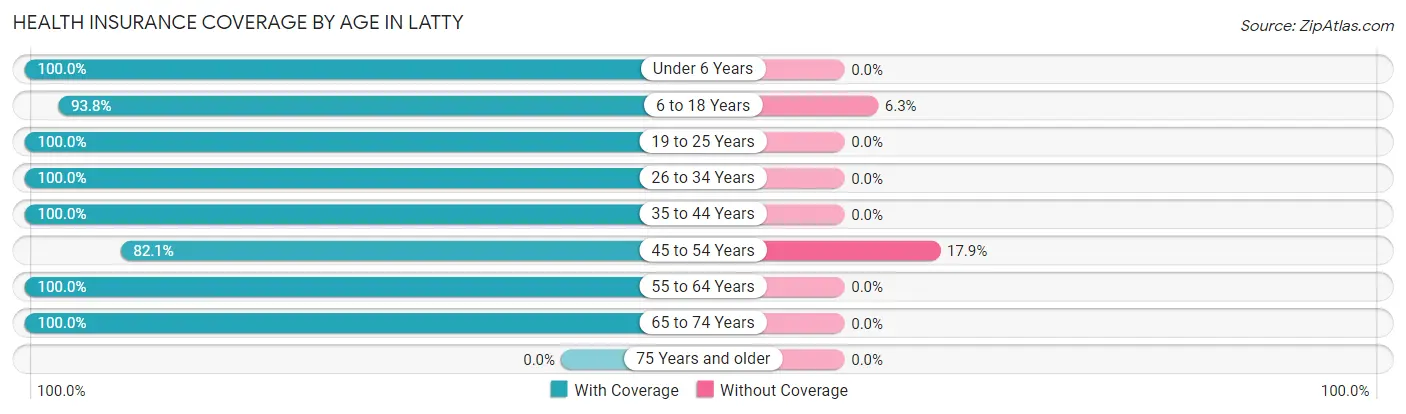
| Age Bracket | With Coverage | Without Coverage |
| Under 6 Years | 2 (100.0%) | 0 (0.0%) |
| 6 to 18 Years | 30 (93.8%) | 2 (6.2%) |
| 19 to 25 Years | 9 (100.0%) | 0 (0.0%) |
| 26 to 34 Years | 10 (100.0%) | 0 (0.0%) |
| 35 to 44 Years | 27 (100.0%) | 0 (0.0%) |
| 45 to 54 Years | 23 (82.1%) | 5 (17.9%) |
| 55 to 64 Years | 19 (100.0%) | 0 (0.0%) |
| 65 to 74 Years | 18 (100.0%) | 0 (0.0%) |
| 75 Years and older | 0 (0.0%) | 0 (0.0%) |
| Total | 138 (95.2%) | 7 (4.8%) |
Health Insurance Coverage by Citizenship Status in Latty
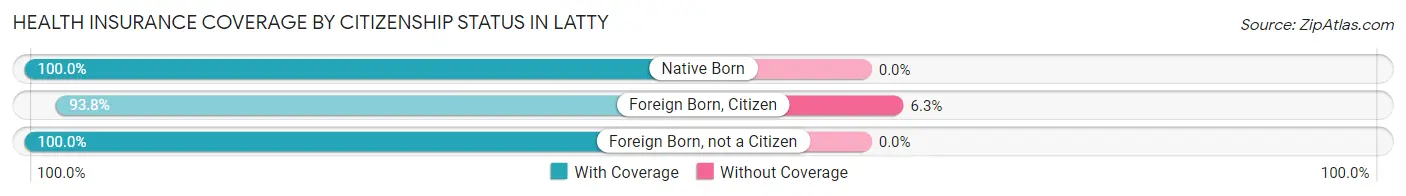
| Citizenship Status | With Coverage | Without Coverage |
| Native Born | 2 (100.0%) | 0 (0.0%) |
| Foreign Born, Citizen | 30 (93.8%) | 2 (6.2%) |
| Foreign Born, not a Citizen | 9 (100.0%) | 0 (0.0%) |
Health Insurance Coverage by Household Income in Latty
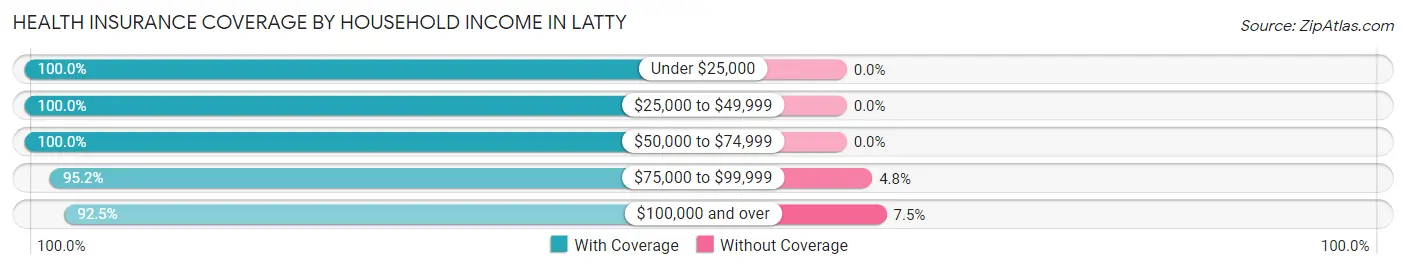
| Household Income | With Coverage | Without Coverage |
| Under $25,000 | 7 (100.0%) | 0 (0.0%) |
| $25,000 to $49,999 | 27 (100.0%) | 0 (0.0%) |
| $50,000 to $74,999 | 2 (100.0%) | 0 (0.0%) |
| $75,000 to $99,999 | 40 (95.2%) | 2 (4.8%) |
| $100,000 and over | 62 (92.5%) | 5 (7.5%) |
Public vs Private Health Insurance Coverage by Age in Latty
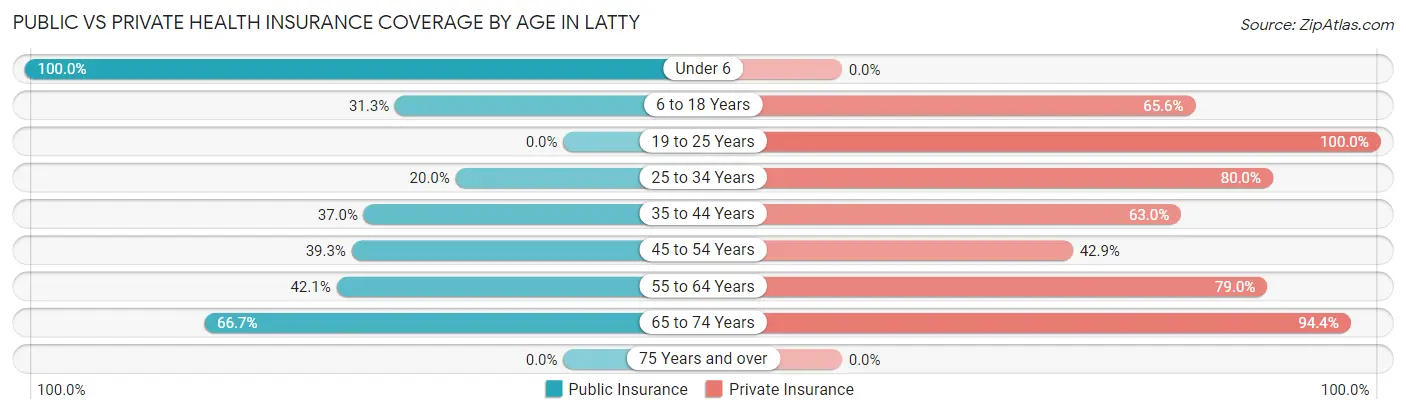
| Age Bracket | Public Insurance | Private Insurance |
| Under 6 | 2 (100.0%) | 0 (0.0%) |
| 6 to 18 Years | 10 (31.2%) | 21 (65.6%) |
| 19 to 25 Years | 0 (0.0%) | 9 (100.0%) |
| 25 to 34 Years | 2 (20.0%) | 8 (80.0%) |
| 35 to 44 Years | 10 (37.0%) | 17 (63.0%) |
| 45 to 54 Years | 11 (39.3%) | 12 (42.9%) |
| 55 to 64 Years | 8 (42.1%) | 15 (78.9%) |
| 65 to 74 Years | 12 (66.7%) | 17 (94.4%) |
| 75 Years and over | 0 (0.0%) | 0 (0.0%) |
| Total | 55 (37.9%) | 99 (68.3%) |
Disability Status by Sex by Age in Latty
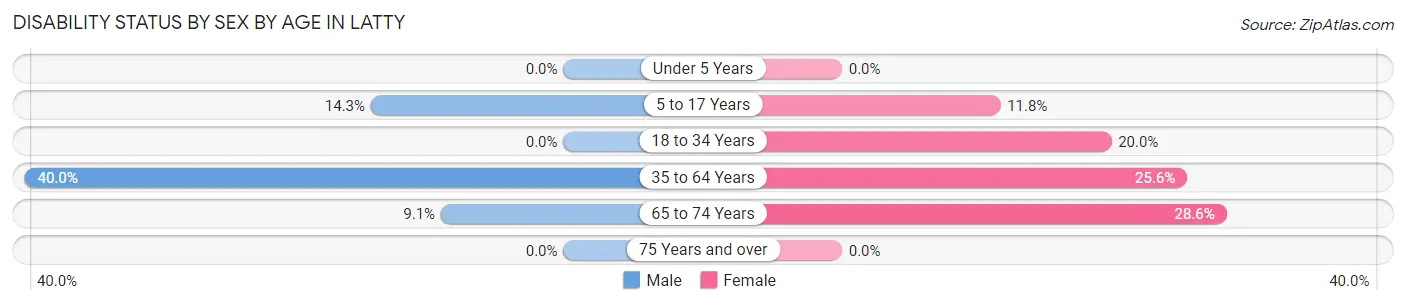
| Age Bracket | Male | Female |
| Under 5 Years | 0 (0.0%) | 0 (0.0%) |
| 5 to 17 Years | 2 (14.3%) | 2 (11.8%) |
| 18 to 34 Years | 0 (0.0%) | 2 (20.0%) |
| 35 to 64 Years | 14 (40.0%) | 10 (25.6%) |
| 65 to 74 Years | 1 (9.1%) | 2 (28.6%) |
| 75 Years and over | 0 (0.0%) | 0 (0.0%) |
Disability Class by Sex by Age in Latty
Disability Class: Hearing Difficulty
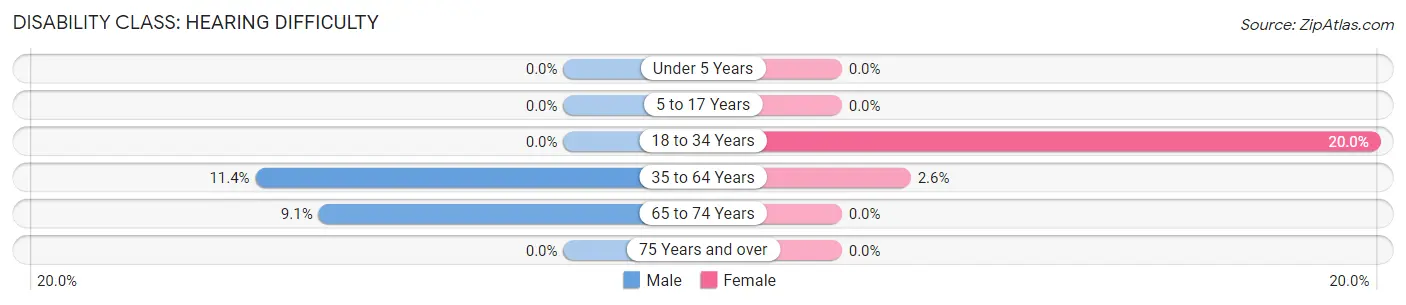
| Age Bracket | Male | Female |
| Under 5 Years | 0 (0.0%) | 0 (0.0%) |
| 5 to 17 Years | 0 (0.0%) | 0 (0.0%) |
| 18 to 34 Years | 0 (0.0%) | 2 (20.0%) |
| 35 to 64 Years | 4 (11.4%) | 1 (2.6%) |
| 65 to 74 Years | 1 (9.1%) | 0 (0.0%) |
| 75 Years and over | 0 (0.0%) | 0 (0.0%) |
Disability Class: Vision Difficulty
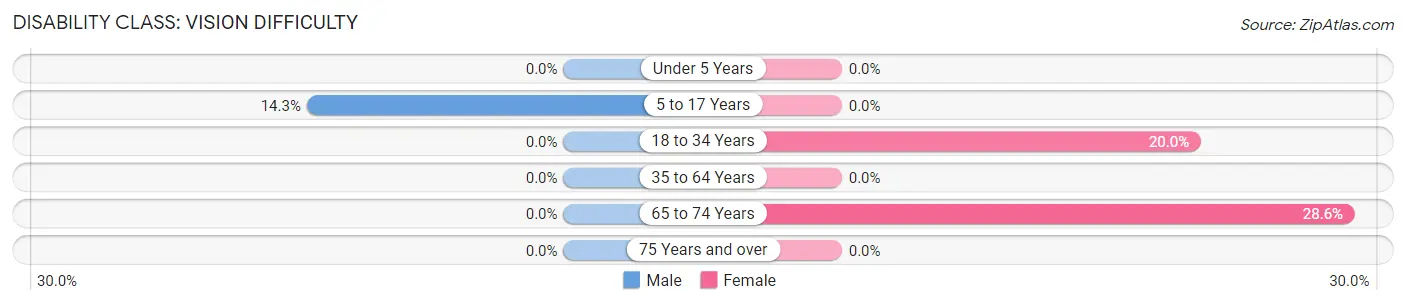
| Age Bracket | Male | Female |
| Under 5 Years | 0 (0.0%) | 0 (0.0%) |
| 5 to 17 Years | 2 (14.3%) | 0 (0.0%) |
| 18 to 34 Years | 0 (0.0%) | 2 (20.0%) |
| 35 to 64 Years | 0 (0.0%) | 0 (0.0%) |
| 65 to 74 Years | 0 (0.0%) | 2 (28.6%) |
| 75 Years and over | 0 (0.0%) | 0 (0.0%) |
Disability Class: Cognitive Difficulty
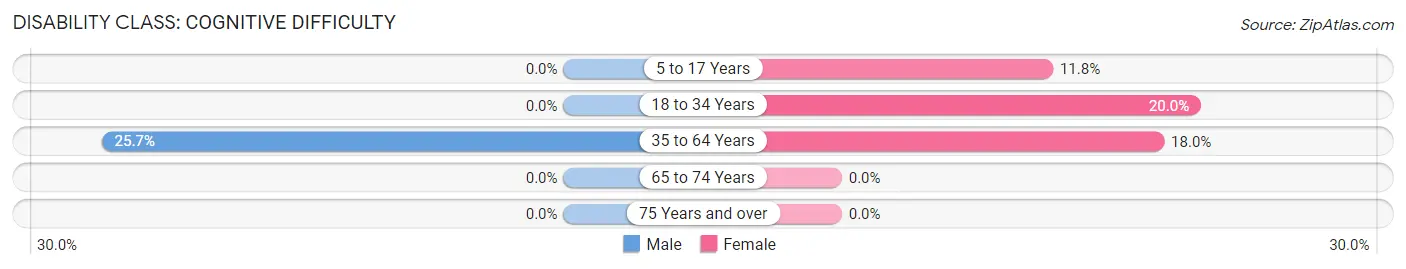
| Age Bracket | Male | Female |
| 5 to 17 Years | 0 (0.0%) | 2 (11.8%) |
| 18 to 34 Years | 0 (0.0%) | 2 (20.0%) |
| 35 to 64 Years | 9 (25.7%) | 7 (17.9%) |
| 65 to 74 Years | 0 (0.0%) | 0 (0.0%) |
| 75 Years and over | 0 (0.0%) | 0 (0.0%) |
Disability Class: Ambulatory Difficulty
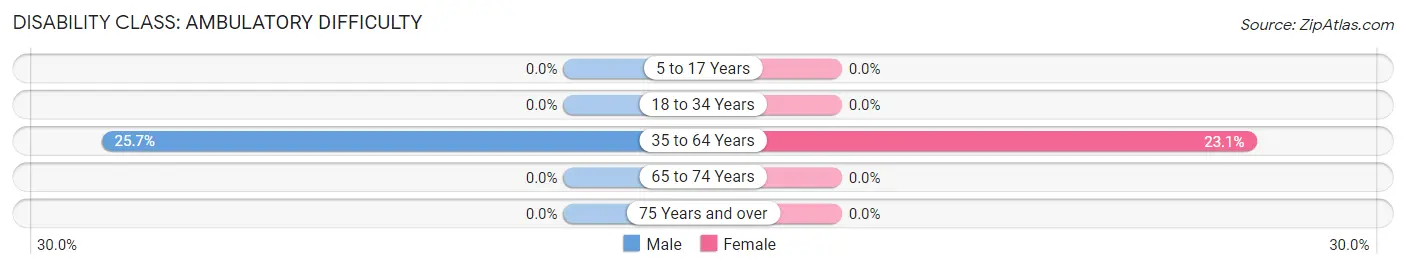
| Age Bracket | Male | Female |
| 5 to 17 Years | 0 (0.0%) | 0 (0.0%) |
| 18 to 34 Years | 0 (0.0%) | 0 (0.0%) |
| 35 to 64 Years | 9 (25.7%) | 9 (23.1%) |
| 65 to 74 Years | 0 (0.0%) | 0 (0.0%) |
| 75 Years and over | 0 (0.0%) | 0 (0.0%) |
Disability Class: Self-Care Difficulty
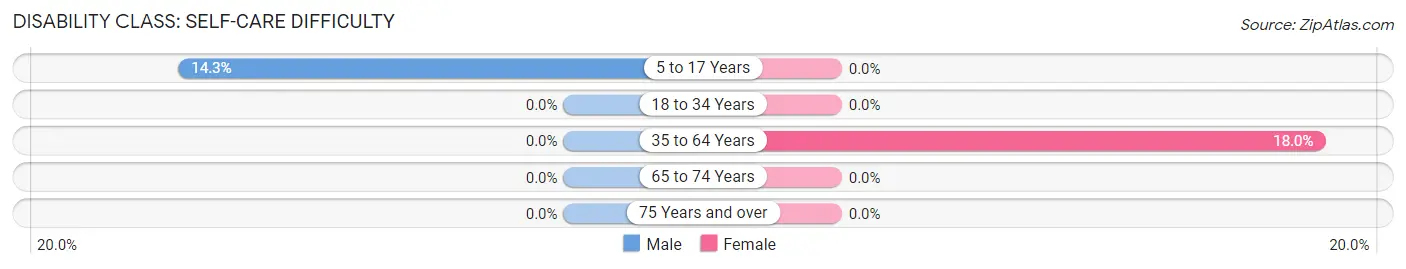
| Age Bracket | Male | Female |
| 5 to 17 Years | 2 (14.3%) | 0 (0.0%) |
| 18 to 34 Years | 0 (0.0%) | 0 (0.0%) |
| 35 to 64 Years | 0 (0.0%) | 7 (17.9%) |
| 65 to 74 Years | 0 (0.0%) | 0 (0.0%) |
| 75 Years and over | 0 (0.0%) | 0 (0.0%) |
Technology Access in Latty
Computing Device Access in Latty
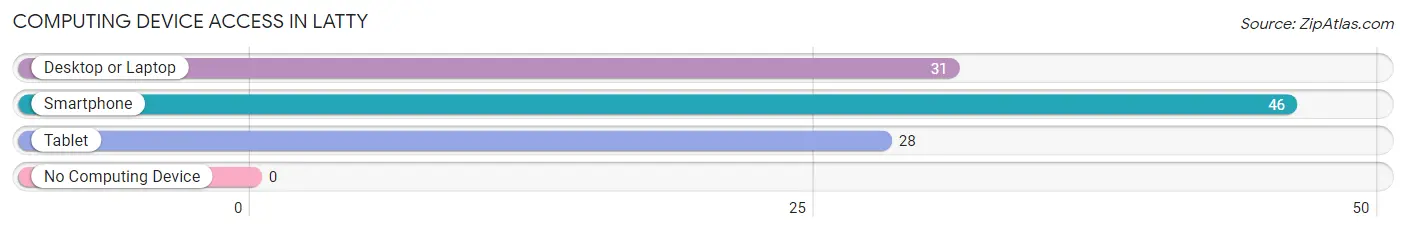
| Device Type | # Households | % Households |
| Desktop or Laptop | 31 | 63.3% |
| Smartphone | 46 | 93.9% |
| Tablet | 28 | 57.1% |
| No Computing Device | 0 | 0.0% |
| Total | 49 | 100.0% |
Internet Access in Latty
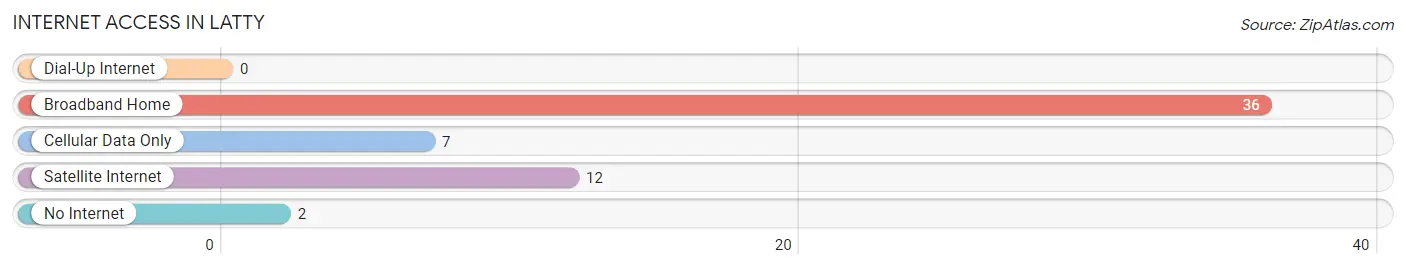
| Internet Type | # Households | % Households |
| Dial-Up Internet | 0 | 0.0% |
| Broadband Home | 36 | 73.5% |
| Cellular Data Only | 7 | 14.3% |
| Satellite Internet | 12 | 24.5% |
| No Internet | 2 | 4.1% |
| Total | 49 | 100.0% |
Latty Summary
Latty is a small village located in Paulding County, Ohio. It is situated in the northwest corner of the state, approximately 30 miles from the city of Toledo. The village has a population of approximately 500 people, and is part of the larger Paulding County area.
History
Latty was founded in 1837 by a group of settlers from Pennsylvania. The village was named after the Latty family, who were among the first settlers. The village was originally a farming community, and the Latty family owned a large portion of the land. The village grew slowly over the years, and by the early 1900s, it had become a small but thriving community.
The village was home to a variety of businesses, including a general store, a blacksmith, a sawmill, and a grist mill. The village also had a post office, a school, and a church. The village was also home to a number of small farms, which provided the community with food and other goods.
Geography
Latty is located in the northwest corner of Ohio, approximately 30 miles from the city of Toledo. The village is situated in a rural area, surrounded by farmland and woodlands. The village is located on the banks of the Auglaize River, which flows through the area. The village is also located near the Paulding County Airport, which provides access to the larger cities in the region.
Economy
Latty’s economy is largely based on agriculture. The village is home to a number of small farms, which produce a variety of crops, including corn, soybeans, wheat, and hay. The village also has a number of small businesses, including a general store, a blacksmith, and a sawmill. The village is also home to a number of small manufacturing businesses, which produce a variety of products, including furniture, clothing, and tools.
Demographics
As of the 2010 census, the population of Latty was 498 people. The village is predominantly white, with a small minority population. The median household income in the village is $41,250, and the median age is 41. The village is home to a number of churches, including the Latty United Methodist Church, the Latty Baptist Church, and the Latty Presbyterian Church.
Latty is a small but vibrant village, with a rich history and a strong sense of community. The village is home to a variety of businesses, churches, and other organizations, which provide the community with a variety of services and amenities. The village is also home to a number of small farms, which provide the community with food and other goods. The village is a great place to live, work, and raise a family.
Common Questions
What is the Total Population of Latty?
Total Population of Latty is 145.
What is the Total Male Population of Latty?
Total Male Population of Latty is 72.
What is the Total Female Population of Latty?
Total Female Population of Latty is 73.
What is the Ratio of Males per 100 Females in Latty?
There are 98.63 Males per 100 Females in Latty.
What is the Ratio of Females per 100 Males in Latty?
There are 101.39 Females per 100 Males in Latty.
What is the Median Population Age in Latty?
Median Population Age in Latty is 38.5 Years.
What is the Average Family Size in Latty
Average Family Size in Latty is 2.9 People.
What is the Average Household Size in Latty
Average Household Size in Latty is 3.0 People.
What is Per Capita Income in Latty?
Per Capita income in Latty is $32,468.
What is the Median Family Income in Latty?
Median Family Income in Latty is $78,929.
What is the Median Household income in Latty?
Median Household Income in Latty is $78,393.
What is Income or Wage Gap in Latty?
Income or Wage Gap in Latty is 58.2%.
Women in Latty earn 41.8 cents for every dollar earned by a man.
What is Inequality or Gini Index in Latty?
Inequality or Gini Index in Latty is 0.32.
How Large is the Labor Force in Latty?
There are 71 People in the Labor Forcein in Latty.
What is the Percentage of People in the Labor Force in Latty?
59.7% of People are in the Labor Force in Latty.