Zip Codes with the Highest Percentage of Population Employed in Arts, Entertainment & Recreation in Columbus, OH
RELATED REPORTS & OPTIONS
Arts, Entertainment & Recreation
Columbus
Compare Zip Codes
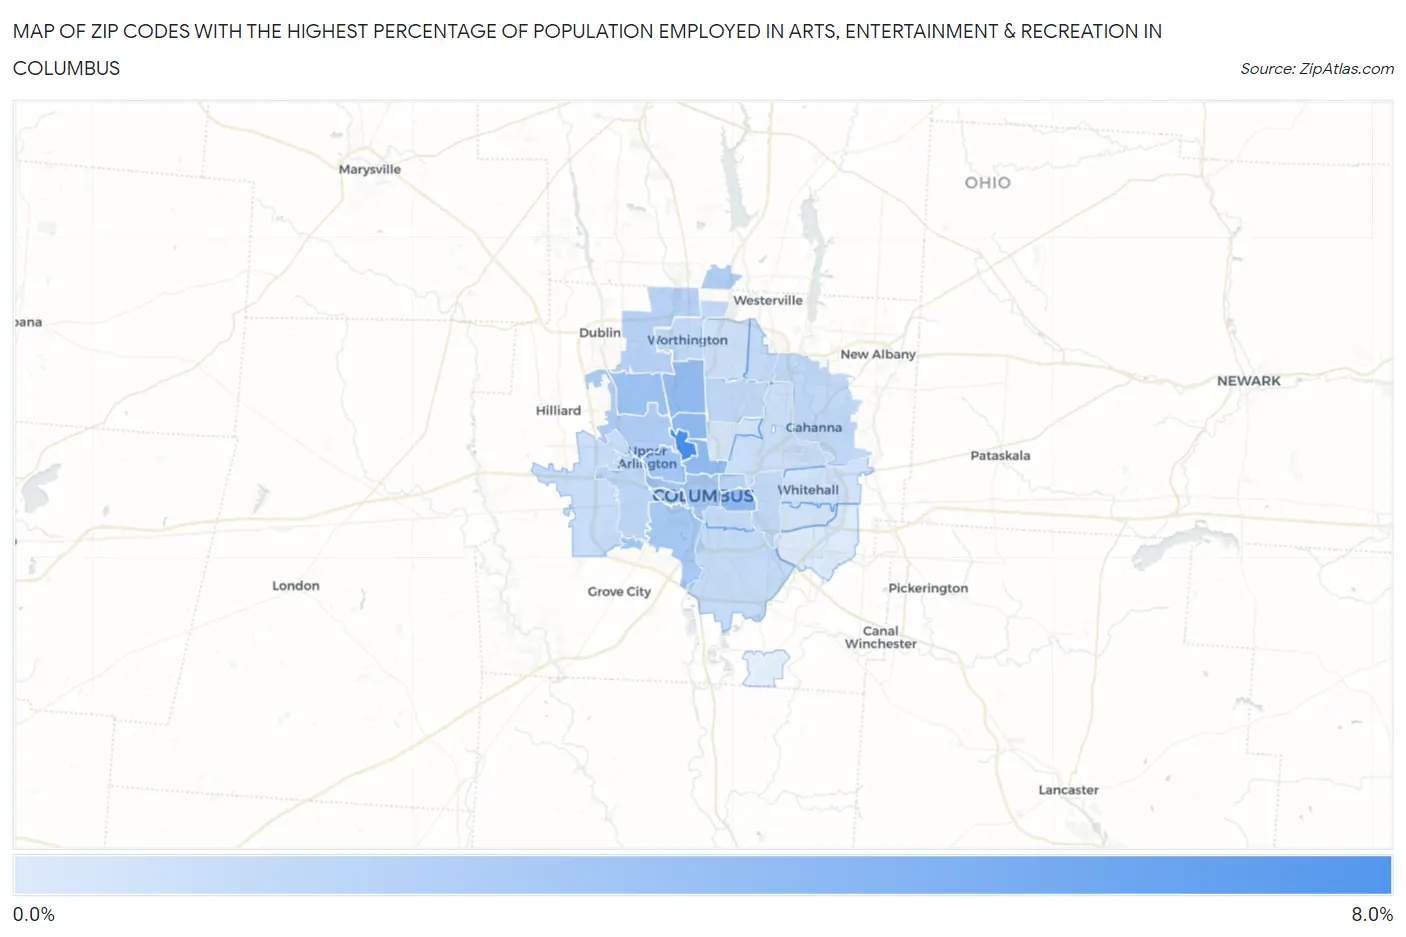
Map of Zip Codes with the Highest Percentage of Population Employed in Arts, Entertainment & Recreation in Columbus
0.0%
8.0%
Zip Codes with the Highest Percentage of Population Employed in Arts, Entertainment & Recreation in Columbus, OH
| Zip Code | % Employed | vs State | vs National | |
| 1. | 43210 | 6.6% | 1.7%(+4.93)#21 | 2.1%(+4.52)#1,455 |
| 2. | 43202 | 3.7% | 1.7%(+2.00)#67 | 2.1%(+1.60)#3,809 |
| 3. | 43201 | 3.6% | 1.7%(+1.94)#69 | 2.1%(+1.54)#3,914 |
| 4. | 43205 | 3.6% | 1.7%(+1.90)#72 | 2.1%(+1.50)#3,985 |
| 5. | 43214 | 3.6% | 1.7%(+1.88)#76 | 2.1%(+1.48)#4,017 |
| 6. | 43220 | 3.1% | 1.7%(+1.40)#102 | 2.1%(+0.999)#5,123 |
| 7. | 43212 | 2.9% | 1.7%(+1.25)#111 | 2.1%(+0.843)#5,576 |
| 8. | 43215 | 2.9% | 1.7%(+1.18)#114 | 2.1%(+0.777)#5,773 |
| 9. | 43223 | 2.8% | 1.7%(+1.12)#121 | 2.1%(+0.720)#5,988 |
| 10. | 43222 | 2.6% | 1.7%(+0.906)#158 | 2.1%(+0.502)#6,821 |
| 11. | 43240 | 2.5% | 1.7%(+0.785)#174 | 2.1%(+0.381)#7,340 |
| 12. | 43221 | 2.4% | 1.7%(+0.696)#195 | 2.1%(+0.292)#7,771 |
| 13. | 43235 | 2.1% | 1.7%(+0.444)#231 | 2.1%(+0.040)#9,088 |
| 14. | 43203 | 2.0% | 1.7%(+0.333)#256 | 2.1%(-0.071)#9,706 |
| 15. | 43204 | 1.8% | 1.7%(+0.168)#296 | 2.1%(-0.237)#10,716 |
| 16. | 43230 | 1.8% | 1.7%(+0.125)#313 | 2.1%(-0.279)#10,994 |
| 17. | 43224 | 1.8% | 1.7%(+0.109)#316 | 2.1%(-0.295)#11,098 |
| 18. | 43209 | 1.7% | 1.7%(+0.051)#335 | 2.1%(-0.353)#11,526 |
| 19. | 43085 | 1.7% | 1.7%(+0.030)#341 | 2.1%(-0.374)#11,679 |
| 20. | 43206 | 1.6% | 1.7%(-0.034)#361 | 2.1%(-0.438)#12,132 |
| 21. | 43207 | 1.6% | 1.7%(-0.056)#369 | 2.1%(-0.460)#12,274 |
| 22. | 43231 | 1.6% | 1.7%(-0.064)#372 | 2.1%(-0.468)#12,342 |
| 23. | 43228 | 1.5% | 1.7%(-0.163)#402 | 2.1%(-0.567)#13,139 |
| 24. | 43219 | 1.3% | 1.7%(-0.370)#473 | 2.1%(-0.775)#14,657 |
| 25. | 43229 | 1.2% | 1.7%(-0.437)#499 | 2.1%(-0.841)#15,171 |
| 26. | 43213 | 1.1% | 1.7%(-0.550)#534 | 2.1%(-0.954)#16,019 |
| 27. | 43227 | 1.1% | 1.7%(-0.592)#548 | 2.1%(-0.996)#16,351 |
| 28. | 43211 | 0.98% | 1.7%(-0.694)#583 | 2.1%(-1.10)#17,084 |
| 29. | 43232 | 0.72% | 1.7%(-0.956)#672 | 2.1%(-1.36)#18,964 |
1
Common Questions
What are the Top 10 Zip Codes with the Highest Percentage of Population Employed in Arts, Entertainment & Recreation in Columbus, OH?
Top 10 Zip Codes with the Highest Percentage of Population Employed in Arts, Entertainment & Recreation in Columbus, OH are:
What zip code has the Highest Percentage of Population Employed in Arts, Entertainment & Recreation in Columbus, OH?
43210 has the Highest Percentage of Population Employed in Arts, Entertainment & Recreation in Columbus, OH with 6.6%.
What is the Percentage of Population Employed in Arts, Entertainment & Recreation in Columbus, OH?
Percentage of Population Employed in Arts, Entertainment & Recreation in Columbus is 2.1%.
What is the Percentage of Population Employed in Arts, Entertainment & Recreation in Ohio?
Percentage of Population Employed in Arts, Entertainment & Recreation in Ohio is 1.7%.
What is the Percentage of Population Employed in Arts, Entertainment & Recreation in the United States?
Percentage of Population Employed in Arts, Entertainment & Recreation in the United States is 2.1%.