Cities with the Highest Percentage of Population Employed in Transportation & Warehousing in Ohio
RELATED REPORTS & OPTIONS
Transportation & Warehousing
Ohio
Compare Cities
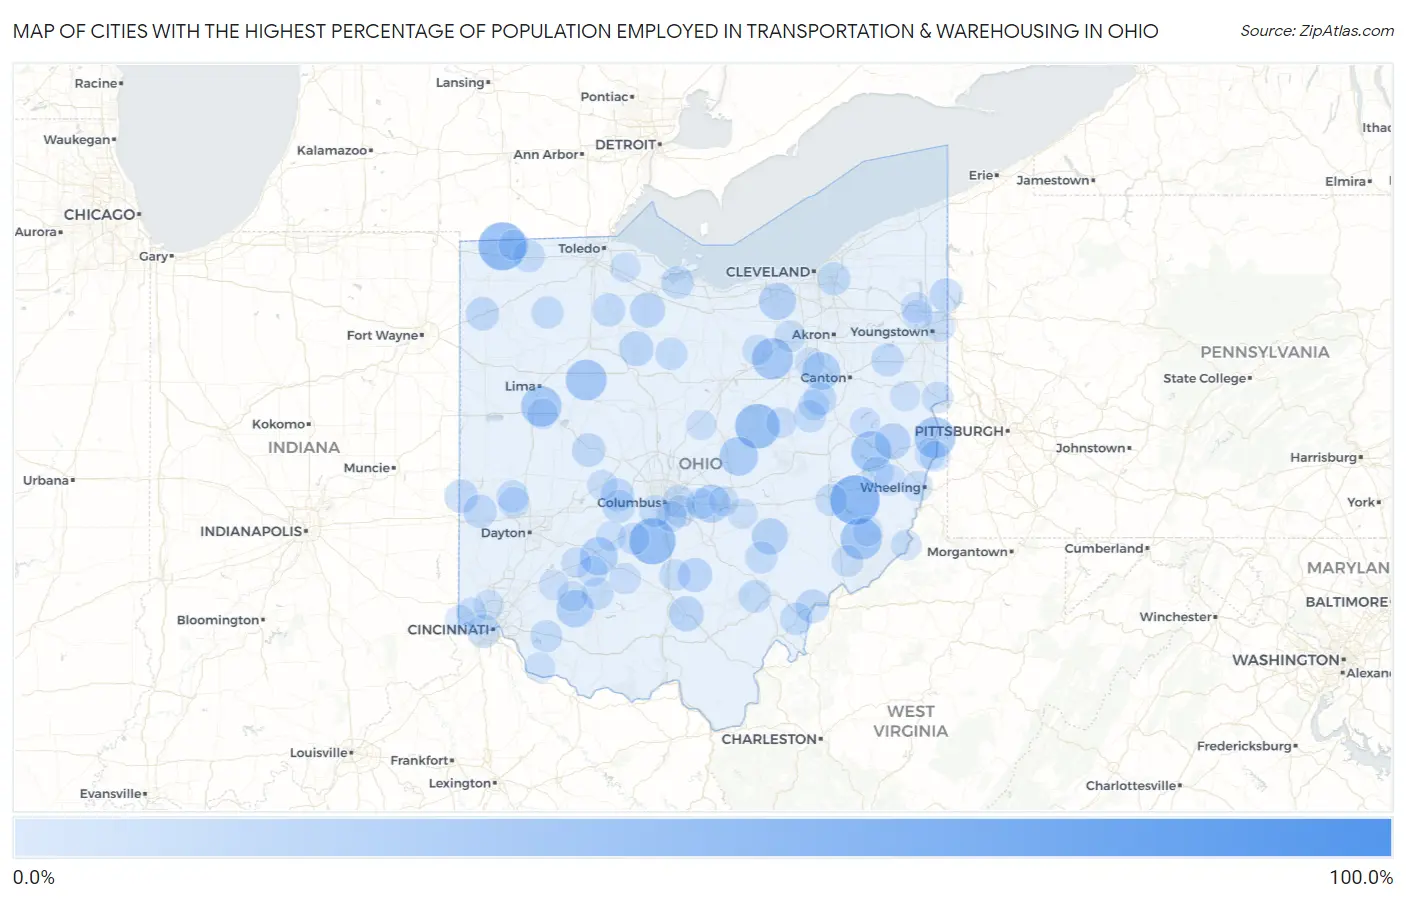
Map of Cities with the Highest Percentage of Population Employed in Transportation & Warehousing in Ohio
0.0%
100.0%
Cities with the Highest Percentage of Population Employed in Transportation & Warehousing in Ohio
| City | % Employed | vs State | vs National | |
| 1. | Bloomingville | 100.0% | 4.9%(+95.1)#1 | 4.9%(+95.1)#12 |
| 2. | Salesville | 53.1% | 4.9%(+48.2)#2 | 4.9%(+48.1)#101 |
| 3. | Alvordton | 50.0% | 4.9%(+45.1)#3 | 4.9%(+45.1)#113 |
| 4. | Darbyville | 46.2% | 4.9%(+41.2)#4 | 4.9%(+41.2)#155 |
| 5. | Gann Brinkhaven | 42.7% | 4.9%(+37.7)#5 | 4.9%(+37.7)#178 |
| 6. | Stafford | 35.7% | 4.9%(+30.8)#6 | 4.9%(+30.8)#249 |
| 7. | Congress | 35.5% | 4.9%(+30.5)#7 | 4.9%(+30.5)#253 |
| 8. | Pottery Addition | 35.1% | 4.9%(+30.1)#8 | 4.9%(+30.1)#262 |
| 9. | New Haven Cdp Huron County | 35.0% | 4.9%(+30.1)#9 | 4.9%(+30.1)#264 |
| 10. | Dola | 34.8% | 4.9%(+29.8)#10 | 4.9%(+29.8)#266 |
| 11. | Uniopolis | 34.0% | 4.9%(+29.0)#11 | 4.9%(+29.0)#281 |
| 12. | Deersville | 33.3% | 4.9%(+28.4)#12 | 4.9%(+28.4)#302 |
| 13. | Martinsburg | 30.6% | 4.9%(+25.7)#13 | 4.9%(+25.7)#353 |
| 14. | Milledgeville | 28.8% | 4.9%(+23.9)#14 | 4.9%(+23.9)#396 |
| 15. | Kirkersville | 28.4% | 4.9%(+23.4)#15 | 4.9%(+23.4)#414 |
| 16. | North Lawrence | 27.8% | 4.9%(+22.9)#16 | 4.9%(+22.9)#434 |
| 17. | Lynchburg | 27.3% | 4.9%(+22.4)#17 | 4.9%(+22.4)#448 |
| 18. | Eaton Estates | 26.6% | 4.9%(+21.7)#18 | 4.9%(+21.7)#473 |
| 19. | Reno Beach | 25.3% | 4.9%(+20.4)#19 | 4.9%(+20.4)#524 |
| 20. | Rose Farm | 25.0% | 4.9%(+20.1)#20 | 4.9%(+20.1)#543 |
| 21. | Jewett | 24.4% | 4.9%(+19.4)#21 | 4.9%(+19.4)#568 |
| 22. | Old Fort | 22.4% | 4.9%(+17.5)#22 | 4.9%(+17.5)#661 |
| 23. | Richmond Dale | 22.1% | 4.9%(+17.2)#23 | 4.9%(+17.2)#683 |
| 24. | Mccutchenville | 21.8% | 4.9%(+16.8)#24 | 4.9%(+16.8)#703 |
| 25. | Laurelville | 20.5% | 4.9%(+15.5)#25 | 4.9%(+15.5)#796 |
| 26. | Little Hocking | 19.9% | 4.9%(+14.9)#26 | 4.9%(+14.9)#844 |
| 27. | Valley Hi | 19.5% | 4.9%(+14.6)#27 | 4.9%(+14.6)#870 |
| 28. | Delshire | 19.2% | 4.9%(+14.3)#28 | 4.9%(+14.3)#883 |
| 29. | Hollansburg | 19.2% | 4.9%(+14.3)#29 | 4.9%(+14.3)#884 |
| 30. | West Manchester | 18.9% | 4.9%(+14.0)#30 | 4.9%(+14.0)#917 |
| 31. | Orangeville | 18.9% | 4.9%(+14.0)#31 | 4.9%(+13.9)#923 |
| 32. | Cecil | 18.8% | 4.9%(+13.8)#32 | 4.9%(+13.8)#933 |
| 33. | Plumwood | 18.7% | 4.9%(+13.8)#33 | 4.9%(+13.8)#940 |
| 34. | Highland Hills | 18.6% | 4.9%(+13.6)#34 | 4.9%(+13.6)#947 |
| 35. | West Millgrove | 18.5% | 4.9%(+13.5)#35 | 4.9%(+13.5)#966 |
| 36. | Lafayette | 17.8% | 4.9%(+12.9)#36 | 4.9%(+12.9)#1,049 |
| 37. | Maple Ridge | 17.8% | 4.9%(+12.8)#37 | 4.9%(+12.8)#1,056 |
| 38. | Wilmot | 17.7% | 4.9%(+12.8)#38 | 4.9%(+12.7)#1,062 |
| 39. | New Marshfield | 17.6% | 4.9%(+12.7)#39 | 4.9%(+12.7)#1,068 |
| 40. | Tuppers Plains | 17.2% | 4.9%(+12.3)#40 | 4.9%(+12.3)#1,121 |
| 41. | Whites Landing | 17.2% | 4.9%(+12.3)#41 | 4.9%(+12.3)#1,126 |
| 42. | Walnut Creek | 16.8% | 4.9%(+11.9)#42 | 4.9%(+11.9)#1,199 |
| 43. | Hemlock | 16.7% | 4.9%(+11.7)#43 | 4.9%(+11.7)#1,217 |
| 44. | Tedrow | 16.7% | 4.9%(+11.7)#44 | 4.9%(+11.7)#1,218 |
| 45. | New Springfield | 16.5% | 4.9%(+11.6)#45 | 4.9%(+11.6)#1,250 |
| 46. | Whitehall | 16.5% | 4.9%(+11.6)#46 | 4.9%(+11.6)#1,260 |
| 47. | Highland | 16.4% | 4.9%(+11.5)#47 | 4.9%(+11.5)#1,275 |
| 48. | Chatfield | 16.4% | 4.9%(+11.5)#48 | 4.9%(+11.4)#1,282 |
| 49. | Hamler | 16.3% | 4.9%(+11.4)#49 | 4.9%(+11.4)#1,287 |
| 50. | Ludlow Falls | 16.3% | 4.9%(+11.3)#50 | 4.9%(+11.3)#1,305 |
| 51. | Williamsburg | 16.2% | 4.9%(+11.3)#51 | 4.9%(+11.3)#1,312 |
| 52. | Byesville | 16.1% | 4.9%(+11.1)#52 | 4.9%(+11.1)#1,330 |
| 53. | Urbancrest | 15.9% | 4.9%(+11.0)#53 | 4.9%(+11.0)#1,343 |
| 54. | Holloway | 15.9% | 4.9%(+11.0)#54 | 4.9%(+10.9)#1,351 |
| 55. | Mount Sterling | 15.6% | 4.9%(+10.7)#55 | 4.9%(+10.7)#1,403 |
| 56. | Blacklick Estates | 15.6% | 4.9%(+10.7)#56 | 4.9%(+10.6)#1,415 |
| 57. | North Industry | 15.6% | 4.9%(+10.6)#57 | 4.9%(+10.6)#1,416 |
| 58. | Newport Cdp Washington County | 15.6% | 4.9%(+10.6)#58 | 4.9%(+10.6)#1,417 |
| 59. | Lower Salem | 15.4% | 4.9%(+10.4)#59 | 4.9%(+10.4)#1,455 |
| 60. | Chippewa Lake | 15.0% | 4.9%(+10.0)#60 | 4.9%(+10.0)#1,545 |
| 61. | Kingston | 14.7% | 4.9%(+9.75)#61 | 4.9%(+9.74)#1,611 |
| 62. | Glenmoor | 14.6% | 4.9%(+9.71)#62 | 4.9%(+9.70)#1,622 |
| 63. | Suffield | 14.3% | 4.9%(+9.38)#63 | 4.9%(+9.37)#1,696 |
| 64. | West Milton | 14.2% | 4.9%(+9.24)#64 | 4.9%(+9.23)#1,756 |
| 65. | Good Hope | 14.1% | 4.9%(+9.18)#65 | 4.9%(+9.17)#1,765 |
| 66. | Lafferty | 14.1% | 4.9%(+9.17)#66 | 4.9%(+9.16)#1,769 |
| 67. | Maplewood Park | 14.0% | 4.9%(+9.08)#67 | 4.9%(+9.07)#1,788 |
| 68. | New Alexandria | 13.8% | 4.9%(+8.88)#68 | 4.9%(+8.87)#1,839 |
| 69. | Winesburg | 13.8% | 4.9%(+8.84)#69 | 4.9%(+8.83)#1,857 |
| 70. | Obetz | 13.7% | 4.9%(+8.77)#70 | 4.9%(+8.76)#1,871 |
| 71. | St Johns | 13.4% | 4.9%(+8.50)#71 | 4.9%(+8.49)#1,939 |
| 72. | Morgandale | 13.4% | 4.9%(+8.46)#72 | 4.9%(+8.45)#1,948 |
| 73. | Brilliant | 13.3% | 4.9%(+8.40)#73 | 4.9%(+8.39)#1,963 |
| 74. | Cinnamon Lake | 13.2% | 4.9%(+8.24)#74 | 4.9%(+8.23)#2,022 |
| 75. | Fayette | 13.2% | 4.9%(+8.24)#75 | 4.9%(+8.23)#2,025 |
| 76. | Hannibal | 13.1% | 4.9%(+8.18)#76 | 4.9%(+8.17)#2,043 |
| 77. | Martinsville | 13.0% | 4.9%(+8.11)#77 | 4.9%(+8.10)#2,064 |
| 78. | Wolfhurst | 13.0% | 4.9%(+8.10)#78 | 4.9%(+8.09)#2,078 |
| 79. | Woodsdale | 13.0% | 4.9%(+8.09)#79 | 4.9%(+8.08)#2,082 |
| 80. | Sabina | 13.0% | 4.9%(+8.07)#80 | 4.9%(+8.06)#2,086 |
| 81. | Port William | 12.9% | 4.9%(+7.94)#81 | 4.9%(+7.92)#2,128 |
| 82. | Etna | 12.8% | 4.9%(+7.88)#82 | 4.9%(+7.86)#2,146 |
| 83. | Mechanicsburg | 12.8% | 4.9%(+7.86)#83 | 4.9%(+7.85)#2,155 |
| 84. | Sherrodsville | 12.8% | 4.9%(+7.82)#84 | 4.9%(+7.81)#2,168 |
| 85. | Killbuck | 12.7% | 4.9%(+7.81)#85 | 4.9%(+7.80)#2,173 |
| 86. | Marshallville | 12.7% | 4.9%(+7.78)#86 | 4.9%(+7.77)#2,180 |
| 87. | New Burlington | 12.7% | 4.9%(+7.74)#87 | 4.9%(+7.73)#2,191 |
| 88. | Clarksville | 12.5% | 4.9%(+7.56)#88 | 4.9%(+7.55)#2,241 |
| 89. | Glenford | 12.5% | 4.9%(+7.56)#89 | 4.9%(+7.55)#2,250 |
| 90. | Chesterville | 12.5% | 4.9%(+7.56)#90 | 4.9%(+7.55)#2,254 |
| 91. | Miamitown | 12.5% | 4.9%(+7.52)#91 | 4.9%(+7.51)#2,287 |
| 92. | Felicity | 12.4% | 4.9%(+7.48)#92 | 4.9%(+7.47)#2,299 |
| 93. | Midway | 12.4% | 4.9%(+7.45)#93 | 4.9%(+7.44)#2,307 |
| 94. | Lewisville | 12.4% | 4.9%(+7.42)#94 | 4.9%(+7.41)#2,322 |
| 95. | Elizabethtown | 12.3% | 4.9%(+7.38)#95 | 4.9%(+7.37)#2,338 |
| 96. | Bolindale | 12.3% | 4.9%(+7.32)#96 | 4.9%(+7.31)#2,362 |
| 97. | Summitville | 12.2% | 4.9%(+7.29)#97 | 4.9%(+7.28)#2,383 |
| 98. | Bidwell | 12.1% | 4.9%(+7.21)#98 | 4.9%(+7.20)#2,409 |
| 99. | Genoa | 12.0% | 4.9%(+7.08)#99 | 4.9%(+7.06)#2,455 |
| 100. | Hebron | 12.0% | 4.9%(+7.05)#100 | 4.9%(+7.04)#2,471 |
Common Questions
What are the Top 10 Cities with the Highest Percentage of Population Employed in Transportation & Warehousing in Ohio?
Top 10 Cities with the Highest Percentage of Population Employed in Transportation & Warehousing in Ohio are:
#1
53.1%
#2
50.0%
#3
46.2%
#4
42.7%
#5
35.7%
#6
35.5%
#7
35.1%
#8
34.8%
#9
34.0%
#10
33.3%
What city has the Highest Percentage of Population Employed in Transportation & Warehousing in Ohio?
Salesville has the Highest Percentage of Population Employed in Transportation & Warehousing in Ohio with 53.1%.
What is the Percentage of Population Employed in Transportation & Warehousing in the State of Ohio?
Percentage of Population Employed in Transportation & Warehousing in Ohio is 4.9%.
What is the Percentage of Population Employed in Transportation & Warehousing in the United States?
Percentage of Population Employed in Transportation & Warehousing in the United States is 4.9%.