Cities with the Highest Percentage of Population Taking Public Transit to Work in Ohio
RELATED REPORTS & OPTIONS
Public Transit
Ohio
Compare Cities
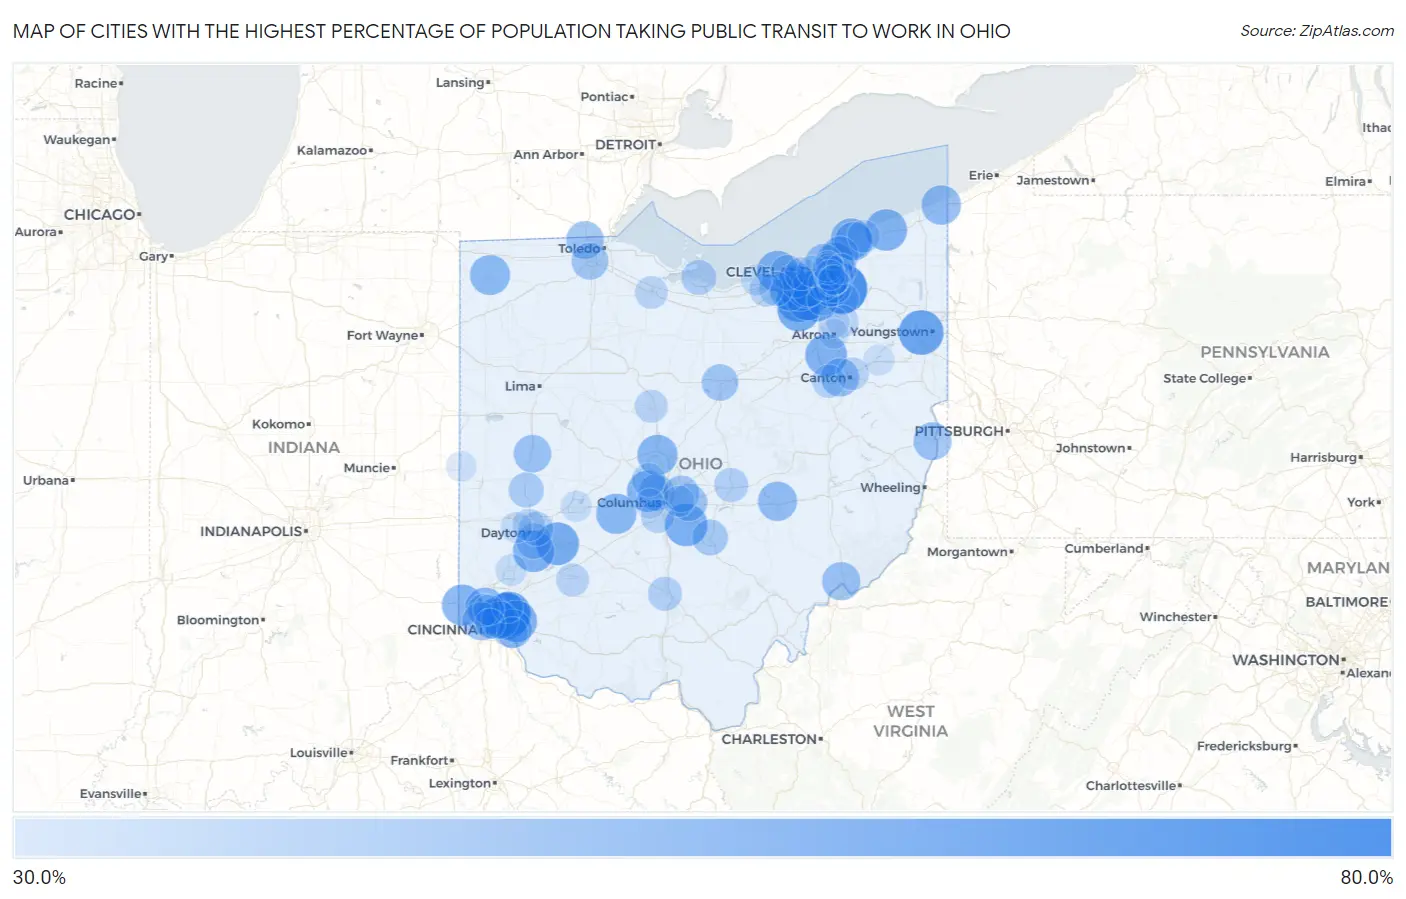
Map of Cities with the Highest Percentage of Population Taking Public Transit to Work in Ohio
0.0%
80.0%
Cities with the Highest Percentage of Population Taking Public Transit to Work in Ohio
| City | % Public Transit | vs State | vs National | |
| 1. | Solon | 75.1% | 36.7%(+38.4)#1 | 38.5%(+36.6)#4 |
| 2. | Silverton | 67.4% | 36.7%(+30.7)#2 | 38.5%(+28.9)#22 |
| 3. | Austintown | 64.9% | 36.7%(+28.2)#3 | 38.5%(+26.4)#54 |
| 4. | Kenwood | 64.4% | 36.7%(+27.7)#4 | 38.5%(+25.9)#63 |
| 5. | Strongsville | 63.5% | 36.7%(+26.8)#5 | 38.5%(+25.0)#75 |
| 6. | Broadview Heights | 61.4% | 36.7%(+24.7)#6 | 38.5%(+22.9)#121 |
| 7. | Xenia | 61.1% | 36.7%(+24.4)#7 | 38.5%(+22.6)#128 |
| 8. | Brunswick | 60.7% | 36.7%(+24.0)#8 | 38.5%(+22.2)#140 |
| 9. | Lithopolis | 60.5% | 36.7%(+23.8)#9 | 38.5%(+22.0)#150 |
| 10. | New Franklin | 58.6% | 36.7%(+21.9)#10 | 38.5%(+20.1)#215 |
| 11. | Centerville | 58.3% | 36.7%(+21.6)#11 | 38.5%(+19.8)#226 |
| 12. | Madison | 58.3% | 36.7%(+21.6)#12 | 38.5%(+19.8)#232 |
| 13. | Terrace Park | 58.3% | 36.7%(+21.6)#13 | 38.5%(+19.8)#237 |
| 14. | Brook Park | 57.9% | 36.7%(+21.2)#14 | 38.5%(+19.4)#263 |
| 15. | Hilliard | 57.4% | 36.7%(+20.7)#15 | 38.5%(+18.9)#287 |
| 16. | Harrison | 57.3% | 36.7%(+20.6)#16 | 38.5%(+18.8)#296 |
| 17. | Avon Lake | 57.1% | 36.7%(+20.4)#17 | 38.5%(+18.6)#304 |
| 18. | North Royalton | 57.0% | 36.7%(+20.3)#18 | 38.5%(+18.5)#311 |
| 19. | Mentor On The Lake | 56.7% | 36.7%(+20.0)#19 | 38.5%(+18.2)#328 |
| 20. | St Bernard | 56.5% | 36.7%(+19.8)#20 | 38.5%(+18.0)#337 |
| 21. | Delaware | 55.9% | 36.7%(+19.2)#21 | 38.5%(+17.4)#382 |
| 22. | London | 55.5% | 36.7%(+18.8)#22 | 38.5%(+17.0)#410 |
| 23. | Bryan | 55.3% | 36.7%(+18.6)#23 | 38.5%(+16.8)#425 |
| 24. | Middleburg Heights | 54.4% | 36.7%(+17.7)#24 | 38.5%(+15.9)#485 |
| 25. | Northbrook | 54.4% | 36.7%(+17.7)#25 | 38.5%(+15.9)#487 |
| 26. | Conneaut | 53.7% | 36.7%(+17.0)#26 | 38.5%(+15.2)#542 |
| 27. | Zanesville | 53.4% | 36.7%(+16.7)#27 | 38.5%(+14.9)#565 |
| 28. | Olmsted Falls | 53.2% | 36.7%(+16.5)#28 | 38.5%(+14.7)#594 |
| 29. | Dry Run | 52.4% | 36.7%(+15.7)#29 | 38.5%(+13.9)#661 |
| 30. | Mentor | 52.1% | 36.7%(+15.4)#30 | 38.5%(+13.6)#678 |
| 31. | Bedford | 51.9% | 36.7%(+15.2)#31 | 38.5%(+13.4)#695 |
| 32. | Parma Heights | 51.5% | 36.7%(+14.8)#32 | 38.5%(+13.0)#717 |
| 33. | Perry Heights | 51.5% | 36.7%(+14.8)#33 | 38.5%(+13.0)#721 |
| 34. | Marietta | 51.4% | 36.7%(+14.7)#34 | 38.5%(+12.9)#733 |
| 35. | Richmond Heights | 51.2% | 36.7%(+14.5)#35 | 38.5%(+12.7)#757 |
| 36. | Cheviot | 51.1% | 36.7%(+14.4)#36 | 38.5%(+12.6)#767 |
| 37. | Steubenville | 50.7% | 36.7%(+14.0)#37 | 38.5%(+12.2)#800 |
| 38. | Sidney | 50.2% | 36.7%(+13.5)#38 | 38.5%(+11.7)#863 |
| 39. | Sylvania | 50.2% | 36.7%(+13.5)#39 | 38.5%(+11.7)#865 |
| 40. | Wickliffe | 49.9% | 36.7%(+13.2)#40 | 38.5%(+11.4)#903 |
| 41. | Beachwood | 49.5% | 36.7%(+12.8)#41 | 38.5%(+11.0)#958 |
| 42. | Reynoldsburg | 49.3% | 36.7%(+12.6)#42 | 38.5%(+10.8)#989 |
| 43. | Bratenahl | 49.3% | 36.7%(+12.6)#43 | 38.5%(+10.8)#1,004 |
| 44. | Norwood | 49.1% | 36.7%(+12.4)#44 | 38.5%(+10.6)#1,026 |
| 45. | Maumee | 48.6% | 36.7%(+11.9)#45 | 38.5%(+10.1)#1,090 |
| 46. | Upper Arlington | 48.4% | 36.7%(+11.7)#46 | 38.5%(+9.90)#1,112 |
| 47. | Mansfield | 48.1% | 36.7%(+11.4)#47 | 38.5%(+9.60)#1,165 |
| 48. | Gahanna | 48.1% | 36.7%(+11.4)#48 | 38.5%(+9.60)#1,166 |
| 49. | Lancaster | 46.4% | 36.7%(+9.70)#49 | 38.5%(+7.90)#1,436 |
| 50. | Kettering | 45.7% | 36.7%(+9.00)#50 | 38.5%(+7.20)#1,534 |
| 51. | Fairview Park | 45.7% | 36.7%(+9.00)#51 | 38.5%(+7.20)#1,540 |
| 52. | Parma | 45.5% | 36.7%(+8.80)#52 | 38.5%(+7.00)#1,564 |
| 53. | Troy | 45.1% | 36.7%(+8.40)#53 | 38.5%(+6.60)#1,650 |
| 54. | Bay Village | 44.6% | 36.7%(+7.90)#54 | 38.5%(+6.10)#1,724 |
| 55. | Sandusky | 44.3% | 36.7%(+7.60)#55 | 38.5%(+5.80)#1,777 |
| 56. | North Ridgeville | 43.3% | 36.7%(+6.60)#56 | 38.5%(+4.80)#1,941 |
| 57. | Riverside | 43.3% | 36.7%(+6.60)#57 | 38.5%(+4.80)#1,946 |
| 58. | University Heights | 43.2% | 36.7%(+6.50)#58 | 38.5%(+4.70)#1,975 |
| 59. | Newark | 42.9% | 36.7%(+6.20)#59 | 38.5%(+4.40)#2,021 |
| 60. | Chillicothe | 42.8% | 36.7%(+6.10)#60 | 38.5%(+4.30)#2,049 |
| 61. | Dublin | 42.5% | 36.7%(+5.80)#61 | 38.5%(+4.00)#2,104 |
| 62. | Bedford Heights | 42.1% | 36.7%(+5.40)#62 | 38.5%(+3.60)#2,182 |
| 63. | Grove City | 41.9% | 36.7%(+5.20)#63 | 38.5%(+3.40)#2,201 |
| 64. | Massillon | 41.7% | 36.7%(+5.00)#64 | 38.5%(+3.20)#2,226 |
| 65. | Elyria | 41.6% | 36.7%(+4.90)#65 | 38.5%(+3.10)#2,243 |
| 66. | Maple Heights | 41.5% | 36.7%(+4.80)#66 | 38.5%(+3.00)#2,265 |
| 67. | Marion | 41.0% | 36.7%(+4.30)#67 | 38.5%(+2.50)#2,338 |
| 68. | Wilmington | 40.8% | 36.7%(+4.10)#68 | 38.5%(+2.30)#2,378 |
| 69. | Lakewood | 40.5% | 36.7%(+3.80)#69 | 38.5%(+2.00)#2,433 |
| 70. | Fremont | 40.4% | 36.7%(+3.70)#70 | 38.5%(+1.90)#2,467 |
| 71. | Canton | 40.3% | 36.7%(+3.60)#71 | 38.5%(+1.80)#2,482 |
| 72. | Painesville | 39.9% | 36.7%(+3.20)#72 | 38.5%(+1.40)#2,558 |
| 73. | Dayton | 39.7% | 36.7%(+3.00)#73 | 38.5%(+1.20)#2,589 |
| 74. | Twinsburg | 39.5% | 36.7%(+2.80)#74 | 38.5%(+1.00)#2,630 |
| 75. | Groesbeck | 39.3% | 36.7%(+2.60)#75 | 38.5%(+0.800)#2,667 |
| 76. | Stow | 38.8% | 36.7%(+2.10)#76 | 38.5%(+0.300)#2,739 |
| 77. | Highland Hills | 38.2% | 36.7%(+1.50)#77 | 38.5%(-0.300)#2,847 |
| 78. | Middletown | 38.0% | 36.7%(+1.30)#78 | 38.5%(-0.500)#2,866 |
| 79. | Garfield Heights | 37.7% | 36.7%(+1.000)#79 | 38.5%(-0.800)#2,904 |
| 80. | Cleveland | 37.6% | 36.7%(+0.900)#80 | 38.5%(-0.900)#2,914 |
| 81. | Whitehall | 37.4% | 36.7%(+0.700)#81 | 38.5%(-1.10)#2,957 |
| 82. | Trotwood | 37.2% | 36.7%(+0.500)#82 | 38.5%(-1.30)#2,985 |
| 83. | Cleveland Heights | 37.0% | 36.7%(+0.300)#83 | 38.5%(-1.50)#3,006 |
| 84. | Lorain | 36.9% | 36.7%(+0.200)#84 | 38.5%(-1.60)#3,022 |
| 85. | Springfield | 36.8% | 36.7%(+0.100)#85 | 38.5%(-1.70)#3,041 |
| 86. | Brecksville | 36.8% | 36.7%(+0.100)#86 | 38.5%(-1.70)#3,045 |
| 87. | Blue Ash | 36.8% | 36.7%(+0.100)#87 | 38.5%(-1.70)#3,046 |
| 88. | Alliance | 36.7% | 36.7%(=0.000)#88 | 38.5%(-1.80)#3,063 |
| 89. | Forestville | 36.5% | 36.7%(-0.200)#89 | 38.5%(-2.00)#3,102 |
| 90. | Cuyahoga Falls | 36.4% | 36.7%(-0.300)#90 | 38.5%(-2.10)#3,115 |
| 91. | Mount Healthy | 36.0% | 36.7%(-0.700)#91 | 38.5%(-2.50)#3,161 |
| 92. | North Randall | 35.7% | 36.7%(-1.00)#92 | 38.5%(-2.80)#3,219 |
| 93. | East Cleveland | 35.6% | 36.7%(-1.10)#93 | 38.5%(-2.90)#3,226 |
| 94. | Mayfield Heights | 35.5% | 36.7%(-1.20)#94 | 38.5%(-3.00)#3,239 |
| 95. | Lincoln Village | 35.5% | 36.7%(-1.20)#95 | 38.5%(-3.00)#3,244 |
| 96. | Akron | 35.3% | 36.7%(-1.40)#96 | 38.5%(-3.20)#3,262 |
| 97. | Union City | 35.3% | 36.7%(-1.40)#97 | 38.5%(-3.20)#3,280 |
| 98. | Cincinnati | 35.1% | 36.7%(-1.60)#98 | 38.5%(-3.40)#3,296 |
| 99. | Shaker Heights | 35.1% | 36.7%(-1.60)#99 | 38.5%(-3.40)#3,306 |
| 100. | Warrensville Heights | 35.1% | 36.7%(-1.60)#100 | 38.5%(-3.40)#3,309 |
Common Questions
What are the Top 10 Cities with the Highest Percentage of Population Taking Public Transit to Work in Ohio?
Top 10 Cities with the Highest Percentage of Population Taking Public Transit to Work in Ohio are:
#1
75.1%
#2
67.4%
#3
64.9%
#4
64.4%
#5
63.5%
#6
61.4%
#7
61.1%
#8
60.7%
#9
60.5%
#10
58.6%
What city has the Highest Percentage of Population Taking Public Transit to Work in Ohio?
Solon has the Highest Percentage of Population Taking Public Transit to Work in Ohio with 75.1%.
What is the Percentage of Population Taking Public Transit to Work in the State of Ohio?
Percentage of Population Taking Public Transit to Work in Ohio is 36.7%.
What is the Percentage of Population Taking Public Transit to Work in the United States?
Percentage of Population Taking Public Transit to Work in the United States is 38.5%.