Cities with the Highest Percentage of Population Employed in Manufacturing in Ohio
RELATED REPORTS & OPTIONS
Manufacturing
Ohio
Compare Cities
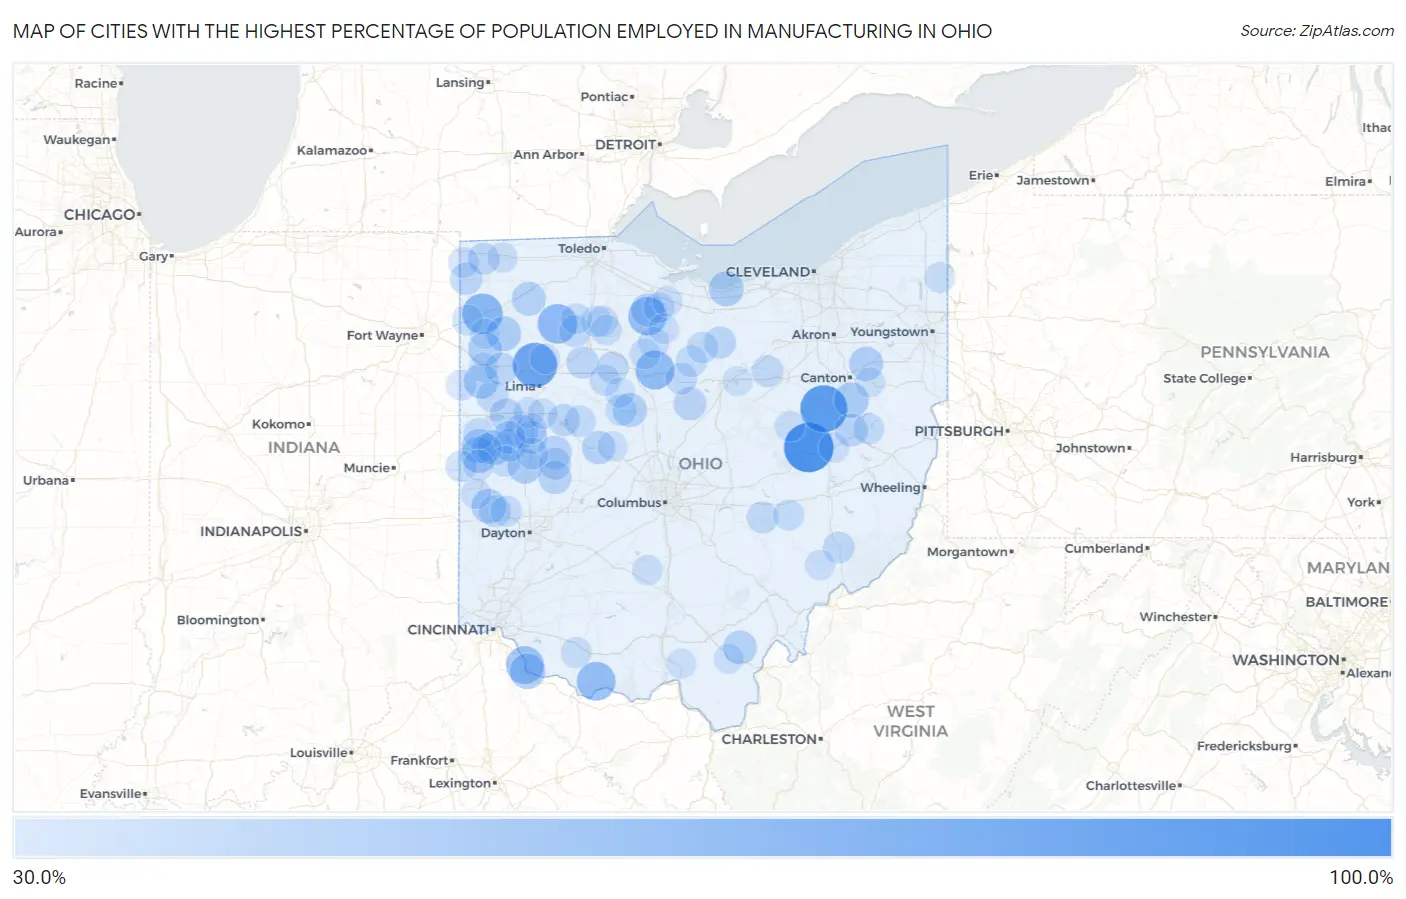
Map of Cities with the Highest Percentage of Population Employed in Manufacturing in Ohio
0.0%
100.0%
Cities with the Highest Percentage of Population Employed in Manufacturing in Ohio
| City | % Employed | vs State | vs National | |
| 1. | Marathon | 100.0% | 15.0%(+85.0)#1 | 10.0%(+90.0)#14 |
| 2. | Fresno | 100.0% | 15.0%(+85.0)#2 | 10.0%(+90.0)#46 |
| 3. | Dundee | 90.9% | 15.0%(+76.0)#3 | 10.0%(+81.0)#72 |
| 4. | Vaughnsville | 82.5% | 15.0%(+67.5)#4 | 10.0%(+72.5)#89 |
| 5. | Cecil | 68.8% | 15.0%(+53.8)#5 | 10.0%(+58.8)#140 |
| 6. | Belmore | 65.8% | 15.0%(+50.8)#6 | 10.0%(+55.8)#154 |
| 7. | Oceola | 64.1% | 15.0%(+49.1)#7 | 10.0%(+54.1)#163 |
| 8. | Bentonville | 63.2% | 15.0%(+48.3)#8 | 10.0%(+53.3)#173 |
| 9. | Fort Seneca | 62.5% | 15.0%(+47.5)#9 | 10.0%(+52.5)#180 |
| 10. | Moscow | 60.0% | 15.0%(+45.0)#10 | 10.0%(+50.0)#201 |
| 11. | Rossburg | 52.4% | 15.0%(+37.4)#11 | 10.0%(+42.4)#330 |
| 12. | Neville | 52.2% | 15.0%(+37.2)#12 | 10.0%(+42.2)#335 |
| 13. | Sandyville | 51.3% | 15.0%(+36.3)#13 | 10.0%(+41.3)#353 |
| 14. | Mitiwanga | 50.6% | 15.0%(+35.6)#14 | 10.0%(+40.6)#364 |
| 15. | Melrose | 50.0% | 15.0%(+35.0)#15 | 10.0%(+40.0)#369 |
| 16. | Lockington | 50.0% | 15.0%(+35.0)#16 | 10.0%(+40.0)#373 |
| 17. | Yorkshire | 50.0% | 15.0%(+35.0)#17 | 10.0%(+40.0)#387 |
| 18. | Ohio City | 49.9% | 15.0%(+34.9)#18 | 10.0%(+39.9)#405 |
| 19. | Ithaca | 49.3% | 15.0%(+34.3)#19 | 10.0%(+39.3)#417 |
| 20. | New Weston | 48.7% | 15.0%(+33.7)#20 | 10.0%(+38.7)#430 |
| 21. | Scott | 47.7% | 15.0%(+32.7)#21 | 10.0%(+37.7)#453 |
| 22. | Harrisburg | 47.6% | 15.0%(+32.6)#22 | 10.0%(+37.6)#455 |
| 23. | Florida | 47.3% | 15.0%(+32.4)#23 | 10.0%(+37.3)#471 |
| 24. | New Bloomington | 47.3% | 15.0%(+32.3)#24 | 10.0%(+37.3)#473 |
| 25. | Vinton | 46.8% | 15.0%(+31.8)#25 | 10.0%(+36.8)#488 |
| 26. | East Liberty | 45.8% | 15.0%(+30.8)#26 | 10.0%(+35.8)#527 |
| 27. | Kettlersville | 45.6% | 15.0%(+30.6)#27 | 10.0%(+35.6)#536 |
| 28. | Quincy | 45.2% | 15.0%(+30.2)#28 | 10.0%(+35.2)#546 |
| 29. | Old Fort | 44.9% | 15.0%(+29.9)#29 | 10.0%(+34.9)#555 |
| 30. | St Paris | 44.5% | 15.0%(+29.5)#30 | 10.0%(+34.5)#569 |
| 31. | Barnhill | 44.4% | 15.0%(+29.4)#31 | 10.0%(+34.4)#581 |
| 32. | St Marys | 44.3% | 15.0%(+29.3)#32 | 10.0%(+34.3)#586 |
| 33. | Fort Loramie | 44.3% | 15.0%(+29.3)#33 | 10.0%(+34.3)#589 |
| 34. | Anna | 44.2% | 15.0%(+29.2)#34 | 10.0%(+34.2)#590 |
| 35. | Candlewood Lake | 44.2% | 15.0%(+29.2)#35 | 10.0%(+34.2)#591 |
| 36. | Minster | 44.1% | 15.0%(+29.1)#36 | 10.0%(+34.1)#596 |
| 37. | Edgerton | 43.0% | 15.0%(+28.0)#37 | 10.0%(+33.0)#653 |
| 38. | Middle Point | 42.4% | 15.0%(+27.4)#38 | 10.0%(+32.4)#682 |
| 39. | Jenera | 42.0% | 15.0%(+27.0)#39 | 10.0%(+32.0)#703 |
| 40. | Greenwich | 41.8% | 15.0%(+26.8)#40 | 10.0%(+31.8)#714 |
| 41. | Rosewood | 41.8% | 15.0%(+26.8)#41 | 10.0%(+31.8)#717 |
| 42. | Chippewa Park | 41.3% | 15.0%(+26.4)#42 | 10.0%(+31.3)#745 |
| 43. | Montpelier | 41.1% | 15.0%(+26.1)#43 | 10.0%(+31.1)#754 |
| 44. | Bolton | 40.8% | 15.0%(+25.9)#44 | 10.0%(+30.8)#772 |
| 45. | New Pittsburg | 40.8% | 15.0%(+25.9)#45 | 10.0%(+30.8)#773 |
| 46. | Wharton | 40.8% | 15.0%(+25.8)#46 | 10.0%(+30.8)#781 |
| 47. | Verona | 40.6% | 15.0%(+25.7)#47 | 10.0%(+30.7)#789 |
| 48. | Fultonham | 40.6% | 15.0%(+25.6)#48 | 10.0%(+30.6)#795 |
| 49. | Mendon | 40.5% | 15.0%(+25.6)#49 | 10.0%(+30.5)#798 |
| 50. | Mccomb | 40.4% | 15.0%(+25.4)#50 | 10.0%(+30.4)#805 |
| 51. | Dexter City | 40.4% | 15.0%(+25.4)#51 | 10.0%(+30.4)#810 |
| 52. | North Robinson | 40.2% | 15.0%(+25.3)#52 | 10.0%(+30.3)#816 |
| 53. | Sidney | 39.9% | 15.0%(+25.0)#53 | 10.0%(+29.9)#846 |
| 54. | Belle Center | 39.8% | 15.0%(+24.8)#54 | 10.0%(+29.8)#854 |
| 55. | Tiro | 39.5% | 15.0%(+24.5)#55 | 10.0%(+29.5)#869 |
| 56. | La Rue | 39.2% | 15.0%(+24.2)#56 | 10.0%(+29.2)#885 |
| 57. | Plymouth | 39.2% | 15.0%(+24.2)#57 | 10.0%(+29.2)#887 |
| 58. | Union City | 39.2% | 15.0%(+24.2)#58 | 10.0%(+29.2)#891 |
| 59. | Leesville | 39.1% | 15.0%(+24.1)#59 | 10.0%(+29.1)#897 |
| 60. | Melmore | 38.7% | 15.0%(+23.7)#60 | 10.0%(+28.7)#921 |
| 61. | Bairdstown | 38.6% | 15.0%(+23.6)#61 | 10.0%(+28.6)#931 |
| 62. | Phillipsburg | 38.4% | 15.0%(+23.4)#62 | 10.0%(+28.4)#950 |
| 63. | Duncan Falls | 38.3% | 15.0%(+23.3)#63 | 10.0%(+28.3)#961 |
| 64. | Patterson | 38.2% | 15.0%(+23.3)#64 | 10.0%(+28.2)#963 |
| 65. | St Henry | 38.2% | 15.0%(+23.2)#65 | 10.0%(+28.2)#973 |
| 66. | Russia | 38.2% | 15.0%(+23.2)#66 | 10.0%(+28.2)#975 |
| 67. | Green Springs | 37.8% | 15.0%(+22.8)#67 | 10.0%(+27.8)#1,006 |
| 68. | Lake Waynoka | 37.7% | 15.0%(+22.7)#68 | 10.0%(+27.7)#1,008 |
| 69. | Sycamore | 37.4% | 15.0%(+22.5)#69 | 10.0%(+27.4)#1,027 |
| 70. | Antwerp | 37.4% | 15.0%(+22.4)#70 | 10.0%(+27.4)#1,029 |
| 71. | North Star | 37.3% | 15.0%(+22.4)#71 | 10.0%(+27.4)#1,033 |
| 72. | Hoytville | 37.2% | 15.0%(+22.2)#72 | 10.0%(+27.2)#1,039 |
| 73. | Bloomdale | 37.2% | 15.0%(+22.2)#73 | 10.0%(+27.2)#1,040 |
| 74. | Edon | 37.1% | 15.0%(+22.1)#74 | 10.0%(+27.1)#1,048 |
| 75. | Wapakoneta | 37.1% | 15.0%(+22.1)#75 | 10.0%(+27.1)#1,049 |
| 76. | Brunersburg | 37.1% | 15.0%(+22.1)#76 | 10.0%(+27.1)#1,050 |
| 77. | Kinsman Center | 37.1% | 15.0%(+22.1)#77 | 10.0%(+27.1)#1,056 |
| 78. | Botkins | 37.0% | 15.0%(+22.0)#78 | 10.0%(+27.0)#1,064 |
| 79. | Lake Buckhorn | 36.8% | 15.0%(+21.8)#79 | 10.0%(+26.8)#1,074 |
| 80. | Ansonia | 36.8% | 15.0%(+21.8)#80 | 10.0%(+26.8)#1,078 |
| 81. | Arcadia | 36.7% | 15.0%(+21.8)#81 | 10.0%(+26.8)#1,083 |
| 82. | Willshire | 36.6% | 15.0%(+21.7)#82 | 10.0%(+26.6)#1,098 |
| 83. | Clarksburg | 36.6% | 15.0%(+21.6)#83 | 10.0%(+26.6)#1,105 |
| 84. | Waterford | 36.3% | 15.0%(+21.3)#84 | 10.0%(+26.3)#1,138 |
| 85. | Wayne Lakes | 36.1% | 15.0%(+21.2)#85 | 10.0%(+26.1)#1,152 |
| 86. | Republic | 35.9% | 15.0%(+20.9)#86 | 10.0%(+25.9)#1,175 |
| 87. | St Johns | 35.8% | 15.0%(+20.8)#87 | 10.0%(+25.8)#1,184 |
| 88. | West Unity | 35.8% | 15.0%(+20.8)#88 | 10.0%(+25.8)#1,190 |
| 89. | Clyde | 35.6% | 15.0%(+20.6)#89 | 10.0%(+25.6)#1,210 |
| 90. | Port Washington | 35.6% | 15.0%(+20.6)#90 | 10.0%(+25.6)#1,213 |
| 91. | Columbus Grove | 35.6% | 15.0%(+20.6)#91 | 10.0%(+25.6)#1,214 |
| 92. | Mount Hope | 35.6% | 15.0%(+20.6)#92 | 10.0%(+25.6)#1,217 |
| 93. | Raymond | 35.6% | 15.0%(+20.6)#93 | 10.0%(+25.6)#1,219 |
| 94. | Minford | 35.5% | 15.0%(+20.5)#94 | 10.0%(+25.5)#1,226 |
| 95. | Mifflin | 35.4% | 15.0%(+20.4)#95 | 10.0%(+25.4)#1,249 |
| 96. | Van Wert | 35.3% | 15.0%(+20.4)#96 | 10.0%(+25.4)#1,253 |
| 97. | Centerville Thurman | 35.3% | 15.0%(+20.3)#97 | 10.0%(+25.3)#1,261 |
| 98. | Latty | 35.2% | 15.0%(+20.2)#98 | 10.0%(+25.2)#1,267 |
| 99. | Marseilles | 35.2% | 15.0%(+20.2)#99 | 10.0%(+25.2)#1,268 |
| 100. | Robertsville | 35.0% | 15.0%(+20.1)#100 | 10.0%(+25.0)#1,282 |
Common Questions
What are the Top 10 Cities with the Highest Percentage of Population Employed in Manufacturing in Ohio?
Top 10 Cities with the Highest Percentage of Population Employed in Manufacturing in Ohio are:
#1
100.0%
#2
90.9%
#3
82.5%
#4
68.8%
#5
65.8%
#6
64.1%
#7
63.2%
#8
62.5%
#9
60.0%
#10
52.4%
What city has the Highest Percentage of Population Employed in Manufacturing in Ohio?
Fresno has the Highest Percentage of Population Employed in Manufacturing in Ohio with 100.0%.
What is the Percentage of Population Employed in Manufacturing in the State of Ohio?
Percentage of Population Employed in Manufacturing in Ohio is 15.0%.
What is the Percentage of Population Employed in Manufacturing in the United States?
Percentage of Population Employed in Manufacturing in the United States is 10.0%.