Cities with the Highest Percentage of Federal Government Employees in Ohio
RELATED REPORTS & OPTIONS
Federal Government Employees
Ohio
Compare Cities
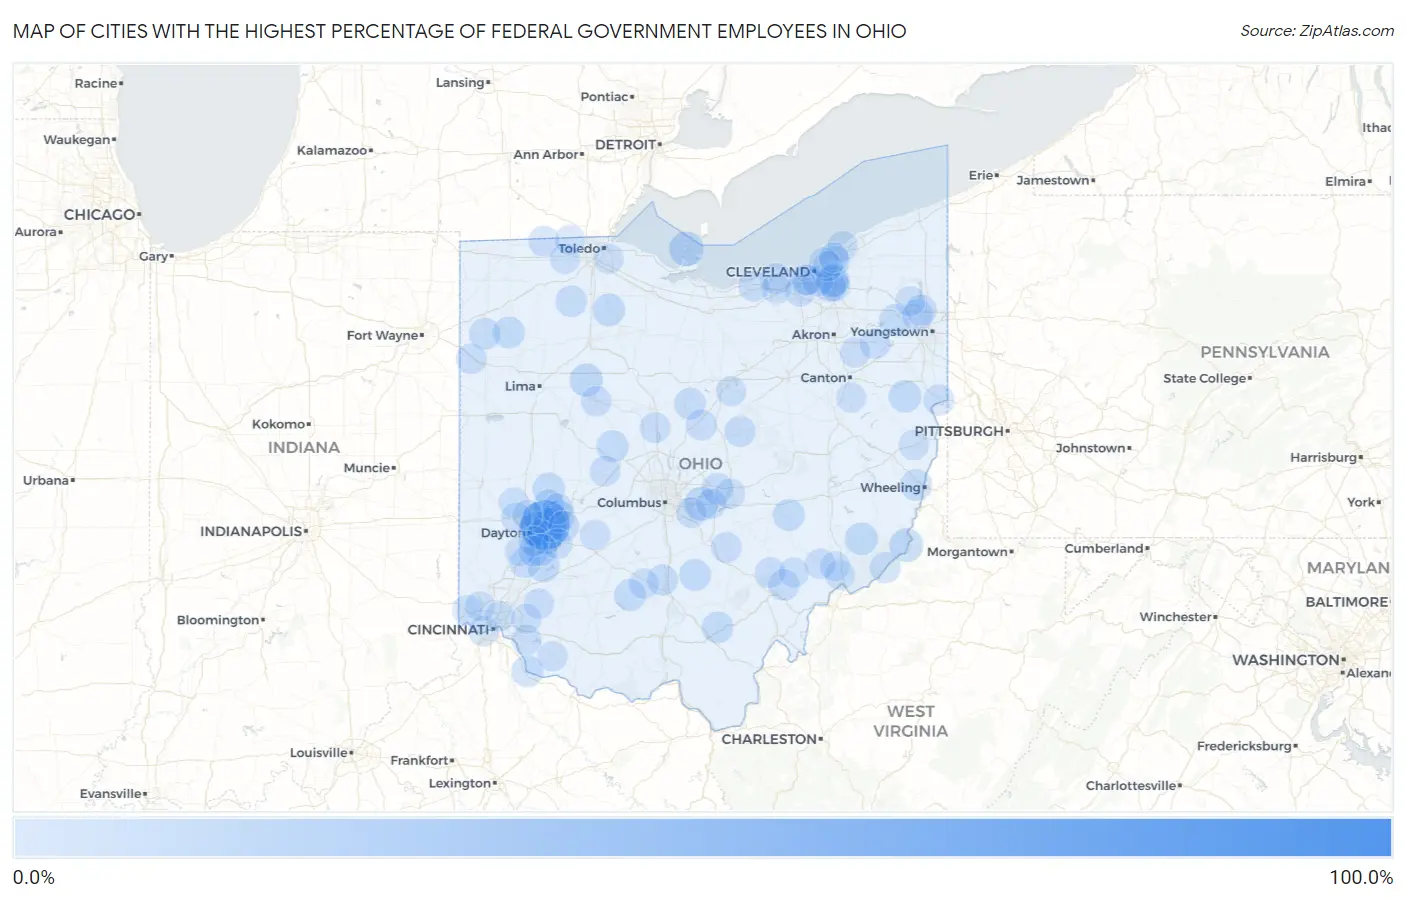
Map of Cities with the Highest Percentage of Federal Government Employees in Ohio
0.0%
100.0%
Cities with the Highest Percentage of Federal Government Employees in Ohio
| City | % Federal Government Employees | vs State | vs National | |
| 1. | Bloomingville | 100.0% | 2.1%(+97.9)#1 | 3.4%(+96.6)#4 |
| 2. | Wright Patterson Afb | 53.5% | 2.1%(+51.4)#2 | 3.4%(+50.1)#158 |
| 3. | Beavercreek | 19.1% | 2.1%(+17.0)#3 | 3.4%(+15.8)#909 |
| 4. | Birmingham | 18.9% | 2.1%(+16.8)#4 | 3.4%(+15.5)#922 |
| 5. | Put In Bay | 15.6% | 2.1%(+13.5)#5 | 3.4%(+12.2)#1,227 |
| 6. | Riverside | 14.5% | 2.1%(+12.4)#6 | 3.4%(+11.1)#1,359 |
| 7. | Fairborn | 13.8% | 2.1%(+11.6)#7 | 3.4%(+10.4)#1,470 |
| 8. | Etna | 13.5% | 2.1%(+11.3)#8 | 3.4%(+10.1)#1,510 |
| 9. | Hannibal | 13.1% | 2.1%(+11.0)#9 | 3.4%(+9.74)#1,566 |
| 10. | Dola | 12.5% | 2.1%(+10.4)#10 | 3.4%(+9.12)#1,659 |
| 11. | Summitville | 11.1% | 2.1%(+8.96)#11 | 3.4%(+7.73)#1,941 |
| 12. | West Millgrove | 10.8% | 2.1%(+8.62)#12 | 3.4%(+7.39)#2,020 |
| 13. | Stafford | 10.7% | 2.1%(+8.57)#13 | 3.4%(+7.34)#2,034 |
| 14. | Christiansburg | 9.9% | 2.1%(+7.71)#14 | 3.4%(+6.48)#2,240 |
| 15. | Enon | 9.7% | 2.1%(+7.51)#15 | 3.4%(+6.28)#2,288 |
| 16. | Corwin | 9.3% | 2.1%(+7.20)#16 | 3.4%(+5.97)#2,397 |
| 17. | Duncan Falls | 9.0% | 2.1%(+6.87)#17 | 3.4%(+5.64)#2,518 |
| 18. | Warrensville Heights | 9.0% | 2.1%(+6.80)#18 | 3.4%(+5.57)#2,537 |
| 19. | Raymond | 8.9% | 2.1%(+6.74)#19 | 3.4%(+5.51)#2,559 |
| 20. | Bellbrook | 8.9% | 2.1%(+6.72)#20 | 3.4%(+5.49)#2,566 |
| 21. | Laurelville | 8.9% | 2.1%(+6.72)#21 | 3.4%(+5.49)#2,570 |
| 22. | South Canal | 8.8% | 2.1%(+6.63)#22 | 3.4%(+5.40)#2,600 |
| 23. | North Randall | 8.7% | 2.1%(+6.56)#23 | 3.4%(+5.33)#2,626 |
| 24. | South Salem | 8.7% | 2.1%(+6.55)#24 | 3.4%(+5.32)#2,635 |
| 25. | Neville | 8.7% | 2.1%(+6.55)#25 | 3.4%(+5.32)#2,642 |
| 26. | Wellston | 8.7% | 2.1%(+6.51)#26 | 3.4%(+5.28)#2,651 |
| 27. | Oakwood | 8.6% | 2.1%(+6.47)#27 | 3.4%(+5.25)#2,665 |
| 28. | Lansing | 8.5% | 2.1%(+6.34)#28 | 3.4%(+5.11)#2,711 |
| 29. | Candlewood Lake | 8.5% | 2.1%(+6.31)#29 | 3.4%(+5.08)#2,731 |
| 30. | Latty | 8.5% | 2.1%(+6.30)#30 | 3.4%(+5.07)#2,740 |
| 31. | Maple Heights | 8.1% | 2.1%(+5.92)#31 | 3.4%(+4.69)#2,893 |
| 32. | Milton Center | 8.1% | 2.1%(+5.92)#32 | 3.4%(+4.69)#2,895 |
| 33. | Granville South | 7.9% | 2.1%(+5.79)#33 | 3.4%(+4.56)#2,933 |
| 34. | Amesville | 7.8% | 2.1%(+5.69)#34 | 3.4%(+4.47)#2,970 |
| 35. | New Carlisle | 7.4% | 2.1%(+5.26)#35 | 3.4%(+4.03)#3,163 |
| 36. | Bolindale | 7.2% | 2.1%(+5.09)#36 | 3.4%(+3.86)#3,253 |
| 37. | Huber Heights | 7.1% | 2.1%(+4.98)#37 | 3.4%(+3.76)#3,313 |
| 38. | Apple Valley | 7.1% | 2.1%(+4.98)#38 | 3.4%(+3.75)#3,315 |
| 39. | Andersonville | 7.1% | 2.1%(+4.95)#39 | 3.4%(+3.72)#3,332 |
| 40. | Linndale | 7.1% | 2.1%(+4.94)#40 | 3.4%(+3.71)#3,334 |
| 41. | Avon | 7.0% | 2.1%(+4.86)#41 | 3.4%(+3.63)#3,389 |
| 42. | Saybrook-On-The-Lake | 7.0% | 2.1%(+4.82)#42 | 3.4%(+3.59)#3,408 |
| 43. | La Croft | 6.9% | 2.1%(+4.75)#43 | 3.4%(+3.52)#3,451 |
| 44. | Springboro | 6.9% | 2.1%(+4.71)#44 | 3.4%(+3.48)#3,474 |
| 45. | Chesterville | 6.8% | 2.1%(+4.70)#45 | 3.4%(+3.47)#3,481 |
| 46. | Howland Center | 6.8% | 2.1%(+4.65)#46 | 3.4%(+3.42)#3,518 |
| 47. | Matamoras | 6.4% | 2.1%(+4.29)#47 | 3.4%(+3.06)#3,712 |
| 48. | Lyons | 6.3% | 2.1%(+4.14)#48 | 3.4%(+2.91)#3,813 |
| 49. | Donnelsville | 6.2% | 2.1%(+4.06)#49 | 3.4%(+2.83)#3,865 |
| 50. | Yellow Springs | 6.2% | 2.1%(+4.05)#50 | 3.4%(+2.82)#3,871 |
| 51. | Hide A Way Hills | 6.1% | 2.1%(+3.97)#51 | 3.4%(+2.74)#3,944 |
| 52. | Waldo | 6.1% | 2.1%(+3.96)#52 | 3.4%(+2.73)#3,946 |
| 53. | Amherst | 6.1% | 2.1%(+3.91)#53 | 3.4%(+2.69)#3,980 |
| 54. | Atwater | 5.9% | 2.1%(+3.78)#54 | 3.4%(+2.55)#4,091 |
| 55. | Pleasant Plain | 5.9% | 2.1%(+3.73)#55 | 3.4%(+2.50)#4,134 |
| 56. | Middleburg Heights | 5.9% | 2.1%(+3.73)#56 | 3.4%(+2.50)#4,147 |
| 57. | Centerville | 5.9% | 2.1%(+3.71)#57 | 3.4%(+2.48)#4,158 |
| 58. | Trimble | 5.8% | 2.1%(+3.70)#58 | 3.4%(+2.47)#4,164 |
| 59. | Woodstock | 5.8% | 2.1%(+3.68)#59 | 3.4%(+2.45)#4,184 |
| 60. | Cuyahoga Heights | 5.7% | 2.1%(+3.56)#60 | 3.4%(+2.33)#4,283 |
| 61. | Timberlake | 5.7% | 2.1%(+3.51)#61 | 3.4%(+2.28)#4,315 |
| 62. | Beverly | 5.6% | 2.1%(+3.46)#62 | 3.4%(+2.24)#4,357 |
| 63. | Pickerington | 5.6% | 2.1%(+3.41)#63 | 3.4%(+2.18)#4,399 |
| 64. | Kenton | 5.5% | 2.1%(+3.35)#64 | 3.4%(+2.12)#4,463 |
| 65. | Bedford Heights | 5.4% | 2.1%(+3.29)#65 | 3.4%(+2.06)#4,521 |
| 66. | Convoy | 5.4% | 2.1%(+3.29)#66 | 3.4%(+2.06)#4,527 |
| 67. | South Solon | 5.4% | 2.1%(+3.21)#67 | 3.4%(+1.98)#4,596 |
| 68. | West Milton | 5.3% | 2.1%(+3.16)#68 | 3.4%(+1.93)#4,643 |
| 69. | Richmond Heights | 5.3% | 2.1%(+3.15)#69 | 3.4%(+1.92)#4,657 |
| 70. | Walbridge | 5.3% | 2.1%(+3.14)#70 | 3.4%(+1.91)#4,663 |
| 71. | Frankfort | 5.3% | 2.1%(+3.11)#71 | 3.4%(+1.89)#4,681 |
| 72. | Brooklyn | 5.3% | 2.1%(+3.11)#72 | 3.4%(+1.88)#4,701 |
| 73. | Blue Jay | 5.2% | 2.1%(+3.03)#73 | 3.4%(+1.80)#4,775 |
| 74. | Amelia | 5.2% | 2.1%(+3.02)#74 | 3.4%(+1.80)#4,779 |
| 75. | Xenia | 5.2% | 2.1%(+3.02)#75 | 3.4%(+1.79)#4,788 |
| 76. | Delshire | 5.2% | 2.1%(+3.00)#76 | 3.4%(+1.78)#4,798 |
| 77. | Englewood | 5.2% | 2.1%(+3.00)#77 | 3.4%(+1.78)#4,799 |
| 78. | Kirkersville | 5.1% | 2.1%(+2.99)#78 | 3.4%(+1.76)#4,825 |
| 79. | Heath | 5.1% | 2.1%(+2.94)#79 | 3.4%(+1.72)#4,873 |
| 80. | Day Heights | 5.0% | 2.1%(+2.86)#80 | 3.4%(+1.63)#4,954 |
| 81. | Champion Heights | 5.0% | 2.1%(+2.86)#81 | 3.4%(+1.63)#4,957 |
| 82. | Hartville | 5.0% | 2.1%(+2.85)#82 | 3.4%(+1.62)#4,978 |
| 83. | Devola | 4.9% | 2.1%(+2.79)#83 | 3.4%(+1.56)#5,025 |
| 84. | North Ridgeville | 4.9% | 2.1%(+2.73)#84 | 3.4%(+1.50)#5,093 |
| 85. | Swanton | 4.9% | 2.1%(+2.73)#85 | 3.4%(+1.50)#5,107 |
| 86. | East Sparta | 4.9% | 2.1%(+2.71)#86 | 3.4%(+1.48)#5,117 |
| 87. | Dry Ridge | 4.8% | 2.1%(+2.69)#87 | 3.4%(+1.46)#5,150 |
| 88. | Bratenahl | 4.8% | 2.1%(+2.66)#88 | 3.4%(+1.43)#5,179 |
| 89. | Berkey | 4.8% | 2.1%(+2.65)#89 | 3.4%(+1.42)#5,194 |
| 90. | Hamersville | 4.8% | 2.1%(+2.61)#90 | 3.4%(+1.38)#5,223 |
| 91. | East Cleveland | 4.7% | 2.1%(+2.59)#91 | 3.4%(+1.36)#5,266 |
| 92. | Golf Manor | 4.7% | 2.1%(+2.58)#92 | 3.4%(+1.35)#5,274 |
| 93. | Chesterhill | 4.7% | 2.1%(+2.58)#93 | 3.4%(+1.35)#5,275 |
| 94. | Vandalia | 4.7% | 2.1%(+2.55)#94 | 3.4%(+1.32)#5,306 |
| 95. | Kettering | 4.7% | 2.1%(+2.55)#95 | 3.4%(+1.32)#5,310 |
| 96. | Miamisburg | 4.7% | 2.1%(+2.54)#96 | 3.4%(+1.31)#5,315 |
| 97. | Lucas | 4.7% | 2.1%(+2.54)#97 | 3.4%(+1.31)#5,317 |
| 98. | Lowell | 4.7% | 2.1%(+2.52)#98 | 3.4%(+1.30)#5,346 |
| 99. | Bloomingdale | 4.7% | 2.1%(+2.50)#99 | 3.4%(+1.27)#5,380 |
| 100. | Euclid | 4.6% | 2.1%(+2.45)#100 | 3.4%(+1.23)#5,428 |
Common Questions
What are the Top 10 Cities with the Highest Percentage of Federal Government Employees in Ohio?
Top 10 Cities with the Highest Percentage of Federal Government Employees in Ohio are:
#1
53.5%
#2
19.1%
#3
15.6%
#4
14.5%
#5
13.8%
#6
13.5%
#7
13.1%
#8
12.5%
#9
11.1%
#10
10.8%
What city has the Highest Percentage of Federal Government Employees in Ohio?
Wright Patterson AFB has the Highest Percentage of Federal Government Employees in Ohio with 53.5%.
What is the Percentage of Federal Government Employees in the State of Ohio?
Percentage of Federal Government Employees in Ohio is 2.1%.
What is the Percentage of Federal Government Employees in the United States?
Percentage of Federal Government Employees in the United States is 3.4%.