Bellbrook, OH
Bellbrook Map
Bellbrook Overview
7,321
TOTAL POPULATION
3,744
MALE POPULATION
3,577
FEMALE POPULATION
104.67
MALES / 100 FEMALES
95.54
FEMALES / 100 MALES
43.1
MEDIAN AGE
2.8
AVG FAMILY SIZE
2.4
AVG HOUSEHOLD SIZE
$52,940
PER CAPITA INCOME
$126,189
AVG FAMILY INCOME
$105,631
AVG HOUSEHOLD INCOME
35.3%
WAGE / INCOME GAP [ % ]
64.7¢/ $1
WAGE / INCOME GAP [ $ ]
0.38
INEQUALITY / GINI INDEX
3,893
LABOR FORCE [ PEOPLE ]
63.4%
PERCENT IN LABOR FORCE
1.0%
UNEMPLOYMENT RATE
Bellbrook Zip Codes
Bellbrook Area Codes
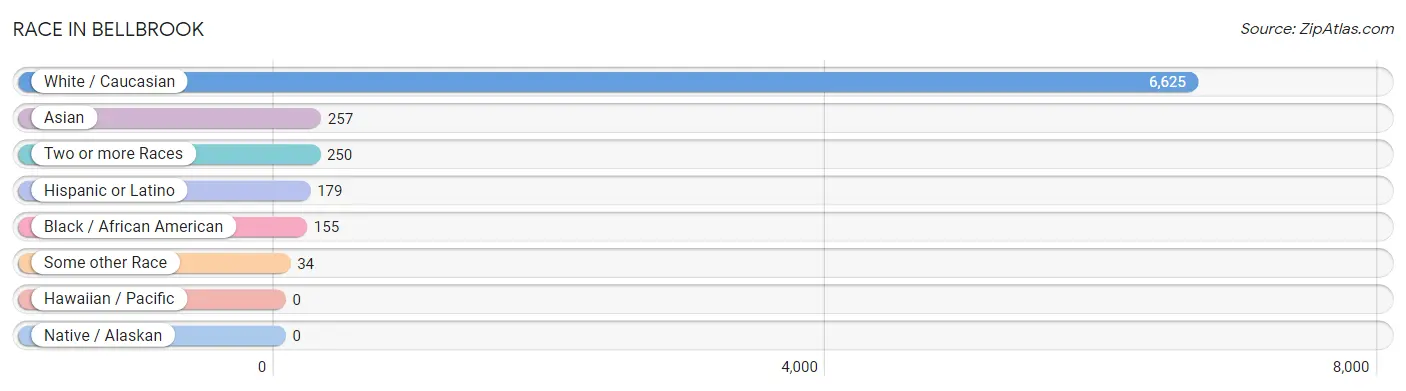
Race in Bellbrook
The most populous races in Bellbrook are White / Caucasian (6,625 | 90.5%), Asian (257 | 3.5%), and Two or more Races (250 | 3.4%).
| Race | # Population | % Population |
| Asian | 257 | 3.5% |
| Black / African American | 155 | 2.1% |
| Hawaiian / Pacific | 0 | 0.0% |
| Hispanic or Latino | 179 | 2.5% |
| Native / Alaskan | 0 | 0.0% |
| White / Caucasian | 6,625 | 90.5% |
| Two or more Races | 250 | 3.4% |
| Some other Race | 34 | 0.5% |
| Total | 7,321 | 100.0% |
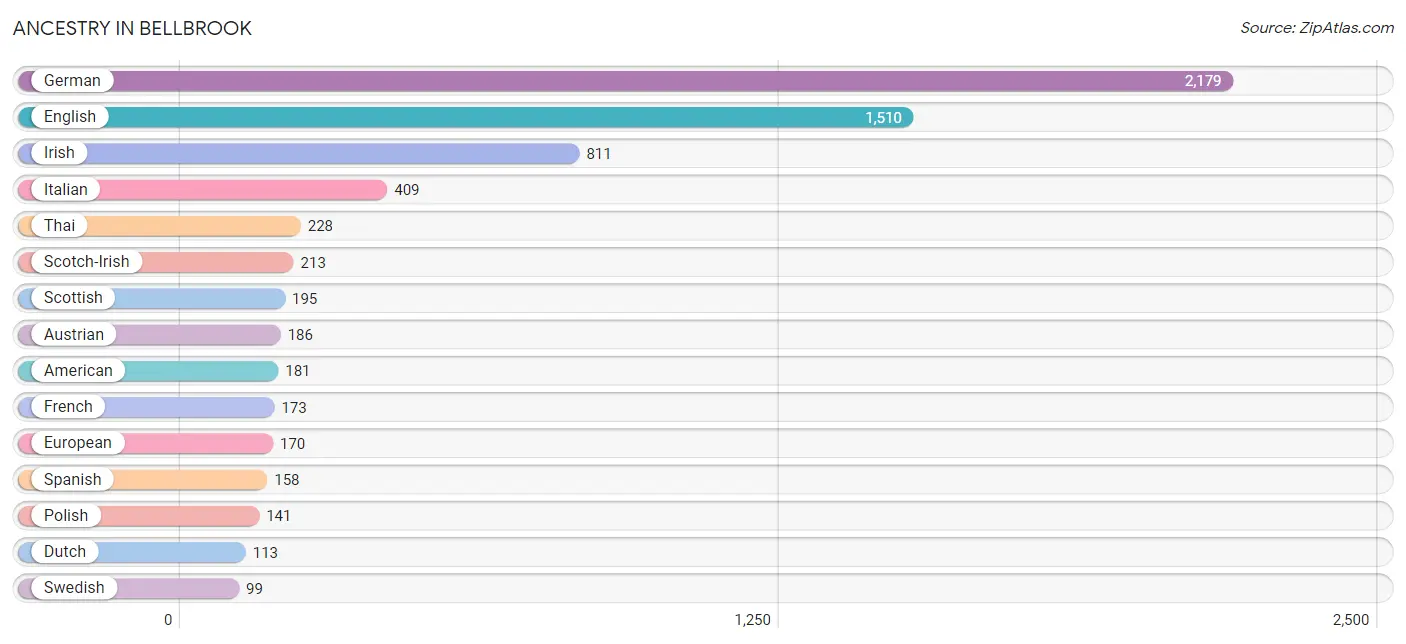
Ancestry in Bellbrook
The most populous ancestries reported in Bellbrook are German (2,179 | 29.8%), English (1,510 | 20.6%), Irish (811 | 11.1%), Italian (409 | 5.6%), and Thai (228 | 3.1%), together accounting for 70.2% of all Bellbrook residents.
| Ancestry | # Population | % Population |
| American | 181 | 2.5% |
| Arab | 10 | 0.1% |
| Austrian | 186 | 2.5% |
| Belgian | 8 | 0.1% |
| Bhutanese | 29 | 0.4% |
| Blackfeet | 24 | 0.3% |
| British | 40 | 0.5% |
| Cherokee | 43 | 0.6% |
| Choctaw | 19 | 0.3% |
| Croatian | 16 | 0.2% |
| Czech | 8 | 0.1% |
| Czechoslovakian | 10 | 0.1% |
| Danish | 11 | 0.2% |
| Dutch | 113 | 1.5% |
| Eastern European | 24 | 0.3% |
| English | 1,510 | 20.6% |
| European | 170 | 2.3% |
| Finnish | 9 | 0.1% |
| French | 173 | 2.4% |
| French Canadian | 13 | 0.2% |
| German | 2,179 | 29.8% |
| Greek | 13 | 0.2% |
| Hungarian | 58 | 0.8% |
| Indian (Asian) | 51 | 0.7% |
| Irish | 811 | 11.1% |
| Italian | 409 | 5.6% |
| Korean | 23 | 0.3% |
| Lithuanian | 37 | 0.5% |
| Norwegian | 49 | 0.7% |
| Polish | 141 | 1.9% |
| Puerto Rican | 13 | 0.2% |
| Scotch-Irish | 213 | 2.9% |
| Scottish | 195 | 2.7% |
| Slovak | 10 | 0.1% |
| Slovene | 3 | 0.0% |
| Spaniard | 8 | 0.1% |
| Spanish | 158 | 2.2% |
| Sri Lankan | 14 | 0.2% |
| Swedish | 99 | 1.3% |
| Swiss | 7 | 0.1% |
| Syrian | 10 | 0.1% |
| Thai | 228 | 3.1% |
| Turkish | 13 | 0.2% |
| Welsh | 61 | 0.8% | View All 44 Rows |
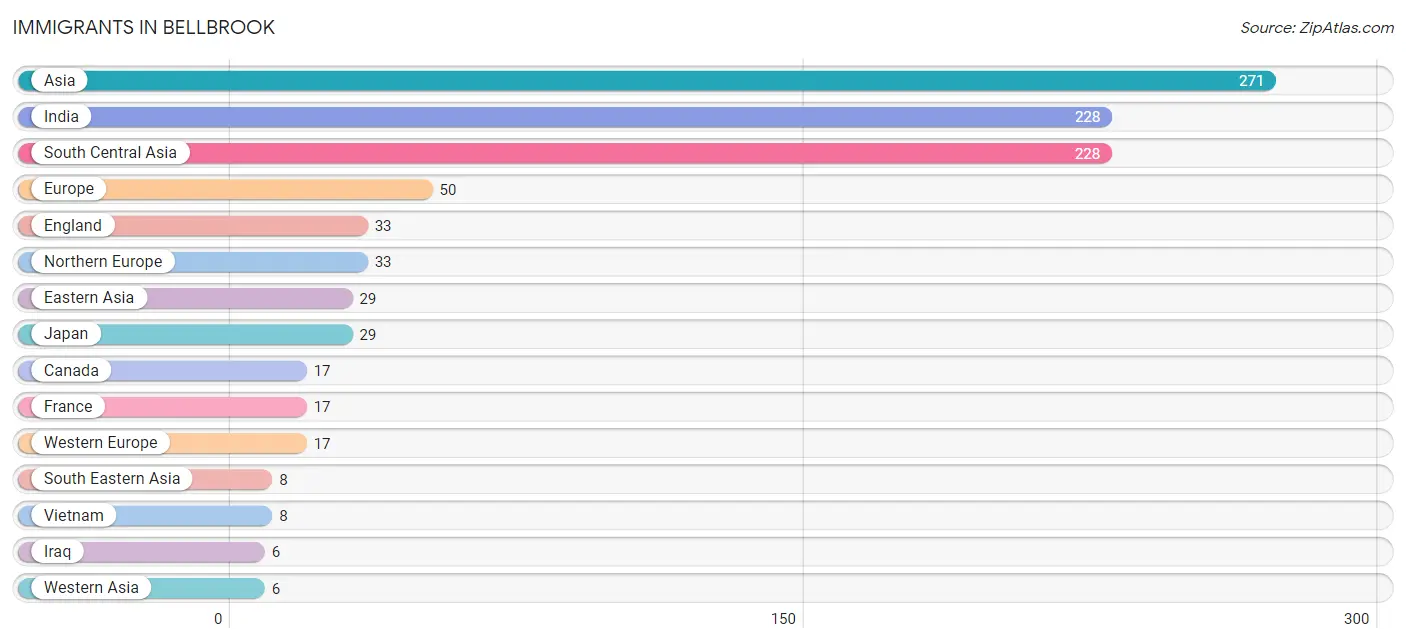
Immigrants in Bellbrook
The most numerous immigrant groups reported in Bellbrook came from Asia (271 | 3.7%), India (228 | 3.1%), South Central Asia (228 | 3.1%), Europe (50 | 0.7%), and England (33 | 0.4%), together accounting for 11.1% of all Bellbrook residents.
| Immigration Origin | # Population | % Population |
| Asia | 271 | 3.7% |
| Canada | 17 | 0.2% |
| Eastern Asia | 29 | 0.4% |
| England | 33 | 0.4% |
| Europe | 50 | 0.7% |
| France | 17 | 0.2% |
| India | 228 | 3.1% |
| Iraq | 6 | 0.1% |
| Japan | 29 | 0.4% |
| Northern Europe | 33 | 0.4% |
| South Central Asia | 228 | 3.1% |
| South Eastern Asia | 8 | 0.1% |
| Vietnam | 8 | 0.1% |
| Western Asia | 6 | 0.1% |
| Western Europe | 17 | 0.2% | View All 15 Rows |
Sex and Age in Bellbrook
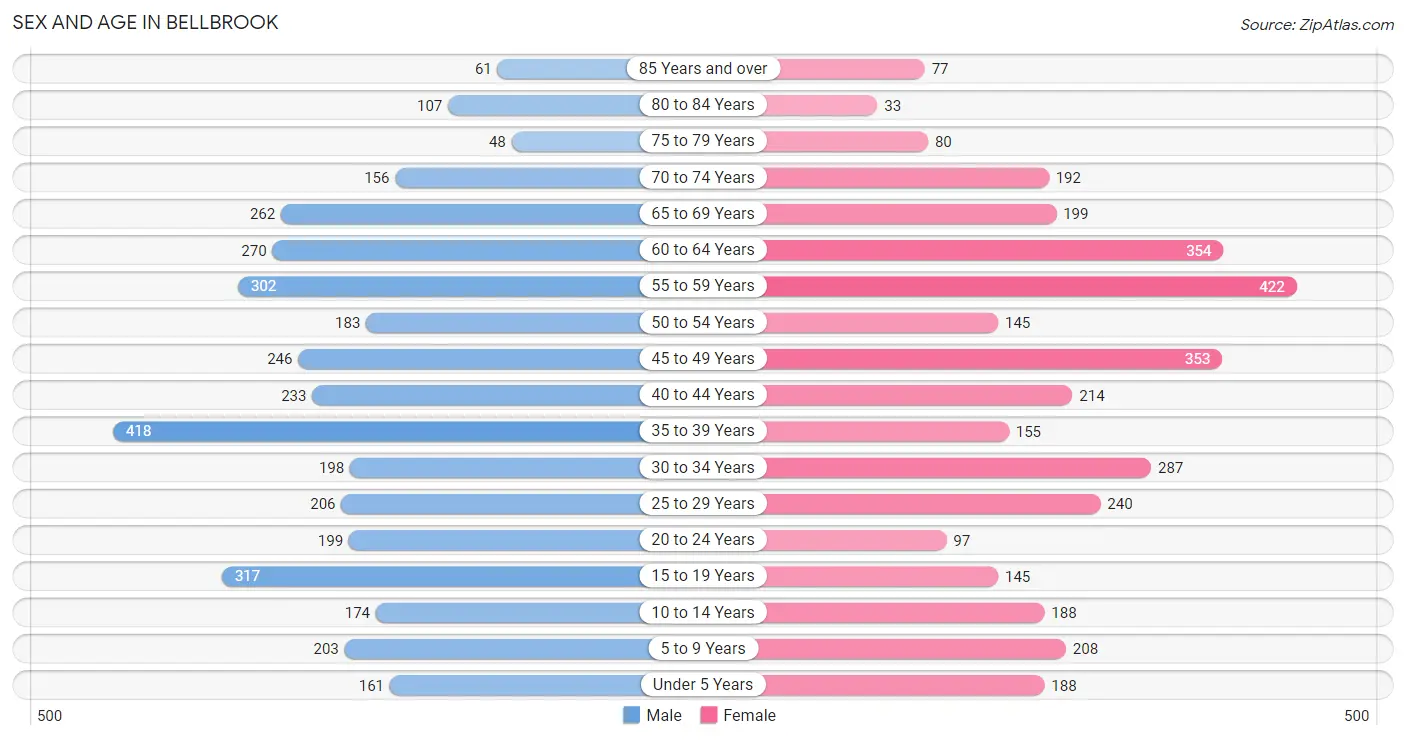
Sex and Age in Bellbrook
The most populous age groups in Bellbrook are 35 to 39 Years (418 | 11.2%) for men and 55 to 59 Years (422 | 11.8%) for women.
| Age Bracket | Male | Female |
| Under 5 Years | 161 (4.3%) | 188 (5.3%) |
| 5 to 9 Years | 203 (5.4%) | 208 (5.8%) |
| 10 to 14 Years | 174 (4.6%) | 188 (5.3%) |
| 15 to 19 Years | 317 (8.5%) | 145 (4.1%) |
| 20 to 24 Years | 199 (5.3%) | 97 (2.7%) |
| 25 to 29 Years | 206 (5.5%) | 240 (6.7%) |
| 30 to 34 Years | 198 (5.3%) | 287 (8.0%) |
| 35 to 39 Years | 418 (11.2%) | 155 (4.3%) |
| 40 to 44 Years | 233 (6.2%) | 214 (6.0%) |
| 45 to 49 Years | 246 (6.6%) | 353 (9.9%) |
| 50 to 54 Years | 183 (4.9%) | 145 (4.1%) |
| 55 to 59 Years | 302 (8.1%) | 422 (11.8%) |
| 60 to 64 Years | 270 (7.2%) | 354 (9.9%) |
| 65 to 69 Years | 262 (7.0%) | 199 (5.6%) |
| 70 to 74 Years | 156 (4.2%) | 192 (5.4%) |
| 75 to 79 Years | 48 (1.3%) | 80 (2.2%) |
| 80 to 84 Years | 107 (2.9%) | 33 (0.9%) |
| 85 Years and over | 61 (1.6%) | 77 (2.1%) |
| Total | 3,744 (100.0%) | 3,577 (100.0%) |
Families and Households in Bellbrook
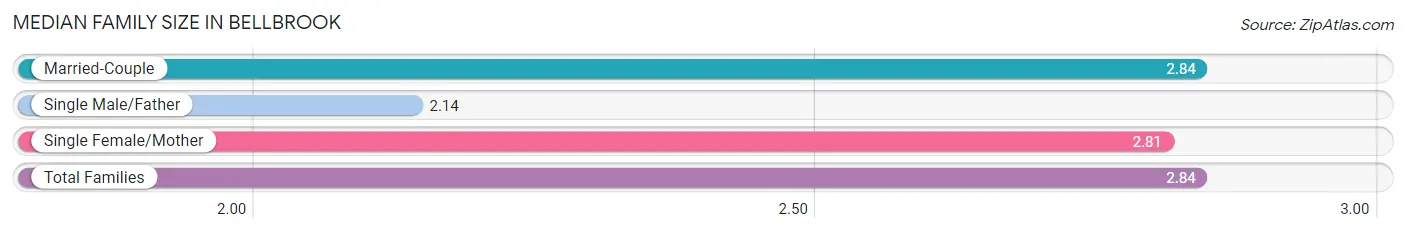
Median Family Size in Bellbrook
The median family size in Bellbrook is 2.84 persons per family, with married-couple families (1,946 | 90.1%) accounting for the largest median family size of 2.84 persons per family. On the other hand, single male/father families (14 | 0.6%) represent the smallest median family size with 2.14 persons per family.
| Family Type | # Families | Family Size |
| Married-Couple | 1,946 (90.1%) | 2.84 |
| Single Male/Father | 14 (0.6%) | 2.14 |
| Single Female/Mother | 199 (9.2%) | 2.81 |
| Total Families | 2,159 (100.0%) | 2.84 |
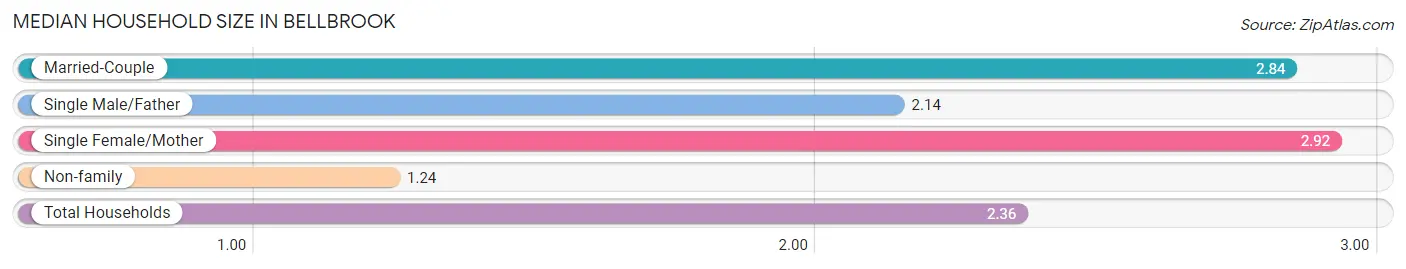
Median Household Size in Bellbrook
The median household size in Bellbrook is 2.36 persons per household, with single female/mother households (199 | 6.4%) accounting for the largest median household size of 2.92 persons per household. non-family households (948 | 30.5%) represent the smallest median household size with 1.24 persons per household.
| Household Type | # Households | Household Size |
| Married-Couple | 1,946 (62.6%) | 2.84 |
| Single Male/Father | 14 (0.4%) | 2.14 |
| Single Female/Mother | 199 (6.4%) | 2.92 |
| Non-family | 948 (30.5%) | 1.24 |
| Total Households | 3,107 (100.0%) | 2.36 |
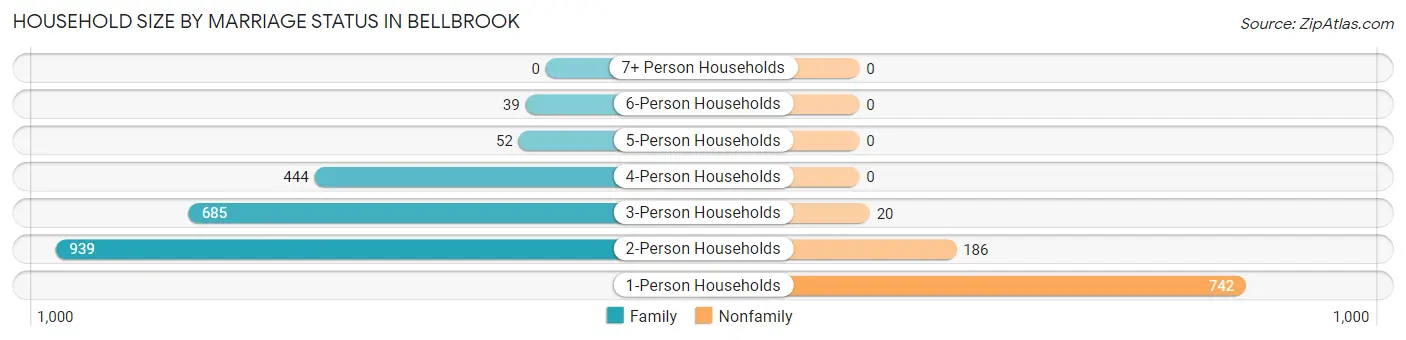
Household Size by Marriage Status in Bellbrook
Out of a total of 3,107 households in Bellbrook, 2,159 (69.5%) are family households, while 948 (30.5%) are nonfamily households. The most numerous type of family households are 2-person households, comprising 939, and the most common type of nonfamily households are 1-person households, comprising 742.
| Household Size | Family Households | Nonfamily Households |
| 1-Person Households | - | 742 (23.9%) |
| 2-Person Households | 939 (30.2%) | 186 (6.0%) |
| 3-Person Households | 685 (22.1%) | 20 (0.6%) |
| 4-Person Households | 444 (14.3%) | 0 (0.0%) |
| 5-Person Households | 52 (1.7%) | 0 (0.0%) |
| 6-Person Households | 39 (1.3%) | 0 (0.0%) |
| 7+ Person Households | 0 (0.0%) | 0 (0.0%) |
| Total | 2,159 (69.5%) | 948 (30.5%) |
Female Fertility in Bellbrook
Fertility by Age in Bellbrook
Average fertility rate in Bellbrook is 81.0 births per 1,000 women. Women in the age bracket of 20 to 34 years have the highest fertility rate with 171.0 births per 1,000 women. Women in the age bracket of 20 to 34 years acount for 88.4% of all women with births.
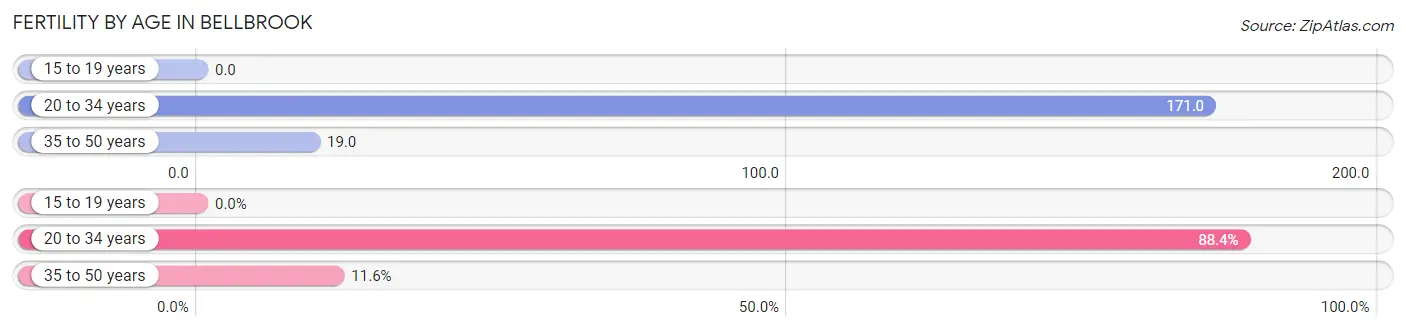
| Age Bracket | Women with Births | Births / 1,000 Women |
| 15 to 19 years | 0 (0.0%) | 0.0 |
| 20 to 34 years | 107 (88.4%) | 171.0 |
| 35 to 50 years | 14 (11.6%) | 19.0 |
| Total | 121 (100.0%) | 81.0 |
Fertility by Age by Marriage Status in Bellbrook
59.5% of women with births (121) in Bellbrook are married. The highest percentage of unmarried women with births falls into 35 to 50 years age bracket with 100.0% of them unmarried at the time of birth, while the lowest percentage of unmarried women with births belong to 20 to 34 years age bracket with 32.7% of them unmarried.
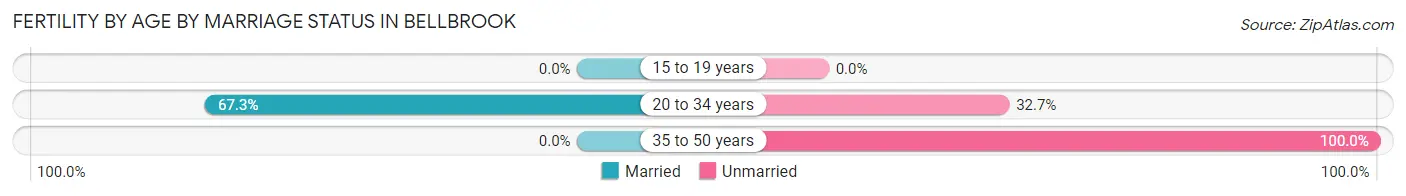
| Age Bracket | Married | Unmarried |
| 15 to 19 years | 0 (0.0%) | 0 (0.0%) |
| 20 to 34 years | 72 (67.3%) | 35 (32.7%) |
| 35 to 50 years | 0 (0.0%) | 14 (100.0%) |
| Total | 72 (59.5%) | 49 (40.5%) |
Fertility by Education in Bellbrook
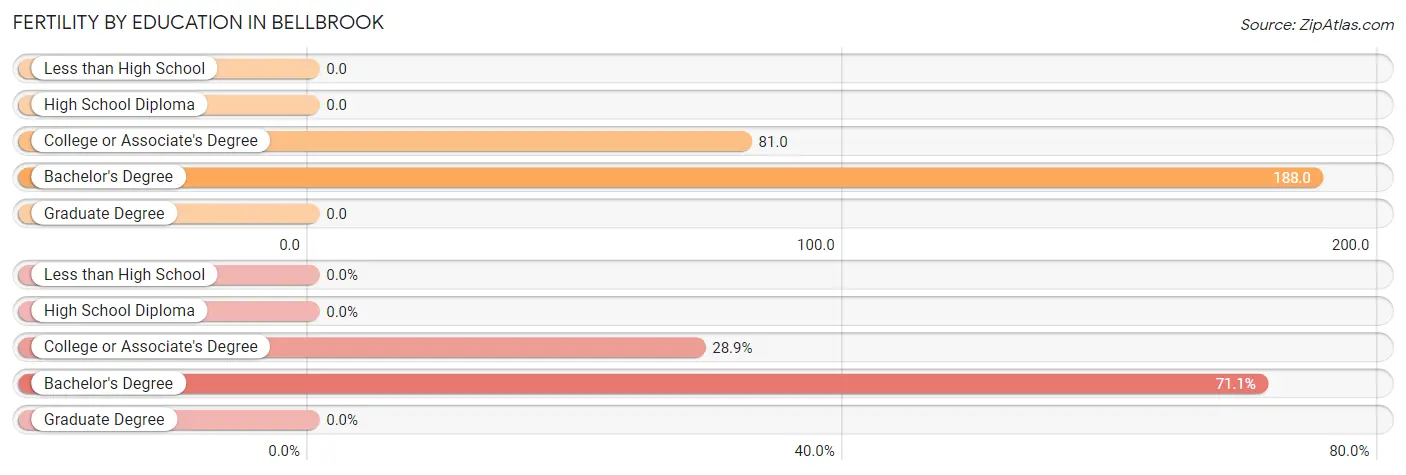
| Educational Attainment | Women with Births | Births / 1,000 Women |
| Less than High School | 0 (0.0%) | 0.0 |
| High School Diploma | 0 (0.0%) | 0.0 |
| College or Associate's Degree | 35 (28.9%) | 81.0 |
| Bachelor's Degree | 86 (71.1%) | 188.0 |
| Graduate Degree | 0 (0.0%) | 0.0 |
| Total | 121 (100.0%) | 81.0 |
Fertility by Education by Marriage Status in Bellbrook
40.5% of women with births in Bellbrook are unmarried. Women with the educational attainment of bachelor's degree are most likely to be married with 83.7% of them married at childbirth, while women with the educational attainment of college or associate's degree are least likely to be married with 100.0% of them unmarried at childbirth.
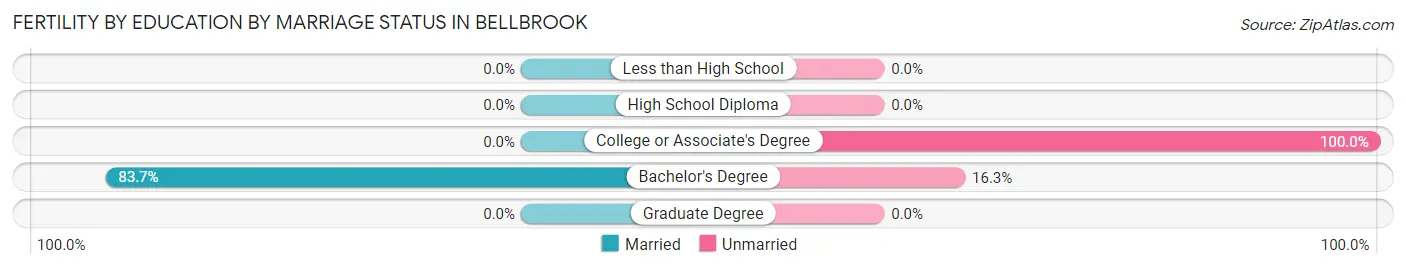
| Educational Attainment | Married | Unmarried |
| Less than High School | 0 (0.0%) | 0 (0.0%) |
| High School Diploma | 0 (0.0%) | 0 (0.0%) |
| College or Associate's Degree | 0 (0.0%) | 35 (100.0%) |
| Bachelor's Degree | 72 (83.7%) | 14 (16.3%) |
| Graduate Degree | 0 (0.0%) | 0 (0.0%) |
| Total | 72 (59.5%) | 49 (40.5%) |
Income in Bellbrook
Income Overview in Bellbrook
Per Capita Income in Bellbrook is $52,940, while median incomes of families and households are $126,189 and $105,631 respectively.
| Characteristic | Number | Measure |
| Per Capita Income | 7,321 | $52,940 |
| Median Family Income | 2,159 | $126,189 |
| Mean Family Income | 2,159 | $145,773 |
| Median Household Income | 3,107 | $105,631 |
| Mean Household Income | 3,107 | $123,883 |
| Income Deficit | 2,159 | $0 |
| Wage / Income Gap (%) | 7,321 | 35.31% |
| Wage / Income Gap ($) | 7,321 | 64.69¢ per $1 |
| Gini / Inequality Index | 7,321 | 0.38 |
Earnings by Sex in Bellbrook
Average Earnings in Bellbrook are $57,673, $70,838 for men and $45,823 for women, a difference of 35.3%.
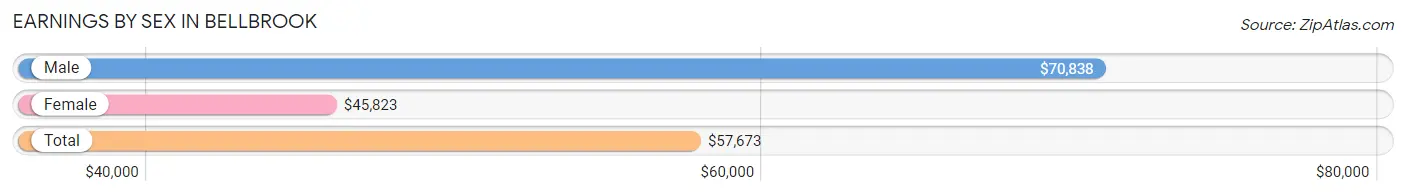
| Sex | Number | Average Earnings |
| Male | 2,383 (54.1%) | $70,838 |
| Female | 2,021 (45.9%) | $45,823 |
| Total | 4,404 (100.0%) | $57,673 |
Earnings by Sex by Income Bracket in Bellbrook
The most common earnings brackets in Bellbrook are $100,000+ for men (592 | 24.8%) and $75,000 to $99,999 for women (348 | 17.2%).
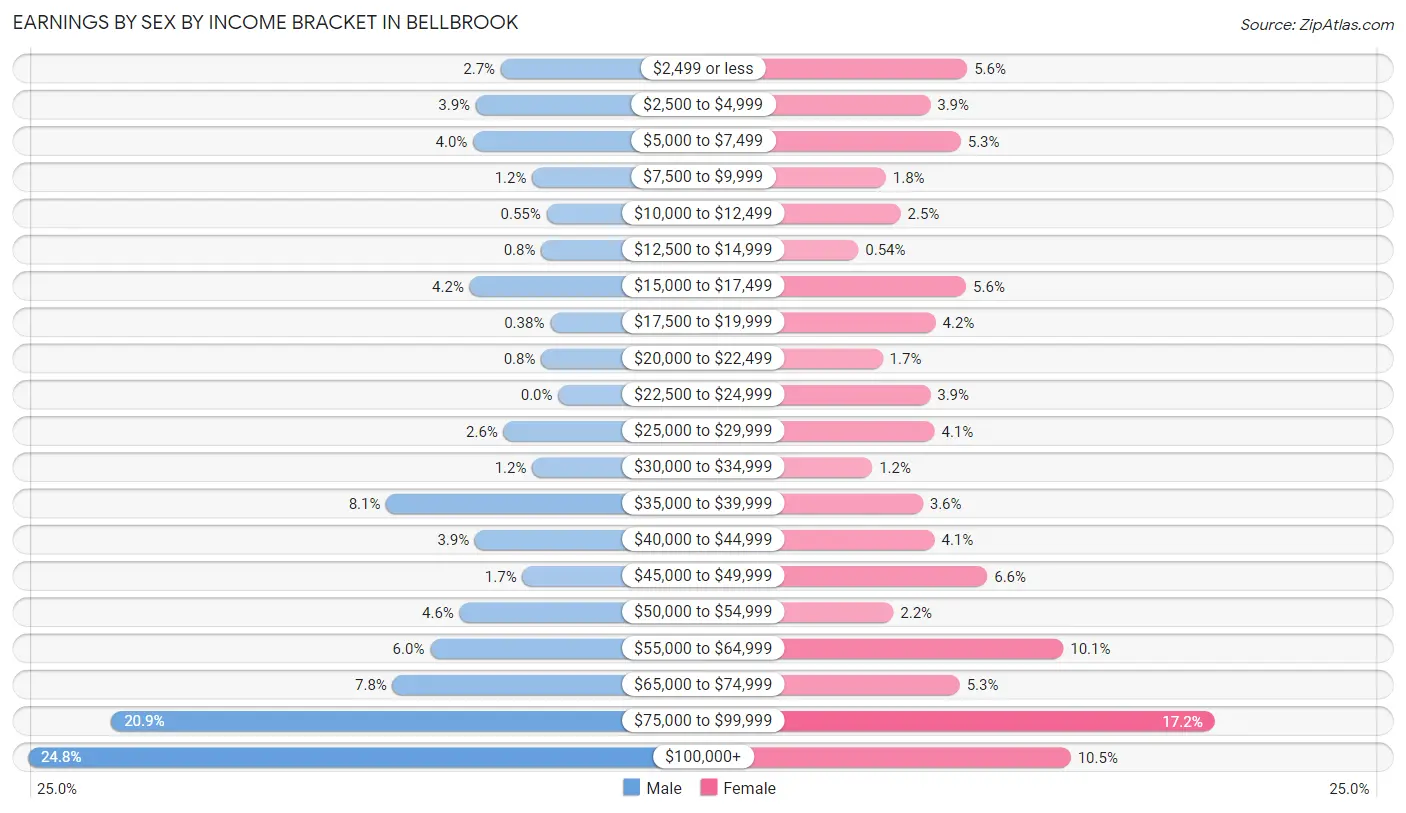
| Income | Male | Female |
| $2,499 or less | 64 (2.7%) | 114 (5.6%) |
| $2,500 to $4,999 | 92 (3.9%) | 79 (3.9%) |
| $5,000 to $7,499 | 95 (4.0%) | 108 (5.3%) |
| $7,500 to $9,999 | 29 (1.2%) | 37 (1.8%) |
| $10,000 to $12,499 | 13 (0.5%) | 51 (2.5%) |
| $12,500 to $14,999 | 19 (0.8%) | 11 (0.5%) |
| $15,000 to $17,499 | 99 (4.2%) | 113 (5.6%) |
| $17,500 to $19,999 | 9 (0.4%) | 84 (4.2%) |
| $20,000 to $22,499 | 19 (0.8%) | 34 (1.7%) |
| $22,500 to $24,999 | 0 (0.0%) | 79 (3.9%) |
| $25,000 to $29,999 | 61 (2.6%) | 83 (4.1%) |
| $30,000 to $34,999 | 29 (1.2%) | 24 (1.2%) |
| $35,000 to $39,999 | 192 (8.1%) | 72 (3.6%) |
| $40,000 to $44,999 | 93 (3.9%) | 83 (4.1%) |
| $45,000 to $49,999 | 40 (1.7%) | 133 (6.6%) |
| $50,000 to $54,999 | 110 (4.6%) | 44 (2.2%) |
| $55,000 to $64,999 | 143 (6.0%) | 205 (10.1%) |
| $65,000 to $74,999 | 185 (7.8%) | 107 (5.3%) |
| $75,000 to $99,999 | 499 (20.9%) | 348 (17.2%) |
| $100,000+ | 592 (24.8%) | 212 (10.5%) |
| Total | 2,383 (100.0%) | 2,021 (100.0%) |
Earnings by Sex by Educational Attainment in Bellbrook
Average earnings in Bellbrook are $78,387 for men and $47,447 for women, a difference of 39.5%. Men with an educational attainment of bachelor's degree enjoy the highest average annual earnings of $92,556, while those with high school diploma education earn the least with $52,371. Women with an educational attainment of graduate degree earn the most with the average annual earnings of $62,868, while those with college or associate's degree education have the smallest earnings of $36,786.
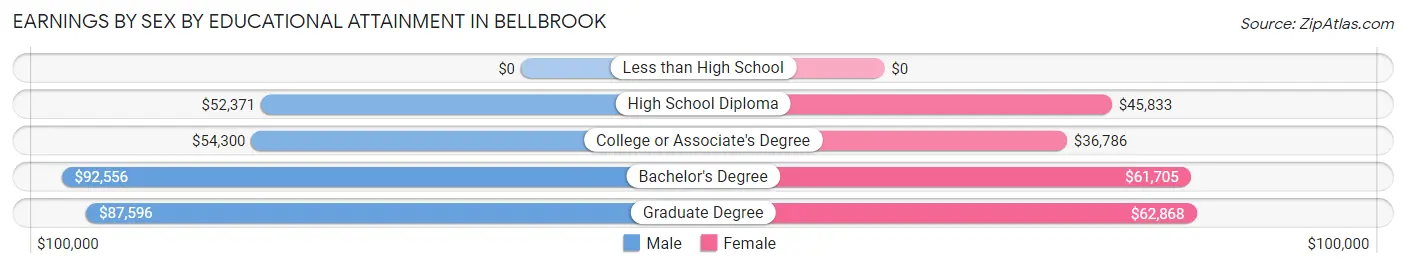
| Educational Attainment | Male Income | Female Income |
| Less than High School | - | - |
| High School Diploma | $52,371 | $45,833 |
| College or Associate's Degree | $54,300 | $36,786 |
| Bachelor's Degree | $92,556 | $61,705 |
| Graduate Degree | $87,596 | $62,868 |
| Total | $78,387 | $47,447 |
Family Income in Bellbrook
Family Income Brackets in Bellbrook
According to the Bellbrook family income data, there are 719 families falling into the $100,000 to $149,999 income range, which is the most common income bracket and makes up 33.3% of all families.
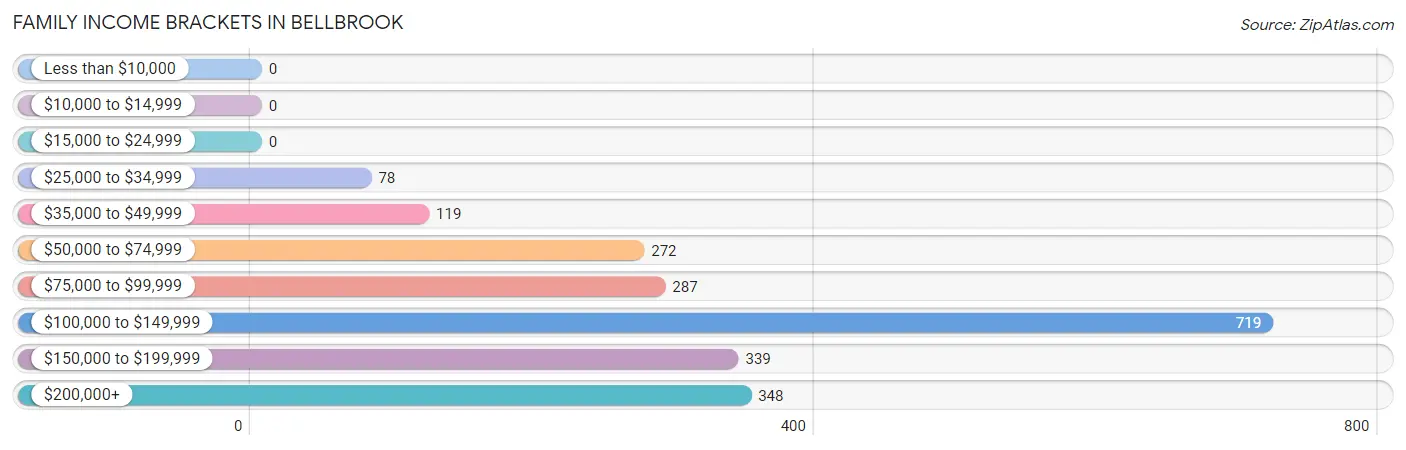
| Income Bracket | # Families | % Families |
| Less than $10,000 | 0 | 0.0% |
| $10,000 to $14,999 | 0 | 0.0% |
| $15,000 to $24,999 | 0 | 0.0% |
| $25,000 to $34,999 | 78 | 3.6% |
| $35,000 to $49,999 | 119 | 5.5% |
| $50,000 to $74,999 | 272 | 12.6% |
| $75,000 to $99,999 | 287 | 13.3% |
| $100,000 to $149,999 | 719 | 33.3% |
| $150,000 to $199,999 | 339 | 15.7% |
| $200,000+ | 348 | 16.1% |
Family Income by Famaliy Size in Bellbrook
3-person families (661 | 30.6%) account for the highest median family income in Bellbrook with $139,931 per family, while 2-person families (963 | 44.6%) have the highest median income of $56,375 per family member.
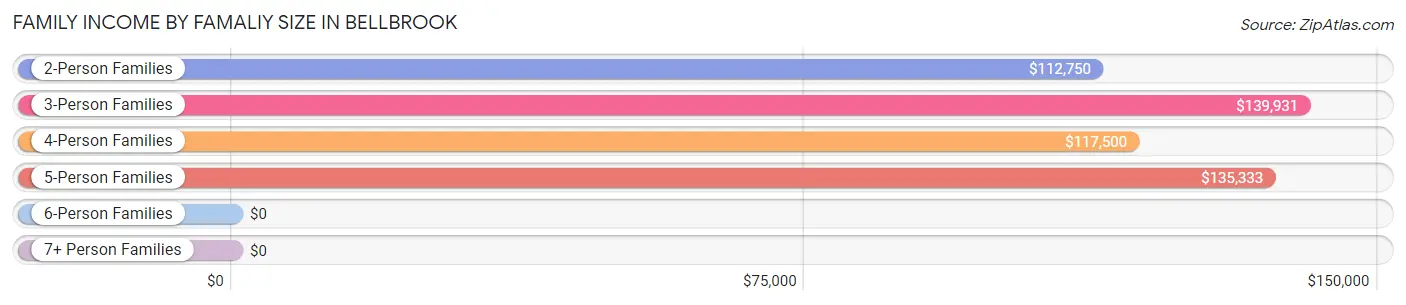
| Income Bracket | # Families | Median Income |
| 2-Person Families | 963 (44.6%) | $112,750 |
| 3-Person Families | 661 (30.6%) | $139,931 |
| 4-Person Families | 444 (20.6%) | $117,500 |
| 5-Person Families | 52 (2.4%) | $135,333 |
| 6-Person Families | 39 (1.8%) | $0 |
| 7+ Person Families | 0 (0.0%) | $0 |
| Total | 2,159 (100.0%) | $126,189 |
Family Income by Number of Earners in Bellbrook
The median family income in Bellbrook is $126,189, with families comprising 3+ earners (246) having the highest median family income of $144,688, while families with no earners (293) have the lowest median family income of $83,839, accounting for 11.4% and 13.6% of families, respectively.
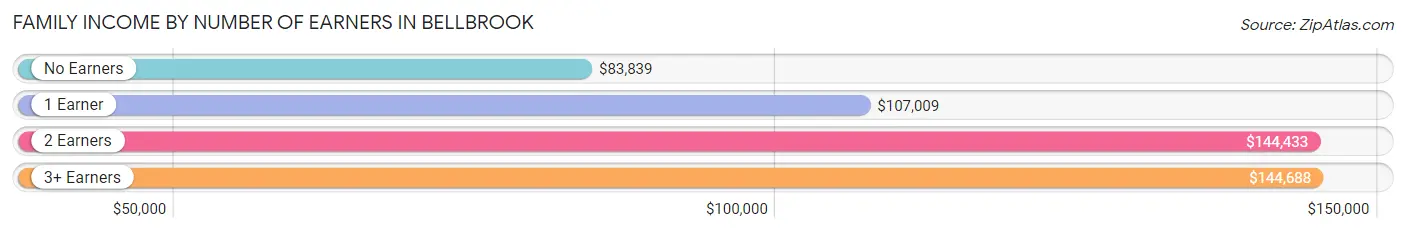
| Number of Earners | # Families | Median Income |
| No Earners | 293 (13.6%) | $83,839 |
| 1 Earner | 545 (25.2%) | $107,009 |
| 2 Earners | 1,075 (49.8%) | $144,433 |
| 3+ Earners | 246 (11.4%) | $144,688 |
| Total | 2,159 (100.0%) | $126,189 |
Household Income in Bellbrook
Household Income Brackets in Bellbrook
With 830 households falling in the category, the $100,000 to $149,999 income range is the most frequent in Bellbrook, accounting for 26.7% of all households. In contrast, only 19 households (0.6%) fall into the less than $10,000 income bracket, making it the least populous group.
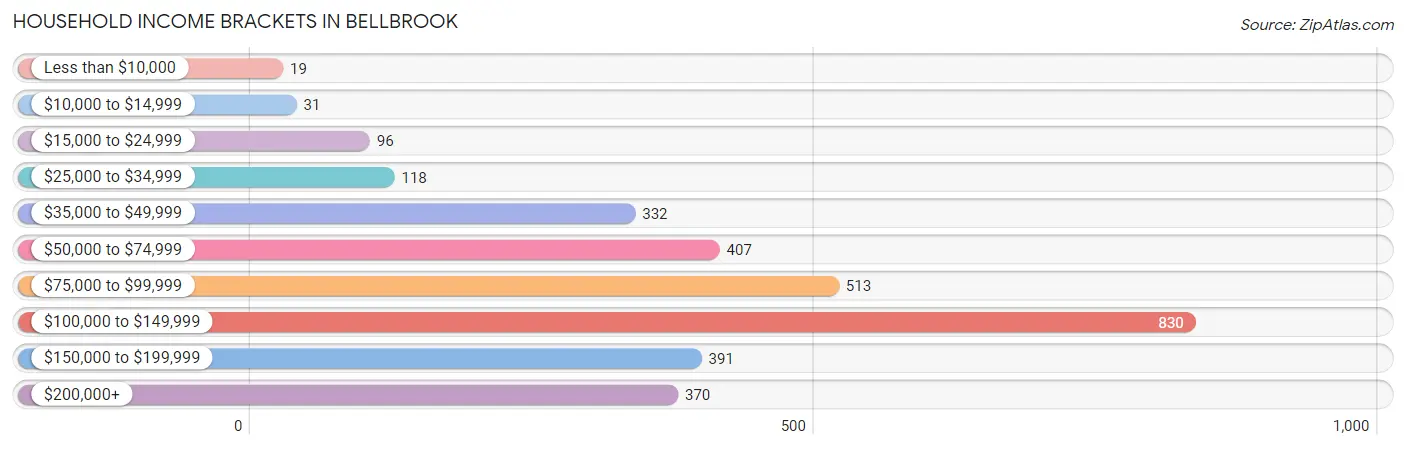
| Income Bracket | # Households | % Households |
| Less than $10,000 | 19 | 0.6% |
| $10,000 to $14,999 | 31 | 1.0% |
| $15,000 to $24,999 | 96 | 3.1% |
| $25,000 to $34,999 | 118 | 3.8% |
| $35,000 to $49,999 | 332 | 10.7% |
| $50,000 to $74,999 | 407 | 13.1% |
| $75,000 to $99,999 | 513 | 16.5% |
| $100,000 to $149,999 | 830 | 26.7% |
| $150,000 to $199,999 | 391 | 12.6% |
| $200,000+ | 370 | 11.9% |
Household Income by Householder Age in Bellbrook
The median household income in Bellbrook is $105,631, with the highest median household income of $115,446 found in the 45 to 64 years age bracket for the primary householder. A total of 1,264 households (40.7%) fall into this category. Meanwhile, the 15 to 24 years age bracket for the primary householder has the lowest median household income of $45,467, with 122 households (3.9%) in this group.
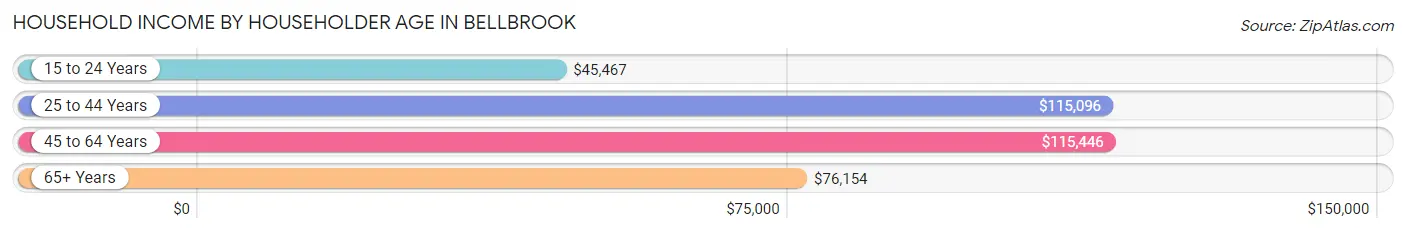
| Income Bracket | # Households | Median Income |
| 15 to 24 Years | 122 (3.9%) | $45,467 |
| 25 to 44 Years | 965 (31.1%) | $115,096 |
| 45 to 64 Years | 1,264 (40.7%) | $115,446 |
| 65+ Years | 756 (24.3%) | $76,154 |
| Total | 3,107 (100.0%) | $105,631 |
Poverty in Bellbrook
Income Below Poverty by Sex and Age in Bellbrook
With 4.8% poverty level for males and 2.1% for females among the residents of Bellbrook, under 5 year old males and 18 to 24 year old females are the most vulnerable to poverty, with 70 males (43.5%) and 35 females (21.2%) in their respective age groups living below the poverty level.
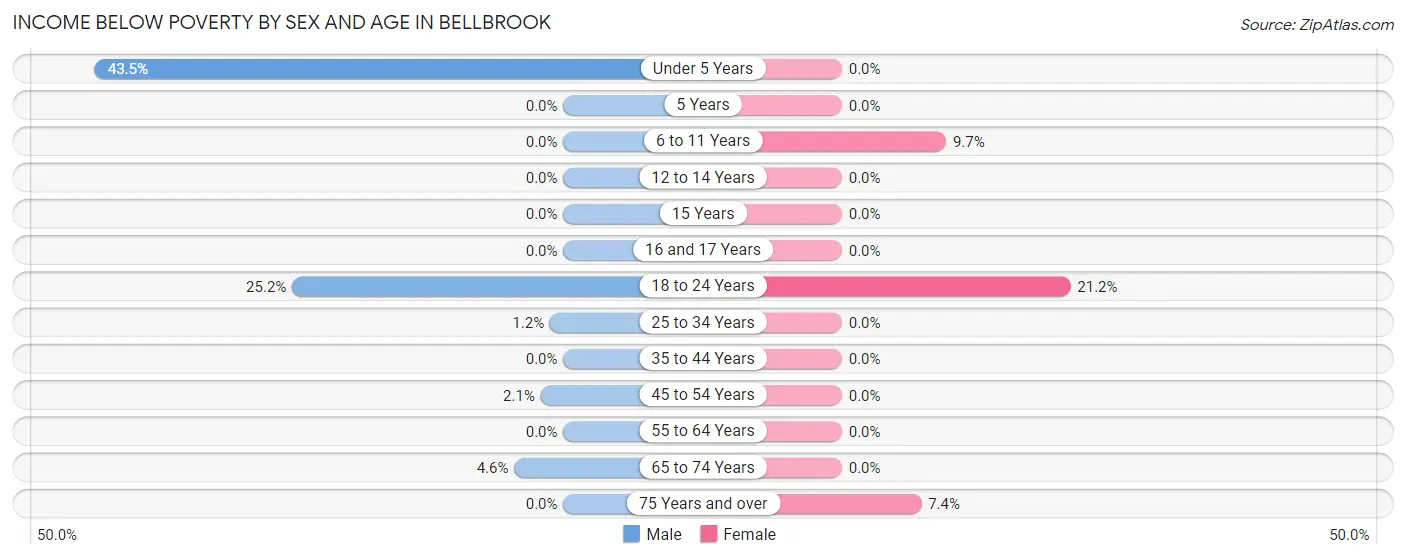
| Age Bracket | Male | Female |
| Under 5 Years | 70 (43.5%) | 0 (0.0%) |
| 5 Years | 0 (0.0%) | 0 (0.0%) |
| 6 to 11 Years | 0 (0.0%) | 26 (9.7%) |
| 12 to 14 Years | 0 (0.0%) | 0 (0.0%) |
| 15 Years | 0 (0.0%) | 0 (0.0%) |
| 16 and 17 Years | 0 (0.0%) | 0 (0.0%) |
| 18 to 24 Years | 75 (25.2%) | 35 (21.2%) |
| 25 to 34 Years | 5 (1.2%) | 0 (0.0%) |
| 35 to 44 Years | 0 (0.0%) | 0 (0.0%) |
| 45 to 54 Years | 9 (2.1%) | 0 (0.0%) |
| 55 to 64 Years | 0 (0.0%) | 0 (0.0%) |
| 65 to 74 Years | 19 (4.5%) | 0 (0.0%) |
| 75 Years and over | 0 (0.0%) | 14 (7.4%) |
| Total | 178 (4.8%) | 75 (2.1%) |
Income Above Poverty by Sex and Age in Bellbrook
According to the poverty statistics in Bellbrook, males aged 5 years and females aged under 5 years are the age groups that are most secure financially, with 100.0% of males and 100.0% of females in these age groups living above the poverty line.
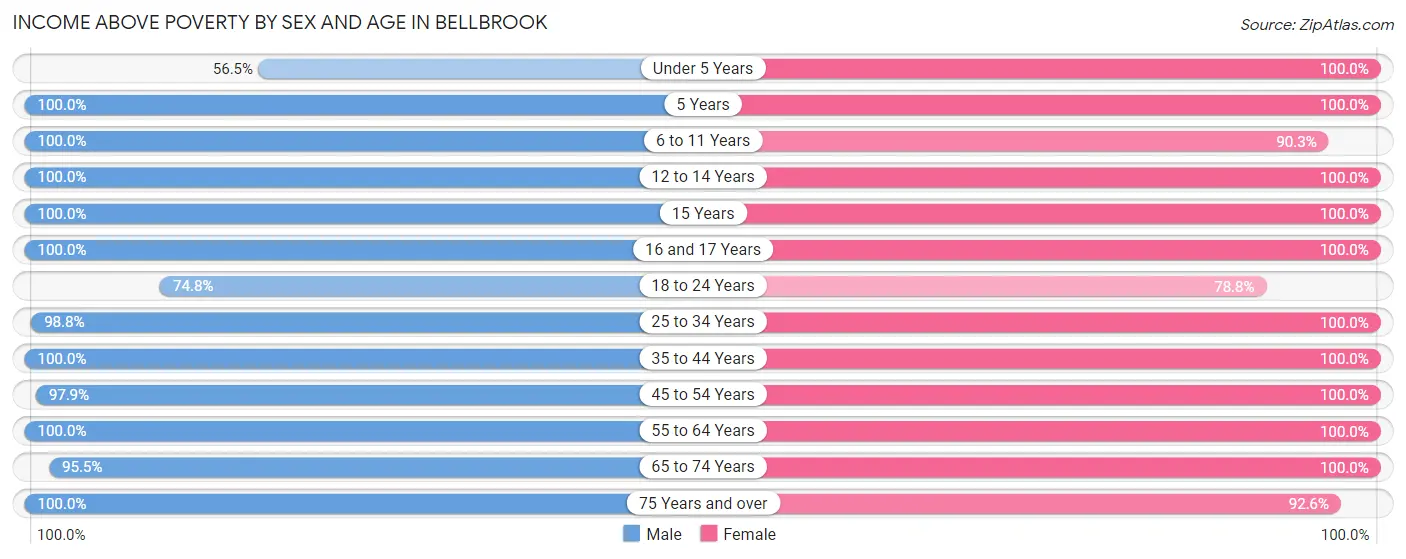
| Age Bracket | Male | Female |
| Under 5 Years | 91 (56.5%) | 188 (100.0%) |
| 5 Years | 60 (100.0%) | 19 (100.0%) |
| 6 to 11 Years | 157 (100.0%) | 243 (90.3%) |
| 12 to 14 Years | 160 (100.0%) | 95 (100.0%) |
| 15 Years | 31 (100.0%) | 28 (100.0%) |
| 16 and 17 Years | 187 (100.0%) | 49 (100.0%) |
| 18 to 24 Years | 223 (74.8%) | 130 (78.8%) |
| 25 to 34 Years | 399 (98.8%) | 527 (100.0%) |
| 35 to 44 Years | 651 (100.0%) | 369 (100.0%) |
| 45 to 54 Years | 420 (97.9%) | 498 (100.0%) |
| 55 to 64 Years | 572 (100.0%) | 776 (100.0%) |
| 65 to 74 Years | 399 (95.5%) | 391 (100.0%) |
| 75 Years and over | 216 (100.0%) | 176 (92.6%) |
| Total | 3,566 (95.3%) | 3,489 (97.9%) |
Income Below Poverty Among Married-Couple Families in Bellbrook
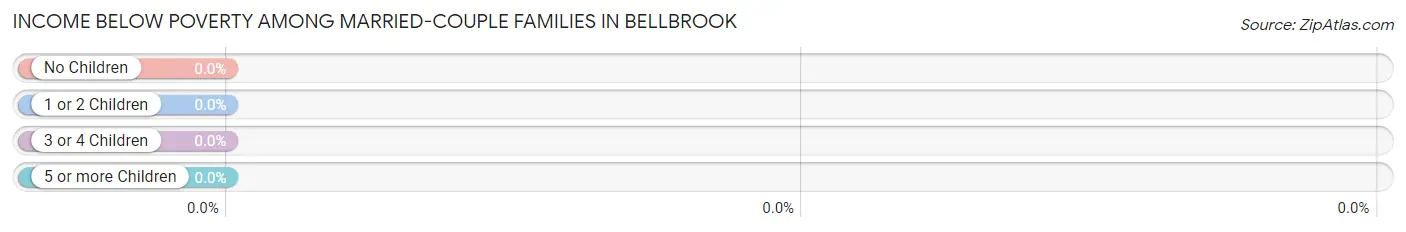
| Children | Above Poverty | Below Poverty |
| No Children | 1,162 (100.0%) | 0 (0.0%) |
| 1 or 2 Children | 712 (100.0%) | 0 (0.0%) |
| 3 or 4 Children | 72 (100.0%) | 0 (0.0%) |
| 5 or more Children | 0 (0.0%) | 0 (0.0%) |
| Total | 1,946 (100.0%) | 0 (0.0%) |
Income Below Poverty Among Single-Parent Households in Bellbrook
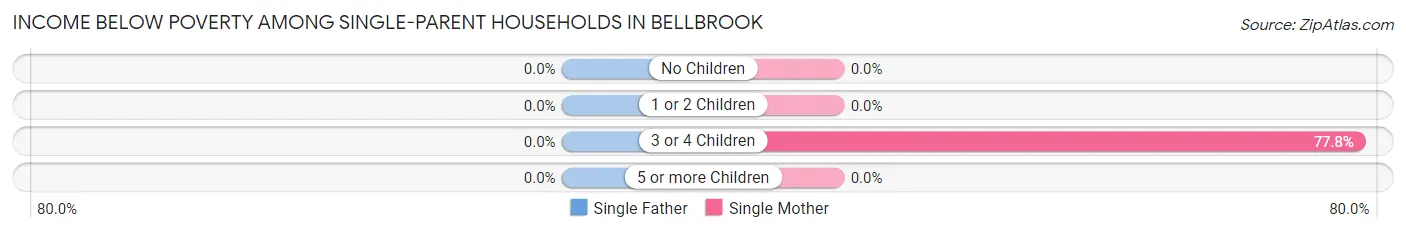
| Children | Single Father | Single Mother |
| No Children | 0 (0.0%) | 0 (0.0%) |
| 1 or 2 Children | 0 (0.0%) | 0 (0.0%) |
| 3 or 4 Children | 0 (0.0%) | 35 (77.8%) |
| 5 or more Children | 0 (0.0%) | 0 (0.0%) |
| Total | 0 (0.0%) | 35 (17.6%) |
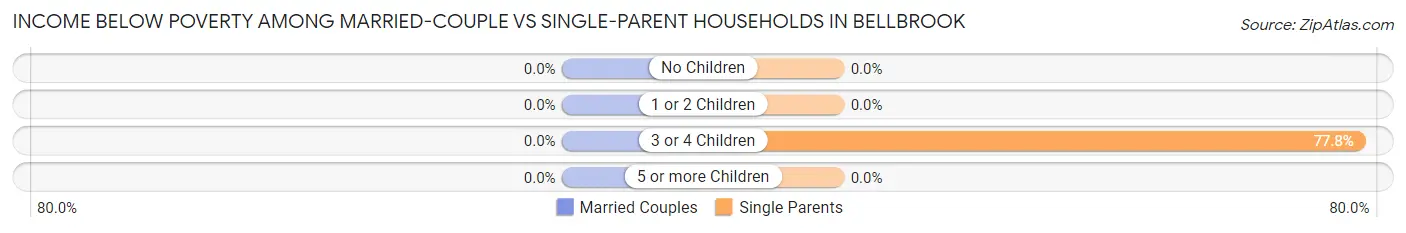
Income Below Poverty Among Married-Couple vs Single-Parent Households in Bellbrook
| Children | Married-Couple Families | Single-Parent Households |
| No Children | 0 (0.0%) | 0 (0.0%) |
| 1 or 2 Children | 0 (0.0%) | 0 (0.0%) |
| 3 or 4 Children | 0 (0.0%) | 35 (77.8%) |
| 5 or more Children | 0 (0.0%) | 0 (0.0%) |
| Total | 0 (0.0%) | 35 (16.4%) |
Employment Characteristics in Bellbrook
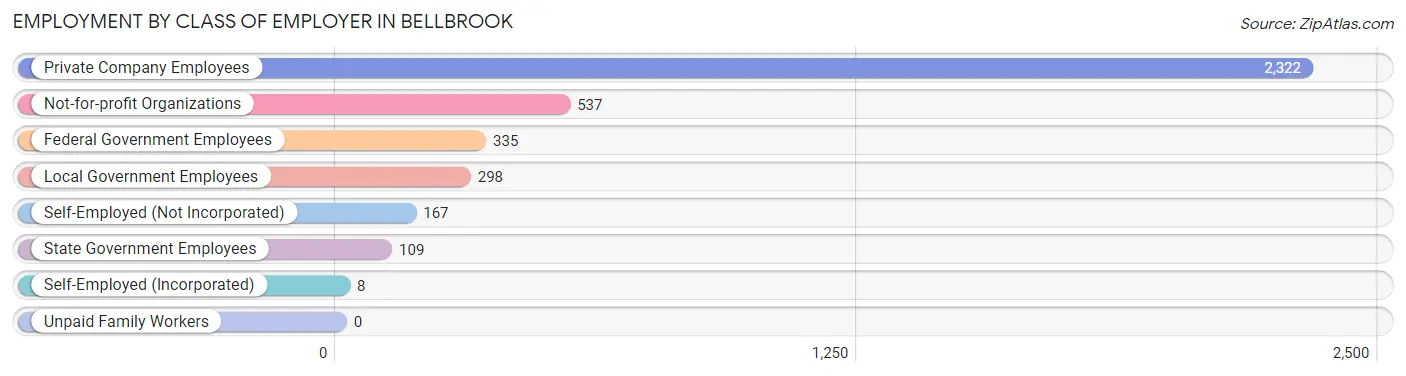
Employment by Class of Employer in Bellbrook
Among the 3,776 employed individuals in Bellbrook, private company employees (2,322 | 61.5%), not-for-profit organizations (537 | 14.2%), and federal government employees (335 | 8.9%) make up the most common classes of employment.
| Employer Class | # Employees | % Employees |
| Private Company Employees | 2,322 | 61.5% |
| Self-Employed (Incorporated) | 8 | 0.2% |
| Self-Employed (Not Incorporated) | 167 | 4.4% |
| Not-for-profit Organizations | 537 | 14.2% |
| Local Government Employees | 298 | 7.9% |
| State Government Employees | 109 | 2.9% |
| Federal Government Employees | 335 | 8.9% |
| Unpaid Family Workers | 0 | 0.0% |
| Total | 3,776 | 100.0% |
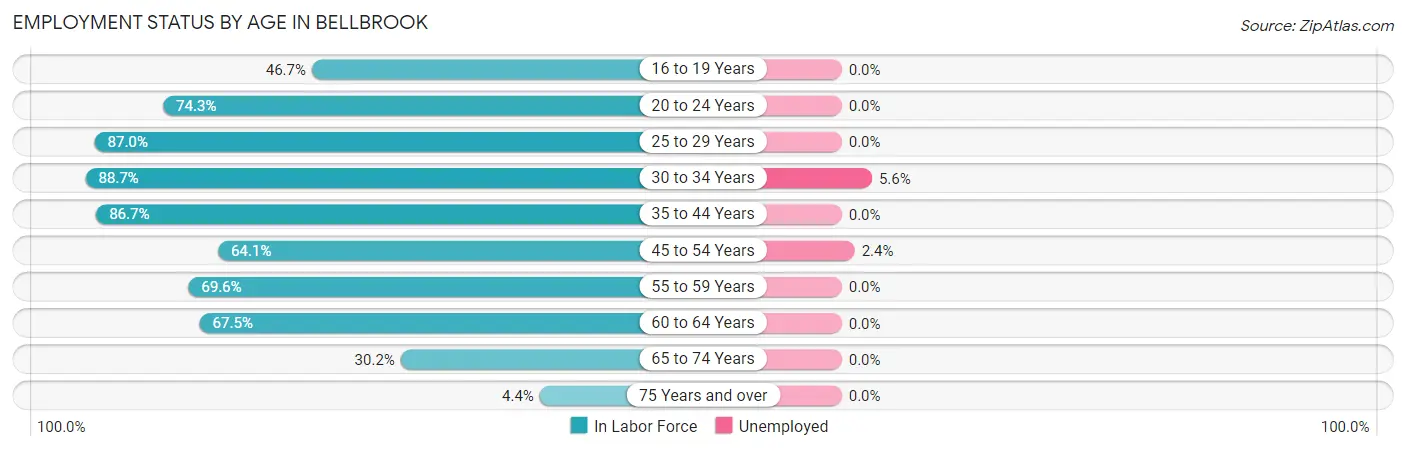
Employment Status by Age in Bellbrook
According to the labor force statistics for Bellbrook, out of the total population over 16 years of age (6,140), 63.4% or 3,893 individuals are in the labor force, with 1.0% or 39 of them unemployed. The age group with the highest labor force participation rate is 30 to 34 years, with 88.7% or 430 individuals in the labor force. Within the labor force, the 30 to 34 years age range has the highest percentage of unemployed individuals, with 5.6% or 24 of them being unemployed.
| Age Bracket | In Labor Force | Unemployed |
| 16 to 19 Years | 188 (46.7%) | 0 (0.0%) |
| 20 to 24 Years | 220 (74.3%) | 0 (0.0%) |
| 25 to 29 Years | 388 (87.0%) | 0 (0.0%) |
| 30 to 34 Years | 430 (88.7%) | 24 (5.6%) |
| 35 to 44 Years | 884 (86.7%) | 0 (0.0%) |
| 45 to 54 Years | 594 (64.1%) | 14 (2.4%) |
| 55 to 59 Years | 504 (69.6%) | 0 (0.0%) |
| 60 to 64 Years | 421 (67.5%) | 0 (0.0%) |
| 65 to 74 Years | 244 (30.2%) | 0 (0.0%) |
| 75 Years and over | 18 (4.4%) | 0 (0.0%) |
| Total | 3,893 (63.4%) | 39 (1.0%) |
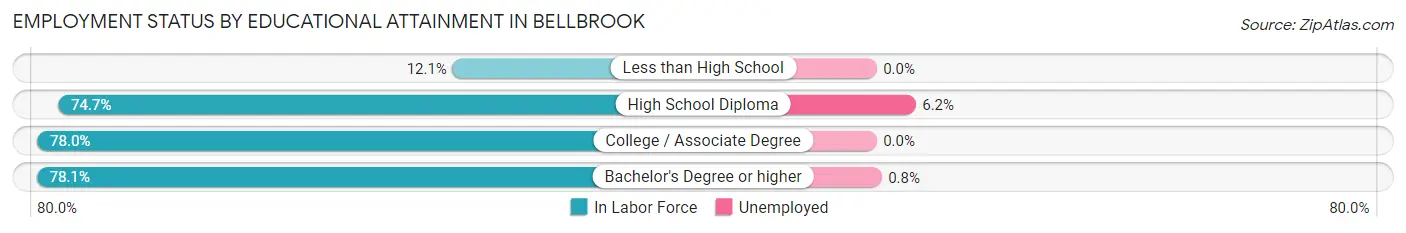
Employment Status by Educational Attainment in Bellbrook
According to labor force statistics for Bellbrook, 76.2% of individuals (3,220) out of the total population between 25 and 64 years of age (4,226) are in the labor force, with 1.2% or 39 of them being unemployed. The group with the highest labor force participation rate are those with the educational attainment of bachelor's degree or higher, with 78.1% or 1,828 individuals in the labor force. Within the labor force, individuals with high school diploma education have the highest percentage of unemployment, with 6.2% or 24 of them being unemployed.
| Educational Attainment | In Labor Force | Unemployed |
| Less than High School | 11 (12.1%) | 0 (0.0%) |
| High School Diploma | 386 (74.7%) | 32 (6.2%) |
| College / Associate Degree | 996 (78.0%) | 0 (0.0%) |
| Bachelor's Degree or higher | 1,828 (78.1%) | 19 (0.8%) |
| Total | 3,220 (76.2%) | 51 (1.2%) |
Employment Occupations by Sex in Bellbrook
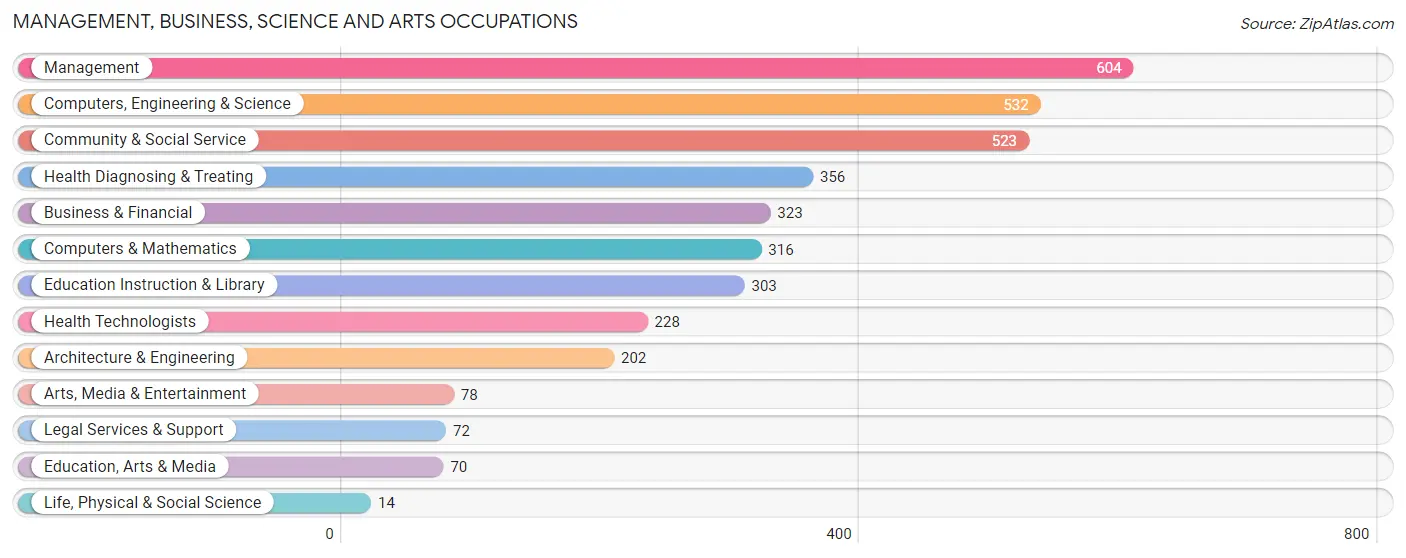
Management, Business, Science and Arts Occupations
The most common Management, Business, Science and Arts occupations in Bellbrook are Management (604 | 15.8%), Computers, Engineering & Science (532 | 13.9%), Community & Social Service (523 | 13.7%), Health Diagnosing & Treating (356 | 9.3%), and Business & Financial (323 | 8.4%).
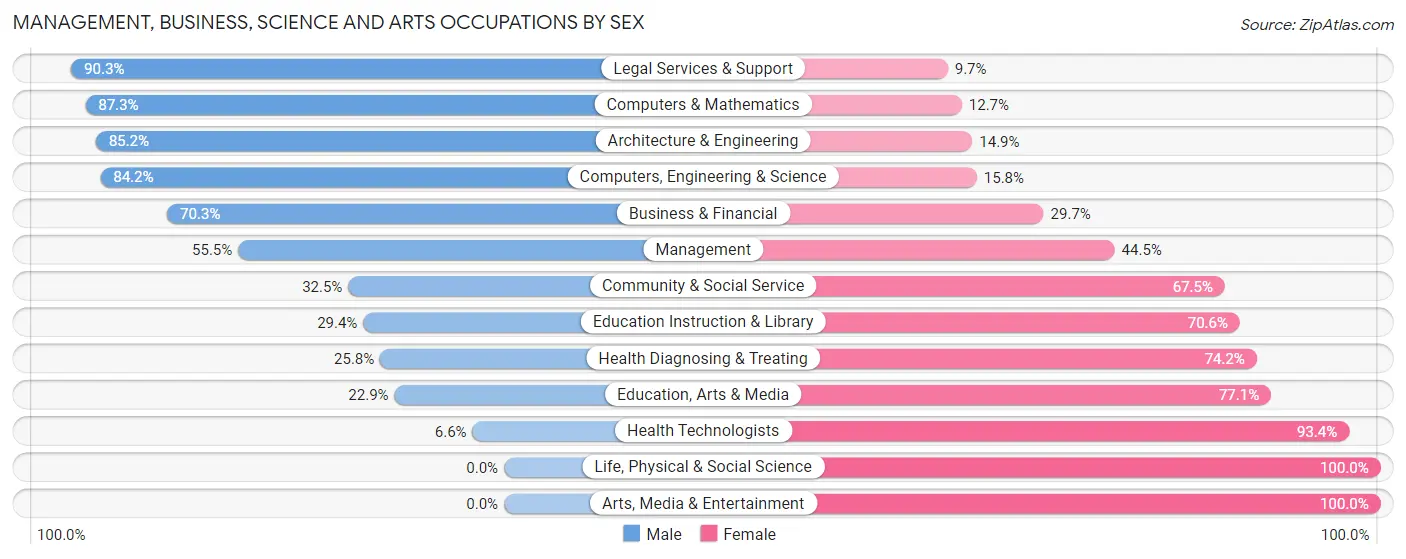
Management, Business, Science and Arts Occupations by Sex
Within the Management, Business, Science and Arts occupations in Bellbrook, the most male-oriented occupations are Legal Services & Support (90.3%), Computers & Mathematics (87.3%), and Architecture & Engineering (85.2%), while the most female-oriented occupations are Life, Physical & Social Science (100.0%), Arts, Media & Entertainment (100.0%), and Health Technologists (93.4%).
| Occupation | Male | Female |
| Management | 335 (55.5%) | 269 (44.5%) |
| Business & Financial | 227 (70.3%) | 96 (29.7%) |
| Computers, Engineering & Science | 448 (84.2%) | 84 (15.8%) |
| Computers & Mathematics | 276 (87.3%) | 40 (12.7%) |
| Architecture & Engineering | 172 (85.2%) | 30 (14.8%) |
| Life, Physical & Social Science | 0 (0.0%) | 14 (100.0%) |
| Community & Social Service | 170 (32.5%) | 353 (67.5%) |
| Education, Arts & Media | 16 (22.9%) | 54 (77.1%) |
| Legal Services & Support | 65 (90.3%) | 7 (9.7%) |
| Education Instruction & Library | 89 (29.4%) | 214 (70.6%) |
| Arts, Media & Entertainment | 0 (0.0%) | 78 (100.0%) |
| Health Diagnosing & Treating | 92 (25.8%) | 264 (74.2%) |
| Health Technologists | 15 (6.6%) | 213 (93.4%) |
| Total (Category) | 1,272 (54.4%) | 1,066 (45.6%) |
| Total (Overall) | 2,155 (56.3%) | 1,670 (43.7%) |
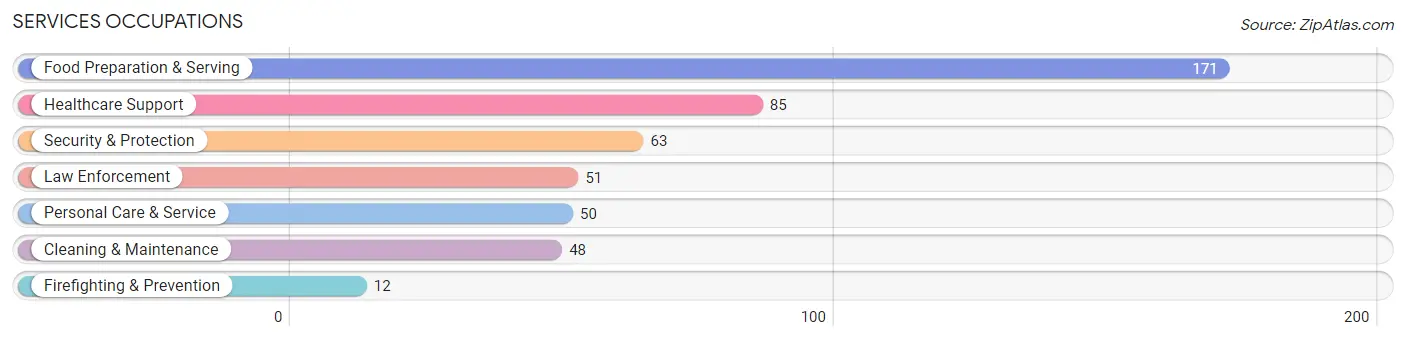
Services Occupations
The most common Services occupations in Bellbrook are Food Preparation & Serving (171 | 4.5%), Healthcare Support (85 | 2.2%), Security & Protection (63 | 1.7%), Law Enforcement (51 | 1.3%), and Personal Care & Service (50 | 1.3%).
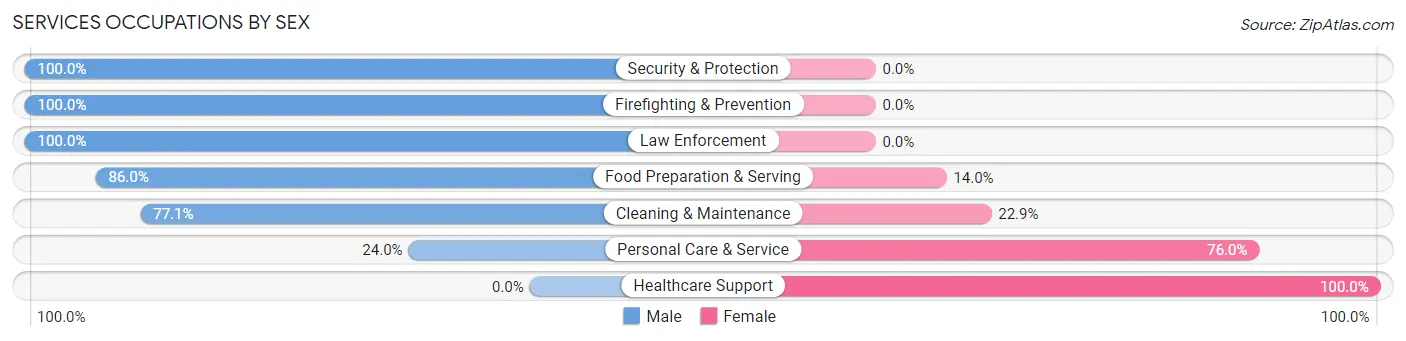
Services Occupations by Sex
Within the Services occupations in Bellbrook, the most male-oriented occupations are Security & Protection (100.0%), Firefighting & Prevention (100.0%), and Law Enforcement (100.0%), while the most female-oriented occupations are Healthcare Support (100.0%), Personal Care & Service (76.0%), and Cleaning & Maintenance (22.9%).
| Occupation | Male | Female |
| Healthcare Support | 0 (0.0%) | 85 (100.0%) |
| Security & Protection | 63 (100.0%) | 0 (0.0%) |
| Firefighting & Prevention | 12 (100.0%) | 0 (0.0%) |
| Law Enforcement | 51 (100.0%) | 0 (0.0%) |
| Food Preparation & Serving | 147 (86.0%) | 24 (14.0%) |
| Cleaning & Maintenance | 37 (77.1%) | 11 (22.9%) |
| Personal Care & Service | 12 (24.0%) | 38 (76.0%) |
| Total (Category) | 259 (62.1%) | 158 (37.9%) |
| Total (Overall) | 2,155 (56.3%) | 1,670 (43.7%) |
Sales and Office Occupations
The most common Sales and Office occupations in Bellbrook are Sales & Related (455 | 11.9%), and Office & Administration (327 | 8.6%).

Sales and Office Occupations by Sex
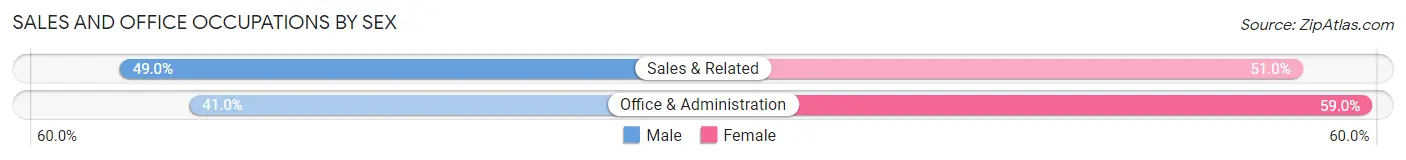
| Occupation | Male | Female |
| Sales & Related | 223 (49.0%) | 232 (51.0%) |
| Office & Administration | 134 (41.0%) | 193 (59.0%) |
| Total (Category) | 357 (45.7%) | 425 (54.3%) |
| Total (Overall) | 2,155 (56.3%) | 1,670 (43.7%) |
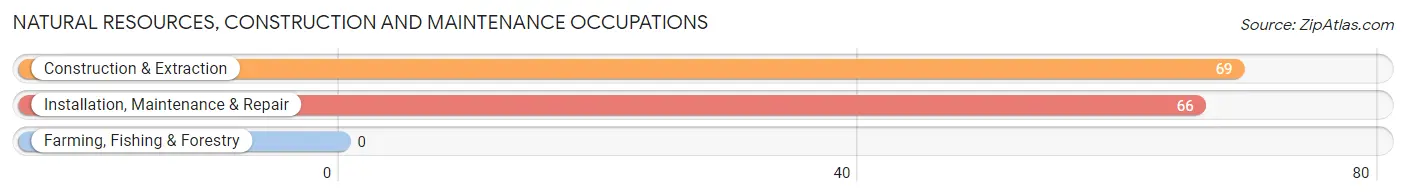
Natural Resources, Construction and Maintenance Occupations
The most common Natural Resources, Construction and Maintenance occupations in Bellbrook are Construction & Extraction (69 | 1.8%), and Installation, Maintenance & Repair (66 | 1.7%).
Natural Resources, Construction and Maintenance Occupations by Sex
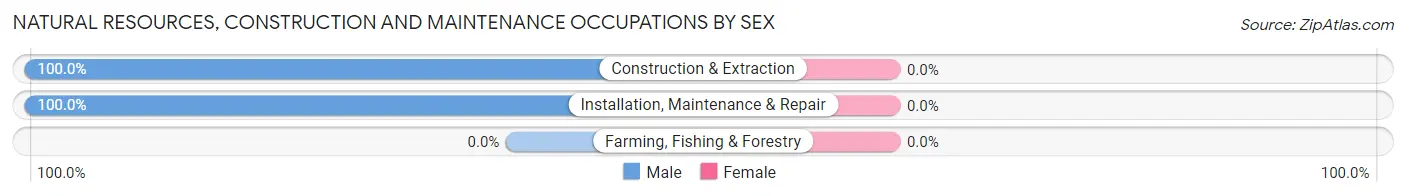
| Occupation | Male | Female |
| Farming, Fishing & Forestry | 0 (0.0%) | 0 (0.0%) |
| Construction & Extraction | 69 (100.0%) | 0 (0.0%) |
| Installation, Maintenance & Repair | 66 (100.0%) | 0 (0.0%) |
| Total (Category) | 135 (100.0%) | 0 (0.0%) |
| Total (Overall) | 2,155 (56.3%) | 1,670 (43.7%) |
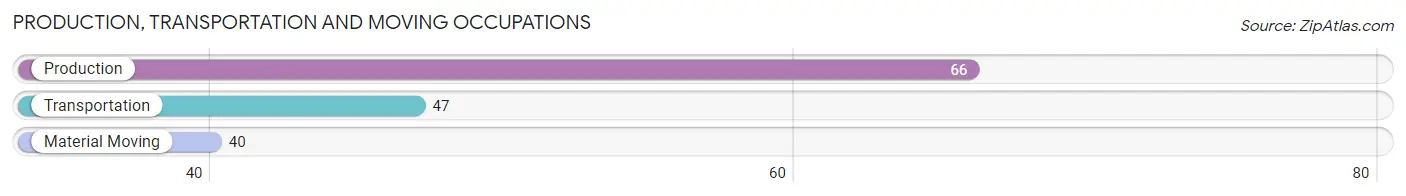
Production, Transportation and Moving Occupations
The most common Production, Transportation and Moving occupations in Bellbrook are Production (66 | 1.7%), Transportation (47 | 1.2%), and Material Moving (40 | 1.1%).
Production, Transportation and Moving Occupations by Sex
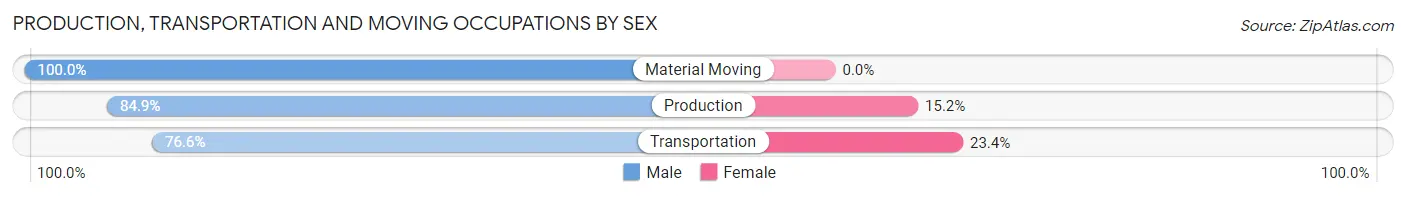
| Occupation | Male | Female |
| Production | 56 (84.9%) | 10 (15.1%) |
| Transportation | 36 (76.6%) | 11 (23.4%) |
| Material Moving | 40 (100.0%) | 0 (0.0%) |
| Total (Category) | 132 (86.3%) | 21 (13.7%) |
| Total (Overall) | 2,155 (56.3%) | 1,670 (43.7%) |
Employment Industries by Sex in Bellbrook
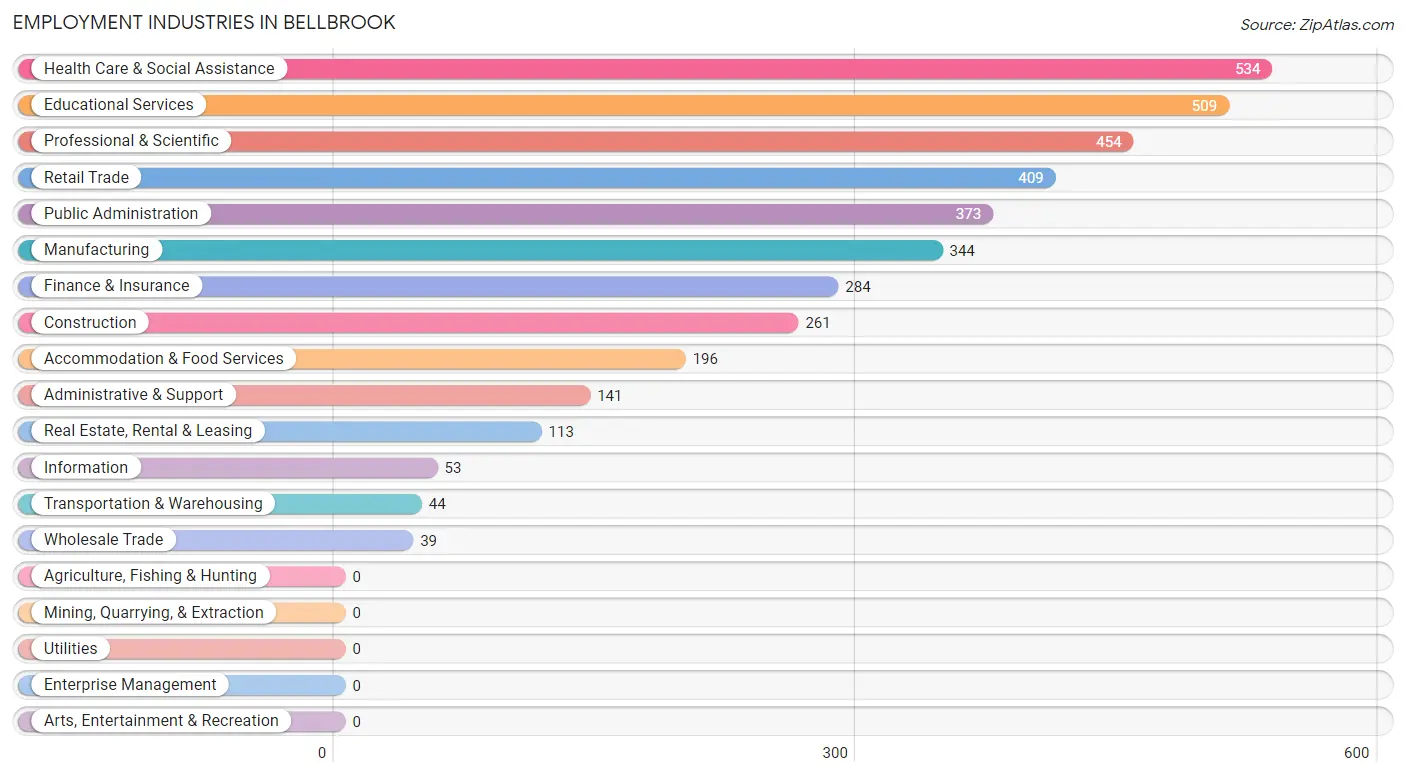
Employment Industries in Bellbrook
The major employment industries in Bellbrook include Health Care & Social Assistance (534 | 14.0%), Educational Services (509 | 13.3%), Professional & Scientific (454 | 11.9%), Retail Trade (409 | 10.7%), and Public Administration (373 | 9.8%).
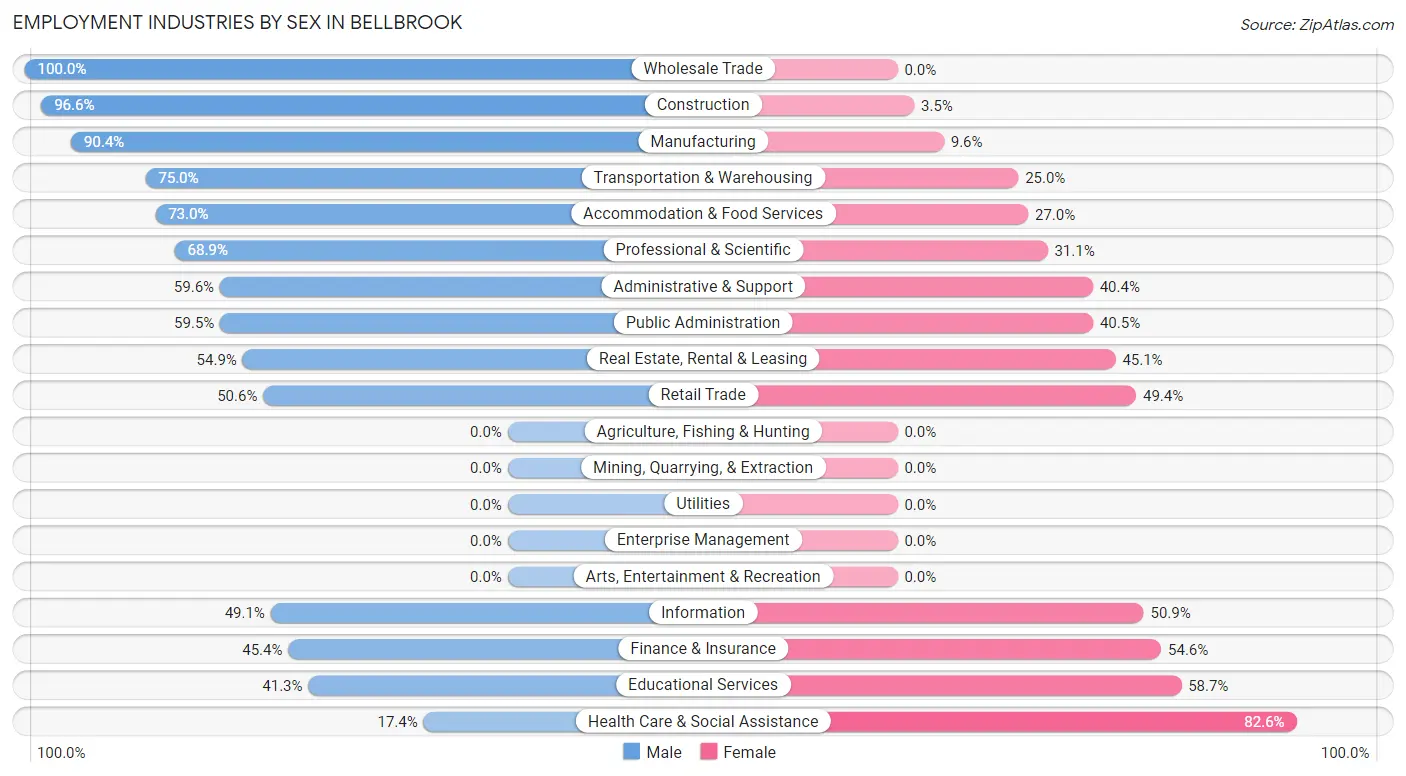
Employment Industries by Sex in Bellbrook
The Bellbrook industries that see more men than women are Wholesale Trade (100.0%), Construction (96.6%), and Manufacturing (90.4%), whereas the industries that tend to have a higher number of women are Health Care & Social Assistance (82.6%), Educational Services (58.7%), and Finance & Insurance (54.6%).
| Industry | Male | Female |
| Agriculture, Fishing & Hunting | 0 (0.0%) | 0 (0.0%) |
| Mining, Quarrying, & Extraction | 0 (0.0%) | 0 (0.0%) |
| Construction | 252 (96.6%) | 9 (3.5%) |
| Manufacturing | 311 (90.4%) | 33 (9.6%) |
| Wholesale Trade | 39 (100.0%) | 0 (0.0%) |
| Retail Trade | 207 (50.6%) | 202 (49.4%) |
| Transportation & Warehousing | 33 (75.0%) | 11 (25.0%) |
| Utilities | 0 (0.0%) | 0 (0.0%) |
| Information | 26 (49.1%) | 27 (50.9%) |
| Finance & Insurance | 129 (45.4%) | 155 (54.6%) |
| Real Estate, Rental & Leasing | 62 (54.9%) | 51 (45.1%) |
| Professional & Scientific | 313 (68.9%) | 141 (31.1%) |
| Enterprise Management | 0 (0.0%) | 0 (0.0%) |
| Administrative & Support | 84 (59.6%) | 57 (40.4%) |
| Educational Services | 210 (41.3%) | 299 (58.7%) |
| Health Care & Social Assistance | 93 (17.4%) | 441 (82.6%) |
| Arts, Entertainment & Recreation | 0 (0.0%) | 0 (0.0%) |
| Accommodation & Food Services | 143 (73.0%) | 53 (27.0%) |
| Public Administration | 222 (59.5%) | 151 (40.5%) |
| Total | 2,155 (56.3%) | 1,670 (43.7%) |
Education in Bellbrook
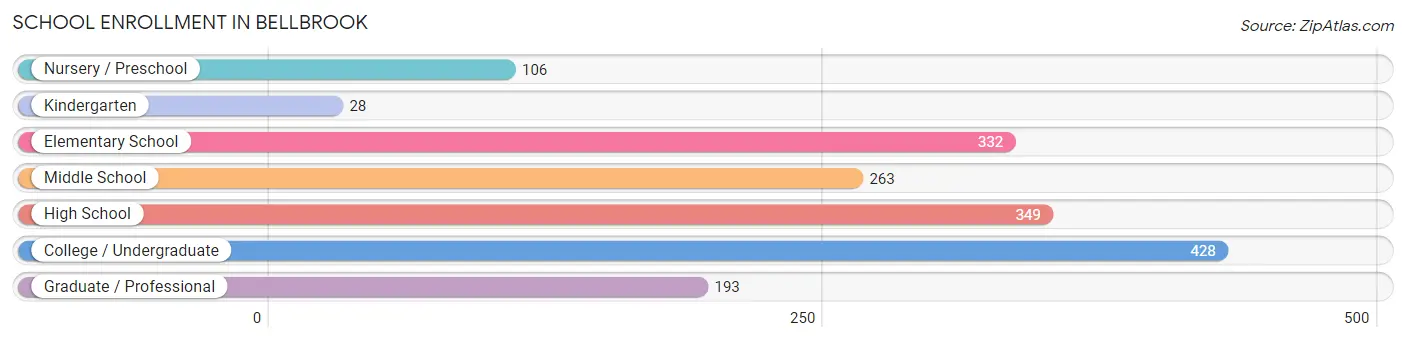
School Enrollment in Bellbrook
The most common levels of schooling among the 1,699 students in Bellbrook are college / undergraduate (428 | 25.2%), high school (349 | 20.5%), and elementary school (332 | 19.5%).
| School Level | # Students | % Students |
| Nursery / Preschool | 106 | 6.2% |
| Kindergarten | 28 | 1.7% |
| Elementary School | 332 | 19.5% |
| Middle School | 263 | 15.5% |
| High School | 349 | 20.5% |
| College / Undergraduate | 428 | 25.2% |
| Graduate / Professional | 193 | 11.4% |
| Total | 1,699 | 100.0% |
School Enrollment by Age by Funding Source in Bellbrook
Out of a total of 1,699 students who are enrolled in schools in Bellbrook, 289 (17.0%) attend a private institution, while the remaining 1,410 (83.0%) are enrolled in public schools. The age group of 3 to 4 year olds has the highest likelihood of being enrolled in private schools, with 36 (78.3% in the age bracket) enrolled. Conversely, the age group of 10 to 14 year olds has the lowest likelihood of being enrolled in a private school, with 334 (100.0% in the age bracket) attending a public institution.
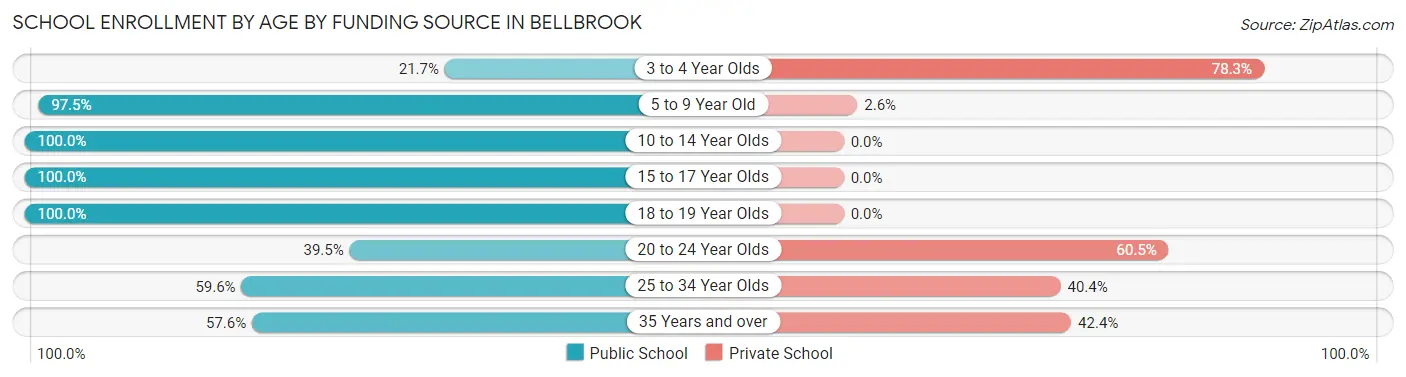
| Age Bracket | Public School | Private School |
| 3 to 4 Year Olds | 10 (21.7%) | 36 (78.3%) |
| 5 to 9 Year Old | 382 (97.5%) | 10 (2.5%) |
| 10 to 14 Year Olds | 334 (100.0%) | 0 (0.0%) |
| 15 to 17 Year Olds | 295 (100.0%) | 0 (0.0%) |
| 18 to 19 Year Olds | 128 (100.0%) | 0 (0.0%) |
| 20 to 24 Year Olds | 75 (39.5%) | 115 (60.5%) |
| 25 to 34 Year Olds | 152 (59.6%) | 103 (40.4%) |
| 35 Years and over | 34 (57.6%) | 25 (42.4%) |
| Total | 1,410 (83.0%) | 289 (17.0%) |
Educational Attainment by Field of Study in Bellbrook
Education (526 | 16.7%), business (467 | 14.8%), engineering (449 | 14.2%), science & technology (357 | 11.3%), and social sciences (210 | 6.7%) are the most common fields of study among 3,157 individuals in Bellbrook who have obtained a bachelor's degree or higher.
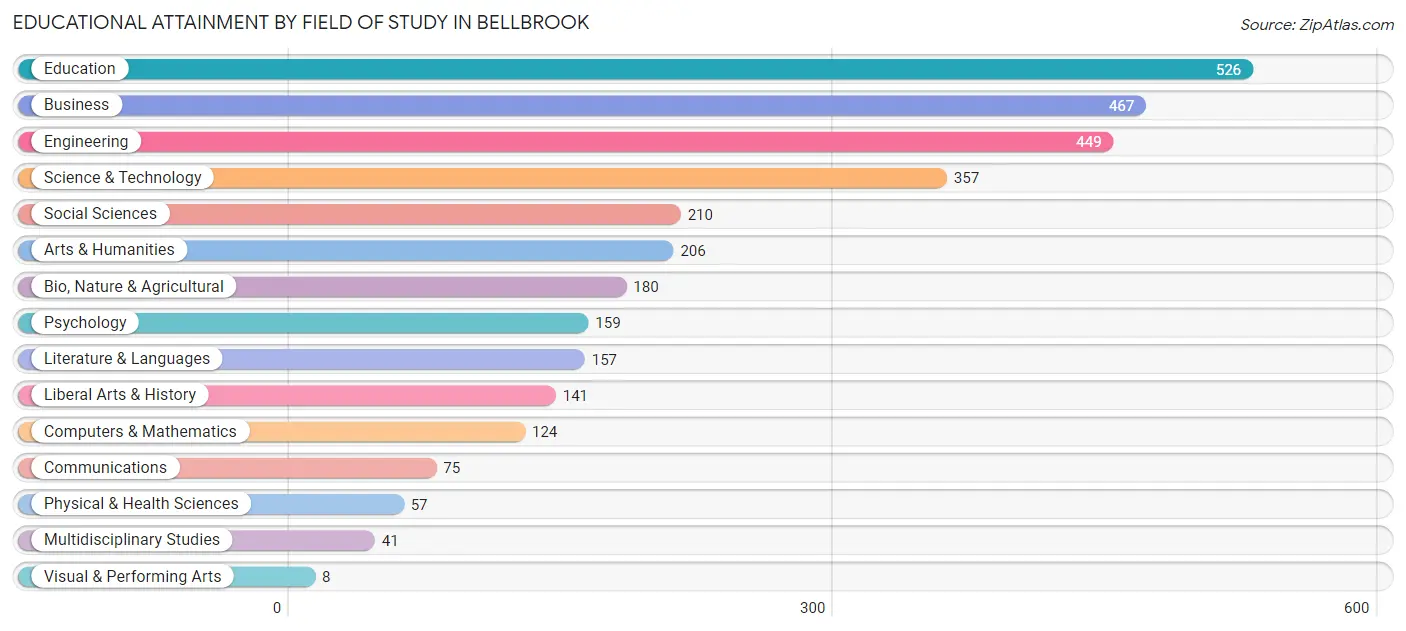
| Field of Study | # Graduates | % Graduates |
| Computers & Mathematics | 124 | 3.9% |
| Bio, Nature & Agricultural | 180 | 5.7% |
| Physical & Health Sciences | 57 | 1.8% |
| Psychology | 159 | 5.0% |
| Social Sciences | 210 | 6.7% |
| Engineering | 449 | 14.2% |
| Multidisciplinary Studies | 41 | 1.3% |
| Science & Technology | 357 | 11.3% |
| Business | 467 | 14.8% |
| Education | 526 | 16.7% |
| Literature & Languages | 157 | 5.0% |
| Liberal Arts & History | 141 | 4.5% |
| Visual & Performing Arts | 8 | 0.3% |
| Communications | 75 | 2.4% |
| Arts & Humanities | 206 | 6.5% |
| Total | 3,157 | 100.0% |
Transportation & Commute in Bellbrook
Vehicle Availability by Sex in Bellbrook
The most prevalent vehicle ownership categories in Bellbrook are males with 2 vehicles (1,086, accounting for 49.9%) and females with 2 vehicles (683, making up 67.9%).
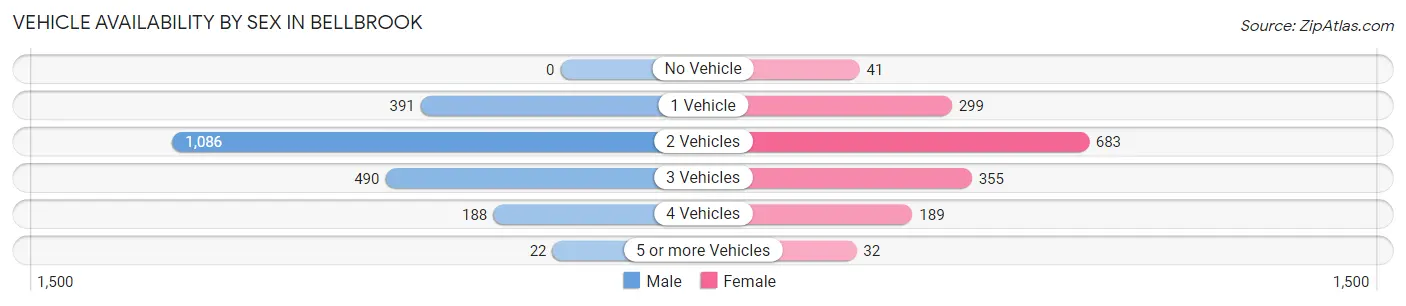
| Vehicles Available | Male | Female |
| No Vehicle | 0 (0.0%) | 41 (2.6%) |
| 1 Vehicle | 391 (18.0%) | 299 (18.7%) |
| 2 Vehicles | 1,086 (49.9%) | 683 (42.7%) |
| 3 Vehicles | 490 (22.5%) | 355 (22.2%) |
| 4 Vehicles | 188 (8.6%) | 189 (11.8%) |
| 5 or more Vehicles | 22 (1.0%) | 32 (2.0%) |
| Total | 2,177 (100.0%) | 1,599 (100.0%) |
Commute Time in Bellbrook
The most frequently occuring commute durations in Bellbrook are 20 to 24 minutes (674 commuters, 20.7%), 25 to 29 minutes (591 commuters, 18.2%), and 15 to 19 minutes (497 commuters, 15.3%).
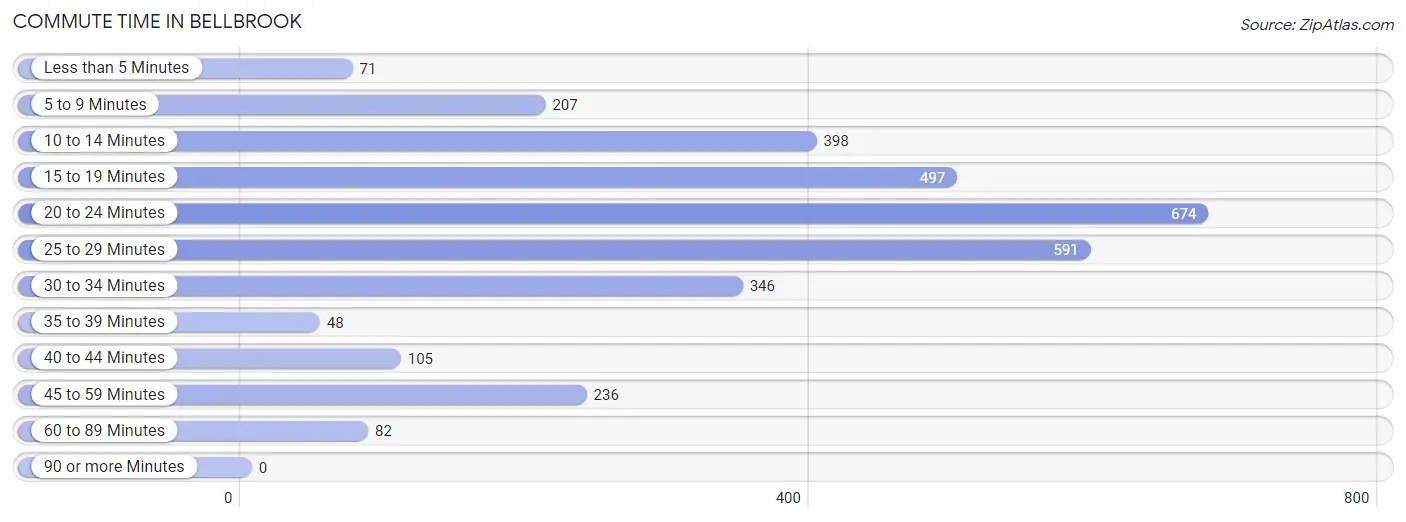
| Commute Time | # Commuters | % Commuters |
| Less than 5 Minutes | 71 | 2.2% |
| 5 to 9 Minutes | 207 | 6.4% |
| 10 to 14 Minutes | 398 | 12.2% |
| 15 to 19 Minutes | 497 | 15.3% |
| 20 to 24 Minutes | 674 | 20.7% |
| 25 to 29 Minutes | 591 | 18.2% |
| 30 to 34 Minutes | 346 | 10.6% |
| 35 to 39 Minutes | 48 | 1.5% |
| 40 to 44 Minutes | 105 | 3.2% |
| 45 to 59 Minutes | 236 | 7.2% |
| 60 to 89 Minutes | 82 | 2.5% |
| 90 or more Minutes | 0 | 0.0% |
Commute Time by Sex in Bellbrook
The most common commute times in Bellbrook are 20 to 24 minutes (378 commuters, 21.1%) for males and 25 to 29 minutes (316 commuters, 21.5%) for females.
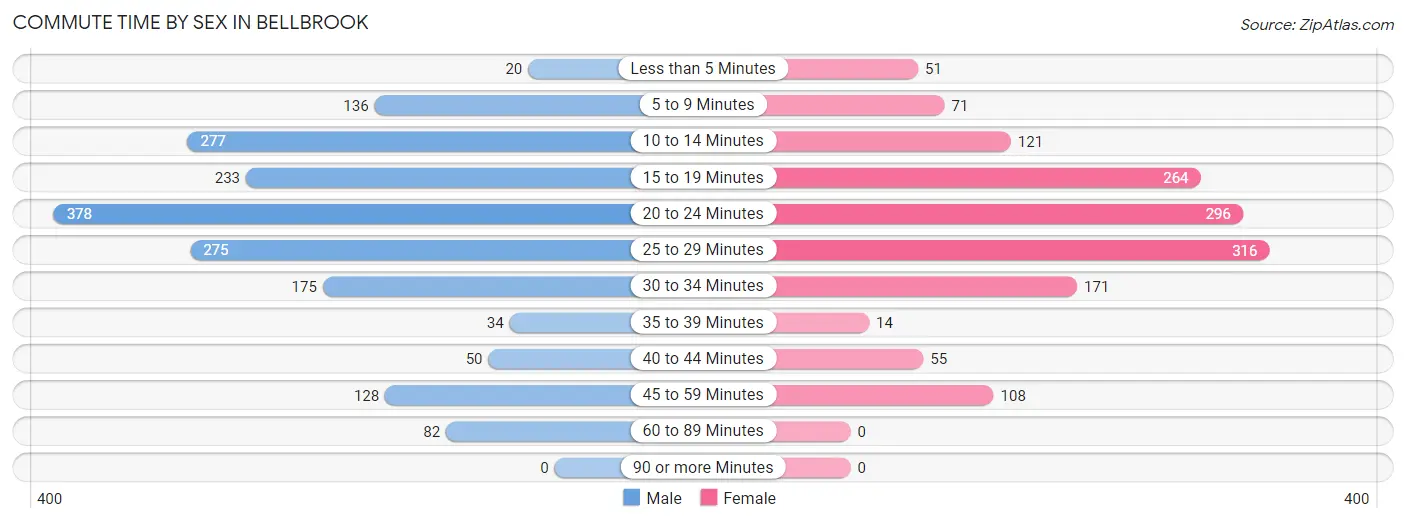
| Commute Time | Male | Female |
| Less than 5 Minutes | 20 (1.1%) | 51 (3.5%) |
| 5 to 9 Minutes | 136 (7.6%) | 71 (4.8%) |
| 10 to 14 Minutes | 277 (15.5%) | 121 (8.3%) |
| 15 to 19 Minutes | 233 (13.0%) | 264 (18.0%) |
| 20 to 24 Minutes | 378 (21.1%) | 296 (20.2%) |
| 25 to 29 Minutes | 275 (15.4%) | 316 (21.5%) |
| 30 to 34 Minutes | 175 (9.8%) | 171 (11.7%) |
| 35 to 39 Minutes | 34 (1.9%) | 14 (0.9%) |
| 40 to 44 Minutes | 50 (2.8%) | 55 (3.7%) |
| 45 to 59 Minutes | 128 (7.2%) | 108 (7.4%) |
| 60 to 89 Minutes | 82 (4.6%) | 0 (0.0%) |
| 90 or more Minutes | 0 (0.0%) | 0 (0.0%) |
Time of Departure to Work by Sex in Bellbrook
The most frequent times of departure to work in Bellbrook are 6:30 AM to 6:59 AM (416, 23.3%) for males and 7:00 AM to 7:29 AM (286, 19.5%) for females.
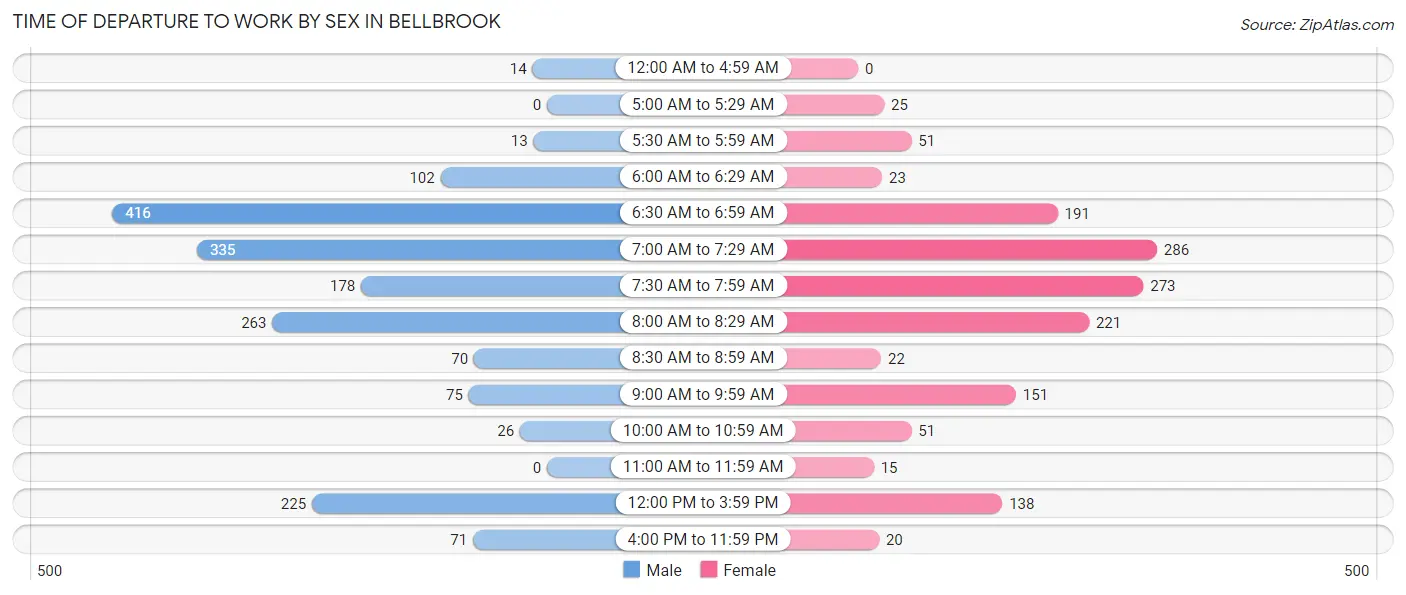
| Time of Departure | Male | Female |
| 12:00 AM to 4:59 AM | 14 (0.8%) | 0 (0.0%) |
| 5:00 AM to 5:29 AM | 0 (0.0%) | 25 (1.7%) |
| 5:30 AM to 5:59 AM | 13 (0.7%) | 51 (3.5%) |
| 6:00 AM to 6:29 AM | 102 (5.7%) | 23 (1.6%) |
| 6:30 AM to 6:59 AM | 416 (23.3%) | 191 (13.0%) |
| 7:00 AM to 7:29 AM | 335 (18.7%) | 286 (19.5%) |
| 7:30 AM to 7:59 AM | 178 (10.0%) | 273 (18.6%) |
| 8:00 AM to 8:29 AM | 263 (14.7%) | 221 (15.1%) |
| 8:30 AM to 8:59 AM | 70 (3.9%) | 22 (1.5%) |
| 9:00 AM to 9:59 AM | 75 (4.2%) | 151 (10.3%) |
| 10:00 AM to 10:59 AM | 26 (1.5%) | 51 (3.5%) |
| 11:00 AM to 11:59 AM | 0 (0.0%) | 15 (1.0%) |
| 12:00 PM to 3:59 PM | 225 (12.6%) | 138 (9.4%) |
| 4:00 PM to 11:59 PM | 71 (4.0%) | 20 (1.4%) |
| Total | 1,788 (100.0%) | 1,467 (100.0%) |
Housing Occupancy in Bellbrook
Occupancy by Ownership in Bellbrook
Of the total 3,107 dwellings in Bellbrook, owner-occupied units account for 2,363 (76.0%), while renter-occupied units make up 744 (23.9%).
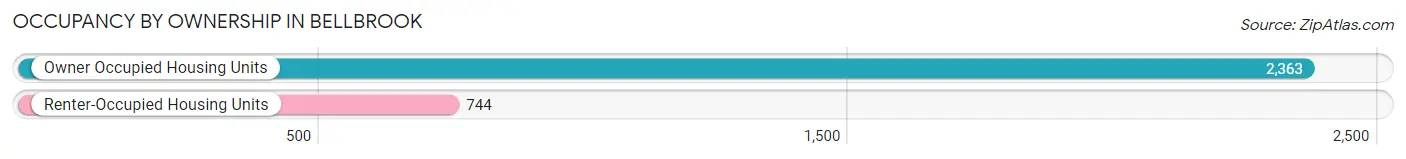
| Occupancy | # Housing Units | % Housing Units |
| Owner Occupied Housing Units | 2,363 | 76.0% |
| Renter-Occupied Housing Units | 744 | 23.9% |
| Total Occupied Housing Units | 3,107 | 100.0% |
Occupancy by Household Size in Bellbrook
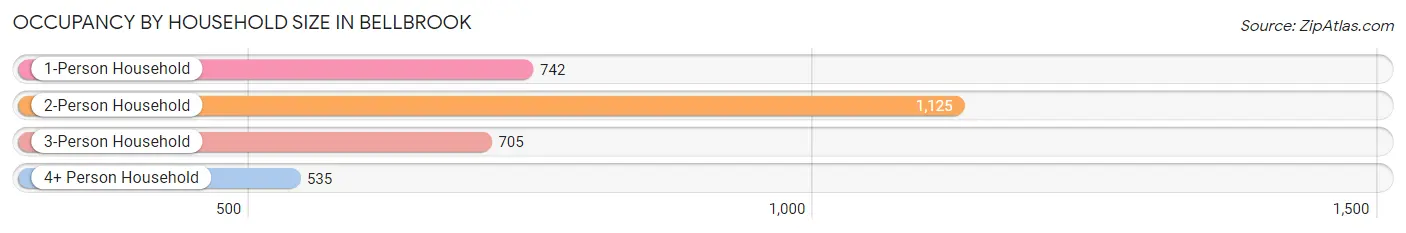
| Household Size | # Housing Units | % Housing Units |
| 1-Person Household | 742 | 23.9% |
| 2-Person Household | 1,125 | 36.2% |
| 3-Person Household | 705 | 22.7% |
| 4+ Person Household | 535 | 17.2% |
| Total Housing Units | 3,107 | 100.0% |
Occupancy by Ownership by Household Size in Bellbrook
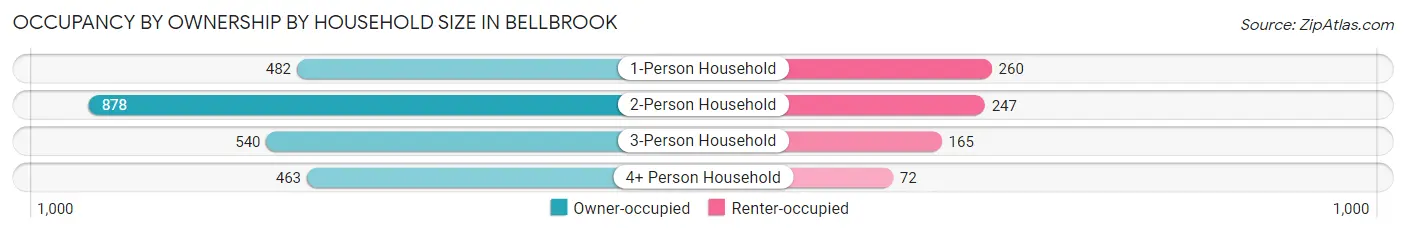
| Household Size | Owner-occupied | Renter-occupied |
| 1-Person Household | 482 (65.0%) | 260 (35.0%) |
| 2-Person Household | 878 (78.0%) | 247 (22.0%) |
| 3-Person Household | 540 (76.6%) | 165 (23.4%) |
| 4+ Person Household | 463 (86.5%) | 72 (13.5%) |
| Total Housing Units | 2,363 (76.0%) | 744 (23.9%) |
Occupancy by Educational Attainment in Bellbrook
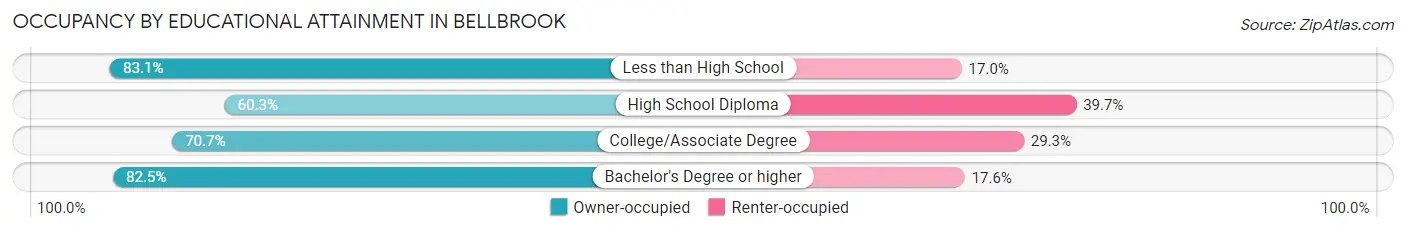
| Household Size | Owner-occupied | Renter-occupied |
| Less than High School | 49 (83.1%) | 10 (17.0%) |
| High School Diploma | 280 (60.3%) | 184 (39.7%) |
| College/Associate Degree | 582 (70.7%) | 241 (29.3%) |
| Bachelor's Degree or higher | 1,452 (82.5%) | 309 (17.5%) |
Occupancy by Age of Householder in Bellbrook
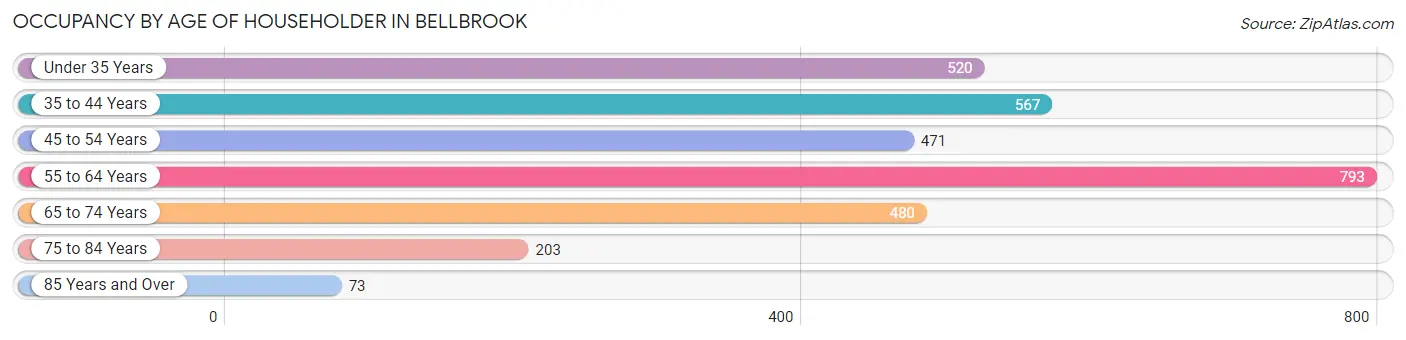
| Age Bracket | # Households | % Households |
| Under 35 Years | 520 | 16.7% |
| 35 to 44 Years | 567 | 18.2% |
| 45 to 54 Years | 471 | 15.2% |
| 55 to 64 Years | 793 | 25.5% |
| 65 to 74 Years | 480 | 15.4% |
| 75 to 84 Years | 203 | 6.5% |
| 85 Years and Over | 73 | 2.4% |
| Total | 3,107 | 100.0% |
Housing Finances in Bellbrook
Median Income by Occupancy in Bellbrook
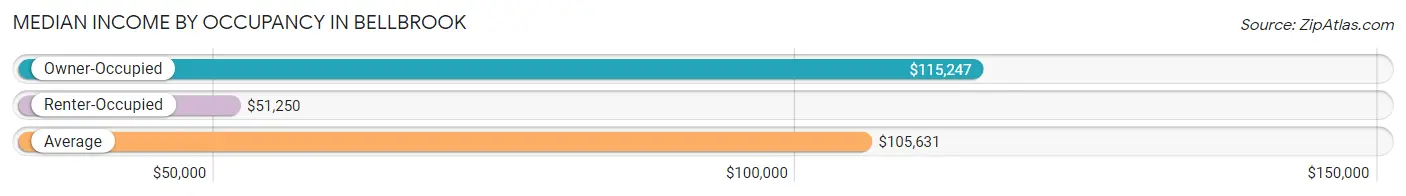
| Occupancy Type | # Households | Median Income |
| Owner-Occupied | 2,363 (76.0%) | $115,247 |
| Renter-Occupied | 744 (23.9%) | $51,250 |
| Average | 3,107 (100.0%) | $105,631 |
Occupancy by Householder Income Bracket in Bellbrook
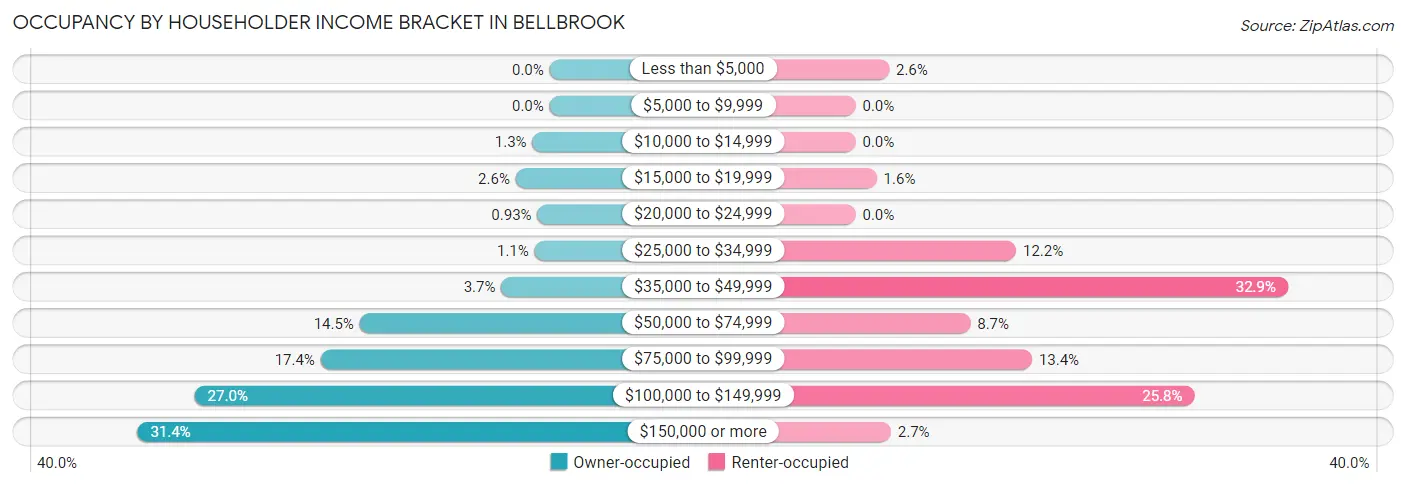
| Income Bracket | Owner-occupied | Renter-occupied |
| Less than $5,000 | 0 (0.0%) | 19 (2.5%) |
| $5,000 to $9,999 | 0 (0.0%) | 0 (0.0%) |
| $10,000 to $14,999 | 31 (1.3%) | 0 (0.0%) |
| $15,000 to $19,999 | 61 (2.6%) | 12 (1.6%) |
| $20,000 to $24,999 | 22 (0.9%) | 0 (0.0%) |
| $25,000 to $34,999 | 27 (1.1%) | 91 (12.2%) |
| $35,000 to $49,999 | 87 (3.7%) | 245 (32.9%) |
| $50,000 to $74,999 | 342 (14.5%) | 65 (8.7%) |
| $75,000 to $99,999 | 412 (17.4%) | 100 (13.4%) |
| $100,000 to $149,999 | 639 (27.0%) | 192 (25.8%) |
| $150,000 or more | 742 (31.4%) | 20 (2.7%) |
| Total | 2,363 (100.0%) | 744 (100.0%) |
Monthly Housing Cost Tiers in Bellbrook
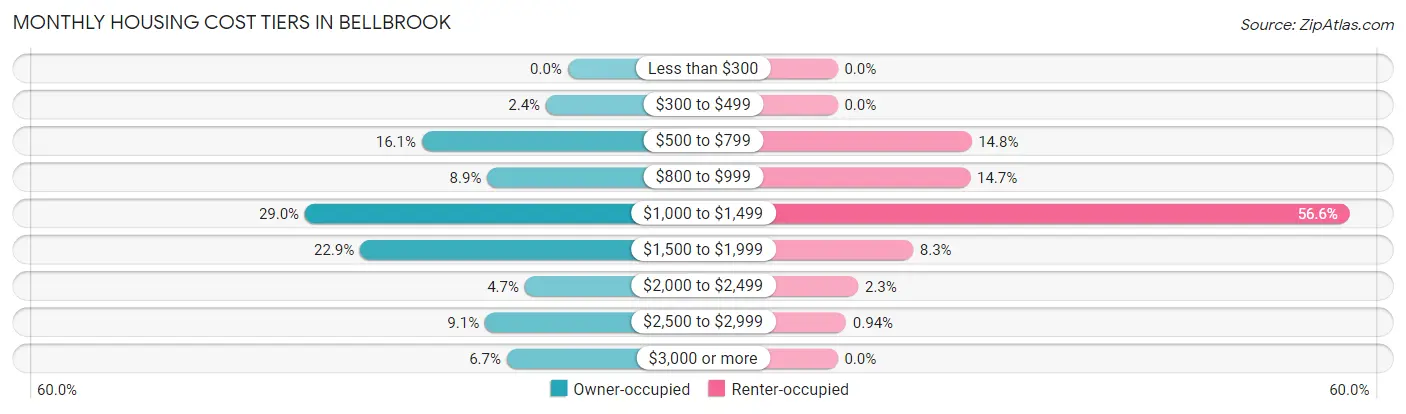
| Monthly Cost | Owner-occupied | Renter-occupied |
| Less than $300 | 0 (0.0%) | 0 (0.0%) |
| $300 to $499 | 57 (2.4%) | 0 (0.0%) |
| $500 to $799 | 381 (16.1%) | 110 (14.8%) |
| $800 to $999 | 210 (8.9%) | 109 (14.6%) |
| $1,000 to $1,499 | 686 (29.0%) | 421 (56.6%) |
| $1,500 to $1,999 | 542 (22.9%) | 62 (8.3%) |
| $2,000 to $2,499 | 112 (4.7%) | 17 (2.3%) |
| $2,500 to $2,999 | 216 (9.1%) | 7 (0.9%) |
| $3,000 or more | 159 (6.7%) | 0 (0.0%) |
| Total | 2,363 (100.0%) | 744 (100.0%) |
Physical Housing Characteristics in Bellbrook
Housing Structures in Bellbrook
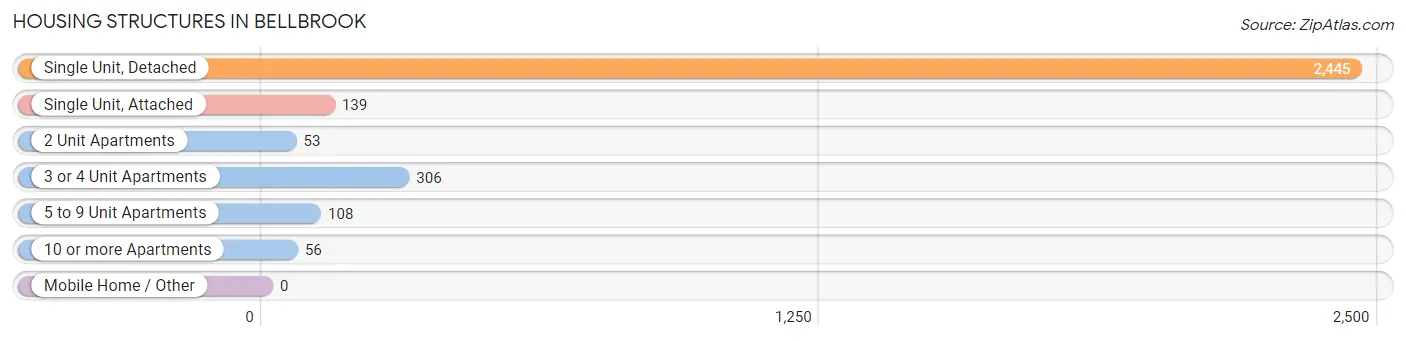
| Structure Type | # Housing Units | % Housing Units |
| Single Unit, Detached | 2,445 | 78.7% |
| Single Unit, Attached | 139 | 4.5% |
| 2 Unit Apartments | 53 | 1.7% |
| 3 or 4 Unit Apartments | 306 | 9.9% |
| 5 to 9 Unit Apartments | 108 | 3.5% |
| 10 or more Apartments | 56 | 1.8% |
| Mobile Home / Other | 0 | 0.0% |
| Total | 3,107 | 100.0% |
Housing Structures by Occupancy in Bellbrook
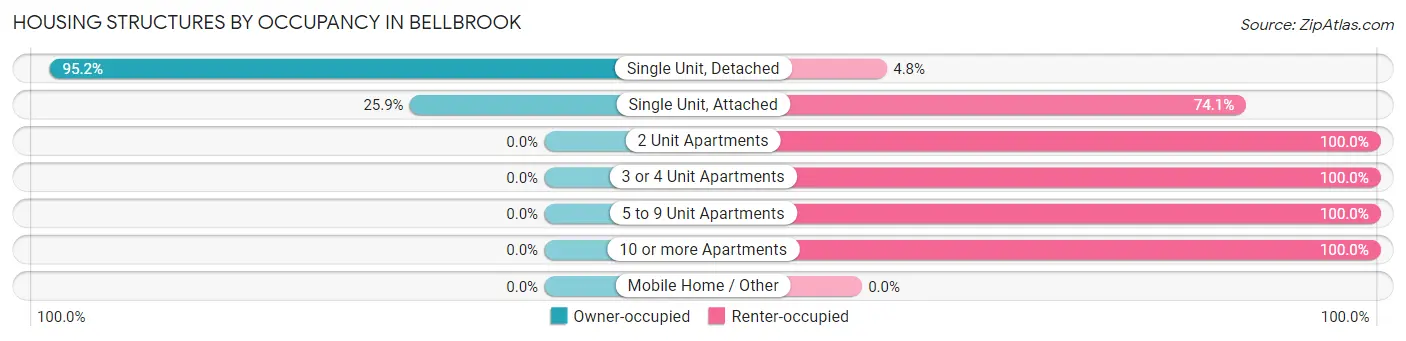
| Structure Type | Owner-occupied | Renter-occupied |
| Single Unit, Detached | 2,327 (95.2%) | 118 (4.8%) |
| Single Unit, Attached | 36 (25.9%) | 103 (74.1%) |
| 2 Unit Apartments | 0 (0.0%) | 53 (100.0%) |
| 3 or 4 Unit Apartments | 0 (0.0%) | 306 (100.0%) |
| 5 to 9 Unit Apartments | 0 (0.0%) | 108 (100.0%) |
| 10 or more Apartments | 0 (0.0%) | 56 (100.0%) |
| Mobile Home / Other | 0 (0.0%) | 0 (0.0%) |
| Total | 2,363 (76.0%) | 744 (23.9%) |
Housing Structures by Number of Rooms in Bellbrook
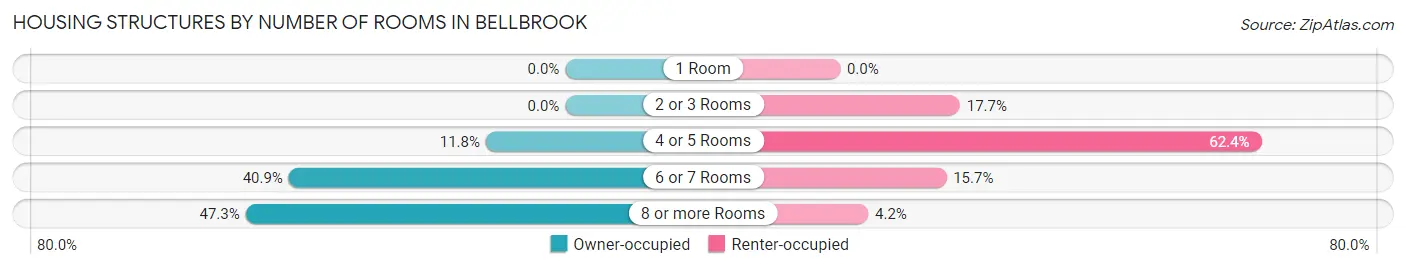
| Number of Rooms | Owner-occupied | Renter-occupied |
| 1 Room | 0 (0.0%) | 0 (0.0%) |
| 2 or 3 Rooms | 0 (0.0%) | 132 (17.7%) |
| 4 or 5 Rooms | 278 (11.8%) | 464 (62.4%) |
| 6 or 7 Rooms | 967 (40.9%) | 117 (15.7%) |
| 8 or more Rooms | 1,118 (47.3%) | 31 (4.2%) |
| Total | 2,363 (100.0%) | 744 (100.0%) |
Housing Structure by Heating Type in Bellbrook
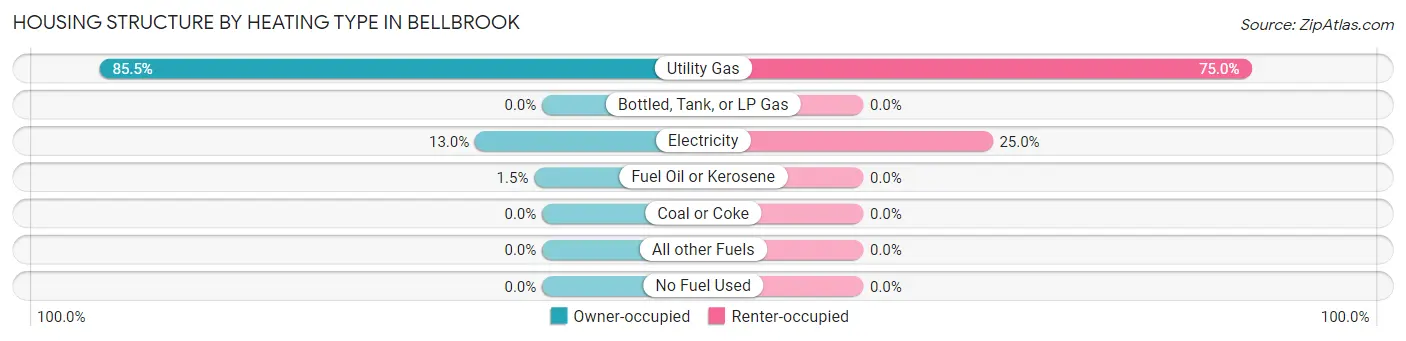
| Heating Type | Owner-occupied | Renter-occupied |
| Utility Gas | 2,021 (85.5%) | 558 (75.0%) |
| Bottled, Tank, or LP Gas | 0 (0.0%) | 0 (0.0%) |
| Electricity | 306 (13.0%) | 186 (25.0%) |
| Fuel Oil or Kerosene | 36 (1.5%) | 0 (0.0%) |
| Coal or Coke | 0 (0.0%) | 0 (0.0%) |
| All other Fuels | 0 (0.0%) | 0 (0.0%) |
| No Fuel Used | 0 (0.0%) | 0 (0.0%) |
| Total | 2,363 (100.0%) | 744 (100.0%) |
Household Vehicle Usage in Bellbrook
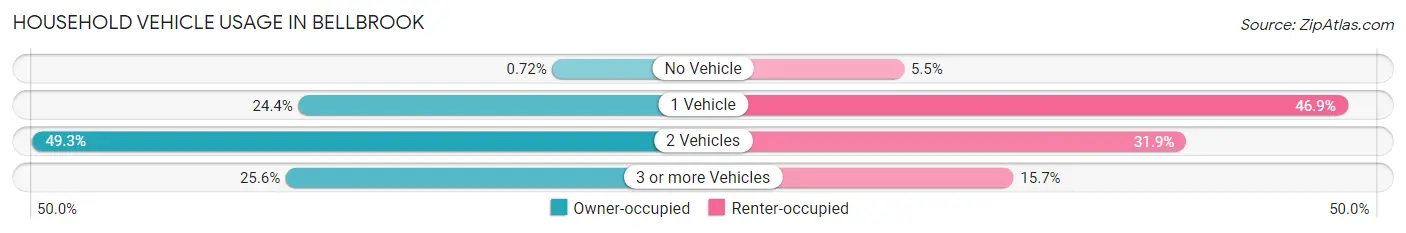
| Vehicles per Household | Owner-occupied | Renter-occupied |
| No Vehicle | 17 (0.7%) | 41 (5.5%) |
| 1 Vehicle | 577 (24.4%) | 349 (46.9%) |
| 2 Vehicles | 1,164 (49.3%) | 237 (31.9%) |
| 3 or more Vehicles | 605 (25.6%) | 117 (15.7%) |
| Total | 2,363 (100.0%) | 744 (100.0%) |
Real Estate & Mortgages in Bellbrook
Real Estate and Mortgage Overview in Bellbrook
| Characteristic | Without Mortgage | With Mortgage |
| Housing Units | 644 | 1,719 |
| Median Property Value | $229,300 | $230,900 |
| Median Household Income | $97,838 | $640 |
| Monthly Housing Costs | $715 | $159 |
| Real Estate Taxes | $4,421 | $24 |
Property Value by Mortgage Status in Bellbrook
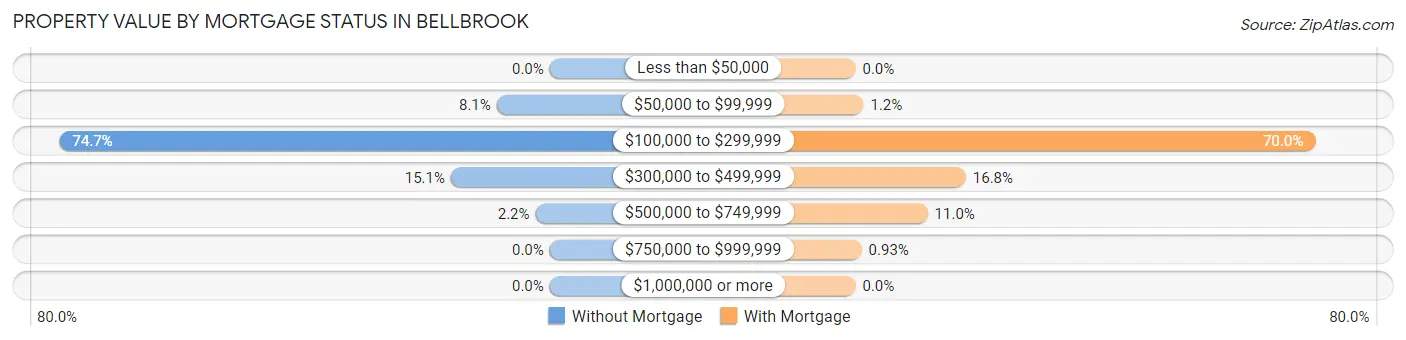
| Property Value | Without Mortgage | With Mortgage |
| Less than $50,000 | 0 (0.0%) | 0 (0.0%) |
| $50,000 to $99,999 | 52 (8.1%) | 21 (1.2%) |
| $100,000 to $299,999 | 481 (74.7%) | 1,204 (70.0%) |
| $300,000 to $499,999 | 97 (15.1%) | 289 (16.8%) |
| $500,000 to $749,999 | 14 (2.2%) | 189 (11.0%) |
| $750,000 to $999,999 | 0 (0.0%) | 16 (0.9%) |
| $1,000,000 or more | 0 (0.0%) | 0 (0.0%) |
| Total | 644 (100.0%) | 1,719 (100.0%) |
Household Income by Mortgage Status in Bellbrook
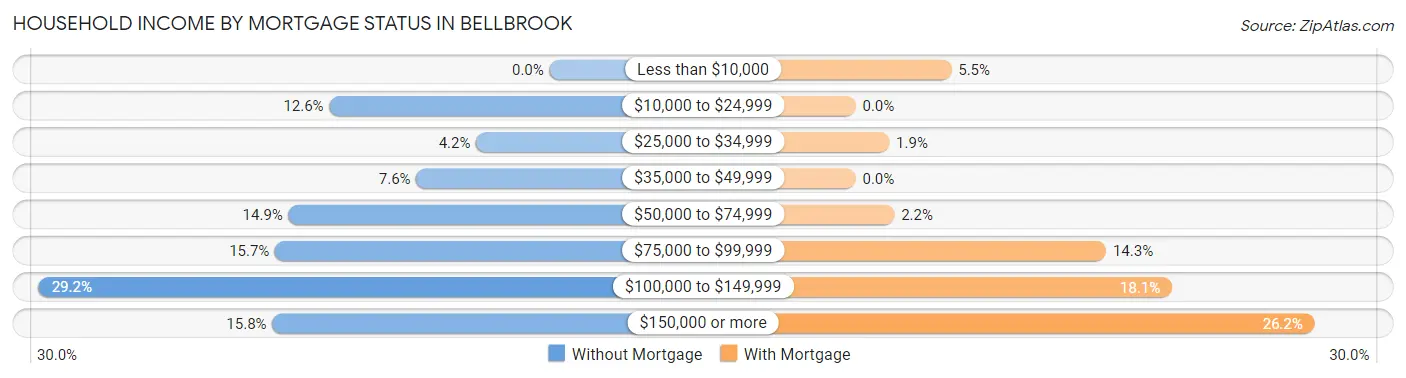
| Household Income | Without Mortgage | With Mortgage |
| Less than $10,000 | 0 (0.0%) | 94 (5.5%) |
| $10,000 to $24,999 | 81 (12.6%) | 0 (0.0%) |
| $25,000 to $34,999 | 27 (4.2%) | 33 (1.9%) |
| $35,000 to $49,999 | 49 (7.6%) | 0 (0.0%) |
| $50,000 to $74,999 | 96 (14.9%) | 38 (2.2%) |
| $75,000 to $99,999 | 101 (15.7%) | 246 (14.3%) |
| $100,000 to $149,999 | 188 (29.2%) | 311 (18.1%) |
| $150,000 or more | 102 (15.8%) | 451 (26.2%) |
| Total | 644 (100.0%) | 1,719 (100.0%) |
Property Value to Household Income Ratio in Bellbrook
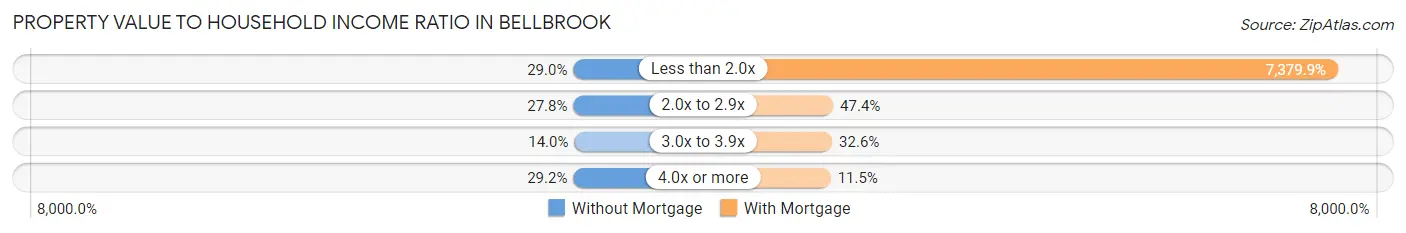
| Value-to-Income Ratio | Without Mortgage | With Mortgage |
| Less than 2.0x | 187 (29.0%) | 126,860 (7,379.9%) |
| 2.0x to 2.9x | 179 (27.8%) | 814 (47.3%) |
| 3.0x to 3.9x | 90 (14.0%) | 561 (32.6%) |
| 4.0x or more | 188 (29.2%) | 198 (11.5%) |
| Total | 644 (100.0%) | 1,719 (100.0%) |
Real Estate Taxes by Mortgage Status in Bellbrook
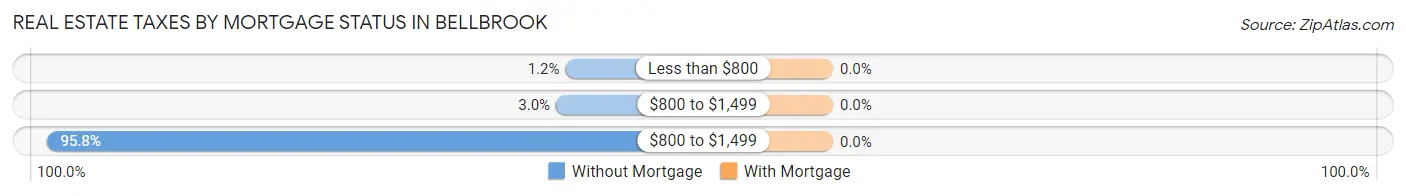
| Property Taxes | Without Mortgage | With Mortgage |
| Less than $800 | 8 (1.2%) | 0 (0.0%) |
| $800 to $1,499 | 19 (2.9%) | 0 (0.0%) |
| $800 to $1,499 | 617 (95.8%) | 0 (0.0%) |
| Total | 644 (100.0%) | 1,719 (100.0%) |
Health & Disability in Bellbrook
Health Insurance Coverage by Age in Bellbrook
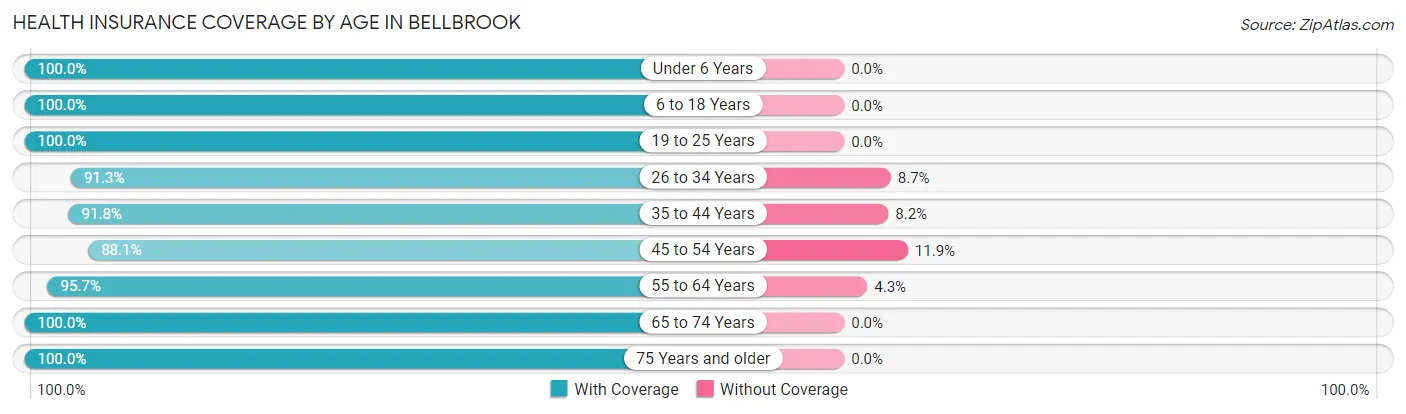
| Age Bracket | With Coverage | Without Coverage |
| Under 6 Years | 428 (100.0%) | 0 (0.0%) |
| 6 to 18 Years | 1,018 (100.0%) | 0 (0.0%) |
| 19 to 25 Years | 541 (100.0%) | 0 (0.0%) |
| 26 to 34 Years | 747 (91.3%) | 71 (8.7%) |
| 35 to 44 Years | 916 (91.8%) | 82 (8.2%) |
| 45 to 54 Years | 817 (88.1%) | 110 (11.9%) |
| 55 to 64 Years | 1,290 (95.7%) | 58 (4.3%) |
| 65 to 74 Years | 809 (100.0%) | 0 (0.0%) |
| 75 Years and older | 406 (100.0%) | 0 (0.0%) |
| Total | 6,972 (95.6%) | 321 (4.4%) |
Health Insurance Coverage by Citizenship Status in Bellbrook
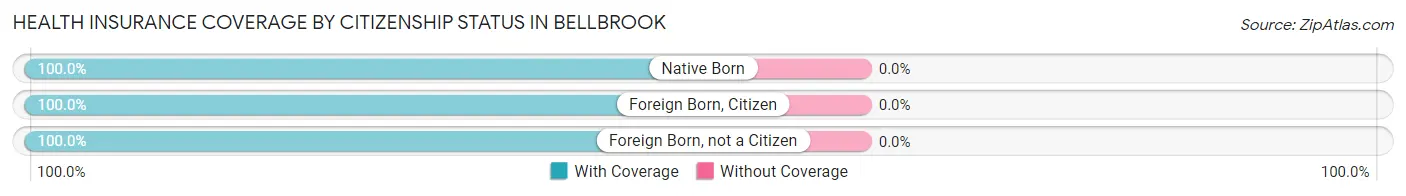
| Citizenship Status | With Coverage | Without Coverage |
| Native Born | 428 (100.0%) | 0 (0.0%) |
| Foreign Born, Citizen | 1,018 (100.0%) | 0 (0.0%) |
| Foreign Born, not a Citizen | 541 (100.0%) | 0 (0.0%) |
Health Insurance Coverage by Household Income in Bellbrook
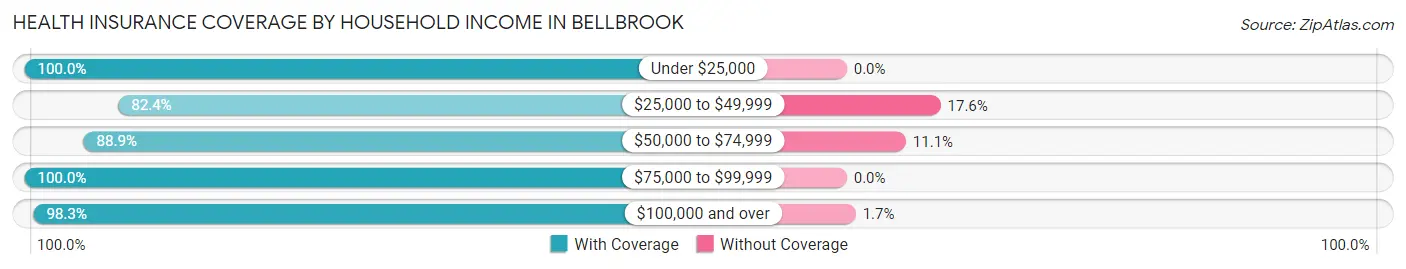
| Household Income | With Coverage | Without Coverage |
| Under $25,000 | 145 (100.0%) | 0 (0.0%) |
| $25,000 to $49,999 | 722 (82.4%) | 154 (17.6%) |
| $50,000 to $74,999 | 739 (88.9%) | 92 (11.1%) |
| $75,000 to $99,999 | 952 (100.0%) | 0 (0.0%) |
| $100,000 and over | 4,414 (98.3%) | 75 (1.7%) |
Public vs Private Health Insurance Coverage by Age in Bellbrook
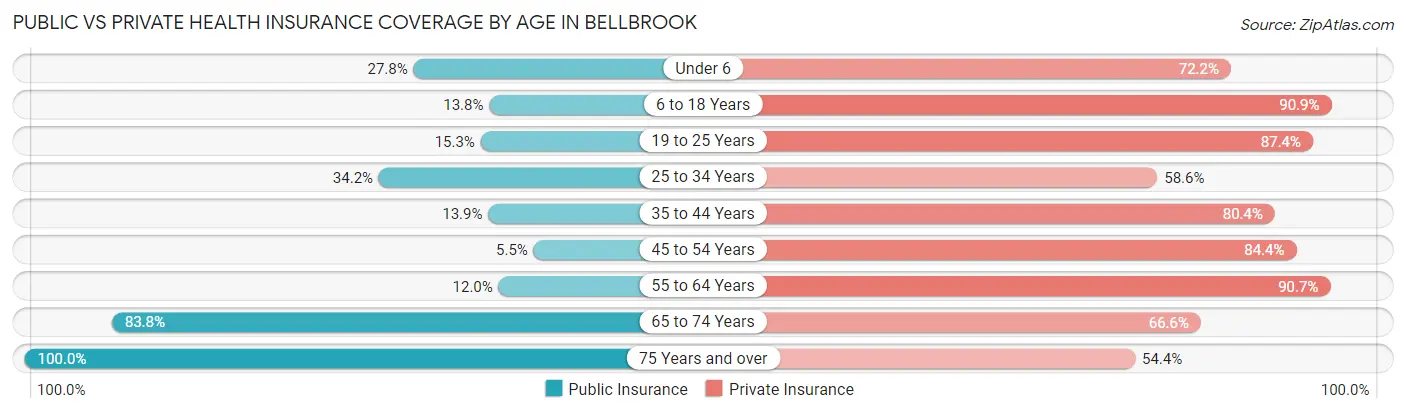
| Age Bracket | Public Insurance | Private Insurance |
| Under 6 | 119 (27.8%) | 309 (72.2%) |
| 6 to 18 Years | 140 (13.8%) | 925 (90.9%) |
| 19 to 25 Years | 83 (15.3%) | 473 (87.4%) |
| 25 to 34 Years | 280 (34.2%) | 479 (58.6%) |
| 35 to 44 Years | 139 (13.9%) | 802 (80.4%) |
| 45 to 54 Years | 51 (5.5%) | 782 (84.4%) |
| 55 to 64 Years | 162 (12.0%) | 1,222 (90.6%) |
| 65 to 74 Years | 678 (83.8%) | 539 (66.6%) |
| 75 Years and over | 406 (100.0%) | 221 (54.4%) |
| Total | 2,058 (28.2%) | 5,752 (78.9%) |
Disability Status by Sex by Age in Bellbrook
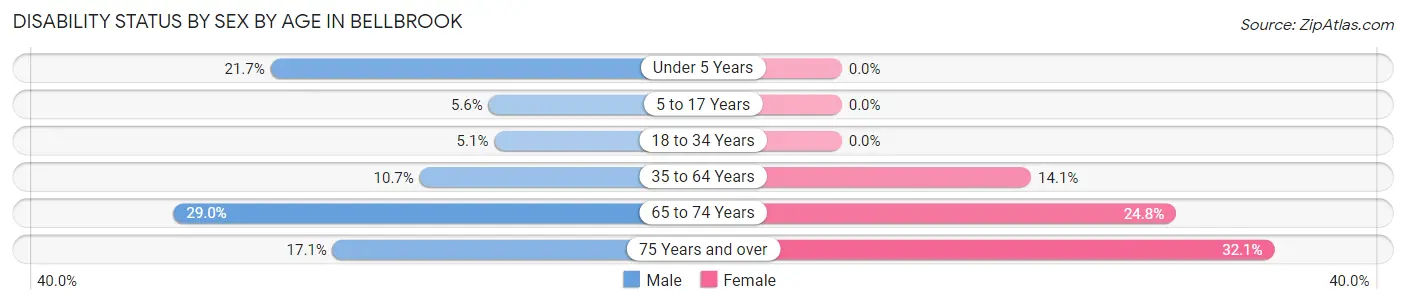
| Age Bracket | Male | Female |
| Under 5 Years | 35 (21.7%) | 0 (0.0%) |
| 5 to 17 Years | 33 (5.6%) | 0 (0.0%) |
| 18 to 34 Years | 36 (5.1%) | 0 (0.0%) |
| 35 to 64 Years | 174 (10.7%) | 231 (14.1%) |
| 65 to 74 Years | 121 (28.9%) | 97 (24.8%) |
| 75 Years and over | 37 (17.1%) | 61 (32.1%) |
Disability Class by Sex by Age in Bellbrook
Disability Class: Hearing Difficulty
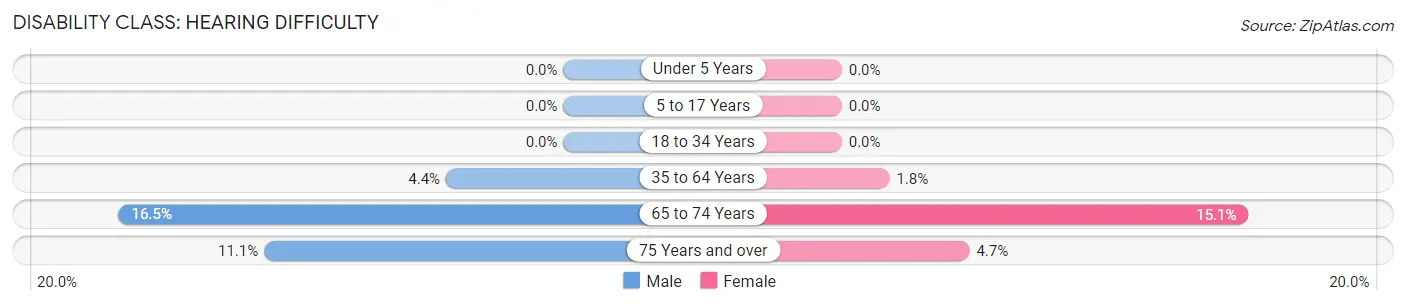
| Age Bracket | Male | Female |
| Under 5 Years | 0 (0.0%) | 0 (0.0%) |
| 5 to 17 Years | 0 (0.0%) | 0 (0.0%) |
| 18 to 34 Years | 0 (0.0%) | 0 (0.0%) |
| 35 to 64 Years | 71 (4.4%) | 29 (1.8%) |
| 65 to 74 Years | 69 (16.5%) | 59 (15.1%) |
| 75 Years and over | 24 (11.1%) | 9 (4.7%) |
Disability Class: Vision Difficulty
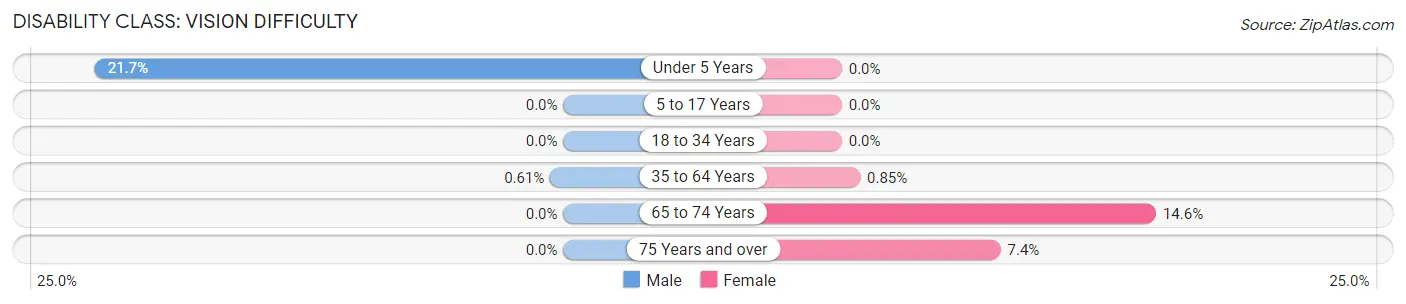
| Age Bracket | Male | Female |
| Under 5 Years | 35 (21.7%) | 0 (0.0%) |
| 5 to 17 Years | 0 (0.0%) | 0 (0.0%) |
| 18 to 34 Years | 0 (0.0%) | 0 (0.0%) |
| 35 to 64 Years | 10 (0.6%) | 14 (0.9%) |
| 65 to 74 Years | 0 (0.0%) | 57 (14.6%) |
| 75 Years and over | 0 (0.0%) | 14 (7.4%) |
Disability Class: Cognitive Difficulty
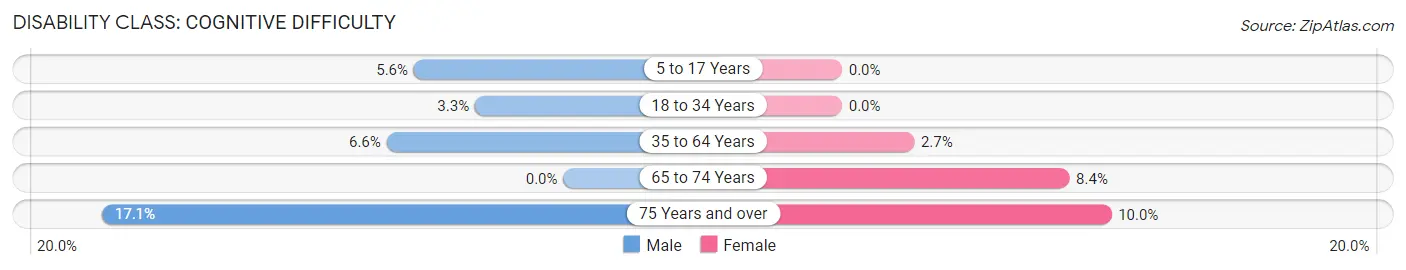
| Age Bracket | Male | Female |
| 5 to 17 Years | 33 (5.6%) | 0 (0.0%) |
| 18 to 34 Years | 23 (3.3%) | 0 (0.0%) |
| 35 to 64 Years | 107 (6.6%) | 44 (2.7%) |
| 65 to 74 Years | 0 (0.0%) | 33 (8.4%) |
| 75 Years and over | 37 (17.1%) | 19 (10.0%) |
Disability Class: Ambulatory Difficulty
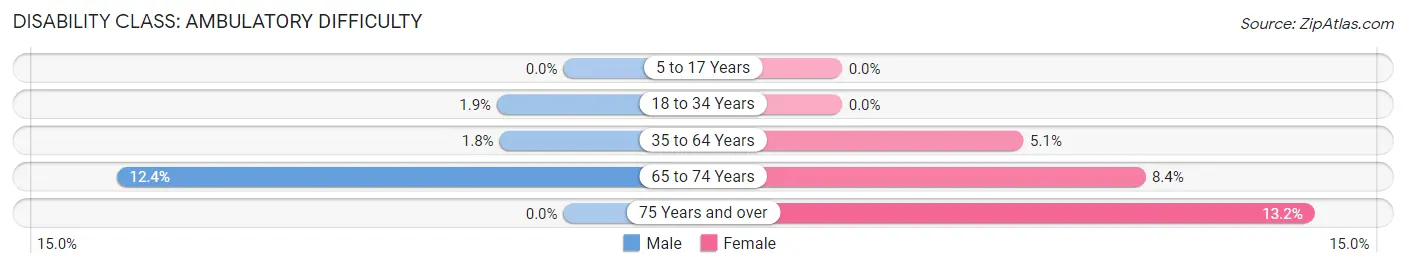
| Age Bracket | Male | Female |
| 5 to 17 Years | 0 (0.0%) | 0 (0.0%) |
| 18 to 34 Years | 13 (1.8%) | 0 (0.0%) |
| 35 to 64 Years | 29 (1.8%) | 83 (5.1%) |
| 65 to 74 Years | 52 (12.4%) | 33 (8.4%) |
| 75 Years and over | 0 (0.0%) | 25 (13.2%) |
Disability Class: Self-Care Difficulty
| Age Bracket | Male | Female |
| 5 to 17 Years | 0 (0.0%) | 0 (0.0%) |
| 18 to 34 Years | 0 (0.0%) | 0 (0.0%) |
| 35 to 64 Years | 0 (0.0%) | 0 (0.0%) |
| 65 to 74 Years | 0 (0.0%) | 0 (0.0%) |
| 75 Years and over | 0 (0.0%) | 0 (0.0%) |
Technology Access in Bellbrook
Computing Device Access in Bellbrook
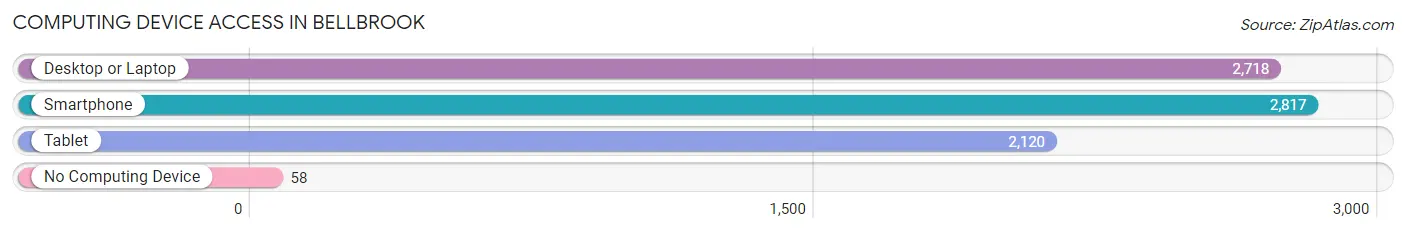
| Device Type | # Households | % Households |
| Desktop or Laptop | 2,718 | 87.5% |
| Smartphone | 2,817 | 90.7% |
| Tablet | 2,120 | 68.2% |
| No Computing Device | 58 | 1.9% |
| Total | 3,107 | 100.0% |
Internet Access in Bellbrook
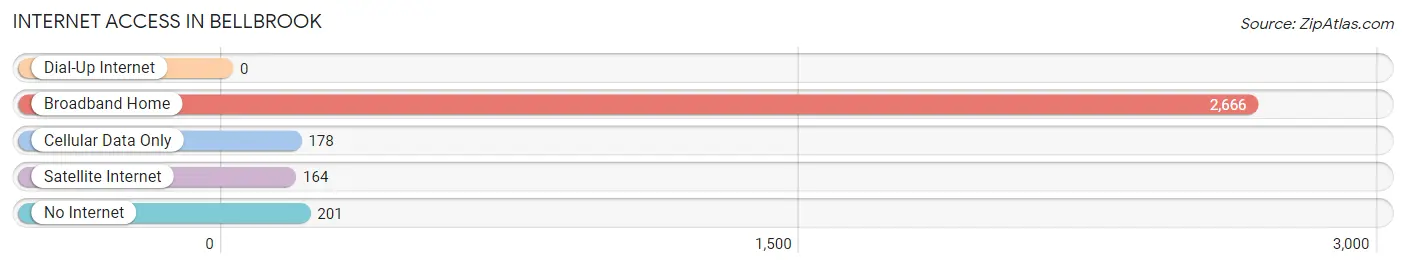
| Internet Type | # Households | % Households |
| Dial-Up Internet | 0 | 0.0% |
| Broadband Home | 2,666 | 85.8% |
| Cellular Data Only | 178 | 5.7% |
| Satellite Internet | 164 | 5.3% |
| No Internet | 201 | 6.5% |
| Total | 3,107 | 100.0% |
Bellbrook Summary
History
Bellbrook, Ohio is a small city located in Greene County, Ohio. It is situated approximately 20 miles east of Dayton and is part of the Dayton Metropolitan Statistical Area. The city was founded in 1817 by William Bell, who purchased the land from the United States government. The city was originally known as Bell’s Creek, but was later changed to Bellbrook in 1845.
The city was originally a farming community, but in the late 19th century, it began to develop into a manufacturing center. The first industry to be established in Bellbrook was a sawmill, which was built in 1845. This was followed by a gristmill, a woolen mill, and a paper mill. The city also had a number of other industries, including a brickyard, a tannery, and a distillery.
In the early 20th century, Bellbrook began to experience a period of growth and development. The city was incorporated in 1921 and the population grew from 1,000 to over 3,000 by the 1950s. During this time, the city was home to a number of businesses, including a furniture factory, a canning factory, and a number of other manufacturing plants.
Geography
Bellbrook is located in Greene County, Ohio, approximately 20 miles east of Dayton. The city is situated in the Miami Valley region of Ohio, which is characterized by rolling hills and fertile farmland. The city is bordered by Sugarcreek Township to the north, Miami Township to the east, and Xenia Township to the south.
The city covers an area of 4.2 square miles and has a population of approximately 5,000 people. The city is located at an elevation of 890 feet above sea level. The climate in Bellbrook is characterized by hot, humid summers and cold, wet winters.
Economy
Bellbrook’s economy is largely based on manufacturing and services. The city is home to a number of manufacturing plants, including a furniture factory, a canning factory, and a number of other manufacturing plants. The city also has a number of service-based businesses, including restaurants, retail stores, and professional services.
The city is also home to a number of educational institutions, including Bellbrook High School, Bellbrook Middle School, and Bellbrook Elementary School. The city is also home to a number of parks and recreational facilities, including a public pool, a skate park, and a number of other outdoor activities.
Demographics
As of the 2010 census, the population of Bellbrook was 5,092. The racial makeup of the city was 94.3% White, 1.7% African American, 0.3% Native American, 0.7% Asian, 0.1% Pacific Islander, 1.2% from other races, and 1.9% from two or more races. Hispanic or Latino of any race were 3.2% of the population.
The median household income in Bellbrook was $50,945, and the median family income was $60,945. The per capita income for the city was $24,945. About 5.3% of families and 7.2% of the population were below the poverty line, including 8.3% of those under age 18 and 6.2% of those age 65 or over.
Common Questions
What is the Total Population of Bellbrook?
Total Population of Bellbrook is 7,321.
What is the Total Male Population of Bellbrook?
Total Male Population of Bellbrook is 3,744.
What is the Total Female Population of Bellbrook?
Total Female Population of Bellbrook is 3,577.
What is the Ratio of Males per 100 Females in Bellbrook?
There are 104.67 Males per 100 Females in Bellbrook.
What is the Ratio of Females per 100 Males in Bellbrook?
There are 95.54 Females per 100 Males in Bellbrook.
What is the Median Population Age in Bellbrook?
Median Population Age in Bellbrook is 43.1 Years.
What is the Average Family Size in Bellbrook
Average Family Size in Bellbrook is 2.8 People.
What is the Average Household Size in Bellbrook
Average Household Size in Bellbrook is 2.4 People.
What is Per Capita Income in Bellbrook?
Per Capita income in Bellbrook is $52,940.
What is the Median Family Income in Bellbrook?
Median Family Income in Bellbrook is $126,189.
What is the Median Household income in Bellbrook?
Median Household Income in Bellbrook is $105,631.
What is Income or Wage Gap in Bellbrook?
Income or Wage Gap in Bellbrook is 35.3%.
Women in Bellbrook earn 64.7 cents for every dollar earned by a man.
What is Inequality or Gini Index in Bellbrook?
Inequality or Gini Index in Bellbrook is 0.38.
How Large is the Labor Force in Bellbrook?
There are 3,893 People in the Labor Forcein in Bellbrook.
What is the Percentage of People in the Labor Force in Bellbrook?
63.4% of People are in the Labor Force in Bellbrook.
What is the Unemployment Rate in Bellbrook?
Unemployment Rate in Bellbrook is 1.0%.