Bannock, OH
Bannock Map
Bannock Overview
191
TOTAL POPULATION
105
MALE POPULATION
86
FEMALE POPULATION
122.09
MALES / 100 FEMALES
81.90
FEMALES / 100 MALES
69.1
MEDIAN AGE
2.0
AVG FAMILY SIZE
1.4
AVG HOUSEHOLD SIZE
$29,345
PER CAPITA INCOME
$47,538
AVG HOUSEHOLD INCOME
0.18
INEQUALITY / GINI INDEX
50
LABOR FORCE [ PEOPLE ]
26.2%
PERCENT IN LABOR FORCE
Bannock Zip Codes
Bannock Area Codes
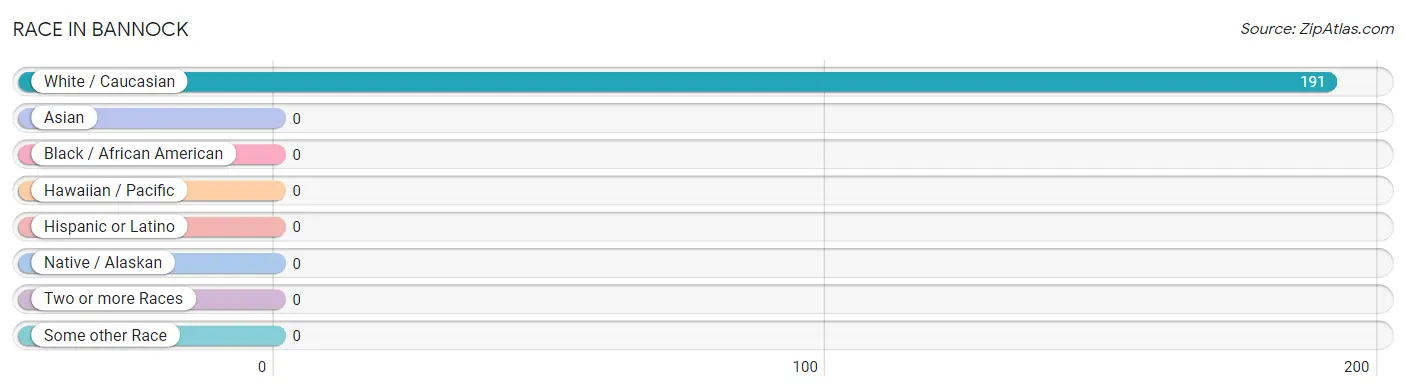
Race in Bannock
The most populous races in Bannock are , and White / Caucasian (191 | 100.0%).
| Race | # Population | % Population |
| Asian | 0 | 0.0% |
| Black / African American | 0 | 0.0% |
| Hawaiian / Pacific | 0 | 0.0% |
| Hispanic or Latino | 0 | 0.0% |
| Native / Alaskan | 0 | 0.0% |
| White / Caucasian | 191 | 100.0% |
| Two or more Races | 0 | 0.0% |
| Some other Race | 0 | 0.0% |
| Total | 191 | 100.0% |
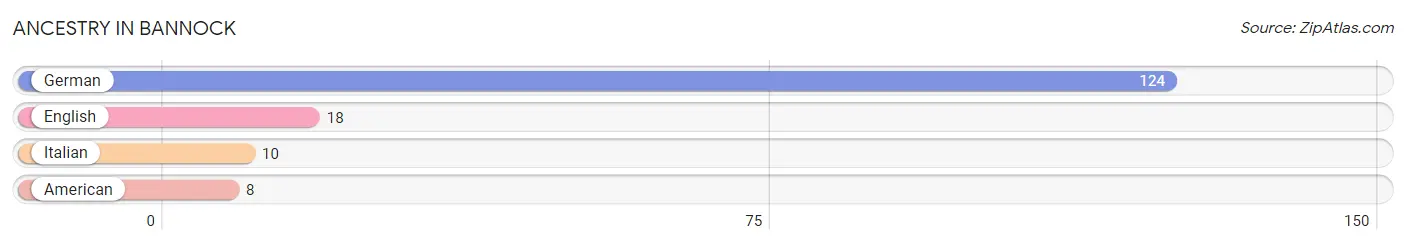
Ancestry in Bannock
The most populous ancestries reported in Bannock are German (124 | 64.9%), English (18 | 9.4%), Italian (10 | 5.2%), and American (8 | 4.2%), together accounting for 83.8% of all Bannock residents.
| Ancestry | # Population | % Population |
| American | 8 | 4.2% |
| English | 18 | 9.4% |
| German | 124 | 64.9% |
| Italian | 10 | 5.2% | View All 4 Rows |
Immigrants in Bannock

| Immigration Origin | # Population | % Population | View All 0 Rows |
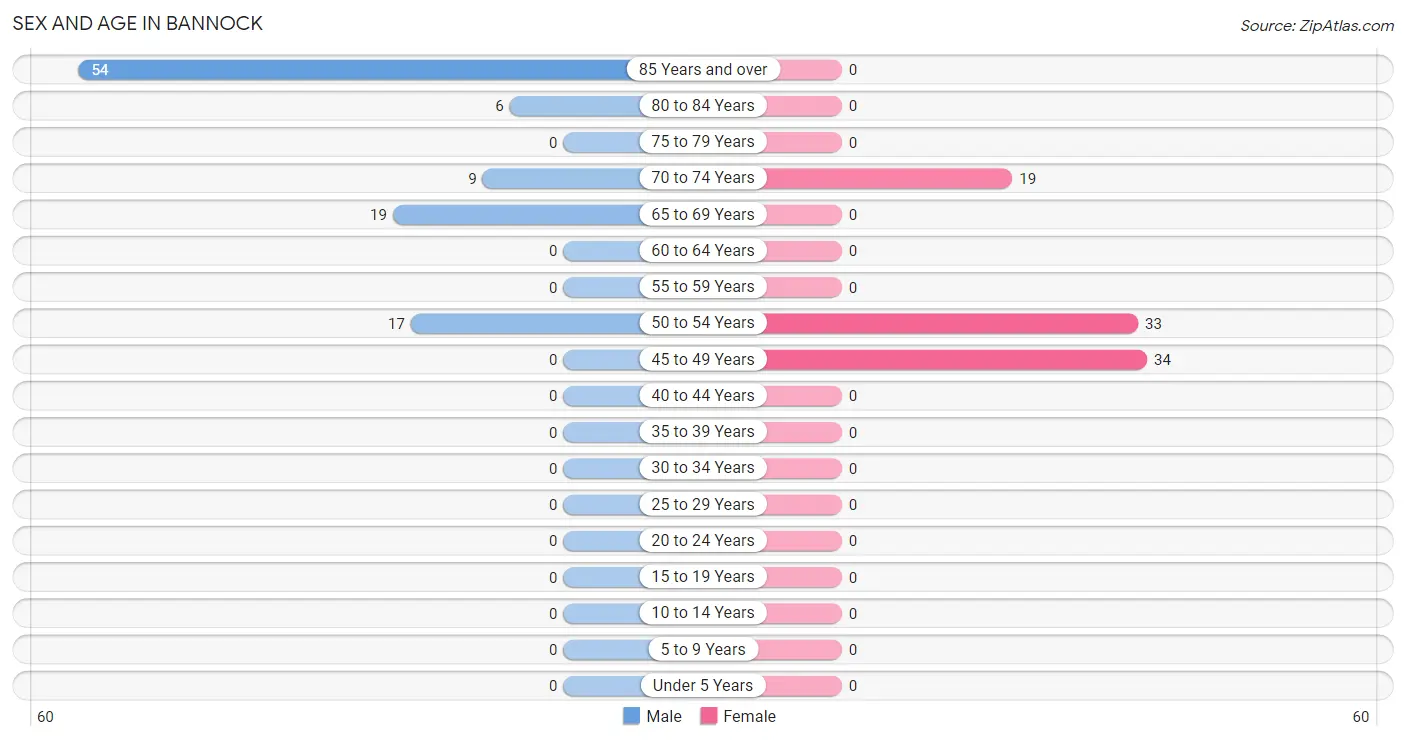
Sex and Age in Bannock
Sex and Age in Bannock
The most populous age groups in Bannock are 85 Years and over (54 | 51.4%) for men and 45 to 49 Years (34 | 39.5%) for women.
| Age Bracket | Male | Female |
| Under 5 Years | 0 (0.0%) | 0 (0.0%) |
| 5 to 9 Years | 0 (0.0%) | 0 (0.0%) |
| 10 to 14 Years | 0 (0.0%) | 0 (0.0%) |
| 15 to 19 Years | 0 (0.0%) | 0 (0.0%) |
| 20 to 24 Years | 0 (0.0%) | 0 (0.0%) |
| 25 to 29 Years | 0 (0.0%) | 0 (0.0%) |
| 30 to 34 Years | 0 (0.0%) | 0 (0.0%) |
| 35 to 39 Years | 0 (0.0%) | 0 (0.0%) |
| 40 to 44 Years | 0 (0.0%) | 0 (0.0%) |
| 45 to 49 Years | 0 (0.0%) | 34 (39.5%) |
| 50 to 54 Years | 17 (16.2%) | 33 (38.4%) |
| 55 to 59 Years | 0 (0.0%) | 0 (0.0%) |
| 60 to 64 Years | 0 (0.0%) | 0 (0.0%) |
| 65 to 69 Years | 19 (18.1%) | 0 (0.0%) |
| 70 to 74 Years | 9 (8.6%) | 19 (22.1%) |
| 75 to 79 Years | 0 (0.0%) | 0 (0.0%) |
| 80 to 84 Years | 6 (5.7%) | 0 (0.0%) |
| 85 Years and over | 54 (51.4%) | 0 (0.0%) |
| Total | 105 (100.0%) | 86 (100.0%) |
Families and Households in Bannock
Median Family Size in Bannock
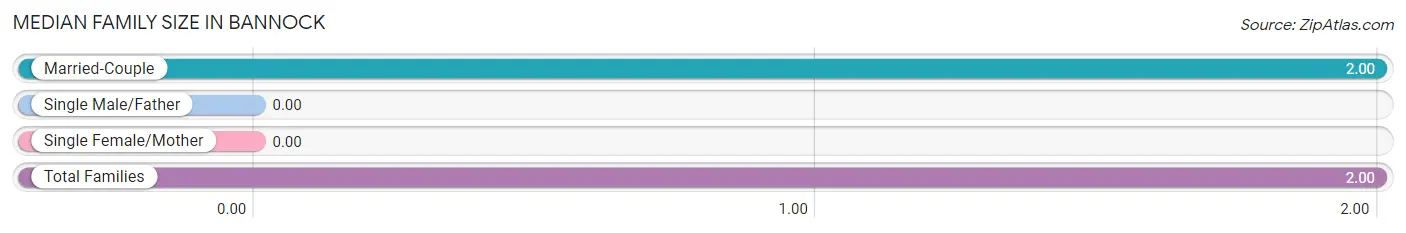
| Family Type | # Families | Family Size |
| Married-Couple | 9 (100.0%) | 2.00 |
| Single Male/Father | 0 (0.0%) | - |
| Single Female/Mother | 0 (0.0%) | - |
| Total Families | 9 (100.0%) | 2.00 |
Median Household Size in Bannock
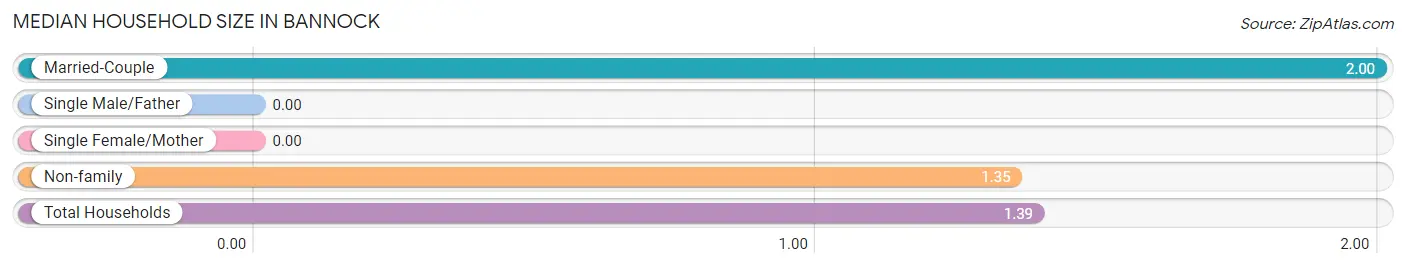
| Household Type | # Households | Household Size |
| Married-Couple | 9 (6.6%) | 2.00 |
| Single Male/Father | 0 (0.0%) | - |
| Single Female/Mother | 0 (0.0%) | - |
| Non-family | 128 (93.4%) | 1.35 |
| Total Households | 137 (100.0%) | 1.39 |
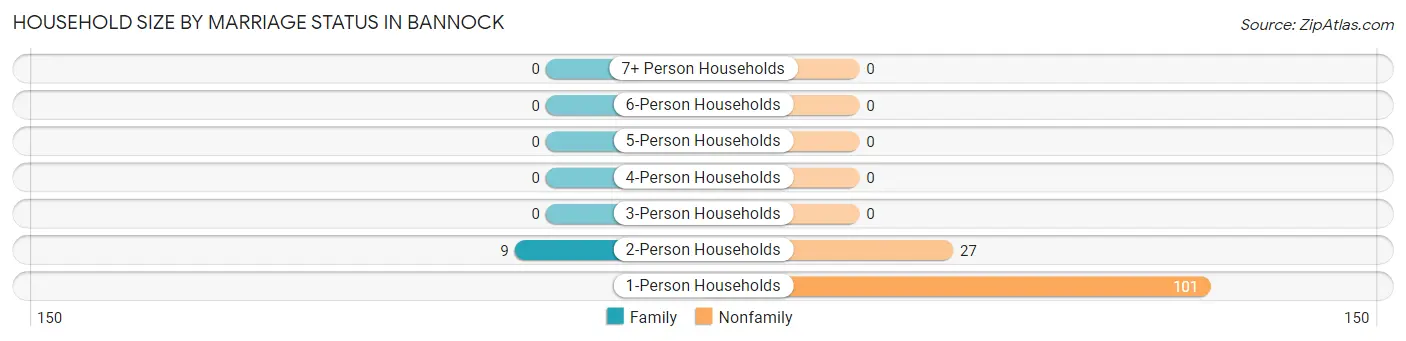
Household Size by Marriage Status in Bannock
Out of a total of 137 households in Bannock, 9 (6.6%) are family households, while 128 (93.4%) are nonfamily households. The most numerous type of family households are 2-person households, comprising 9, and the most common type of nonfamily households are 1-person households, comprising 101.
| Household Size | Family Households | Nonfamily Households |
| 1-Person Households | - | 101 (73.7%) |
| 2-Person Households | 9 (6.6%) | 27 (19.7%) |
| 3-Person Households | 0 (0.0%) | 0 (0.0%) |
| 4-Person Households | 0 (0.0%) | 0 (0.0%) |
| 5-Person Households | 0 (0.0%) | 0 (0.0%) |
| 6-Person Households | 0 (0.0%) | 0 (0.0%) |
| 7+ Person Households | 0 (0.0%) | 0 (0.0%) |
| Total | 9 (6.6%) | 128 (93.4%) |
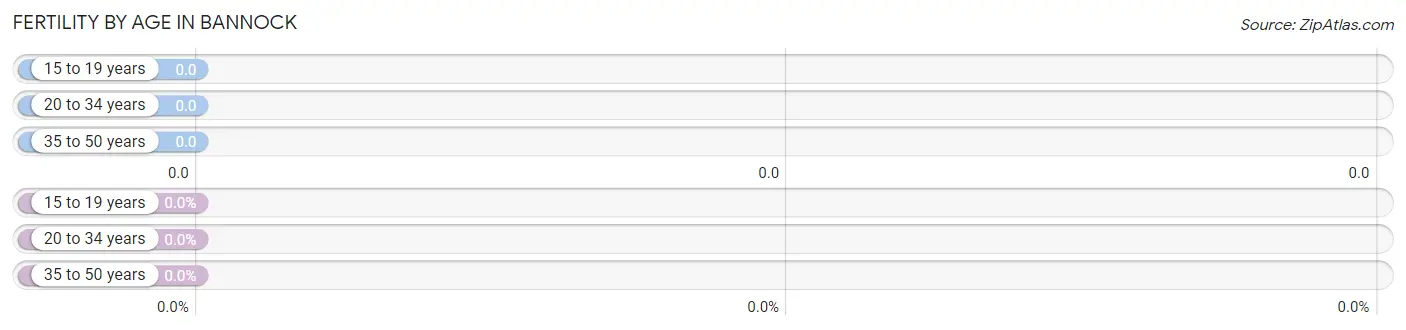
Female Fertility in Bannock
Fertility by Age in Bannock
| Age Bracket | Women with Births | Births / 1,000 Women |
| 15 to 19 years | 0 (0.0%) | 0.0 |
| 20 to 34 years | 0 (0.0%) | 0.0 |
| 35 to 50 years | 0 (0.0%) | 0.0 |
| Total | 0 (0.0%) | 0.0 |
Fertility by Age by Marriage Status in Bannock
| Age Bracket | Married | Unmarried |
| 15 to 19 years | 0 (0.0%) | 0 (0.0%) |
| 20 to 34 years | 0 (0.0%) | 0 (0.0%) |
| 35 to 50 years | 0 (0.0%) | 0 (0.0%) |
| Total | 0 (0.0%) | 0 (0.0%) |
Fertility by Education in Bannock
| Educational Attainment | Women with Births | Births / 1,000 Women |
| Less than High School | 0 (0.0%) | 0.0 |
| High School Diploma | 0 (0.0%) | 0.0 |
| College or Associate's Degree | 0 (0.0%) | 0.0 |
| Bachelor's Degree | 0 (0.0%) | 0.0 |
| Graduate Degree | 0 (0.0%) | 0.0 |
| Total | 0 (0.0%) | 0.0 |
Fertility by Education by Marriage Status in Bannock
| Educational Attainment | Married | Unmarried |
| Less than High School | 0 (0.0%) | 0 (0.0%) |
| High School Diploma | 0 (0.0%) | 0 (0.0%) |
| College or Associate's Degree | 0 (0.0%) | 0 (0.0%) |
| Bachelor's Degree | 0 (0.0%) | 0 (0.0%) |
| Graduate Degree | 0 (0.0%) | 0 (0.0%) |
| Total | 0 (0.0%) | 0 (0.0%) |
Income in Bannock
Income Overview in Bannock
| Characteristic | Number | Measure |
| Per Capita Income | 191 | $29,345 |
| Median Family Income | 9 | $0 |
| Mean Family Income | 9 | $0 |
| Median Household Income | 137 | $47,538 |
| Mean Household Income | 137 | $39,458 |
| Income Deficit | 9 | $0 |
| Wage / Income Gap (%) | 191 | 0.00% |
| Wage / Income Gap ($) | 191 | 100.00¢ per $1 |
| Gini / Inequality Index | 191 | 0.18 |
Earnings by Sex in Bannock
| Sex | Number | Average Earnings |
| Male | 17 (20.2%) | $0 |
| Female | 67 (79.8%) | $0 |
| Total | 84 (100.0%) | $0 |
Earnings by Sex by Income Bracket in Bannock
The most common earnings brackets in Bannock are $40,000 to $44,999 for men (17 | 100.0%) and $10,000 to $12,499 for women (34 | 50.7%).
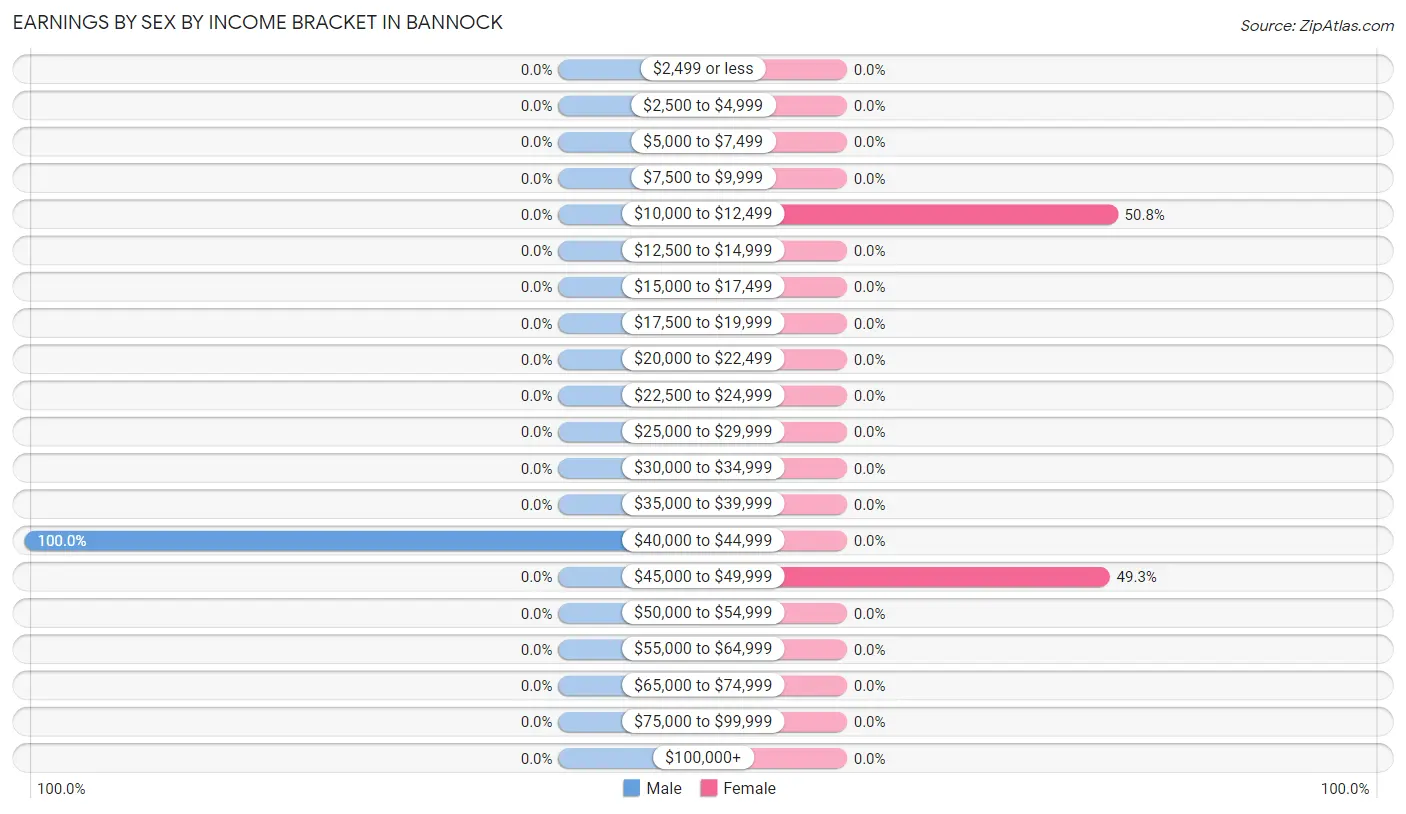
| Income | Male | Female |
| $2,499 or less | 0 (0.0%) | 0 (0.0%) |
| $2,500 to $4,999 | 0 (0.0%) | 0 (0.0%) |
| $5,000 to $7,499 | 0 (0.0%) | 0 (0.0%) |
| $7,500 to $9,999 | 0 (0.0%) | 0 (0.0%) |
| $10,000 to $12,499 | 0 (0.0%) | 34 (50.7%) |
| $12,500 to $14,999 | 0 (0.0%) | 0 (0.0%) |
| $15,000 to $17,499 | 0 (0.0%) | 0 (0.0%) |
| $17,500 to $19,999 | 0 (0.0%) | 0 (0.0%) |
| $20,000 to $22,499 | 0 (0.0%) | 0 (0.0%) |
| $22,500 to $24,999 | 0 (0.0%) | 0 (0.0%) |
| $25,000 to $29,999 | 0 (0.0%) | 0 (0.0%) |
| $30,000 to $34,999 | 0 (0.0%) | 0 (0.0%) |
| $35,000 to $39,999 | 0 (0.0%) | 0 (0.0%) |
| $40,000 to $44,999 | 17 (100.0%) | 0 (0.0%) |
| $45,000 to $49,999 | 0 (0.0%) | 33 (49.2%) |
| $50,000 to $54,999 | 0 (0.0%) | 0 (0.0%) |
| $55,000 to $64,999 | 0 (0.0%) | 0 (0.0%) |
| $65,000 to $74,999 | 0 (0.0%) | 0 (0.0%) |
| $75,000 to $99,999 | 0 (0.0%) | 0 (0.0%) |
| $100,000+ | 0 (0.0%) | 0 (0.0%) |
| Total | 17 (100.0%) | 67 (100.0%) |
Earnings by Sex by Educational Attainment in Bannock
| Educational Attainment | Male Income | Female Income |
| Less than High School | - | - |
| High School Diploma | - | - |
| College or Associate's Degree | - | - |
| Bachelor's Degree | - | - |
| Graduate Degree | - | - |
| Total | - | - |
Family Income in Bannock
Family Income Brackets in Bannock
According to the Bannock family income data, there are 9 families falling into the $50,000 to $74,999 income range, which is the most common income bracket and makes up 100.0% of all families.
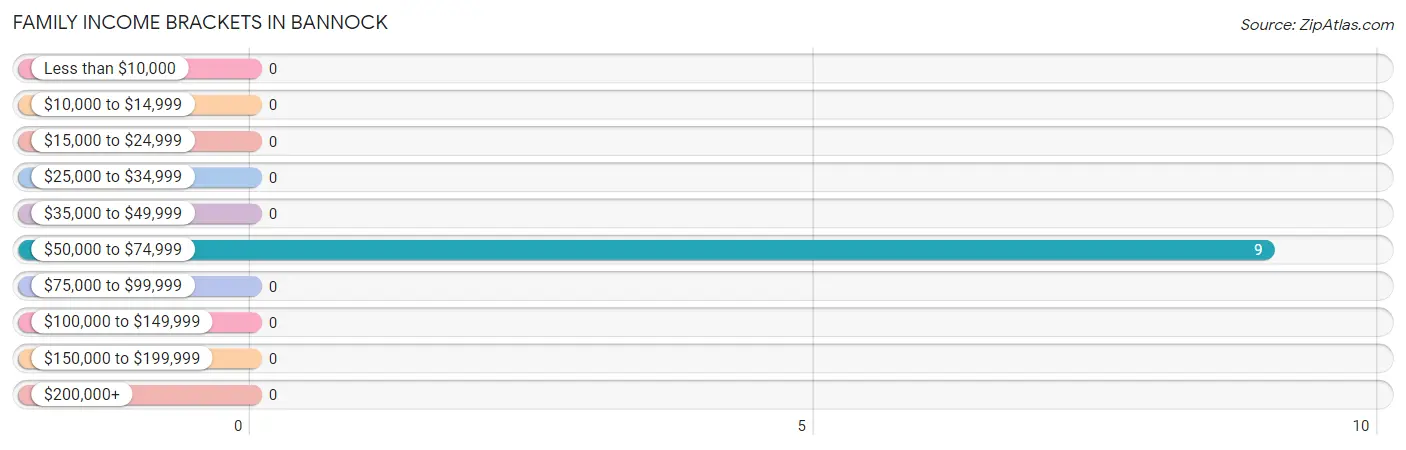
| Income Bracket | # Families | % Families |
| Less than $10,000 | 0 | 0.0% |
| $10,000 to $14,999 | 0 | 0.0% |
| $15,000 to $24,999 | 0 | 0.0% |
| $25,000 to $34,999 | 0 | 0.0% |
| $35,000 to $49,999 | 0 | 0.0% |
| $50,000 to $74,999 | 9 | 100.0% |
| $75,000 to $99,999 | 0 | 0.0% |
| $100,000 to $149,999 | 0 | 0.0% |
| $150,000 to $199,999 | 0 | 0.0% |
| $200,000+ | 0 | 0.0% |
Family Income by Famaliy Size in Bannock
| Income Bracket | # Families | Median Income |
| 2-Person Families | 9 (100.0%) | $0 |
| 3-Person Families | 0 (0.0%) | $0 |
| 4-Person Families | 0 (0.0%) | $0 |
| 5-Person Families | 0 (0.0%) | $0 |
| 6-Person Families | 0 (0.0%) | $0 |
| 7+ Person Families | 0 (0.0%) | $0 |
| Total | 9 (100.0%) | $0 |
Family Income by Number of Earners in Bannock
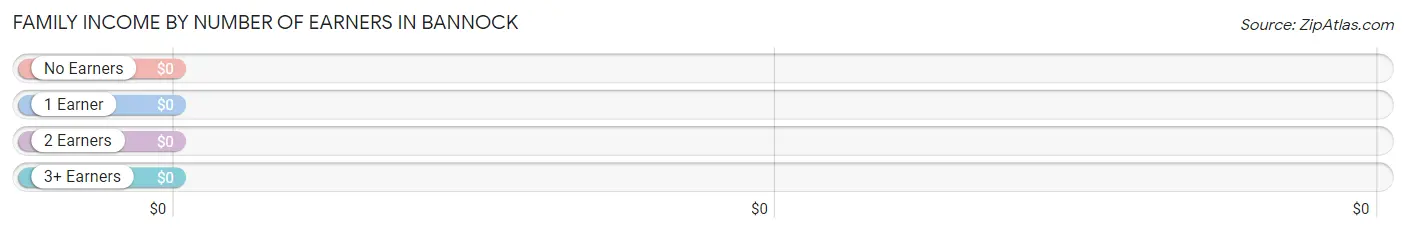
| Number of Earners | # Families | Median Income |
| No Earners | 9 (100.0%) | $0 |
| 1 Earner | 0 (0.0%) | $0 |
| 2 Earners | 0 (0.0%) | $0 |
| 3+ Earners | 0 (0.0%) | $0 |
| Total | 9 (100.0%) | $0 |
Household Income in Bannock
Household Income Brackets in Bannock
With 54 households falling in the category, the $25,000 to $34,999 income range is the most frequent in Bannock, accounting for 39.4% of all households.
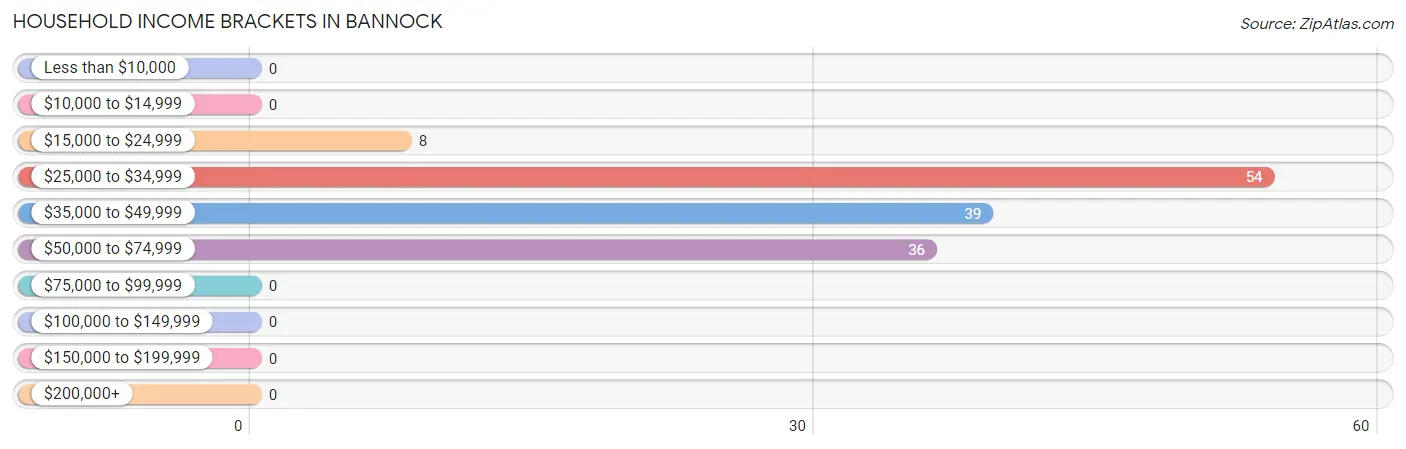
| Income Bracket | # Households | % Households |
| Less than $10,000 | 0 | 0.0% |
| $10,000 to $14,999 | 0 | 0.0% |
| $15,000 to $24,999 | 8 | 5.8% |
| $25,000 to $34,999 | 54 | 39.4% |
| $35,000 to $49,999 | 39 | 28.5% |
| $50,000 to $74,999 | 36 | 26.3% |
| $75,000 to $99,999 | 0 | 0.0% |
| $100,000 to $149,999 | 0 | 0.0% |
| $150,000 to $199,999 | 0 | 0.0% |
| $200,000+ | 0 | 0.0% |
Household Income by Householder Age in Bannock
The median household income in Bannock is $47,538, with the highest median household income of $26,644 found in the 65+ years age bracket for the primary householder. A total of 87 households (63.5%) fall into this category.
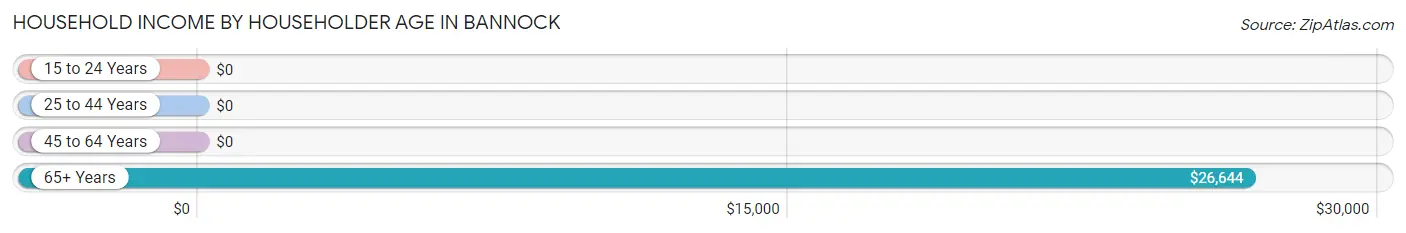
| Income Bracket | # Households | Median Income |
| 15 to 24 Years | 0 (0.0%) | $0 |
| 25 to 44 Years | 0 (0.0%) | $0 |
| 45 to 64 Years | 50 (36.5%) | $0 |
| 65+ Years | 87 (63.5%) | $26,644 |
| Total | 137 (100.0%) | $47,538 |
Poverty in Bannock
Income Below Poverty by Sex and Age in Bannock
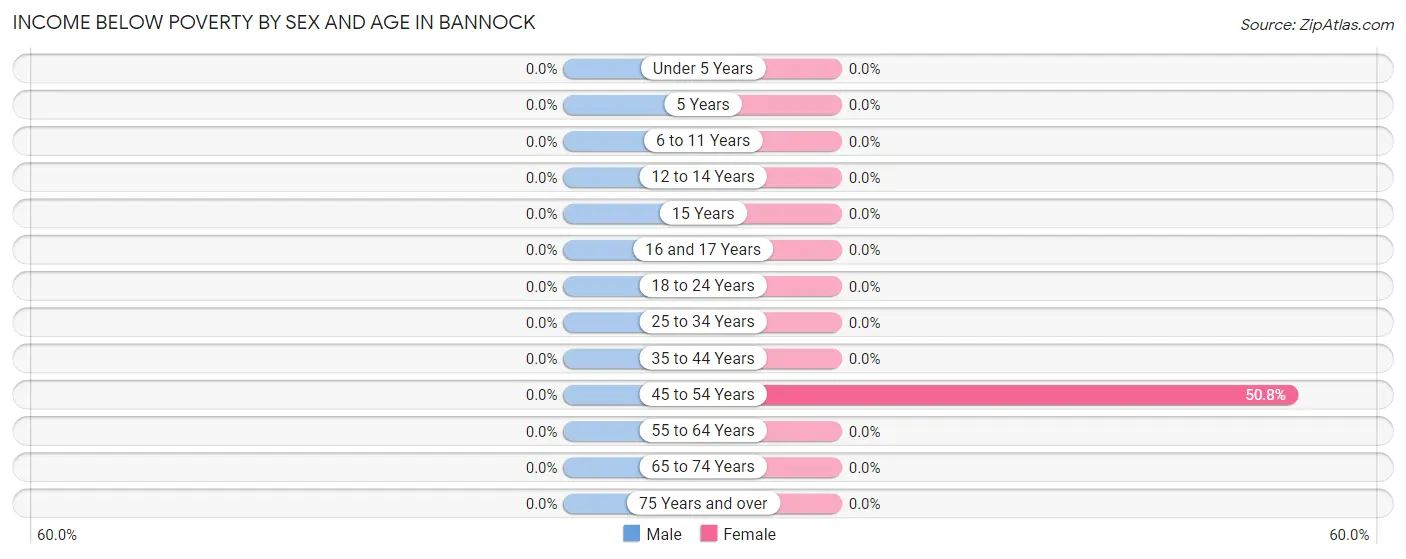
| Age Bracket | Male | Female |
| Under 5 Years | 0 (0.0%) | 0 (0.0%) |
| 5 Years | 0 (0.0%) | 0 (0.0%) |
| 6 to 11 Years | 0 (0.0%) | 0 (0.0%) |
| 12 to 14 Years | 0 (0.0%) | 0 (0.0%) |
| 15 Years | 0 (0.0%) | 0 (0.0%) |
| 16 and 17 Years | 0 (0.0%) | 0 (0.0%) |
| 18 to 24 Years | 0 (0.0%) | 0 (0.0%) |
| 25 to 34 Years | 0 (0.0%) | 0 (0.0%) |
| 35 to 44 Years | 0 (0.0%) | 0 (0.0%) |
| 45 to 54 Years | 0 (0.0%) | 34 (50.7%) |
| 55 to 64 Years | 0 (0.0%) | 0 (0.0%) |
| 65 to 74 Years | 0 (0.0%) | 0 (0.0%) |
| 75 Years and over | 0 (0.0%) | 0 (0.0%) |
| Total | 0 (0.0%) | 34 (39.5%) |
Income Above Poverty by Sex and Age in Bannock
According to the poverty statistics in Bannock, males aged 45 to 54 years and females aged 65 to 74 years are the age groups that are most secure financially, with 100.0% of males and 100.0% of females in these age groups living above the poverty line.
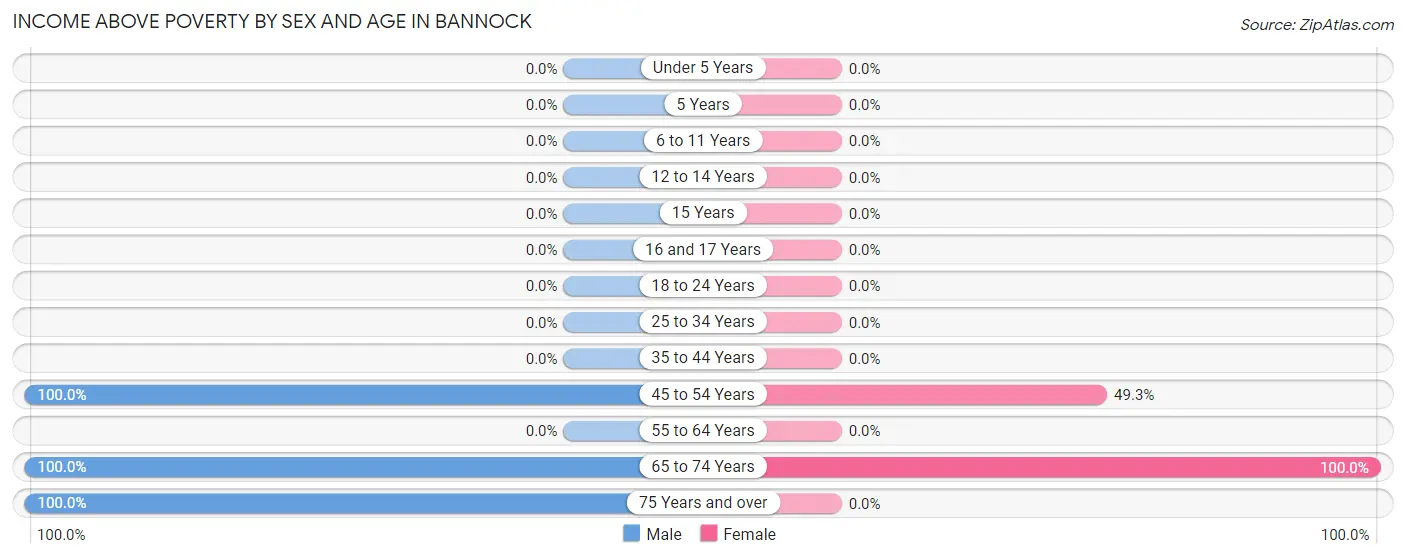
| Age Bracket | Male | Female |
| Under 5 Years | 0 (0.0%) | 0 (0.0%) |
| 5 Years | 0 (0.0%) | 0 (0.0%) |
| 6 to 11 Years | 0 (0.0%) | 0 (0.0%) |
| 12 to 14 Years | 0 (0.0%) | 0 (0.0%) |
| 15 Years | 0 (0.0%) | 0 (0.0%) |
| 16 and 17 Years | 0 (0.0%) | 0 (0.0%) |
| 18 to 24 Years | 0 (0.0%) | 0 (0.0%) |
| 25 to 34 Years | 0 (0.0%) | 0 (0.0%) |
| 35 to 44 Years | 0 (0.0%) | 0 (0.0%) |
| 45 to 54 Years | 17 (100.0%) | 33 (49.2%) |
| 55 to 64 Years | 0 (0.0%) | 0 (0.0%) |
| 65 to 74 Years | 28 (100.0%) | 19 (100.0%) |
| 75 Years and over | 60 (100.0%) | 0 (0.0%) |
| Total | 105 (100.0%) | 52 (60.5%) |
Income Below Poverty Among Married-Couple Families in Bannock
| Children | Above Poverty | Below Poverty |
| No Children | 9 (100.0%) | 0 (0.0%) |
| 1 or 2 Children | 0 (0.0%) | 0 (0.0%) |
| 3 or 4 Children | 0 (0.0%) | 0 (0.0%) |
| 5 or more Children | 0 (0.0%) | 0 (0.0%) |
| Total | 9 (100.0%) | 0 (0.0%) |
Income Below Poverty Among Single-Parent Households in Bannock
| Children | Single Father | Single Mother |
| No Children | 0 (0.0%) | 0 (0.0%) |
| 1 or 2 Children | 0 (0.0%) | 0 (0.0%) |
| 3 or 4 Children | 0 (0.0%) | 0 (0.0%) |
| 5 or more Children | 0 (0.0%) | 0 (0.0%) |
| Total | 0 (0.0%) | 0 (0.0%) |
Income Below Poverty Among Married-Couple vs Single-Parent Households in Bannock
| Children | Married-Couple Families | Single-Parent Households |
| No Children | 0 (0.0%) | 0 (0.0%) |
| 1 or 2 Children | 0 (0.0%) | 0 (0.0%) |
| 3 or 4 Children | 0 (0.0%) | 0 (0.0%) |
| 5 or more Children | 0 (0.0%) | 0 (0.0%) |
| Total | 0 (0.0%) | 0 (0.0%) |
Employment Characteristics in Bannock
Employment by Class of Employer in Bannock
Among the 50 employed individuals in Bannock, state government employees (33 | 66.0%), and private company employees (17 | 34.0%) make up the most common classes of employment.
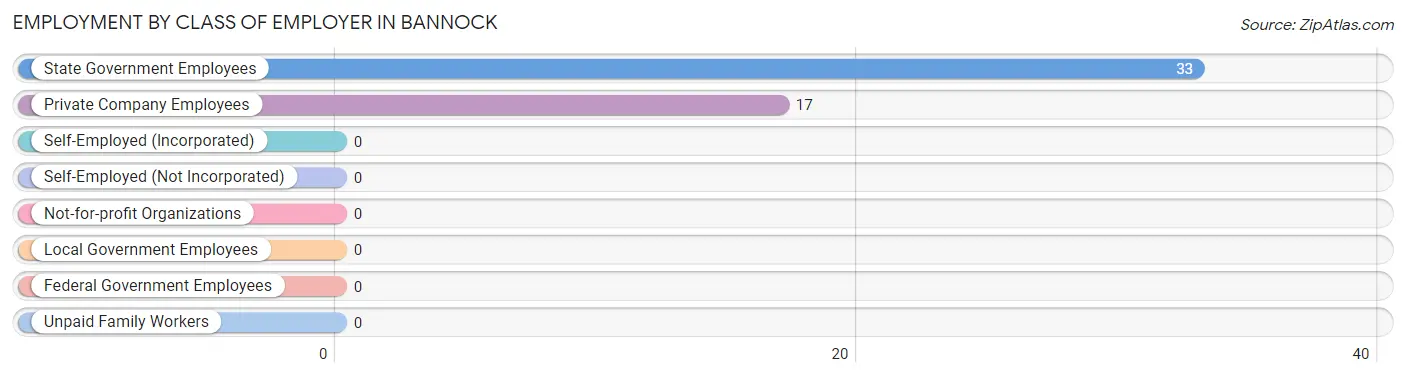
| Employer Class | # Employees | % Employees |
| Private Company Employees | 17 | 34.0% |
| Self-Employed (Incorporated) | 0 | 0.0% |
| Self-Employed (Not Incorporated) | 0 | 0.0% |
| Not-for-profit Organizations | 0 | 0.0% |
| Local Government Employees | 0 | 0.0% |
| State Government Employees | 33 | 66.0% |
| Federal Government Employees | 0 | 0.0% |
| Unpaid Family Workers | 0 | 0.0% |
| Total | 50 | 100.0% |
Employment Status by Age in Bannock
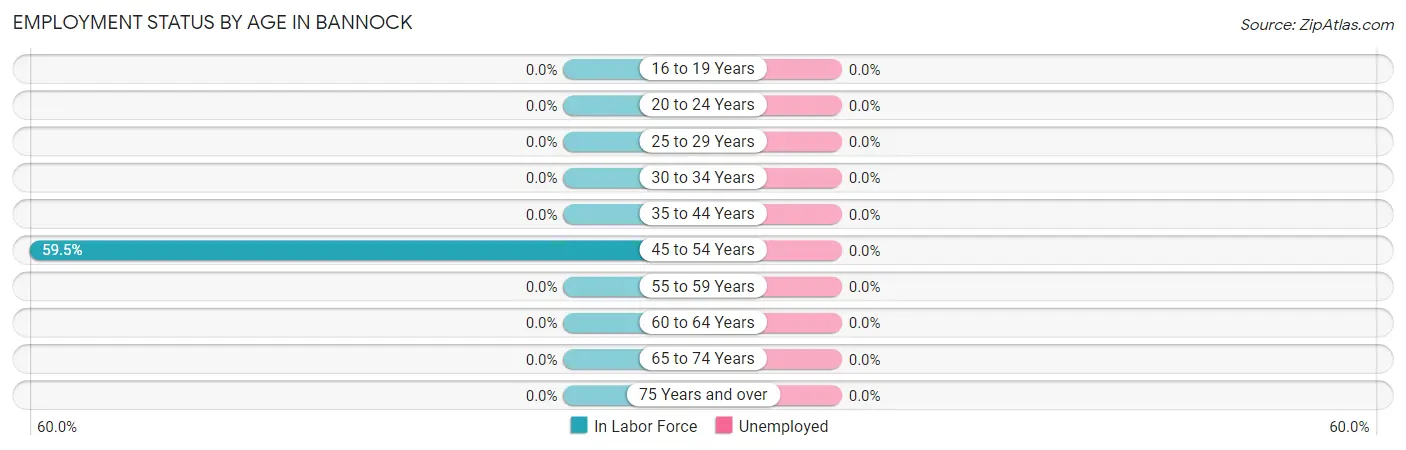
| Age Bracket | In Labor Force | Unemployed |
| 16 to 19 Years | 0 (0.0%) | 0 (0.0%) |
| 20 to 24 Years | 0 (0.0%) | 0 (0.0%) |
| 25 to 29 Years | 0 (0.0%) | 0 (0.0%) |
| 30 to 34 Years | 0 (0.0%) | 0 (0.0%) |
| 35 to 44 Years | 0 (0.0%) | 0 (0.0%) |
| 45 to 54 Years | 50 (59.5%) | 0 (0.0%) |
| 55 to 59 Years | 0 (0.0%) | 0 (0.0%) |
| 60 to 64 Years | 0 (0.0%) | 0 (0.0%) |
| 65 to 74 Years | 0 (0.0%) | 0 (0.0%) |
| 75 Years and over | 0 (0.0%) | 0 (0.0%) |
| Total | 50 (26.2%) | 0 (0.0%) |
Employment Status by Educational Attainment in Bannock
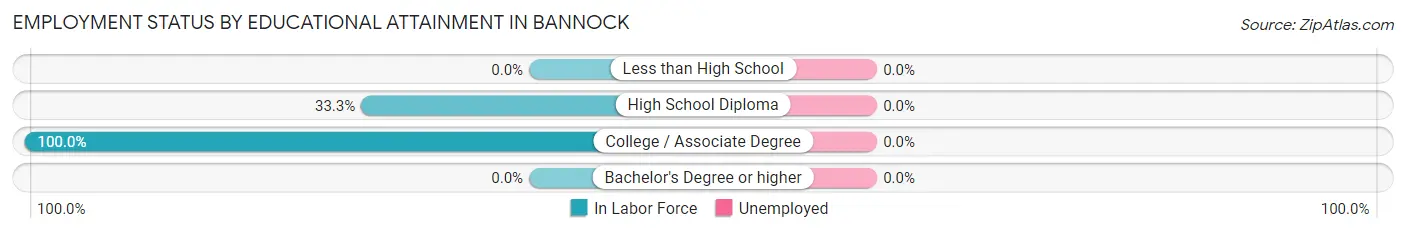
| Educational Attainment | In Labor Force | Unemployed |
| Less than High School | 0 (0.0%) | 0 (0.0%) |
| High School Diploma | 17 (33.3%) | 0 (0.0%) |
| College / Associate Degree | 33 (100.0%) | 0 (0.0%) |
| Bachelor's Degree or higher | 0 (0.0%) | 0 (0.0%) |
| Total | 50 (59.5%) | 0 (0.0%) |
Employment Occupations by Sex in Bannock
Management, Business, Science and Arts Occupations
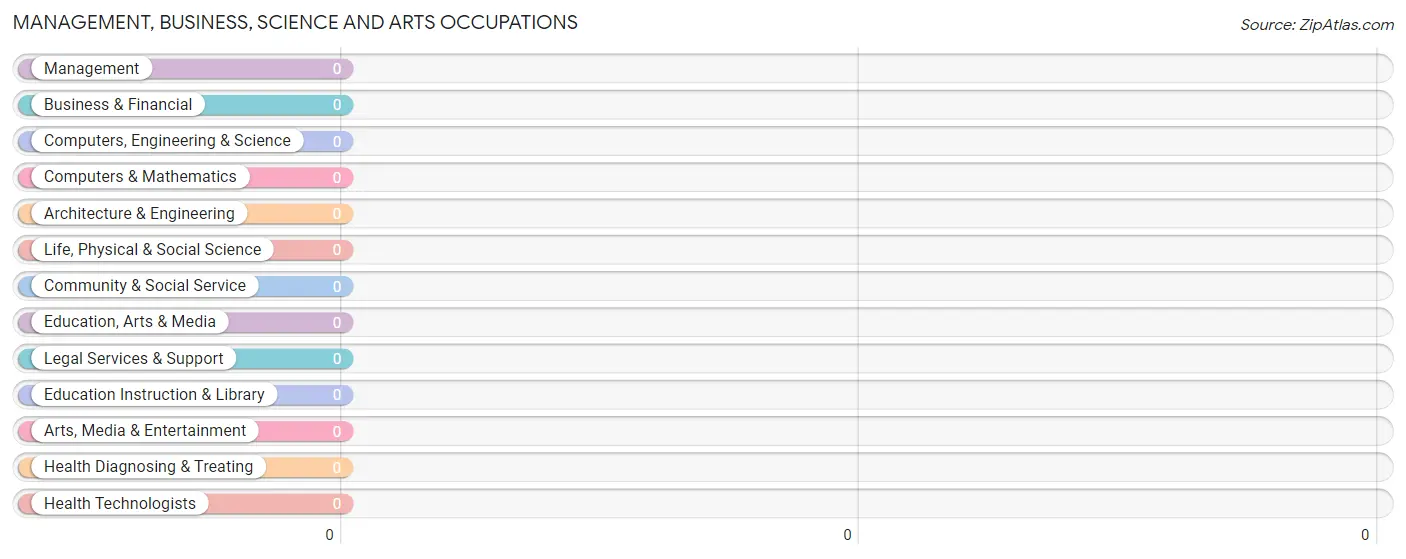
Management, Business, Science and Arts Occupations by Sex
| Occupation | Male | Female |
| Management | 0 (0.0%) | 0 (0.0%) |
| Business & Financial | 0 (0.0%) | 0 (0.0%) |
| Computers, Engineering & Science | 0 (0.0%) | 0 (0.0%) |
| Computers & Mathematics | 0 (0.0%) | 0 (0.0%) |
| Architecture & Engineering | 0 (0.0%) | 0 (0.0%) |
| Life, Physical & Social Science | 0 (0.0%) | 0 (0.0%) |
| Community & Social Service | 0 (0.0%) | 0 (0.0%) |
| Education, Arts & Media | 0 (0.0%) | 0 (0.0%) |
| Legal Services & Support | 0 (0.0%) | 0 (0.0%) |
| Education Instruction & Library | 0 (0.0%) | 0 (0.0%) |
| Arts, Media & Entertainment | 0 (0.0%) | 0 (0.0%) |
| Health Diagnosing & Treating | 0 (0.0%) | 0 (0.0%) |
| Health Technologists | 0 (0.0%) | 0 (0.0%) |
| Total (Category) | 0 (0.0%) | 0 (0.0%) |
| Total (Overall) | 17 (34.0%) | 33 (66.0%) |
Services Occupations
The most common Services occupations in Bannock are Security & Protection (33 | 66.0%), and Law Enforcement (33 | 66.0%).
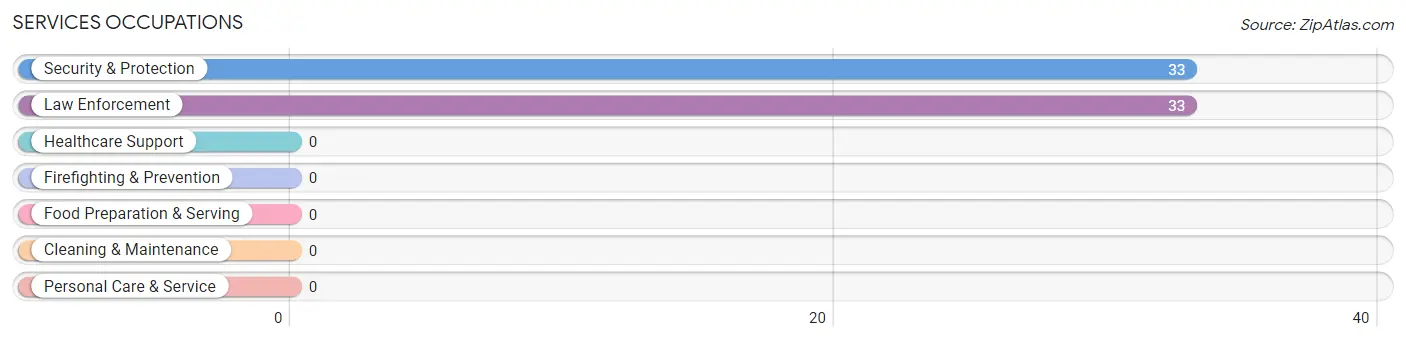
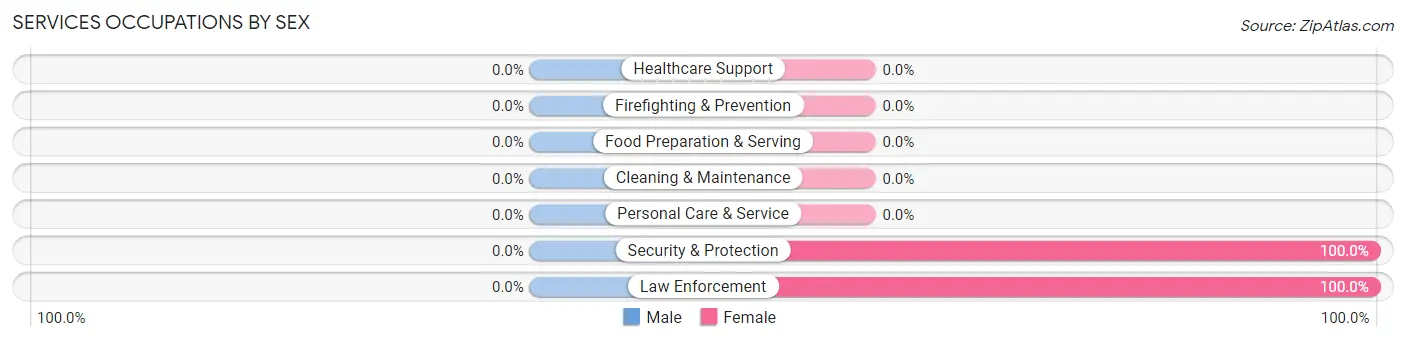
Services Occupations by Sex
| Occupation | Male | Female |
| Healthcare Support | 0 (0.0%) | 0 (0.0%) |
| Security & Protection | 0 (0.0%) | 33 (100.0%) |
| Firefighting & Prevention | 0 (0.0%) | 0 (0.0%) |
| Law Enforcement | 0 (0.0%) | 33 (100.0%) |
| Food Preparation & Serving | 0 (0.0%) | 0 (0.0%) |
| Cleaning & Maintenance | 0 (0.0%) | 0 (0.0%) |
| Personal Care & Service | 0 (0.0%) | 0 (0.0%) |
| Total (Category) | 0 (0.0%) | 33 (100.0%) |
| Total (Overall) | 17 (34.0%) | 33 (66.0%) |
Sales and Office Occupations
Sales and Office Occupations by Sex
| Occupation | Male | Female |
| Sales & Related | 0 (0.0%) | 0 (0.0%) |
| Office & Administration | 0 (0.0%) | 0 (0.0%) |
| Total (Category) | 0 (0.0%) | 0 (0.0%) |
| Total (Overall) | 17 (34.0%) | 33 (66.0%) |
Natural Resources, Construction and Maintenance Occupations
The most common Natural Resources, Construction and Maintenance occupations in Bannock are , and Construction & Extraction (17 | 34.0%).
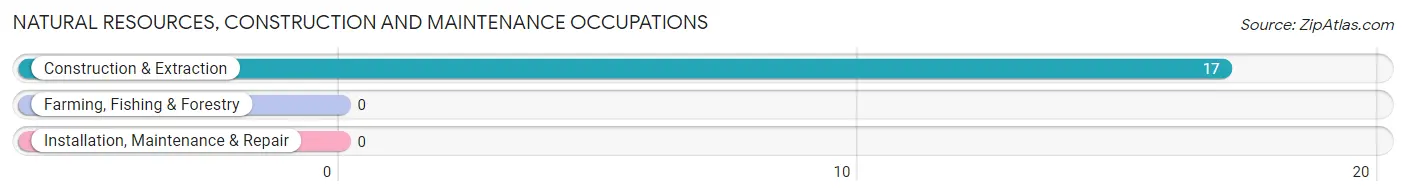
Natural Resources, Construction and Maintenance Occupations by Sex
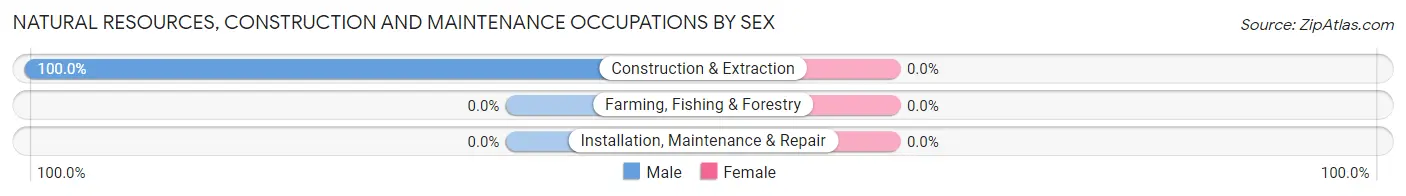
| Occupation | Male | Female |
| Farming, Fishing & Forestry | 0 (0.0%) | 0 (0.0%) |
| Construction & Extraction | 17 (100.0%) | 0 (0.0%) |
| Installation, Maintenance & Repair | 0 (0.0%) | 0 (0.0%) |
| Total (Category) | 17 (100.0%) | 0 (0.0%) |
| Total (Overall) | 17 (34.0%) | 33 (66.0%) |
Production, Transportation and Moving Occupations
Production, Transportation and Moving Occupations by Sex
| Occupation | Male | Female |
| Production | 0 (0.0%) | 0 (0.0%) |
| Transportation | 0 (0.0%) | 0 (0.0%) |
| Material Moving | 0 (0.0%) | 0 (0.0%) |
| Total (Category) | 0 (0.0%) | 0 (0.0%) |
| Total (Overall) | 17 (34.0%) | 33 (66.0%) |
Employment Industries by Sex in Bannock
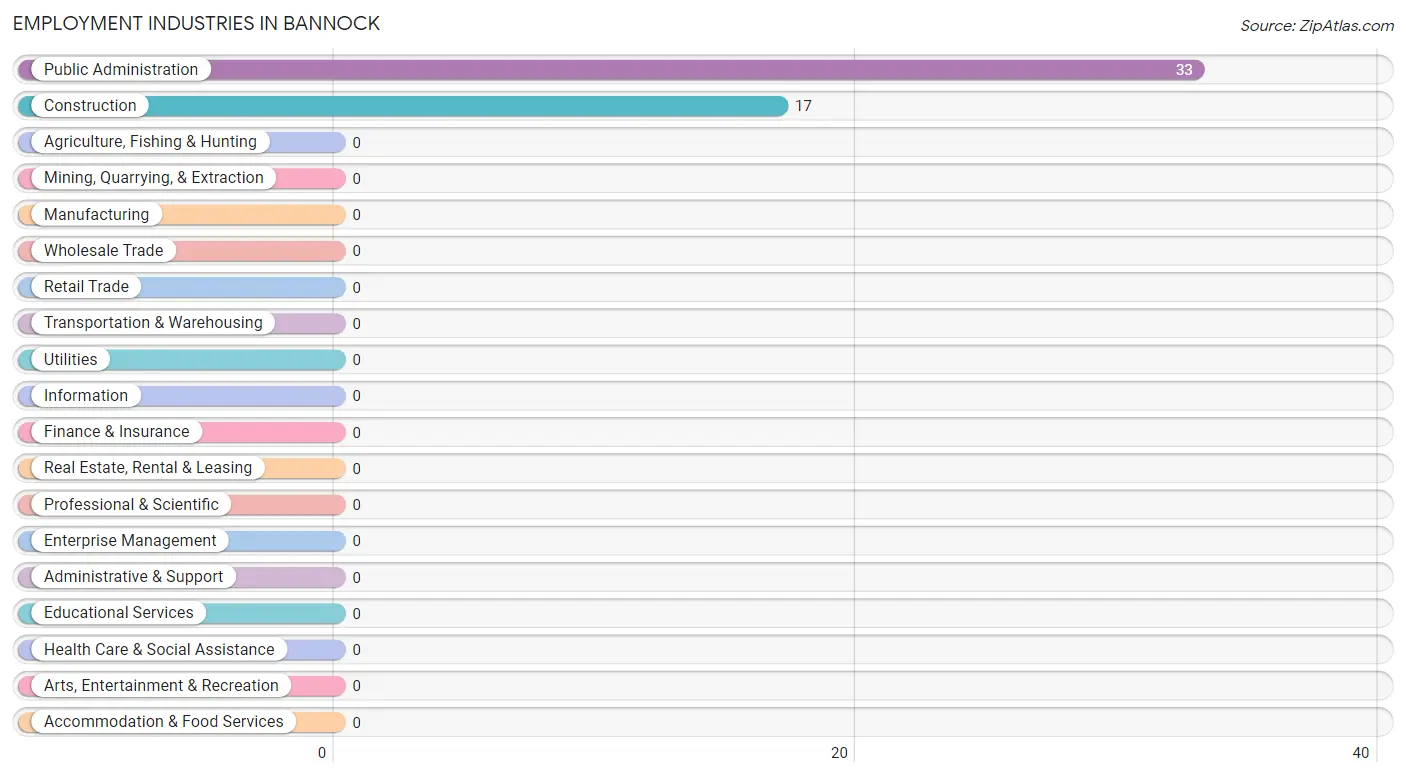
Employment Industries in Bannock
The major employment industries in Bannock include Public Administration (33 | 66.0%), and Construction (17 | 34.0%).
Employment Industries by Sex in Bannock
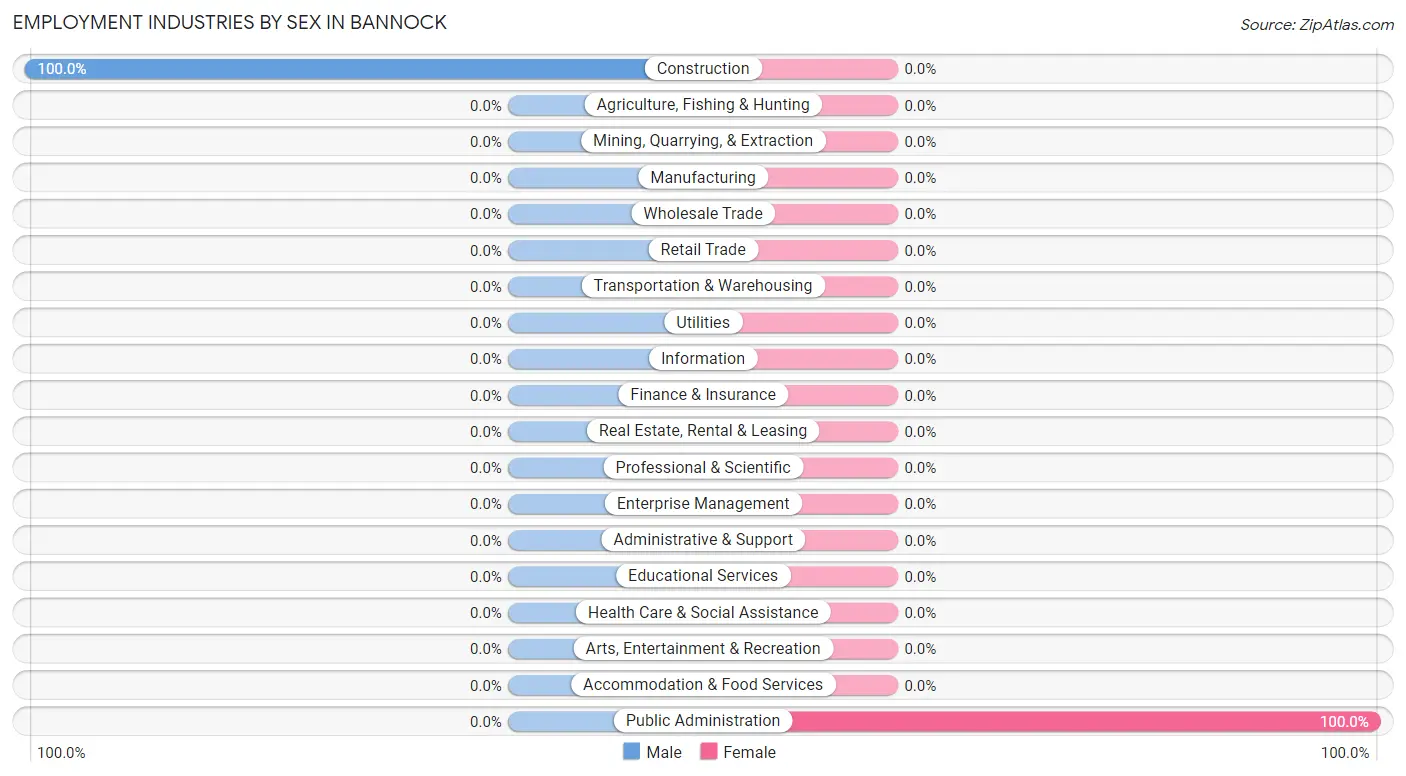
| Industry | Male | Female |
| Agriculture, Fishing & Hunting | 0 (0.0%) | 0 (0.0%) |
| Mining, Quarrying, & Extraction | 0 (0.0%) | 0 (0.0%) |
| Construction | 17 (100.0%) | 0 (0.0%) |
| Manufacturing | 0 (0.0%) | 0 (0.0%) |
| Wholesale Trade | 0 (0.0%) | 0 (0.0%) |
| Retail Trade | 0 (0.0%) | 0 (0.0%) |
| Transportation & Warehousing | 0 (0.0%) | 0 (0.0%) |
| Utilities | 0 (0.0%) | 0 (0.0%) |
| Information | 0 (0.0%) | 0 (0.0%) |
| Finance & Insurance | 0 (0.0%) | 0 (0.0%) |
| Real Estate, Rental & Leasing | 0 (0.0%) | 0 (0.0%) |
| Professional & Scientific | 0 (0.0%) | 0 (0.0%) |
| Enterprise Management | 0 (0.0%) | 0 (0.0%) |
| Administrative & Support | 0 (0.0%) | 0 (0.0%) |
| Educational Services | 0 (0.0%) | 0 (0.0%) |
| Health Care & Social Assistance | 0 (0.0%) | 0 (0.0%) |
| Arts, Entertainment & Recreation | 0 (0.0%) | 0 (0.0%) |
| Accommodation & Food Services | 0 (0.0%) | 0 (0.0%) |
| Public Administration | 0 (0.0%) | 33 (100.0%) |
| Total | 17 (34.0%) | 33 (66.0%) |
Education in Bannock
School Enrollment in Bannock
| School Level | # Students | % Students |
| Nursery / Preschool | 0 | 0.0% |
| Kindergarten | 0 | 0.0% |
| Elementary School | 0 | 0.0% |
| Middle School | 0 | 0.0% |
| High School | 0 | 0.0% |
| College / Undergraduate | 0 | 0.0% |
| Graduate / Professional | 0 | 0.0% |
| Total | 0 | 0.0% |
School Enrollment by Age by Funding Source in Bannock
| Age Bracket | Public School | Private School |
| 3 to 4 Year Olds | 0 (0.0%) | 0 (0.0%) |
| 5 to 9 Year Old | 0 (0.0%) | 0 (0.0%) |
| 10 to 14 Year Olds | 0 (0.0%) | 0 (0.0%) |
| 15 to 17 Year Olds | 0 (0.0%) | 0 (0.0%) |
| 18 to 19 Year Olds | 0 (0.0%) | 0 (0.0%) |
| 20 to 24 Year Olds | 0 (0.0%) | 0 (0.0%) |
| 25 to 34 Year Olds | 0 (0.0%) | 0 (0.0%) |
| 35 Years and over | 0 (0.0%) | 0 (0.0%) |
| Total | 0 (0.0%) | 0 (0.0%) |
Educational Attainment by Field of Study in Bannock
, and liberal arts & history (8 | 100.0%) are the most common fields of study among 8 individuals in Bannock who have obtained a bachelor's degree or higher.
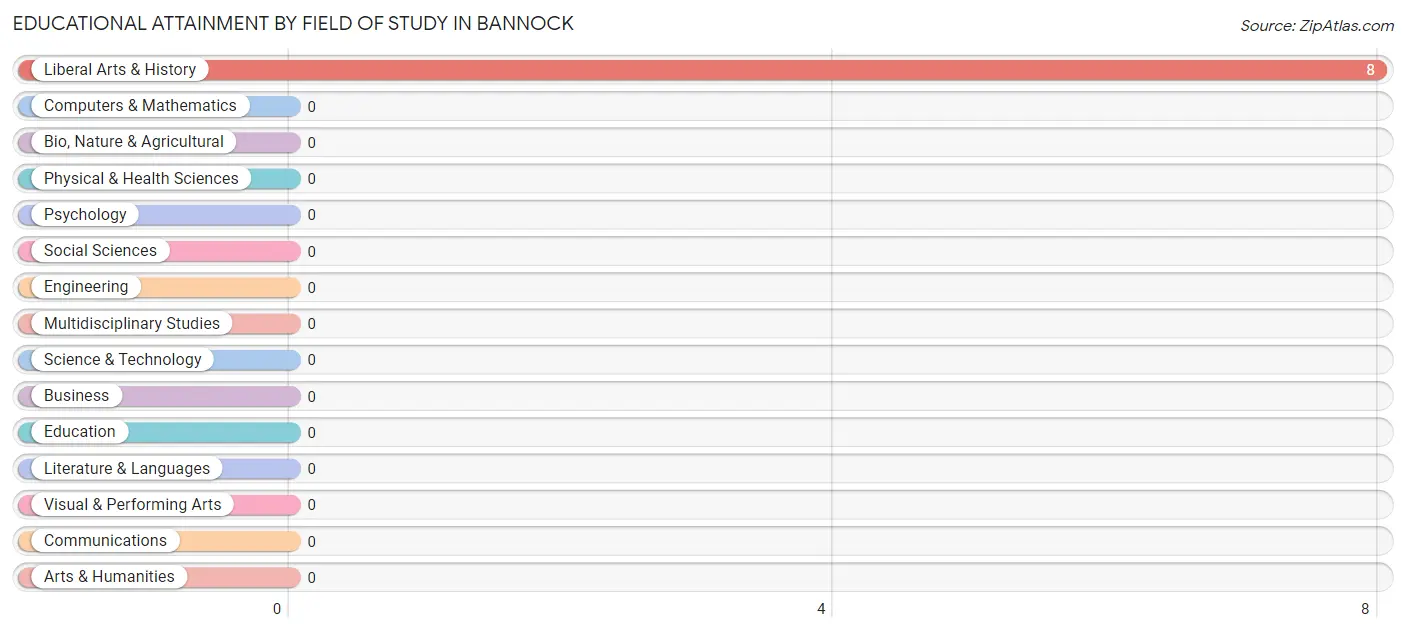
| Field of Study | # Graduates | % Graduates |
| Computers & Mathematics | 0 | 0.0% |
| Bio, Nature & Agricultural | 0 | 0.0% |
| Physical & Health Sciences | 0 | 0.0% |
| Psychology | 0 | 0.0% |
| Social Sciences | 0 | 0.0% |
| Engineering | 0 | 0.0% |
| Multidisciplinary Studies | 0 | 0.0% |
| Science & Technology | 0 | 0.0% |
| Business | 0 | 0.0% |
| Education | 0 | 0.0% |
| Literature & Languages | 0 | 0.0% |
| Liberal Arts & History | 8 | 100.0% |
| Visual & Performing Arts | 0 | 0.0% |
| Communications | 0 | 0.0% |
| Arts & Humanities | 0 | 0.0% |
| Total | 8 | 100.0% |
Transportation & Commute in Bannock
Vehicle Availability by Sex in Bannock
The most prevalent vehicle ownership categories in Bannock are males with 3 vehicles (17, accounting for 100.0%) and females with 3 vehicles (0, making up 51.5%).
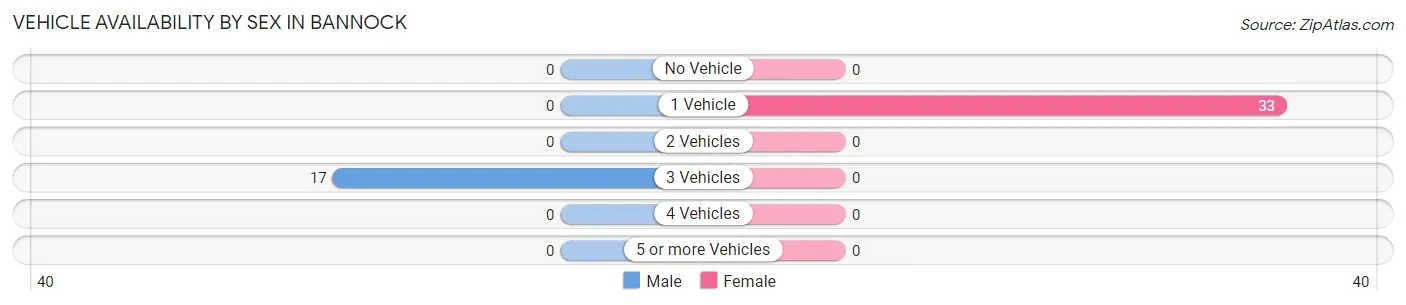
| Vehicles Available | Male | Female |
| No Vehicle | 0 (0.0%) | 0 (0.0%) |
| 1 Vehicle | 0 (0.0%) | 33 (100.0%) |
| 2 Vehicles | 0 (0.0%) | 0 (0.0%) |
| 3 Vehicles | 17 (100.0%) | 0 (0.0%) |
| 4 Vehicles | 0 (0.0%) | 0 (0.0%) |
| 5 or more Vehicles | 0 (0.0%) | 0 (0.0%) |
| Total | 17 (100.0%) | 33 (100.0%) |
Commute Time in Bannock
The most frequently occuring commute durations in Bannock are 5 to 9 minutes (33 commuters, 66.0%), 10 to 14 minutes (17 commuters, 34.0%), and less than 5 minutes (0 commuters, 0.0%).
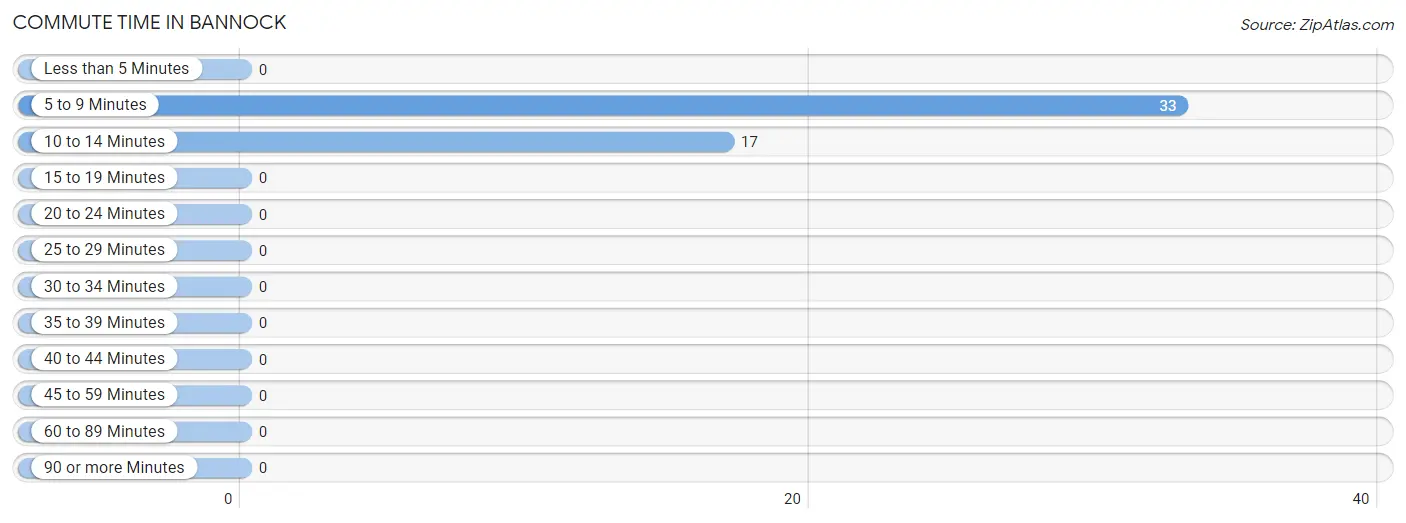
| Commute Time | # Commuters | % Commuters |
| Less than 5 Minutes | 0 | 0.0% |
| 5 to 9 Minutes | 33 | 66.0% |
| 10 to 14 Minutes | 17 | 34.0% |
| 15 to 19 Minutes | 0 | 0.0% |
| 20 to 24 Minutes | 0 | 0.0% |
| 25 to 29 Minutes | 0 | 0.0% |
| 30 to 34 Minutes | 0 | 0.0% |
| 35 to 39 Minutes | 0 | 0.0% |
| 40 to 44 Minutes | 0 | 0.0% |
| 45 to 59 Minutes | 0 | 0.0% |
| 60 to 89 Minutes | 0 | 0.0% |
| 90 or more Minutes | 0 | 0.0% |
Commute Time by Sex in Bannock
The most common commute times in Bannock are 10 to 14 minutes (17 commuters, 100.0%) for males and 5 to 9 minutes (33 commuters, 100.0%) for females.
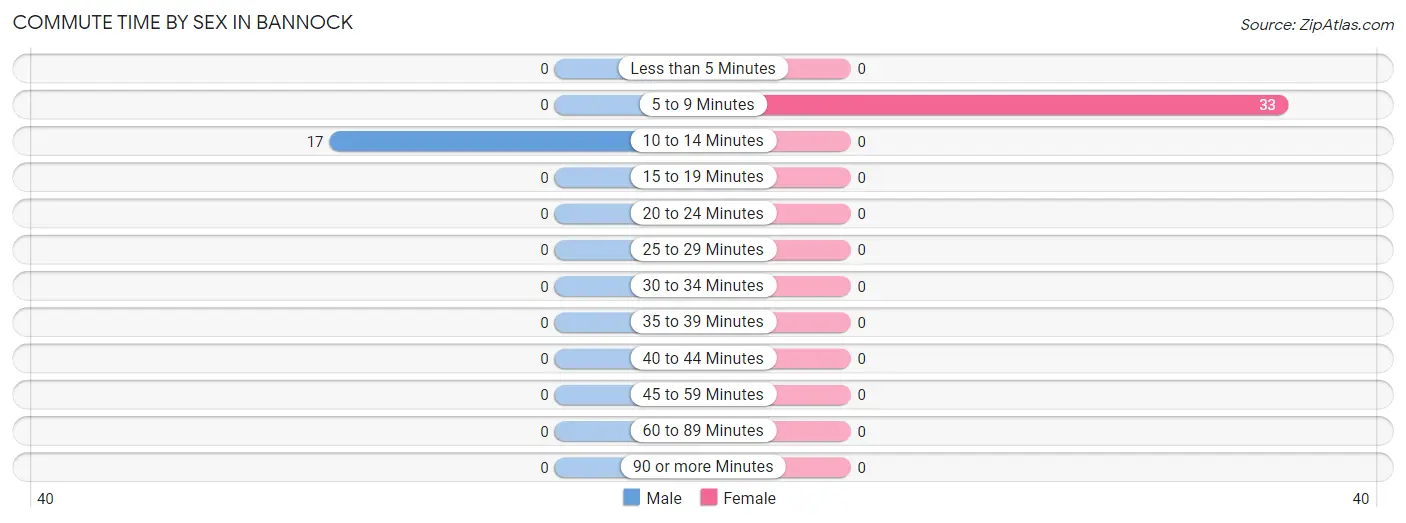
| Commute Time | Male | Female |
| Less than 5 Minutes | 0 (0.0%) | 0 (0.0%) |
| 5 to 9 Minutes | 0 (0.0%) | 33 (100.0%) |
| 10 to 14 Minutes | 17 (100.0%) | 0 (0.0%) |
| 15 to 19 Minutes | 0 (0.0%) | 0 (0.0%) |
| 20 to 24 Minutes | 0 (0.0%) | 0 (0.0%) |
| 25 to 29 Minutes | 0 (0.0%) | 0 (0.0%) |
| 30 to 34 Minutes | 0 (0.0%) | 0 (0.0%) |
| 35 to 39 Minutes | 0 (0.0%) | 0 (0.0%) |
| 40 to 44 Minutes | 0 (0.0%) | 0 (0.0%) |
| 45 to 59 Minutes | 0 (0.0%) | 0 (0.0%) |
| 60 to 89 Minutes | 0 (0.0%) | 0 (0.0%) |
| 90 or more Minutes | 0 (0.0%) | 0 (0.0%) |
Time of Departure to Work by Sex in Bannock
The most frequent times of departure to work in Bannock are 7:30 AM to 7:59 AM (17, 100.0%) for males and 5:00 AM to 5:29 AM (33, 100.0%) for females.
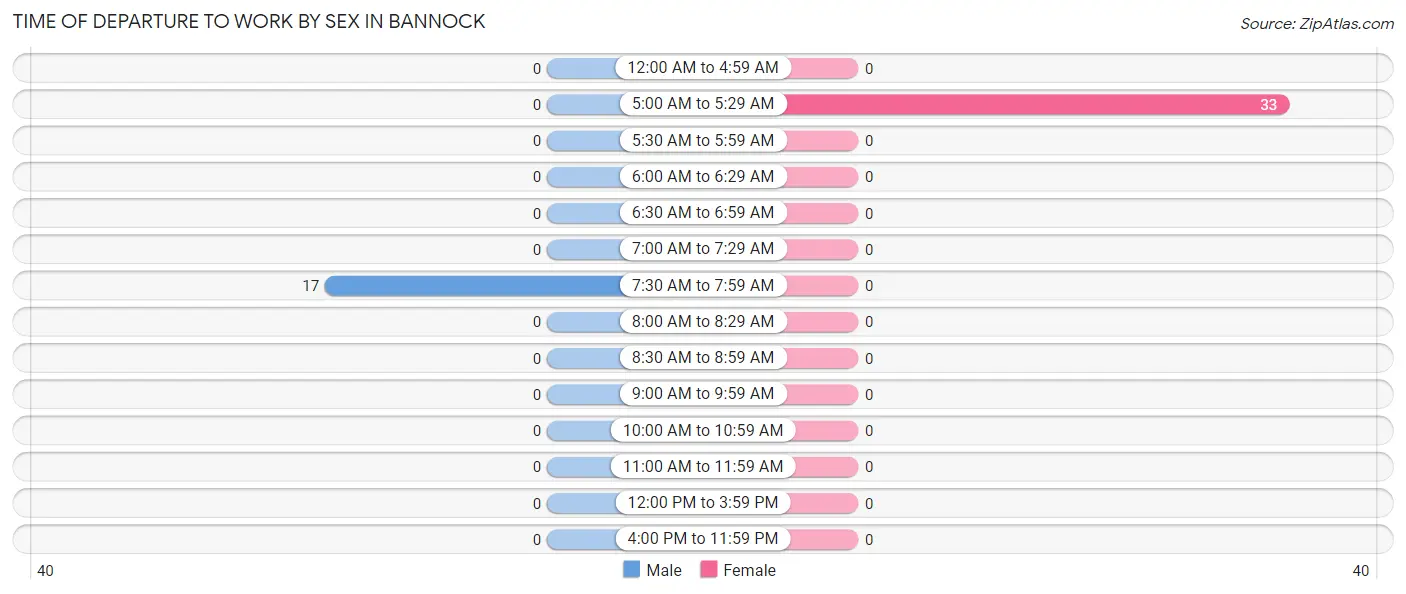
| Time of Departure | Male | Female |
| 12:00 AM to 4:59 AM | 0 (0.0%) | 0 (0.0%) |
| 5:00 AM to 5:29 AM | 0 (0.0%) | 33 (100.0%) |
| 5:30 AM to 5:59 AM | 0 (0.0%) | 0 (0.0%) |
| 6:00 AM to 6:29 AM | 0 (0.0%) | 0 (0.0%) |
| 6:30 AM to 6:59 AM | 0 (0.0%) | 0 (0.0%) |
| 7:00 AM to 7:29 AM | 0 (0.0%) | 0 (0.0%) |
| 7:30 AM to 7:59 AM | 17 (100.0%) | 0 (0.0%) |
| 8:00 AM to 8:29 AM | 0 (0.0%) | 0 (0.0%) |
| 8:30 AM to 8:59 AM | 0 (0.0%) | 0 (0.0%) |
| 9:00 AM to 9:59 AM | 0 (0.0%) | 0 (0.0%) |
| 10:00 AM to 10:59 AM | 0 (0.0%) | 0 (0.0%) |
| 11:00 AM to 11:59 AM | 0 (0.0%) | 0 (0.0%) |
| 12:00 PM to 3:59 PM | 0 (0.0%) | 0 (0.0%) |
| 4:00 PM to 11:59 PM | 0 (0.0%) | 0 (0.0%) |
| Total | 17 (100.0%) | 33 (100.0%) |
Housing Occupancy in Bannock
Occupancy by Ownership in Bannock
Of the total 137 dwellings in Bannock, owner-occupied units account for 120 (87.6%), while renter-occupied units make up 17 (12.4%).
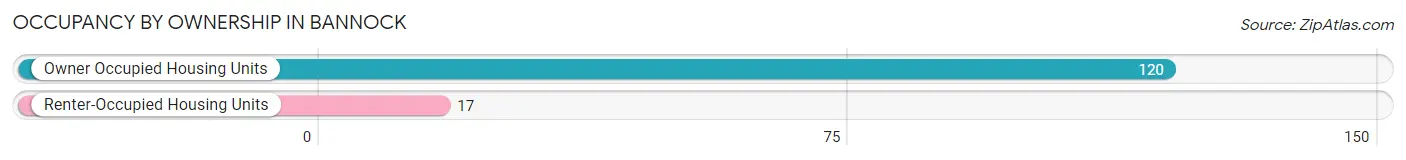
| Occupancy | # Housing Units | % Housing Units |
| Owner Occupied Housing Units | 120 | 87.6% |
| Renter-Occupied Housing Units | 17 | 12.4% |
| Total Occupied Housing Units | 137 | 100.0% |
Occupancy by Household Size in Bannock
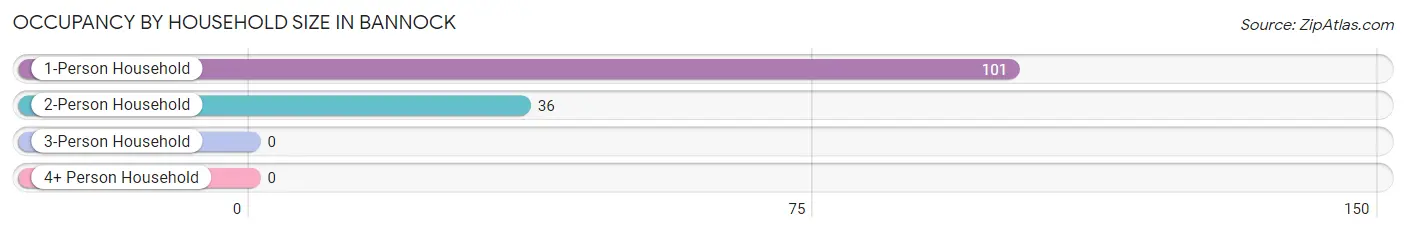
| Household Size | # Housing Units | % Housing Units |
| 1-Person Household | 101 | 73.7% |
| 2-Person Household | 36 | 26.3% |
| 3-Person Household | 0 | 0.0% |
| 4+ Person Household | 0 | 0.0% |
| Total Housing Units | 137 | 100.0% |
Occupancy by Ownership by Household Size in Bannock
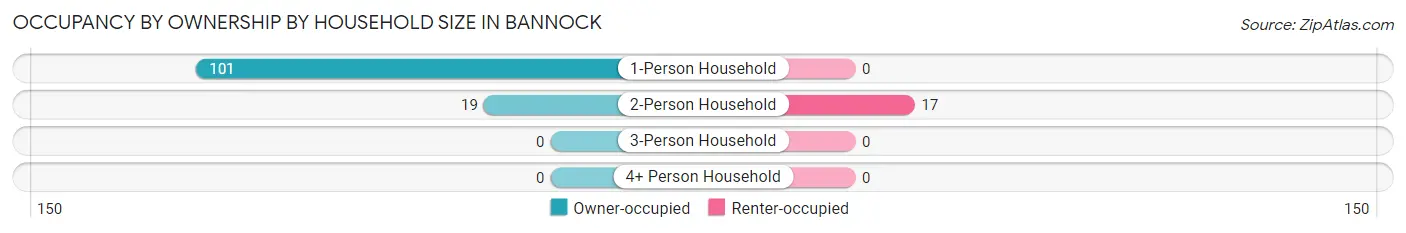
| Household Size | Owner-occupied | Renter-occupied |
| 1-Person Household | 101 (100.0%) | 0 (0.0%) |
| 2-Person Household | 19 (52.8%) | 17 (47.2%) |
| 3-Person Household | 0 (0.0%) | 0 (0.0%) |
| 4+ Person Household | 0 (0.0%) | 0 (0.0%) |
| Total Housing Units | 120 (87.6%) | 17 (12.4%) |
Occupancy by Educational Attainment in Bannock
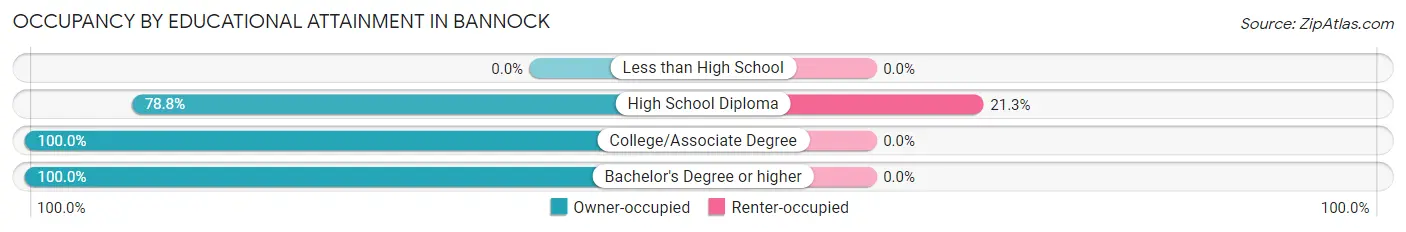
| Household Size | Owner-occupied | Renter-occupied |
| Less than High School | 0 (0.0%) | 0 (0.0%) |
| High School Diploma | 63 (78.7%) | 17 (21.2%) |
| College/Associate Degree | 49 (100.0%) | 0 (0.0%) |
| Bachelor's Degree or higher | 8 (100.0%) | 0 (0.0%) |
Occupancy by Age of Householder in Bannock
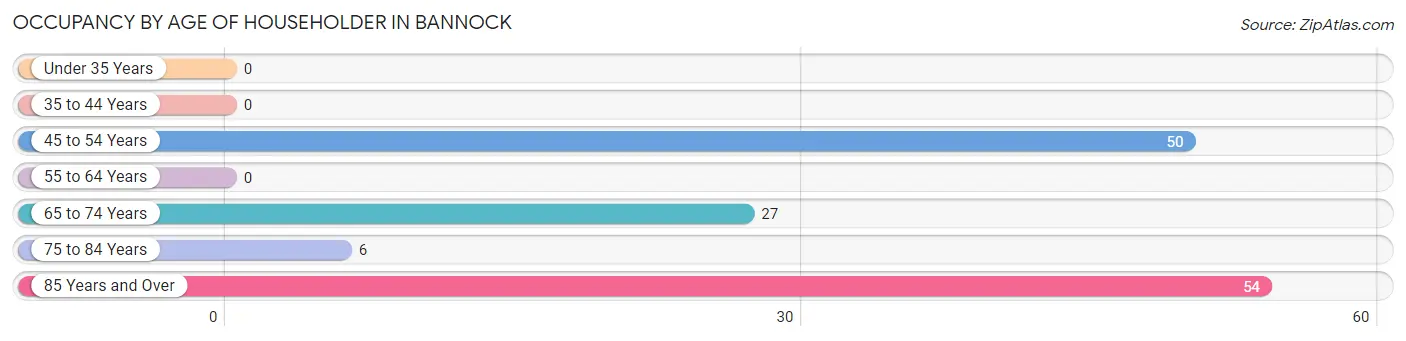
| Age Bracket | # Households | % Households |
| Under 35 Years | 0 | 0.0% |
| 35 to 44 Years | 0 | 0.0% |
| 45 to 54 Years | 50 | 36.5% |
| 55 to 64 Years | 0 | 0.0% |
| 65 to 74 Years | 27 | 19.7% |
| 75 to 84 Years | 6 | 4.4% |
| 85 Years and Over | 54 | 39.4% |
| Total | 137 | 100.0% |
Housing Finances in Bannock
Median Income by Occupancy in Bannock
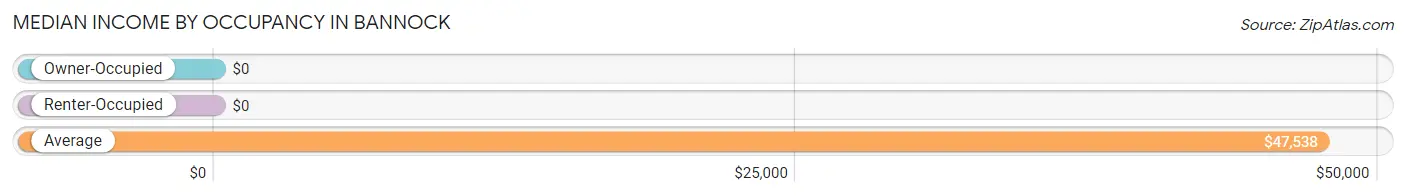
| Occupancy Type | # Households | Median Income |
| Owner-Occupied | 120 (87.6%) | $0 |
| Renter-Occupied | 17 (12.4%) | $0 |
| Average | 137 (100.0%) | $47,538 |
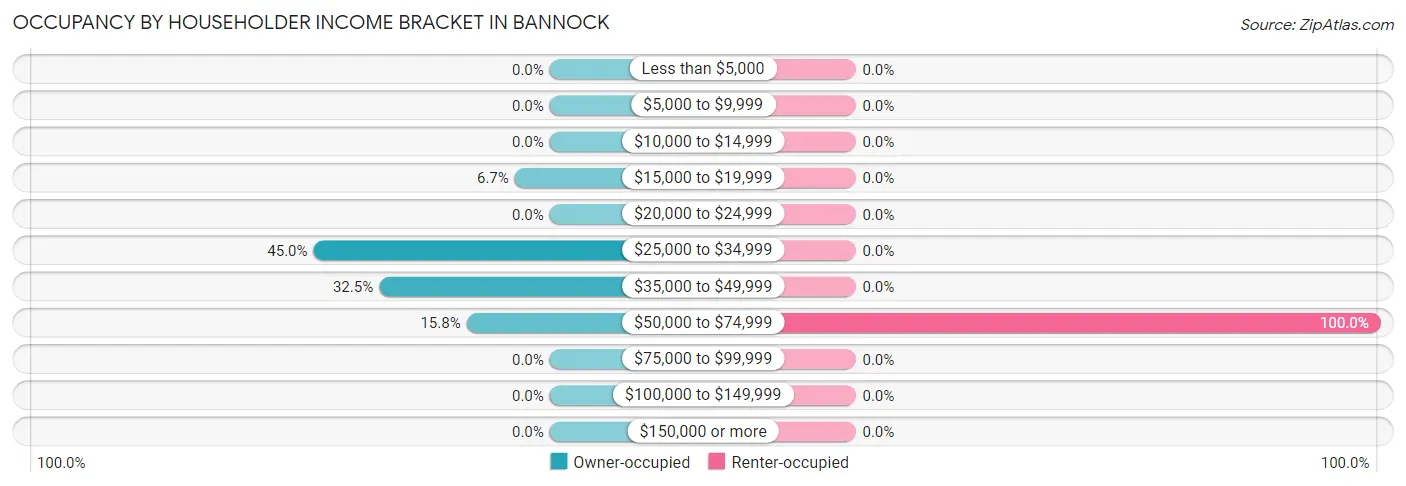
Occupancy by Householder Income Bracket in Bannock
| Income Bracket | Owner-occupied | Renter-occupied |
| Less than $5,000 | 0 (0.0%) | 0 (0.0%) |
| $5,000 to $9,999 | 0 (0.0%) | 0 (0.0%) |
| $10,000 to $14,999 | 0 (0.0%) | 0 (0.0%) |
| $15,000 to $19,999 | 8 (6.7%) | 0 (0.0%) |
| $20,000 to $24,999 | 0 (0.0%) | 0 (0.0%) |
| $25,000 to $34,999 | 54 (45.0%) | 0 (0.0%) |
| $35,000 to $49,999 | 39 (32.5%) | 0 (0.0%) |
| $50,000 to $74,999 | 19 (15.8%) | 17 (100.0%) |
| $75,000 to $99,999 | 0 (0.0%) | 0 (0.0%) |
| $100,000 to $149,999 | 0 (0.0%) | 0 (0.0%) |
| $150,000 or more | 0 (0.0%) | 0 (0.0%) |
| Total | 120 (100.0%) | 17 (100.0%) |
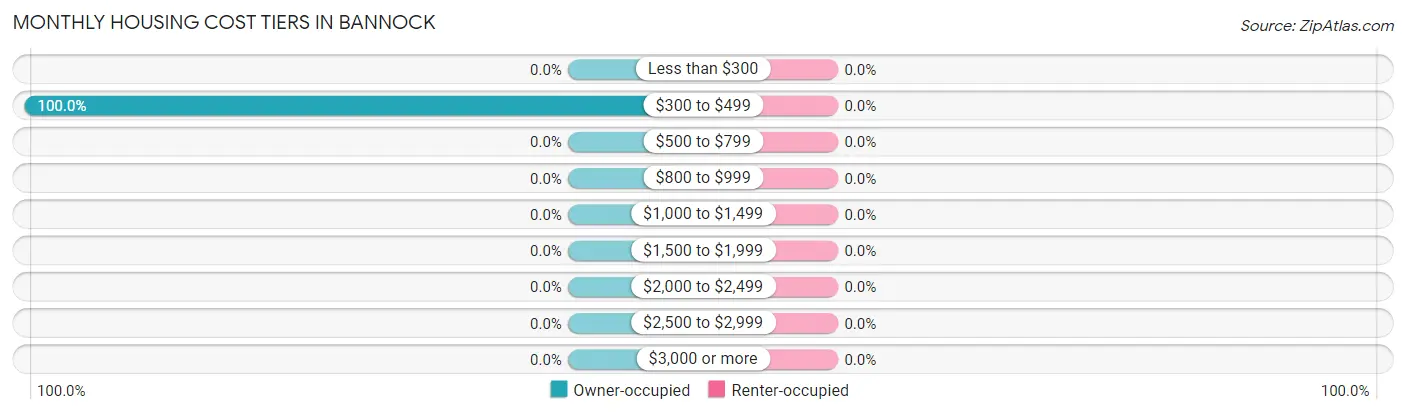
Monthly Housing Cost Tiers in Bannock
| Monthly Cost | Owner-occupied | Renter-occupied |
| Less than $300 | 0 (0.0%) | 0 (0.0%) |
| $300 to $499 | 120 (100.0%) | 0 (0.0%) |
| $500 to $799 | 0 (0.0%) | 0 (0.0%) |
| $800 to $999 | 0 (0.0%) | 0 (0.0%) |
| $1,000 to $1,499 | 0 (0.0%) | 0 (0.0%) |
| $1,500 to $1,999 | 0 (0.0%) | 0 (0.0%) |
| $2,000 to $2,499 | 0 (0.0%) | 0 (0.0%) |
| $2,500 to $2,999 | 0 (0.0%) | 0 (0.0%) |
| $3,000 or more | 0 (0.0%) | 0 (0.0%) |
| Total | 120 (100.0%) | 17 (100.0%) |
Physical Housing Characteristics in Bannock
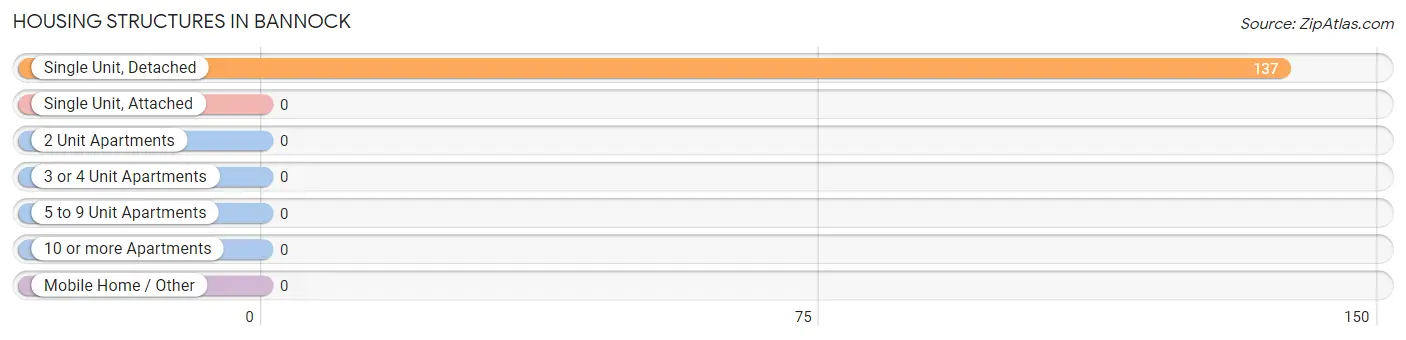
Housing Structures in Bannock
| Structure Type | # Housing Units | % Housing Units |
| Single Unit, Detached | 137 | 100.0% |
| Single Unit, Attached | 0 | 0.0% |
| 2 Unit Apartments | 0 | 0.0% |
| 3 or 4 Unit Apartments | 0 | 0.0% |
| 5 to 9 Unit Apartments | 0 | 0.0% |
| 10 or more Apartments | 0 | 0.0% |
| Mobile Home / Other | 0 | 0.0% |
| Total | 137 | 100.0% |
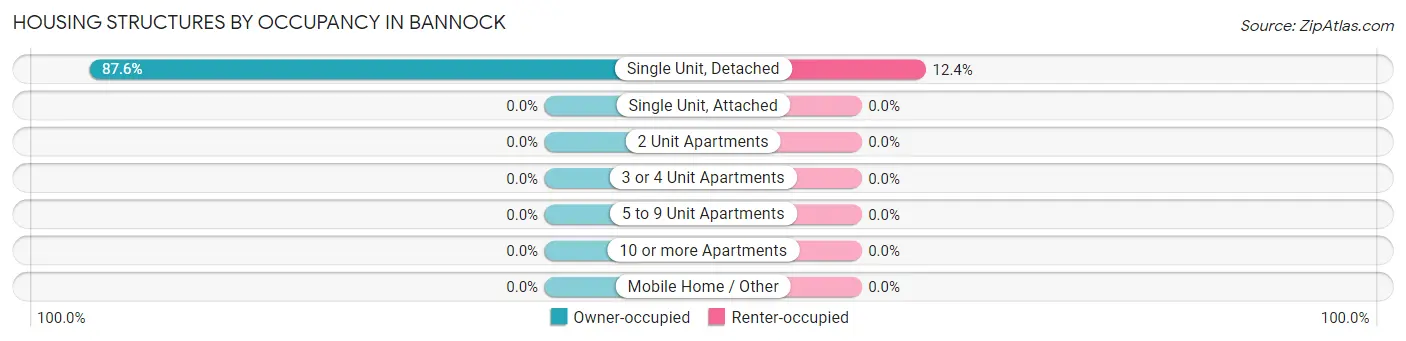
Housing Structures by Occupancy in Bannock
| Structure Type | Owner-occupied | Renter-occupied |
| Single Unit, Detached | 120 (87.6%) | 17 (12.4%) |
| Single Unit, Attached | 0 (0.0%) | 0 (0.0%) |
| 2 Unit Apartments | 0 (0.0%) | 0 (0.0%) |
| 3 or 4 Unit Apartments | 0 (0.0%) | 0 (0.0%) |
| 5 to 9 Unit Apartments | 0 (0.0%) | 0 (0.0%) |
| 10 or more Apartments | 0 (0.0%) | 0 (0.0%) |
| Mobile Home / Other | 0 (0.0%) | 0 (0.0%) |
| Total | 120 (87.6%) | 17 (12.4%) |
Housing Structures by Number of Rooms in Bannock
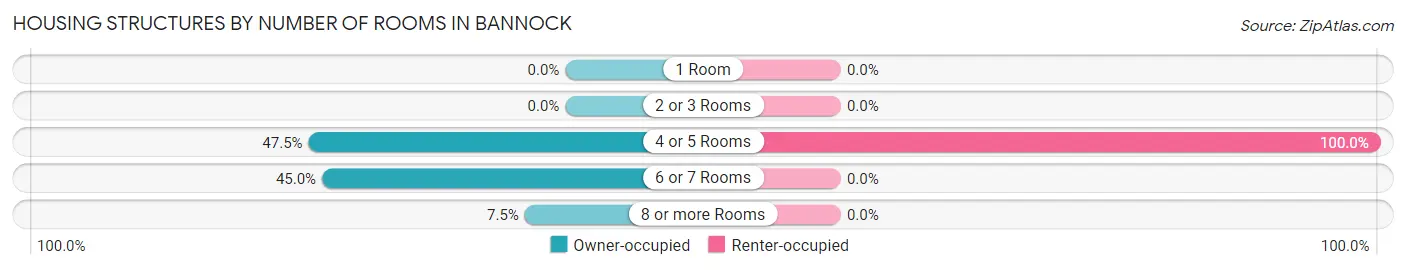
| Number of Rooms | Owner-occupied | Renter-occupied |
| 1 Room | 0 (0.0%) | 0 (0.0%) |
| 2 or 3 Rooms | 0 (0.0%) | 0 (0.0%) |
| 4 or 5 Rooms | 57 (47.5%) | 17 (100.0%) |
| 6 or 7 Rooms | 54 (45.0%) | 0 (0.0%) |
| 8 or more Rooms | 9 (7.5%) | 0 (0.0%) |
| Total | 120 (100.0%) | 17 (100.0%) |
Housing Structure by Heating Type in Bannock
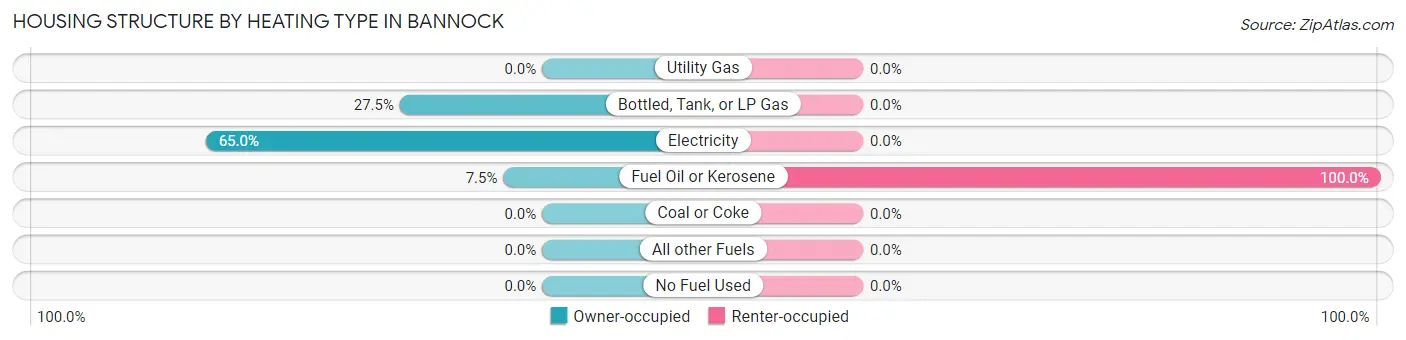
| Heating Type | Owner-occupied | Renter-occupied |
| Utility Gas | 0 (0.0%) | 0 (0.0%) |
| Bottled, Tank, or LP Gas | 33 (27.5%) | 0 (0.0%) |
| Electricity | 78 (65.0%) | 0 (0.0%) |
| Fuel Oil or Kerosene | 9 (7.5%) | 17 (100.0%) |
| Coal or Coke | 0 (0.0%) | 0 (0.0%) |
| All other Fuels | 0 (0.0%) | 0 (0.0%) |
| No Fuel Used | 0 (0.0%) | 0 (0.0%) |
| Total | 120 (100.0%) | 17 (100.0%) |
Household Vehicle Usage in Bannock
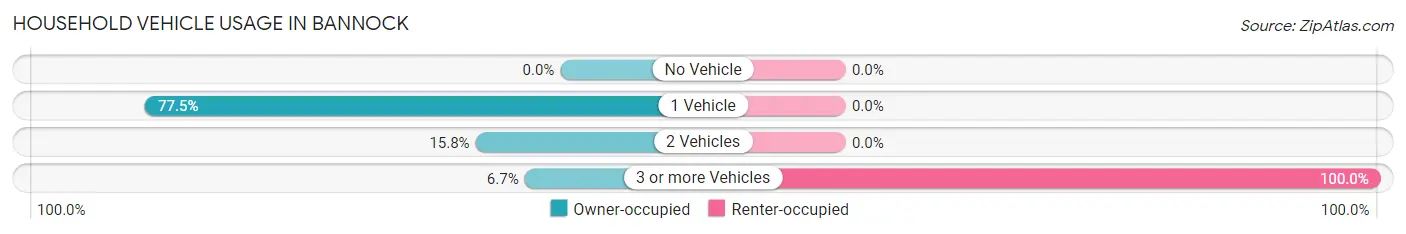
| Vehicles per Household | Owner-occupied | Renter-occupied |
| No Vehicle | 0 (0.0%) | 0 (0.0%) |
| 1 Vehicle | 93 (77.5%) | 0 (0.0%) |
| 2 Vehicles | 19 (15.8%) | 0 (0.0%) |
| 3 or more Vehicles | 8 (6.7%) | 17 (100.0%) |
| Total | 120 (100.0%) | 17 (100.0%) |
Real Estate & Mortgages in Bannock
Real Estate and Mortgage Overview in Bannock
| Characteristic | Without Mortgage | With Mortgage |
| Housing Units | 120 | 0 |
| Median Property Value | $100,000 | $0 |
| Median Household Income | - | - |
| Monthly Housing Costs | $338 | $0 |
| Real Estate Taxes | $2,310 | $0 |
Property Value by Mortgage Status in Bannock
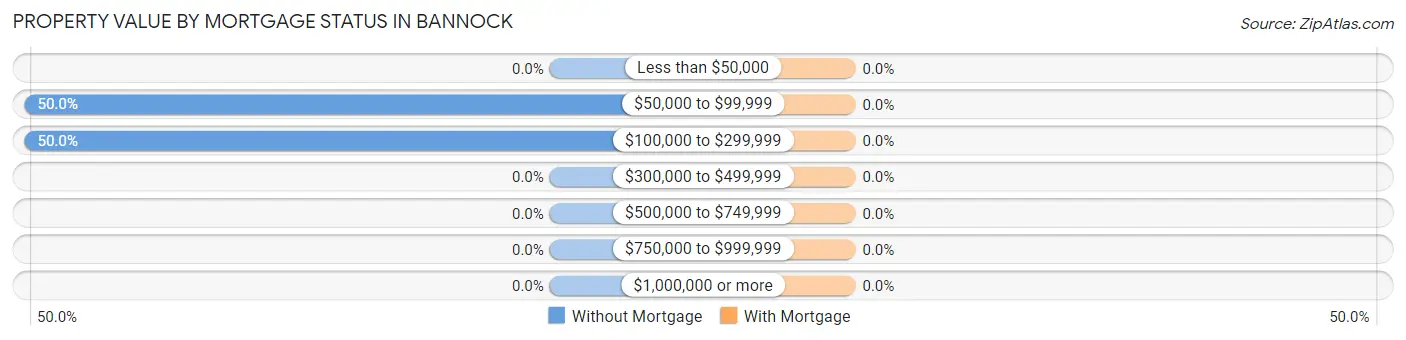
| Property Value | Without Mortgage | With Mortgage |
| Less than $50,000 | 0 (0.0%) | 0 (0.0%) |
| $50,000 to $99,999 | 60 (50.0%) | 0 (0.0%) |
| $100,000 to $299,999 | 60 (50.0%) | 0 (0.0%) |
| $300,000 to $499,999 | 0 (0.0%) | 0 (0.0%) |
| $500,000 to $749,999 | 0 (0.0%) | 0 (0.0%) |
| $750,000 to $999,999 | 0 (0.0%) | 0 (0.0%) |
| $1,000,000 or more | 0 (0.0%) | 0 (0.0%) |
| Total | 120 (100.0%) | 0 (0.0%) |
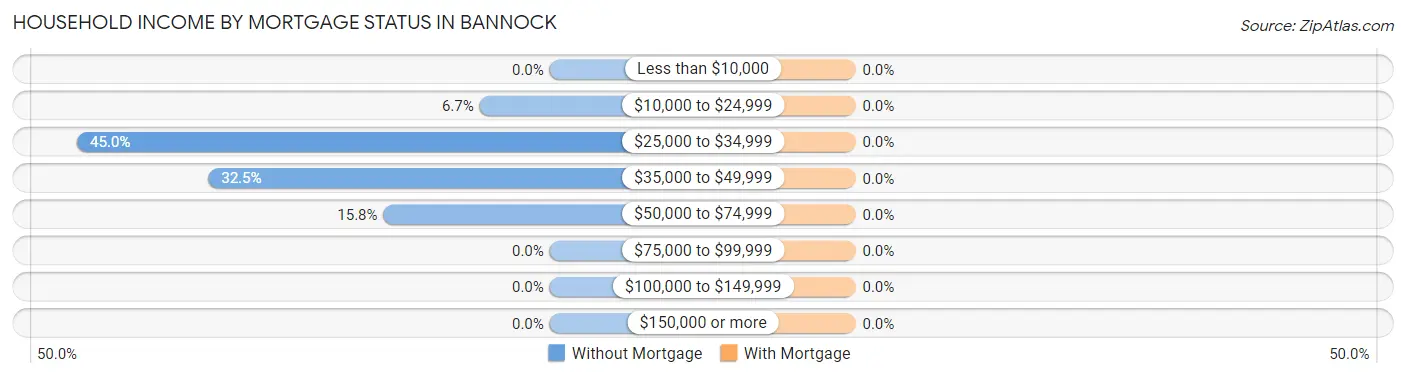
Household Income by Mortgage Status in Bannock
| Household Income | Without Mortgage | With Mortgage |
| Less than $10,000 | 0 (0.0%) | 0 (0.0%) |
| $10,000 to $24,999 | 8 (6.7%) | 0 (0.0%) |
| $25,000 to $34,999 | 54 (45.0%) | 0 (0.0%) |
| $35,000 to $49,999 | 39 (32.5%) | 0 (0.0%) |
| $50,000 to $74,999 | 19 (15.8%) | 0 (0.0%) |
| $75,000 to $99,999 | 0 (0.0%) | 0 (0.0%) |
| $100,000 to $149,999 | 0 (0.0%) | 0 (0.0%) |
| $150,000 or more | 0 (0.0%) | 0 (0.0%) |
| Total | 120 (100.0%) | 0 (0.0%) |
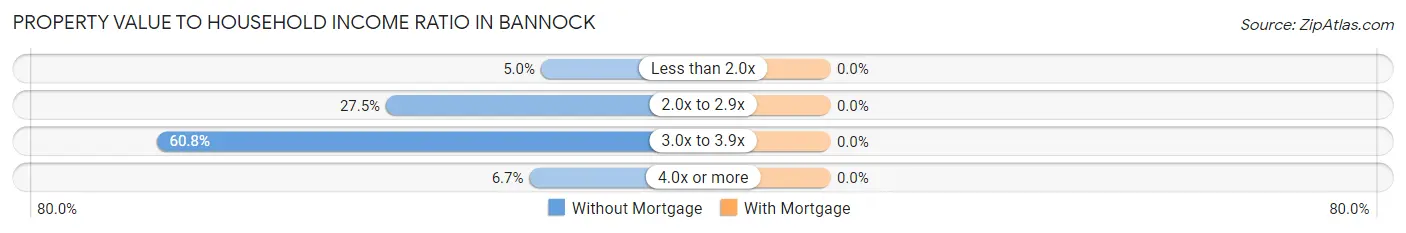
Property Value to Household Income Ratio in Bannock
| Value-to-Income Ratio | Without Mortgage | With Mortgage |
| Less than 2.0x | 6 (5.0%) | 0 (0.0%) |
| 2.0x to 2.9x | 33 (27.5%) | 0 (0.0%) |
| 3.0x to 3.9x | 73 (60.8%) | 0 (0.0%) |
| 4.0x or more | 8 (6.7%) | 0 (0.0%) |
| Total | 120 (100.0%) | 0 (0.0%) |
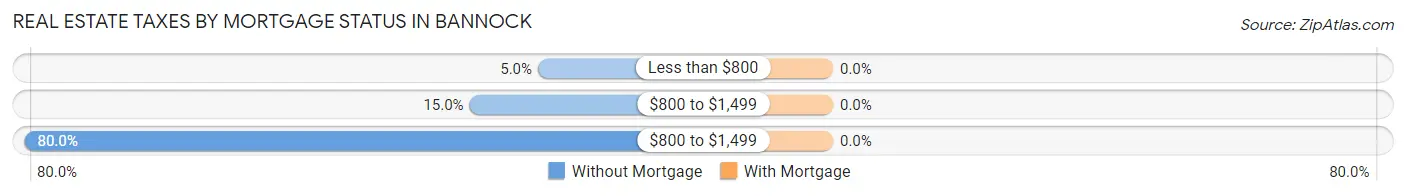
Real Estate Taxes by Mortgage Status in Bannock
| Property Taxes | Without Mortgage | With Mortgage |
| Less than $800 | 6 (5.0%) | 0 (0.0%) |
| $800 to $1,499 | 18 (15.0%) | 0 (0.0%) |
| $800 to $1,499 | 96 (80.0%) | 0 (0.0%) |
| Total | 120 (100.0%) | 0 (0.0%) |
Health & Disability in Bannock
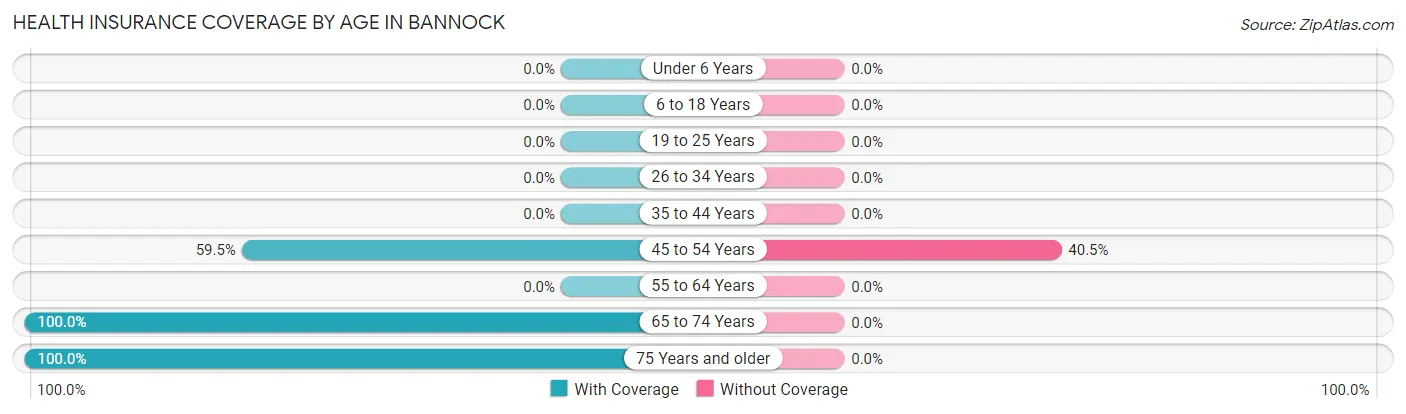
Health Insurance Coverage by Age in Bannock
| Age Bracket | With Coverage | Without Coverage |
| Under 6 Years | 0 (0.0%) | 0 (0.0%) |
| 6 to 18 Years | 0 (0.0%) | 0 (0.0%) |
| 19 to 25 Years | 0 (0.0%) | 0 (0.0%) |
| 26 to 34 Years | 0 (0.0%) | 0 (0.0%) |
| 35 to 44 Years | 0 (0.0%) | 0 (0.0%) |
| 45 to 54 Years | 50 (59.5%) | 34 (40.5%) |
| 55 to 64 Years | 0 (0.0%) | 0 (0.0%) |
| 65 to 74 Years | 47 (100.0%) | 0 (0.0%) |
| 75 Years and older | 60 (100.0%) | 0 (0.0%) |
| Total | 157 (82.2%) | 34 (17.8%) |
Health Insurance Coverage by Citizenship Status in Bannock
| Citizenship Status | With Coverage | Without Coverage |
| Native Born | 0 (0.0%) | 0 (0.0%) |
| Foreign Born, Citizen | 0 (0.0%) | 0 (0.0%) |
| Foreign Born, not a Citizen | 0 (0.0%) | 0 (0.0%) |
Health Insurance Coverage by Household Income in Bannock
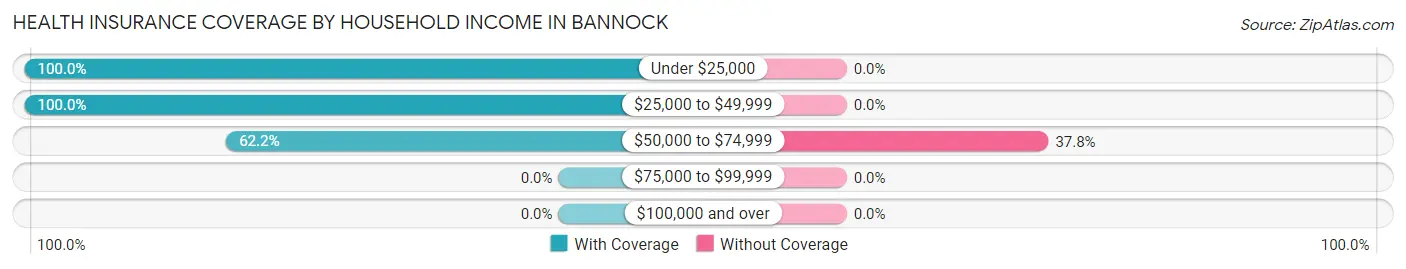
| Household Income | With Coverage | Without Coverage |
| Under $25,000 | 8 (100.0%) | 0 (0.0%) |
| $25,000 to $49,999 | 93 (100.0%) | 0 (0.0%) |
| $50,000 to $74,999 | 56 (62.2%) | 34 (37.8%) |
| $75,000 to $99,999 | 0 (0.0%) | 0 (0.0%) |
| $100,000 and over | 0 (0.0%) | 0 (0.0%) |
Public vs Private Health Insurance Coverage by Age in Bannock
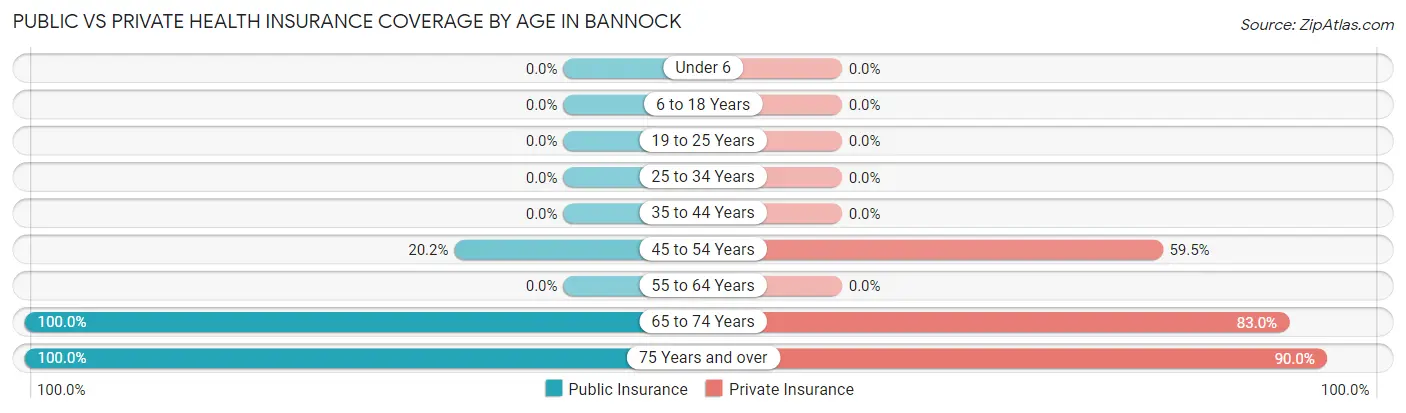
| Age Bracket | Public Insurance | Private Insurance |
| Under 6 | 0 (0.0%) | 0 (0.0%) |
| 6 to 18 Years | 0 (0.0%) | 0 (0.0%) |
| 19 to 25 Years | 0 (0.0%) | 0 (0.0%) |
| 25 to 34 Years | 0 (0.0%) | 0 (0.0%) |
| 35 to 44 Years | 0 (0.0%) | 0 (0.0%) |
| 45 to 54 Years | 17 (20.2%) | 50 (59.5%) |
| 55 to 64 Years | 0 (0.0%) | 0 (0.0%) |
| 65 to 74 Years | 47 (100.0%) | 39 (83.0%) |
| 75 Years and over | 60 (100.0%) | 54 (90.0%) |
| Total | 124 (64.9%) | 143 (74.9%) |
Disability Status by Sex by Age in Bannock
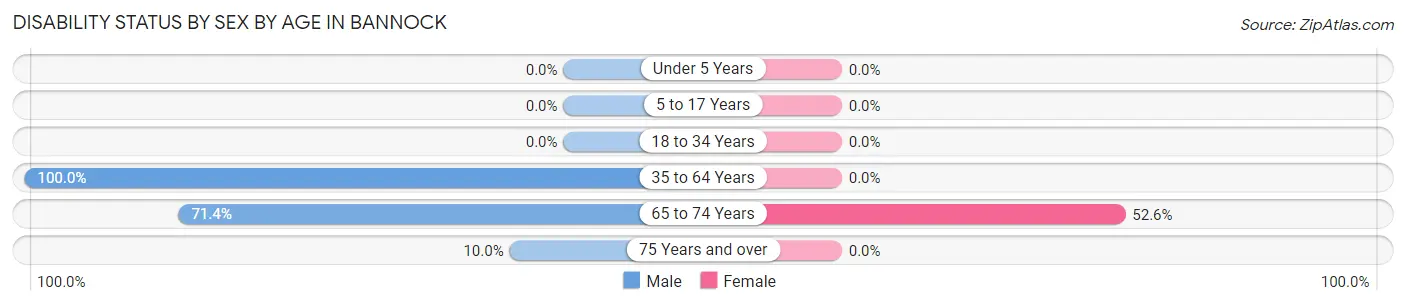
| Age Bracket | Male | Female |
| Under 5 Years | 0 (0.0%) | 0 (0.0%) |
| 5 to 17 Years | 0 (0.0%) | 0 (0.0%) |
| 18 to 34 Years | 0 (0.0%) | 0 (0.0%) |
| 35 to 64 Years | 17 (100.0%) | 0 (0.0%) |
| 65 to 74 Years | 20 (71.4%) | 10 (52.6%) |
| 75 Years and over | 6 (10.0%) | 0 (0.0%) |
Disability Class by Sex by Age in Bannock
Disability Class: Hearing Difficulty
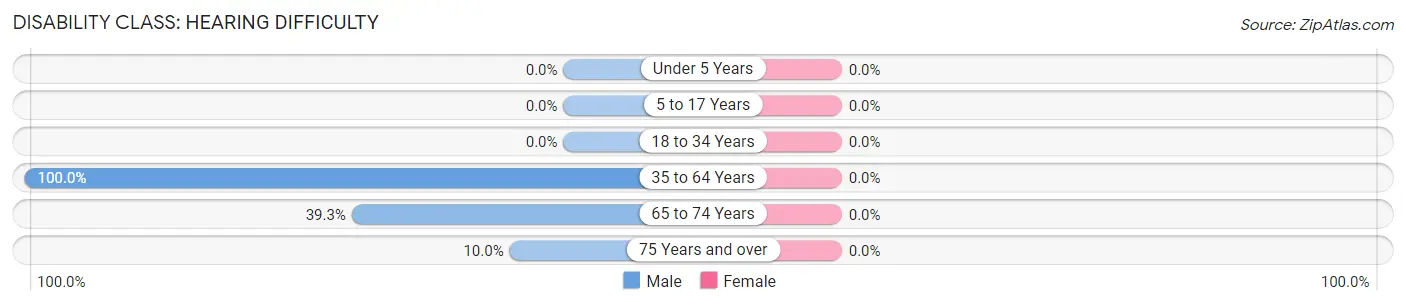
| Age Bracket | Male | Female |
| Under 5 Years | 0 (0.0%) | 0 (0.0%) |
| 5 to 17 Years | 0 (0.0%) | 0 (0.0%) |
| 18 to 34 Years | 0 (0.0%) | 0 (0.0%) |
| 35 to 64 Years | 17 (100.0%) | 0 (0.0%) |
| 65 to 74 Years | 11 (39.3%) | 0 (0.0%) |
| 75 Years and over | 6 (10.0%) | 0 (0.0%) |
Disability Class: Vision Difficulty
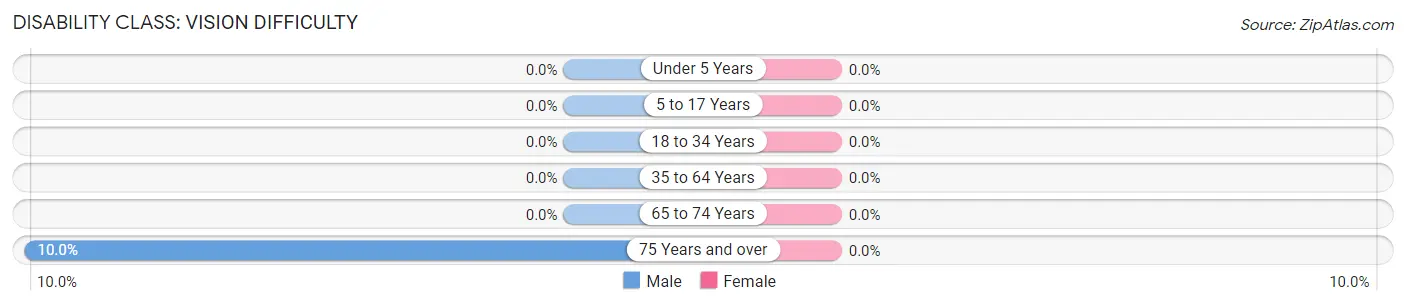
| Age Bracket | Male | Female |
| Under 5 Years | 0 (0.0%) | 0 (0.0%) |
| 5 to 17 Years | 0 (0.0%) | 0 (0.0%) |
| 18 to 34 Years | 0 (0.0%) | 0 (0.0%) |
| 35 to 64 Years | 0 (0.0%) | 0 (0.0%) |
| 65 to 74 Years | 0 (0.0%) | 0 (0.0%) |
| 75 Years and over | 6 (10.0%) | 0 (0.0%) |
Disability Class: Cognitive Difficulty
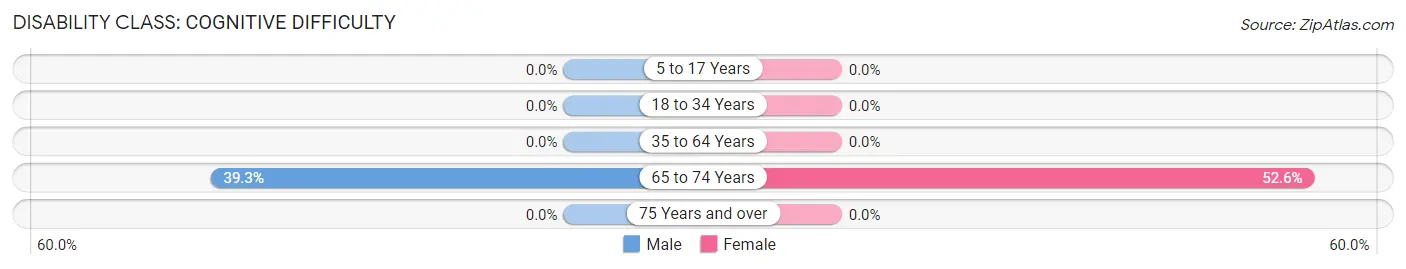
| Age Bracket | Male | Female |
| 5 to 17 Years | 0 (0.0%) | 0 (0.0%) |
| 18 to 34 Years | 0 (0.0%) | 0 (0.0%) |
| 35 to 64 Years | 0 (0.0%) | 0 (0.0%) |
| 65 to 74 Years | 11 (39.3%) | 10 (52.6%) |
| 75 Years and over | 0 (0.0%) | 0 (0.0%) |
Disability Class: Ambulatory Difficulty
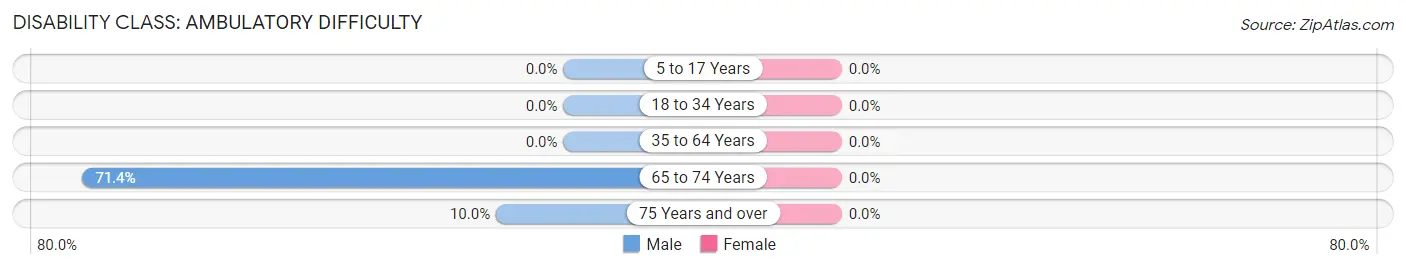
| Age Bracket | Male | Female |
| 5 to 17 Years | 0 (0.0%) | 0 (0.0%) |
| 18 to 34 Years | 0 (0.0%) | 0 (0.0%) |
| 35 to 64 Years | 0 (0.0%) | 0 (0.0%) |
| 65 to 74 Years | 20 (71.4%) | 0 (0.0%) |
| 75 Years and over | 6 (10.0%) | 0 (0.0%) |
Disability Class: Self-Care Difficulty
| Age Bracket | Male | Female |
| 5 to 17 Years | 0 (0.0%) | 0 (0.0%) |
| 18 to 34 Years | 0 (0.0%) | 0 (0.0%) |
| 35 to 64 Years | 0 (0.0%) | 0 (0.0%) |
| 65 to 74 Years | 0 (0.0%) | 0 (0.0%) |
| 75 Years and over | 0 (0.0%) | 0 (0.0%) |
Technology Access in Bannock
Computing Device Access in Bannock
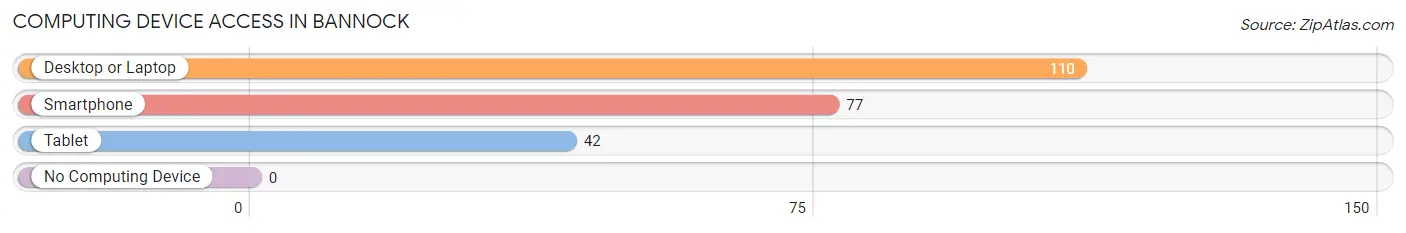
| Device Type | # Households | % Households |
| Desktop or Laptop | 110 | 80.3% |
| Smartphone | 77 | 56.2% |
| Tablet | 42 | 30.7% |
| No Computing Device | 0 | 0.0% |
| Total | 137 | 100.0% |
Internet Access in Bannock
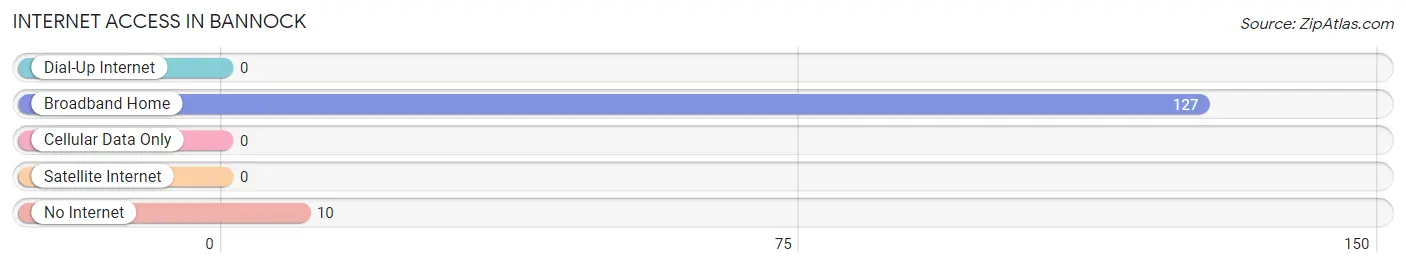
| Internet Type | # Households | % Households |
| Dial-Up Internet | 0 | 0.0% |
| Broadband Home | 127 | 92.7% |
| Cellular Data Only | 0 | 0.0% |
| Satellite Internet | 0 | 0.0% |
| No Internet | 10 | 7.3% |
| Total | 137 | 100.0% |
Bannock Summary
Bannock is a small village located in the southeastern corner of Pike County, Ohio. It is situated on the banks of the Scioto River, approximately 25 miles south of Columbus. The village was founded in 1817 and has a population of approximately 500 people.
History
Bannock was founded in 1817 by a group of settlers from Pennsylvania. The village was named after the Bannock Indians, who were a Native American tribe that lived in the area. The settlers built a grist mill and a saw mill on the banks of the Scioto River, which provided the village with its first industry. The village grew slowly over the years, and by the mid-1800s, it had become a thriving community.
In the late 1800s, the village was home to several businesses, including a general store, a blacksmith shop, a hotel, and a post office. The village also had a school, which was built in 1876. The school was later replaced by a larger building in the early 1900s.
In the early 1900s, the village was home to several factories, including a furniture factory, a canning factory, and a brickyard. These factories provided employment for many of the village's residents.
Geography
Bannock is located in the southeastern corner of Pike County, Ohio. It is situated on the banks of the Scioto River, approximately 25 miles south of Columbus. The village is surrounded by rolling hills and farmland. The climate in the area is generally mild, with temperatures ranging from the low 30s in the winter to the mid-80s in the summer.
Economy
The economy of Bannock is largely based on agriculture. The village is home to several farms, which produce a variety of crops, including corn, soybeans, and wheat. The village also has several small businesses, including a general store, a hardware store, and a restaurant.
Demographics
As of the 2010 census, the population of Bannock was 498. The racial makeup of the village was 97.2% White, 0.6% African American, 0.2% Native American, 0.2% Asian, 0.2% from other races, and 1.8% from two or more races. The median household income was $41,250, and the median family income was $50,000.
Conclusion
Bannock is a small village located in the southeastern corner of Pike County, Ohio. It was founded in 1817 and has a population of approximately 500 people. The village is largely agricultural, with several farms producing a variety of crops. The village also has several small businesses, including a general store, a hardware store, and a restaurant. The population of Bannock is 97.2% White, 0.6% African American, 0.2% Native American, 0.2% Asian, 0.2% from other races, and 1.8% from two or more races. The median household income was $41,250, and the median family income was $50,000.
Common Questions
What is the Total Population of Bannock?
Total Population of Bannock is 191.
What is the Total Male Population of Bannock?
Total Male Population of Bannock is 105.
What is the Total Female Population of Bannock?
Total Female Population of Bannock is 86.
What is the Ratio of Males per 100 Females in Bannock?
There are 122.09 Males per 100 Females in Bannock.
What is the Ratio of Females per 100 Males in Bannock?
There are 81.90 Females per 100 Males in Bannock.
What is the Median Population Age in Bannock?
Median Population Age in Bannock is 69.1 Years.
What is the Average Family Size in Bannock
Average Family Size in Bannock is 2.0 People.
What is the Average Household Size in Bannock
Average Household Size in Bannock is 1.4 People.
What is Per Capita Income in Bannock?
Per Capita income in Bannock is $29,345.
What is the Median Household income in Bannock?
Median Household Income in Bannock is $47,538.
What is Inequality or Gini Index in Bannock?
Inequality or Gini Index in Bannock is 0.18.
How Large is the Labor Force in Bannock?
There are 50 People in the Labor Forcein in Bannock.
What is the Percentage of People in the Labor Force in Bannock?
26.2% of People are in the Labor Force in Bannock.