Yorkville, NY
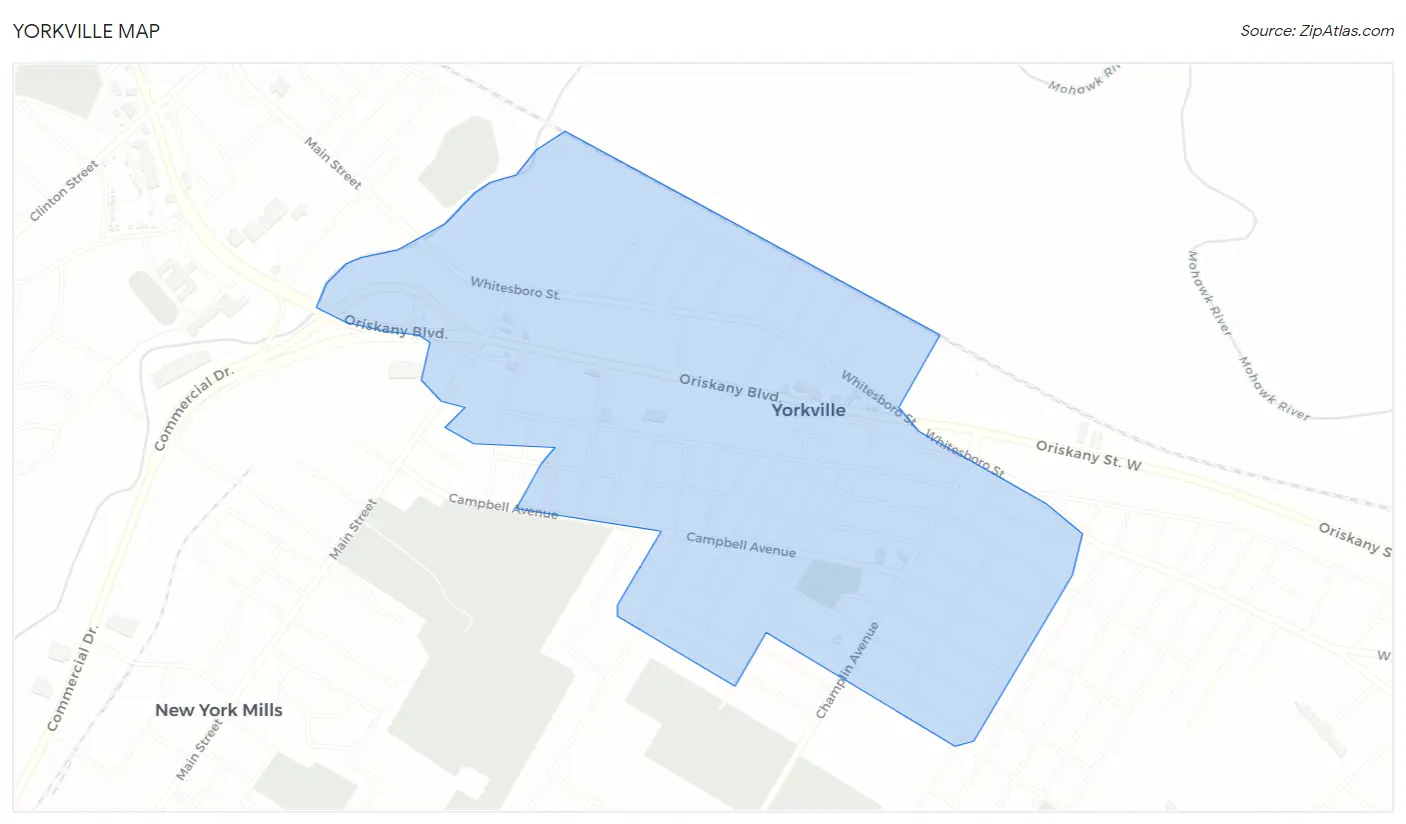
Yorkville Map
Yorkville Overview
2,635
TOTAL POPULATION
1,436
MALE POPULATION
1,199
FEMALE POPULATION
119.77
MALES / 100 FEMALES
83.50
FEMALES / 100 MALES
36.2
MEDIAN AGE
2.9
AVG FAMILY SIZE
2.2
AVG HOUSEHOLD SIZE
$32,337
PER CAPITA INCOME
$62,432
AVG FAMILY INCOME
$58,414
AVG HOUSEHOLD INCOME
9.0%
WAGE / INCOME GAP [ % ]
91.0¢/ $1
WAGE / INCOME GAP [ $ ]
0.35
INEQUALITY / GINI INDEX
1,468
LABOR FORCE [ PEOPLE ]
69.1%
PERCENT IN LABOR FORCE
5.5%
UNEMPLOYMENT RATE
Yorkville Zip Codes
Yorkville Area Codes
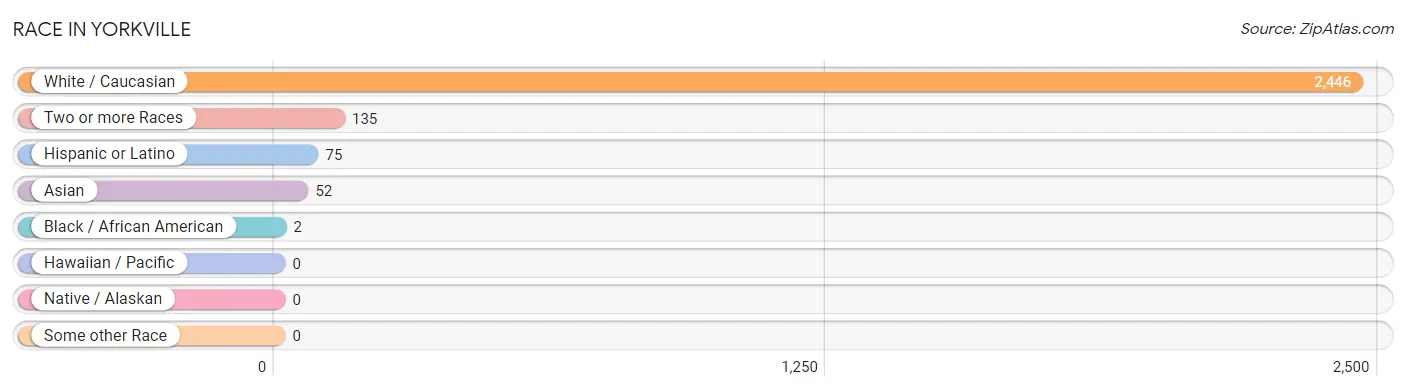
Race in Yorkville
The most populous races in Yorkville are White / Caucasian (2,446 | 92.8%), Two or more Races (135 | 5.1%), and Hispanic or Latino (75 | 2.9%).
| Race | # Population | % Population |
| Asian | 52 | 2.0% |
| Black / African American | 2 | 0.1% |
| Hawaiian / Pacific | 0 | 0.0% |
| Hispanic or Latino | 75 | 2.9% |
| Native / Alaskan | 0 | 0.0% |
| White / Caucasian | 2,446 | 92.8% |
| Two or more Races | 135 | 5.1% |
| Some other Race | 0 | 0.0% |
| Total | 2,635 | 100.0% |
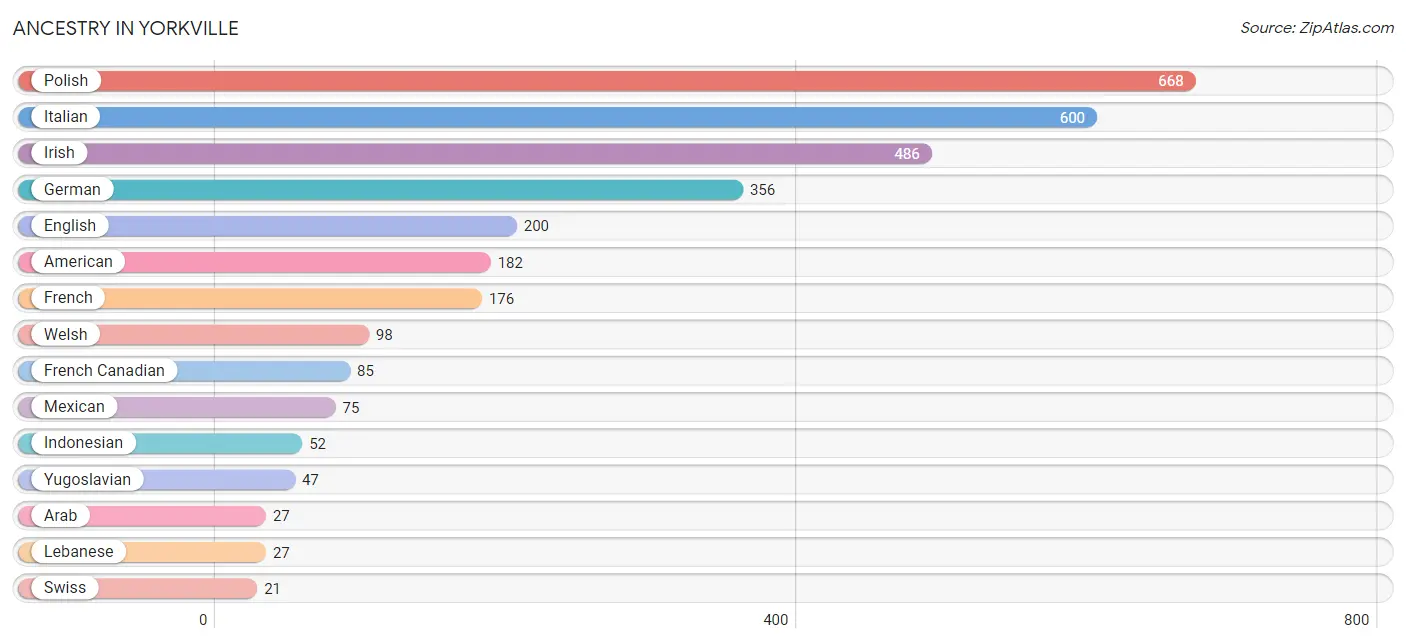
Ancestry in Yorkville
The most populous ancestries reported in Yorkville are Polish (668 | 25.4%), Italian (600 | 22.8%), Irish (486 | 18.4%), German (356 | 13.5%), and English (200 | 7.6%), together accounting for 87.7% of all Yorkville residents.
| Ancestry | # Population | % Population |
| American | 182 | 6.9% |
| Arab | 27 | 1.0% |
| Austrian | 9 | 0.3% |
| Crow | 5 | 0.2% |
| English | 200 | 7.6% |
| French | 176 | 6.7% |
| French Canadian | 85 | 3.2% |
| German | 356 | 13.5% |
| Indonesian | 52 | 2.0% |
| Irish | 486 | 18.4% |
| Italian | 600 | 22.8% |
| Lebanese | 27 | 1.0% |
| Mexican | 75 | 2.9% |
| Polish | 668 | 25.4% |
| Swiss | 21 | 0.8% |
| Ukrainian | 6 | 0.2% |
| Welsh | 98 | 3.7% |
| Yugoslavian | 47 | 1.8% | View All 18 Rows |
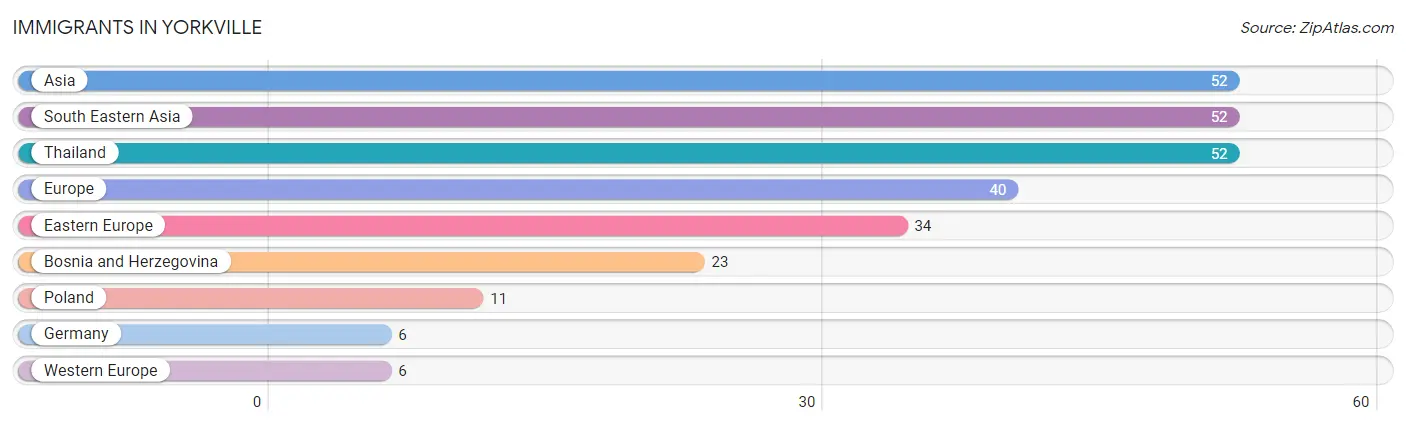
Immigrants in Yorkville
The most numerous immigrant groups reported in Yorkville came from Asia (52 | 2.0%), South Eastern Asia (52 | 2.0%), Thailand (52 | 2.0%), Europe (40 | 1.5%), and Eastern Europe (34 | 1.3%), together accounting for 8.7% of all Yorkville residents.
| Immigration Origin | # Population | % Population |
| Asia | 52 | 2.0% |
| Bosnia and Herzegovina | 23 | 0.9% |
| Eastern Europe | 34 | 1.3% |
| Europe | 40 | 1.5% |
| Germany | 6 | 0.2% |
| Poland | 11 | 0.4% |
| South Eastern Asia | 52 | 2.0% |
| Thailand | 52 | 2.0% |
| Western Europe | 6 | 0.2% | View All 9 Rows |
Sex and Age in Yorkville
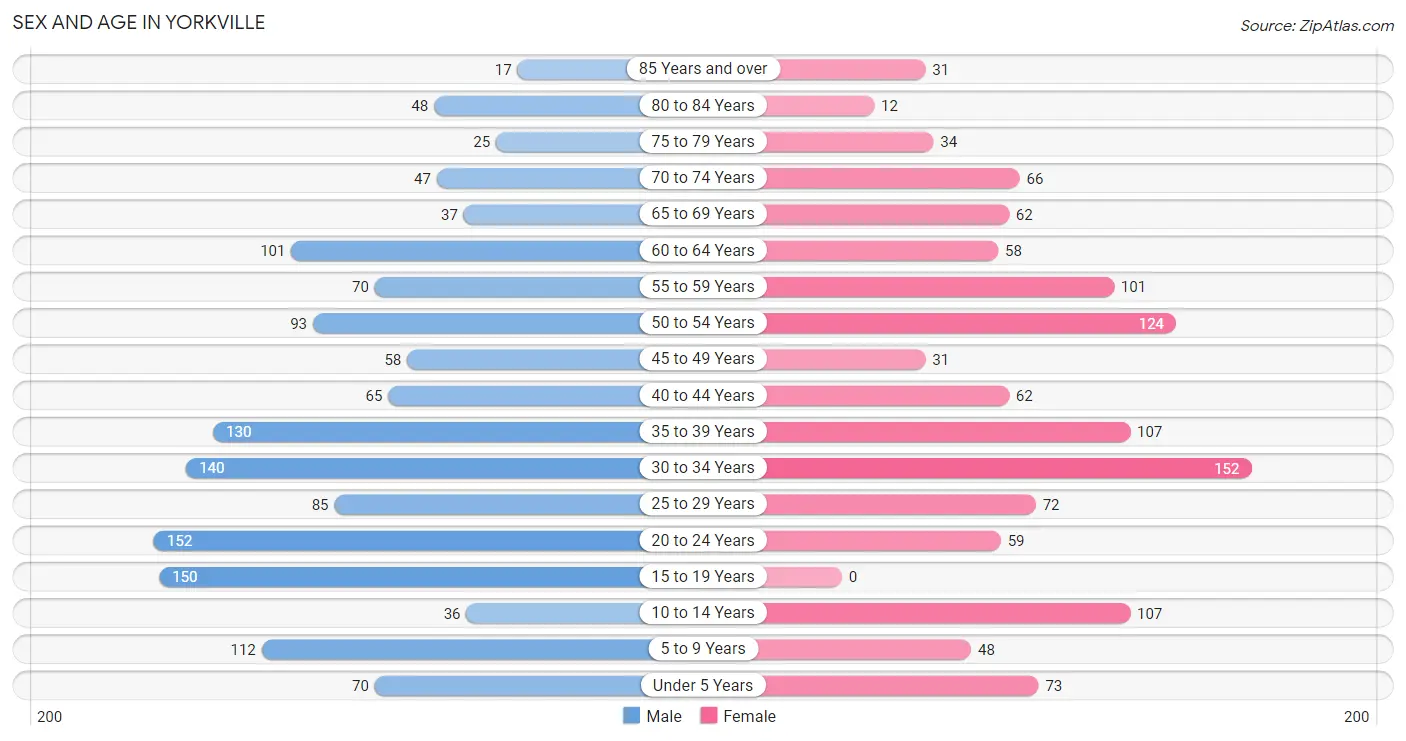
Sex and Age in Yorkville
The most populous age groups in Yorkville are 20 to 24 Years (152 | 10.6%) for men and 30 to 34 Years (152 | 12.7%) for women.
| Age Bracket | Male | Female |
| Under 5 Years | 70 (4.9%) | 73 (6.1%) |
| 5 to 9 Years | 112 (7.8%) | 48 (4.0%) |
| 10 to 14 Years | 36 (2.5%) | 107 (8.9%) |
| 15 to 19 Years | 150 (10.4%) | 0 (0.0%) |
| 20 to 24 Years | 152 (10.6%) | 59 (4.9%) |
| 25 to 29 Years | 85 (5.9%) | 72 (6.0%) |
| 30 to 34 Years | 140 (9.8%) | 152 (12.7%) |
| 35 to 39 Years | 130 (9.0%) | 107 (8.9%) |
| 40 to 44 Years | 65 (4.5%) | 62 (5.2%) |
| 45 to 49 Years | 58 (4.0%) | 31 (2.6%) |
| 50 to 54 Years | 93 (6.5%) | 124 (10.3%) |
| 55 to 59 Years | 70 (4.9%) | 101 (8.4%) |
| 60 to 64 Years | 101 (7.0%) | 58 (4.8%) |
| 65 to 69 Years | 37 (2.6%) | 62 (5.2%) |
| 70 to 74 Years | 47 (3.3%) | 66 (5.5%) |
| 75 to 79 Years | 25 (1.7%) | 34 (2.8%) |
| 80 to 84 Years | 48 (3.3%) | 12 (1.0%) |
| 85 Years and over | 17 (1.2%) | 31 (2.6%) |
| Total | 1,436 (100.0%) | 1,199 (100.0%) |
Families and Households in Yorkville
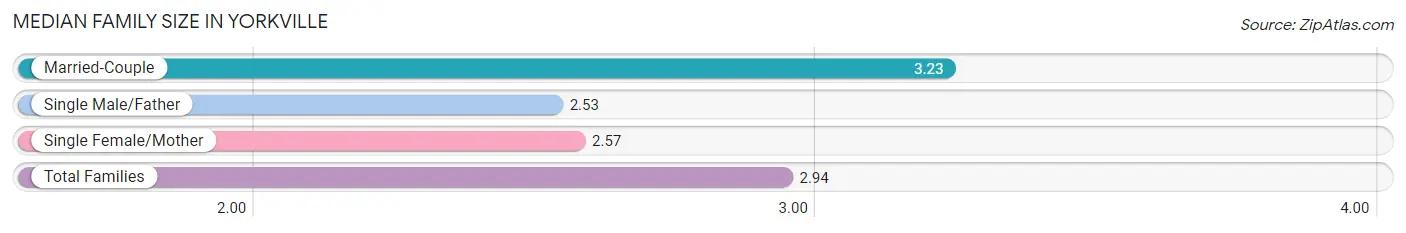
Median Family Size in Yorkville
The median family size in Yorkville is 2.94 persons per family, with married-couple families (375 | 55.8%) accounting for the largest median family size of 3.23 persons per family. On the other hand, single male/father families (88 | 13.1%) represent the smallest median family size with 2.53 persons per family.
| Family Type | # Families | Family Size |
| Married-Couple | 375 (55.8%) | 3.23 |
| Single Male/Father | 88 (13.1%) | 2.53 |
| Single Female/Mother | 209 (31.1%) | 2.57 |
| Total Families | 672 (100.0%) | 2.94 |
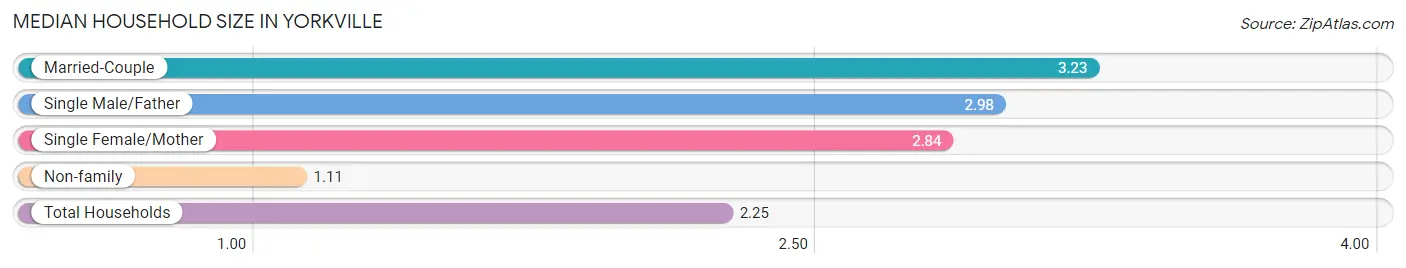
Median Household Size in Yorkville
The median household size in Yorkville is 2.25 persons per household, with married-couple households (375 | 32.2%) accounting for the largest median household size of 3.23 persons per household. non-family households (494 | 42.4%) represent the smallest median household size with 1.11 persons per household.
| Household Type | # Households | Household Size |
| Married-Couple | 375 (32.2%) | 3.23 |
| Single Male/Father | 88 (7.5%) | 2.98 |
| Single Female/Mother | 209 (17.9%) | 2.84 |
| Non-family | 494 (42.4%) | 1.11 |
| Total Households | 1,166 (100.0%) | 2.25 |
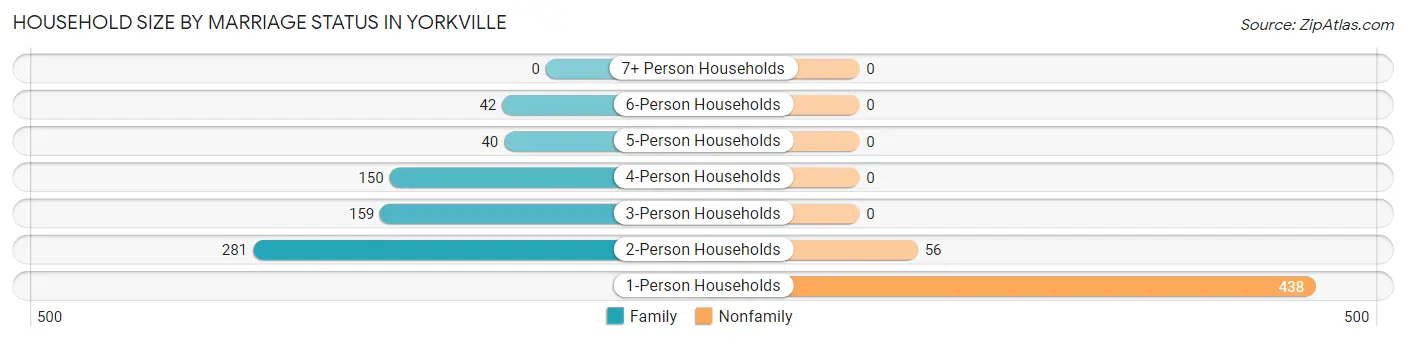
Household Size by Marriage Status in Yorkville
Out of a total of 1,166 households in Yorkville, 672 (57.6%) are family households, while 494 (42.4%) are nonfamily households. The most numerous type of family households are 2-person households, comprising 281, and the most common type of nonfamily households are 1-person households, comprising 438.
| Household Size | Family Households | Nonfamily Households |
| 1-Person Households | - | 438 (37.6%) |
| 2-Person Households | 281 (24.1%) | 56 (4.8%) |
| 3-Person Households | 159 (13.6%) | 0 (0.0%) |
| 4-Person Households | 150 (12.9%) | 0 (0.0%) |
| 5-Person Households | 40 (3.4%) | 0 (0.0%) |
| 6-Person Households | 42 (3.6%) | 0 (0.0%) |
| 7+ Person Households | 0 (0.0%) | 0 (0.0%) |
| Total | 672 (57.6%) | 494 (42.4%) |
Female Fertility in Yorkville
Fertility by Age in Yorkville
| Age Bracket | Women with Births | Births / 1,000 Women |
| 15 to 19 years | 0 (0.0%) | 0.0 |
| 20 to 34 years | 0 (0.0%) | 0.0 |
| 35 to 50 years | 0 (0.0%) | 0.0 |
| Total | 0 (0.0%) | 0.0 |
Fertility by Age by Marriage Status in Yorkville
| Age Bracket | Married | Unmarried |
| 15 to 19 years | 0 (0.0%) | 0 (0.0%) |
| 20 to 34 years | 0 (0.0%) | 0 (0.0%) |
| 35 to 50 years | 0 (0.0%) | 0 (0.0%) |
| Total | 0 (0.0%) | 0 (0.0%) |
Fertility by Education in Yorkville
| Educational Attainment | Women with Births | Births / 1,000 Women |
| Less than High School | 0 (0.0%) | 0.0 |
| High School Diploma | 0 (0.0%) | 0.0 |
| College or Associate's Degree | 0 (0.0%) | 0.0 |
| Bachelor's Degree | 0 (0.0%) | 0.0 |
| Graduate Degree | 0 (0.0%) | 0.0 |
| Total | 0 (0.0%) | 0.0 |
Fertility by Education by Marriage Status in Yorkville
| Educational Attainment | Married | Unmarried |
| Less than High School | 0 (0.0%) | 0 (0.0%) |
| High School Diploma | 0 (0.0%) | 0 (0.0%) |
| College or Associate's Degree | 0 (0.0%) | 0 (0.0%) |
| Bachelor's Degree | 0 (0.0%) | 0 (0.0%) |
| Graduate Degree | 0 (0.0%) | 0 (0.0%) |
| Total | 0 (0.0%) | 0 (0.0%) |
Income in Yorkville
Income Overview in Yorkville
Per Capita Income in Yorkville is $32,337, while median incomes of families and households are $62,432 and $58,414 respectively.
| Characteristic | Number | Measure |
| Per Capita Income | 2,635 | $32,337 |
| Median Family Income | 672 | $62,432 |
| Mean Family Income | 672 | $78,163 |
| Median Household Income | 1,166 | $58,414 |
| Mean Household Income | 1,166 | $71,850 |
| Income Deficit | 672 | $0 |
| Wage / Income Gap (%) | 2,635 | 8.97% |
| Wage / Income Gap ($) | 2,635 | 91.03¢ per $1 |
| Gini / Inequality Index | 2,635 | 0.35 |
Earnings by Sex in Yorkville
Average Earnings in Yorkville are $38,517, $37,083 for men and $40,739 for women, a difference of 9.0%.
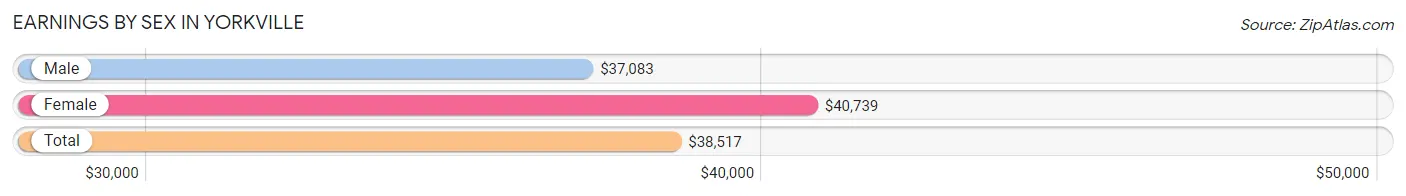
| Sex | Number | Average Earnings |
| Male | 853 (58.5%) | $37,083 |
| Female | 606 (41.5%) | $40,739 |
| Total | 1,459 (100.0%) | $38,517 |
Earnings by Sex by Income Bracket in Yorkville
The most common earnings brackets in Yorkville are $30,000 to $34,999 for men (139 | 16.3%) and $5,000 to $7,499 for women (88 | 14.5%).
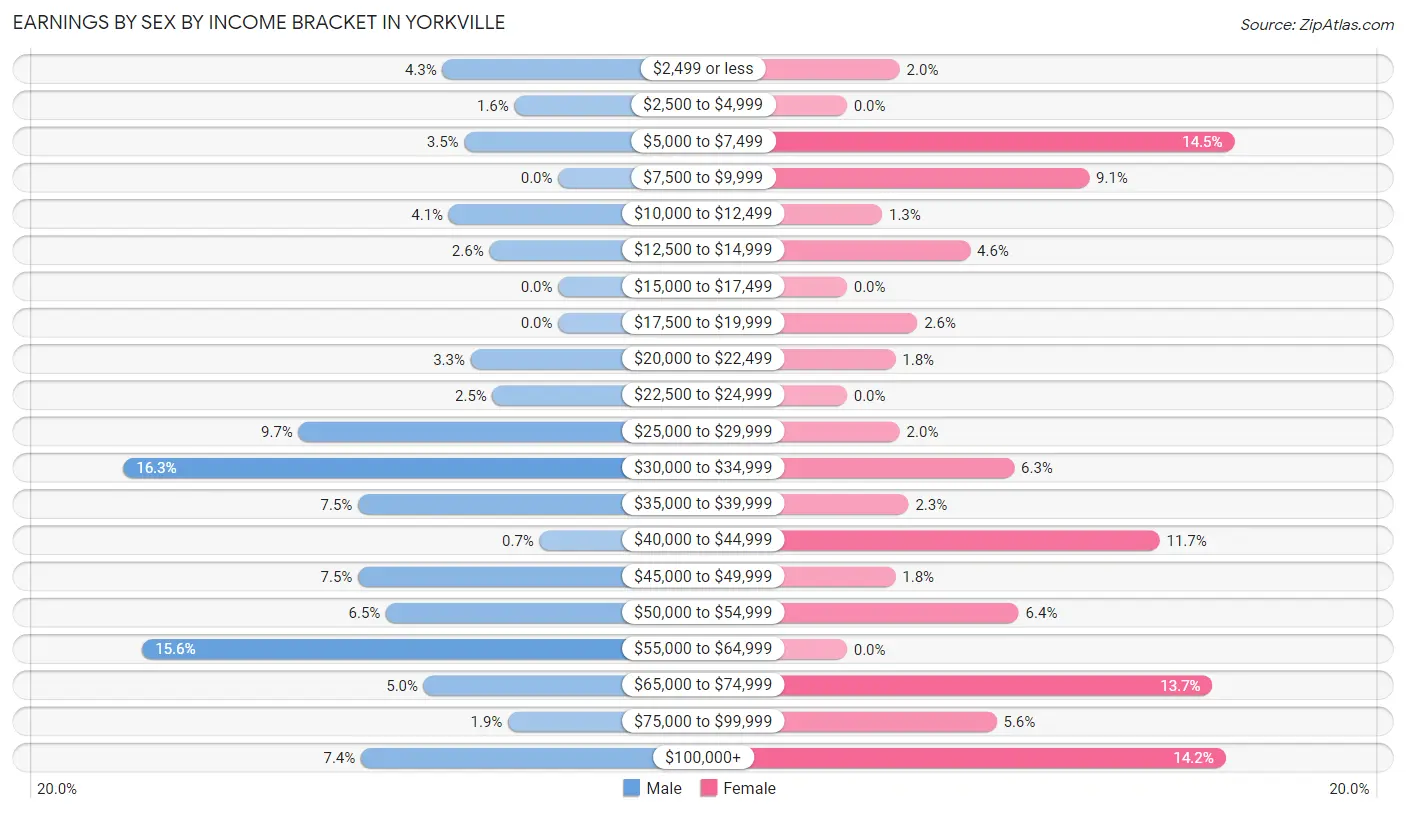
| Income | Male | Female |
| $2,499 or less | 37 (4.3%) | 12 (2.0%) |
| $2,500 to $4,999 | 14 (1.6%) | 0 (0.0%) |
| $5,000 to $7,499 | 30 (3.5%) | 88 (14.5%) |
| $7,500 to $9,999 | 0 (0.0%) | 55 (9.1%) |
| $10,000 to $12,499 | 35 (4.1%) | 8 (1.3%) |
| $12,500 to $14,999 | 22 (2.6%) | 28 (4.6%) |
| $15,000 to $17,499 | 0 (0.0%) | 0 (0.0%) |
| $17,500 to $19,999 | 0 (0.0%) | 16 (2.6%) |
| $20,000 to $22,499 | 28 (3.3%) | 11 (1.8%) |
| $22,500 to $24,999 | 21 (2.5%) | 0 (0.0%) |
| $25,000 to $29,999 | 83 (9.7%) | 12 (2.0%) |
| $30,000 to $34,999 | 139 (16.3%) | 38 (6.3%) |
| $35,000 to $39,999 | 64 (7.5%) | 14 (2.3%) |
| $40,000 to $44,999 | 6 (0.7%) | 71 (11.7%) |
| $45,000 to $49,999 | 64 (7.5%) | 11 (1.8%) |
| $50,000 to $54,999 | 55 (6.5%) | 39 (6.4%) |
| $55,000 to $64,999 | 133 (15.6%) | 0 (0.0%) |
| $65,000 to $74,999 | 43 (5.0%) | 83 (13.7%) |
| $75,000 to $99,999 | 16 (1.9%) | 34 (5.6%) |
| $100,000+ | 63 (7.4%) | 86 (14.2%) |
| Total | 853 (100.0%) | 606 (100.0%) |
Earnings by Sex by Educational Attainment in Yorkville
Average earnings in Yorkville are $39,914 for men and $41,144 for women, a difference of 3.0%. Men with an educational attainment of bachelor's degree enjoy the highest average annual earnings of $59,245, while those with college or associate's degree education earn the least with $33,545. Women with an educational attainment of graduate degree earn the most with the average annual earnings of $109,188, while those with high school diploma education have the smallest earnings of $13,080.
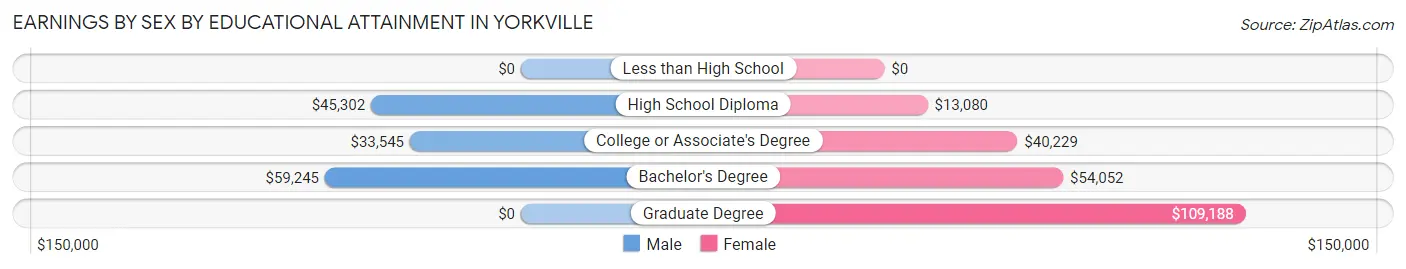
| Educational Attainment | Male Income | Female Income |
| Less than High School | - | - |
| High School Diploma | $45,302 | $13,080 |
| College or Associate's Degree | $33,545 | $40,229 |
| Bachelor's Degree | $59,245 | $54,052 |
| Graduate Degree | - | - |
| Total | $39,914 | $41,144 |
Family Income in Yorkville
Family Income Brackets in Yorkville
According to the Yorkville family income data, there are 201 families falling into the $100,000 to $149,999 income range, which is the most common income bracket and makes up 29.9% of all families.
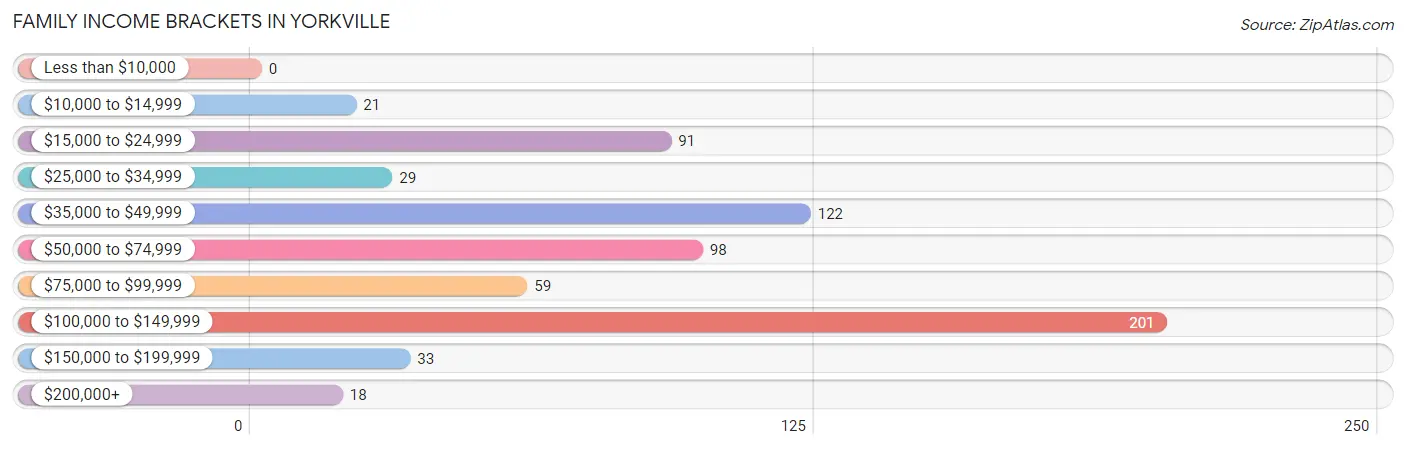
| Income Bracket | # Families | % Families |
| Less than $10,000 | 0 | 0.0% |
| $10,000 to $14,999 | 21 | 3.1% |
| $15,000 to $24,999 | 91 | 13.5% |
| $25,000 to $34,999 | 29 | 4.3% |
| $35,000 to $49,999 | 122 | 18.2% |
| $50,000 to $74,999 | 98 | 14.6% |
| $75,000 to $99,999 | 59 | 8.8% |
| $100,000 to $149,999 | 201 | 29.9% |
| $150,000 to $199,999 | 33 | 4.9% |
| $200,000+ | 18 | 2.7% |
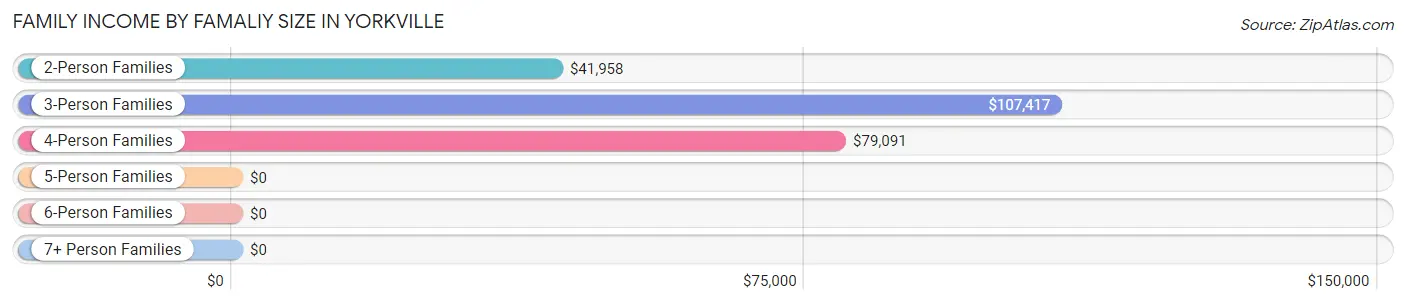
Family Income by Famaliy Size in Yorkville
3-person families (167 | 24.8%) account for the highest median family income in Yorkville with $107,417 per family, while 3-person families (167 | 24.8%) have the highest median income of $35,806 per family member.
| Income Bracket | # Families | Median Income |
| 2-Person Families | 291 (43.3%) | $41,958 |
| 3-Person Families | 167 (24.8%) | $107,417 |
| 4-Person Families | 132 (19.6%) | $79,091 |
| 5-Person Families | 82 (12.2%) | $0 |
| 6-Person Families | 0 (0.0%) | $0 |
| 7+ Person Families | 0 (0.0%) | $0 |
| Total | 672 (100.0%) | $62,432 |
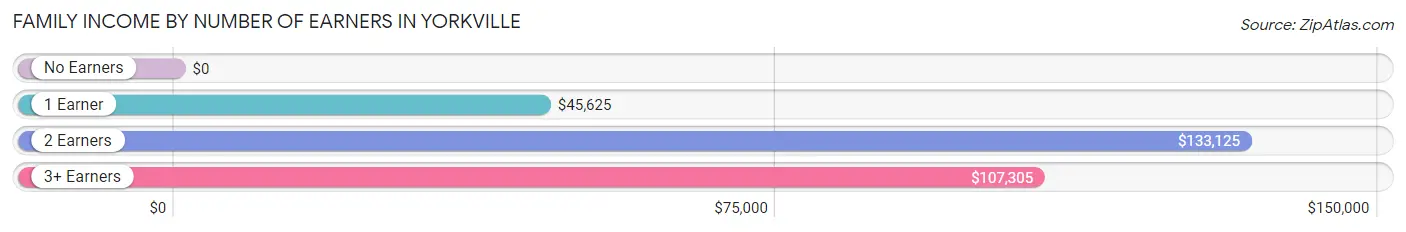
Family Income by Number of Earners in Yorkville
| Number of Earners | # Families | Median Income |
| No Earners | 132 (19.6%) | $0 |
| 1 Earner | 285 (42.4%) | $45,625 |
| 2 Earners | 152 (22.6%) | $133,125 |
| 3+ Earners | 103 (15.3%) | $107,305 |
| Total | 672 (100.0%) | $62,432 |
Household Income in Yorkville
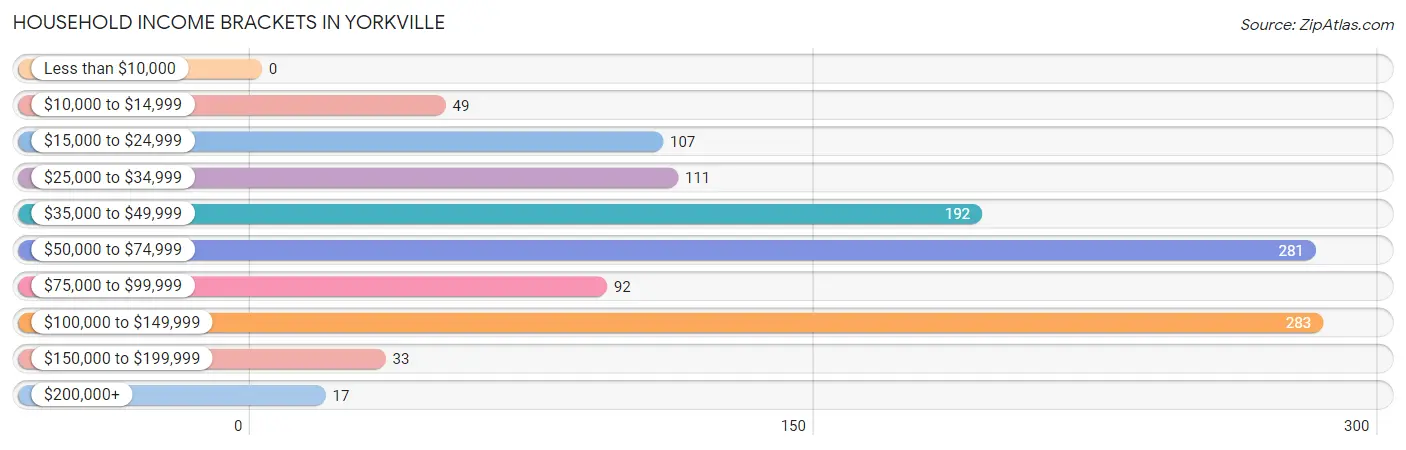
Household Income Brackets in Yorkville
With 283 households falling in the category, the $100,000 to $149,999 income range is the most frequent in Yorkville, accounting for 24.3% of all households.
| Income Bracket | # Households | % Households |
| Less than $10,000 | 0 | 0.0% |
| $10,000 to $14,999 | 49 | 4.2% |
| $15,000 to $24,999 | 107 | 9.2% |
| $25,000 to $34,999 | 111 | 9.5% |
| $35,000 to $49,999 | 192 | 16.5% |
| $50,000 to $74,999 | 281 | 24.1% |
| $75,000 to $99,999 | 92 | 7.9% |
| $100,000 to $149,999 | 283 | 24.3% |
| $150,000 to $199,999 | 33 | 2.8% |
| $200,000+ | 17 | 1.5% |
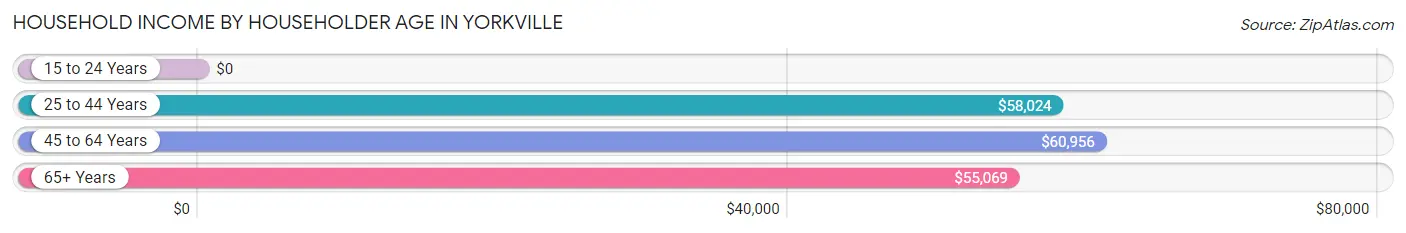
Household Income by Householder Age in Yorkville
The median household income in Yorkville is $58,414, with the highest median household income of $60,956 found in the 45 to 64 years age bracket for the primary householder. A total of 403 households (34.6%) fall into this category. Meanwhile, the 15 to 24 years age bracket for the primary householder has the lowest median household income of $0, with 43 households (3.7%) in this group.
| Income Bracket | # Households | Median Income |
| 15 to 24 Years | 43 (3.7%) | $0 |
| 25 to 44 Years | 481 (41.2%) | $58,024 |
| 45 to 64 Years | 403 (34.6%) | $60,956 |
| 65+ Years | 239 (20.5%) | $55,069 |
| Total | 1,166 (100.0%) | $58,414 |
Poverty in Yorkville
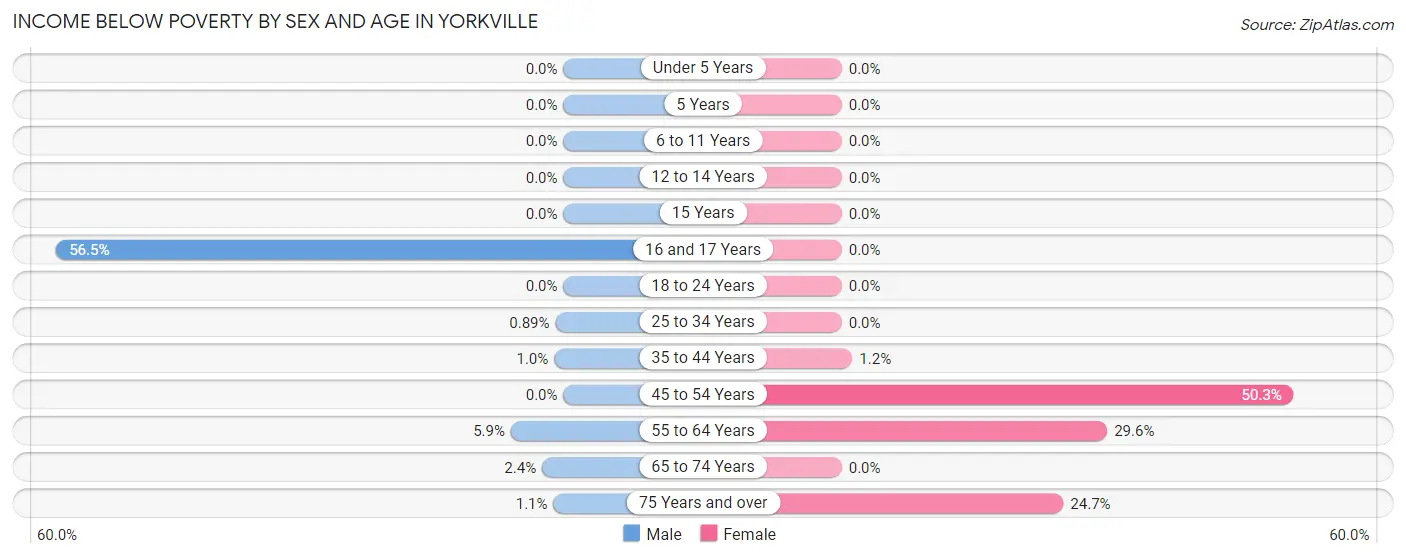
Income Below Poverty by Sex and Age in Yorkville
With 4.6% poverty level for males and 12.2% for females among the residents of Yorkville, 16 and 17 year old males and 45 to 54 year old females are the most vulnerable to poverty, with 48 males (56.5%) and 78 females (50.3%) in their respective age groups living below the poverty level.
| Age Bracket | Male | Female |
| Under 5 Years | 0 (0.0%) | 0 (0.0%) |
| 5 Years | 0 (0.0%) | 0 (0.0%) |
| 6 to 11 Years | 0 (0.0%) | 0 (0.0%) |
| 12 to 14 Years | 0 (0.0%) | 0 (0.0%) |
| 15 Years | 0 (0.0%) | 0 (0.0%) |
| 16 and 17 Years | 48 (56.5%) | 0 (0.0%) |
| 18 to 24 Years | 0 (0.0%) | 0 (0.0%) |
| 25 to 34 Years | 2 (0.9%) | 0 (0.0%) |
| 35 to 44 Years | 2 (1.0%) | 2 (1.2%) |
| 45 to 54 Years | 0 (0.0%) | 78 (50.3%) |
| 55 to 64 Years | 10 (5.9%) | 47 (29.6%) |
| 65 to 74 Years | 2 (2.4%) | 0 (0.0%) |
| 75 Years and over | 1 (1.1%) | 19 (24.7%) |
| Total | 65 (4.6%) | 146 (12.2%) |
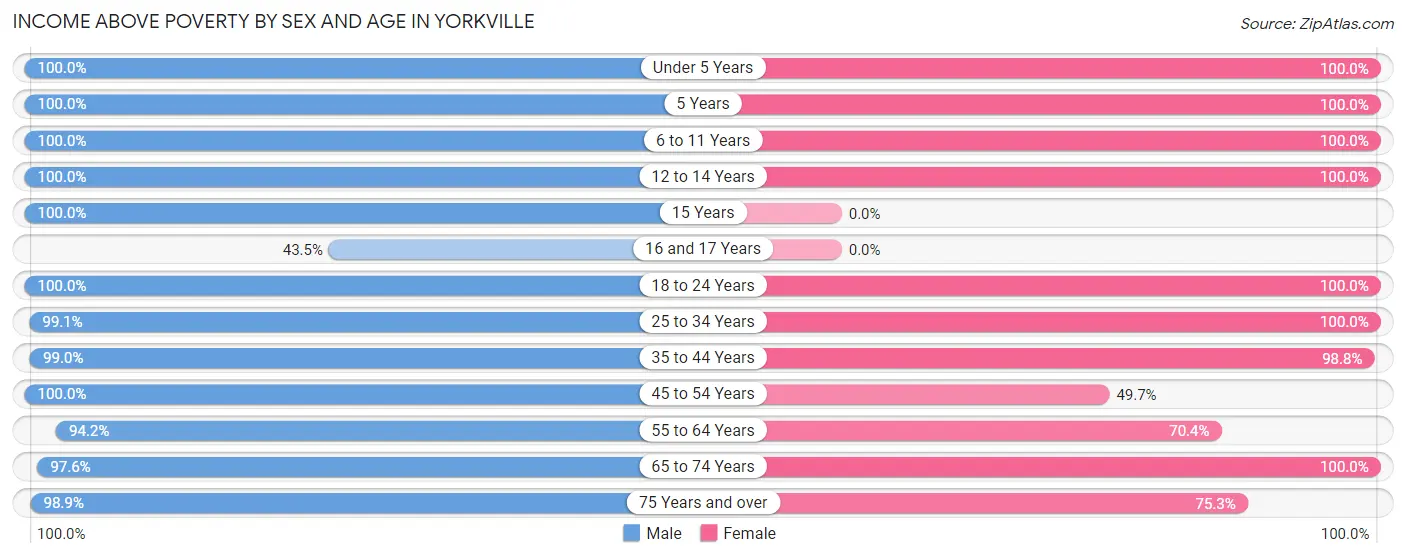
Income Above Poverty by Sex and Age in Yorkville
According to the poverty statistics in Yorkville, males aged under 5 years and females aged under 5 years are the age groups that are most secure financially, with 100.0% of males and 100.0% of females in these age groups living above the poverty line.
| Age Bracket | Male | Female |
| Under 5 Years | 70 (100.0%) | 73 (100.0%) |
| 5 Years | 24 (100.0%) | 11 (100.0%) |
| 6 to 11 Years | 88 (100.0%) | 91 (100.0%) |
| 12 to 14 Years | 13 (100.0%) | 53 (100.0%) |
| 15 Years | 65 (100.0%) | 0 (0.0%) |
| 16 and 17 Years | 37 (43.5%) | 0 (0.0%) |
| 18 to 24 Years | 152 (100.0%) | 59 (100.0%) |
| 25 to 34 Years | 223 (99.1%) | 224 (100.0%) |
| 35 to 44 Years | 193 (99.0%) | 167 (98.8%) |
| 45 to 54 Years | 151 (100.0%) | 77 (49.7%) |
| 55 to 64 Years | 161 (94.2%) | 112 (70.4%) |
| 65 to 74 Years | 82 (97.6%) | 128 (100.0%) |
| 75 Years and over | 89 (98.9%) | 58 (75.3%) |
| Total | 1,348 (95.4%) | 1,053 (87.8%) |
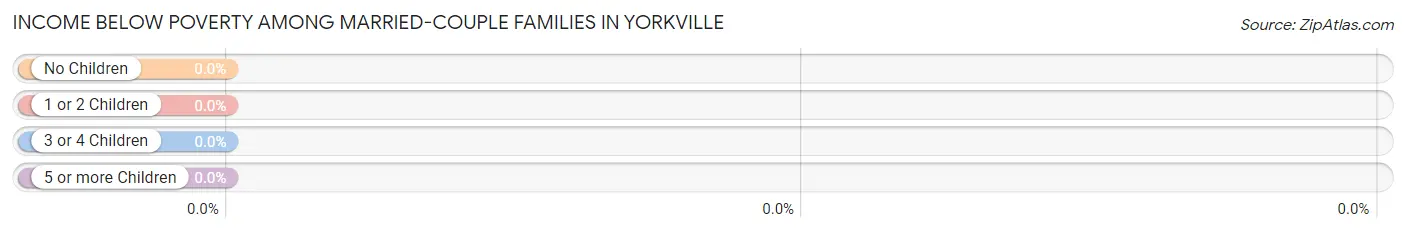
Income Below Poverty Among Married-Couple Families in Yorkville
| Children | Above Poverty | Below Poverty |
| No Children | 190 (100.0%) | 0 (0.0%) |
| 1 or 2 Children | 168 (100.0%) | 0 (0.0%) |
| 3 or 4 Children | 17 (100.0%) | 0 (0.0%) |
| 5 or more Children | 0 (0.0%) | 0 (0.0%) |
| Total | 375 (100.0%) | 0 (0.0%) |
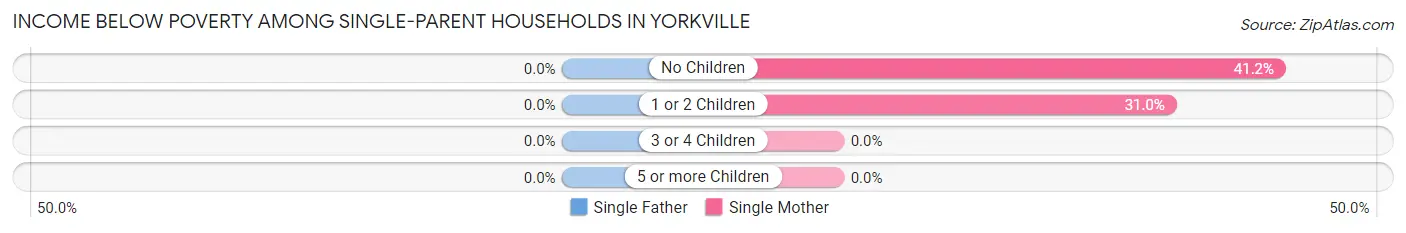
Income Below Poverty Among Single-Parent Households in Yorkville
| Children | Single Father | Single Mother |
| No Children | 0 (0.0%) | 21 (41.2%) |
| 1 or 2 Children | 0 (0.0%) | 49 (31.0%) |
| 3 or 4 Children | 0 (0.0%) | 0 (0.0%) |
| 5 or more Children | 0 (0.0%) | 0 (0.0%) |
| Total | 0 (0.0%) | 70 (33.5%) |
Income Below Poverty Among Married-Couple vs Single-Parent Households in Yorkville
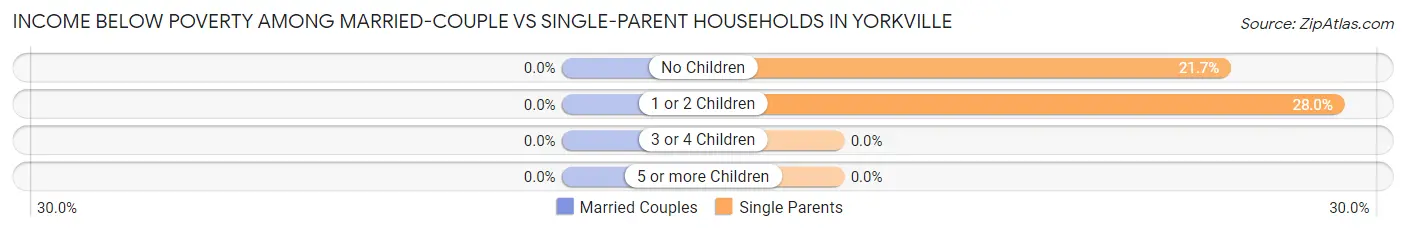
| Children | Married-Couple Families | Single-Parent Households |
| No Children | 0 (0.0%) | 21 (21.6%) |
| 1 or 2 Children | 0 (0.0%) | 49 (28.0%) |
| 3 or 4 Children | 0 (0.0%) | 0 (0.0%) |
| 5 or more Children | 0 (0.0%) | 0 (0.0%) |
| Total | 0 (0.0%) | 70 (23.6%) |
Employment Characteristics in Yorkville
Employment by Class of Employer in Yorkville
Among the 1,334 employed individuals in Yorkville, private company employees (934 | 70.0%), not-for-profit organizations (209 | 15.7%), and local government employees (111 | 8.3%) make up the most common classes of employment.
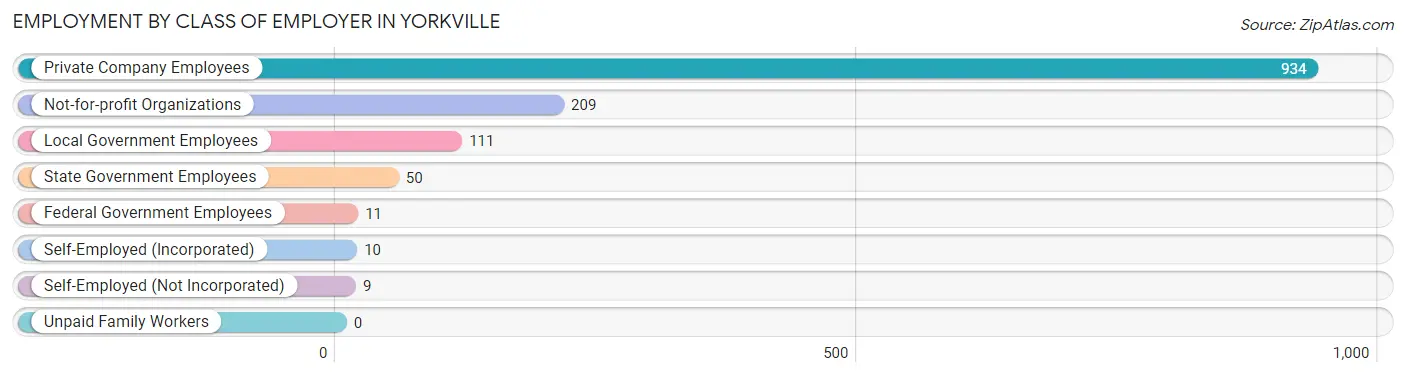
| Employer Class | # Employees | % Employees |
| Private Company Employees | 934 | 70.0% |
| Self-Employed (Incorporated) | 10 | 0.7% |
| Self-Employed (Not Incorporated) | 9 | 0.7% |
| Not-for-profit Organizations | 209 | 15.7% |
| Local Government Employees | 111 | 8.3% |
| State Government Employees | 50 | 3.7% |
| Federal Government Employees | 11 | 0.8% |
| Unpaid Family Workers | 0 | 0.0% |
| Total | 1,334 | 100.0% |
Employment Status by Age in Yorkville
According to the labor force statistics for Yorkville, out of the total population over 16 years of age (2,124), 69.1% or 1,468 individuals are in the labor force, with 5.5% or 81 of them unemployed. The age group with the highest labor force participation rate is 20 to 24 years, with 100.0% or 211 individuals in the labor force. Within the labor force, the 65 to 74 years age range has the highest percentage of unemployed individuals, with 25.0% or 12 of them being unemployed.
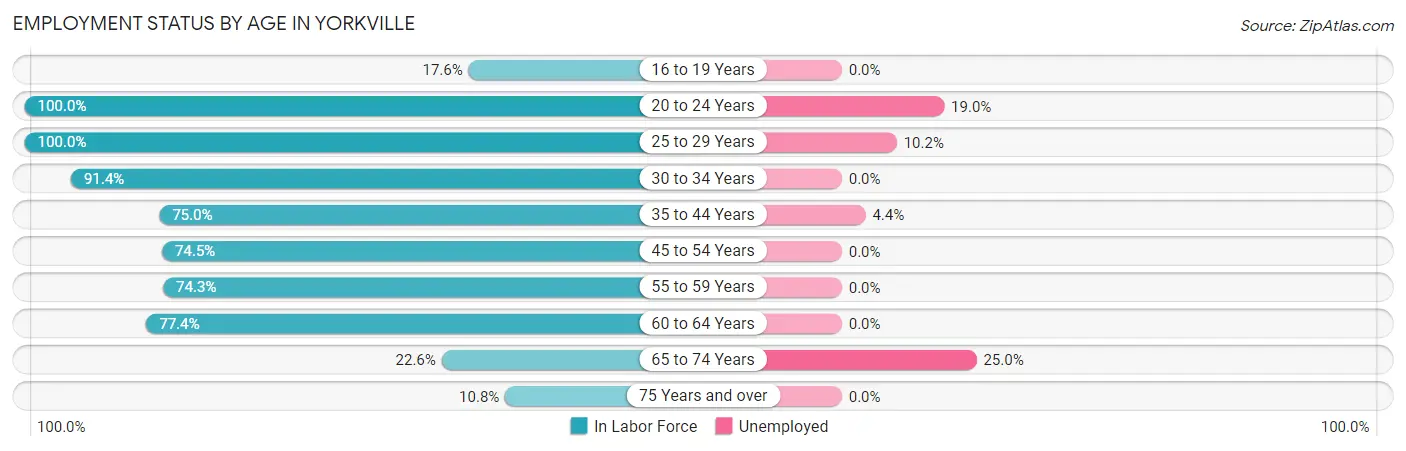
| Age Bracket | In Labor Force | Unemployed |
| 16 to 19 Years | 15 (17.6%) | 0 (0.0%) |
| 20 to 24 Years | 211 (100.0%) | 40 (19.0%) |
| 25 to 29 Years | 157 (100.0%) | 16 (10.2%) |
| 30 to 34 Years | 267 (91.4%) | 0 (0.0%) |
| 35 to 44 Years | 273 (75.0%) | 12 (4.4%) |
| 45 to 54 Years | 228 (74.5%) | 0 (0.0%) |
| 55 to 59 Years | 127 (74.3%) | 0 (0.0%) |
| 60 to 64 Years | 123 (77.4%) | 0 (0.0%) |
| 65 to 74 Years | 48 (22.6%) | 12 (25.0%) |
| 75 Years and over | 18 (10.8%) | 0 (0.0%) |
| Total | 1,468 (69.1%) | 81 (5.5%) |
Employment Status by Educational Attainment in Yorkville
According to labor force statistics for Yorkville, 81.1% of individuals (1,175) out of the total population between 25 and 64 years of age (1,449) are in the labor force, with 2.4% or 28 of them being unemployed. The group with the highest labor force participation rate are those with the educational attainment of bachelor's degree or higher, with 96.5% or 334 individuals in the labor force. Within the labor force, individuals with high school diploma education have the highest percentage of unemployment, with 4.7% or 16 of them being unemployed.
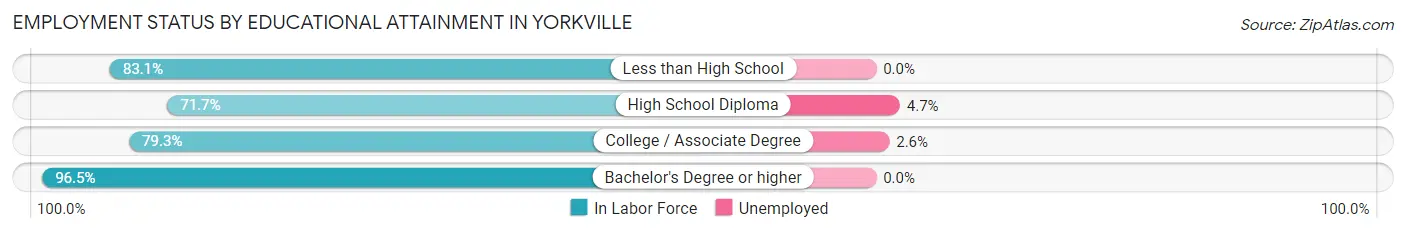
| Educational Attainment | In Labor Force | Unemployed |
| Less than High School | 49 (83.1%) | 0 (0.0%) |
| High School Diploma | 337 (71.7%) | 22 (4.7%) |
| College / Associate Degree | 455 (79.3%) | 15 (2.6%) |
| Bachelor's Degree or higher | 334 (96.5%) | 0 (0.0%) |
| Total | 1,175 (81.1%) | 35 (2.4%) |
Employment Occupations by Sex in Yorkville
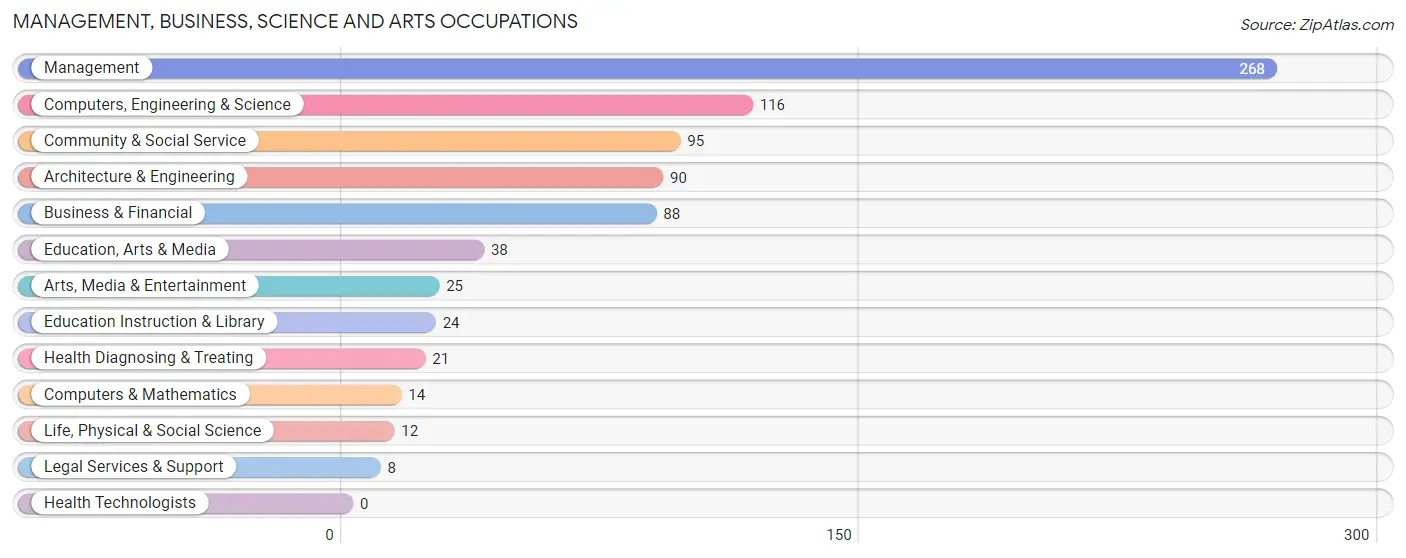
Management, Business, Science and Arts Occupations
The most common Management, Business, Science and Arts occupations in Yorkville are Management (268 | 19.3%), Computers, Engineering & Science (116 | 8.4%), Community & Social Service (95 | 6.9%), Architecture & Engineering (90 | 6.5%), and Business & Financial (88 | 6.3%).
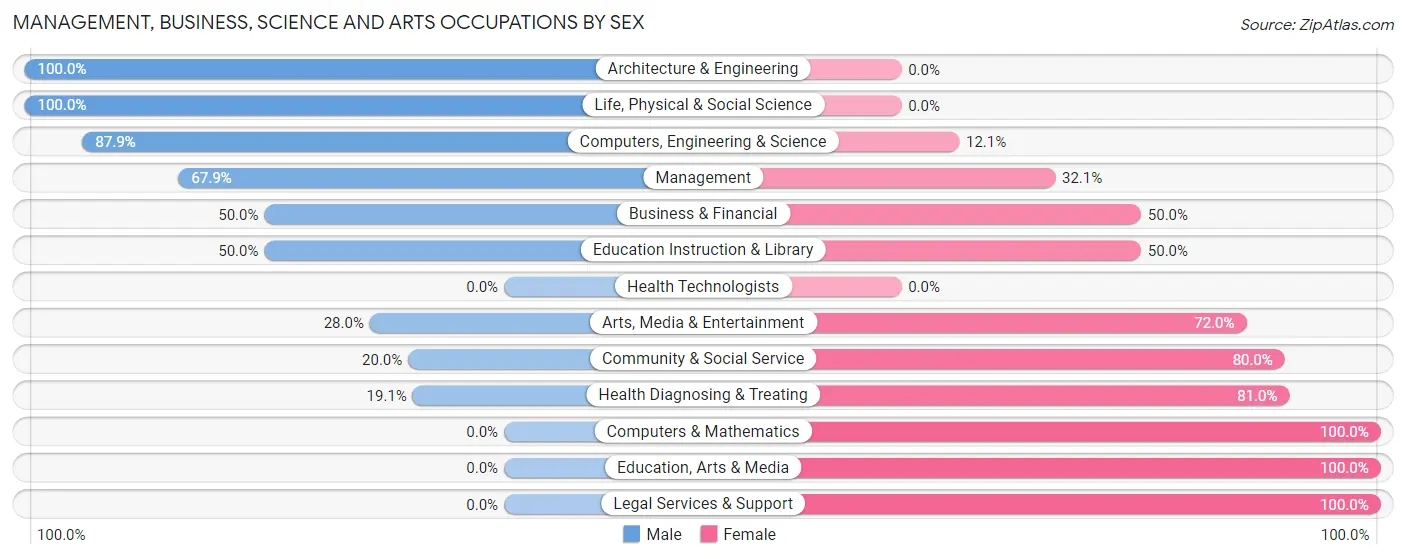
Management, Business, Science and Arts Occupations by Sex
Within the Management, Business, Science and Arts occupations in Yorkville, the most male-oriented occupations are Architecture & Engineering (100.0%), Life, Physical & Social Science (100.0%), and Computers, Engineering & Science (87.9%), while the most female-oriented occupations are Computers & Mathematics (100.0%), Education, Arts & Media (100.0%), and Legal Services & Support (100.0%).
| Occupation | Male | Female |
| Management | 182 (67.9%) | 86 (32.1%) |
| Business & Financial | 44 (50.0%) | 44 (50.0%) |
| Computers, Engineering & Science | 102 (87.9%) | 14 (12.1%) |
| Computers & Mathematics | 0 (0.0%) | 14 (100.0%) |
| Architecture & Engineering | 90 (100.0%) | 0 (0.0%) |
| Life, Physical & Social Science | 12 (100.0%) | 0 (0.0%) |
| Community & Social Service | 19 (20.0%) | 76 (80.0%) |
| Education, Arts & Media | 0 (0.0%) | 38 (100.0%) |
| Legal Services & Support | 0 (0.0%) | 8 (100.0%) |
| Education Instruction & Library | 12 (50.0%) | 12 (50.0%) |
| Arts, Media & Entertainment | 7 (28.0%) | 18 (72.0%) |
| Health Diagnosing & Treating | 4 (19.1%) | 17 (80.9%) |
| Health Technologists | 0 (0.0%) | 0 (0.0%) |
| Total (Category) | 351 (59.7%) | 237 (40.3%) |
| Total (Overall) | 804 (58.0%) | 583 (42.0%) |
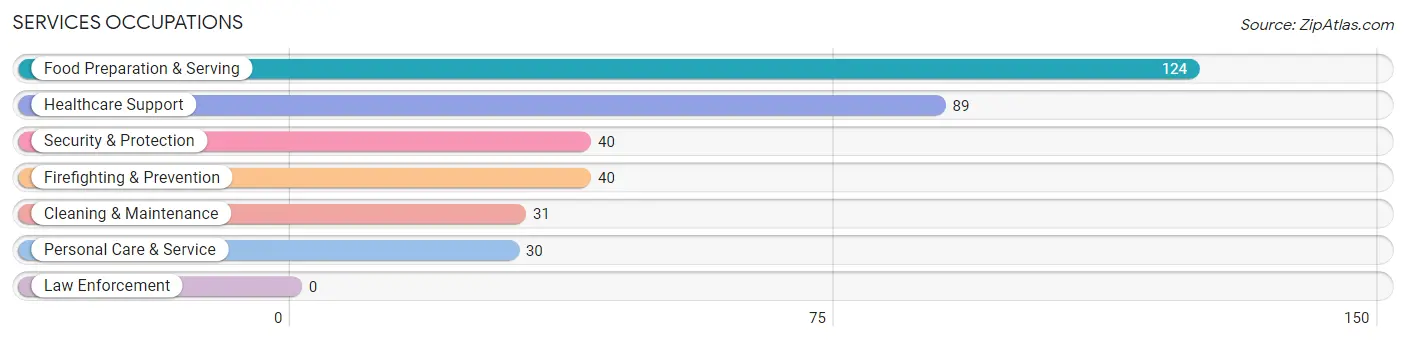
Services Occupations
The most common Services occupations in Yorkville are Food Preparation & Serving (124 | 8.9%), Healthcare Support (89 | 6.4%), Security & Protection (40 | 2.9%), Firefighting & Prevention (40 | 2.9%), and Cleaning & Maintenance (31 | 2.2%).
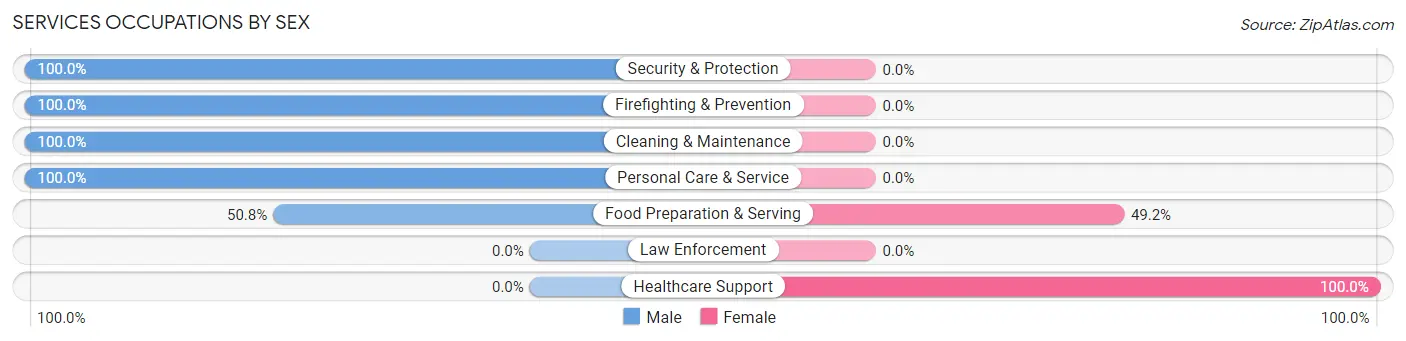
Services Occupations by Sex
Within the Services occupations in Yorkville, the most male-oriented occupations are Security & Protection (100.0%), Firefighting & Prevention (100.0%), and Cleaning & Maintenance (100.0%), while the most female-oriented occupations are Healthcare Support (100.0%), and Food Preparation & Serving (49.2%).
| Occupation | Male | Female |
| Healthcare Support | 0 (0.0%) | 89 (100.0%) |
| Security & Protection | 40 (100.0%) | 0 (0.0%) |
| Firefighting & Prevention | 40 (100.0%) | 0 (0.0%) |
| Law Enforcement | 0 (0.0%) | 0 (0.0%) |
| Food Preparation & Serving | 63 (50.8%) | 61 (49.2%) |
| Cleaning & Maintenance | 31 (100.0%) | 0 (0.0%) |
| Personal Care & Service | 30 (100.0%) | 0 (0.0%) |
| Total (Category) | 164 (52.2%) | 150 (47.8%) |
| Total (Overall) | 804 (58.0%) | 583 (42.0%) |
Sales and Office Occupations
The most common Sales and Office occupations in Yorkville are Office & Administration (190 | 13.7%), and Sales & Related (40 | 2.9%).
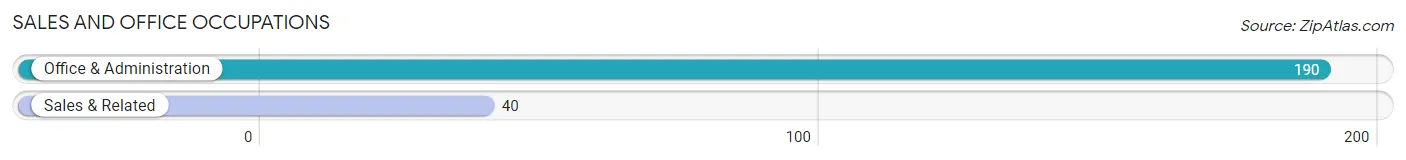
Sales and Office Occupations by Sex

| Occupation | Male | Female |
| Sales & Related | 27 (67.5%) | 13 (32.5%) |
| Office & Administration | 35 (18.4%) | 155 (81.6%) |
| Total (Category) | 62 (27.0%) | 168 (73.0%) |
| Total (Overall) | 804 (58.0%) | 583 (42.0%) |
Natural Resources, Construction and Maintenance Occupations
The most common Natural Resources, Construction and Maintenance occupations in Yorkville are Installation, Maintenance & Repair (38 | 2.7%), and Construction & Extraction (5 | 0.4%).
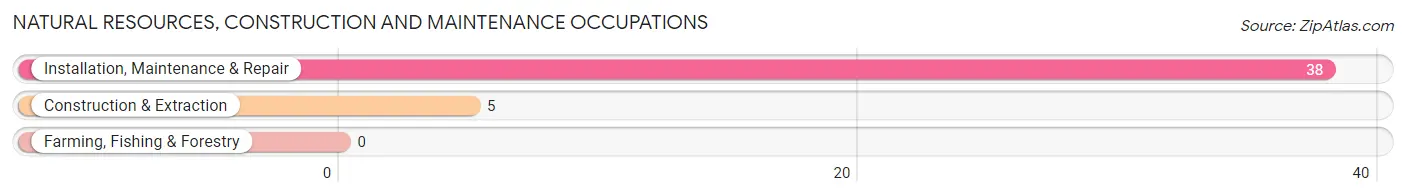
Natural Resources, Construction and Maintenance Occupations by Sex

| Occupation | Male | Female |
| Farming, Fishing & Forestry | 0 (0.0%) | 0 (0.0%) |
| Construction & Extraction | 5 (100.0%) | 0 (0.0%) |
| Installation, Maintenance & Repair | 38 (100.0%) | 0 (0.0%) |
| Total (Category) | 43 (100.0%) | 0 (0.0%) |
| Total (Overall) | 804 (58.0%) | 583 (42.0%) |
Production, Transportation and Moving Occupations
The most common Production, Transportation and Moving occupations in Yorkville are Production (128 | 9.2%), Material Moving (64 | 4.6%), and Transportation (20 | 1.4%).
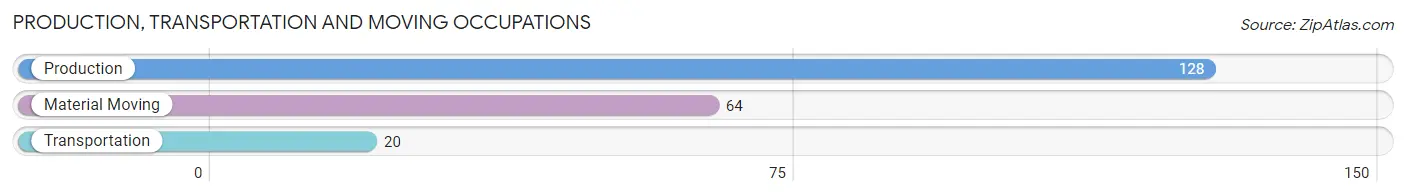
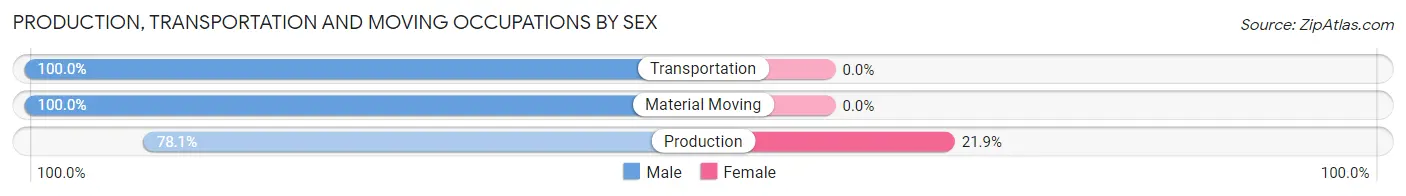
Production, Transportation and Moving Occupations by Sex
| Occupation | Male | Female |
| Production | 100 (78.1%) | 28 (21.9%) |
| Transportation | 20 (100.0%) | 0 (0.0%) |
| Material Moving | 64 (100.0%) | 0 (0.0%) |
| Total (Category) | 184 (86.8%) | 28 (13.2%) |
| Total (Overall) | 804 (58.0%) | 583 (42.0%) |
Employment Industries by Sex in Yorkville
Employment Industries in Yorkville
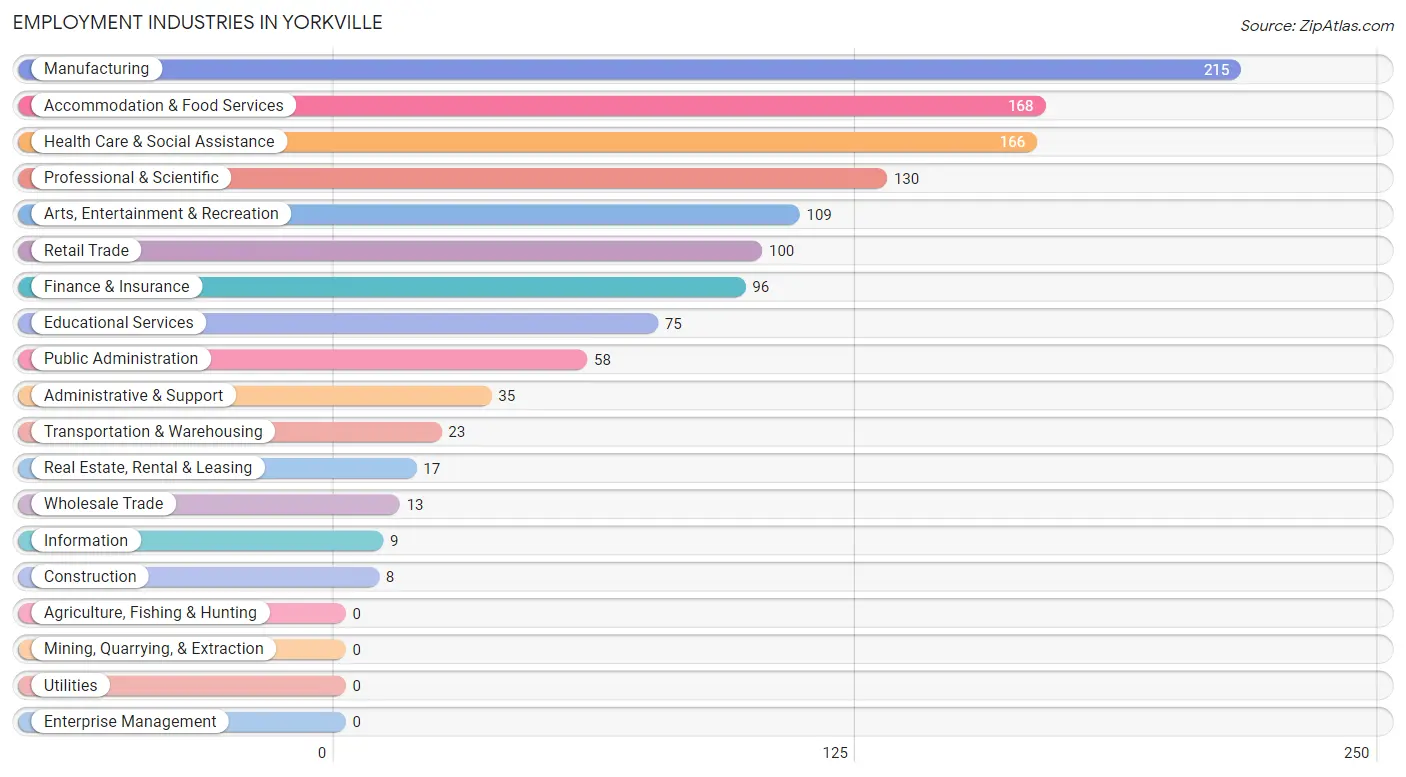
The major employment industries in Yorkville include Manufacturing (215 | 15.5%), Accommodation & Food Services (168 | 12.1%), Health Care & Social Assistance (166 | 12.0%), Professional & Scientific (130 | 9.4%), and Arts, Entertainment & Recreation (109 | 7.9%).
Employment Industries by Sex in Yorkville
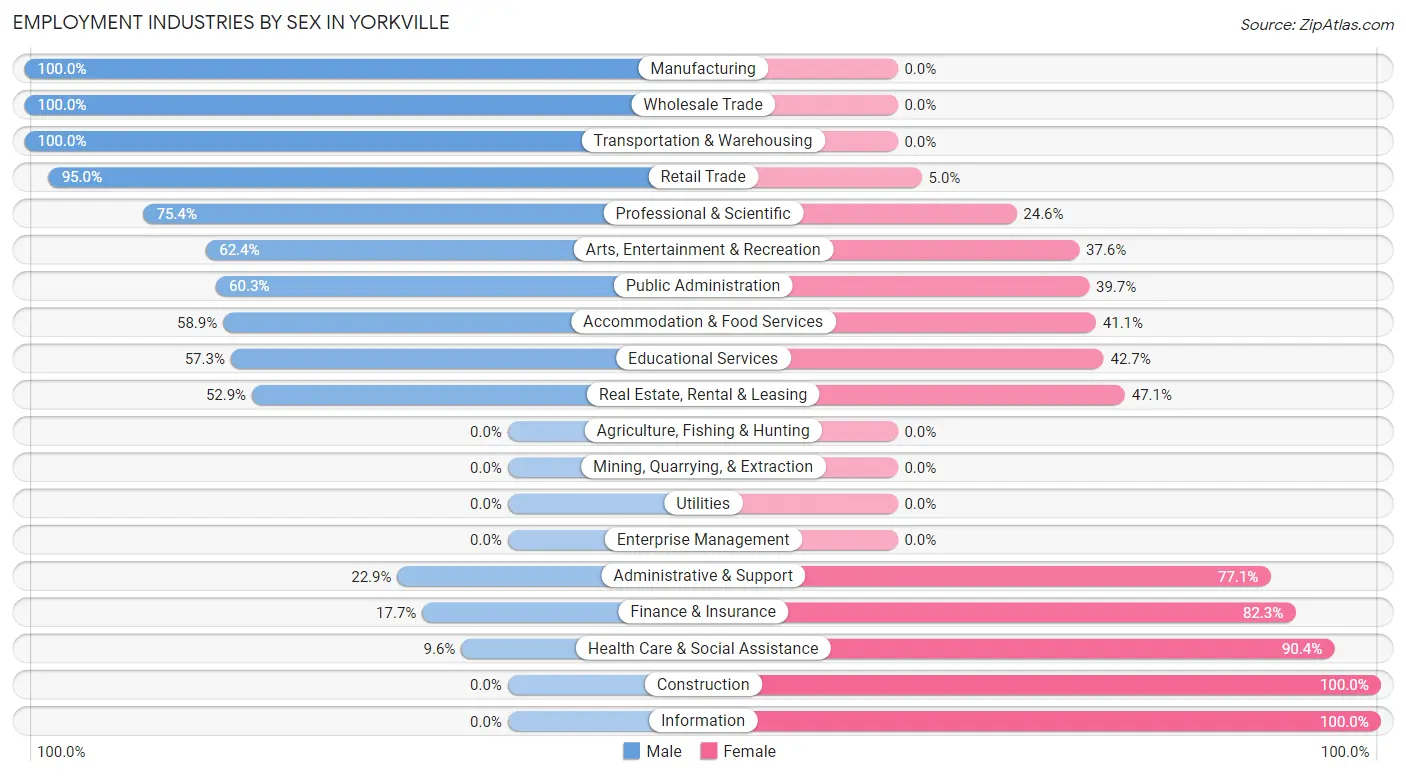
The Yorkville industries that see more men than women are Manufacturing (100.0%), Wholesale Trade (100.0%), and Transportation & Warehousing (100.0%), whereas the industries that tend to have a higher number of women are Construction (100.0%), Information (100.0%), and Health Care & Social Assistance (90.4%).
| Industry | Male | Female |
| Agriculture, Fishing & Hunting | 0 (0.0%) | 0 (0.0%) |
| Mining, Quarrying, & Extraction | 0 (0.0%) | 0 (0.0%) |
| Construction | 0 (0.0%) | 8 (100.0%) |
| Manufacturing | 215 (100.0%) | 0 (0.0%) |
| Wholesale Trade | 13 (100.0%) | 0 (0.0%) |
| Retail Trade | 95 (95.0%) | 5 (5.0%) |
| Transportation & Warehousing | 23 (100.0%) | 0 (0.0%) |
| Utilities | 0 (0.0%) | 0 (0.0%) |
| Information | 0 (0.0%) | 9 (100.0%) |
| Finance & Insurance | 17 (17.7%) | 79 (82.3%) |
| Real Estate, Rental & Leasing | 9 (52.9%) | 8 (47.1%) |
| Professional & Scientific | 98 (75.4%) | 32 (24.6%) |
| Enterprise Management | 0 (0.0%) | 0 (0.0%) |
| Administrative & Support | 8 (22.9%) | 27 (77.1%) |
| Educational Services | 43 (57.3%) | 32 (42.7%) |
| Health Care & Social Assistance | 16 (9.6%) | 150 (90.4%) |
| Arts, Entertainment & Recreation | 68 (62.4%) | 41 (37.6%) |
| Accommodation & Food Services | 99 (58.9%) | 69 (41.1%) |
| Public Administration | 35 (60.3%) | 23 (39.7%) |
| Total | 804 (58.0%) | 583 (42.0%) |
Education in Yorkville
School Enrollment in Yorkville
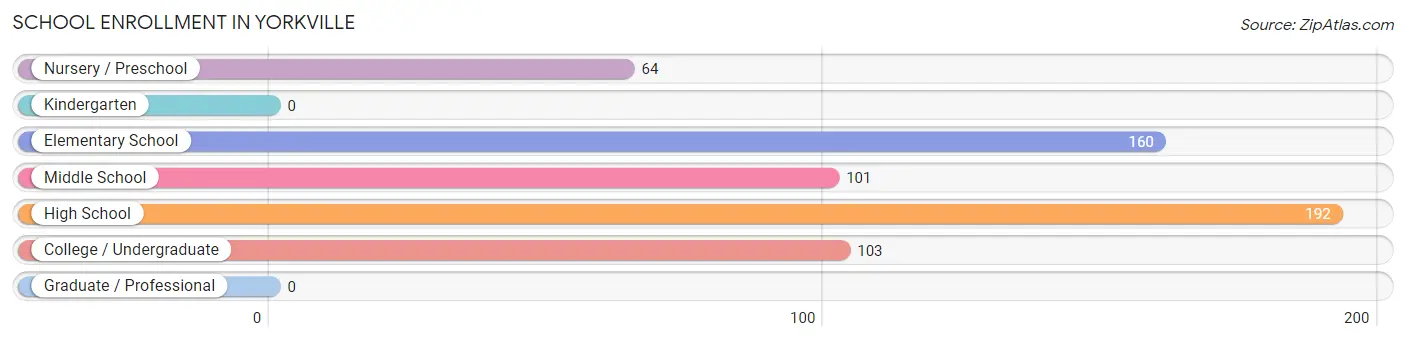
The most common levels of schooling among the 620 students in Yorkville are high school (192 | 31.0%), elementary school (160 | 25.8%), and college / undergraduate (103 | 16.6%).
| School Level | # Students | % Students |
| Nursery / Preschool | 64 | 10.3% |
| Kindergarten | 0 | 0.0% |
| Elementary School | 160 | 25.8% |
| Middle School | 101 | 16.3% |
| High School | 192 | 31.0% |
| College / Undergraduate | 103 | 16.6% |
| Graduate / Professional | 0 | 0.0% |
| Total | 620 | 100.0% |
School Enrollment by Age by Funding Source in Yorkville
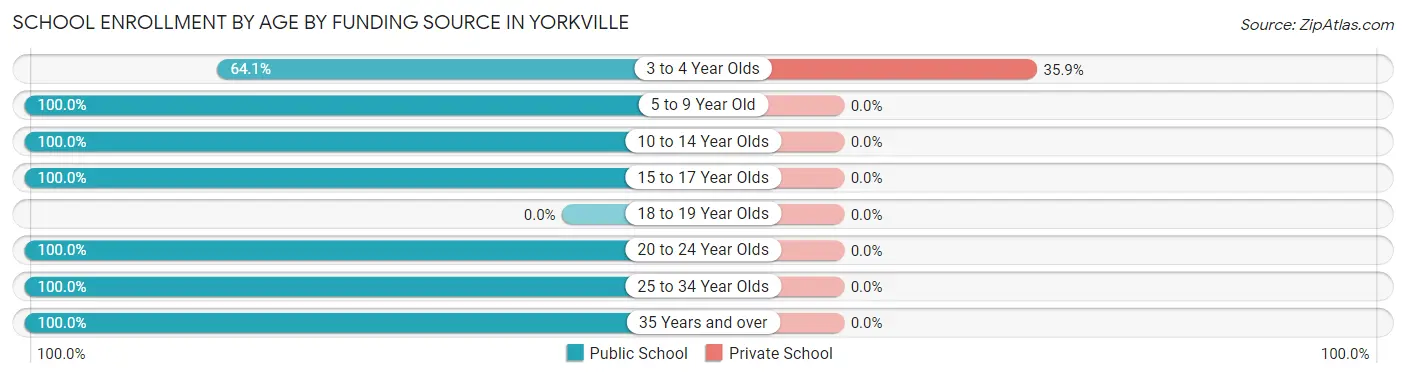
Out of a total of 620 students who are enrolled in schools in Yorkville, 23 (3.7%) attend a private institution, while the remaining 597 (96.3%) are enrolled in public schools. The age group of 3 to 4 year olds has the highest likelihood of being enrolled in private schools, with 23 (35.9% in the age bracket) enrolled. Conversely, the age group of 5 to 9 year old has the lowest likelihood of being enrolled in a private school, with 160 (100.0% in the age bracket) attending a public institution.
| Age Bracket | Public School | Private School |
| 3 to 4 Year Olds | 41 (64.1%) | 23 (35.9%) |
| 5 to 9 Year Old | 160 (100.0%) | 0 (0.0%) |
| 10 to 14 Year Olds | 143 (100.0%) | 0 (0.0%) |
| 15 to 17 Year Olds | 150 (100.0%) | 0 (0.0%) |
| 18 to 19 Year Olds | 0 (0.0%) | 0 (0.0%) |
| 20 to 24 Year Olds | 37 (100.0%) | 0 (0.0%) |
| 25 to 34 Year Olds | 58 (100.0%) | 0 (0.0%) |
| 35 Years and over | 8 (100.0%) | 0 (0.0%) |
| Total | 597 (96.3%) | 23 (3.7%) |
Educational Attainment by Field of Study in Yorkville
Social sciences (155 | 36.5%), business (102 | 24.0%), psychology (41 | 9.7%), science & technology (30 | 7.1%), and arts & humanities (30 | 7.1%) are the most common fields of study among 425 individuals in Yorkville who have obtained a bachelor's degree or higher.
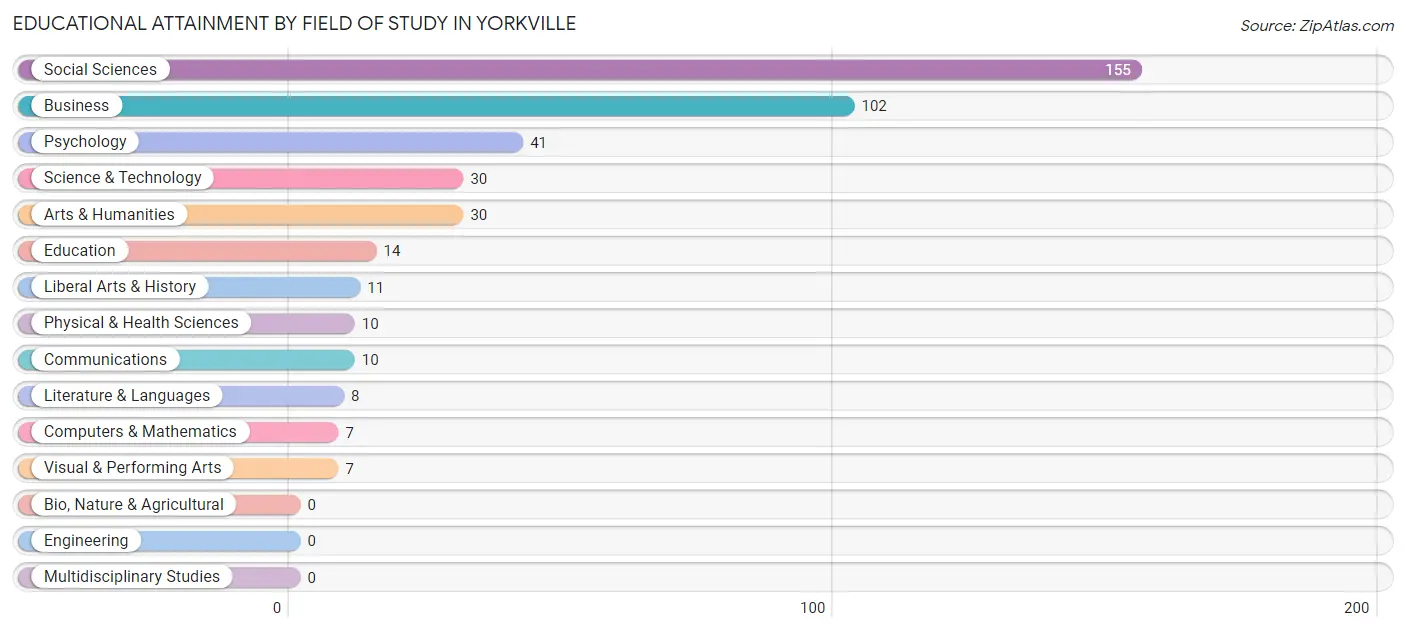
| Field of Study | # Graduates | % Graduates |
| Computers & Mathematics | 7 | 1.7% |
| Bio, Nature & Agricultural | 0 | 0.0% |
| Physical & Health Sciences | 10 | 2.4% |
| Psychology | 41 | 9.7% |
| Social Sciences | 155 | 36.5% |
| Engineering | 0 | 0.0% |
| Multidisciplinary Studies | 0 | 0.0% |
| Science & Technology | 30 | 7.1% |
| Business | 102 | 24.0% |
| Education | 14 | 3.3% |
| Literature & Languages | 8 | 1.9% |
| Liberal Arts & History | 11 | 2.6% |
| Visual & Performing Arts | 7 | 1.7% |
| Communications | 10 | 2.4% |
| Arts & Humanities | 30 | 7.1% |
| Total | 425 | 100.0% |
Transportation & Commute in Yorkville
Vehicle Availability by Sex in Yorkville
The most prevalent vehicle ownership categories in Yorkville are males with 2 vehicles (394, accounting for 49.7%) and females with 2 vehicles (213, making up 72.7%).
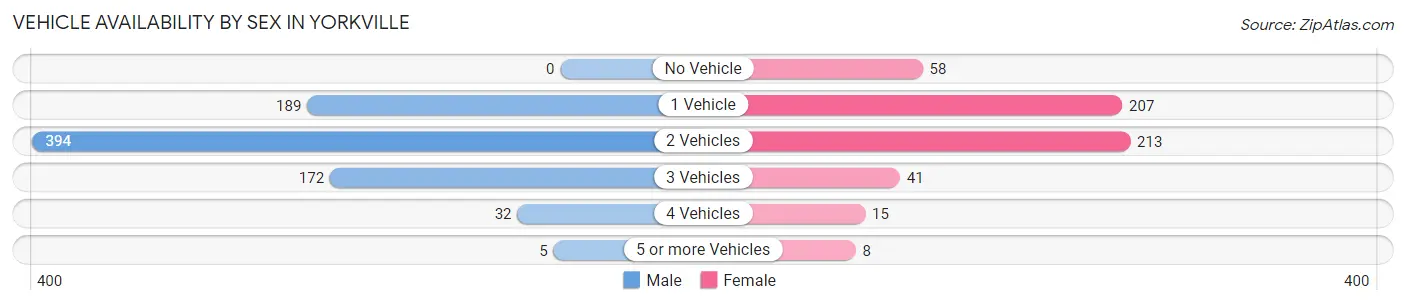
| Vehicles Available | Male | Female |
| No Vehicle | 0 (0.0%) | 58 (10.7%) |
| 1 Vehicle | 189 (23.9%) | 207 (38.2%) |
| 2 Vehicles | 394 (49.7%) | 213 (39.3%) |
| 3 Vehicles | 172 (21.7%) | 41 (7.6%) |
| 4 Vehicles | 32 (4.0%) | 15 (2.8%) |
| 5 or more Vehicles | 5 (0.6%) | 8 (1.5%) |
| Total | 792 (100.0%) | 542 (100.0%) |
Commute Time in Yorkville
The most frequently occuring commute durations in Yorkville are 5 to 9 minutes (361 commuters, 29.2%), 15 to 19 minutes (326 commuters, 26.4%), and 10 to 14 minutes (180 commuters, 14.6%).
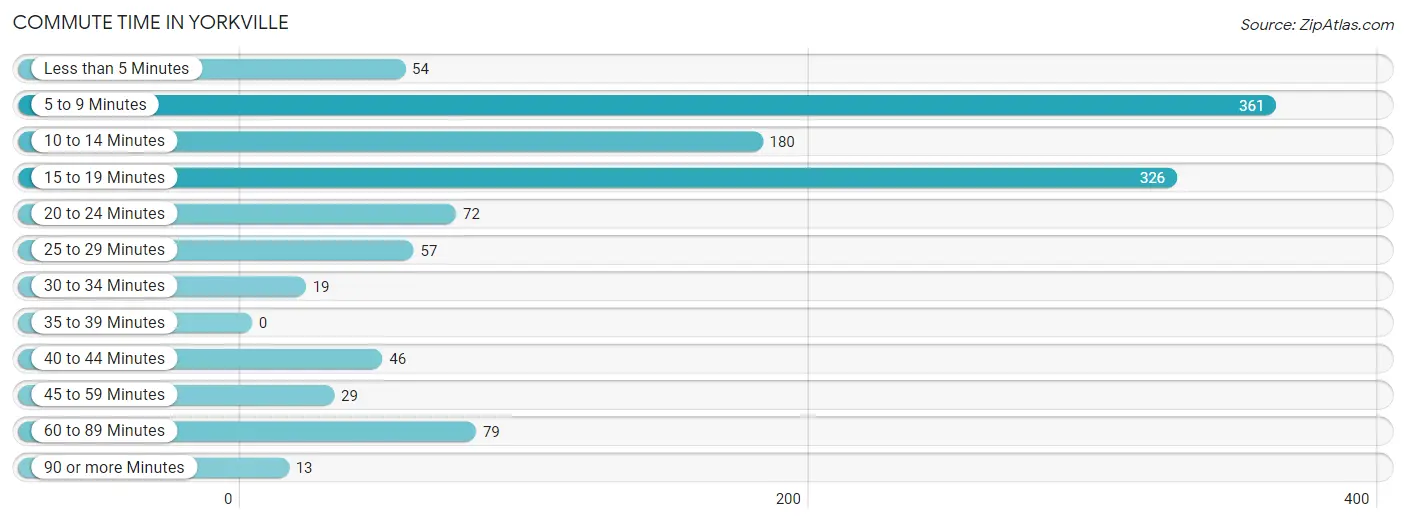
| Commute Time | # Commuters | % Commuters |
| Less than 5 Minutes | 54 | 4.4% |
| 5 to 9 Minutes | 361 | 29.2% |
| 10 to 14 Minutes | 180 | 14.6% |
| 15 to 19 Minutes | 326 | 26.4% |
| 20 to 24 Minutes | 72 | 5.8% |
| 25 to 29 Minutes | 57 | 4.6% |
| 30 to 34 Minutes | 19 | 1.5% |
| 35 to 39 Minutes | 0 | 0.0% |
| 40 to 44 Minutes | 46 | 3.7% |
| 45 to 59 Minutes | 29 | 2.4% |
| 60 to 89 Minutes | 79 | 6.4% |
| 90 or more Minutes | 13 | 1.1% |
Commute Time by Sex in Yorkville
The most common commute times in Yorkville are 5 to 9 minutes (257 commuters, 33.8%) for males and 15 to 19 minutes (152 commuters, 31.9%) for females.
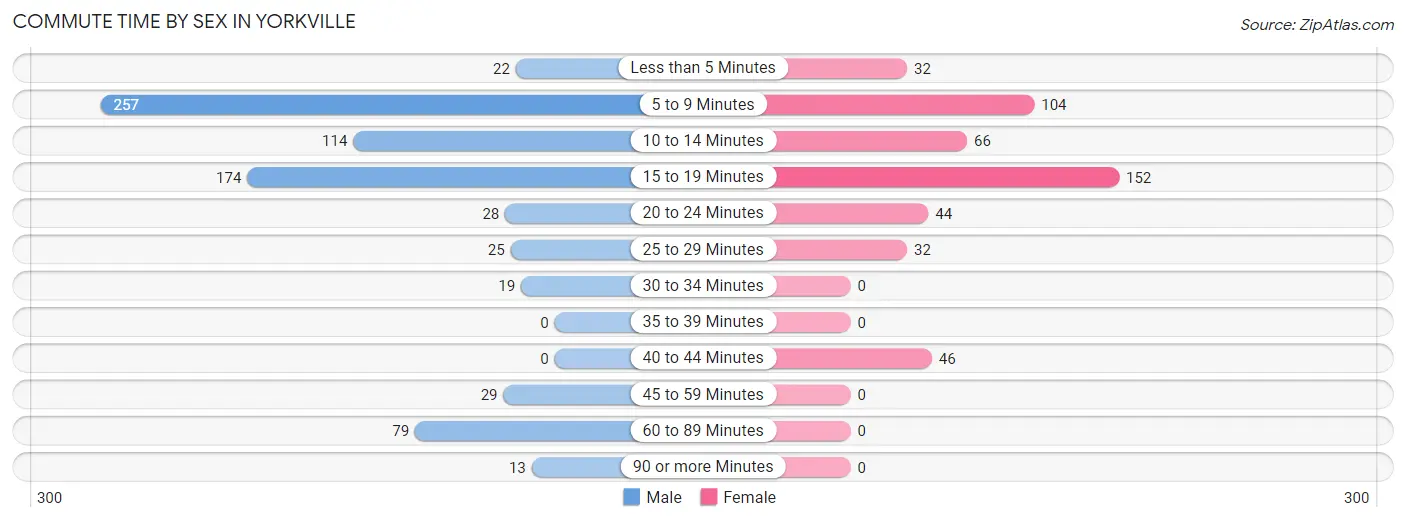
| Commute Time | Male | Female |
| Less than 5 Minutes | 22 (2.9%) | 32 (6.7%) |
| 5 to 9 Minutes | 257 (33.8%) | 104 (21.8%) |
| 10 to 14 Minutes | 114 (15.0%) | 66 (13.9%) |
| 15 to 19 Minutes | 174 (22.9%) | 152 (31.9%) |
| 20 to 24 Minutes | 28 (3.7%) | 44 (9.2%) |
| 25 to 29 Minutes | 25 (3.3%) | 32 (6.7%) |
| 30 to 34 Minutes | 19 (2.5%) | 0 (0.0%) |
| 35 to 39 Minutes | 0 (0.0%) | 0 (0.0%) |
| 40 to 44 Minutes | 0 (0.0%) | 46 (9.7%) |
| 45 to 59 Minutes | 29 (3.8%) | 0 (0.0%) |
| 60 to 89 Minutes | 79 (10.4%) | 0 (0.0%) |
| 90 or more Minutes | 13 (1.7%) | 0 (0.0%) |
Time of Departure to Work by Sex in Yorkville
The most frequent times of departure to work in Yorkville are 7:30 AM to 7:59 AM (224, 29.5%) for males and 7:30 AM to 7:59 AM (142, 29.8%) for females.
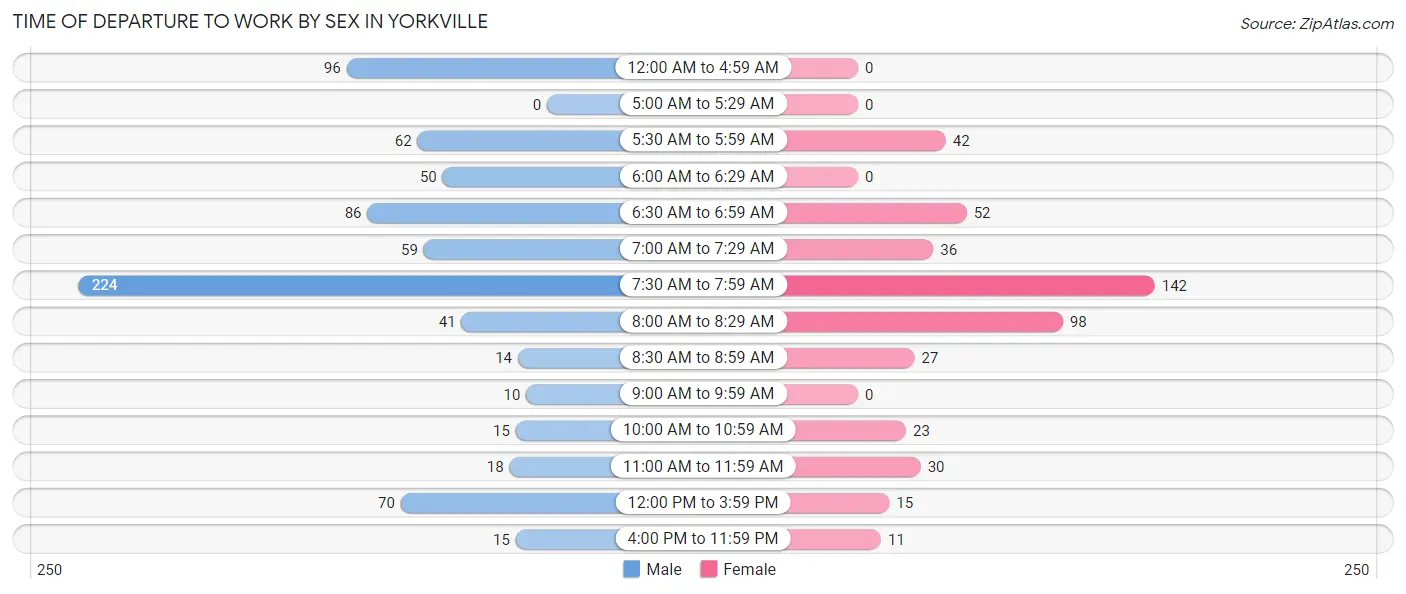
| Time of Departure | Male | Female |
| 12:00 AM to 4:59 AM | 96 (12.6%) | 0 (0.0%) |
| 5:00 AM to 5:29 AM | 0 (0.0%) | 0 (0.0%) |
| 5:30 AM to 5:59 AM | 62 (8.2%) | 42 (8.8%) |
| 6:00 AM to 6:29 AM | 50 (6.6%) | 0 (0.0%) |
| 6:30 AM to 6:59 AM | 86 (11.3%) | 52 (10.9%) |
| 7:00 AM to 7:29 AM | 59 (7.8%) | 36 (7.6%) |
| 7:30 AM to 7:59 AM | 224 (29.5%) | 142 (29.8%) |
| 8:00 AM to 8:29 AM | 41 (5.4%) | 98 (20.6%) |
| 8:30 AM to 8:59 AM | 14 (1.8%) | 27 (5.7%) |
| 9:00 AM to 9:59 AM | 10 (1.3%) | 0 (0.0%) |
| 10:00 AM to 10:59 AM | 15 (2.0%) | 23 (4.8%) |
| 11:00 AM to 11:59 AM | 18 (2.4%) | 30 (6.3%) |
| 12:00 PM to 3:59 PM | 70 (9.2%) | 15 (3.2%) |
| 4:00 PM to 11:59 PM | 15 (2.0%) | 11 (2.3%) |
| Total | 760 (100.0%) | 476 (100.0%) |
Housing Occupancy in Yorkville
Occupancy by Ownership in Yorkville
Of the total 1,166 dwellings in Yorkville, owner-occupied units account for 720 (61.8%), while renter-occupied units make up 446 (38.3%).
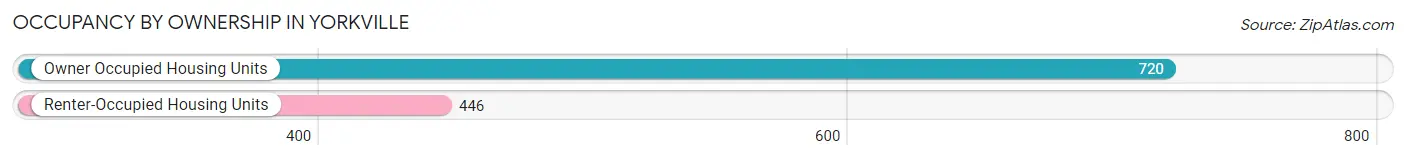
| Occupancy | # Housing Units | % Housing Units |
| Owner Occupied Housing Units | 720 | 61.8% |
| Renter-Occupied Housing Units | 446 | 38.3% |
| Total Occupied Housing Units | 1,166 | 100.0% |
Occupancy by Household Size in Yorkville
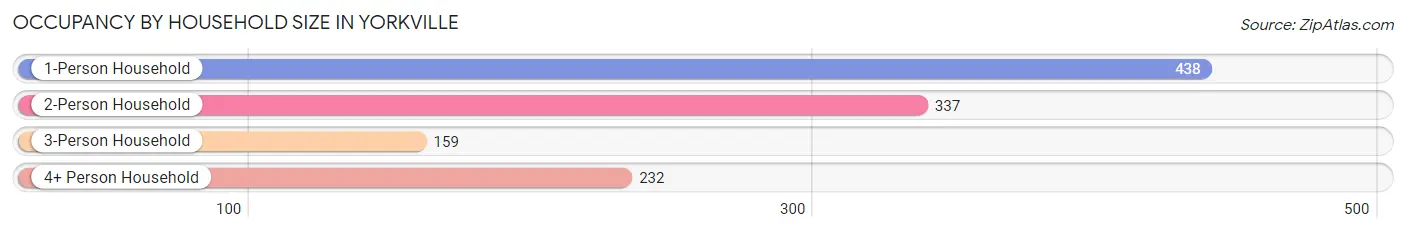
| Household Size | # Housing Units | % Housing Units |
| 1-Person Household | 438 | 37.6% |
| 2-Person Household | 337 | 28.9% |
| 3-Person Household | 159 | 13.6% |
| 4+ Person Household | 232 | 19.9% |
| Total Housing Units | 1,166 | 100.0% |
Occupancy by Ownership by Household Size in Yorkville
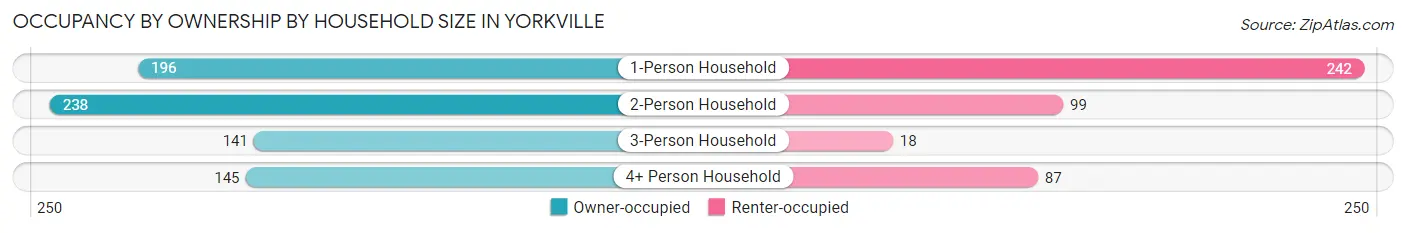
| Household Size | Owner-occupied | Renter-occupied |
| 1-Person Household | 196 (44.8%) | 242 (55.2%) |
| 2-Person Household | 238 (70.6%) | 99 (29.4%) |
| 3-Person Household | 141 (88.7%) | 18 (11.3%) |
| 4+ Person Household | 145 (62.5%) | 87 (37.5%) |
| Total Housing Units | 720 (61.8%) | 446 (38.3%) |
Occupancy by Educational Attainment in Yorkville
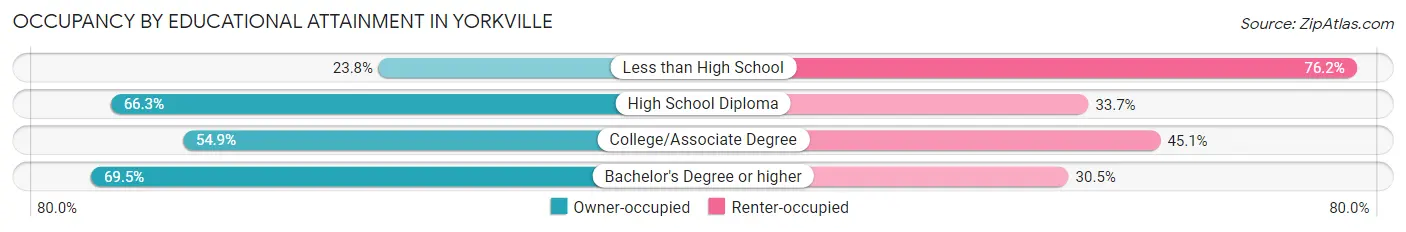
| Household Size | Owner-occupied | Renter-occupied |
| Less than High School | 5 (23.8%) | 16 (76.2%) |
| High School Diploma | 260 (66.3%) | 132 (33.7%) |
| College/Associate Degree | 257 (54.9%) | 211 (45.1%) |
| Bachelor's Degree or higher | 198 (69.5%) | 87 (30.5%) |
Occupancy by Age of Householder in Yorkville
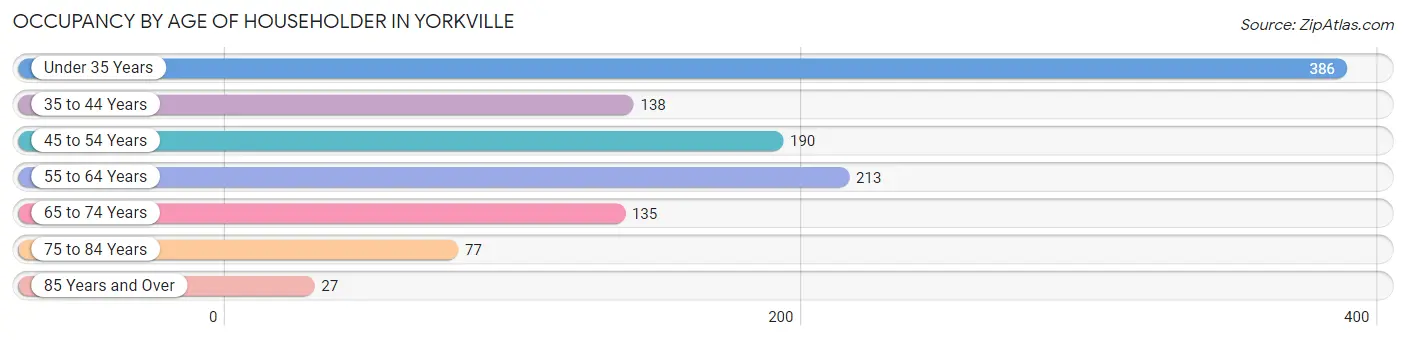
| Age Bracket | # Households | % Households |
| Under 35 Years | 386 | 33.1% |
| 35 to 44 Years | 138 | 11.8% |
| 45 to 54 Years | 190 | 16.3% |
| 55 to 64 Years | 213 | 18.3% |
| 65 to 74 Years | 135 | 11.6% |
| 75 to 84 Years | 77 | 6.6% |
| 85 Years and Over | 27 | 2.3% |
| Total | 1,166 | 100.0% |
Housing Finances in Yorkville
Median Income by Occupancy in Yorkville
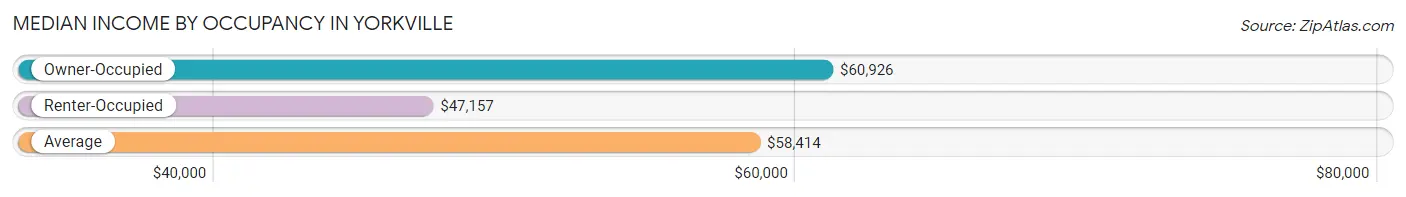
| Occupancy Type | # Households | Median Income |
| Owner-Occupied | 720 (61.8%) | $60,926 |
| Renter-Occupied | 446 (38.3%) | $47,157 |
| Average | 1,166 (100.0%) | $58,414 |
Occupancy by Householder Income Bracket in Yorkville
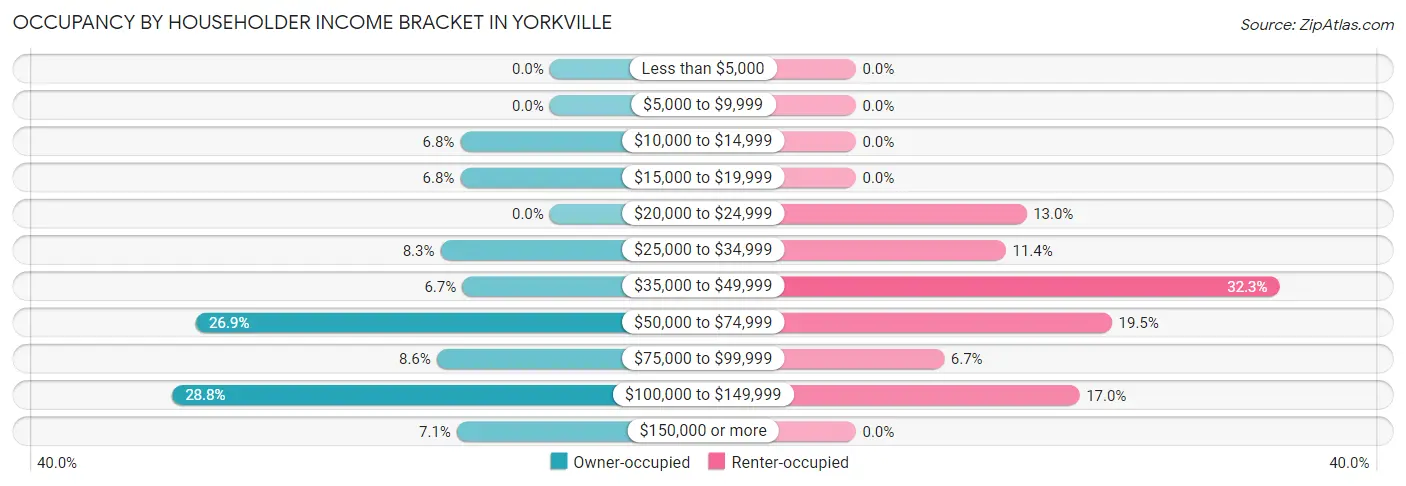
| Income Bracket | Owner-occupied | Renter-occupied |
| Less than $5,000 | 0 (0.0%) | 0 (0.0%) |
| $5,000 to $9,999 | 0 (0.0%) | 0 (0.0%) |
| $10,000 to $14,999 | 49 (6.8%) | 0 (0.0%) |
| $15,000 to $19,999 | 49 (6.8%) | 0 (0.0%) |
| $20,000 to $24,999 | 0 (0.0%) | 58 (13.0%) |
| $25,000 to $34,999 | 60 (8.3%) | 51 (11.4%) |
| $35,000 to $49,999 | 48 (6.7%) | 144 (32.3%) |
| $50,000 to $74,999 | 194 (26.9%) | 87 (19.5%) |
| $75,000 to $99,999 | 62 (8.6%) | 30 (6.7%) |
| $100,000 to $149,999 | 207 (28.7%) | 76 (17.0%) |
| $150,000 or more | 51 (7.1%) | 0 (0.0%) |
| Total | 720 (100.0%) | 446 (100.0%) |
Monthly Housing Cost Tiers in Yorkville
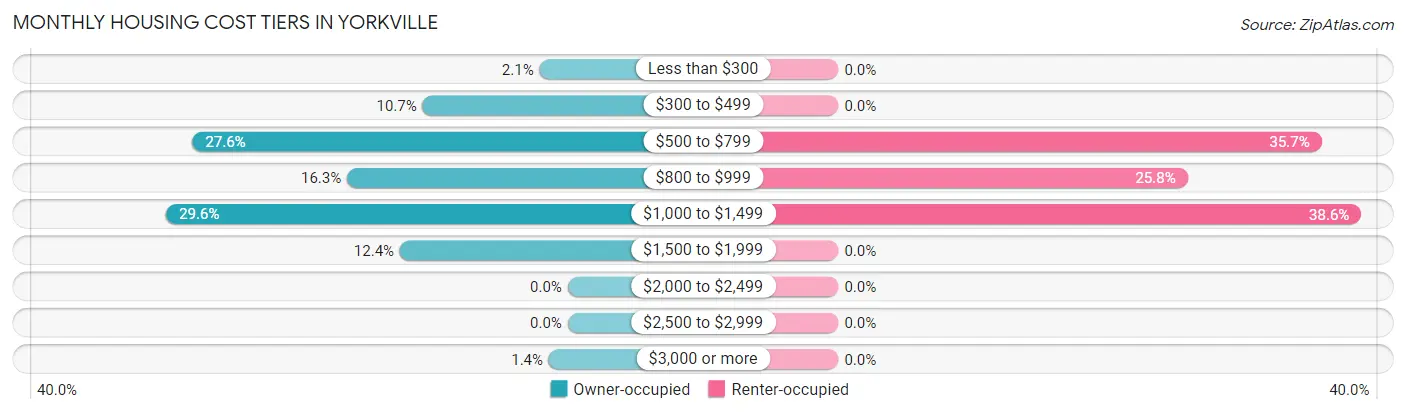
| Monthly Cost | Owner-occupied | Renter-occupied |
| Less than $300 | 15 (2.1%) | 0 (0.0%) |
| $300 to $499 | 77 (10.7%) | 0 (0.0%) |
| $500 to $799 | 199 (27.6%) | 159 (35.6%) |
| $800 to $999 | 117 (16.3%) | 115 (25.8%) |
| $1,000 to $1,499 | 213 (29.6%) | 172 (38.6%) |
| $1,500 to $1,999 | 89 (12.4%) | 0 (0.0%) |
| $2,000 to $2,499 | 0 (0.0%) | 0 (0.0%) |
| $2,500 to $2,999 | 0 (0.0%) | 0 (0.0%) |
| $3,000 or more | 10 (1.4%) | 0 (0.0%) |
| Total | 720 (100.0%) | 446 (100.0%) |
Physical Housing Characteristics in Yorkville
Housing Structures in Yorkville
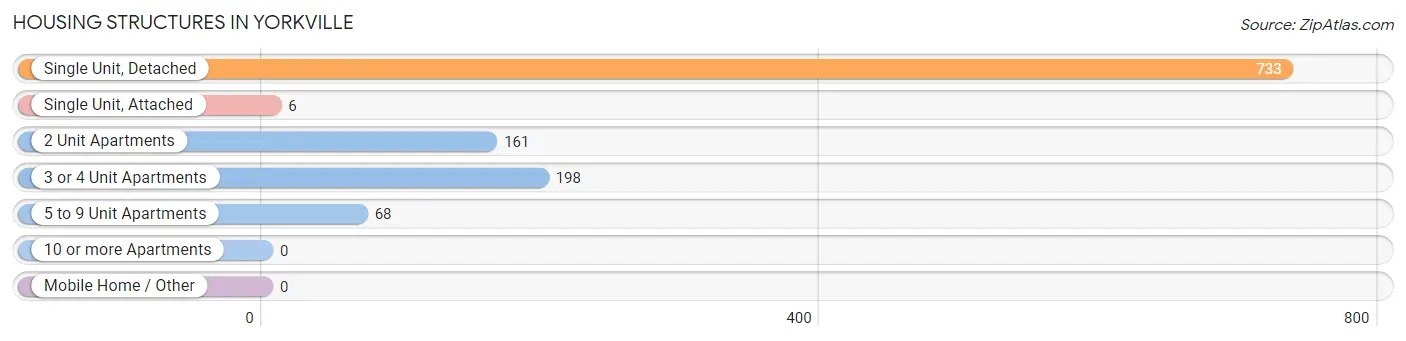
| Structure Type | # Housing Units | % Housing Units |
| Single Unit, Detached | 733 | 62.9% |
| Single Unit, Attached | 6 | 0.5% |
| 2 Unit Apartments | 161 | 13.8% |
| 3 or 4 Unit Apartments | 198 | 17.0% |
| 5 to 9 Unit Apartments | 68 | 5.8% |
| 10 or more Apartments | 0 | 0.0% |
| Mobile Home / Other | 0 | 0.0% |
| Total | 1,166 | 100.0% |
Housing Structures by Occupancy in Yorkville
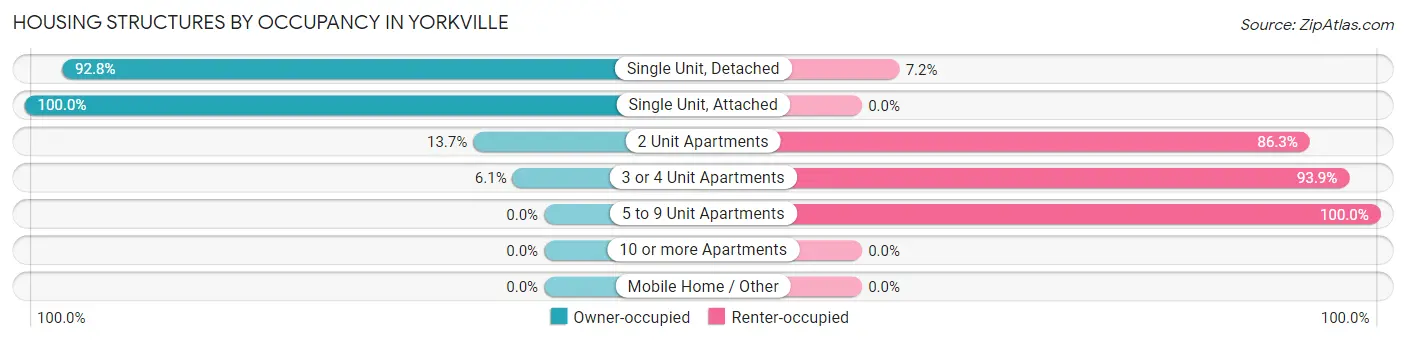
| Structure Type | Owner-occupied | Renter-occupied |
| Single Unit, Detached | 680 (92.8%) | 53 (7.2%) |
| Single Unit, Attached | 6 (100.0%) | 0 (0.0%) |
| 2 Unit Apartments | 22 (13.7%) | 139 (86.3%) |
| 3 or 4 Unit Apartments | 12 (6.1%) | 186 (93.9%) |
| 5 to 9 Unit Apartments | 0 (0.0%) | 68 (100.0%) |
| 10 or more Apartments | 0 (0.0%) | 0 (0.0%) |
| Mobile Home / Other | 0 (0.0%) | 0 (0.0%) |
| Total | 720 (61.8%) | 446 (38.3%) |
Housing Structures by Number of Rooms in Yorkville
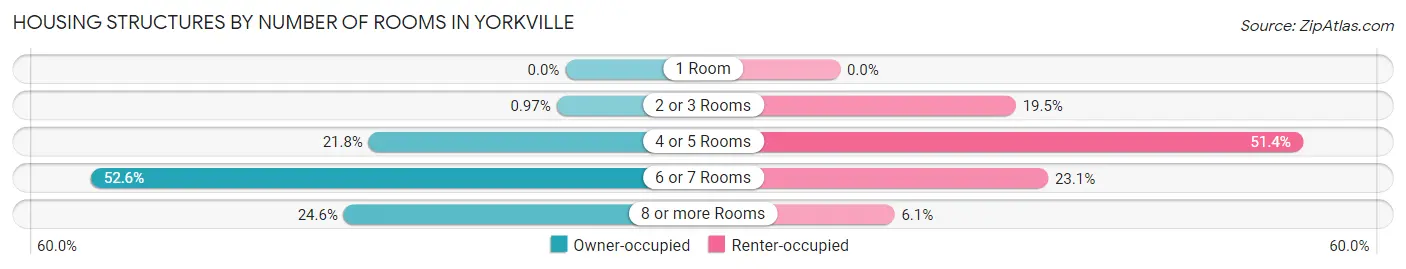
| Number of Rooms | Owner-occupied | Renter-occupied |
| 1 Room | 0 (0.0%) | 0 (0.0%) |
| 2 or 3 Rooms | 7 (1.0%) | 87 (19.5%) |
| 4 or 5 Rooms | 157 (21.8%) | 229 (51.3%) |
| 6 or 7 Rooms | 379 (52.6%) | 103 (23.1%) |
| 8 or more Rooms | 177 (24.6%) | 27 (6.0%) |
| Total | 720 (100.0%) | 446 (100.0%) |
Housing Structure by Heating Type in Yorkville
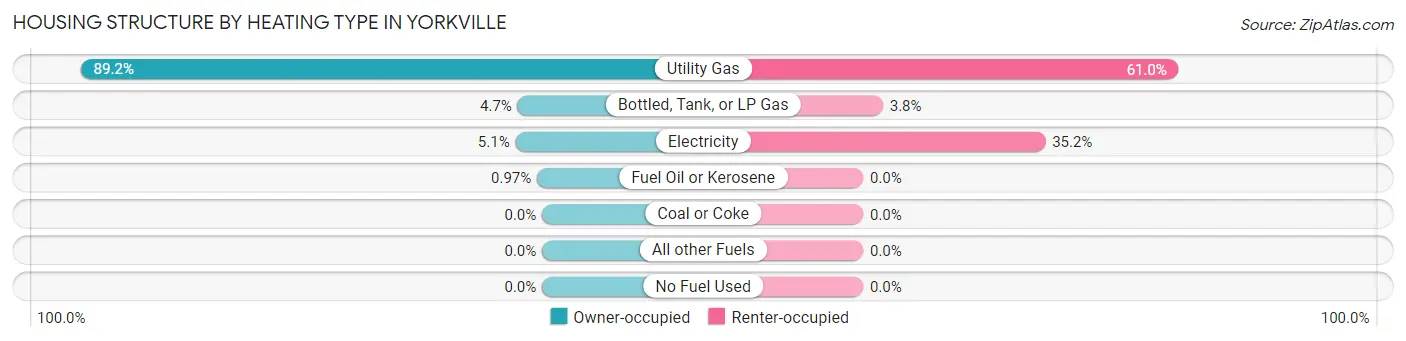
| Heating Type | Owner-occupied | Renter-occupied |
| Utility Gas | 642 (89.2%) | 272 (61.0%) |
| Bottled, Tank, or LP Gas | 34 (4.7%) | 17 (3.8%) |
| Electricity | 37 (5.1%) | 157 (35.2%) |
| Fuel Oil or Kerosene | 7 (1.0%) | 0 (0.0%) |
| Coal or Coke | 0 (0.0%) | 0 (0.0%) |
| All other Fuels | 0 (0.0%) | 0 (0.0%) |
| No Fuel Used | 0 (0.0%) | 0 (0.0%) |
| Total | 720 (100.0%) | 446 (100.0%) |
Household Vehicle Usage in Yorkville
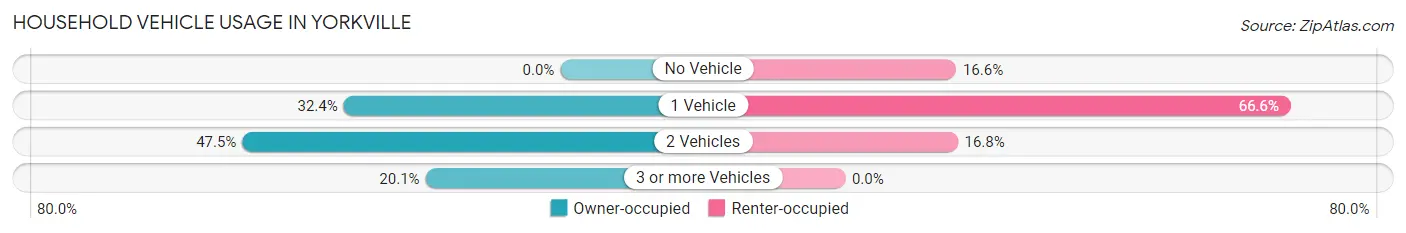
| Vehicles per Household | Owner-occupied | Renter-occupied |
| No Vehicle | 0 (0.0%) | 74 (16.6%) |
| 1 Vehicle | 233 (32.4%) | 297 (66.6%) |
| 2 Vehicles | 342 (47.5%) | 75 (16.8%) |
| 3 or more Vehicles | 145 (20.1%) | 0 (0.0%) |
| Total | 720 (100.0%) | 446 (100.0%) |
Real Estate & Mortgages in Yorkville
Real Estate and Mortgage Overview in Yorkville
| Characteristic | Without Mortgage | With Mortgage |
| Housing Units | 325 | 395 |
| Median Property Value | $117,500 | $112,100 |
| Median Household Income | $60,129 | $46 |
| Monthly Housing Costs | $567 | $10 |
| Real Estate Taxes | $3,386 | $22 |
Property Value by Mortgage Status in Yorkville
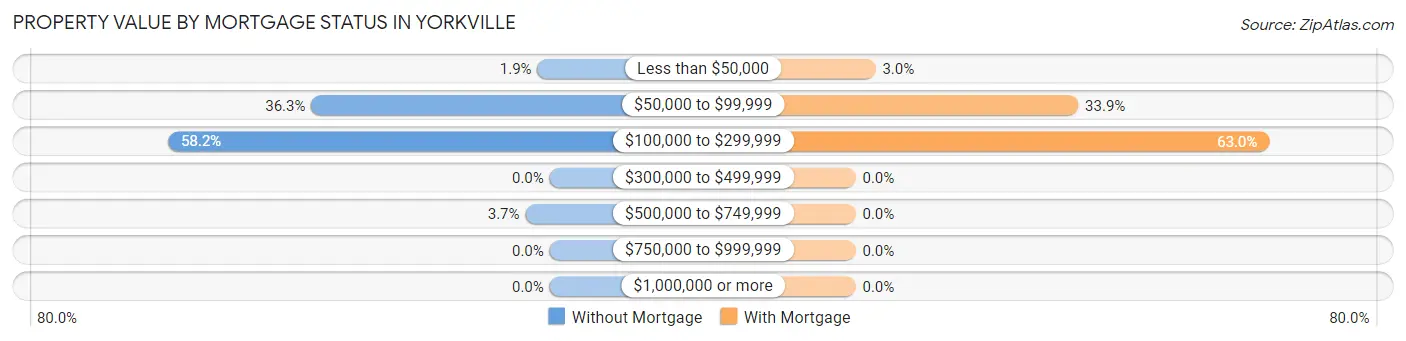
| Property Value | Without Mortgage | With Mortgage |
| Less than $50,000 | 6 (1.8%) | 12 (3.0%) |
| $50,000 to $99,999 | 118 (36.3%) | 134 (33.9%) |
| $100,000 to $299,999 | 189 (58.2%) | 249 (63.0%) |
| $300,000 to $499,999 | 0 (0.0%) | 0 (0.0%) |
| $500,000 to $749,999 | 12 (3.7%) | 0 (0.0%) |
| $750,000 to $999,999 | 0 (0.0%) | 0 (0.0%) |
| $1,000,000 or more | 0 (0.0%) | 0 (0.0%) |
| Total | 325 (100.0%) | 395 (100.0%) |
Household Income by Mortgage Status in Yorkville
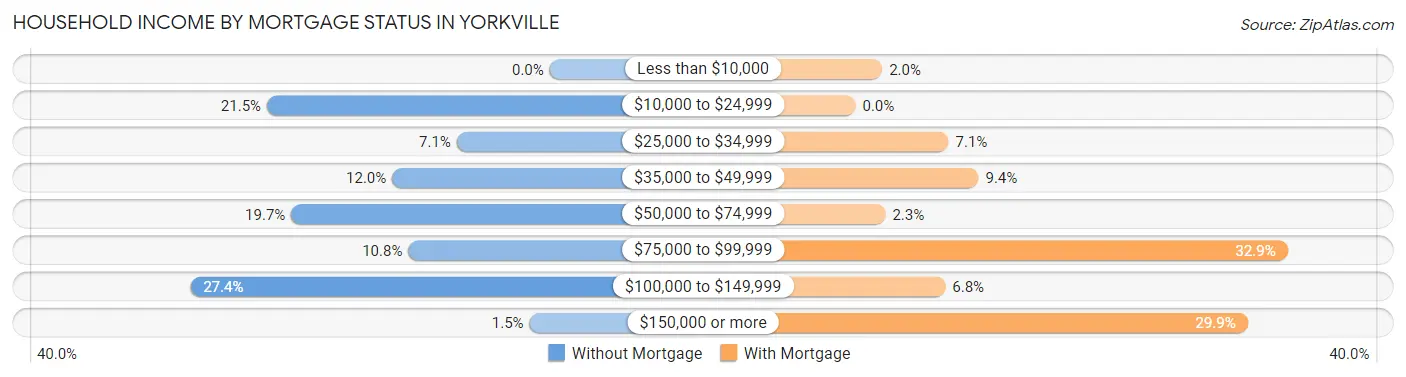
| Household Income | Without Mortgage | With Mortgage |
| Less than $10,000 | 0 (0.0%) | 8 (2.0%) |
| $10,000 to $24,999 | 70 (21.5%) | 0 (0.0%) |
| $25,000 to $34,999 | 23 (7.1%) | 28 (7.1%) |
| $35,000 to $49,999 | 39 (12.0%) | 37 (9.4%) |
| $50,000 to $74,999 | 64 (19.7%) | 9 (2.3%) |
| $75,000 to $99,999 | 35 (10.8%) | 130 (32.9%) |
| $100,000 to $149,999 | 89 (27.4%) | 27 (6.8%) |
| $150,000 or more | 5 (1.5%) | 118 (29.9%) |
| Total | 325 (100.0%) | 395 (100.0%) |
Property Value to Household Income Ratio in Yorkville
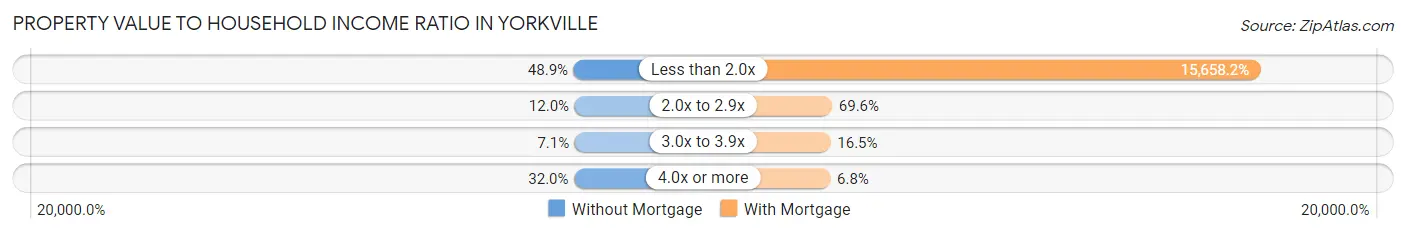
| Value-to-Income Ratio | Without Mortgage | With Mortgage |
| Less than 2.0x | 159 (48.9%) | 61,850 (15,658.2%) |
| 2.0x to 2.9x | 39 (12.0%) | 275 (69.6%) |
| 3.0x to 3.9x | 23 (7.1%) | 65 (16.5%) |
| 4.0x or more | 104 (32.0%) | 27 (6.8%) |
| Total | 325 (100.0%) | 395 (100.0%) |
Real Estate Taxes by Mortgage Status in Yorkville
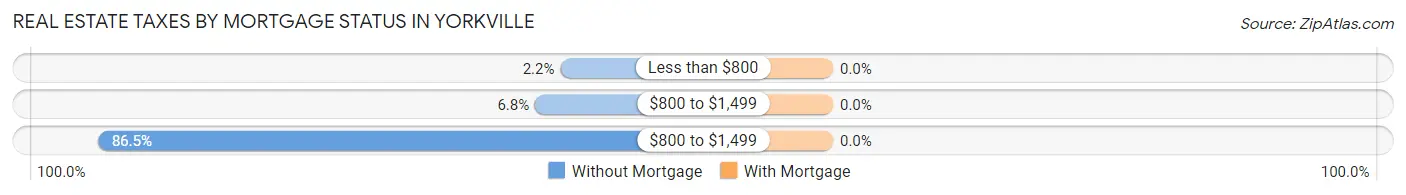
| Property Taxes | Without Mortgage | With Mortgage |
| Less than $800 | 7 (2.1%) | 0 (0.0%) |
| $800 to $1,499 | 22 (6.8%) | 0 (0.0%) |
| $800 to $1,499 | 281 (86.5%) | 0 (0.0%) |
| Total | 325 (100.0%) | 395 (100.0%) |
Health & Disability in Yorkville
Health Insurance Coverage by Age in Yorkville
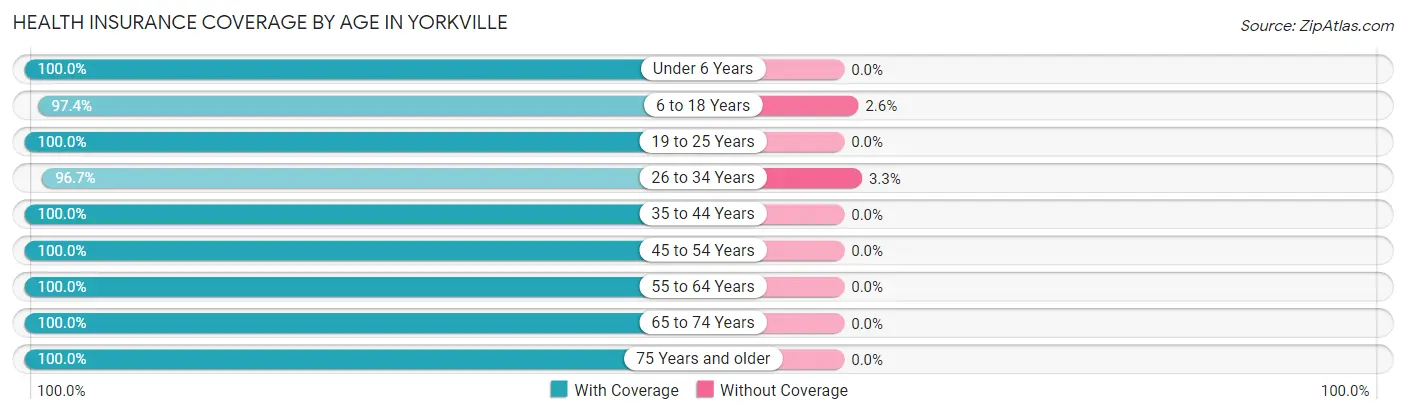
| Age Bracket | With Coverage | Without Coverage |
| Under 6 Years | 178 (100.0%) | 0 (0.0%) |
| 6 to 18 Years | 407 (97.4%) | 11 (2.6%) |
| 19 to 25 Years | 235 (100.0%) | 0 (0.0%) |
| 26 to 34 Years | 411 (96.7%) | 14 (3.3%) |
| 35 to 44 Years | 364 (100.0%) | 0 (0.0%) |
| 45 to 54 Years | 306 (100.0%) | 0 (0.0%) |
| 55 to 64 Years | 330 (100.0%) | 0 (0.0%) |
| 65 to 74 Years | 212 (100.0%) | 0 (0.0%) |
| 75 Years and older | 167 (100.0%) | 0 (0.0%) |
| Total | 2,610 (99.1%) | 25 (0.9%) |
Health Insurance Coverage by Citizenship Status in Yorkville
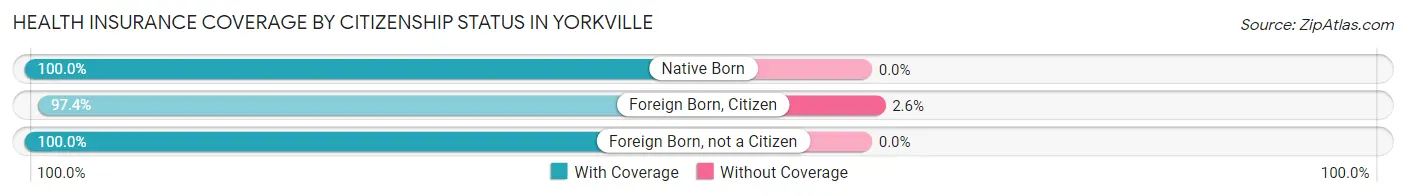
| Citizenship Status | With Coverage | Without Coverage |
| Native Born | 178 (100.0%) | 0 (0.0%) |
| Foreign Born, Citizen | 407 (97.4%) | 11 (2.6%) |
| Foreign Born, not a Citizen | 235 (100.0%) | 0 (0.0%) |
Health Insurance Coverage by Household Income in Yorkville
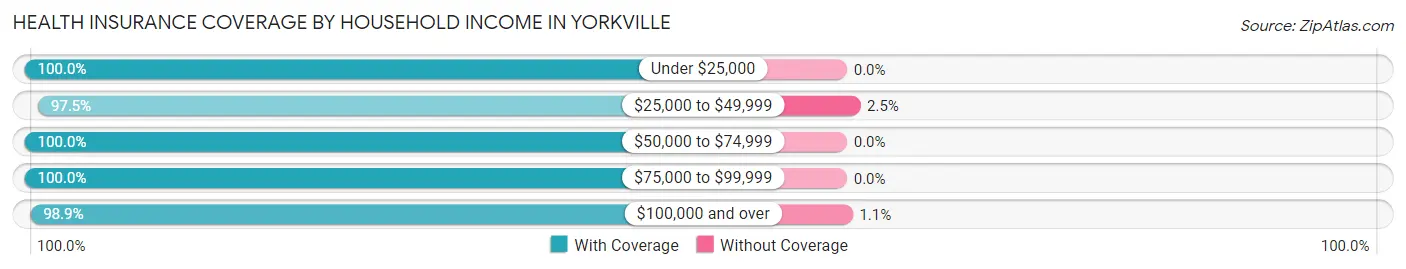
| Household Income | With Coverage | Without Coverage |
| Under $25,000 | 285 (100.0%) | 0 (0.0%) |
| $25,000 to $49,999 | 549 (97.5%) | 14 (2.5%) |
| $50,000 to $74,999 | 446 (100.0%) | 0 (0.0%) |
| $75,000 to $99,999 | 283 (100.0%) | 0 (0.0%) |
| $100,000 and over | 1,031 (98.9%) | 11 (1.1%) |
Public vs Private Health Insurance Coverage by Age in Yorkville
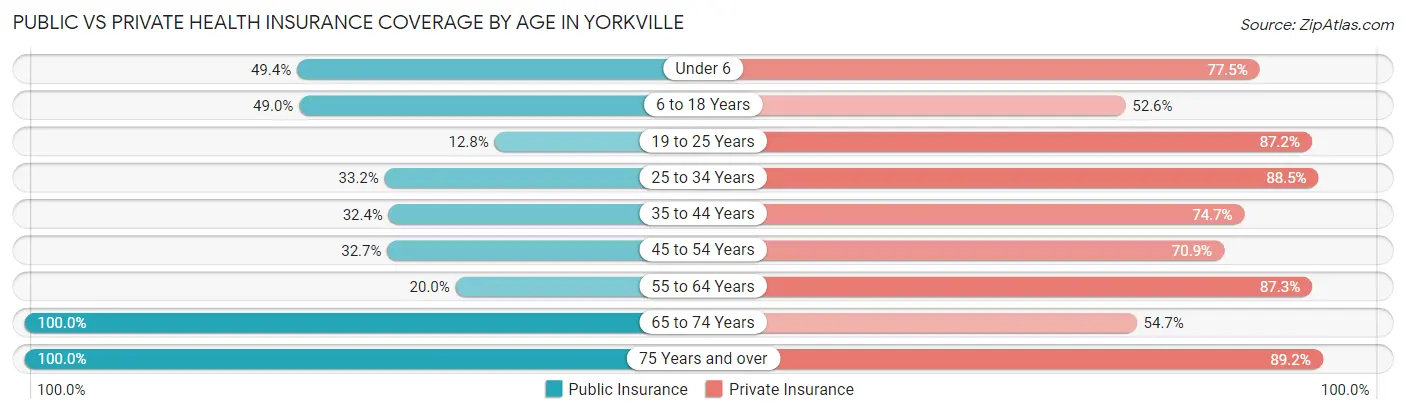
| Age Bracket | Public Insurance | Private Insurance |
| Under 6 | 88 (49.4%) | 138 (77.5%) |
| 6 to 18 Years | 205 (49.0%) | 220 (52.6%) |
| 19 to 25 Years | 30 (12.8%) | 205 (87.2%) |
| 25 to 34 Years | 141 (33.2%) | 376 (88.5%) |
| 35 to 44 Years | 118 (32.4%) | 272 (74.7%) |
| 45 to 54 Years | 100 (32.7%) | 217 (70.9%) |
| 55 to 64 Years | 66 (20.0%) | 288 (87.3%) |
| 65 to 74 Years | 212 (100.0%) | 116 (54.7%) |
| 75 Years and over | 167 (100.0%) | 149 (89.2%) |
| Total | 1,127 (42.8%) | 1,981 (75.2%) |
Disability Status by Sex by Age in Yorkville
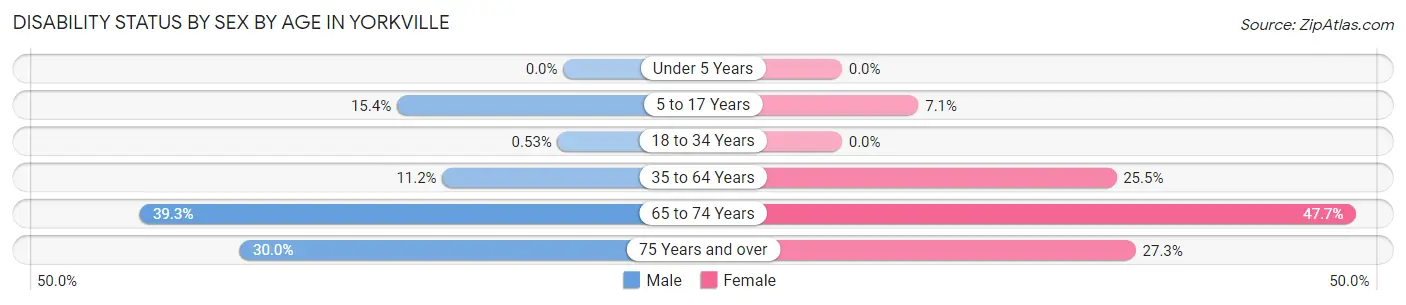
| Age Bracket | Male | Female |
| Under 5 Years | 0 (0.0%) | 0 (0.0%) |
| 5 to 17 Years | 46 (15.4%) | 11 (7.1%) |
| 18 to 34 Years | 2 (0.5%) | 0 (0.0%) |
| 35 to 64 Years | 58 (11.2%) | 123 (25.5%) |
| 65 to 74 Years | 33 (39.3%) | 61 (47.7%) |
| 75 Years and over | 27 (30.0%) | 21 (27.3%) |
Disability Class by Sex by Age in Yorkville
Disability Class: Hearing Difficulty
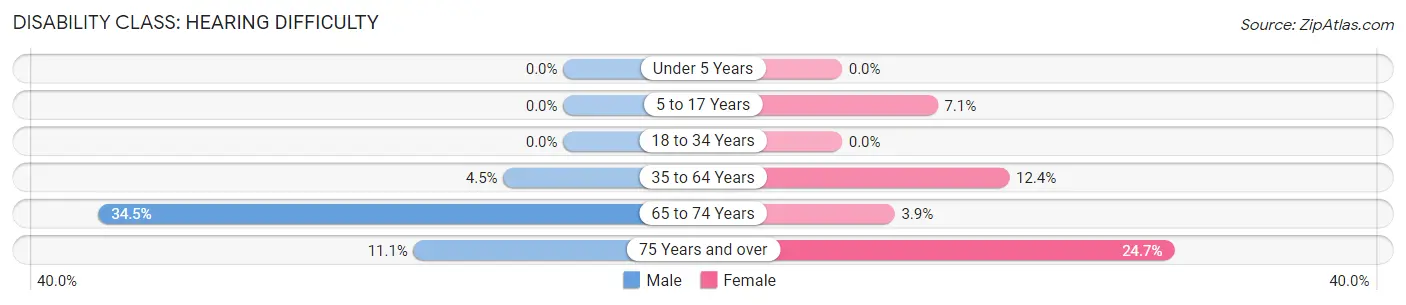
| Age Bracket | Male | Female |
| Under 5 Years | 0 (0.0%) | 0 (0.0%) |
| 5 to 17 Years | 0 (0.0%) | 11 (7.1%) |
| 18 to 34 Years | 0 (0.0%) | 0 (0.0%) |
| 35 to 64 Years | 23 (4.4%) | 60 (12.4%) |
| 65 to 74 Years | 29 (34.5%) | 5 (3.9%) |
| 75 Years and over | 10 (11.1%) | 19 (24.7%) |
Disability Class: Vision Difficulty
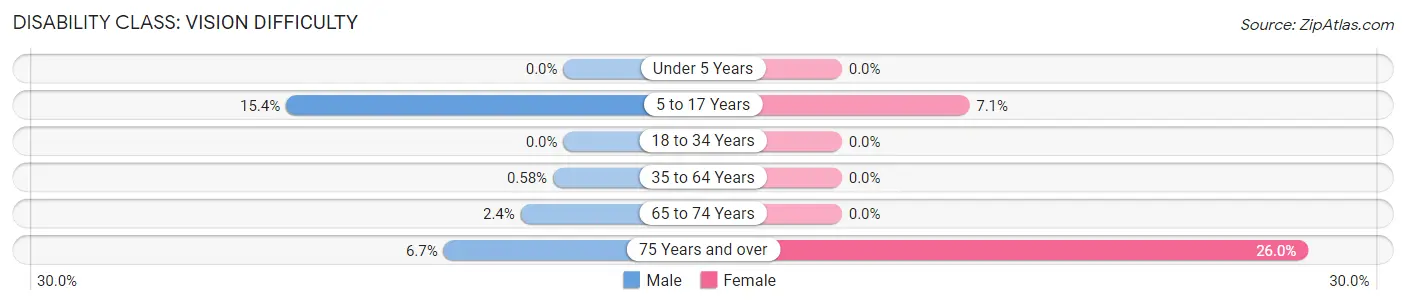
| Age Bracket | Male | Female |
| Under 5 Years | 0 (0.0%) | 0 (0.0%) |
| 5 to 17 Years | 46 (15.4%) | 11 (7.1%) |
| 18 to 34 Years | 0 (0.0%) | 0 (0.0%) |
| 35 to 64 Years | 3 (0.6%) | 0 (0.0%) |
| 65 to 74 Years | 2 (2.4%) | 0 (0.0%) |
| 75 Years and over | 6 (6.7%) | 20 (26.0%) |
Disability Class: Cognitive Difficulty
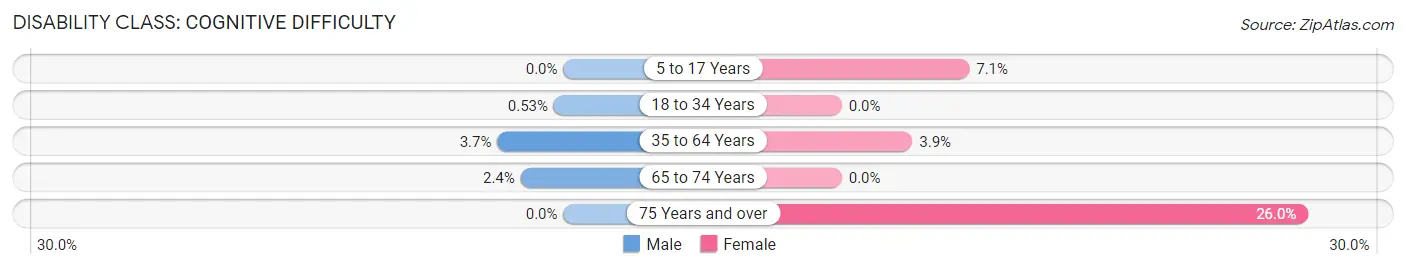
| Age Bracket | Male | Female |
| 5 to 17 Years | 0 (0.0%) | 11 (7.1%) |
| 18 to 34 Years | 2 (0.5%) | 0 (0.0%) |
| 35 to 64 Years | 19 (3.7%) | 19 (3.9%) |
| 65 to 74 Years | 2 (2.4%) | 0 (0.0%) |
| 75 Years and over | 0 (0.0%) | 20 (26.0%) |
Disability Class: Ambulatory Difficulty
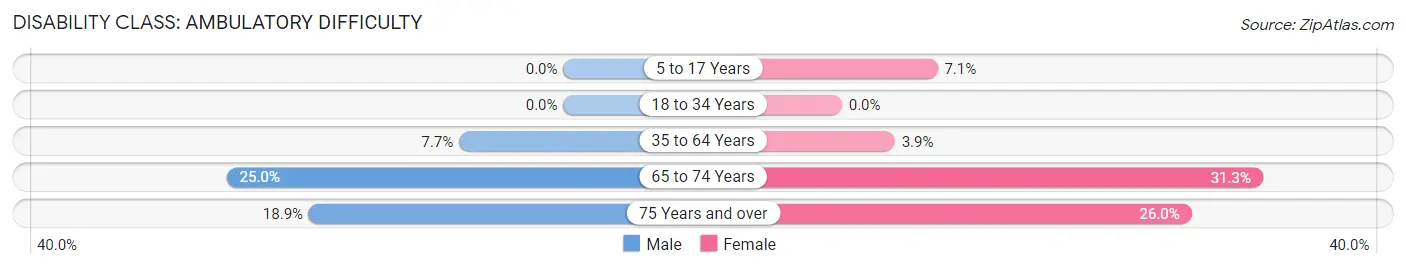
| Age Bracket | Male | Female |
| 5 to 17 Years | 0 (0.0%) | 11 (7.1%) |
| 18 to 34 Years | 0 (0.0%) | 0 (0.0%) |
| 35 to 64 Years | 40 (7.7%) | 19 (3.9%) |
| 65 to 74 Years | 21 (25.0%) | 40 (31.2%) |
| 75 Years and over | 17 (18.9%) | 20 (26.0%) |
Disability Class: Self-Care Difficulty
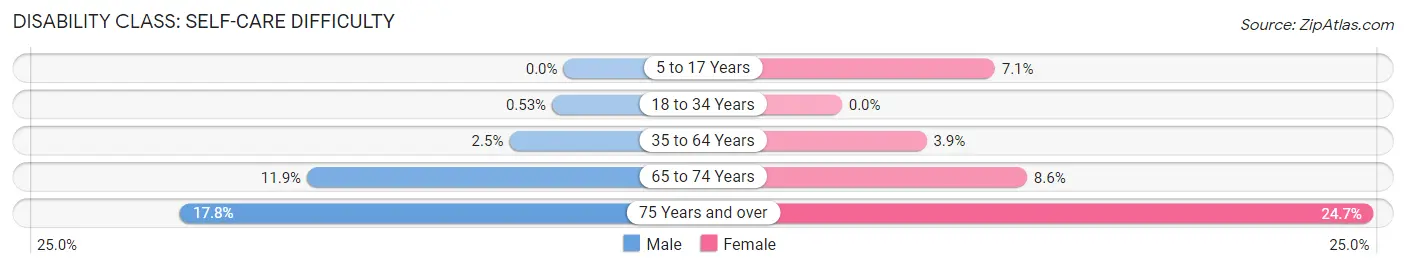
| Age Bracket | Male | Female |
| 5 to 17 Years | 0 (0.0%) | 11 (7.1%) |
| 18 to 34 Years | 2 (0.5%) | 0 (0.0%) |
| 35 to 64 Years | 13 (2.5%) | 19 (3.9%) |
| 65 to 74 Years | 10 (11.9%) | 11 (8.6%) |
| 75 Years and over | 16 (17.8%) | 19 (24.7%) |
Technology Access in Yorkville
Computing Device Access in Yorkville
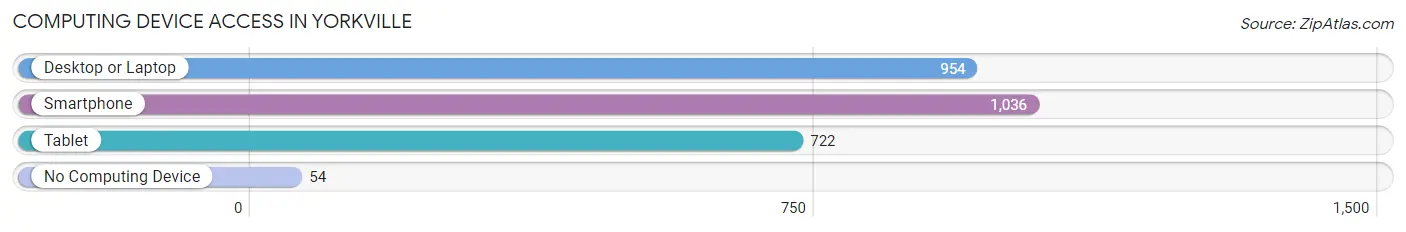
| Device Type | # Households | % Households |
| Desktop or Laptop | 954 | 81.8% |
| Smartphone | 1,036 | 88.8% |
| Tablet | 722 | 61.9% |
| No Computing Device | 54 | 4.6% |
| Total | 1,166 | 100.0% |
Internet Access in Yorkville
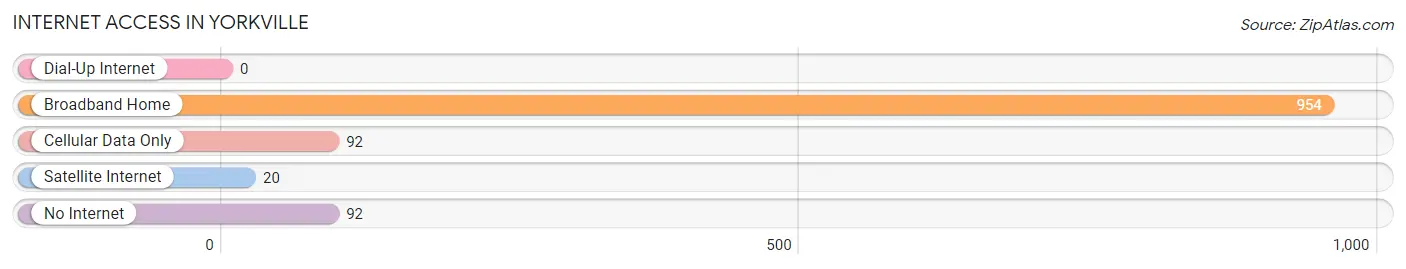
| Internet Type | # Households | % Households |
| Dial-Up Internet | 0 | 0.0% |
| Broadband Home | 954 | 81.8% |
| Cellular Data Only | 92 | 7.9% |
| Satellite Internet | 20 | 1.7% |
| No Internet | 92 | 7.9% |
| Total | 1,166 | 100.0% |
Yorkville Summary
Yorkville is a neighborhood located in the Upper East Side of Manhattan, New York City. It is bounded by East 79th Street to the north, East 96th Street to the south, Third Avenue to the east, and the East River to the west. The neighborhood is part of Manhattan Community Board 8.
History
Yorkville was originally part of the town of York, which was established in 1788. The town was named after the Duke of York, who was the brother of King George III. The town was annexed to the City of New York in 1879.
In the late 19th century, Yorkville was a predominantly German-American neighborhood. It was home to many German immigrants who had come to the United States in search of a better life. The area was known for its many beer gardens and German restaurants.
In the early 20th century, the neighborhood began to change as more immigrants from other countries moved in. By the 1950s, the area had become a predominantly Irish-American neighborhood.
Geography
Yorkville is located in the Upper East Side of Manhattan. It is bounded by East 79th Street to the north, East 96th Street to the south, Third Avenue to the east, and the East River to the west. The neighborhood is part of Manhattan Community Board 8.
The neighborhood is served by the 4, 5, and 6 subway lines, as well as the M15, M31, M86, and M96 bus lines.
Economy
Yorkville is home to a variety of businesses, including restaurants, bars, cafes, and retail stores. The neighborhood is also home to several medical centers, including Memorial Sloan Kettering Cancer Center and New York-Presbyterian Hospital.
Demographics
According to the 2010 United States Census, the population of Yorkville was 28,908. The racial makeup of the neighborhood was 57.3% White, 16.3% African American, 0.2% Native American, 11.2% Asian, 0.1% Pacific Islander, 11.2% from other races, and 4.0% from two or more races.
The median household income in Yorkville was $77,837 in 2017. The median age of residents was 38.7 years. The most common occupations in the neighborhood were in management, business, science, and arts.
Conclusion
Yorkville is a vibrant and diverse neighborhood located in the Upper East Side of Manhattan. It has a rich history, with roots in German and Irish immigration. The neighborhood is home to a variety of businesses, including restaurants, bars, cafes, and retail stores. The population of Yorkville is diverse, with a median household income of $77,837 in 2017.
Common Questions
What is the Total Population of Yorkville?
Total Population of Yorkville is 2,635.
What is the Total Male Population of Yorkville?
Total Male Population of Yorkville is 1,436.
What is the Total Female Population of Yorkville?
Total Female Population of Yorkville is 1,199.
What is the Ratio of Males per 100 Females in Yorkville?
There are 119.77 Males per 100 Females in Yorkville.
What is the Ratio of Females per 100 Males in Yorkville?
There are 83.50 Females per 100 Males in Yorkville.
What is the Median Population Age in Yorkville?
Median Population Age in Yorkville is 36.2 Years.
What is the Average Family Size in Yorkville
Average Family Size in Yorkville is 2.9 People.
What is the Average Household Size in Yorkville
Average Household Size in Yorkville is 2.2 People.
What is Per Capita Income in Yorkville?
Per Capita income in Yorkville is $32,337.
What is the Median Family Income in Yorkville?
Median Family Income in Yorkville is $62,432.
What is the Median Household income in Yorkville?
Median Household Income in Yorkville is $58,414.
What is Income or Wage Gap in Yorkville?
Income or Wage Gap in Yorkville is 9.0%.
Women in Yorkville earn 91.0 cents for every dollar earned by a man.
What is Inequality or Gini Index in Yorkville?
Inequality or Gini Index in Yorkville is 0.35.
How Large is the Labor Force in Yorkville?
There are 1,468 People in the Labor Forcein in Yorkville.
What is the Percentage of People in the Labor Force in Yorkville?
69.1% of People are in the Labor Force in Yorkville.
What is the Unemployment Rate in Yorkville?
Unemployment Rate in Yorkville is 5.5%.