West Valley, NY
West Valley Map
West Valley Overview
495
TOTAL POPULATION
260
MALE POPULATION
235
FEMALE POPULATION
110.64
MALES / 100 FEMALES
90.38
FEMALES / 100 MALES
57.1
MEDIAN AGE
2.9
AVG FAMILY SIZE
2.3
AVG HOUSEHOLD SIZE
$26,813
PER CAPITA INCOME
$66,691
AVG FAMILY INCOME
$55,577
AVG HOUSEHOLD INCOME
17.4%
WAGE / INCOME GAP [ % ]
82.6¢/ $1
WAGE / INCOME GAP [ $ ]
0.38
INEQUALITY / GINI INDEX
202
LABOR FORCE [ PEOPLE ]
48.7%
PERCENT IN LABOR FORCE
West Valley Zip Codes
West Valley Area Codes
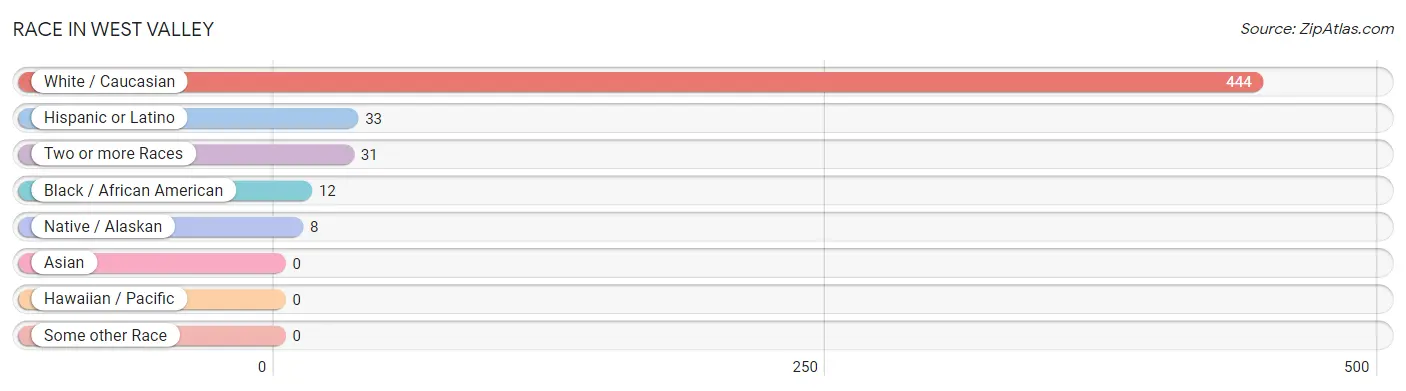
Race in West Valley
The most populous races in West Valley are White / Caucasian (444 | 89.7%), Hispanic or Latino (33 | 6.7%), and Two or more Races (31 | 6.3%).
| Race | # Population | % Population |
| Asian | 0 | 0.0% |
| Black / African American | 12 | 2.4% |
| Hawaiian / Pacific | 0 | 0.0% |
| Hispanic or Latino | 33 | 6.7% |
| Native / Alaskan | 8 | 1.6% |
| White / Caucasian | 444 | 89.7% |
| Two or more Races | 31 | 6.3% |
| Some other Race | 0 | 0.0% |
| Total | 495 | 100.0% |
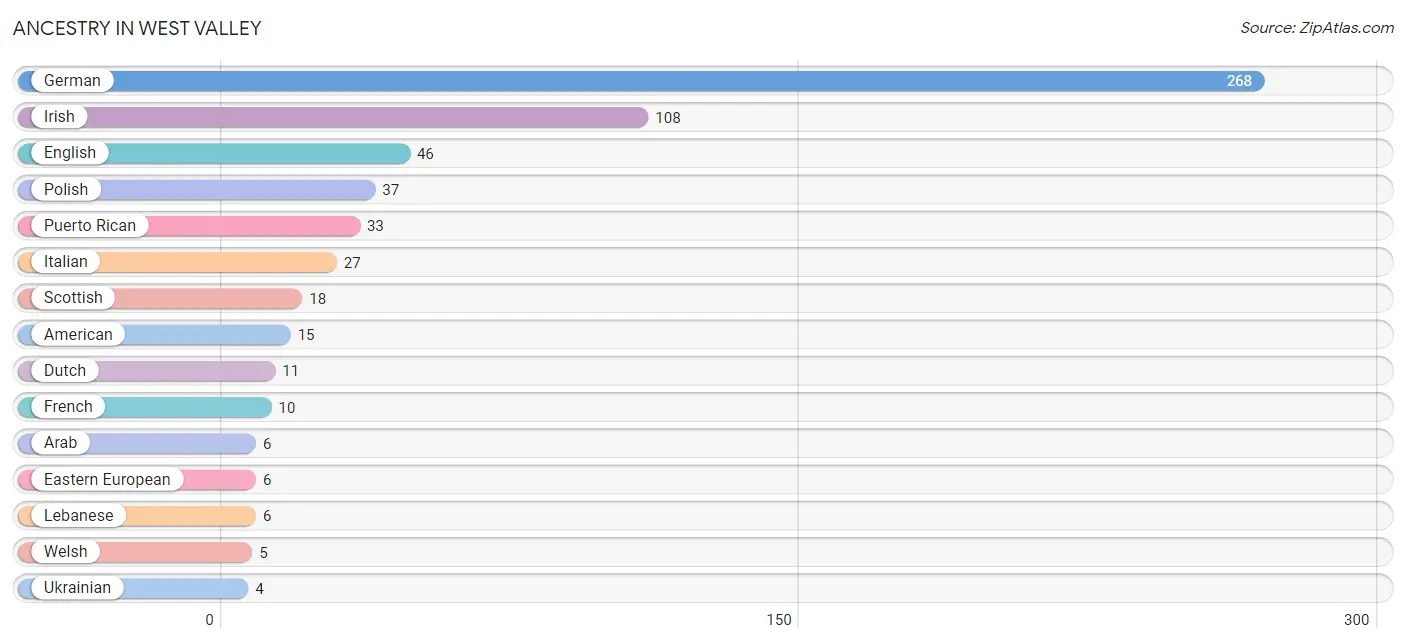
Ancestry in West Valley
The most populous ancestries reported in West Valley are German (268 | 54.1%), Irish (108 | 21.8%), English (46 | 9.3%), Polish (37 | 7.5%), and Puerto Rican (33 | 6.7%), together accounting for 99.4% of all West Valley residents.
| Ancestry | # Population | % Population |
| American | 15 | 3.0% |
| Arab | 6 | 1.2% |
| Dutch | 11 | 2.2% |
| Eastern European | 6 | 1.2% |
| English | 46 | 9.3% |
| French | 10 | 2.0% |
| German | 268 | 54.1% |
| Irish | 108 | 21.8% |
| Italian | 27 | 5.4% |
| Lebanese | 6 | 1.2% |
| Polish | 37 | 7.5% |
| Puerto Rican | 33 | 6.7% |
| Scottish | 18 | 3.6% |
| Ukrainian | 4 | 0.8% |
| Welsh | 5 | 1.0% | View All 15 Rows |
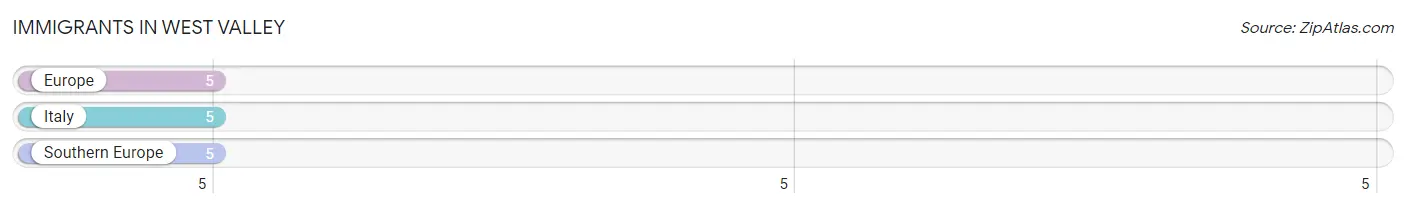
Immigrants in West Valley
The most numerous immigrant groups reported in West Valley came from Europe (5 | 1.0%), Italy (5 | 1.0%), and Southern Europe (5 | 1.0%), together accounting for 3.0% of all West Valley residents.
| Immigration Origin | # Population | % Population |
| Europe | 5 | 1.0% |
| Italy | 5 | 1.0% |
| Southern Europe | 5 | 1.0% | View All 3 Rows |
Sex and Age in West Valley
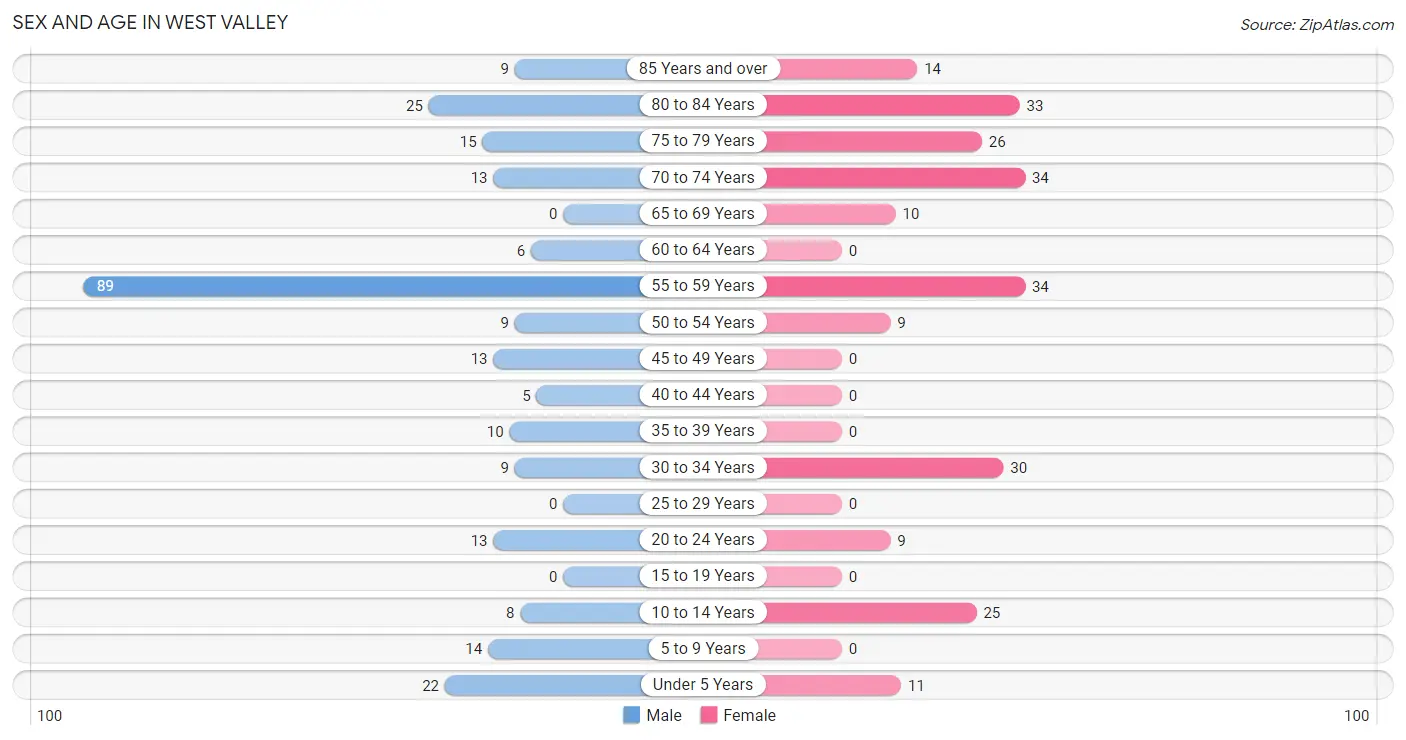
Sex and Age in West Valley
The most populous age groups in West Valley are 55 to 59 Years (89 | 34.2%) for men and 55 to 59 Years (34 | 14.5%) for women.
| Age Bracket | Male | Female |
| Under 5 Years | 22 (8.5%) | 11 (4.7%) |
| 5 to 9 Years | 14 (5.4%) | 0 (0.0%) |
| 10 to 14 Years | 8 (3.1%) | 25 (10.6%) |
| 15 to 19 Years | 0 (0.0%) | 0 (0.0%) |
| 20 to 24 Years | 13 (5.0%) | 9 (3.8%) |
| 25 to 29 Years | 0 (0.0%) | 0 (0.0%) |
| 30 to 34 Years | 9 (3.5%) | 30 (12.8%) |
| 35 to 39 Years | 10 (3.8%) | 0 (0.0%) |
| 40 to 44 Years | 5 (1.9%) | 0 (0.0%) |
| 45 to 49 Years | 13 (5.0%) | 0 (0.0%) |
| 50 to 54 Years | 9 (3.5%) | 9 (3.8%) |
| 55 to 59 Years | 89 (34.2%) | 34 (14.5%) |
| 60 to 64 Years | 6 (2.3%) | 0 (0.0%) |
| 65 to 69 Years | 0 (0.0%) | 10 (4.3%) |
| 70 to 74 Years | 13 (5.0%) | 34 (14.5%) |
| 75 to 79 Years | 15 (5.8%) | 26 (11.1%) |
| 80 to 84 Years | 25 (9.6%) | 33 (14.0%) |
| 85 Years and over | 9 (3.5%) | 14 (6.0%) |
| Total | 260 (100.0%) | 235 (100.0%) |
Families and Households in West Valley
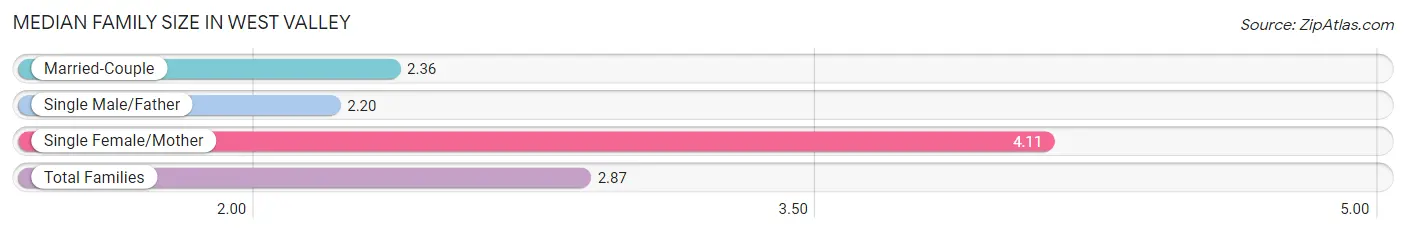
Median Family Size in West Valley
The median family size in West Valley is 2.87 persons per family, with single female/mother families (44 | 29.5%) accounting for the largest median family size of 4.11 persons per family. On the other hand, single male/father families (5 | 3.4%) represent the smallest median family size with 2.20 persons per family.
| Family Type | # Families | Family Size |
| Married-Couple | 100 (67.1%) | 2.36 |
| Single Male/Father | 5 (3.4%) | 2.20 |
| Single Female/Mother | 44 (29.5%) | 4.11 |
| Total Families | 149 (100.0%) | 2.87 |
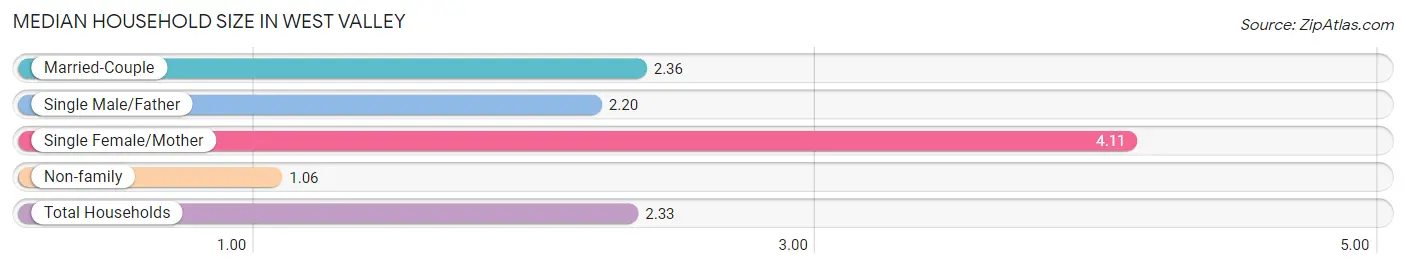
Median Household Size in West Valley
The median household size in West Valley is 2.33 persons per household, with single female/mother households (44 | 20.7%) accounting for the largest median household size of 4.11 persons per household. non-family households (63 | 29.7%) represent the smallest median household size with 1.06 persons per household.
| Household Type | # Households | Household Size |
| Married-Couple | 100 (47.2%) | 2.36 |
| Single Male/Father | 5 (2.4%) | 2.20 |
| Single Female/Mother | 44 (20.7%) | 4.11 |
| Non-family | 63 (29.7%) | 1.06 |
| Total Households | 212 (100.0%) | 2.33 |
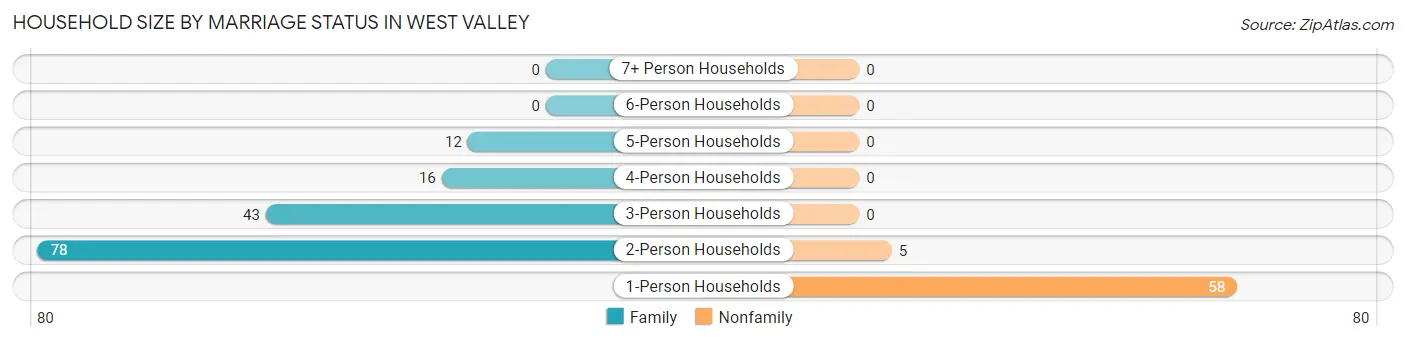
Household Size by Marriage Status in West Valley
Out of a total of 212 households in West Valley, 149 (70.3%) are family households, while 63 (29.7%) are nonfamily households. The most numerous type of family households are 2-person households, comprising 78, and the most common type of nonfamily households are 1-person households, comprising 58.
| Household Size | Family Households | Nonfamily Households |
| 1-Person Households | - | 58 (27.4%) |
| 2-Person Households | 78 (36.8%) | 5 (2.4%) |
| 3-Person Households | 43 (20.3%) | 0 (0.0%) |
| 4-Person Households | 16 (7.5%) | 0 (0.0%) |
| 5-Person Households | 12 (5.7%) | 0 (0.0%) |
| 6-Person Households | 0 (0.0%) | 0 (0.0%) |
| 7+ Person Households | 0 (0.0%) | 0 (0.0%) |
| Total | 149 (70.3%) | 63 (29.7%) |
Female Fertility in West Valley
Fertility by Age in West Valley
Average fertility rate in West Valley is 209.0 births per 1,000 women. Women in the age bracket of 20 to 34 years have the highest fertility rate with 231.0 births per 1,000 women. Women in the age bracket of 20 to 34 years acount for 100.0% of all women with births.
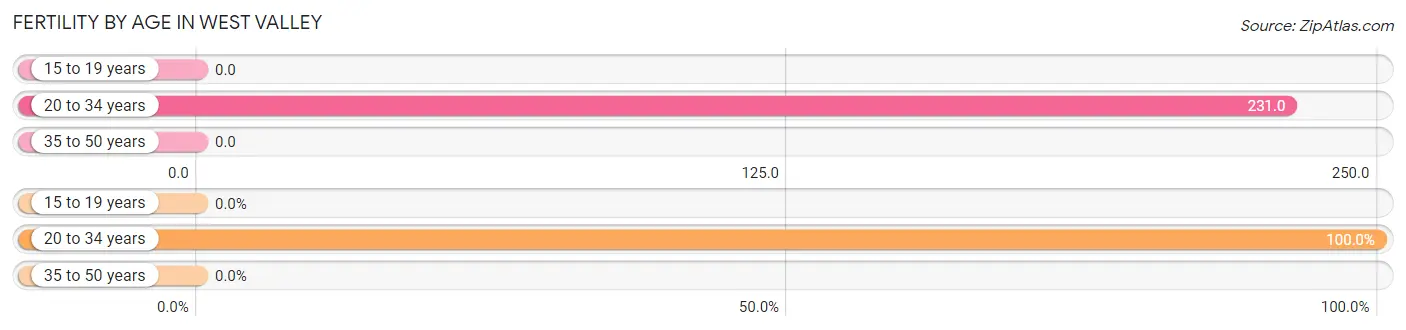
| Age Bracket | Women with Births | Births / 1,000 Women |
| 15 to 19 years | 0 (0.0%) | 0.0 |
| 20 to 34 years | 9 (100.0%) | 231.0 |
| 35 to 50 years | 0 (0.0%) | 0.0 |
| Total | 9 (100.0%) | 209.0 |
Fertility by Age by Marriage Status in West Valley
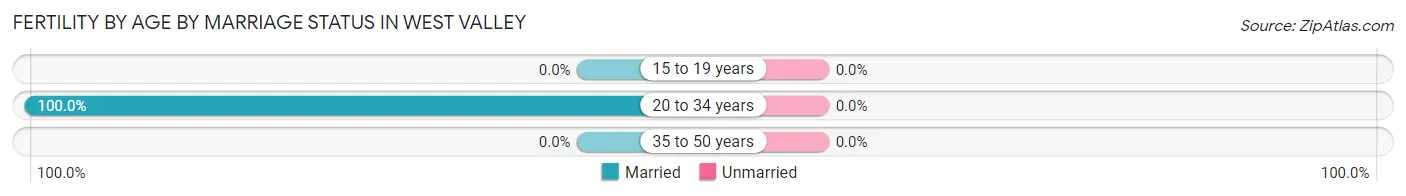
| Age Bracket | Married | Unmarried |
| 15 to 19 years | 0 (0.0%) | 0 (0.0%) |
| 20 to 34 years | 9 (100.0%) | 0 (0.0%) |
| 35 to 50 years | 0 (0.0%) | 0 (0.0%) |
| Total | 9 (100.0%) | 0 (0.0%) |
Fertility by Education in West Valley
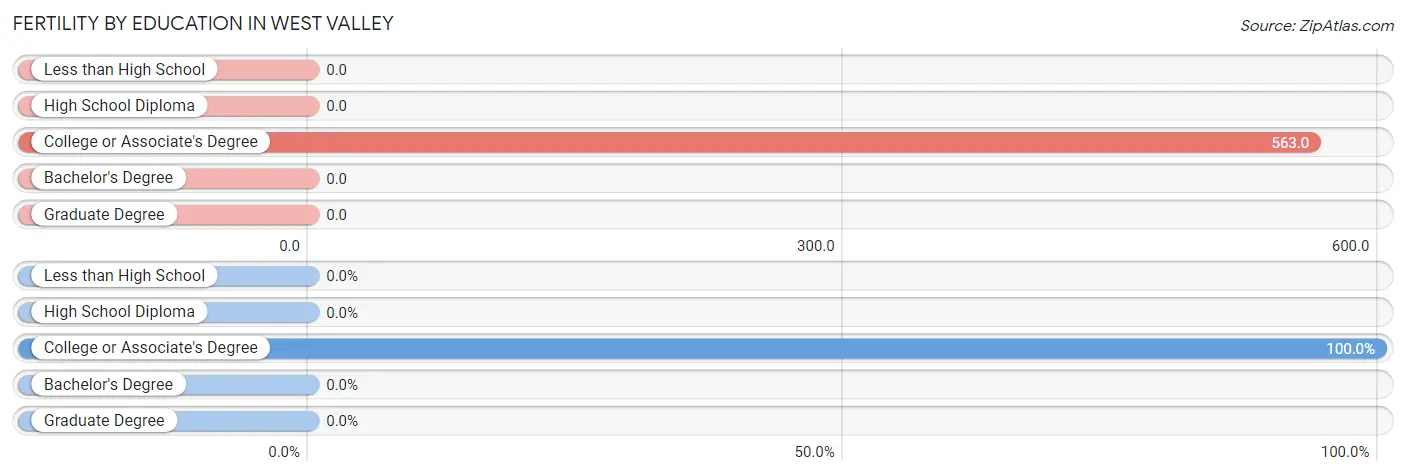
| Educational Attainment | Women with Births | Births / 1,000 Women |
| Less than High School | 0 (0.0%) | 0.0 |
| High School Diploma | 0 (0.0%) | 0.0 |
| College or Associate's Degree | 9 (100.0%) | 563.0 |
| Bachelor's Degree | 0 (0.0%) | 0.0 |
| Graduate Degree | 0 (0.0%) | 0.0 |
| Total | 9 (100.0%) | 209.0 |
Fertility by Education by Marriage Status in West Valley
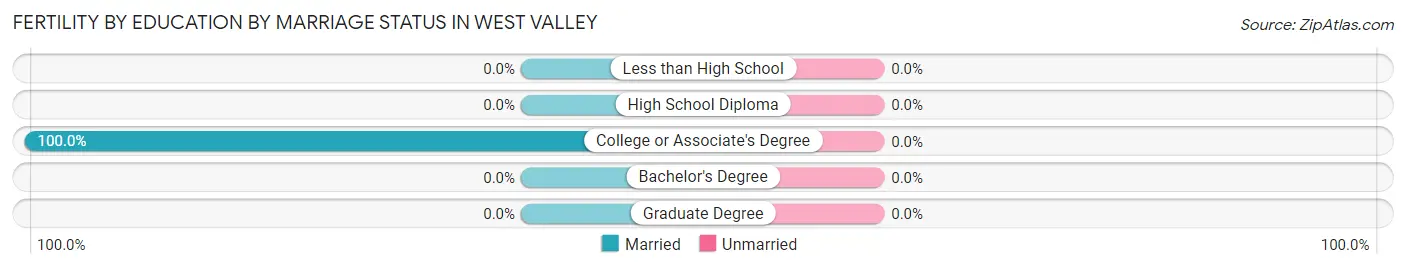
| Educational Attainment | Married | Unmarried |
| Less than High School | 0 (0.0%) | 0 (0.0%) |
| High School Diploma | 0 (0.0%) | 0 (0.0%) |
| College or Associate's Degree | 9 (100.0%) | 0 (0.0%) |
| Bachelor's Degree | 0 (0.0%) | 0 (0.0%) |
| Graduate Degree | 0 (0.0%) | 0 (0.0%) |
| Total | 9 (100.0%) | 0 (0.0%) |
Income in West Valley
Income Overview in West Valley
Per Capita Income in West Valley is $26,813, while median incomes of families and households are $66,691 and $55,577 respectively.
| Characteristic | Number | Measure |
| Per Capita Income | 495 | $26,813 |
| Median Family Income | 149 | $66,691 |
| Mean Family Income | 149 | $75,820 |
| Median Household Income | 212 | $55,577 |
| Mean Household Income | 212 | $60,326 |
| Income Deficit | 149 | $0 |
| Wage / Income Gap (%) | 495 | 17.38% |
| Wage / Income Gap ($) | 495 | 82.62¢ per $1 |
| Gini / Inequality Index | 495 | 0.38 |
Earnings by Sex in West Valley
Average Earnings in West Valley are $29,250, $34,167 for men and $28,229 for women, a difference of 17.4%.
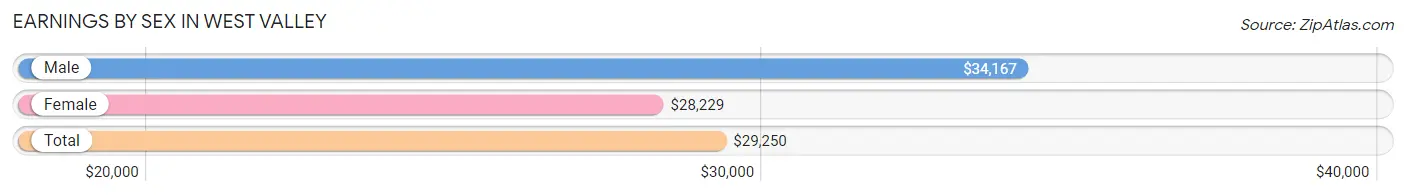
| Sex | Number | Average Earnings |
| Male | 138 (63.0%) | $34,167 |
| Female | 81 (37.0%) | $28,229 |
| Total | 219 (100.0%) | $29,250 |
Earnings by Sex by Income Bracket in West Valley
The most common earnings brackets in West Valley are $25,000 to $29,999 for men (46 | 33.3%) and $25,000 to $29,999 for women (19 | 23.5%).
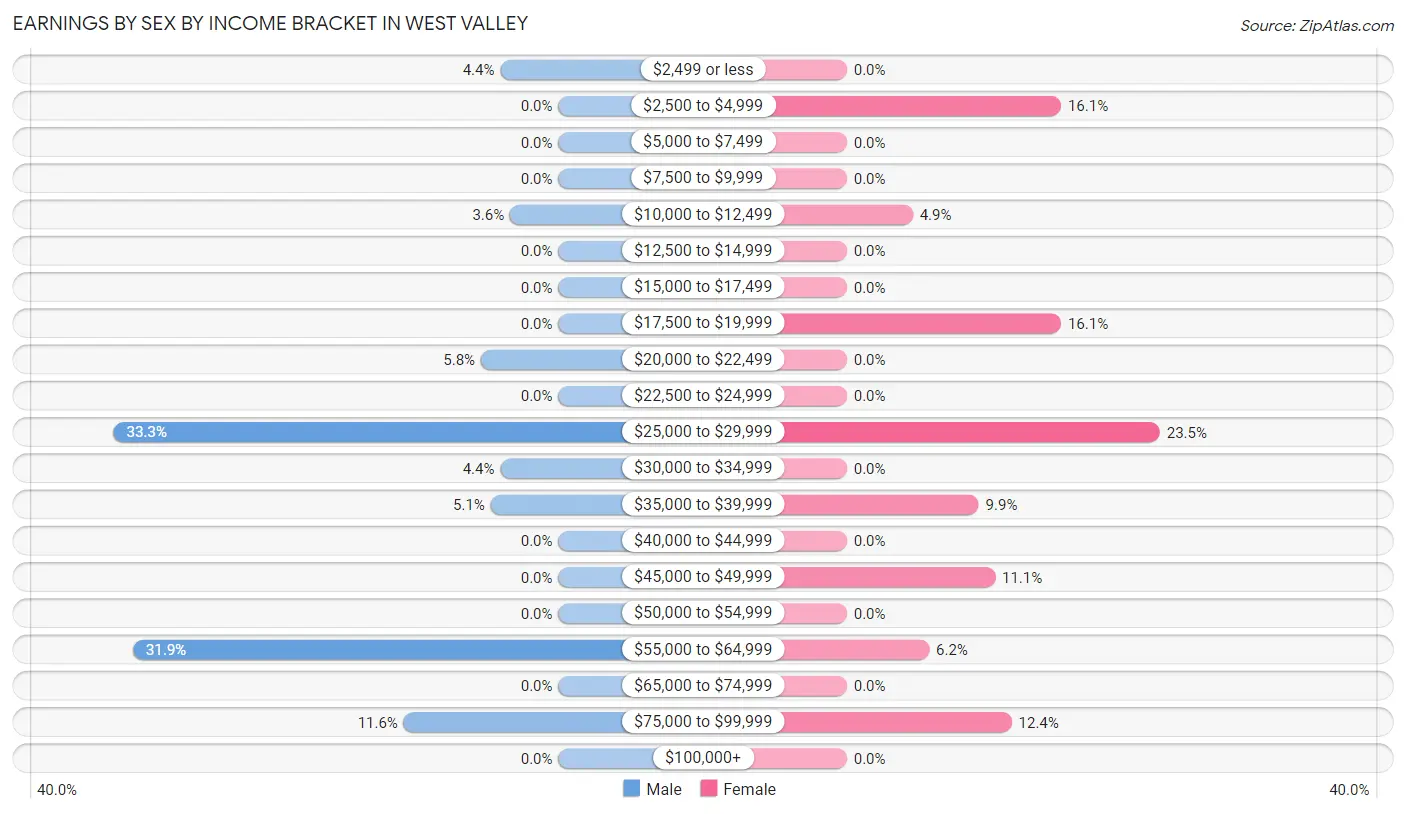
| Income | Male | Female |
| $2,499 or less | 6 (4.3%) | 0 (0.0%) |
| $2,500 to $4,999 | 0 (0.0%) | 13 (16.1%) |
| $5,000 to $7,499 | 0 (0.0%) | 0 (0.0%) |
| $7,500 to $9,999 | 0 (0.0%) | 0 (0.0%) |
| $10,000 to $12,499 | 5 (3.6%) | 4 (4.9%) |
| $12,500 to $14,999 | 0 (0.0%) | 0 (0.0%) |
| $15,000 to $17,499 | 0 (0.0%) | 0 (0.0%) |
| $17,500 to $19,999 | 0 (0.0%) | 13 (16.1%) |
| $20,000 to $22,499 | 8 (5.8%) | 0 (0.0%) |
| $22,500 to $24,999 | 0 (0.0%) | 0 (0.0%) |
| $25,000 to $29,999 | 46 (33.3%) | 19 (23.5%) |
| $30,000 to $34,999 | 6 (4.3%) | 0 (0.0%) |
| $35,000 to $39,999 | 7 (5.1%) | 8 (9.9%) |
| $40,000 to $44,999 | 0 (0.0%) | 0 (0.0%) |
| $45,000 to $49,999 | 0 (0.0%) | 9 (11.1%) |
| $50,000 to $54,999 | 0 (0.0%) | 0 (0.0%) |
| $55,000 to $64,999 | 44 (31.9%) | 5 (6.2%) |
| $65,000 to $74,999 | 0 (0.0%) | 0 (0.0%) |
| $75,000 to $99,999 | 16 (11.6%) | 10 (12.3%) |
| $100,000+ | 0 (0.0%) | 0 (0.0%) |
| Total | 138 (100.0%) | 81 (100.0%) |
Earnings by Sex by Educational Attainment in West Valley
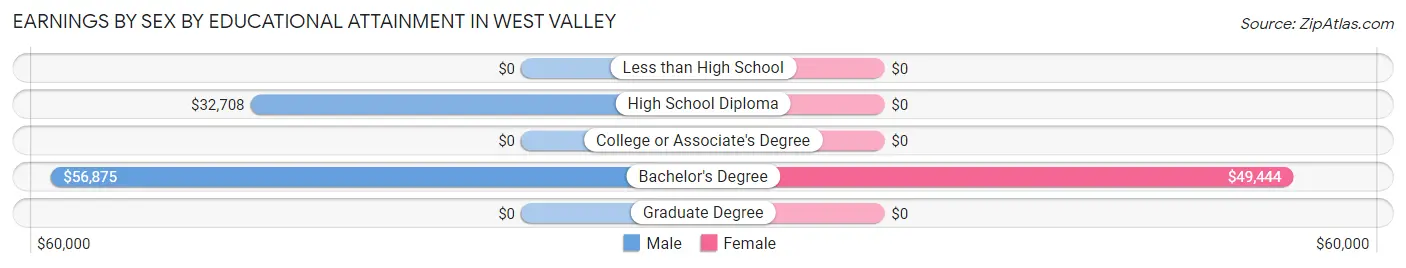
| Educational Attainment | Male Income | Female Income |
| Less than High School | - | - |
| High School Diploma | $32,708 | $0 |
| College or Associate's Degree | - | - |
| Bachelor's Degree | $56,875 | $49,444 |
| Graduate Degree | - | - |
| Total | - | - |
Family Income in West Valley
Family Income Brackets in West Valley
According to the West Valley family income data, there are 48 families falling into the $50,000 to $74,999 income range, which is the most common income bracket and makes up 32.2% of all families.
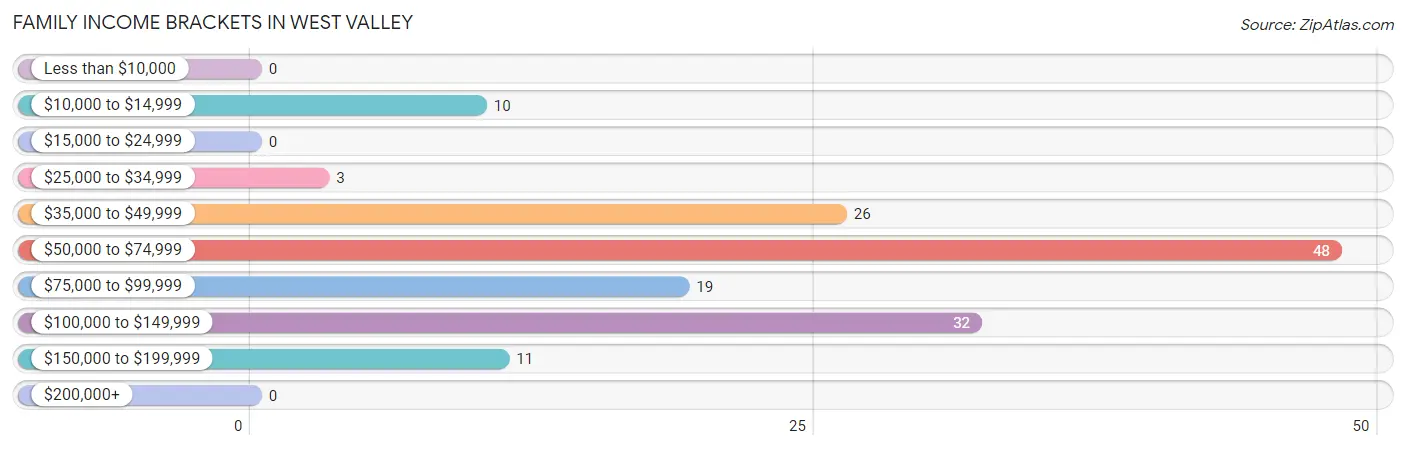
| Income Bracket | # Families | % Families |
| Less than $10,000 | 0 | 0.0% |
| $10,000 to $14,999 | 10 | 6.7% |
| $15,000 to $24,999 | 0 | 0.0% |
| $25,000 to $34,999 | 3 | 2.0% |
| $35,000 to $49,999 | 26 | 17.4% |
| $50,000 to $74,999 | 48 | 32.2% |
| $75,000 to $99,999 | 19 | 12.8% |
| $100,000 to $149,999 | 32 | 21.5% |
| $150,000 to $199,999 | 11 | 7.4% |
| $200,000+ | 0 | 0.0% |
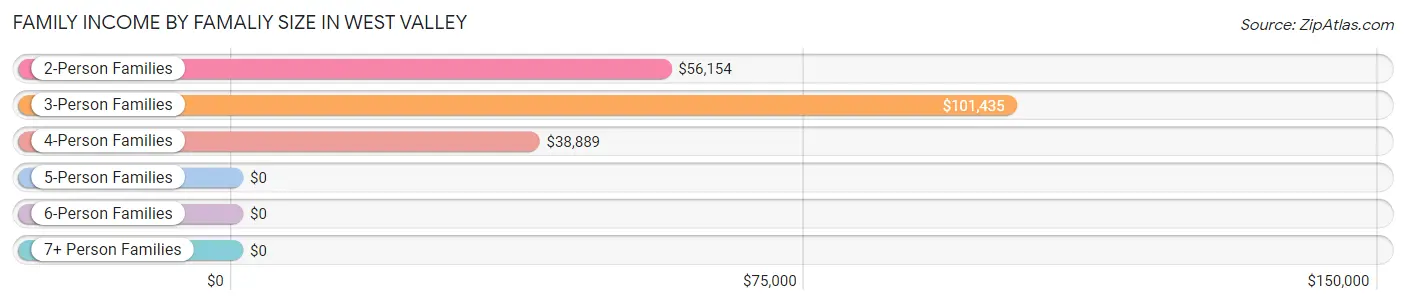
Family Income by Famaliy Size in West Valley
3-person families (43 | 28.9%) account for the highest median family income in West Valley with $101,435 per family, while 3-person families (43 | 28.9%) have the highest median income of $33,812 per family member.
| Income Bracket | # Families | Median Income |
| 2-Person Families | 78 (52.3%) | $56,154 |
| 3-Person Families | 43 (28.9%) | $101,435 |
| 4-Person Families | 16 (10.7%) | $38,889 |
| 5-Person Families | 12 (8.1%) | $0 |
| 6-Person Families | 0 (0.0%) | $0 |
| 7+ Person Families | 0 (0.0%) | $0 |
| Total | 149 (100.0%) | $66,691 |
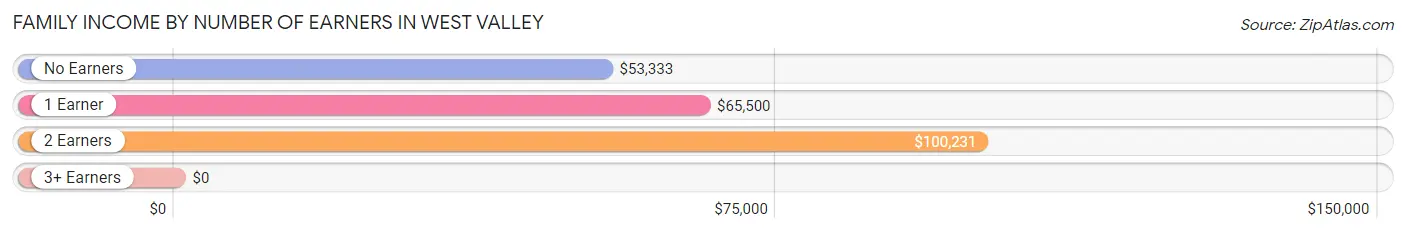
Family Income by Number of Earners in West Valley
| Number of Earners | # Families | Median Income |
| No Earners | 50 (33.6%) | $53,333 |
| 1 Earner | 28 (18.8%) | $65,500 |
| 2 Earners | 61 (40.9%) | $100,231 |
| 3+ Earners | 10 (6.7%) | $0 |
| Total | 149 (100.0%) | $66,691 |
Household Income in West Valley
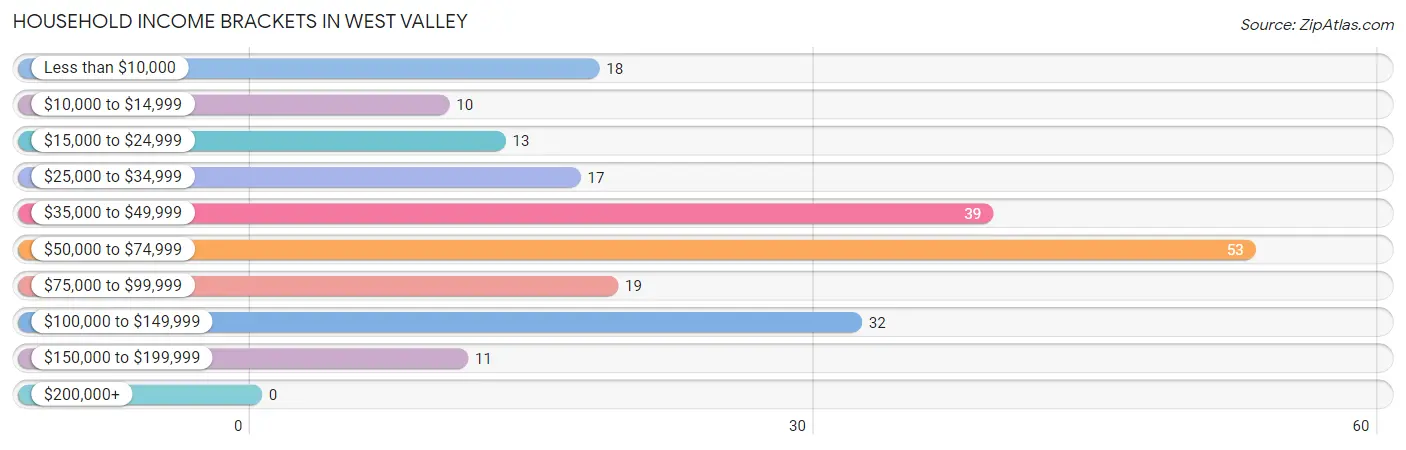
Household Income Brackets in West Valley
With 53 households falling in the category, the $50,000 to $74,999 income range is the most frequent in West Valley, accounting for 25.0% of all households.
| Income Bracket | # Households | % Households |
| Less than $10,000 | 18 | 8.5% |
| $10,000 to $14,999 | 10 | 4.7% |
| $15,000 to $24,999 | 13 | 6.1% |
| $25,000 to $34,999 | 17 | 8.0% |
| $35,000 to $49,999 | 39 | 18.4% |
| $50,000 to $74,999 | 53 | 25.0% |
| $75,000 to $99,999 | 19 | 9.0% |
| $100,000 to $149,999 | 32 | 15.1% |
| $150,000 to $199,999 | 11 | 5.2% |
| $200,000+ | 0 | 0.0% |
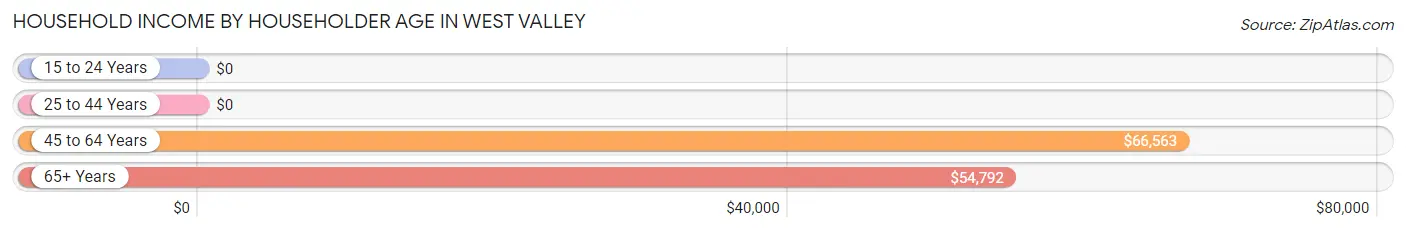
Household Income by Householder Age in West Valley
The median household income in West Valley is $55,577, with the highest median household income of $66,563 found in the 45 to 64 years age bracket for the primary householder. A total of 49 households (23.1%) fall into this category. Meanwhile, the 15 to 24 years age bracket for the primary householder has the lowest median household income of $0, with 9 households (4.3%) in this group.
| Income Bracket | # Households | Median Income |
| 15 to 24 Years | 9 (4.3%) | $0 |
| 25 to 44 Years | 21 (9.9%) | $0 |
| 45 to 64 Years | 49 (23.1%) | $66,563 |
| 65+ Years | 133 (62.7%) | $54,792 |
| Total | 212 (100.0%) | $55,577 |
Poverty in West Valley
Income Below Poverty by Sex and Age in West Valley
With 6.5% poverty level for males and 9.8% for females among the residents of West Valley, 75 year old and over males and 65 to 74 year old females are the most vulnerable to poverty, with 11 males (22.5%) and 18 females (40.9%) in their respective age groups living below the poverty level.
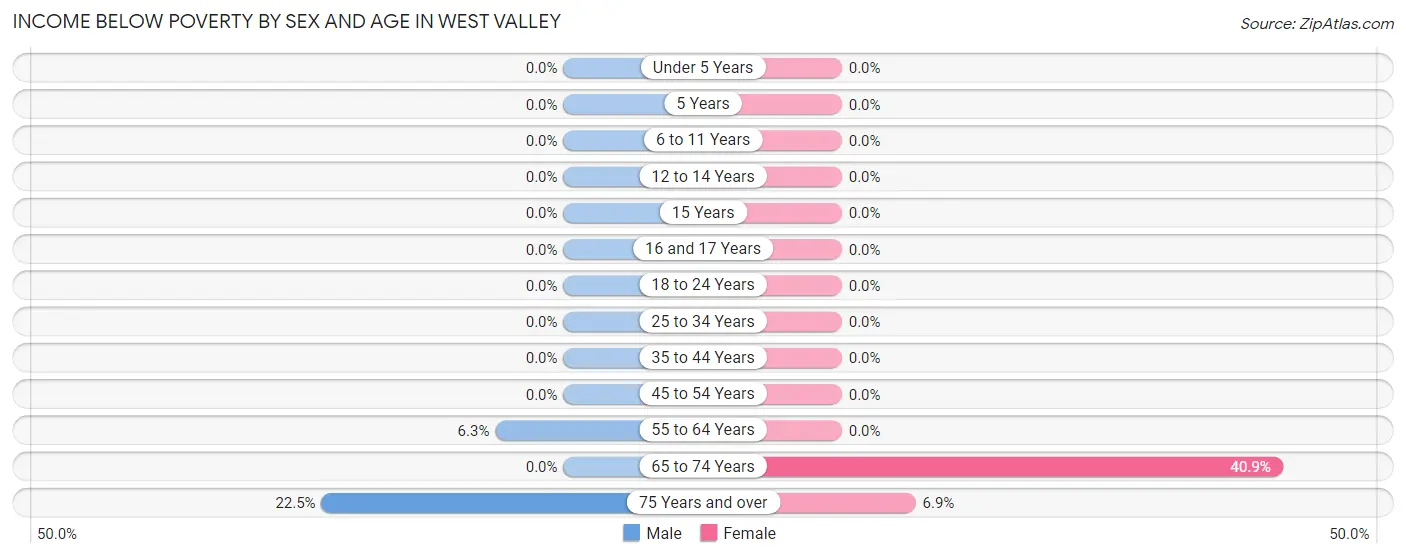
| Age Bracket | Male | Female |
| Under 5 Years | 0 (0.0%) | 0 (0.0%) |
| 5 Years | 0 (0.0%) | 0 (0.0%) |
| 6 to 11 Years | 0 (0.0%) | 0 (0.0%) |
| 12 to 14 Years | 0 (0.0%) | 0 (0.0%) |
| 15 Years | 0 (0.0%) | 0 (0.0%) |
| 16 and 17 Years | 0 (0.0%) | 0 (0.0%) |
| 18 to 24 Years | 0 (0.0%) | 0 (0.0%) |
| 25 to 34 Years | 0 (0.0%) | 0 (0.0%) |
| 35 to 44 Years | 0 (0.0%) | 0 (0.0%) |
| 45 to 54 Years | 0 (0.0%) | 0 (0.0%) |
| 55 to 64 Years | 6 (6.3%) | 0 (0.0%) |
| 65 to 74 Years | 0 (0.0%) | 18 (40.9%) |
| 75 Years and over | 11 (22.5%) | 5 (6.9%) |
| Total | 17 (6.5%) | 23 (9.8%) |
Income Above Poverty by Sex and Age in West Valley
According to the poverty statistics in West Valley, males aged under 5 years and females aged under 5 years are the age groups that are most secure financially, with 100.0% of males and 100.0% of females in these age groups living above the poverty line.
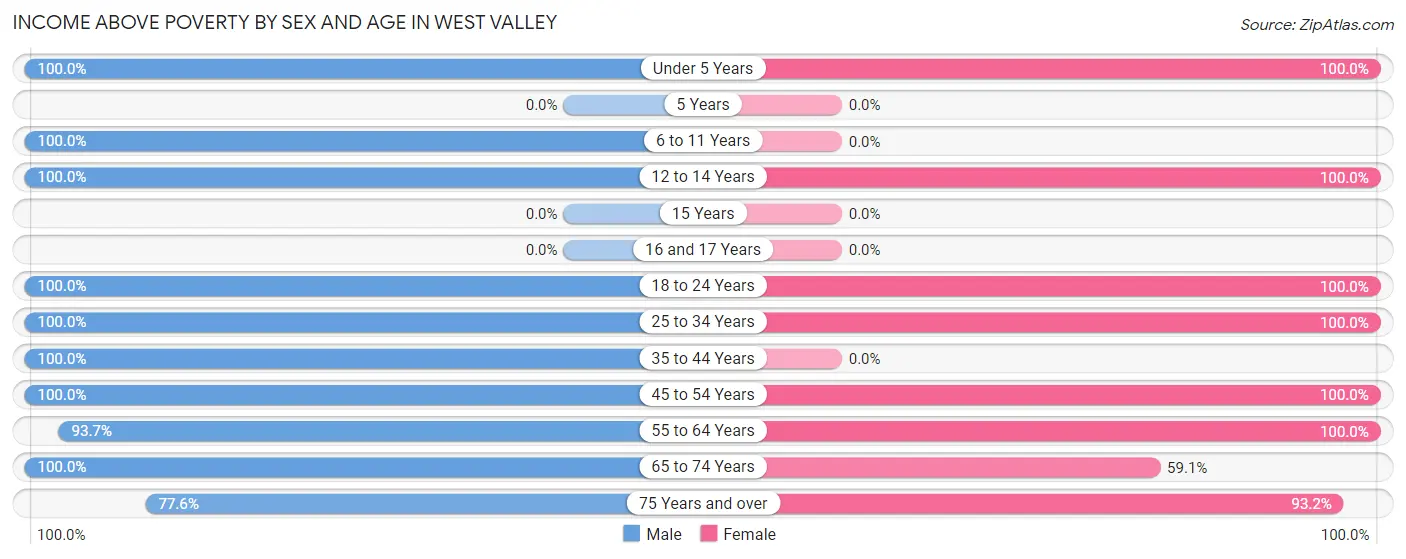
| Age Bracket | Male | Female |
| Under 5 Years | 22 (100.0%) | 11 (100.0%) |
| 5 Years | 0 (0.0%) | 0 (0.0%) |
| 6 to 11 Years | 14 (100.0%) | 0 (0.0%) |
| 12 to 14 Years | 8 (100.0%) | 25 (100.0%) |
| 15 Years | 0 (0.0%) | 0 (0.0%) |
| 16 and 17 Years | 0 (0.0%) | 0 (0.0%) |
| 18 to 24 Years | 13 (100.0%) | 9 (100.0%) |
| 25 to 34 Years | 9 (100.0%) | 30 (100.0%) |
| 35 to 44 Years | 15 (100.0%) | 0 (0.0%) |
| 45 to 54 Years | 22 (100.0%) | 9 (100.0%) |
| 55 to 64 Years | 89 (93.7%) | 34 (100.0%) |
| 65 to 74 Years | 13 (100.0%) | 26 (59.1%) |
| 75 Years and over | 38 (77.5%) | 68 (93.1%) |
| Total | 243 (93.5%) | 212 (90.2%) |
Income Below Poverty Among Married-Couple Families in West Valley
The poverty statistics for married-couple families in West Valley show that 5.0% or 5 of the total 100 families live below the poverty line. Families with no children have the highest poverty rate of 6.4%, comprising of 5 families. On the other hand, families with 1 or 2 children have the lowest poverty rate of 0.0%, which includes 0 families.
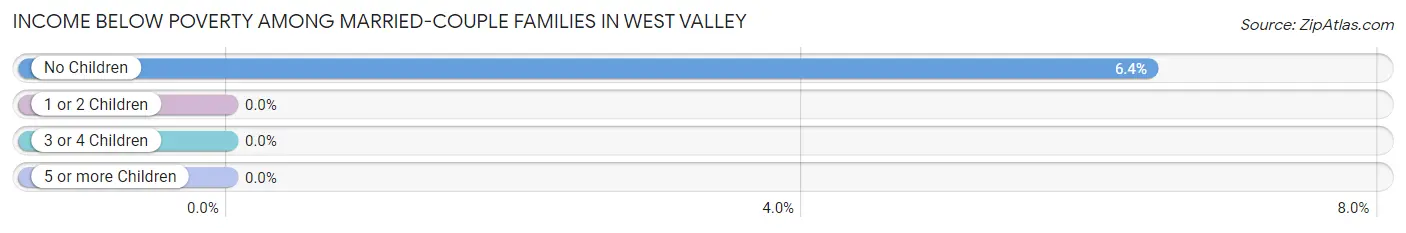
| Children | Above Poverty | Below Poverty |
| No Children | 73 (93.6%) | 5 (6.4%) |
| 1 or 2 Children | 22 (100.0%) | 0 (0.0%) |
| 3 or 4 Children | 0 (0.0%) | 0 (0.0%) |
| 5 or more Children | 0 (0.0%) | 0 (0.0%) |
| Total | 95 (95.0%) | 5 (5.0%) |
Income Below Poverty Among Single-Parent Households in West Valley
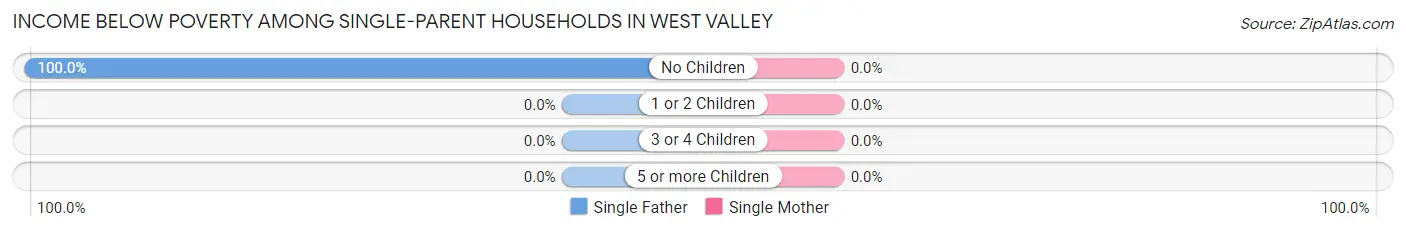
| Children | Single Father | Single Mother |
| No Children | 5 (100.0%) | 0 (0.0%) |
| 1 or 2 Children | 0 (0.0%) | 0 (0.0%) |
| 3 or 4 Children | 0 (0.0%) | 0 (0.0%) |
| 5 or more Children | 0 (0.0%) | 0 (0.0%) |
| Total | 5 (100.0%) | 0 (0.0%) |
Income Below Poverty Among Married-Couple vs Single-Parent Households in West Valley
The poverty data for West Valley shows that 5 of the married-couple family households (5.0%) and 5 of the single-parent households (10.2%) are living below the poverty level. Within the married-couple family households, those with no children have the highest poverty rate, with 5 households (6.4%) falling below the poverty line. Among the single-parent households, those with no children have the highest poverty rate, with 5 household (13.5%) living below poverty.
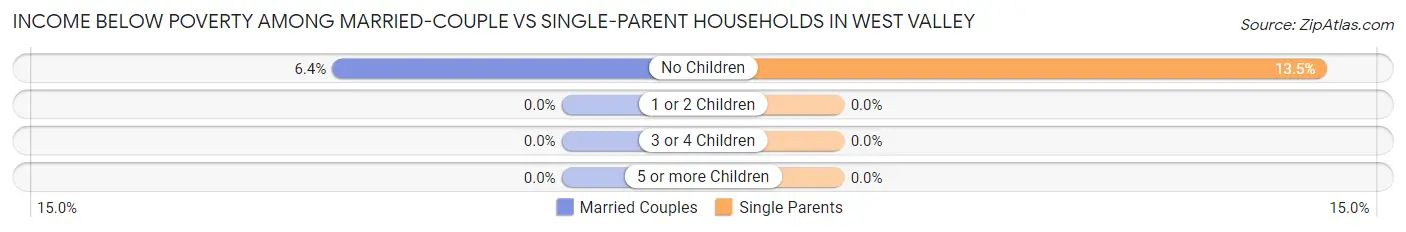
| Children | Married-Couple Families | Single-Parent Households |
| No Children | 5 (6.4%) | 5 (13.5%) |
| 1 or 2 Children | 0 (0.0%) | 0 (0.0%) |
| 3 or 4 Children | 0 (0.0%) | 0 (0.0%) |
| 5 or more Children | 0 (0.0%) | 0 (0.0%) |
| Total | 5 (5.0%) | 5 (10.2%) |
Employment Characteristics in West Valley
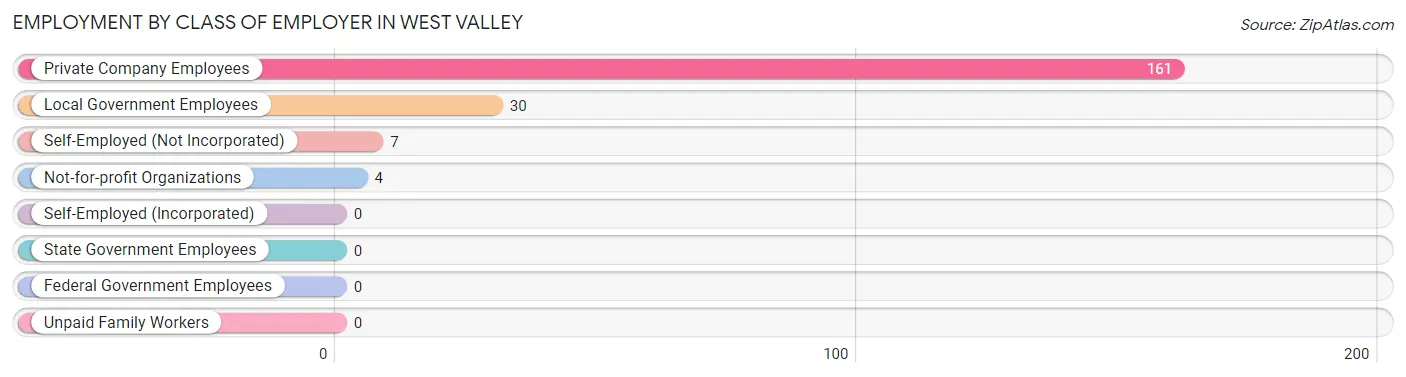
Employment by Class of Employer in West Valley
Among the 202 employed individuals in West Valley, private company employees (161 | 79.7%), local government employees (30 | 14.8%), and self-employed (not incorporated) (7 | 3.5%) make up the most common classes of employment.
| Employer Class | # Employees | % Employees |
| Private Company Employees | 161 | 79.7% |
| Self-Employed (Incorporated) | 0 | 0.0% |
| Self-Employed (Not Incorporated) | 7 | 3.5% |
| Not-for-profit Organizations | 4 | 2.0% |
| Local Government Employees | 30 | 14.8% |
| State Government Employees | 0 | 0.0% |
| Federal Government Employees | 0 | 0.0% |
| Unpaid Family Workers | 0 | 0.0% |
| Total | 202 | 100.0% |
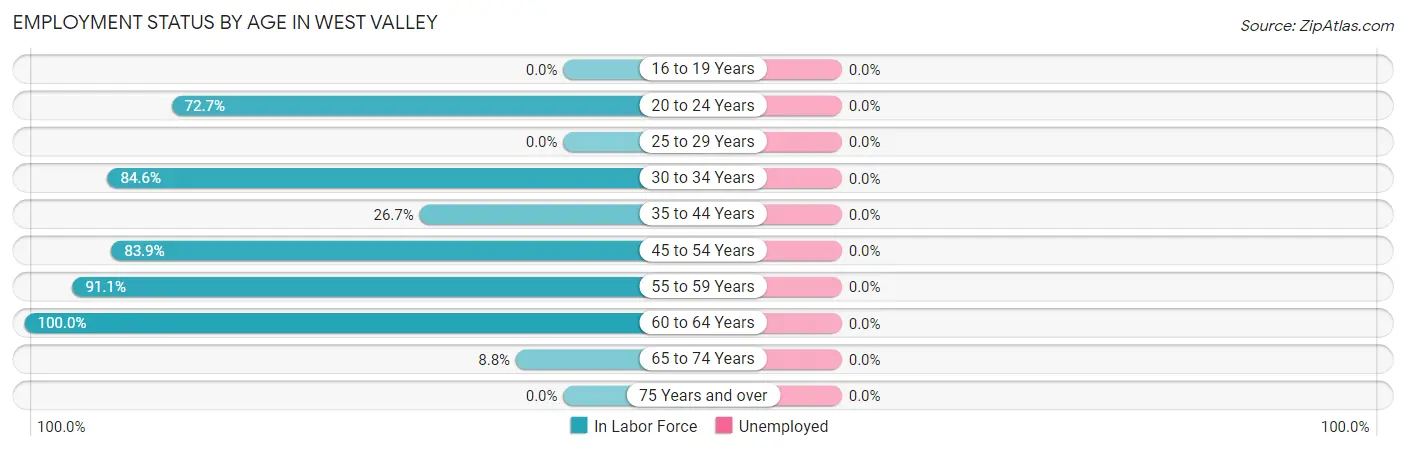
Employment Status by Age in West Valley
| Age Bracket | In Labor Force | Unemployed |
| 16 to 19 Years | 0 (0.0%) | 0 (0.0%) |
| 20 to 24 Years | 16 (72.7%) | 0 (0.0%) |
| 25 to 29 Years | 0 (0.0%) | 0 (0.0%) |
| 30 to 34 Years | 33 (84.6%) | 0 (0.0%) |
| 35 to 44 Years | 4 (26.7%) | 0 (0.0%) |
| 45 to 54 Years | 26 (83.9%) | 0 (0.0%) |
| 55 to 59 Years | 112 (91.1%) | 0 (0.0%) |
| 60 to 64 Years | 6 (100.0%) | 0 (0.0%) |
| 65 to 74 Years | 5 (8.8%) | 0 (0.0%) |
| 75 Years and over | 0 (0.0%) | 0 (0.0%) |
| Total | 202 (48.7%) | 0 (0.0%) |
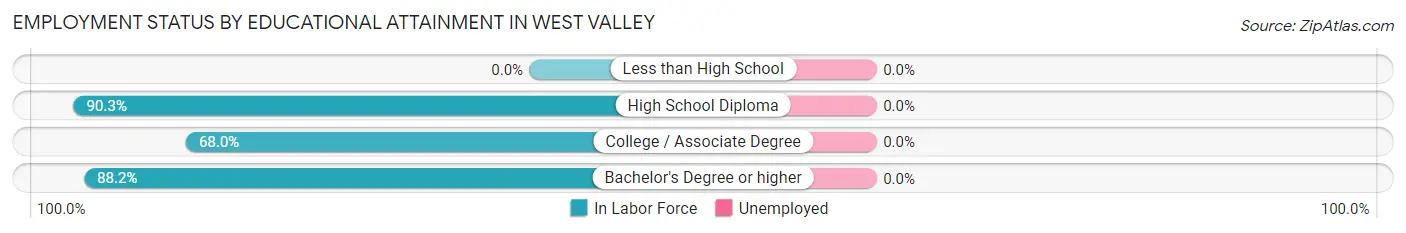
Employment Status by Educational Attainment in West Valley
| Educational Attainment | In Labor Force | Unemployed |
| Less than High School | 0 (0.0%) | 0 (0.0%) |
| High School Diploma | 102 (90.3%) | 0 (0.0%) |
| College / Associate Degree | 34 (68.0%) | 0 (0.0%) |
| Bachelor's Degree or higher | 45 (88.2%) | 0 (0.0%) |
| Total | 181 (84.6%) | 0 (0.0%) |
Employment Occupations by Sex in West Valley
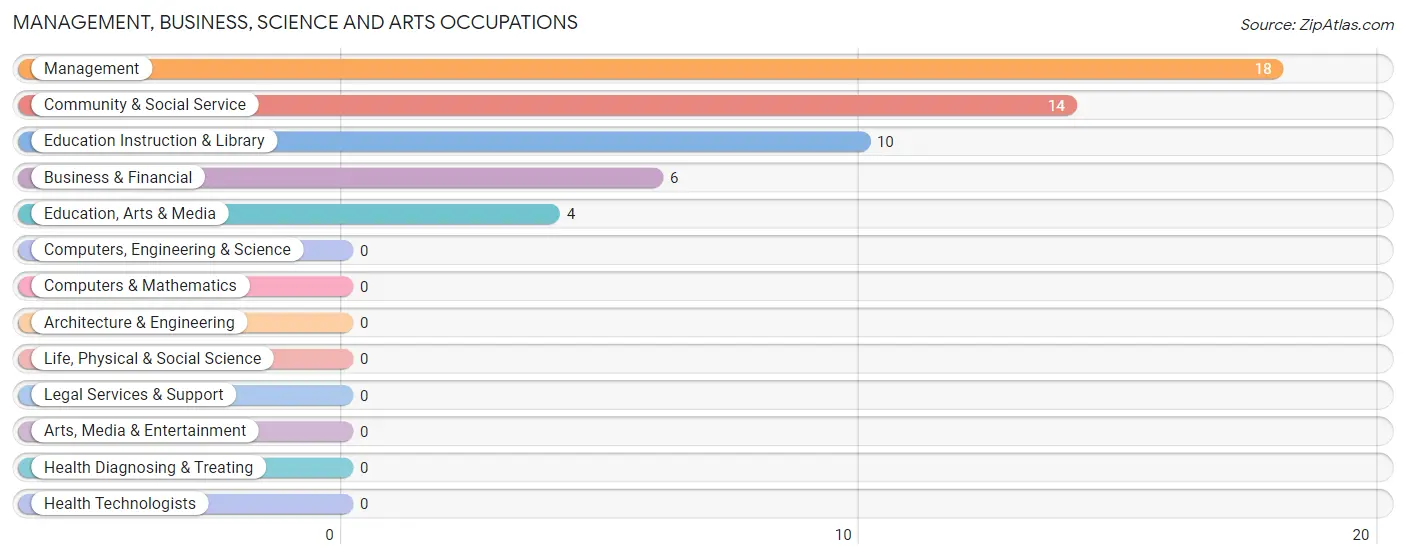
Management, Business, Science and Arts Occupations
The most common Management, Business, Science and Arts occupations in West Valley are Management (18 | 8.9%), Community & Social Service (14 | 6.9%), Education Instruction & Library (10 | 5.0%), Business & Financial (6 | 3.0%), and Education, Arts & Media (4 | 2.0%).
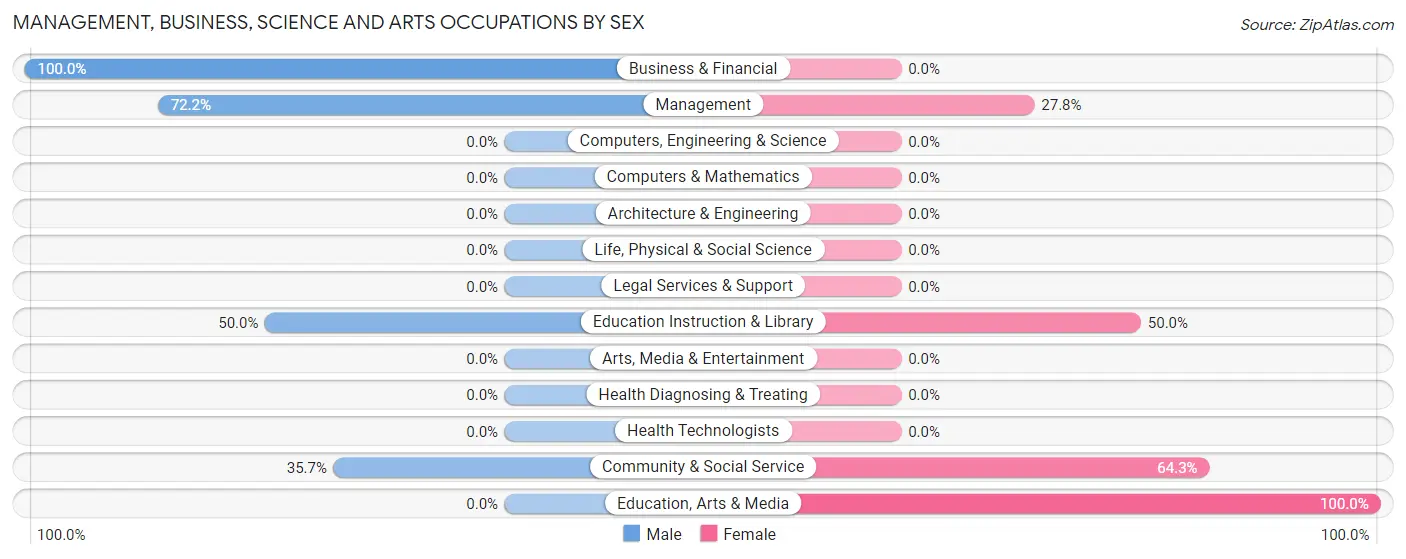
Management, Business, Science and Arts Occupations by Sex
Within the Management, Business, Science and Arts occupations in West Valley, the most male-oriented occupations are Business & Financial (100.0%), Management (72.2%), and Education Instruction & Library (50.0%), while the most female-oriented occupations are Education, Arts & Media (100.0%), Community & Social Service (64.3%), and Education Instruction & Library (50.0%).
| Occupation | Male | Female |
| Management | 13 (72.2%) | 5 (27.8%) |
| Business & Financial | 6 (100.0%) | 0 (0.0%) |
| Computers, Engineering & Science | 0 (0.0%) | 0 (0.0%) |
| Computers & Mathematics | 0 (0.0%) | 0 (0.0%) |
| Architecture & Engineering | 0 (0.0%) | 0 (0.0%) |
| Life, Physical & Social Science | 0 (0.0%) | 0 (0.0%) |
| Community & Social Service | 5 (35.7%) | 9 (64.3%) |
| Education, Arts & Media | 0 (0.0%) | 4 (100.0%) |
| Legal Services & Support | 0 (0.0%) | 0 (0.0%) |
| Education Instruction & Library | 5 (50.0%) | 5 (50.0%) |
| Arts, Media & Entertainment | 0 (0.0%) | 0 (0.0%) |
| Health Diagnosing & Treating | 0 (0.0%) | 0 (0.0%) |
| Health Technologists | 0 (0.0%) | 0 (0.0%) |
| Total (Category) | 24 (63.2%) | 14 (36.8%) |
| Total (Overall) | 121 (59.9%) | 81 (40.1%) |
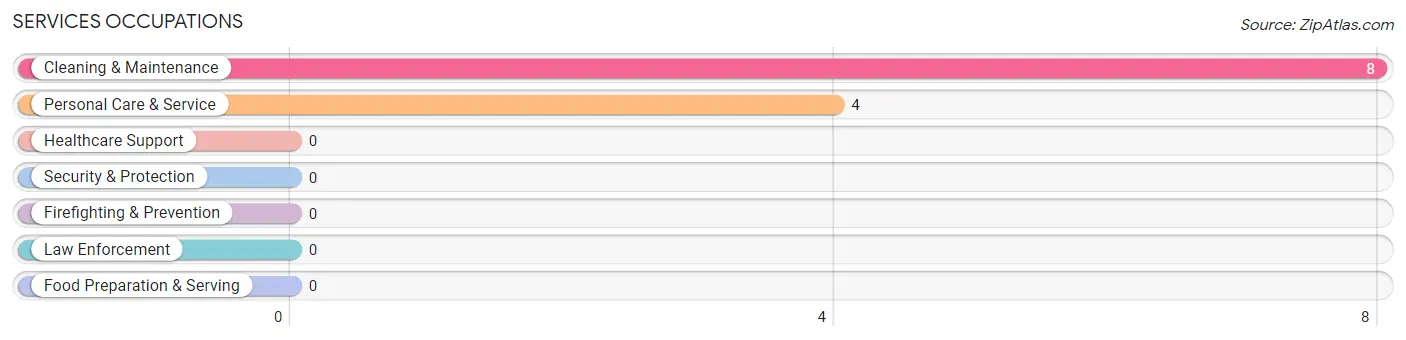
Services Occupations
The most common Services occupations in West Valley are Cleaning & Maintenance (8 | 4.0%), and Personal Care & Service (4 | 2.0%).
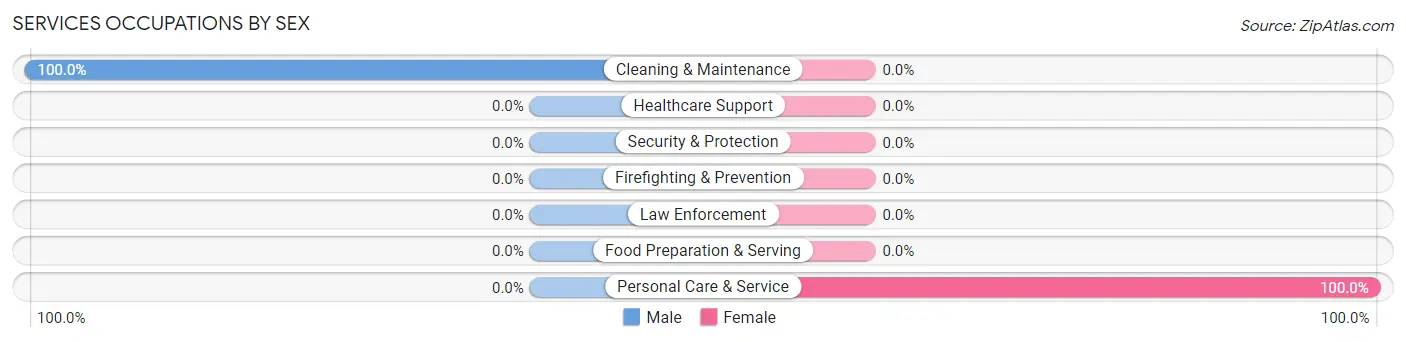
Services Occupations by Sex
| Occupation | Male | Female |
| Healthcare Support | 0 (0.0%) | 0 (0.0%) |
| Security & Protection | 0 (0.0%) | 0 (0.0%) |
| Firefighting & Prevention | 0 (0.0%) | 0 (0.0%) |
| Law Enforcement | 0 (0.0%) | 0 (0.0%) |
| Food Preparation & Serving | 0 (0.0%) | 0 (0.0%) |
| Cleaning & Maintenance | 8 (100.0%) | 0 (0.0%) |
| Personal Care & Service | 0 (0.0%) | 4 (100.0%) |
| Total (Category) | 8 (66.7%) | 4 (33.3%) |
| Total (Overall) | 121 (59.9%) | 81 (40.1%) |
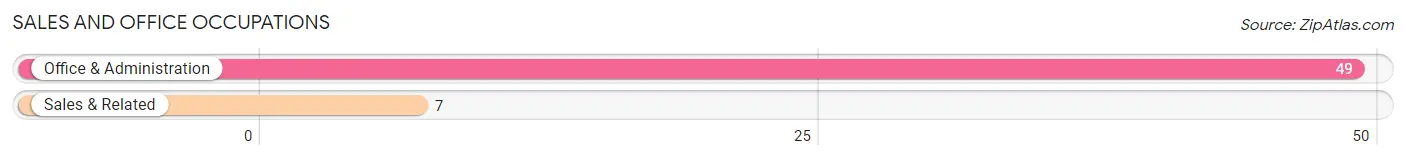
Sales and Office Occupations
The most common Sales and Office occupations in West Valley are Office & Administration (49 | 24.3%), and Sales & Related (7 | 3.5%).
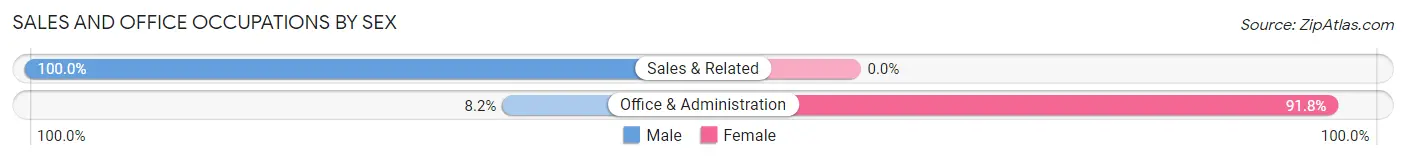
Sales and Office Occupations by Sex
| Occupation | Male | Female |
| Sales & Related | 7 (100.0%) | 0 (0.0%) |
| Office & Administration | 4 (8.2%) | 45 (91.8%) |
| Total (Category) | 11 (19.6%) | 45 (80.4%) |
| Total (Overall) | 121 (59.9%) | 81 (40.1%) |
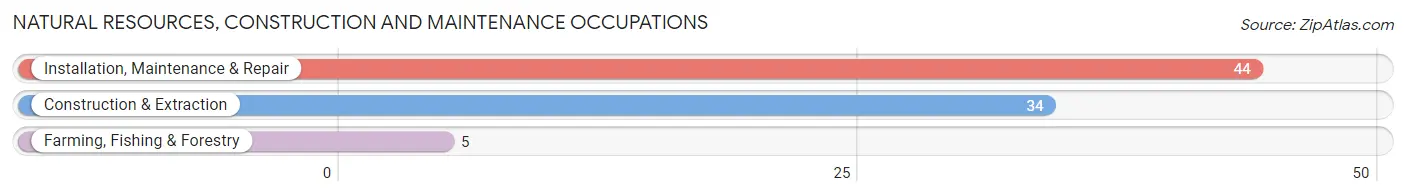
Natural Resources, Construction and Maintenance Occupations
The most common Natural Resources, Construction and Maintenance occupations in West Valley are Installation, Maintenance & Repair (44 | 21.8%), Construction & Extraction (34 | 16.8%), and Farming, Fishing & Forestry (5 | 2.5%).
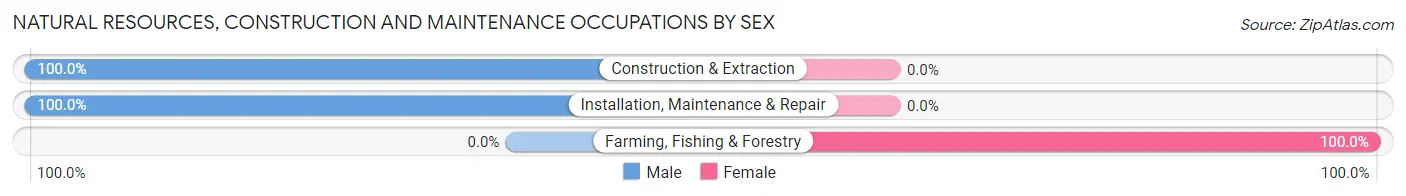
Natural Resources, Construction and Maintenance Occupations by Sex
| Occupation | Male | Female |
| Farming, Fishing & Forestry | 0 (0.0%) | 5 (100.0%) |
| Construction & Extraction | 34 (100.0%) | 0 (0.0%) |
| Installation, Maintenance & Repair | 44 (100.0%) | 0 (0.0%) |
| Total (Category) | 78 (94.0%) | 5 (6.0%) |
| Total (Overall) | 121 (59.9%) | 81 (40.1%) |
Production, Transportation and Moving Occupations
The most common Production, Transportation and Moving occupations in West Valley are , and Material Moving (13 | 6.4%).
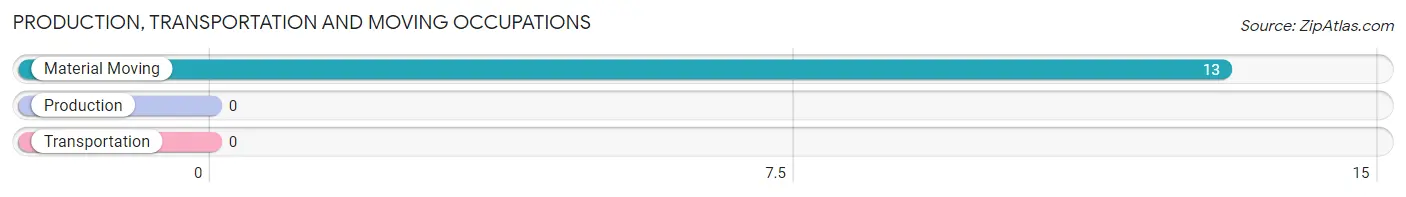
Production, Transportation and Moving Occupations by Sex
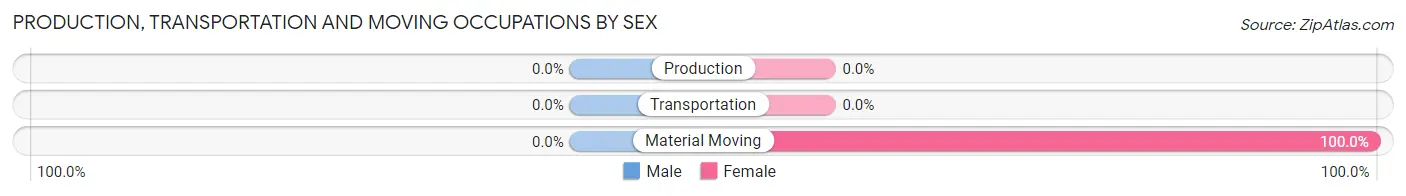
| Occupation | Male | Female |
| Production | 0 (0.0%) | 0 (0.0%) |
| Transportation | 0 (0.0%) | 0 (0.0%) |
| Material Moving | 0 (0.0%) | 13 (100.0%) |
| Total (Category) | 0 (0.0%) | 13 (100.0%) |
| Total (Overall) | 121 (59.9%) | 81 (40.1%) |
Employment Industries by Sex in West Valley
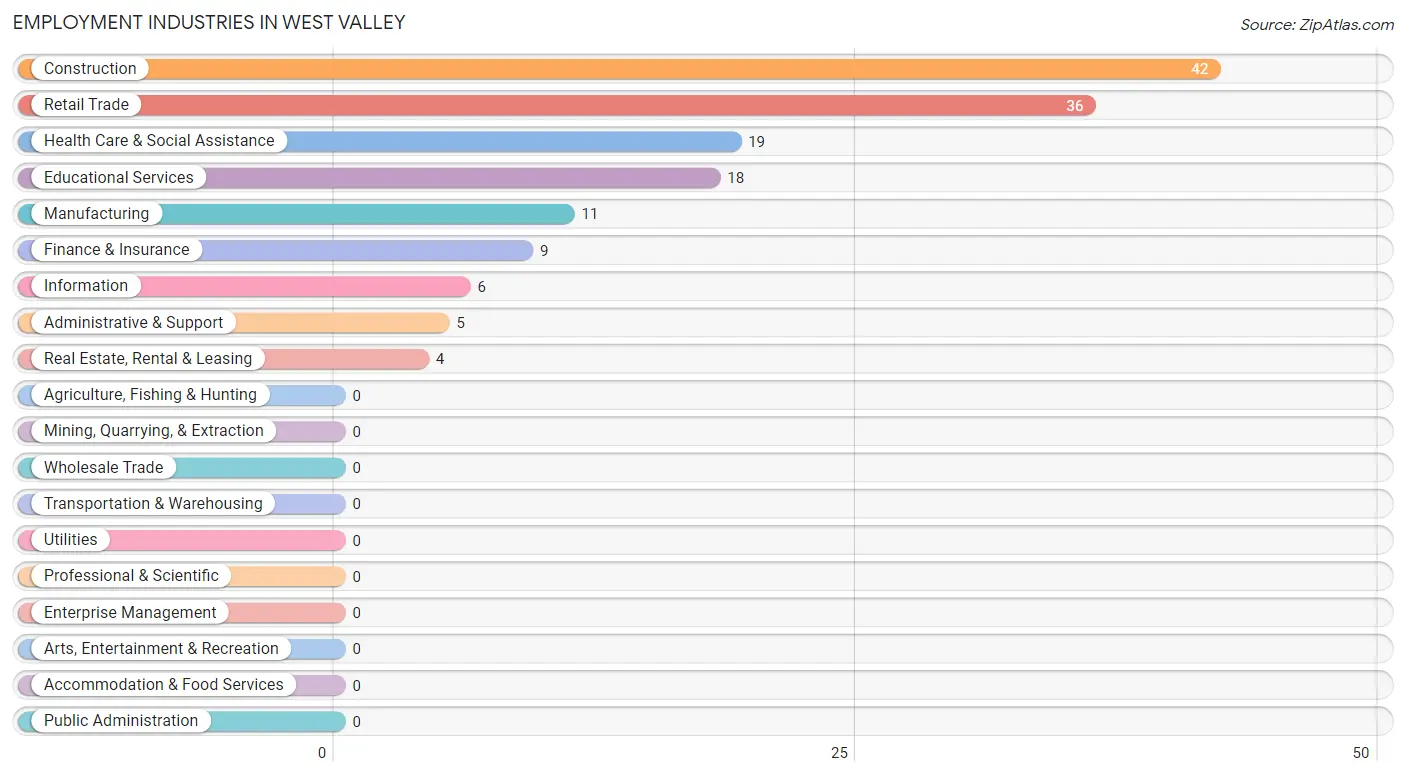
Employment Industries in West Valley
The major employment industries in West Valley include Construction (42 | 20.8%), Retail Trade (36 | 17.8%), Health Care & Social Assistance (19 | 9.4%), Educational Services (18 | 8.9%), and Manufacturing (11 | 5.4%).
Employment Industries by Sex in West Valley
The West Valley industries that see more men than women are Information (100.0%), Real Estate, Rental & Leasing (100.0%), and Construction (88.1%), whereas the industries that tend to have a higher number of women are Finance & Insurance (100.0%), Administrative & Support (100.0%), and Health Care & Social Assistance (100.0%).
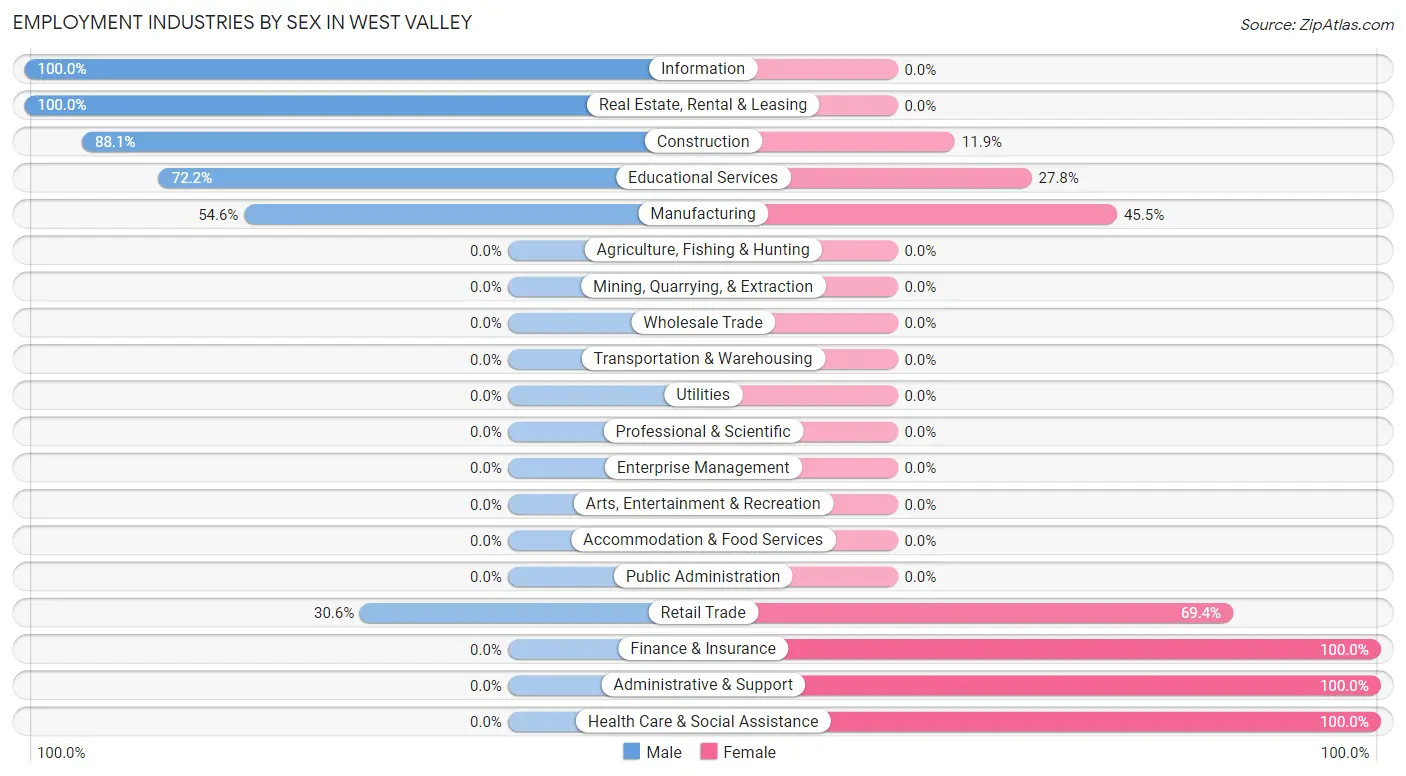
| Industry | Male | Female |
| Agriculture, Fishing & Hunting | 0 (0.0%) | 0 (0.0%) |
| Mining, Quarrying, & Extraction | 0 (0.0%) | 0 (0.0%) |
| Construction | 37 (88.1%) | 5 (11.9%) |
| Manufacturing | 6 (54.5%) | 5 (45.5%) |
| Wholesale Trade | 0 (0.0%) | 0 (0.0%) |
| Retail Trade | 11 (30.6%) | 25 (69.4%) |
| Transportation & Warehousing | 0 (0.0%) | 0 (0.0%) |
| Utilities | 0 (0.0%) | 0 (0.0%) |
| Information | 6 (100.0%) | 0 (0.0%) |
| Finance & Insurance | 0 (0.0%) | 9 (100.0%) |
| Real Estate, Rental & Leasing | 4 (100.0%) | 0 (0.0%) |
| Professional & Scientific | 0 (0.0%) | 0 (0.0%) |
| Enterprise Management | 0 (0.0%) | 0 (0.0%) |
| Administrative & Support | 0 (0.0%) | 5 (100.0%) |
| Educational Services | 13 (72.2%) | 5 (27.8%) |
| Health Care & Social Assistance | 0 (0.0%) | 19 (100.0%) |
| Arts, Entertainment & Recreation | 0 (0.0%) | 0 (0.0%) |
| Accommodation & Food Services | 0 (0.0%) | 0 (0.0%) |
| Public Administration | 0 (0.0%) | 0 (0.0%) |
| Total | 121 (59.9%) | 81 (40.1%) |
Education in West Valley
School Enrollment in West Valley
The most common levels of schooling among the 65 students in West Valley are middle school (33 | 50.8%), college / undergraduate (15 | 23.1%), and elementary school (14 | 21.5%).
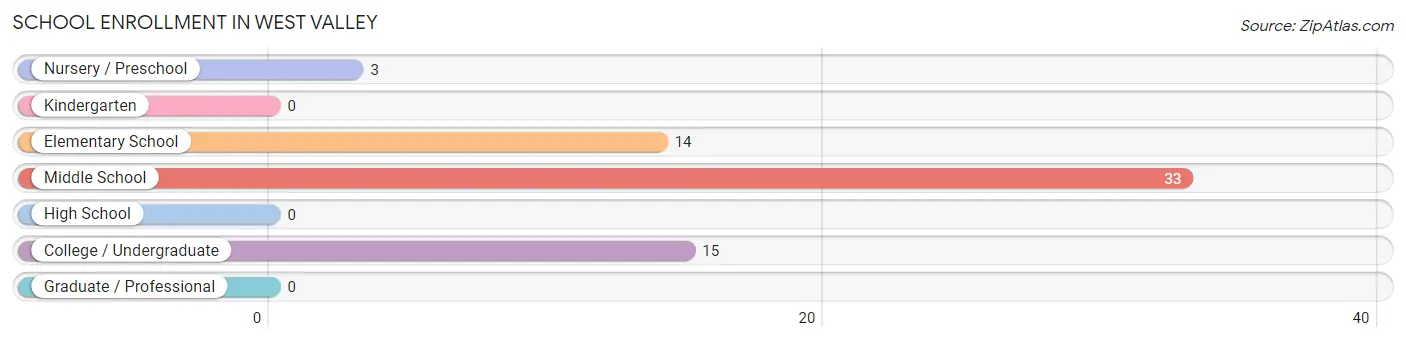
| School Level | # Students | % Students |
| Nursery / Preschool | 3 | 4.6% |
| Kindergarten | 0 | 0.0% |
| Elementary School | 14 | 21.5% |
| Middle School | 33 | 50.8% |
| High School | 0 | 0.0% |
| College / Undergraduate | 15 | 23.1% |
| Graduate / Professional | 0 | 0.0% |
| Total | 65 | 100.0% |
School Enrollment by Age by Funding Source in West Valley
Out of a total of 65 students who are enrolled in schools in West Valley, 12 (18.5%) attend a private institution, while the remaining 53 (81.5%) are enrolled in public schools. The age group of 3 to 4 year olds has the highest likelihood of being enrolled in private schools, with 3 (100.0% in the age bracket) enrolled. Conversely, the age group of 5 to 9 year old has the lowest likelihood of being enrolled in a private school, with 14 (100.0% in the age bracket) attending a public institution.
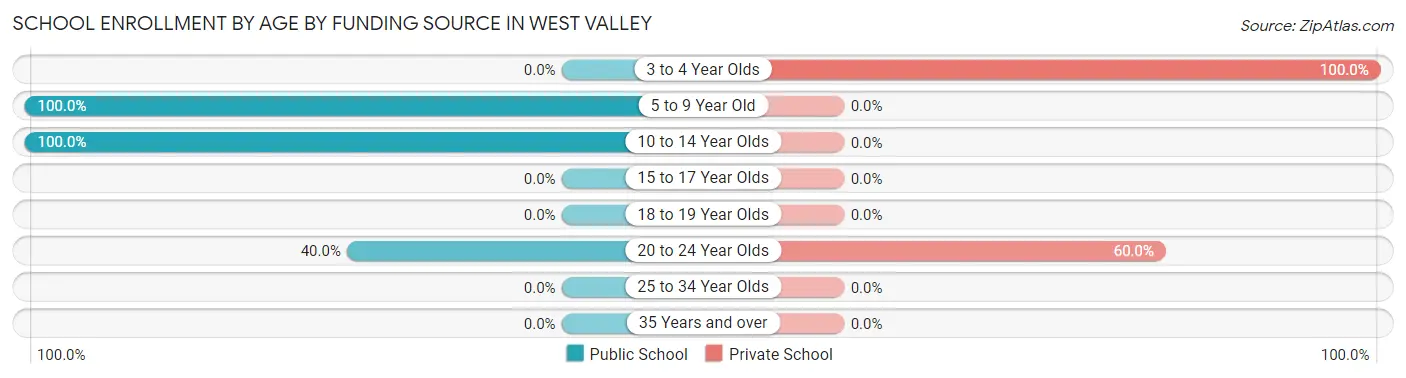
| Age Bracket | Public School | Private School |
| 3 to 4 Year Olds | 0 (0.0%) | 3 (100.0%) |
| 5 to 9 Year Old | 14 (100.0%) | 0 (0.0%) |
| 10 to 14 Year Olds | 33 (100.0%) | 0 (0.0%) |
| 15 to 17 Year Olds | 0 (0.0%) | 0 (0.0%) |
| 18 to 19 Year Olds | 0 (0.0%) | 0 (0.0%) |
| 20 to 24 Year Olds | 6 (40.0%) | 9 (60.0%) |
| 25 to 34 Year Olds | 0 (0.0%) | 0 (0.0%) |
| 35 Years and over | 0 (0.0%) | 0 (0.0%) |
| Total | 53 (81.5%) | 12 (18.5%) |
Educational Attainment by Field of Study in West Valley
Science & technology (15 | 17.2%), liberal arts & history (13 | 14.9%), social sciences (9 | 10.3%), education (9 | 10.3%), and physical & health sciences (8 | 9.2%) are the most common fields of study among 87 individuals in West Valley who have obtained a bachelor's degree or higher.
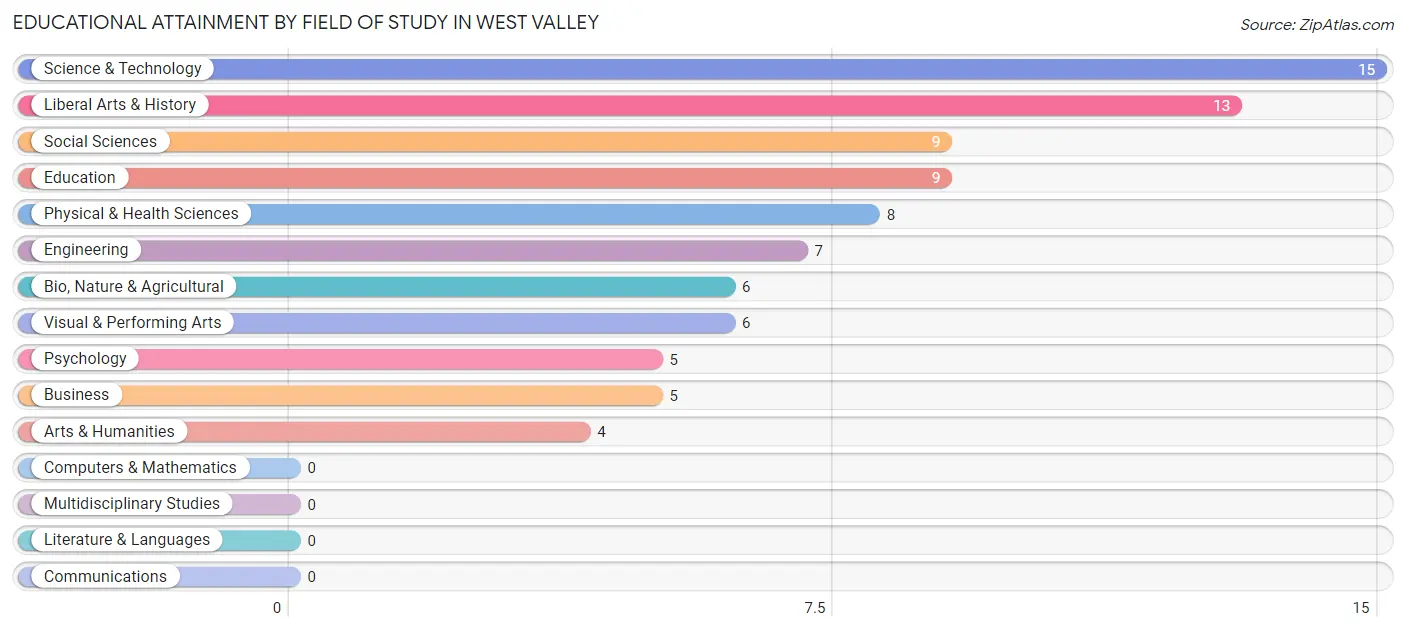
| Field of Study | # Graduates | % Graduates |
| Computers & Mathematics | 0 | 0.0% |
| Bio, Nature & Agricultural | 6 | 6.9% |
| Physical & Health Sciences | 8 | 9.2% |
| Psychology | 5 | 5.8% |
| Social Sciences | 9 | 10.3% |
| Engineering | 7 | 8.1% |
| Multidisciplinary Studies | 0 | 0.0% |
| Science & Technology | 15 | 17.2% |
| Business | 5 | 5.8% |
| Education | 9 | 10.3% |
| Literature & Languages | 0 | 0.0% |
| Liberal Arts & History | 13 | 14.9% |
| Visual & Performing Arts | 6 | 6.9% |
| Communications | 0 | 0.0% |
| Arts & Humanities | 4 | 4.6% |
| Total | 87 | 100.0% |
Transportation & Commute in West Valley
Vehicle Availability by Sex in West Valley
The most prevalent vehicle ownership categories in West Valley are males with 2 vehicles (95, accounting for 78.5%) and females with 2 vehicles (56, making up 117.3%).
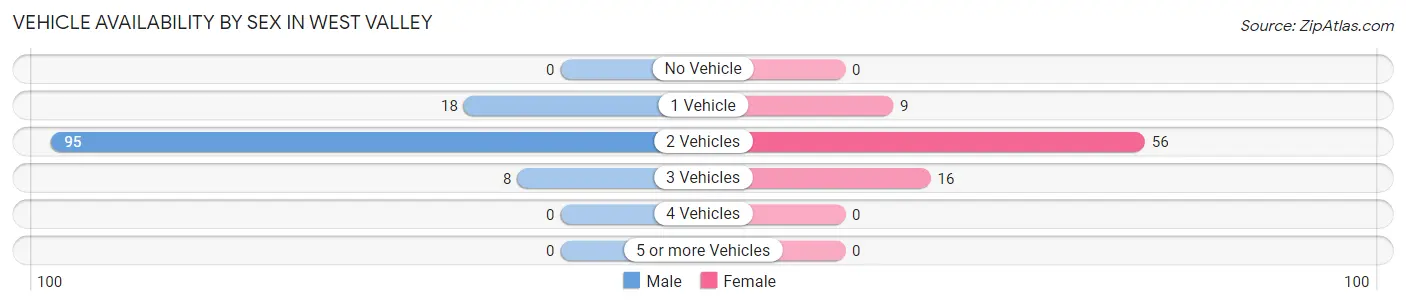
| Vehicles Available | Male | Female |
| No Vehicle | 0 (0.0%) | 0 (0.0%) |
| 1 Vehicle | 18 (14.9%) | 9 (11.1%) |
| 2 Vehicles | 95 (78.5%) | 56 (69.1%) |
| 3 Vehicles | 8 (6.6%) | 16 (19.8%) |
| 4 Vehicles | 0 (0.0%) | 0 (0.0%) |
| 5 or more Vehicles | 0 (0.0%) | 0 (0.0%) |
| Total | 121 (100.0%) | 81 (100.0%) |
Commute Time in West Valley
The most frequently occuring commute durations in West Valley are 60 to 89 minutes (40 commuters, 19.8%), 20 to 24 minutes (38 commuters, 18.8%), and 45 to 59 minutes (33 commuters, 16.3%).
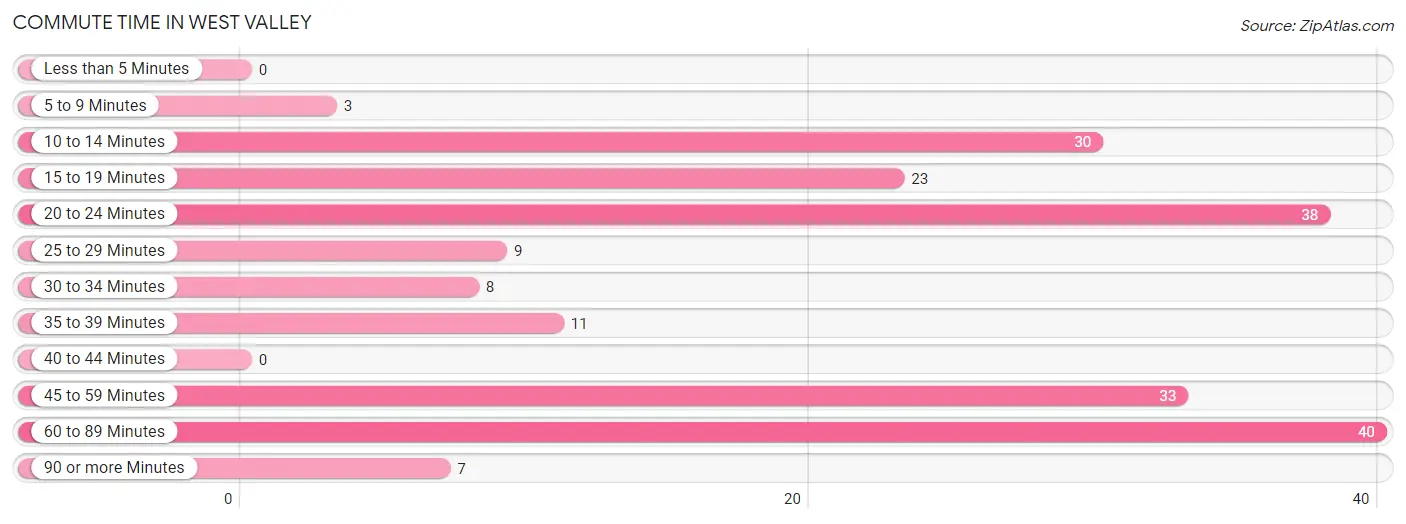
| Commute Time | # Commuters | % Commuters |
| Less than 5 Minutes | 0 | 0.0% |
| 5 to 9 Minutes | 3 | 1.5% |
| 10 to 14 Minutes | 30 | 14.8% |
| 15 to 19 Minutes | 23 | 11.4% |
| 20 to 24 Minutes | 38 | 18.8% |
| 25 to 29 Minutes | 9 | 4.5% |
| 30 to 34 Minutes | 8 | 4.0% |
| 35 to 39 Minutes | 11 | 5.4% |
| 40 to 44 Minutes | 0 | 0.0% |
| 45 to 59 Minutes | 33 | 16.3% |
| 60 to 89 Minutes | 40 | 19.8% |
| 90 or more Minutes | 7 | 3.5% |
Commute Time by Sex in West Valley
The most common commute times in West Valley are 60 to 89 minutes (40 commuters, 33.1%) for males and 10 to 14 minutes (30 commuters, 37.0%) for females.
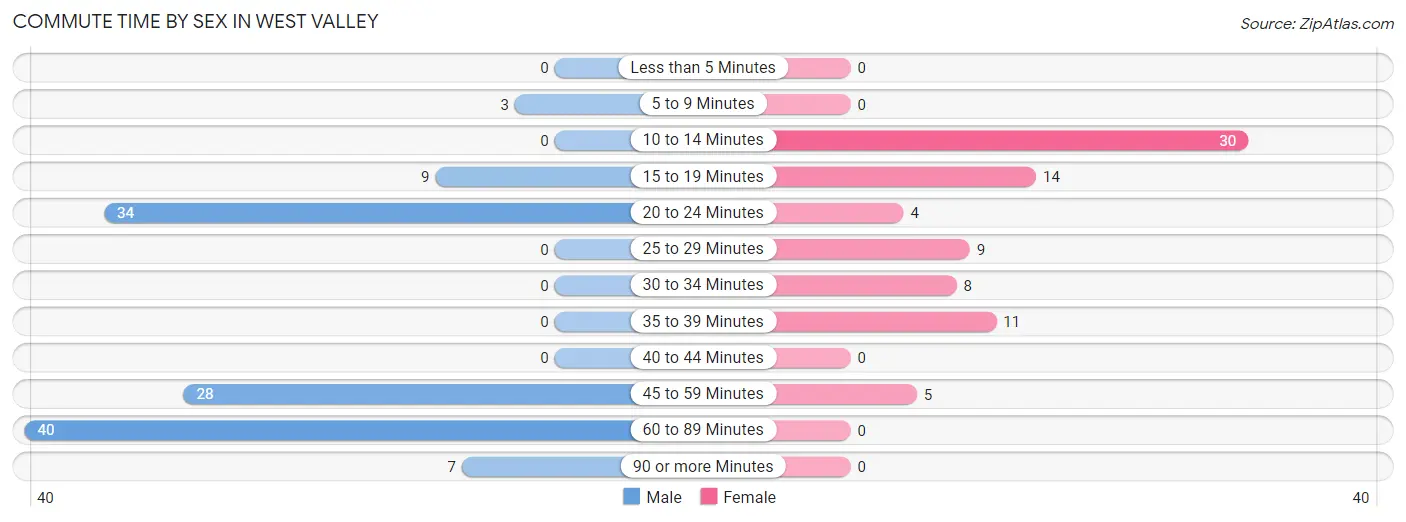
| Commute Time | Male | Female |
| Less than 5 Minutes | 0 (0.0%) | 0 (0.0%) |
| 5 to 9 Minutes | 3 (2.5%) | 0 (0.0%) |
| 10 to 14 Minutes | 0 (0.0%) | 30 (37.0%) |
| 15 to 19 Minutes | 9 (7.4%) | 14 (17.3%) |
| 20 to 24 Minutes | 34 (28.1%) | 4 (4.9%) |
| 25 to 29 Minutes | 0 (0.0%) | 9 (11.1%) |
| 30 to 34 Minutes | 0 (0.0%) | 8 (9.9%) |
| 35 to 39 Minutes | 0 (0.0%) | 11 (13.6%) |
| 40 to 44 Minutes | 0 (0.0%) | 0 (0.0%) |
| 45 to 59 Minutes | 28 (23.1%) | 5 (6.2%) |
| 60 to 89 Minutes | 40 (33.1%) | 0 (0.0%) |
| 90 or more Minutes | 7 (5.8%) | 0 (0.0%) |
Time of Departure to Work by Sex in West Valley
The most frequent times of departure to work in West Valley are 7:00 AM to 7:29 AM (86, 71.1%) for males and 6:30 AM to 6:59 AM (24, 29.6%) for females.
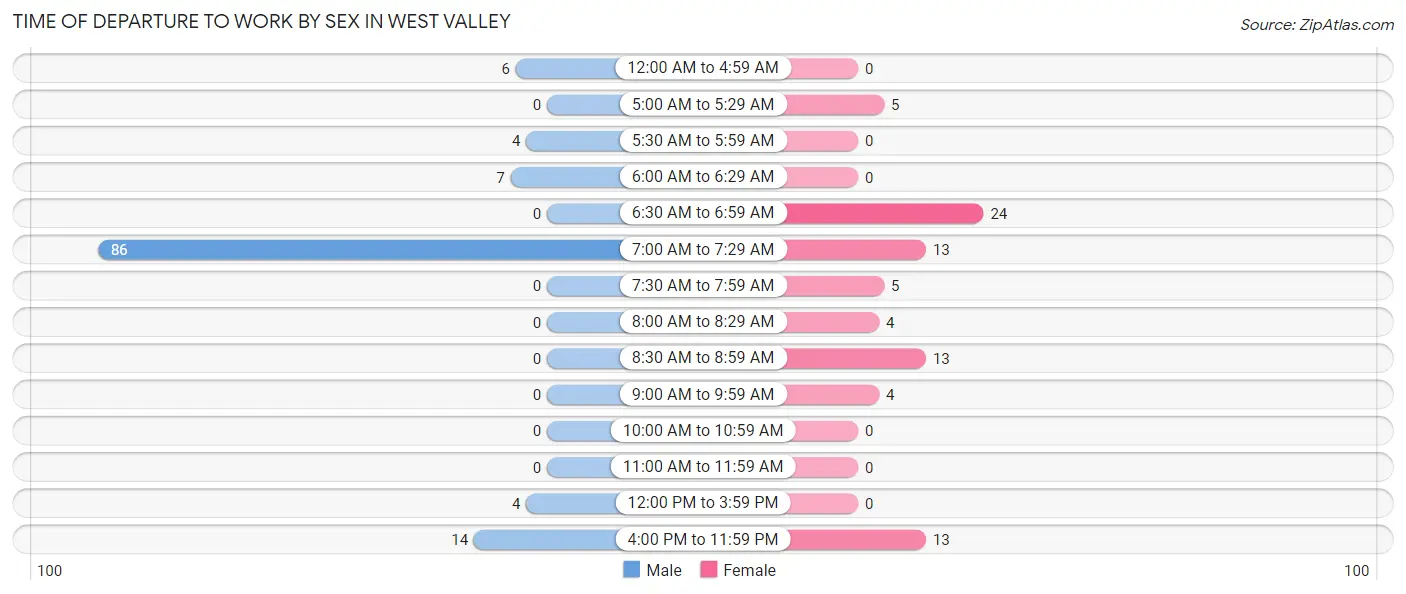
| Time of Departure | Male | Female |
| 12:00 AM to 4:59 AM | 6 (5.0%) | 0 (0.0%) |
| 5:00 AM to 5:29 AM | 0 (0.0%) | 5 (6.2%) |
| 5:30 AM to 5:59 AM | 4 (3.3%) | 0 (0.0%) |
| 6:00 AM to 6:29 AM | 7 (5.8%) | 0 (0.0%) |
| 6:30 AM to 6:59 AM | 0 (0.0%) | 24 (29.6%) |
| 7:00 AM to 7:29 AM | 86 (71.1%) | 13 (16.1%) |
| 7:30 AM to 7:59 AM | 0 (0.0%) | 5 (6.2%) |
| 8:00 AM to 8:29 AM | 0 (0.0%) | 4 (4.9%) |
| 8:30 AM to 8:59 AM | 0 (0.0%) | 13 (16.1%) |
| 9:00 AM to 9:59 AM | 0 (0.0%) | 4 (4.9%) |
| 10:00 AM to 10:59 AM | 0 (0.0%) | 0 (0.0%) |
| 11:00 AM to 11:59 AM | 0 (0.0%) | 0 (0.0%) |
| 12:00 PM to 3:59 PM | 4 (3.3%) | 0 (0.0%) |
| 4:00 PM to 11:59 PM | 14 (11.6%) | 13 (16.1%) |
| Total | 121 (100.0%) | 81 (100.0%) |
Housing Occupancy in West Valley
Occupancy by Ownership in West Valley
Of the total 212 dwellings in West Valley, owner-occupied units account for 186 (87.7%), while renter-occupied units make up 26 (12.3%).
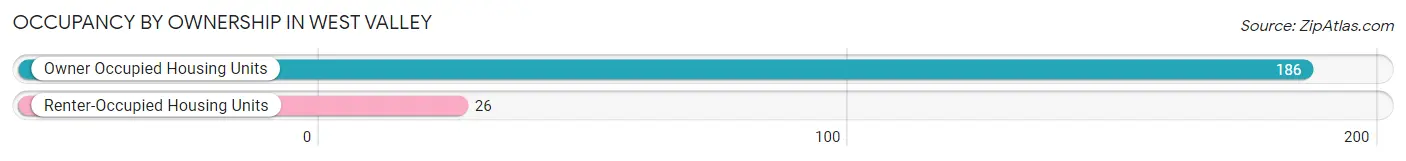
| Occupancy | # Housing Units | % Housing Units |
| Owner Occupied Housing Units | 186 | 87.7% |
| Renter-Occupied Housing Units | 26 | 12.3% |
| Total Occupied Housing Units | 212 | 100.0% |
Occupancy by Household Size in West Valley
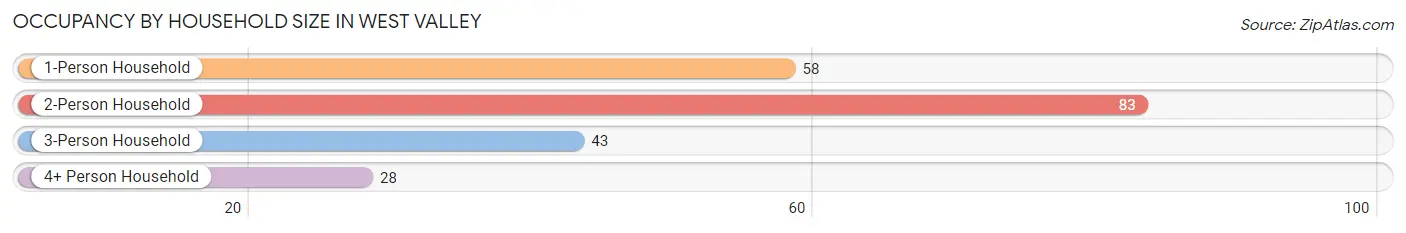
| Household Size | # Housing Units | % Housing Units |
| 1-Person Household | 58 | 27.4% |
| 2-Person Household | 83 | 39.2% |
| 3-Person Household | 43 | 20.3% |
| 4+ Person Household | 28 | 13.2% |
| Total Housing Units | 212 | 100.0% |
Occupancy by Ownership by Household Size in West Valley
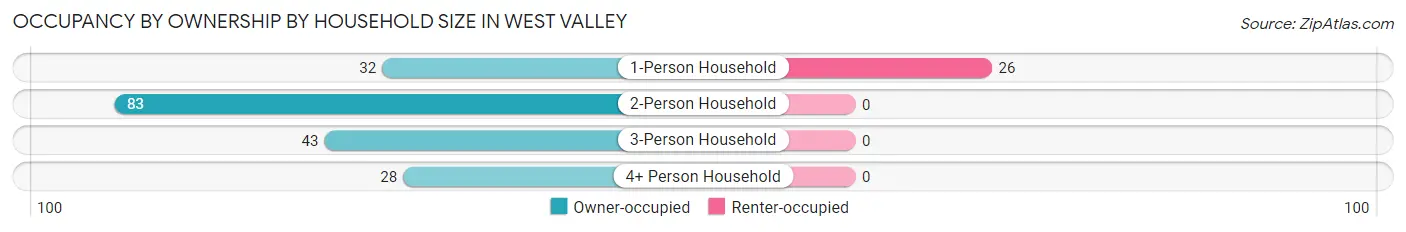
| Household Size | Owner-occupied | Renter-occupied |
| 1-Person Household | 32 (55.2%) | 26 (44.8%) |
| 2-Person Household | 83 (100.0%) | 0 (0.0%) |
| 3-Person Household | 43 (100.0%) | 0 (0.0%) |
| 4+ Person Household | 28 (100.0%) | 0 (0.0%) |
| Total Housing Units | 186 (87.7%) | 26 (12.3%) |
Occupancy by Educational Attainment in West Valley
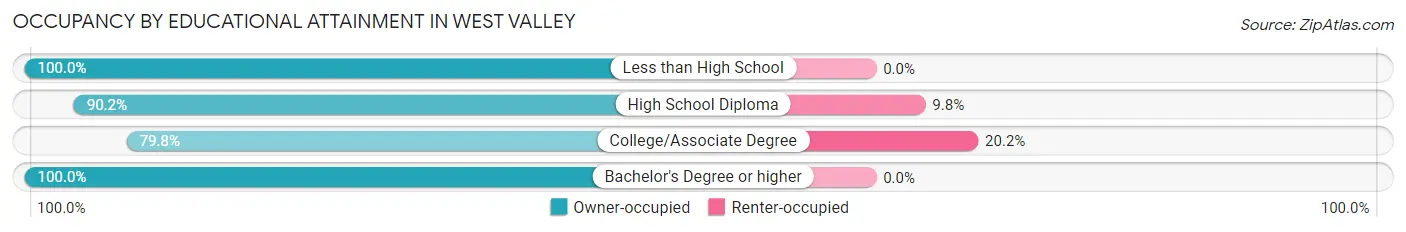
| Household Size | Owner-occupied | Renter-occupied |
| Less than High School | 5 (100.0%) | 0 (0.0%) |
| High School Diploma | 74 (90.2%) | 8 (9.8%) |
| College/Associate Degree | 71 (79.8%) | 18 (20.2%) |
| Bachelor's Degree or higher | 36 (100.0%) | 0 (0.0%) |
Occupancy by Age of Householder in West Valley
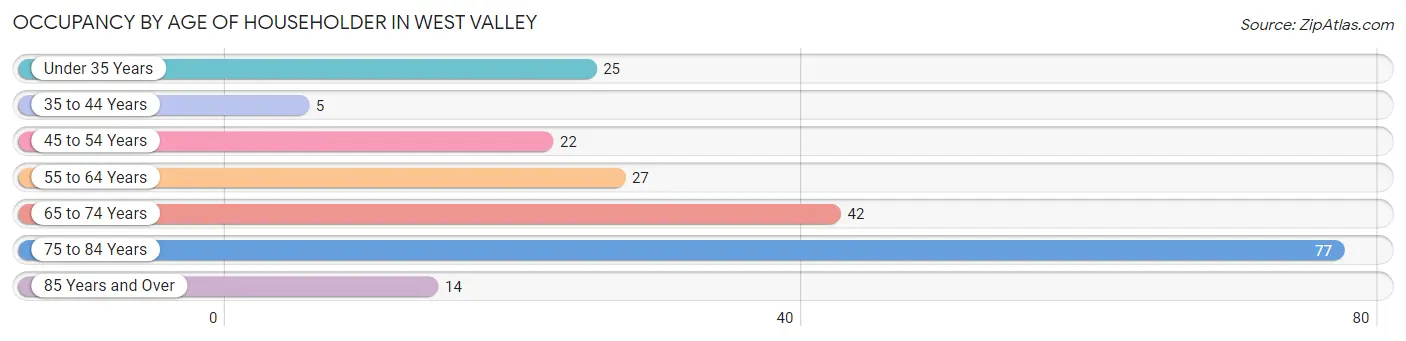
| Age Bracket | # Households | % Households |
| Under 35 Years | 25 | 11.8% |
| 35 to 44 Years | 5 | 2.4% |
| 45 to 54 Years | 22 | 10.4% |
| 55 to 64 Years | 27 | 12.7% |
| 65 to 74 Years | 42 | 19.8% |
| 75 to 84 Years | 77 | 36.3% |
| 85 Years and Over | 14 | 6.6% |
| Total | 212 | 100.0% |
Housing Finances in West Valley
Median Income by Occupancy in West Valley
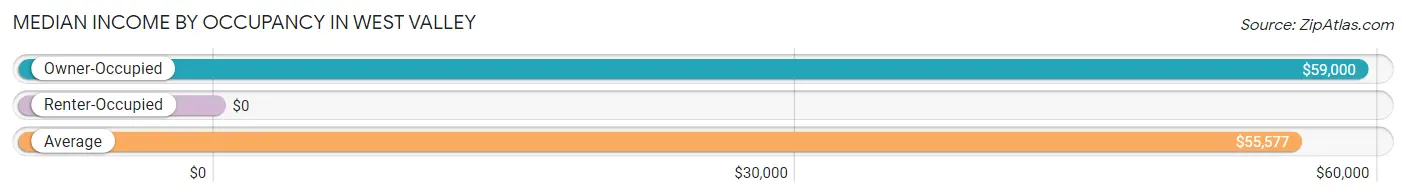
| Occupancy Type | # Households | Median Income |
| Owner-Occupied | 186 (87.7%) | $59,000 |
| Renter-Occupied | 26 (12.3%) | $0 |
| Average | 212 (100.0%) | $55,577 |
Occupancy by Householder Income Bracket in West Valley
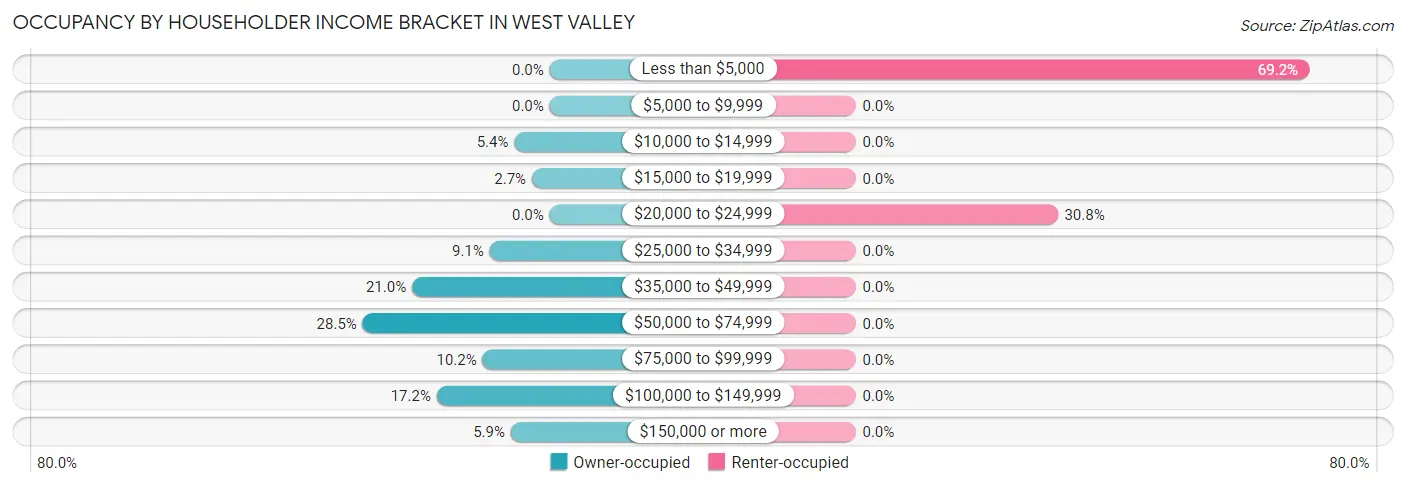
| Income Bracket | Owner-occupied | Renter-occupied |
| Less than $5,000 | 0 (0.0%) | 18 (69.2%) |
| $5,000 to $9,999 | 0 (0.0%) | 0 (0.0%) |
| $10,000 to $14,999 | 10 (5.4%) | 0 (0.0%) |
| $15,000 to $19,999 | 5 (2.7%) | 0 (0.0%) |
| $20,000 to $24,999 | 0 (0.0%) | 8 (30.8%) |
| $25,000 to $34,999 | 17 (9.1%) | 0 (0.0%) |
| $35,000 to $49,999 | 39 (21.0%) | 0 (0.0%) |
| $50,000 to $74,999 | 53 (28.5%) | 0 (0.0%) |
| $75,000 to $99,999 | 19 (10.2%) | 0 (0.0%) |
| $100,000 to $149,999 | 32 (17.2%) | 0 (0.0%) |
| $150,000 or more | 11 (5.9%) | 0 (0.0%) |
| Total | 186 (100.0%) | 26 (100.0%) |
Monthly Housing Cost Tiers in West Valley
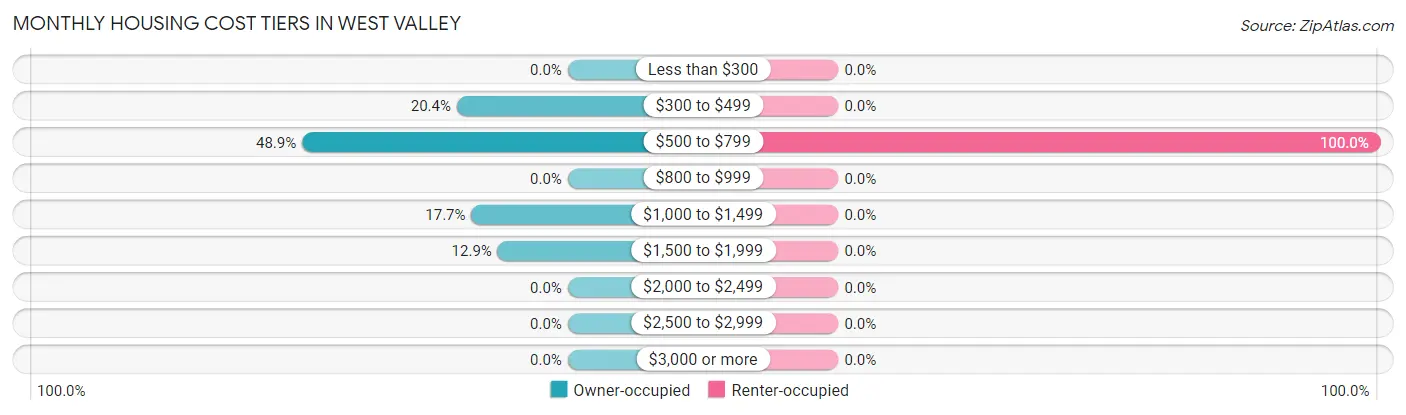
| Monthly Cost | Owner-occupied | Renter-occupied |
| Less than $300 | 0 (0.0%) | 0 (0.0%) |
| $300 to $499 | 38 (20.4%) | 0 (0.0%) |
| $500 to $799 | 91 (48.9%) | 26 (100.0%) |
| $800 to $999 | 0 (0.0%) | 0 (0.0%) |
| $1,000 to $1,499 | 33 (17.7%) | 0 (0.0%) |
| $1,500 to $1,999 | 24 (12.9%) | 0 (0.0%) |
| $2,000 to $2,499 | 0 (0.0%) | 0 (0.0%) |
| $2,500 to $2,999 | 0 (0.0%) | 0 (0.0%) |
| $3,000 or more | 0 (0.0%) | 0 (0.0%) |
| Total | 186 (100.0%) | 26 (100.0%) |
Physical Housing Characteristics in West Valley
Housing Structures in West Valley
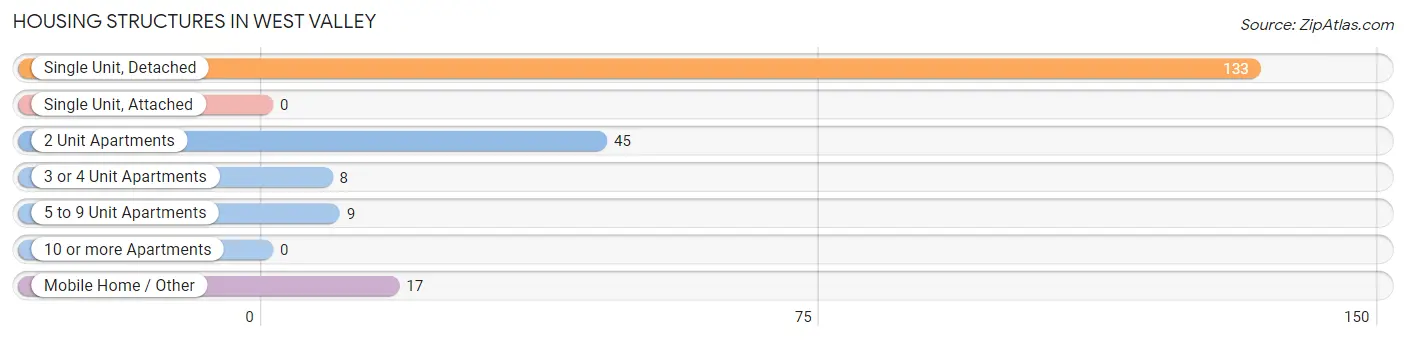
| Structure Type | # Housing Units | % Housing Units |
| Single Unit, Detached | 133 | 62.7% |
| Single Unit, Attached | 0 | 0.0% |
| 2 Unit Apartments | 45 | 21.2% |
| 3 or 4 Unit Apartments | 8 | 3.8% |
| 5 to 9 Unit Apartments | 9 | 4.3% |
| 10 or more Apartments | 0 | 0.0% |
| Mobile Home / Other | 17 | 8.0% |
| Total | 212 | 100.0% |
Housing Structures by Occupancy in West Valley
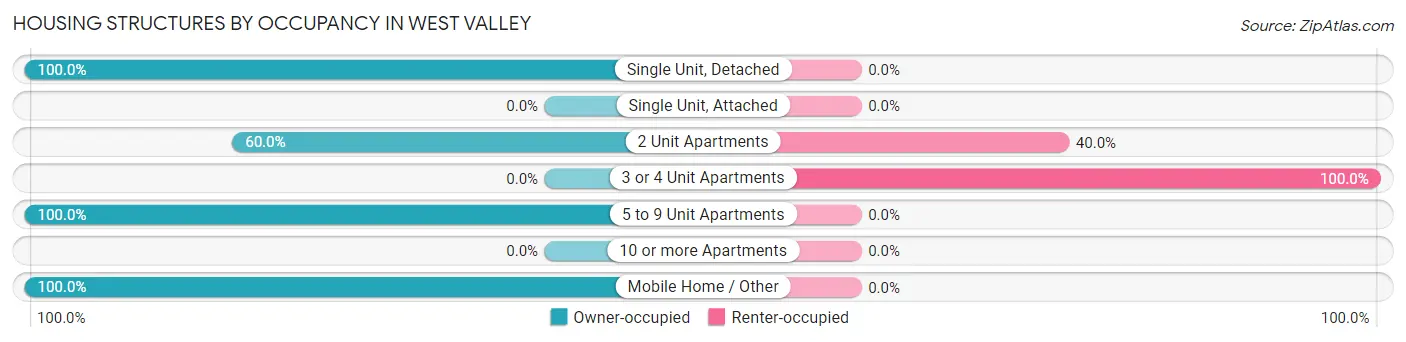
| Structure Type | Owner-occupied | Renter-occupied |
| Single Unit, Detached | 133 (100.0%) | 0 (0.0%) |
| Single Unit, Attached | 0 (0.0%) | 0 (0.0%) |
| 2 Unit Apartments | 27 (60.0%) | 18 (40.0%) |
| 3 or 4 Unit Apartments | 0 (0.0%) | 8 (100.0%) |
| 5 to 9 Unit Apartments | 9 (100.0%) | 0 (0.0%) |
| 10 or more Apartments | 0 (0.0%) | 0 (0.0%) |
| Mobile Home / Other | 17 (100.0%) | 0 (0.0%) |
| Total | 186 (87.7%) | 26 (12.3%) |
Housing Structures by Number of Rooms in West Valley
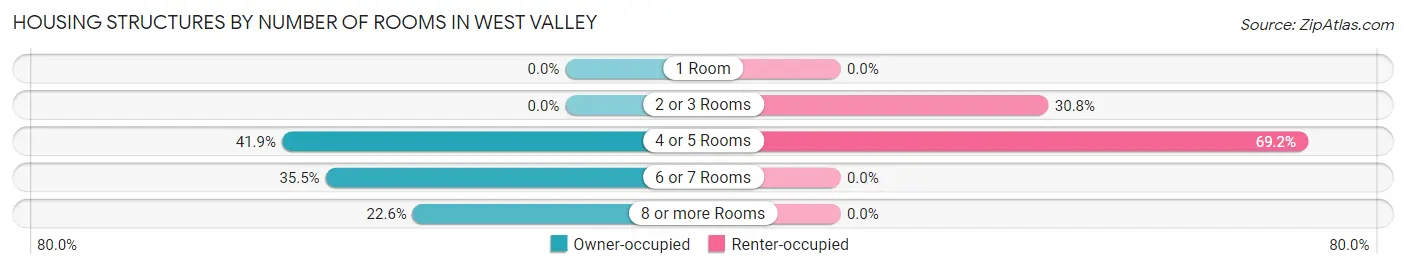
| Number of Rooms | Owner-occupied | Renter-occupied |
| 1 Room | 0 (0.0%) | 0 (0.0%) |
| 2 or 3 Rooms | 0 (0.0%) | 8 (30.8%) |
| 4 or 5 Rooms | 78 (41.9%) | 18 (69.2%) |
| 6 or 7 Rooms | 66 (35.5%) | 0 (0.0%) |
| 8 or more Rooms | 42 (22.6%) | 0 (0.0%) |
| Total | 186 (100.0%) | 26 (100.0%) |
Housing Structure by Heating Type in West Valley
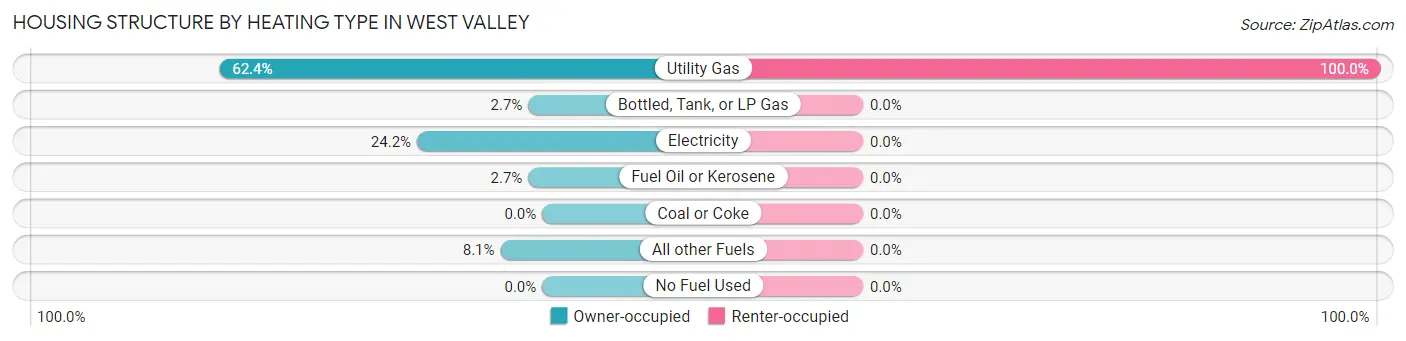
| Heating Type | Owner-occupied | Renter-occupied |
| Utility Gas | 116 (62.4%) | 26 (100.0%) |
| Bottled, Tank, or LP Gas | 5 (2.7%) | 0 (0.0%) |
| Electricity | 45 (24.2%) | 0 (0.0%) |
| Fuel Oil or Kerosene | 5 (2.7%) | 0 (0.0%) |
| Coal or Coke | 0 (0.0%) | 0 (0.0%) |
| All other Fuels | 15 (8.1%) | 0 (0.0%) |
| No Fuel Used | 0 (0.0%) | 0 (0.0%) |
| Total | 186 (100.0%) | 26 (100.0%) |
Household Vehicle Usage in West Valley
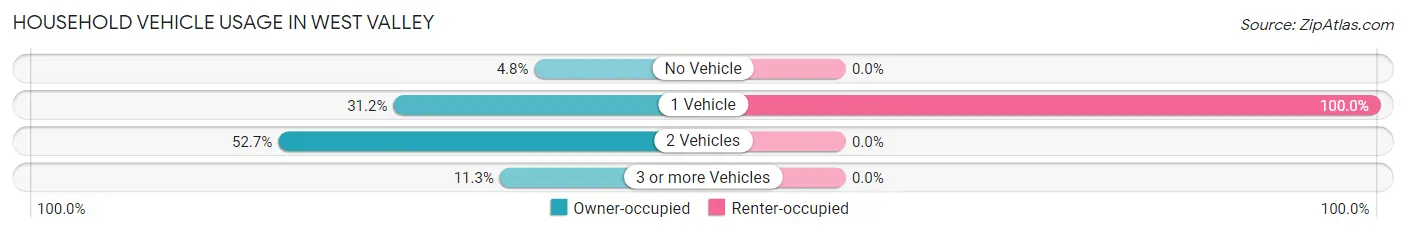
| Vehicles per Household | Owner-occupied | Renter-occupied |
| No Vehicle | 9 (4.8%) | 0 (0.0%) |
| 1 Vehicle | 58 (31.2%) | 26 (100.0%) |
| 2 Vehicles | 98 (52.7%) | 0 (0.0%) |
| 3 or more Vehicles | 21 (11.3%) | 0 (0.0%) |
| Total | 186 (100.0%) | 26 (100.0%) |
Real Estate & Mortgages in West Valley
Real Estate and Mortgage Overview in West Valley
| Characteristic | Without Mortgage | With Mortgage |
| Housing Units | 107 | 79 |
| Median Property Value | $92,400 | $120,500 |
| Median Household Income | $66,146 | $11 |
| Monthly Housing Costs | $541 | $0 |
| Real Estate Taxes | $3,088 | $7 |
Property Value by Mortgage Status in West Valley
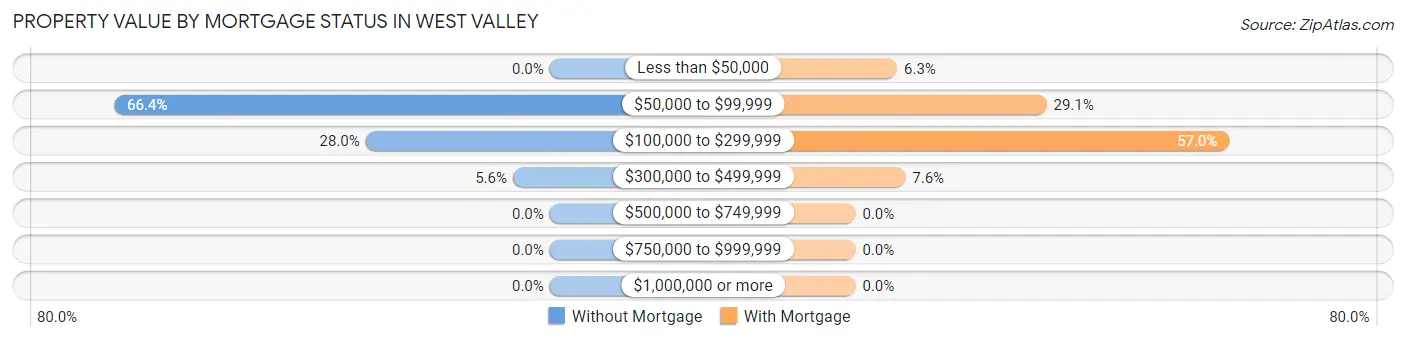
| Property Value | Without Mortgage | With Mortgage |
| Less than $50,000 | 0 (0.0%) | 5 (6.3%) |
| $50,000 to $99,999 | 71 (66.4%) | 23 (29.1%) |
| $100,000 to $299,999 | 30 (28.0%) | 45 (57.0%) |
| $300,000 to $499,999 | 6 (5.6%) | 6 (7.6%) |
| $500,000 to $749,999 | 0 (0.0%) | 0 (0.0%) |
| $750,000 to $999,999 | 0 (0.0%) | 0 (0.0%) |
| $1,000,000 or more | 0 (0.0%) | 0 (0.0%) |
| Total | 107 (100.0%) | 79 (100.0%) |
Household Income by Mortgage Status in West Valley
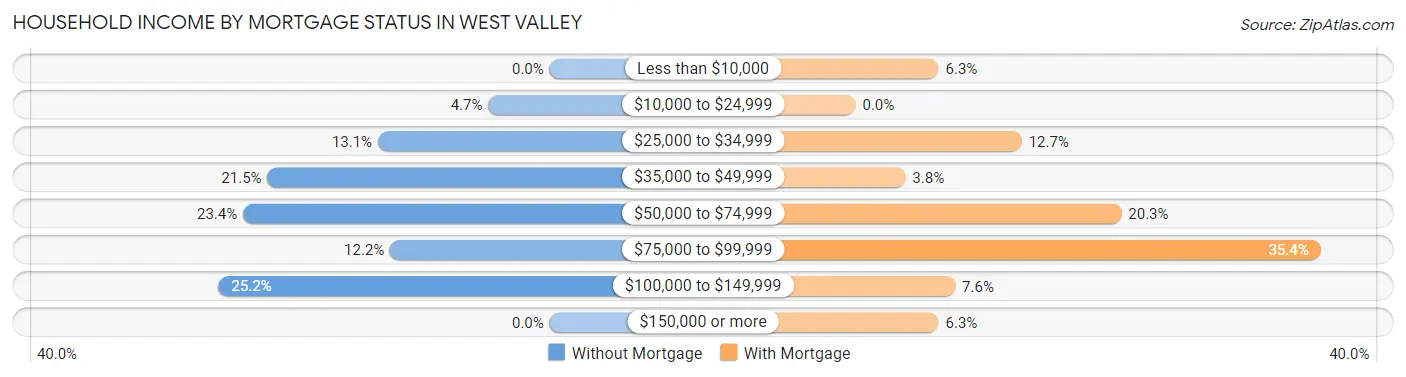
| Household Income | Without Mortgage | With Mortgage |
| Less than $10,000 | 0 (0.0%) | 5 (6.3%) |
| $10,000 to $24,999 | 5 (4.7%) | 0 (0.0%) |
| $25,000 to $34,999 | 14 (13.1%) | 10 (12.7%) |
| $35,000 to $49,999 | 23 (21.5%) | 3 (3.8%) |
| $50,000 to $74,999 | 25 (23.4%) | 16 (20.3%) |
| $75,000 to $99,999 | 13 (12.1%) | 28 (35.4%) |
| $100,000 to $149,999 | 27 (25.2%) | 6 (7.6%) |
| $150,000 or more | 0 (0.0%) | 5 (6.3%) |
| Total | 107 (100.0%) | 79 (100.0%) |
Property Value to Household Income Ratio in West Valley
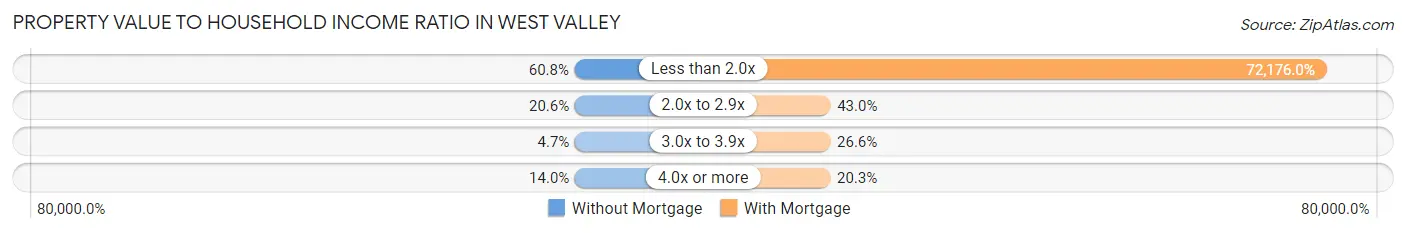
| Value-to-Income Ratio | Without Mortgage | With Mortgage |
| Less than 2.0x | 65 (60.8%) | 57,019 (72,176.0%) |
| 2.0x to 2.9x | 22 (20.6%) | 34 (43.0%) |
| 3.0x to 3.9x | 5 (4.7%) | 21 (26.6%) |
| 4.0x or more | 15 (14.0%) | 16 (20.3%) |
| Total | 107 (100.0%) | 79 (100.0%) |
Real Estate Taxes by Mortgage Status in West Valley
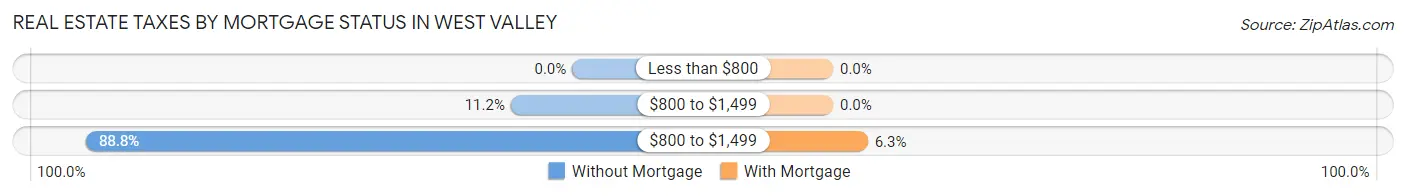
| Property Taxes | Without Mortgage | With Mortgage |
| Less than $800 | 0 (0.0%) | 0 (0.0%) |
| $800 to $1,499 | 12 (11.2%) | 0 (0.0%) |
| $800 to $1,499 | 95 (88.8%) | 5 (6.3%) |
| Total | 107 (100.0%) | 79 (100.0%) |
Health & Disability in West Valley
Health Insurance Coverage by Age in West Valley
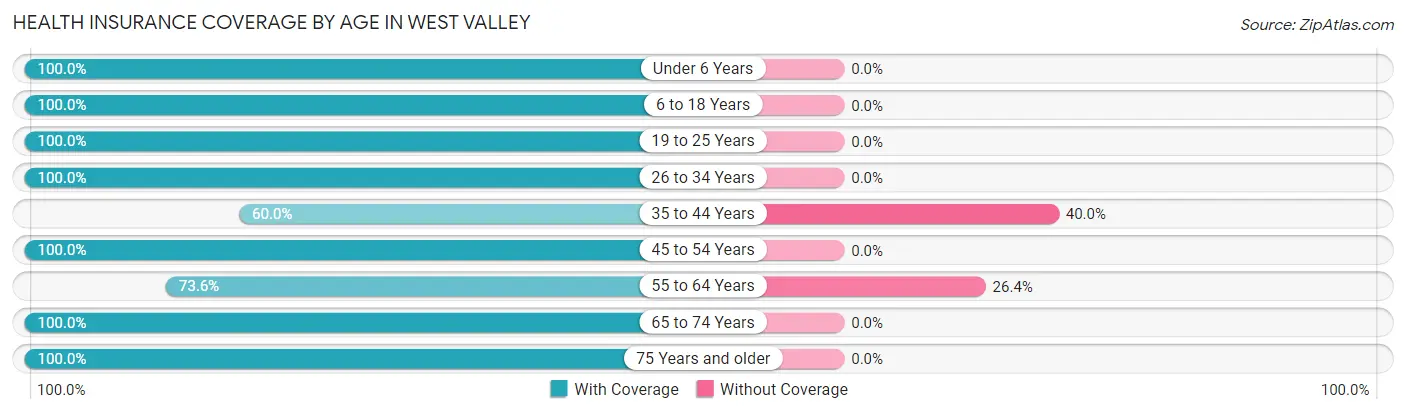
| Age Bracket | With Coverage | Without Coverage |
| Under 6 Years | 33 (100.0%) | 0 (0.0%) |
| 6 to 18 Years | 47 (100.0%) | 0 (0.0%) |
| 19 to 25 Years | 22 (100.0%) | 0 (0.0%) |
| 26 to 34 Years | 39 (100.0%) | 0 (0.0%) |
| 35 to 44 Years | 9 (60.0%) | 6 (40.0%) |
| 45 to 54 Years | 31 (100.0%) | 0 (0.0%) |
| 55 to 64 Years | 95 (73.6%) | 34 (26.4%) |
| 65 to 74 Years | 57 (100.0%) | 0 (0.0%) |
| 75 Years and older | 122 (100.0%) | 0 (0.0%) |
| Total | 455 (91.9%) | 40 (8.1%) |
Health Insurance Coverage by Citizenship Status in West Valley
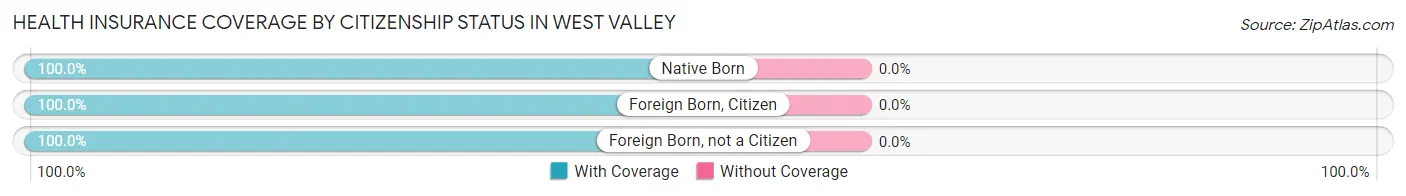
| Citizenship Status | With Coverage | Without Coverage |
| Native Born | 33 (100.0%) | 0 (0.0%) |
| Foreign Born, Citizen | 47 (100.0%) | 0 (0.0%) |
| Foreign Born, not a Citizen | 22 (100.0%) | 0 (0.0%) |
Health Insurance Coverage by Household Income in West Valley
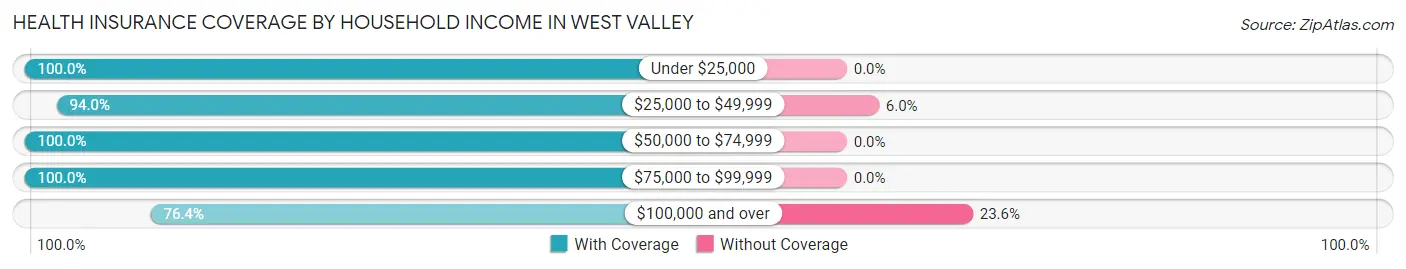
| Household Income | With Coverage | Without Coverage |
| Under $25,000 | 53 (100.0%) | 0 (0.0%) |
| $25,000 to $49,999 | 94 (94.0%) | 6 (6.0%) |
| $50,000 to $74,999 | 141 (100.0%) | 0 (0.0%) |
| $75,000 to $99,999 | 57 (100.0%) | 0 (0.0%) |
| $100,000 and over | 110 (76.4%) | 34 (23.6%) |
Public vs Private Health Insurance Coverage by Age in West Valley
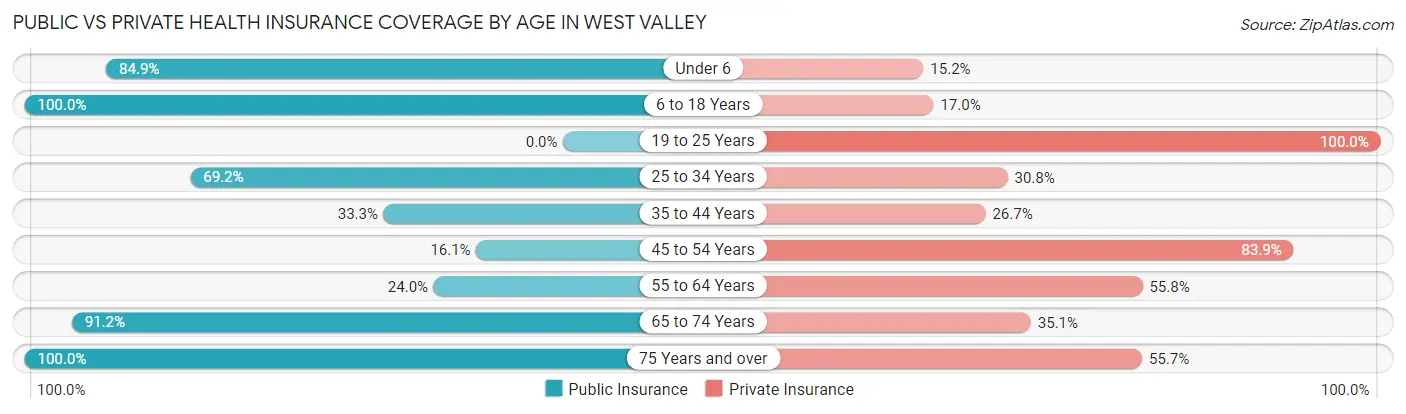
| Age Bracket | Public Insurance | Private Insurance |
| Under 6 | 28 (84.9%) | 5 (15.1%) |
| 6 to 18 Years | 47 (100.0%) | 8 (17.0%) |
| 19 to 25 Years | 0 (0.0%) | 22 (100.0%) |
| 25 to 34 Years | 27 (69.2%) | 12 (30.8%) |
| 35 to 44 Years | 5 (33.3%) | 4 (26.7%) |
| 45 to 54 Years | 5 (16.1%) | 26 (83.9%) |
| 55 to 64 Years | 31 (24.0%) | 72 (55.8%) |
| 65 to 74 Years | 52 (91.2%) | 20 (35.1%) |
| 75 Years and over | 122 (100.0%) | 68 (55.7%) |
| Total | 317 (64.0%) | 237 (47.9%) |
Disability Status by Sex by Age in West Valley
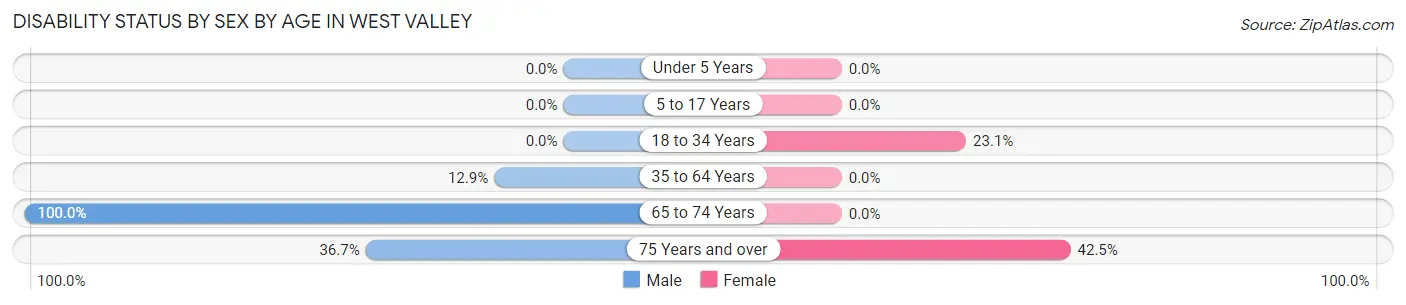
| Age Bracket | Male | Female |
| Under 5 Years | 0 (0.0%) | 0 (0.0%) |
| 5 to 17 Years | 0 (0.0%) | 0 (0.0%) |
| 18 to 34 Years | 0 (0.0%) | 9 (23.1%) |
| 35 to 64 Years | 17 (12.9%) | 0 (0.0%) |
| 65 to 74 Years | 13 (100.0%) | 0 (0.0%) |
| 75 Years and over | 18 (36.7%) | 31 (42.5%) |
Disability Class by Sex by Age in West Valley
Disability Class: Hearing Difficulty
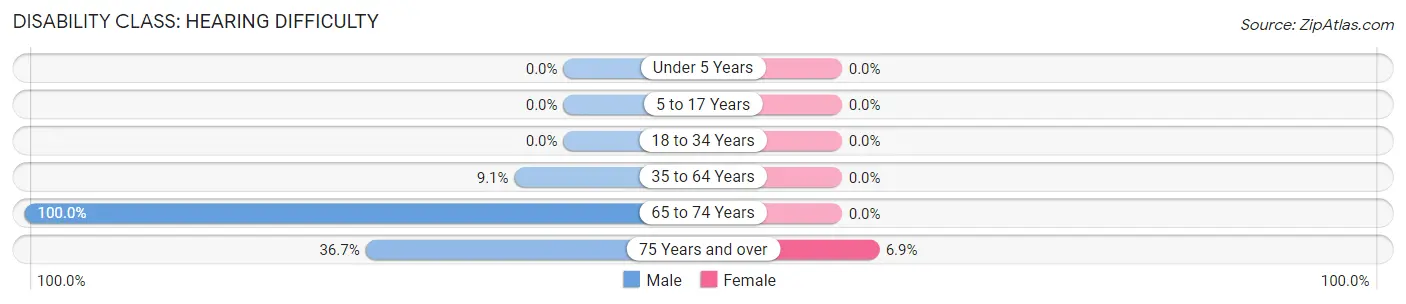
| Age Bracket | Male | Female |
| Under 5 Years | 0 (0.0%) | 0 (0.0%) |
| 5 to 17 Years | 0 (0.0%) | 0 (0.0%) |
| 18 to 34 Years | 0 (0.0%) | 0 (0.0%) |
| 35 to 64 Years | 12 (9.1%) | 0 (0.0%) |
| 65 to 74 Years | 13 (100.0%) | 0 (0.0%) |
| 75 Years and over | 18 (36.7%) | 5 (6.9%) |
Disability Class: Vision Difficulty
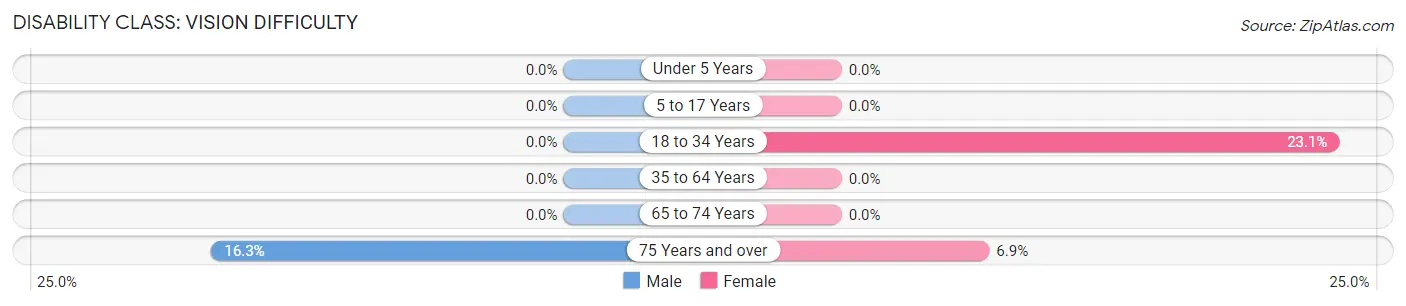
| Age Bracket | Male | Female |
| Under 5 Years | 0 (0.0%) | 0 (0.0%) |
| 5 to 17 Years | 0 (0.0%) | 0 (0.0%) |
| 18 to 34 Years | 0 (0.0%) | 9 (23.1%) |
| 35 to 64 Years | 0 (0.0%) | 0 (0.0%) |
| 65 to 74 Years | 0 (0.0%) | 0 (0.0%) |
| 75 Years and over | 8 (16.3%) | 5 (6.9%) |
Disability Class: Cognitive Difficulty
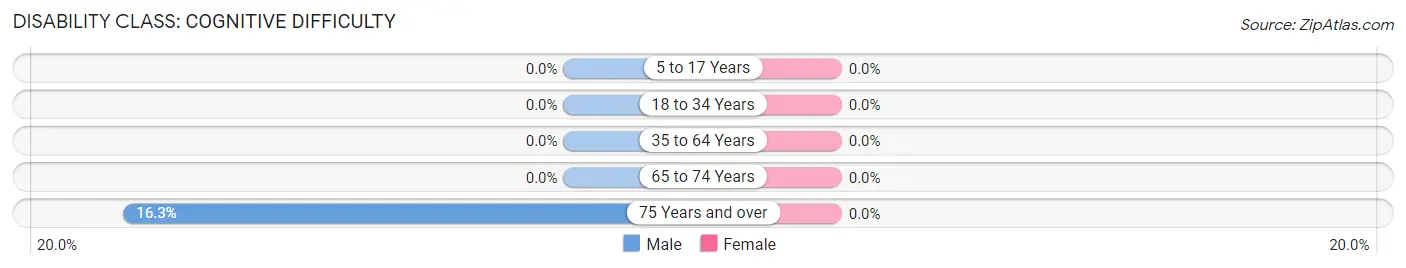
| Age Bracket | Male | Female |
| 5 to 17 Years | 0 (0.0%) | 0 (0.0%) |
| 18 to 34 Years | 0 (0.0%) | 0 (0.0%) |
| 35 to 64 Years | 0 (0.0%) | 0 (0.0%) |
| 65 to 74 Years | 0 (0.0%) | 0 (0.0%) |
| 75 Years and over | 8 (16.3%) | 0 (0.0%) |
Disability Class: Ambulatory Difficulty
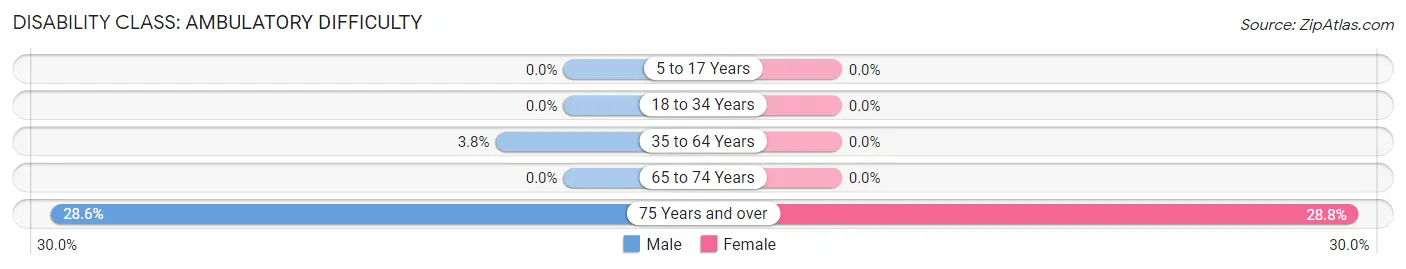
| Age Bracket | Male | Female |
| 5 to 17 Years | 0 (0.0%) | 0 (0.0%) |
| 18 to 34 Years | 0 (0.0%) | 0 (0.0%) |
| 35 to 64 Years | 5 (3.8%) | 0 (0.0%) |
| 65 to 74 Years | 0 (0.0%) | 0 (0.0%) |
| 75 Years and over | 14 (28.6%) | 21 (28.8%) |
Disability Class: Self-Care Difficulty
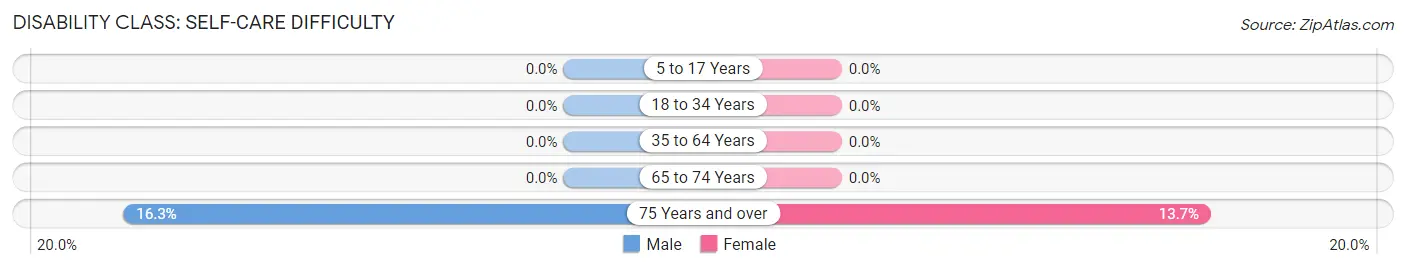
| Age Bracket | Male | Female |
| 5 to 17 Years | 0 (0.0%) | 0 (0.0%) |
| 18 to 34 Years | 0 (0.0%) | 0 (0.0%) |
| 35 to 64 Years | 0 (0.0%) | 0 (0.0%) |
| 65 to 74 Years | 0 (0.0%) | 0 (0.0%) |
| 75 Years and over | 8 (16.3%) | 10 (13.7%) |
Technology Access in West Valley
Computing Device Access in West Valley
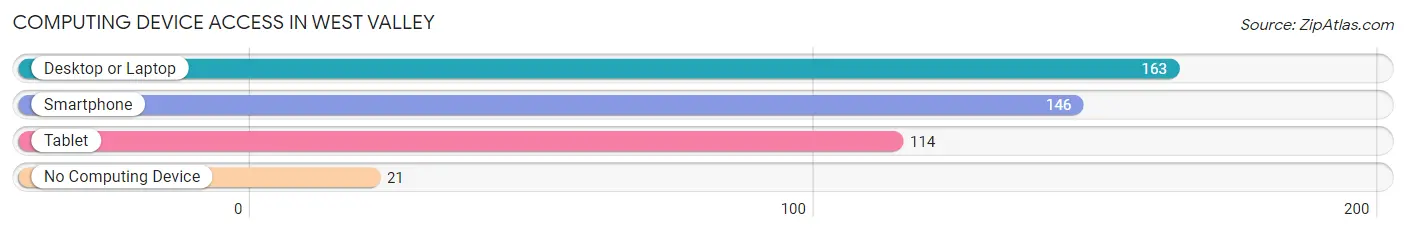
| Device Type | # Households | % Households |
| Desktop or Laptop | 163 | 76.9% |
| Smartphone | 146 | 68.9% |
| Tablet | 114 | 53.8% |
| No Computing Device | 21 | 9.9% |
| Total | 212 | 100.0% |
Internet Access in West Valley
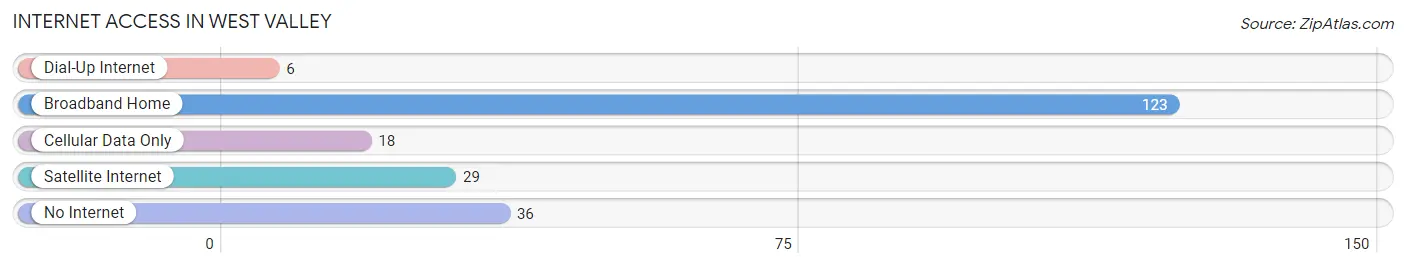
| Internet Type | # Households | % Households |
| Dial-Up Internet | 6 | 2.8% |
| Broadband Home | 123 | 58.0% |
| Cellular Data Only | 18 | 8.5% |
| Satellite Internet | 29 | 13.7% |
| No Internet | 36 | 17.0% |
| Total | 212 | 100.0% |
West Valley Summary
West Valley is a small town located in the western part of New York State, in Cattaraugus County. It is situated in the foothills of the Allegheny Mountains, and is surrounded by rolling hills and lush forests. The town has a population of approximately 1,500 people, and is home to a variety of businesses, including a small grocery store, a gas station, a post office, and a few restaurants.
History
West Valley was first settled in the early 1800s by a group of settlers from Connecticut. The town was originally known as “Westfield”, but the name was changed to “West Valley” in 1845. The town was officially incorporated in 1848.
The town was originally a farming community, and the main crops grown were wheat, corn, and potatoes. In the late 1800s, the town began to develop into a small industrial center, with several factories and mills being built. The most notable of these was the West Valley Woolen Mill, which was established in 1875 and operated until the early 1900s.
Geography
West Valley is located in the western part of New York State, in Cattaraugus County. It is situated in the foothills of the Allegheny Mountains, and is surrounded by rolling hills and lush forests. The town is located approximately 30 miles south of Buffalo, and is accessible by car via Interstate 86.
The town is situated on the banks of the West Valley Creek, which flows through the town and is a popular spot for fishing and swimming. The town is also home to several small lakes, including Lake Erie, which is located just a few miles away.
Economy
West Valley’s economy is largely based on agriculture and tourism. The town is home to several small farms, which produce a variety of crops, including wheat, corn, and potatoes. The town is also home to several small businesses, including a grocery store, a gas station, a post office, and a few restaurants.
The town is also a popular tourist destination, and is home to several attractions, including the West Valley Historical Society Museum, the West Valley Wildlife Refuge, and the West Valley State Park. The town also hosts several annual events, including the West Valley Fall Festival and the West Valley Summer Festival.
Demographics
As of the 2010 census, West Valley had a population of 1,500 people. The racial makeup of the town was 97.3% White, 0.7% African American, 0.3% Native American, 0.3% Asian, and 1.3% from other races. The median household income was $41,250, and the median family income was $50,000. The per capita income was $20,000.
Conclusion
West Valley is a small town located in the western part of New York State, in Cattaraugus County. It is situated in the foothills of the Allegheny Mountains, and is surrounded by rolling hills and lush forests. The town has a population of approximately 1,500 people, and is home to a variety of businesses, including a small grocery store, a gas station, a post office, and a few restaurants. The town’s economy is largely based on agriculture and tourism, and the town is also a popular tourist destination. The town has a diverse population, with a median household income of $41,250 and a median family income of $50,000.
Common Questions
What is the Total Population of West Valley?
Total Population of West Valley is 495.
What is the Total Male Population of West Valley?
Total Male Population of West Valley is 260.
What is the Total Female Population of West Valley?
Total Female Population of West Valley is 235.
What is the Ratio of Males per 100 Females in West Valley?
There are 110.64 Males per 100 Females in West Valley.
What is the Ratio of Females per 100 Males in West Valley?
There are 90.38 Females per 100 Males in West Valley.
What is the Median Population Age in West Valley?
Median Population Age in West Valley is 57.1 Years.
What is the Average Family Size in West Valley
Average Family Size in West Valley is 2.9 People.
What is the Average Household Size in West Valley
Average Household Size in West Valley is 2.3 People.
What is Per Capita Income in West Valley?
Per Capita income in West Valley is $26,813.
What is the Median Family Income in West Valley?
Median Family Income in West Valley is $66,691.
What is the Median Household income in West Valley?
Median Household Income in West Valley is $55,577.
What is Income or Wage Gap in West Valley?
Income or Wage Gap in West Valley is 17.4%.
Women in West Valley earn 82.6 cents for every dollar earned by a man.
What is Inequality or Gini Index in West Valley?
Inequality or Gini Index in West Valley is 0.38.
How Large is the Labor Force in West Valley?
There are 202 People in the Labor Forcein in West Valley.
What is the Percentage of People in the Labor Force in West Valley?
48.7% of People are in the Labor Force in West Valley.