West Sayville, NY
West Sayville Map
West Sayville Overview
5,032
TOTAL POPULATION
2,383
MALE POPULATION
2,649
FEMALE POPULATION
89.96
MALES / 100 FEMALES
111.16
FEMALES / 100 MALES
46.4
MEDIAN AGE
3.1
AVG FAMILY SIZE
2.8
AVG HOUSEHOLD SIZE
$62,735
PER CAPITA INCOME
$166,451
AVG FAMILY INCOME
$157,275
AVG HOUSEHOLD INCOME
30.2%
WAGE / INCOME GAP [ % ]
69.8¢/ $1
WAGE / INCOME GAP [ $ ]
0.38
INEQUALITY / GINI INDEX
2,736
LABOR FORCE [ PEOPLE ]
65.0%
PERCENT IN LABOR FORCE
3.7%
UNEMPLOYMENT RATE
West Sayville Zip Codes
West Sayville Area Codes
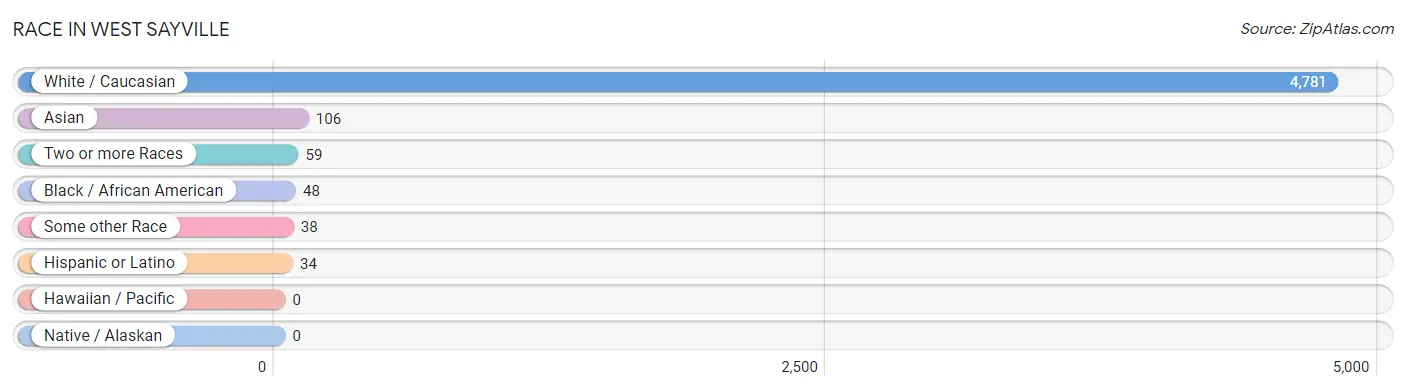
Race in West Sayville
The most populous races in West Sayville are White / Caucasian (4,781 | 95.0%), Asian (106 | 2.1%), and Two or more Races (59 | 1.2%).
| Race | # Population | % Population |
| Asian | 106 | 2.1% |
| Black / African American | 48 | 0.9% |
| Hawaiian / Pacific | 0 | 0.0% |
| Hispanic or Latino | 34 | 0.7% |
| Native / Alaskan | 0 | 0.0% |
| White / Caucasian | 4,781 | 95.0% |
| Two or more Races | 59 | 1.2% |
| Some other Race | 38 | 0.8% |
| Total | 5,032 | 100.0% |
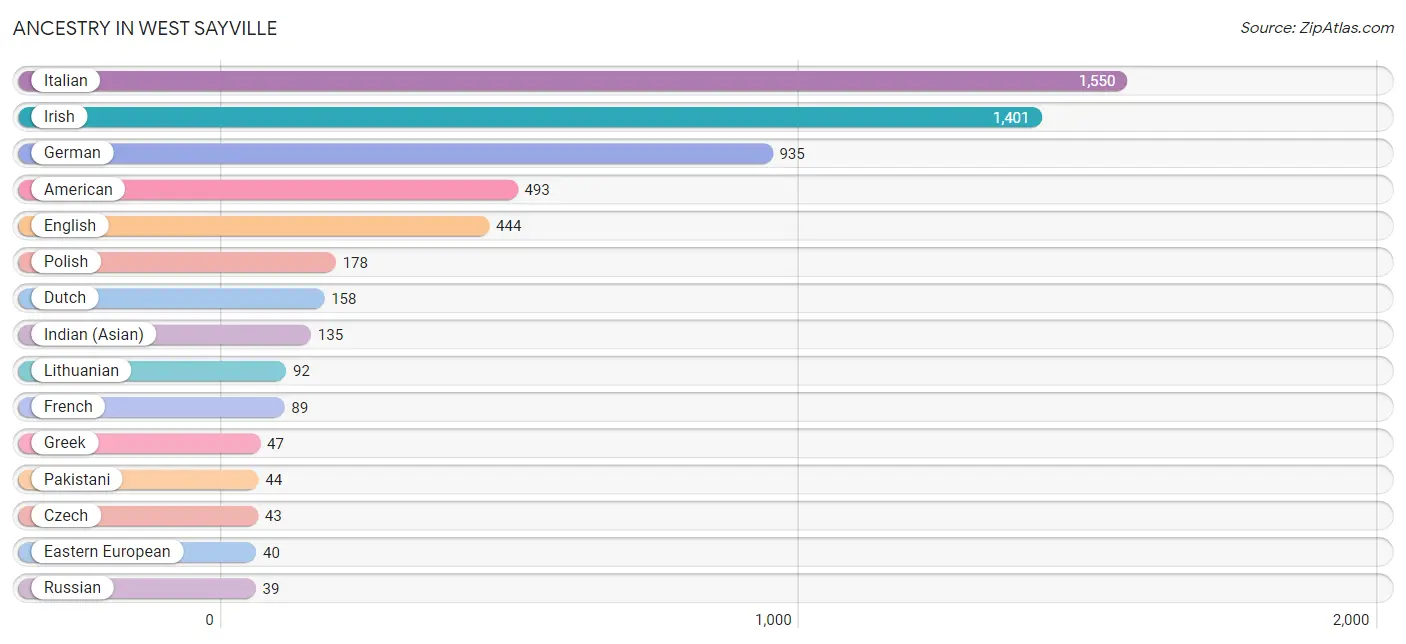
Ancestry in West Sayville
The most populous ancestries reported in West Sayville are Italian (1,550 | 30.8%), Irish (1,401 | 27.8%), German (935 | 18.6%), American (493 | 9.8%), and English (444 | 8.8%), together accounting for 95.8% of all West Sayville residents.
| Ancestry | # Population | % Population |
| Albanian | 8 | 0.2% |
| American | 493 | 9.8% |
| British | 35 | 0.7% |
| Burmese | 17 | 0.3% |
| Cuban | 11 | 0.2% |
| Czech | 43 | 0.9% |
| Dutch | 158 | 3.1% |
| Eastern European | 40 | 0.8% |
| English | 444 | 8.8% |
| French | 89 | 1.8% |
| German | 935 | 18.6% |
| Greek | 47 | 0.9% |
| Guyanese | 14 | 0.3% |
| Hungarian | 25 | 0.5% |
| Indian (Asian) | 135 | 2.7% |
| Irish | 1,401 | 27.8% |
| Italian | 1,550 | 30.8% |
| Latvian | 10 | 0.2% |
| Lithuanian | 92 | 1.8% |
| Maltese | 11 | 0.2% |
| Norwegian | 36 | 0.7% |
| Pakistani | 44 | 0.9% |
| Polish | 178 | 3.5% |
| Portuguese | 16 | 0.3% |
| Puerto Rican | 23 | 0.5% |
| Russian | 39 | 0.8% |
| Scandinavian | 9 | 0.2% |
| Scotch-Irish | 10 | 0.2% |
| Scottish | 29 | 0.6% |
| Swiss | 12 | 0.2% | View All 30 Rows |
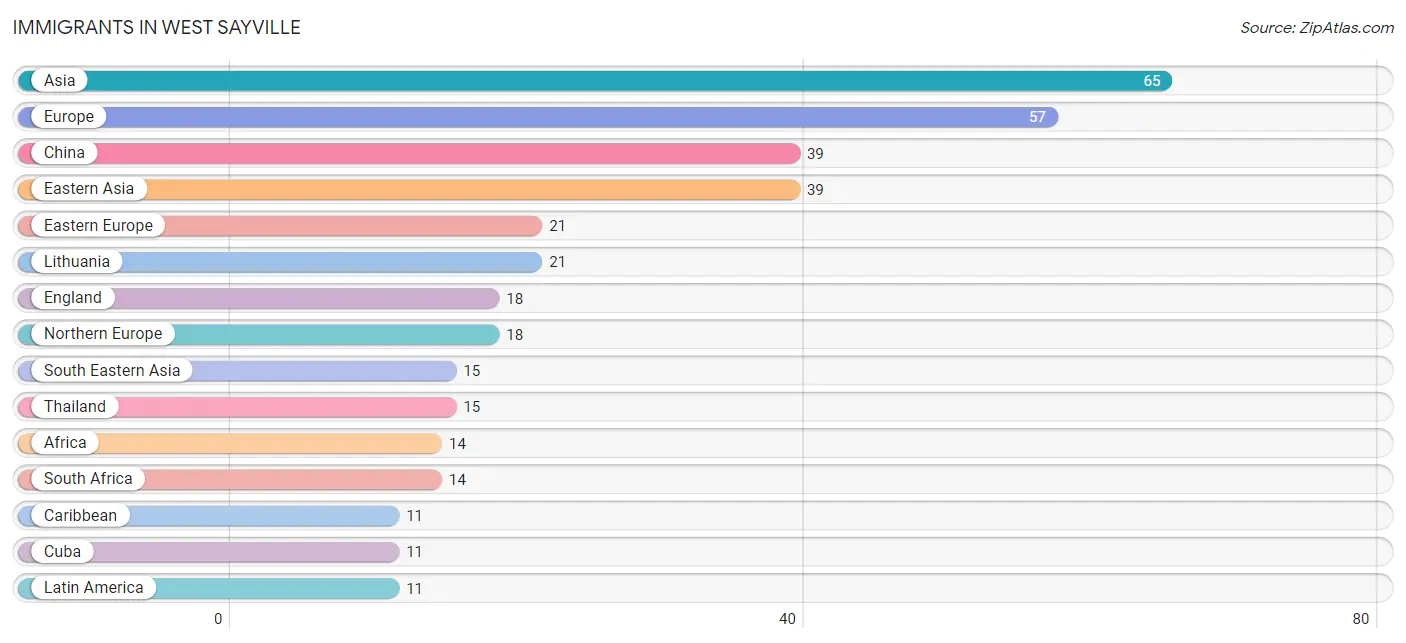
Immigrants in West Sayville
The most numerous immigrant groups reported in West Sayville came from Asia (65 | 1.3%), Europe (57 | 1.1%), China (39 | 0.8%), Eastern Asia (39 | 0.8%), and Eastern Europe (21 | 0.4%), together accounting for 4.4% of all West Sayville residents.
| Immigration Origin | # Population | % Population |
| Africa | 14 | 0.3% |
| Asia | 65 | 1.3% |
| Caribbean | 11 | 0.2% |
| China | 39 | 0.8% |
| Cuba | 11 | 0.2% |
| Eastern Asia | 39 | 0.8% |
| Eastern Europe | 21 | 0.4% |
| England | 18 | 0.4% |
| Europe | 57 | 1.1% |
| Germany | 9 | 0.2% |
| Italy | 9 | 0.2% |
| Latin America | 11 | 0.2% |
| Lithuania | 21 | 0.4% |
| Northern Europe | 18 | 0.4% |
| South Africa | 14 | 0.3% |
| South Central Asia | 11 | 0.2% |
| South Eastern Asia | 15 | 0.3% |
| Southern Europe | 9 | 0.2% |
| Thailand | 15 | 0.3% |
| Uzbekistan | 11 | 0.2% |
| Western Europe | 9 | 0.2% | View All 21 Rows |
Sex and Age in West Sayville
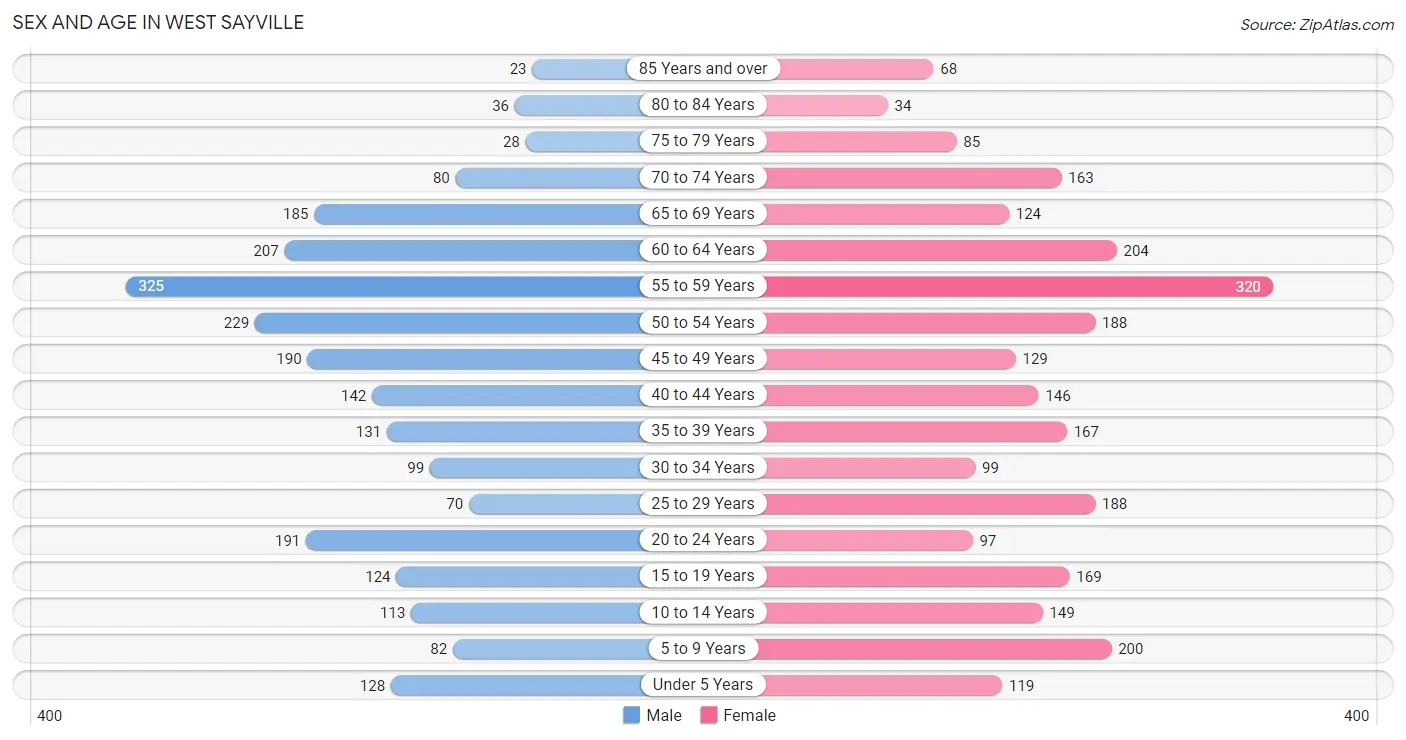
Sex and Age in West Sayville
The most populous age groups in West Sayville are 55 to 59 Years (325 | 13.6%) for men and 55 to 59 Years (320 | 12.1%) for women.
| Age Bracket | Male | Female |
| Under 5 Years | 128 (5.4%) | 119 (4.5%) |
| 5 to 9 Years | 82 (3.4%) | 200 (7.5%) |
| 10 to 14 Years | 113 (4.7%) | 149 (5.6%) |
| 15 to 19 Years | 124 (5.2%) | 169 (6.4%) |
| 20 to 24 Years | 191 (8.0%) | 97 (3.7%) |
| 25 to 29 Years | 70 (2.9%) | 188 (7.1%) |
| 30 to 34 Years | 99 (4.2%) | 99 (3.7%) |
| 35 to 39 Years | 131 (5.5%) | 167 (6.3%) |
| 40 to 44 Years | 142 (6.0%) | 146 (5.5%) |
| 45 to 49 Years | 190 (8.0%) | 129 (4.9%) |
| 50 to 54 Years | 229 (9.6%) | 188 (7.1%) |
| 55 to 59 Years | 325 (13.6%) | 320 (12.1%) |
| 60 to 64 Years | 207 (8.7%) | 204 (7.7%) |
| 65 to 69 Years | 185 (7.8%) | 124 (4.7%) |
| 70 to 74 Years | 80 (3.4%) | 163 (6.1%) |
| 75 to 79 Years | 28 (1.2%) | 85 (3.2%) |
| 80 to 84 Years | 36 (1.5%) | 34 (1.3%) |
| 85 Years and over | 23 (1.0%) | 68 (2.6%) |
| Total | 2,383 (100.0%) | 2,649 (100.0%) |
Families and Households in West Sayville
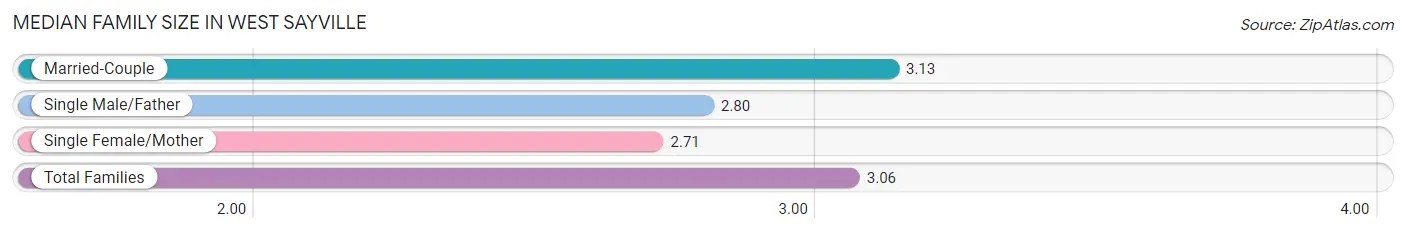
Median Family Size in West Sayville
The median family size in West Sayville is 3.06 persons per family, with married-couple families (1,221 | 82.0%) accounting for the largest median family size of 3.13 persons per family. On the other hand, single female/mother families (234 | 15.7%) represent the smallest median family size with 2.71 persons per family.
| Family Type | # Families | Family Size |
| Married-Couple | 1,221 (82.0%) | 3.13 |
| Single Male/Father | 35 (2.4%) | 2.80 |
| Single Female/Mother | 234 (15.7%) | 2.71 |
| Total Families | 1,490 (100.0%) | 3.06 |
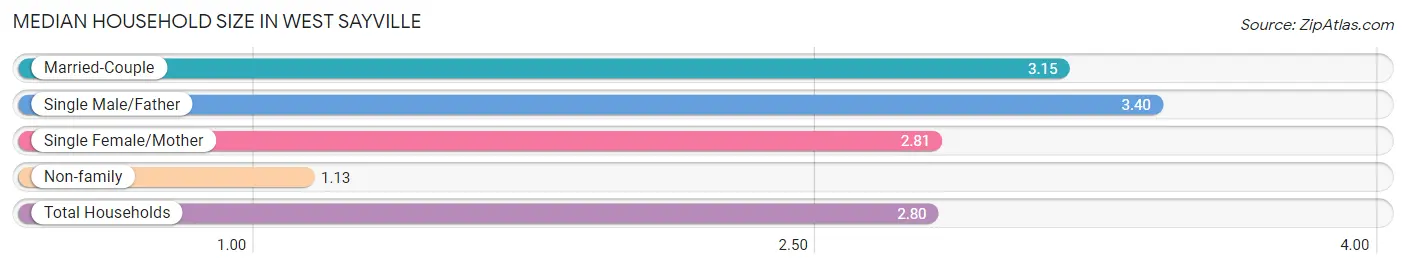
Median Household Size in West Sayville
The median household size in West Sayville is 2.80 persons per household, with single male/father households (35 | 2.0%) accounting for the largest median household size of 3.4 persons per household. non-family households (271 | 15.4%) represent the smallest median household size with 1.13 persons per household.
| Household Type | # Households | Household Size |
| Married-Couple | 1,221 (69.3%) | 3.15 |
| Single Male/Father | 35 (2.0%) | 3.40 |
| Single Female/Mother | 234 (13.3%) | 2.81 |
| Non-family | 271 (15.4%) | 1.13 |
| Total Households | 1,761 (100.0%) | 2.80 |
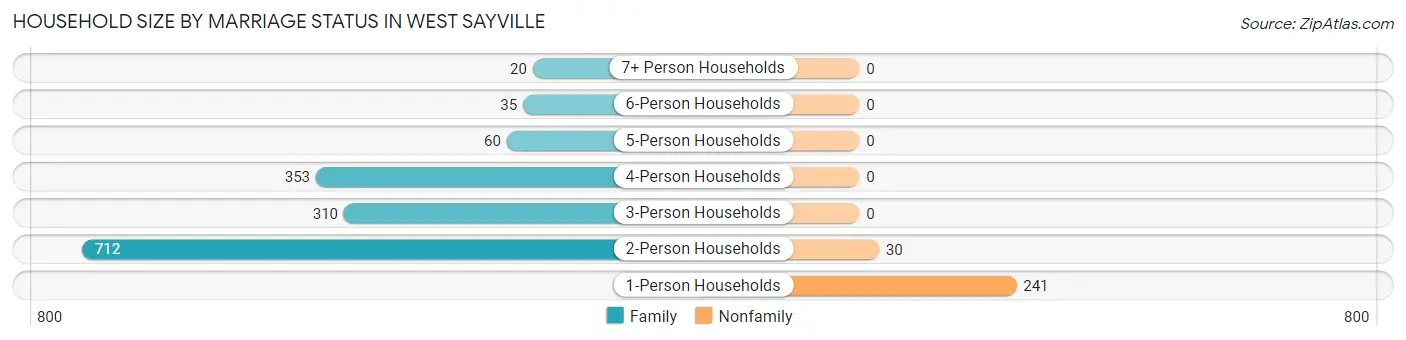
Household Size by Marriage Status in West Sayville
Out of a total of 1,761 households in West Sayville, 1,490 (84.6%) are family households, while 271 (15.4%) are nonfamily households. The most numerous type of family households are 2-person households, comprising 712, and the most common type of nonfamily households are 1-person households, comprising 241.
| Household Size | Family Households | Nonfamily Households |
| 1-Person Households | - | 241 (13.7%) |
| 2-Person Households | 712 (40.4%) | 30 (1.7%) |
| 3-Person Households | 310 (17.6%) | 0 (0.0%) |
| 4-Person Households | 353 (20.1%) | 0 (0.0%) |
| 5-Person Households | 60 (3.4%) | 0 (0.0%) |
| 6-Person Households | 35 (2.0%) | 0 (0.0%) |
| 7+ Person Households | 20 (1.1%) | 0 (0.0%) |
| Total | 1,490 (84.6%) | 271 (15.4%) |
Female Fertility in West Sayville
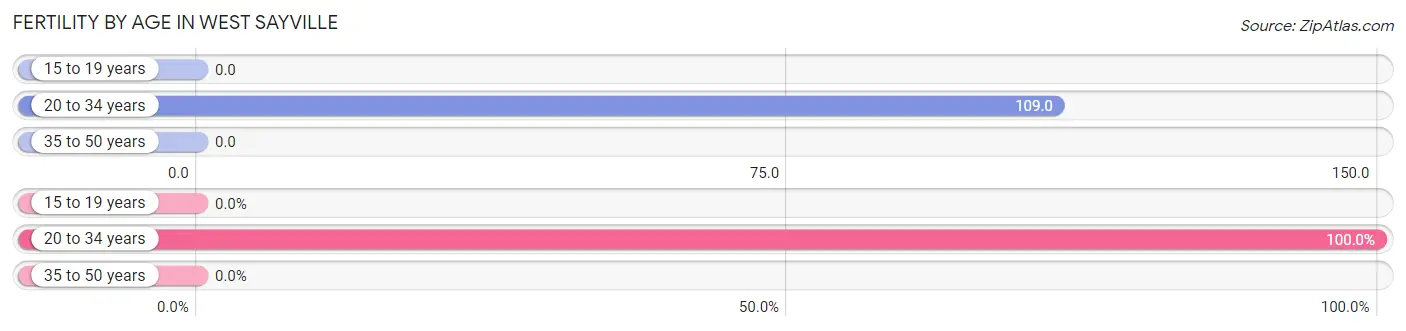
Fertility by Age in West Sayville
Average fertility rate in West Sayville is 41.0 births per 1,000 women. Women in the age bracket of 20 to 34 years have the highest fertility rate with 109.0 births per 1,000 women. Women in the age bracket of 20 to 34 years acount for 100.0% of all women with births.
| Age Bracket | Women with Births | Births / 1,000 Women |
| 15 to 19 years | 0 (0.0%) | 0.0 |
| 20 to 34 years | 42 (100.0%) | 109.0 |
| 35 to 50 years | 0 (0.0%) | 0.0 |
| Total | 42 (100.0%) | 41.0 |
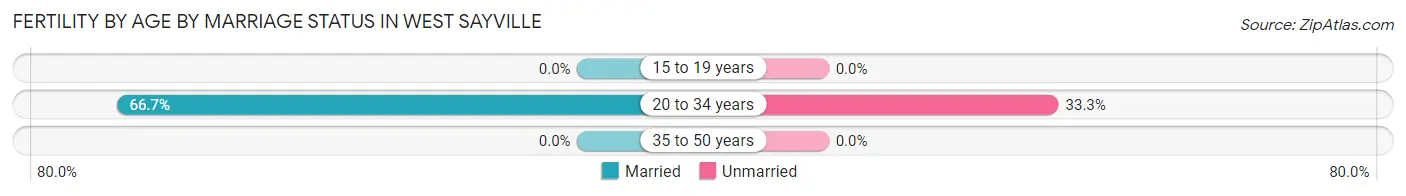
Fertility by Age by Marriage Status in West Sayville
66.7% of women with births (42) in West Sayville are married. The highest percentage of unmarried women with births falls into 20 to 34 years age bracket with 33.3% of them unmarried at the time of birth, while the lowest percentage of unmarried women with births belong to 20 to 34 years age bracket with 33.3% of them unmarried.
| Age Bracket | Married | Unmarried |
| 15 to 19 years | 0 (0.0%) | 0 (0.0%) |
| 20 to 34 years | 28 (66.7%) | 14 (33.3%) |
| 35 to 50 years | 0 (0.0%) | 0 (0.0%) |
| Total | 28 (66.7%) | 14 (33.3%) |
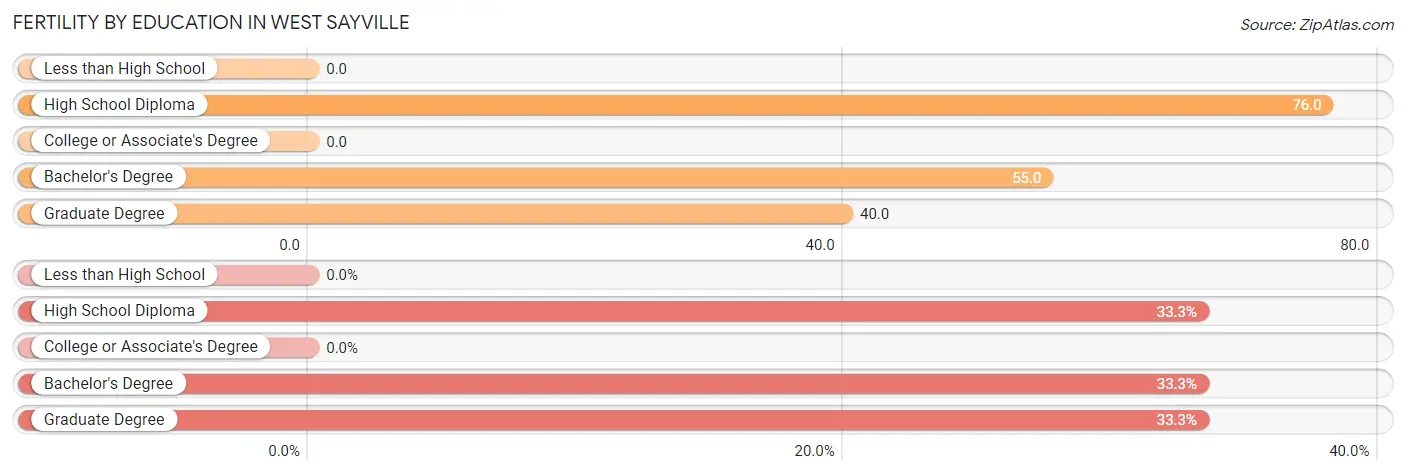
Fertility by Education in West Sayville
| Educational Attainment | Women with Births | Births / 1,000 Women |
| Less than High School | 0 (0.0%) | 0.0 |
| High School Diploma | 14 (33.3%) | 76.0 |
| College or Associate's Degree | 0 (0.0%) | 0.0 |
| Bachelor's Degree | 14 (33.3%) | 55.0 |
| Graduate Degree | 14 (33.3%) | 40.0 |
| Total | 42 (100.0%) | 41.0 |
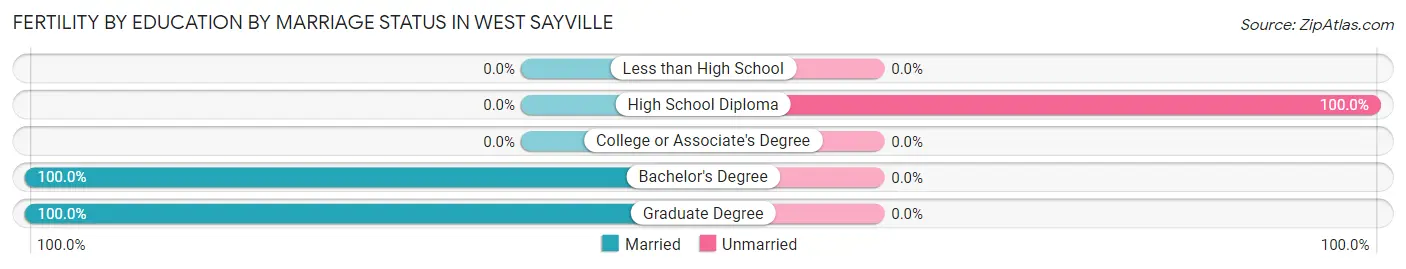
Fertility by Education by Marriage Status in West Sayville
33.3% of women with births in West Sayville are unmarried. Women with the educational attainment of bachelor's degree are most likely to be married with 100.0% of them married at childbirth, while women with the educational attainment of high school diploma are least likely to be married with 100.0% of them unmarried at childbirth.
| Educational Attainment | Married | Unmarried |
| Less than High School | 0 (0.0%) | 0 (0.0%) |
| High School Diploma | 0 (0.0%) | 14 (100.0%) |
| College or Associate's Degree | 0 (0.0%) | 0 (0.0%) |
| Bachelor's Degree | 14 (100.0%) | 0 (0.0%) |
| Graduate Degree | 14 (100.0%) | 0 (0.0%) |
| Total | 28 (66.7%) | 14 (33.3%) |
Income in West Sayville
Income Overview in West Sayville
Per Capita Income in West Sayville is $62,735, while median incomes of families and households are $166,451 and $157,275 respectively.
| Characteristic | Number | Measure |
| Per Capita Income | 5,032 | $62,735 |
| Median Family Income | 1,490 | $166,451 |
| Mean Family Income | 1,490 | $187,708 |
| Median Household Income | 1,761 | $157,275 |
| Mean Household Income | 1,761 | $173,623 |
| Income Deficit | 1,490 | $0 |
| Wage / Income Gap (%) | 5,032 | 30.16% |
| Wage / Income Gap ($) | 5,032 | 69.84¢ per $1 |
| Gini / Inequality Index | 5,032 | 0.38 |
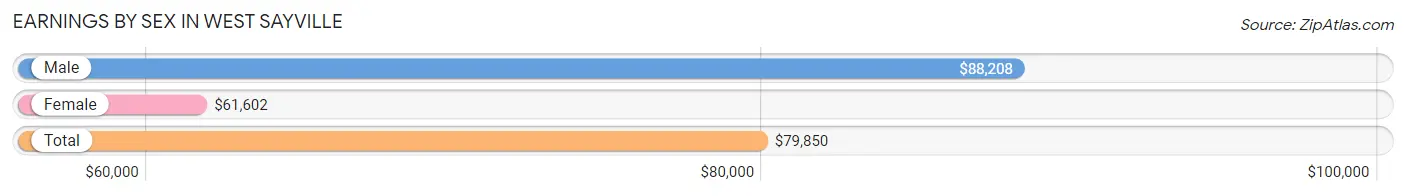
Earnings by Sex in West Sayville
Average Earnings in West Sayville are $79,850, $88,208 for men and $61,602 for women, a difference of 30.2%.
| Sex | Number | Average Earnings |
| Male | 1,515 (52.6%) | $88,208 |
| Female | 1,363 (47.4%) | $61,602 |
| Total | 2,878 (100.0%) | $79,850 |
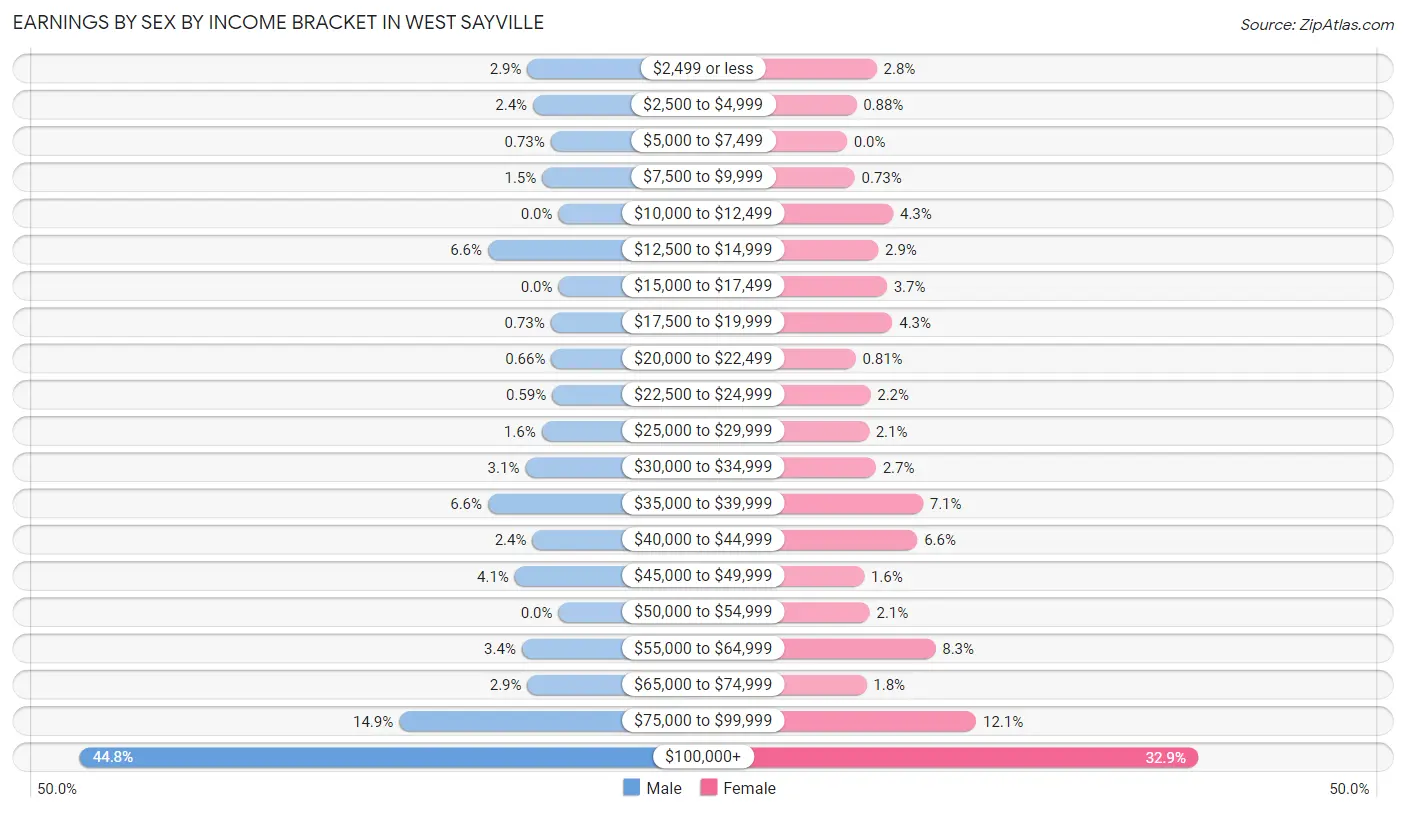
Earnings by Sex by Income Bracket in West Sayville
The most common earnings brackets in West Sayville are $100,000+ for men (679 | 44.8%) and $100,000+ for women (448 | 32.9%).
| Income | Male | Female |
| $2,499 or less | 44 (2.9%) | 38 (2.8%) |
| $2,500 to $4,999 | 36 (2.4%) | 12 (0.9%) |
| $5,000 to $7,499 | 11 (0.7%) | 0 (0.0%) |
| $7,500 to $9,999 | 23 (1.5%) | 10 (0.7%) |
| $10,000 to $12,499 | 0 (0.0%) | 59 (4.3%) |
| $12,500 to $14,999 | 100 (6.6%) | 40 (2.9%) |
| $15,000 to $17,499 | 0 (0.0%) | 51 (3.7%) |
| $17,500 to $19,999 | 11 (0.7%) | 58 (4.3%) |
| $20,000 to $22,499 | 10 (0.7%) | 11 (0.8%) |
| $22,500 to $24,999 | 9 (0.6%) | 30 (2.2%) |
| $25,000 to $29,999 | 24 (1.6%) | 28 (2.1%) |
| $30,000 to $34,999 | 47 (3.1%) | 37 (2.7%) |
| $35,000 to $39,999 | 100 (6.6%) | 97 (7.1%) |
| $40,000 to $44,999 | 37 (2.4%) | 90 (6.6%) |
| $45,000 to $49,999 | 62 (4.1%) | 22 (1.6%) |
| $50,000 to $54,999 | 0 (0.0%) | 29 (2.1%) |
| $55,000 to $64,999 | 52 (3.4%) | 113 (8.3%) |
| $65,000 to $74,999 | 44 (2.9%) | 25 (1.8%) |
| $75,000 to $99,999 | 226 (14.9%) | 165 (12.1%) |
| $100,000+ | 679 (44.8%) | 448 (32.9%) |
| Total | 1,515 (100.0%) | 1,363 (100.0%) |
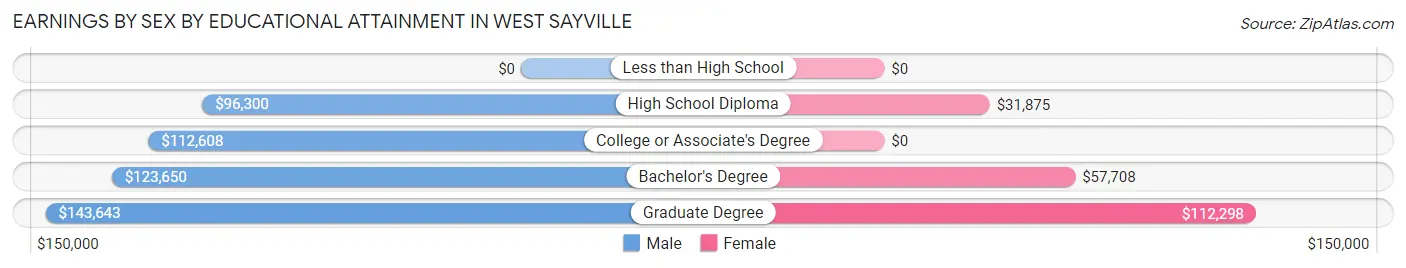
Earnings by Sex by Educational Attainment in West Sayville
Average earnings in West Sayville are $113,125 for men and $63,472 for women, a difference of 43.9%. Men with an educational attainment of graduate degree enjoy the highest average annual earnings of $143,643, while those with high school diploma education earn the least with $96,300. Women with an educational attainment of graduate degree earn the most with the average annual earnings of $112,298, while those with high school diploma education have the smallest earnings of $31,875.
| Educational Attainment | Male Income | Female Income |
| Less than High School | - | - |
| High School Diploma | $96,300 | $31,875 |
| College or Associate's Degree | $112,608 | $0 |
| Bachelor's Degree | $123,650 | $57,708 |
| Graduate Degree | $143,643 | $112,298 |
| Total | $113,125 | $63,472 |
Family Income in West Sayville
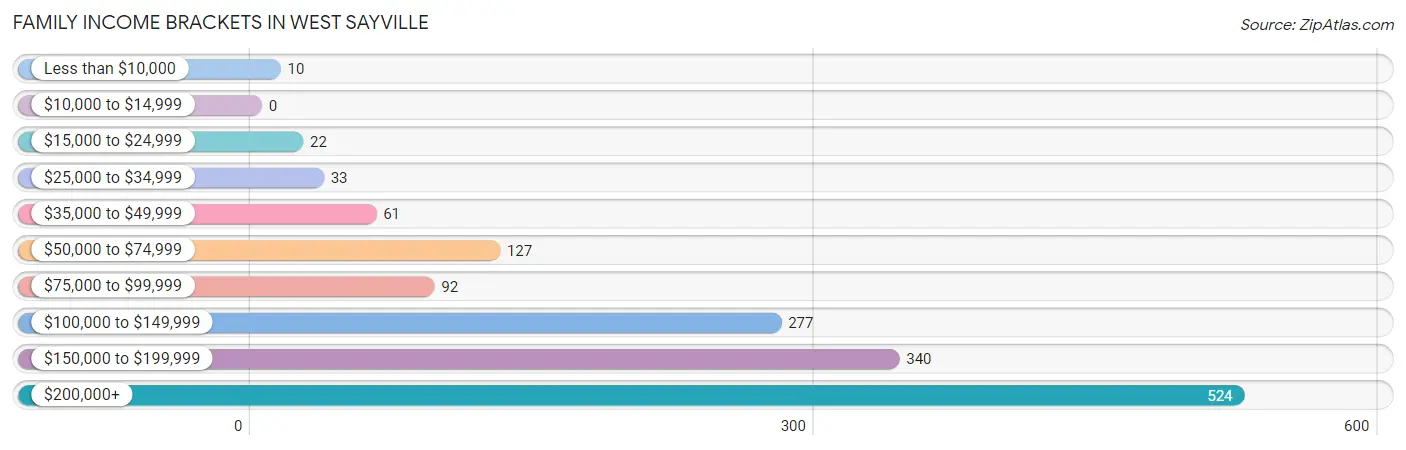
Family Income Brackets in West Sayville
According to the West Sayville family income data, there are 524 families falling into the $200,000+ income range, which is the most common income bracket and makes up 35.2% of all families.
| Income Bracket | # Families | % Families |
| Less than $10,000 | 10 | 0.7% |
| $10,000 to $14,999 | 0 | 0.0% |
| $15,000 to $24,999 | 22 | 1.5% |
| $25,000 to $34,999 | 33 | 2.2% |
| $35,000 to $49,999 | 61 | 4.1% |
| $50,000 to $74,999 | 127 | 8.5% |
| $75,000 to $99,999 | 92 | 6.2% |
| $100,000 to $149,999 | 277 | 18.6% |
| $150,000 to $199,999 | 340 | 22.8% |
| $200,000+ | 524 | 35.2% |
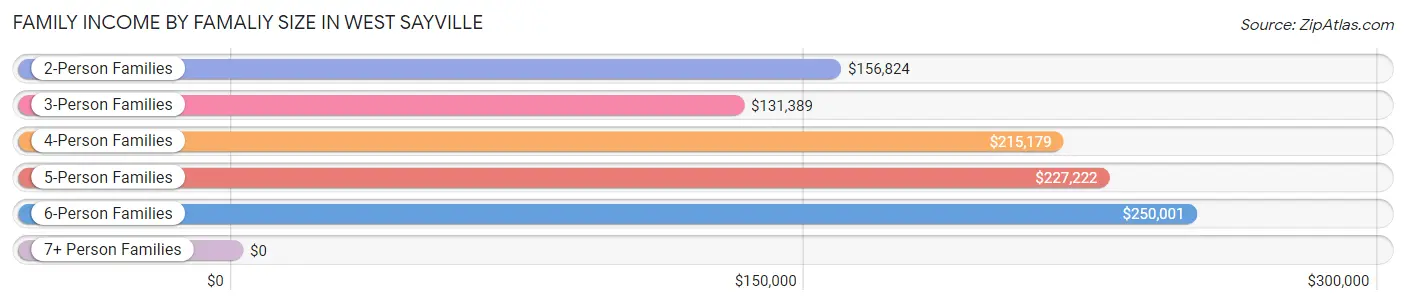
Family Income by Famaliy Size in West Sayville
6-person families (35 | 2.4%) account for the highest median family income in West Sayville with $250,001 per family, while 2-person families (735 | 49.3%) have the highest median income of $78,412 per family member.
| Income Bracket | # Families | Median Income |
| 2-Person Families | 735 (49.3%) | $156,824 |
| 3-Person Families | 316 (21.2%) | $131,389 |
| 4-Person Families | 334 (22.4%) | $215,179 |
| 5-Person Families | 50 (3.4%) | $227,222 |
| 6-Person Families | 35 (2.4%) | $250,001 |
| 7+ Person Families | 20 (1.3%) | $0 |
| Total | 1,490 (100.0%) | $166,451 |
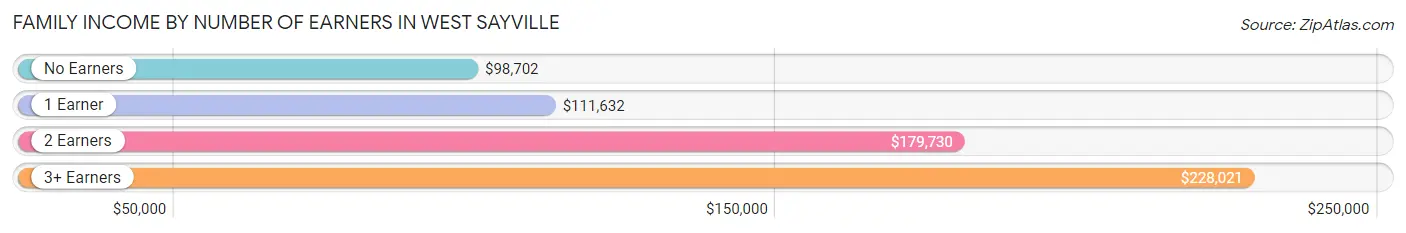
Family Income by Number of Earners in West Sayville
The median family income in West Sayville is $166,451, with families comprising 3+ earners (204) having the highest median family income of $228,021, while families with no earners (183) have the lowest median family income of $98,702, accounting for 13.7% and 12.3% of families, respectively.
| Number of Earners | # Families | Median Income |
| No Earners | 183 (12.3%) | $98,702 |
| 1 Earner | 353 (23.7%) | $111,632 |
| 2 Earners | 750 (50.3%) | $179,730 |
| 3+ Earners | 204 (13.7%) | $228,021 |
| Total | 1,490 (100.0%) | $166,451 |
Household Income in West Sayville
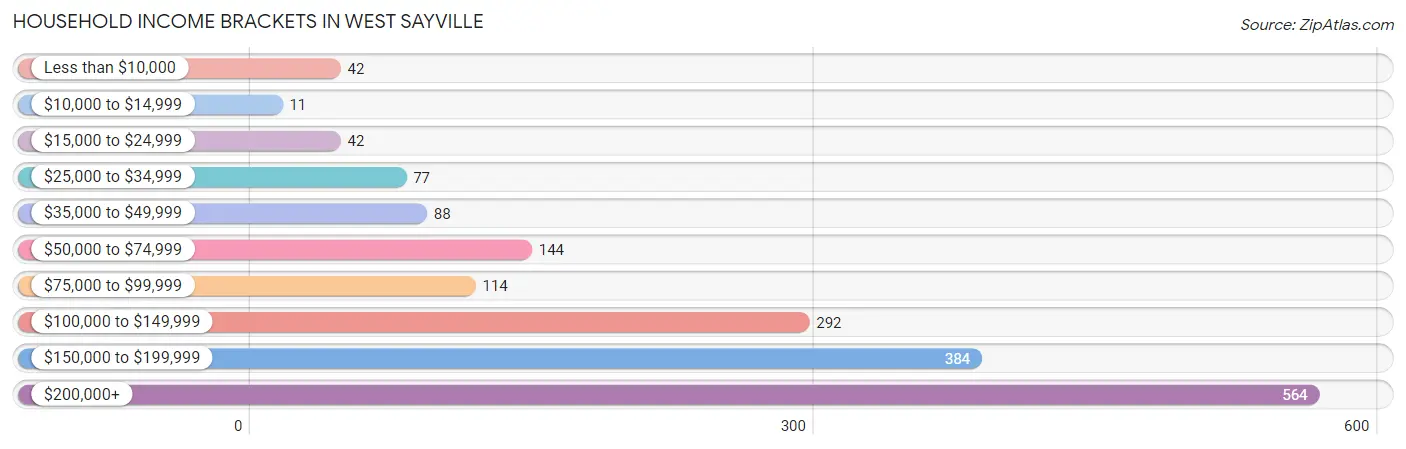
Household Income Brackets in West Sayville
With 564 households falling in the category, the $200,000+ income range is the most frequent in West Sayville, accounting for 32.0% of all households. In contrast, only 11 households (0.6%) fall into the $10,000 to $14,999 income bracket, making it the least populous group.
| Income Bracket | # Households | % Households |
| Less than $10,000 | 42 | 2.4% |
| $10,000 to $14,999 | 11 | 0.6% |
| $15,000 to $24,999 | 42 | 2.4% |
| $25,000 to $34,999 | 77 | 4.4% |
| $35,000 to $49,999 | 88 | 5.0% |
| $50,000 to $74,999 | 144 | 8.2% |
| $75,000 to $99,999 | 114 | 6.5% |
| $100,000 to $149,999 | 292 | 16.6% |
| $150,000 to $199,999 | 384 | 21.8% |
| $200,000+ | 564 | 32.0% |
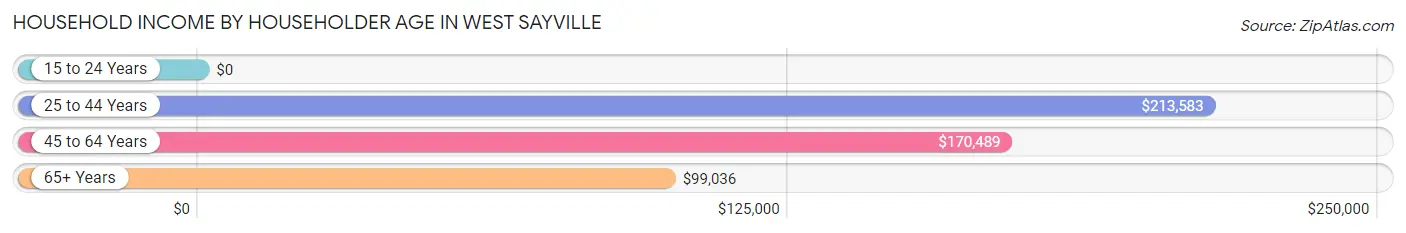
Household Income by Householder Age in West Sayville
The median household income in West Sayville is $157,275, with the highest median household income of $213,583 found in the 25 to 44 years age bracket for the primary householder. A total of 339 households (19.3%) fall into this category.
| Income Bracket | # Households | Median Income |
| 15 to 24 Years | 0 (0.0%) | $0 |
| 25 to 44 Years | 339 (19.3%) | $213,583 |
| 45 to 64 Years | 899 (51.0%) | $170,489 |
| 65+ Years | 523 (29.7%) | $99,036 |
| Total | 1,761 (100.0%) | $157,275 |
Poverty in West Sayville
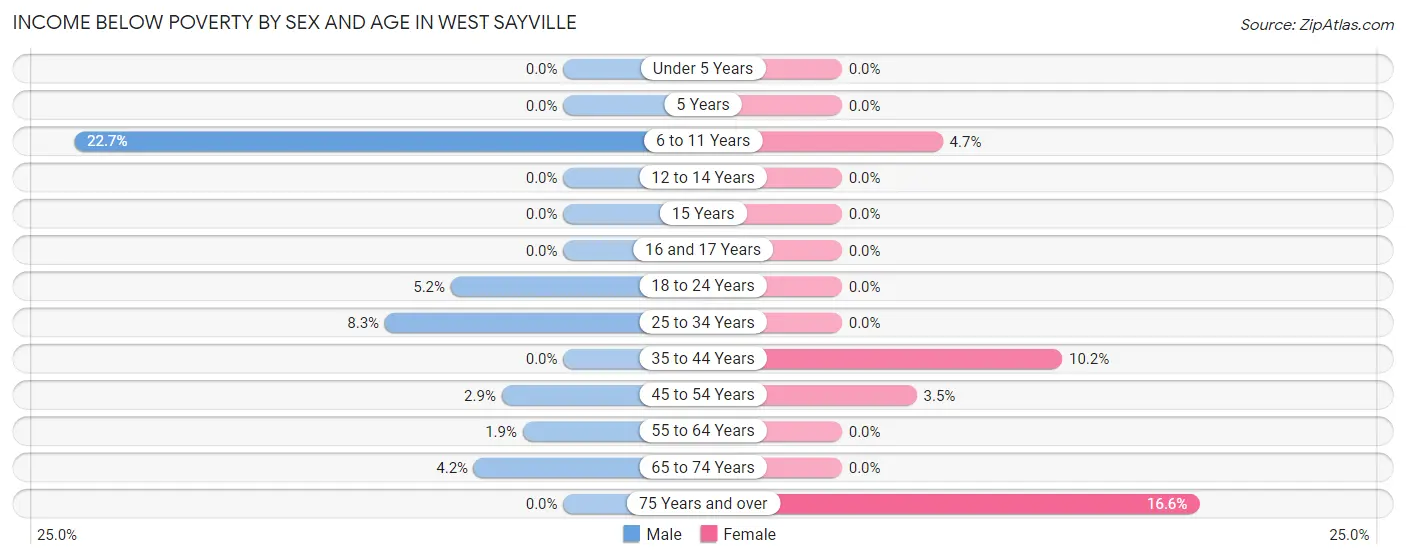
Income Below Poverty by Sex and Age in West Sayville
With 4.1% poverty level for males and 3.3% for females among the residents of West Sayville, 6 to 11 year old males and 75 year old and over females are the most vulnerable to poverty, with 37 males (22.7%) and 31 females (16.6%) in their respective age groups living below the poverty level.
| Age Bracket | Male | Female |
| Under 5 Years | 0 (0.0%) | 0 (0.0%) |
| 5 Years | 0 (0.0%) | 0 (0.0%) |
| 6 to 11 Years | 37 (22.7%) | 13 (4.7%) |
| 12 to 14 Years | 0 (0.0%) | 0 (0.0%) |
| 15 Years | 0 (0.0%) | 0 (0.0%) |
| 16 and 17 Years | 0 (0.0%) | 0 (0.0%) |
| 18 to 24 Years | 14 (5.2%) | 0 (0.0%) |
| 25 to 34 Years | 14 (8.3%) | 0 (0.0%) |
| 35 to 44 Years | 0 (0.0%) | 32 (10.2%) |
| 45 to 54 Years | 12 (2.9%) | 11 (3.5%) |
| 55 to 64 Years | 10 (1.9%) | 0 (0.0%) |
| 65 to 74 Years | 11 (4.2%) | 0 (0.0%) |
| 75 Years and over | 0 (0.0%) | 31 (16.6%) |
| Total | 98 (4.1%) | 87 (3.3%) |
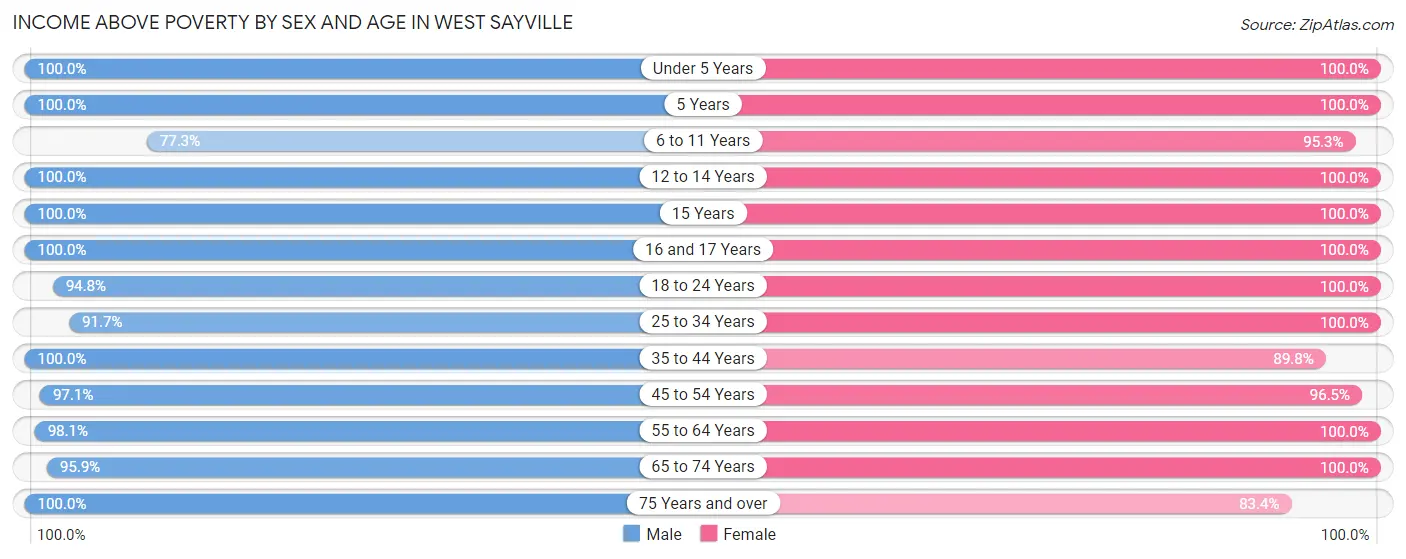
Income Above Poverty by Sex and Age in West Sayville
According to the poverty statistics in West Sayville, males aged under 5 years and females aged under 5 years are the age groups that are most secure financially, with 100.0% of males and 100.0% of females in these age groups living above the poverty line.
| Age Bracket | Male | Female |
| Under 5 Years | 128 (100.0%) | 119 (100.0%) |
| 5 Years | 10 (100.0%) | 27 (100.0%) |
| 6 to 11 Years | 126 (77.3%) | 265 (95.3%) |
| 12 to 14 Years | 22 (100.0%) | 44 (100.0%) |
| 15 Years | 13 (100.0%) | 18 (100.0%) |
| 16 and 17 Years | 34 (100.0%) | 51 (100.0%) |
| 18 to 24 Years | 254 (94.8%) | 197 (100.0%) |
| 25 to 34 Years | 155 (91.7%) | 287 (100.0%) |
| 35 to 44 Years | 273 (100.0%) | 281 (89.8%) |
| 45 to 54 Years | 407 (97.1%) | 306 (96.5%) |
| 55 to 64 Years | 522 (98.1%) | 524 (100.0%) |
| 65 to 74 Years | 254 (95.9%) | 287 (100.0%) |
| 75 Years and over | 87 (100.0%) | 156 (83.4%) |
| Total | 2,285 (95.9%) | 2,562 (96.7%) |
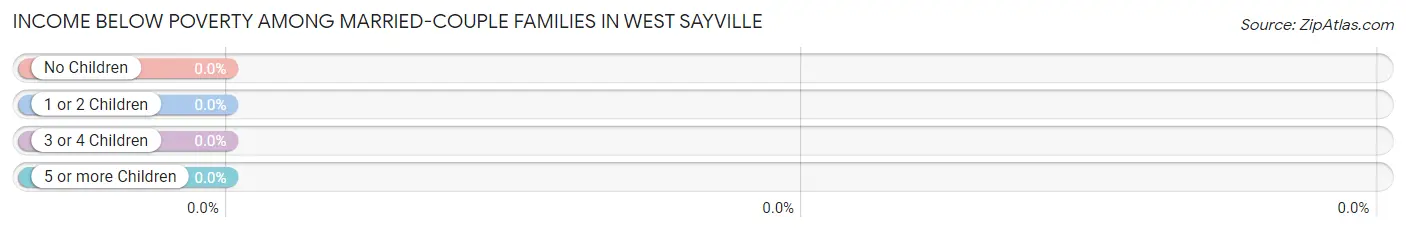
Income Below Poverty Among Married-Couple Families in West Sayville
| Children | Above Poverty | Below Poverty |
| No Children | 772 (100.0%) | 0 (0.0%) |
| 1 or 2 Children | 422 (100.0%) | 0 (0.0%) |
| 3 or 4 Children | 27 (100.0%) | 0 (0.0%) |
| 5 or more Children | 0 (0.0%) | 0 (0.0%) |
| Total | 1,221 (100.0%) | 0 (0.0%) |
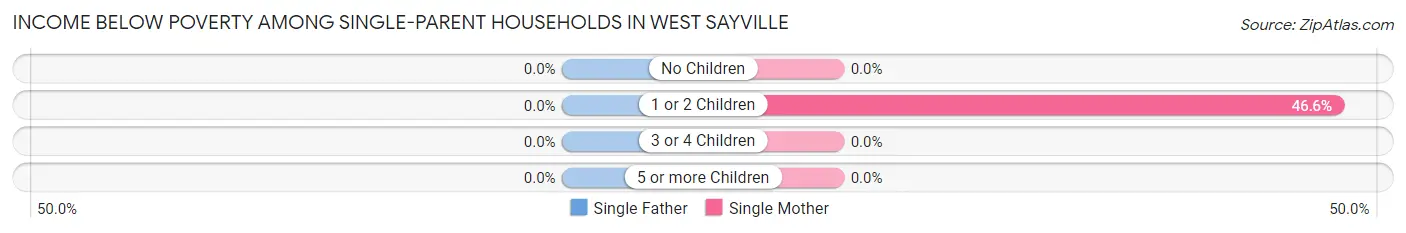
Income Below Poverty Among Single-Parent Households in West Sayville
| Children | Single Father | Single Mother |
| No Children | 0 (0.0%) | 0 (0.0%) |
| 1 or 2 Children | 0 (0.0%) | 34 (46.6%) |
| 3 or 4 Children | 0 (0.0%) | 0 (0.0%) |
| 5 or more Children | 0 (0.0%) | 0 (0.0%) |
| Total | 0 (0.0%) | 34 (14.5%) |
Income Below Poverty Among Married-Couple vs Single-Parent Households in West Sayville
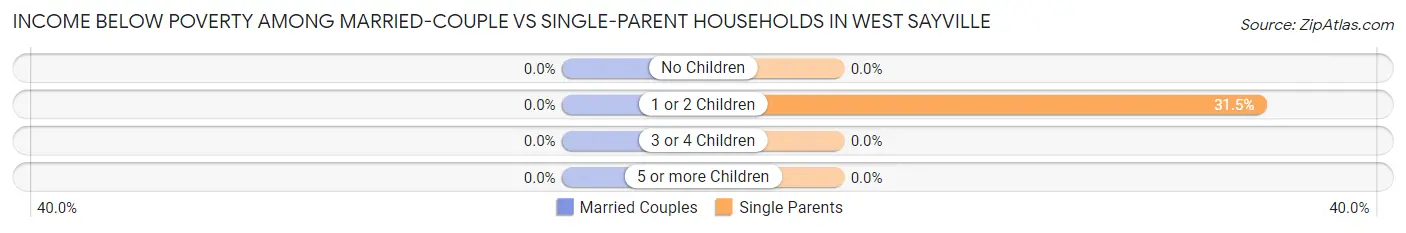
| Children | Married-Couple Families | Single-Parent Households |
| No Children | 0 (0.0%) | 0 (0.0%) |
| 1 or 2 Children | 0 (0.0%) | 34 (31.5%) |
| 3 or 4 Children | 0 (0.0%) | 0 (0.0%) |
| 5 or more Children | 0 (0.0%) | 0 (0.0%) |
| Total | 0 (0.0%) | 34 (12.6%) |
Employment Characteristics in West Sayville
Employment by Class of Employer in West Sayville
Among the 2,512 employed individuals in West Sayville, private company employees (1,499 | 59.7%), local government employees (649 | 25.8%), and state government employees (95 | 3.8%) make up the most common classes of employment.
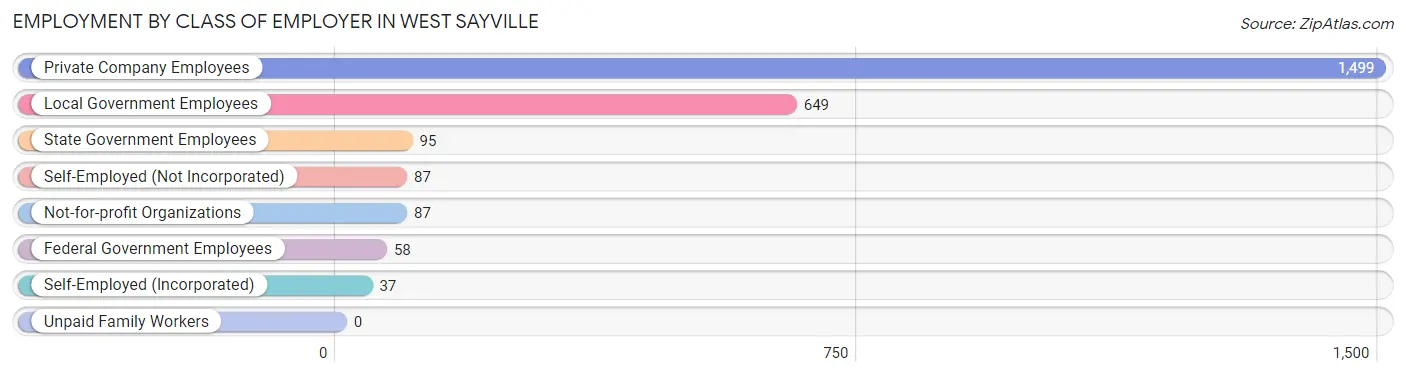
| Employer Class | # Employees | % Employees |
| Private Company Employees | 1,499 | 59.7% |
| Self-Employed (Incorporated) | 37 | 1.5% |
| Self-Employed (Not Incorporated) | 87 | 3.5% |
| Not-for-profit Organizations | 87 | 3.5% |
| Local Government Employees | 649 | 25.8% |
| State Government Employees | 95 | 3.8% |
| Federal Government Employees | 58 | 2.3% |
| Unpaid Family Workers | 0 | 0.0% |
| Total | 2,512 | 100.0% |
Employment Status by Age in West Sayville
According to the labor force statistics for West Sayville, out of the total population over 16 years of age (4,210), 65.0% or 2,736 individuals are in the labor force, with 3.7% or 101 of them unemployed. The age group with the highest labor force participation rate is 35 to 44 years, with 92.2% or 540 individuals in the labor force. Within the labor force, the 75 years and over age range has the highest percentage of unemployed individuals, with 100.0% or 31 of them being unemployed.
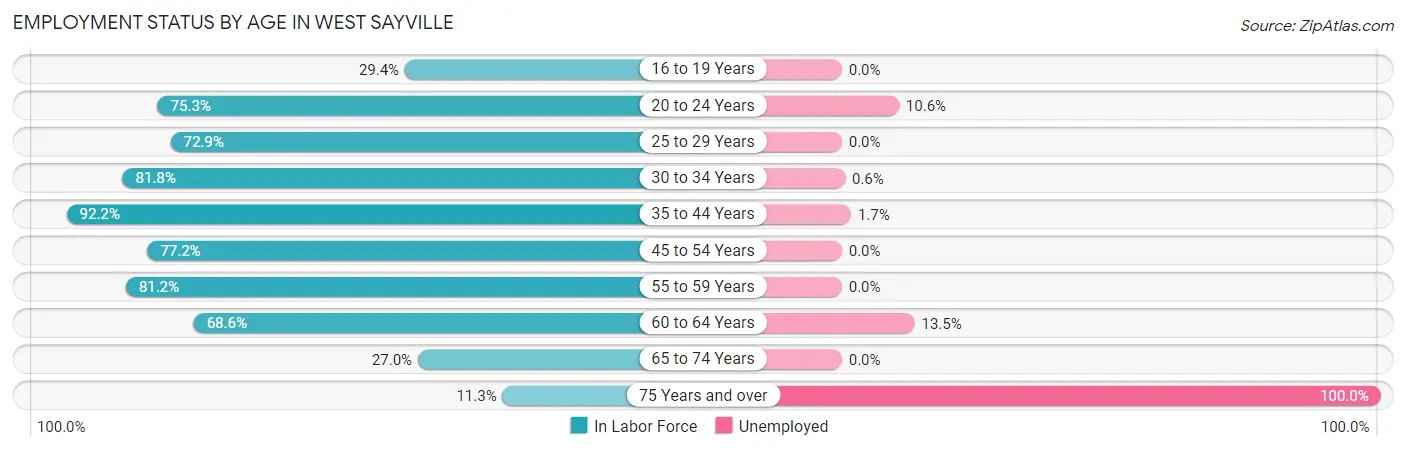
| Age Bracket | In Labor Force | Unemployed |
| 16 to 19 Years | 77 (29.4%) | 0 (0.0%) |
| 20 to 24 Years | 217 (75.3%) | 23 (10.6%) |
| 25 to 29 Years | 188 (72.9%) | 0 (0.0%) |
| 30 to 34 Years | 162 (81.8%) | 1 (0.6%) |
| 35 to 44 Years | 540 (92.2%) | 9 (1.7%) |
| 45 to 54 Years | 568 (77.2%) | 0 (0.0%) |
| 55 to 59 Years | 524 (81.2%) | 0 (0.0%) |
| 60 to 64 Years | 282 (68.6%) | 38 (13.5%) |
| 65 to 74 Years | 149 (27.0%) | 0 (0.0%) |
| 75 Years and over | 31 (11.3%) | 31 (100.0%) |
| Total | 2,736 (65.0%) | 101 (3.7%) |
Employment Status by Educational Attainment in West Sayville
According to labor force statistics for West Sayville, 79.9% of individuals (2,264) out of the total population between 25 and 64 years of age (2,834) are in the labor force, with 2.1% or 48 of them being unemployed. The group with the highest labor force participation rate are those with the educational attainment of bachelor's degree or higher, with 87.0% or 1,114 individuals in the labor force. Within the labor force, individuals with college / associate degree education have the highest percentage of unemployment, with 4.0% or 30 of them being unemployed.
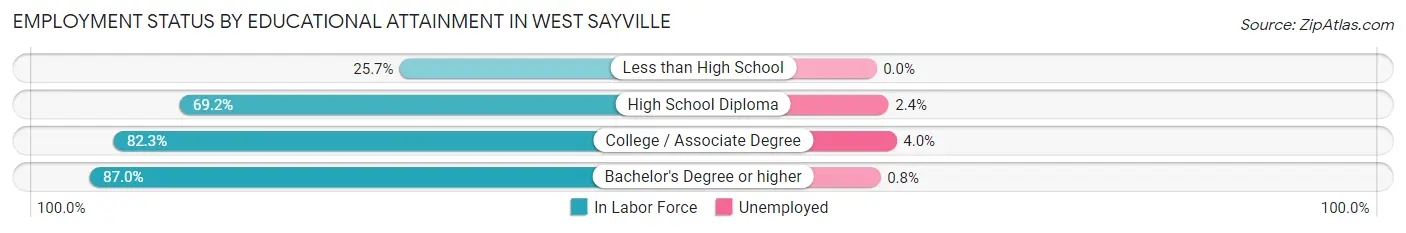
| Educational Attainment | In Labor Force | Unemployed |
| Less than High School | 27 (25.7%) | 0 (0.0%) |
| High School Diploma | 369 (69.2%) | 13 (2.4%) |
| College / Associate Degree | 754 (82.3%) | 37 (4.0%) |
| Bachelor's Degree or higher | 1,114 (87.0%) | 10 (0.8%) |
| Total | 2,264 (79.9%) | 60 (2.1%) |
Employment Occupations by Sex in West Sayville
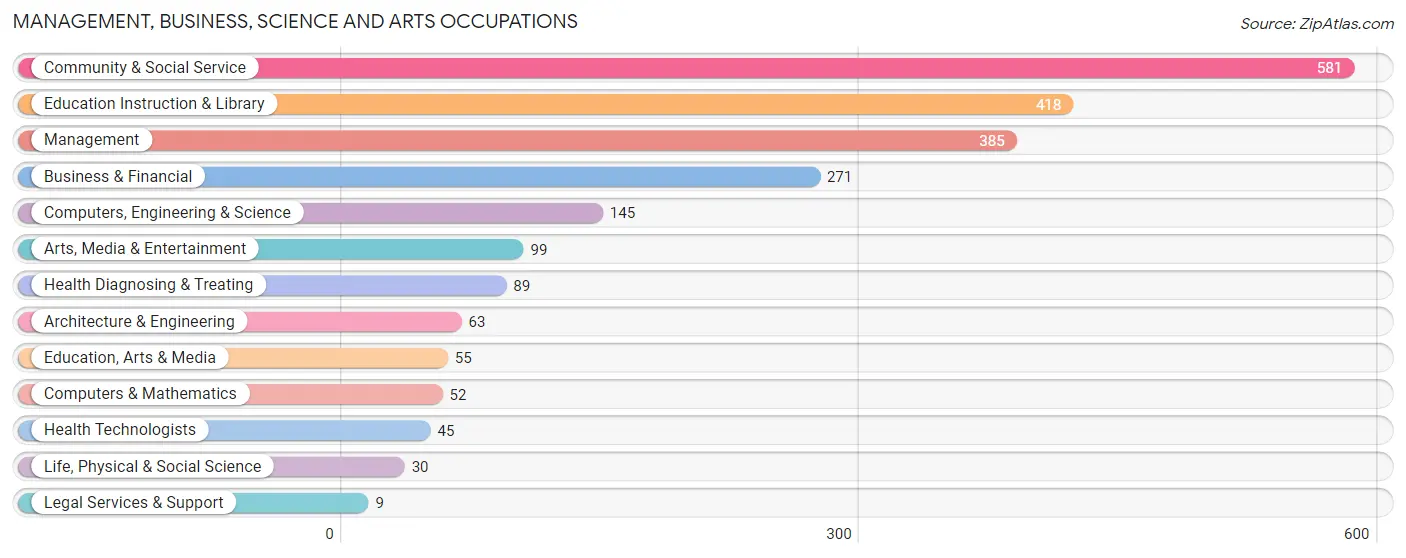
Management, Business, Science and Arts Occupations
The most common Management, Business, Science and Arts occupations in West Sayville are Community & Social Service (581 | 22.0%), Education Instruction & Library (418 | 15.9%), Management (385 | 14.6%), Business & Financial (271 | 10.3%), and Computers, Engineering & Science (145 | 5.5%).
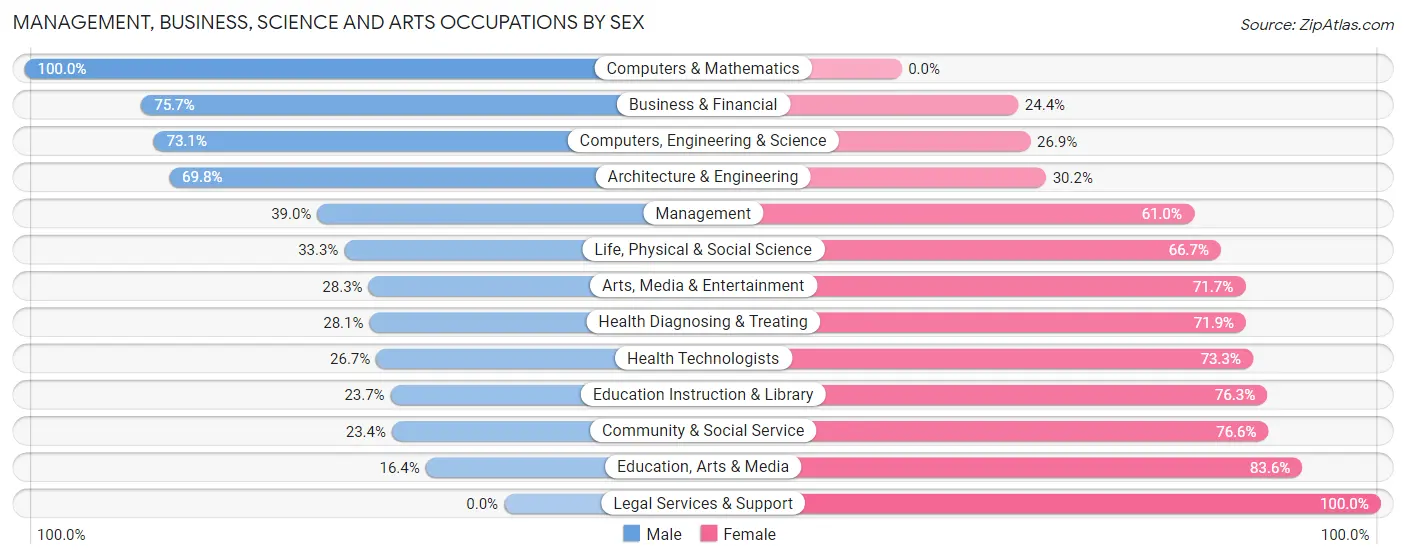
Management, Business, Science and Arts Occupations by Sex
Within the Management, Business, Science and Arts occupations in West Sayville, the most male-oriented occupations are Computers & Mathematics (100.0%), Business & Financial (75.6%), and Computers, Engineering & Science (73.1%), while the most female-oriented occupations are Legal Services & Support (100.0%), Education, Arts & Media (83.6%), and Community & Social Service (76.6%).
| Occupation | Male | Female |
| Management | 150 (39.0%) | 235 (61.0%) |
| Business & Financial | 205 (75.6%) | 66 (24.3%) |
| Computers, Engineering & Science | 106 (73.1%) | 39 (26.9%) |
| Computers & Mathematics | 52 (100.0%) | 0 (0.0%) |
| Architecture & Engineering | 44 (69.8%) | 19 (30.2%) |
| Life, Physical & Social Science | 10 (33.3%) | 20 (66.7%) |
| Community & Social Service | 136 (23.4%) | 445 (76.6%) |
| Education, Arts & Media | 9 (16.4%) | 46 (83.6%) |
| Legal Services & Support | 0 (0.0%) | 9 (100.0%) |
| Education Instruction & Library | 99 (23.7%) | 319 (76.3%) |
| Arts, Media & Entertainment | 28 (28.3%) | 71 (71.7%) |
| Health Diagnosing & Treating | 25 (28.1%) | 64 (71.9%) |
| Health Technologists | 12 (26.7%) | 33 (73.3%) |
| Total (Category) | 622 (42.3%) | 849 (57.7%) |
| Total (Overall) | 1,411 (53.5%) | 1,225 (46.5%) |
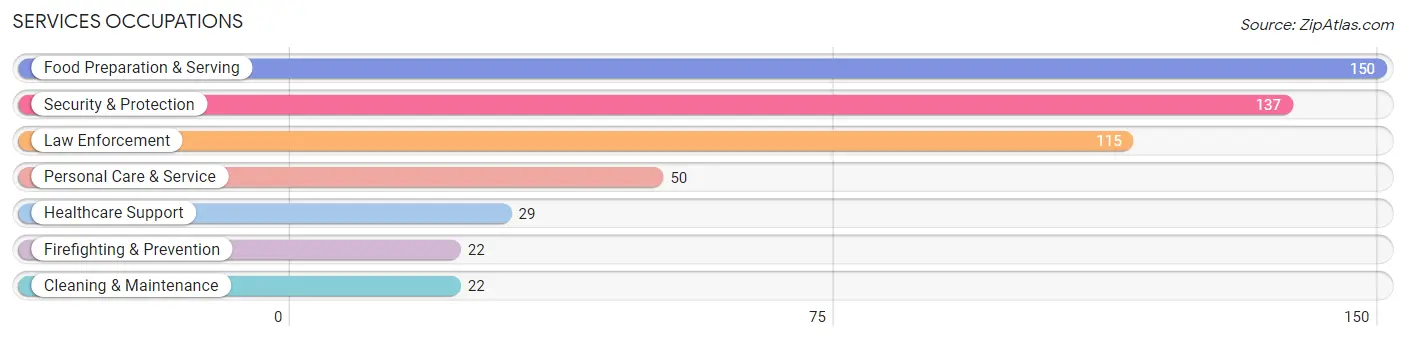
Services Occupations
The most common Services occupations in West Sayville are Food Preparation & Serving (150 | 5.7%), Security & Protection (137 | 5.2%), Law Enforcement (115 | 4.4%), Personal Care & Service (50 | 1.9%), and Healthcare Support (29 | 1.1%).
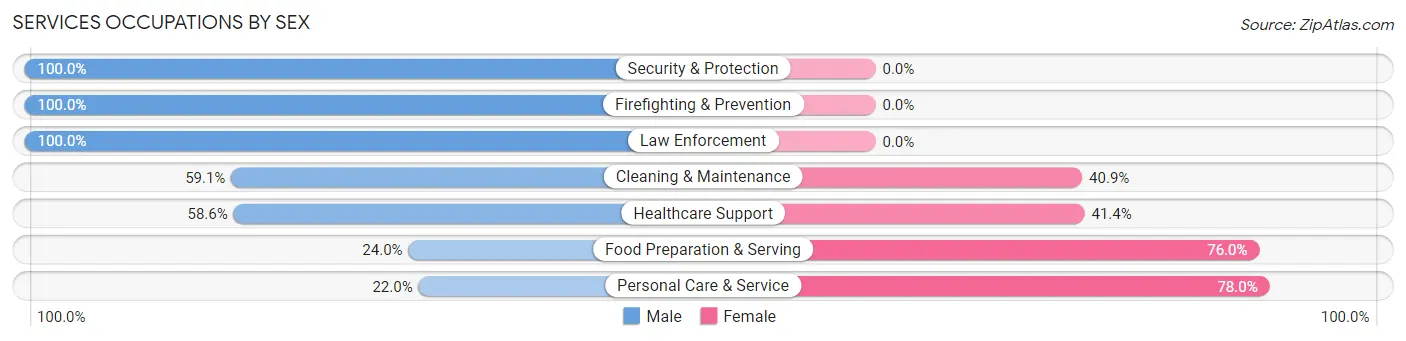
Services Occupations by Sex
Within the Services occupations in West Sayville, the most male-oriented occupations are Security & Protection (100.0%), Firefighting & Prevention (100.0%), and Law Enforcement (100.0%), while the most female-oriented occupations are Personal Care & Service (78.0%), Food Preparation & Serving (76.0%), and Healthcare Support (41.4%).
| Occupation | Male | Female |
| Healthcare Support | 17 (58.6%) | 12 (41.4%) |
| Security & Protection | 137 (100.0%) | 0 (0.0%) |
| Firefighting & Prevention | 22 (100.0%) | 0 (0.0%) |
| Law Enforcement | 115 (100.0%) | 0 (0.0%) |
| Food Preparation & Serving | 36 (24.0%) | 114 (76.0%) |
| Cleaning & Maintenance | 13 (59.1%) | 9 (40.9%) |
| Personal Care & Service | 11 (22.0%) | 39 (78.0%) |
| Total (Category) | 214 (55.1%) | 174 (44.9%) |
| Total (Overall) | 1,411 (53.5%) | 1,225 (46.5%) |
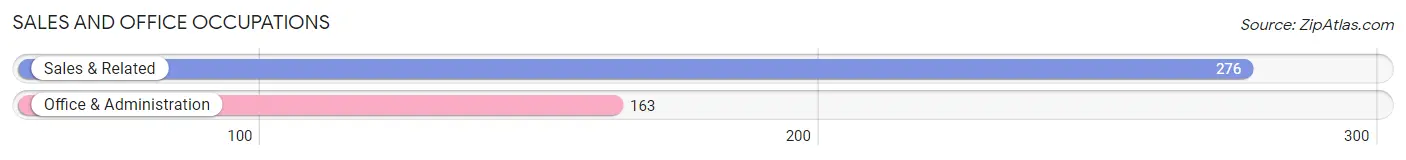
Sales and Office Occupations
The most common Sales and Office occupations in West Sayville are Sales & Related (276 | 10.5%), and Office & Administration (163 | 6.2%).
Sales and Office Occupations by Sex
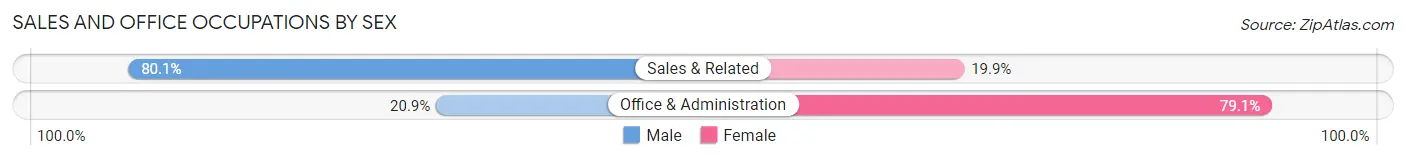
| Occupation | Male | Female |
| Sales & Related | 221 (80.1%) | 55 (19.9%) |
| Office & Administration | 34 (20.9%) | 129 (79.1%) |
| Total (Category) | 255 (58.1%) | 184 (41.9%) |
| Total (Overall) | 1,411 (53.5%) | 1,225 (46.5%) |
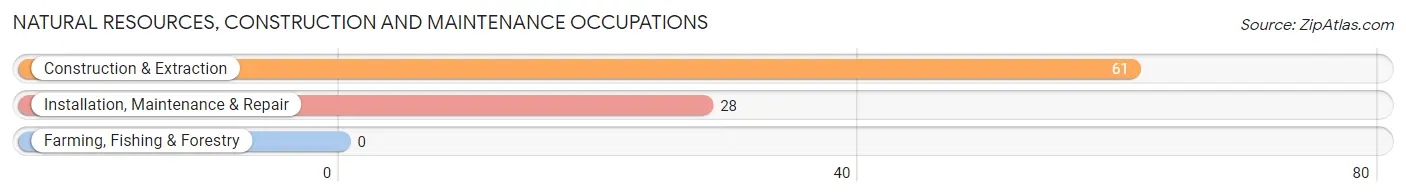
Natural Resources, Construction and Maintenance Occupations
The most common Natural Resources, Construction and Maintenance occupations in West Sayville are Construction & Extraction (61 | 2.3%), and Installation, Maintenance & Repair (28 | 1.1%).
Natural Resources, Construction and Maintenance Occupations by Sex
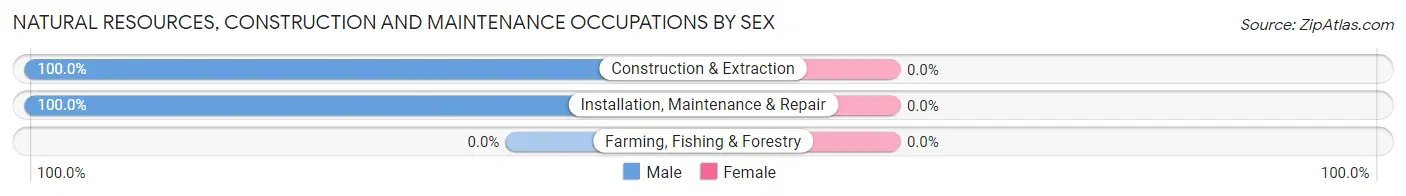
| Occupation | Male | Female |
| Farming, Fishing & Forestry | 0 (0.0%) | 0 (0.0%) |
| Construction & Extraction | 61 (100.0%) | 0 (0.0%) |
| Installation, Maintenance & Repair | 28 (100.0%) | 0 (0.0%) |
| Total (Category) | 89 (100.0%) | 0 (0.0%) |
| Total (Overall) | 1,411 (53.5%) | 1,225 (46.5%) |
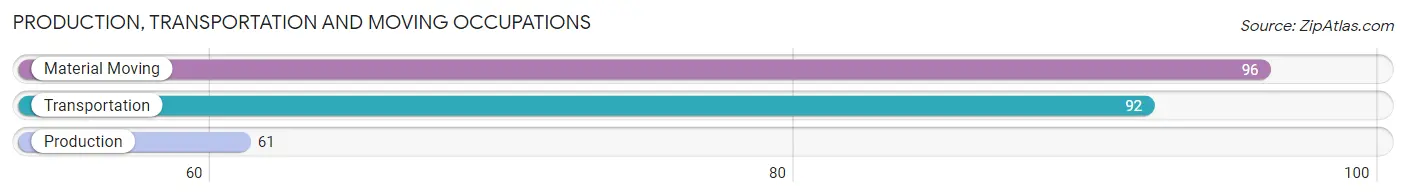
Production, Transportation and Moving Occupations
The most common Production, Transportation and Moving occupations in West Sayville are Material Moving (96 | 3.6%), Transportation (92 | 3.5%), and Production (61 | 2.3%).
Production, Transportation and Moving Occupations by Sex
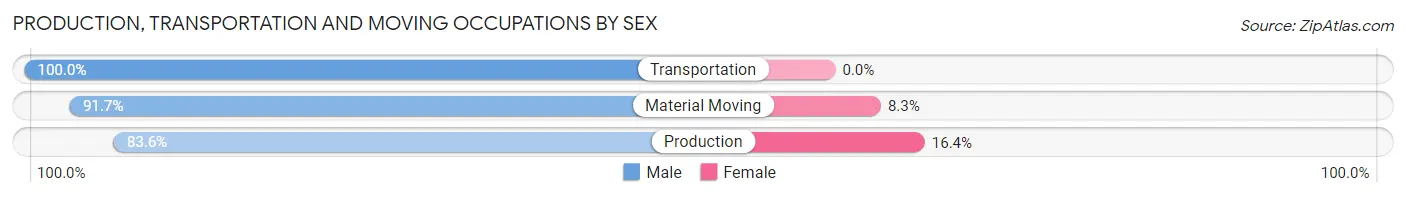
| Occupation | Male | Female |
| Production | 51 (83.6%) | 10 (16.4%) |
| Transportation | 92 (100.0%) | 0 (0.0%) |
| Material Moving | 88 (91.7%) | 8 (8.3%) |
| Total (Category) | 231 (92.8%) | 18 (7.2%) |
| Total (Overall) | 1,411 (53.5%) | 1,225 (46.5%) |
Employment Industries by Sex in West Sayville
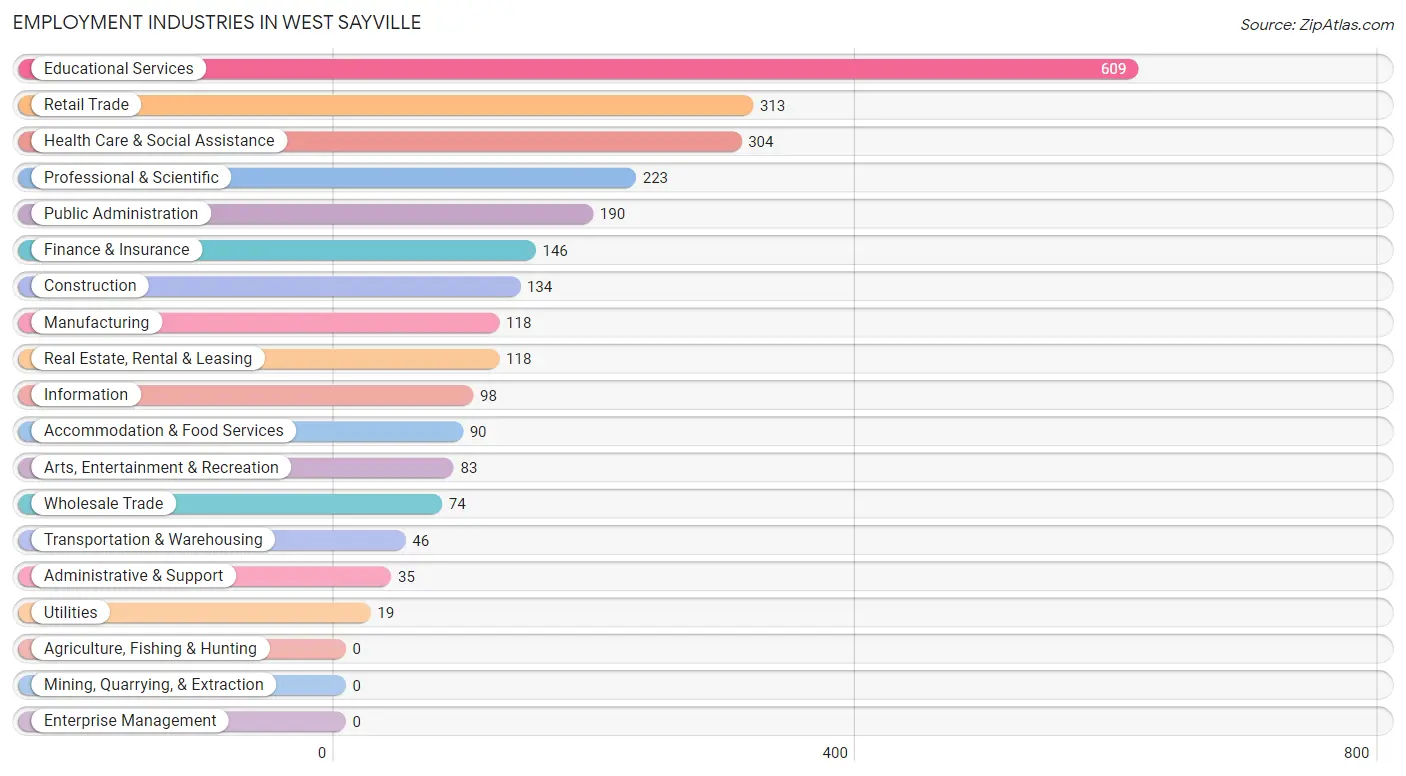
Employment Industries in West Sayville
The major employment industries in West Sayville include Educational Services (609 | 23.1%), Retail Trade (313 | 11.9%), Health Care & Social Assistance (304 | 11.5%), Professional & Scientific (223 | 8.5%), and Public Administration (190 | 7.2%).
Employment Industries by Sex in West Sayville
The West Sayville industries that see more men than women are Transportation & Warehousing (100.0%), Real Estate, Rental & Leasing (100.0%), and Administrative & Support (100.0%), whereas the industries that tend to have a higher number of women are Health Care & Social Assistance (91.4%), Educational Services (72.6%), and Accommodation & Food Services (60.0%).
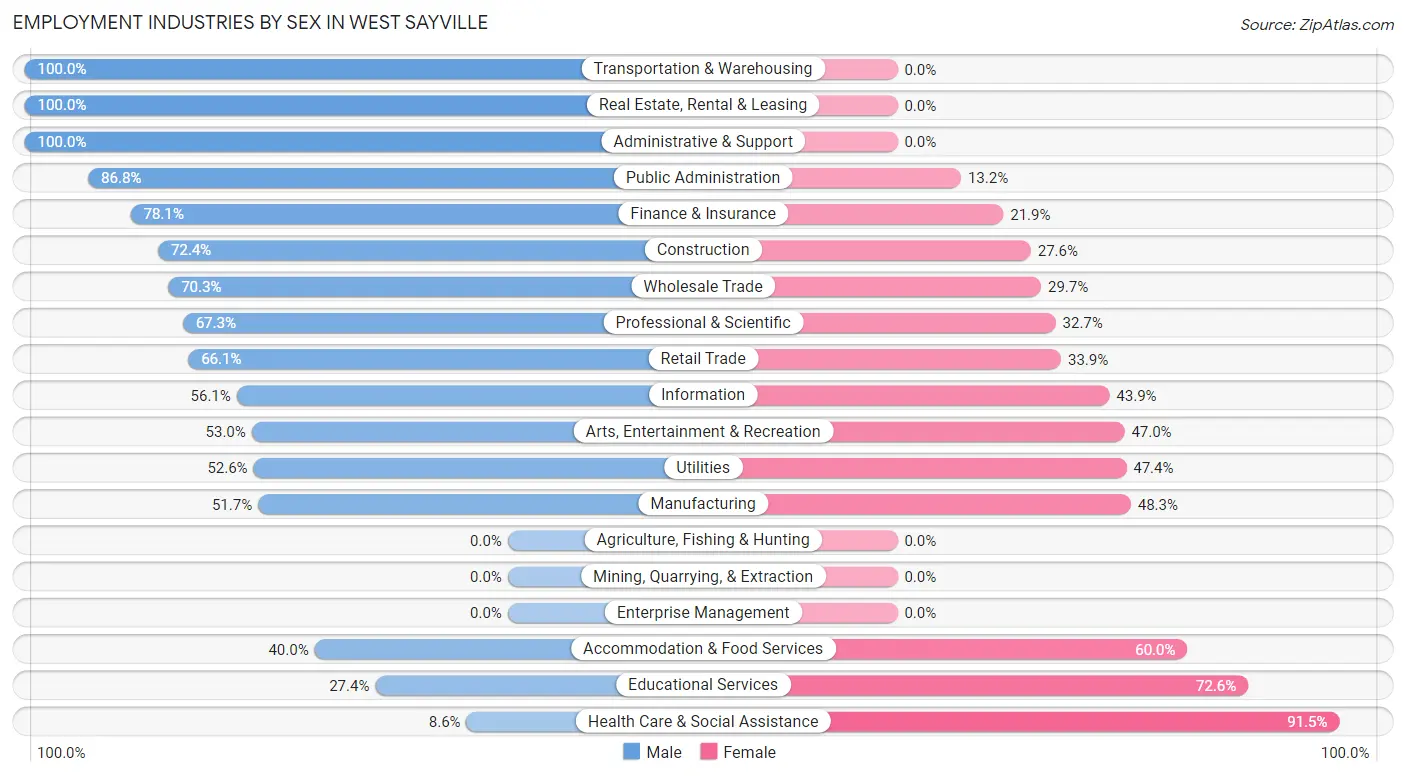
| Industry | Male | Female |
| Agriculture, Fishing & Hunting | 0 (0.0%) | 0 (0.0%) |
| Mining, Quarrying, & Extraction | 0 (0.0%) | 0 (0.0%) |
| Construction | 97 (72.4%) | 37 (27.6%) |
| Manufacturing | 61 (51.7%) | 57 (48.3%) |
| Wholesale Trade | 52 (70.3%) | 22 (29.7%) |
| Retail Trade | 207 (66.1%) | 106 (33.9%) |
| Transportation & Warehousing | 46 (100.0%) | 0 (0.0%) |
| Utilities | 10 (52.6%) | 9 (47.4%) |
| Information | 55 (56.1%) | 43 (43.9%) |
| Finance & Insurance | 114 (78.1%) | 32 (21.9%) |
| Real Estate, Rental & Leasing | 118 (100.0%) | 0 (0.0%) |
| Professional & Scientific | 150 (67.3%) | 73 (32.7%) |
| Enterprise Management | 0 (0.0%) | 0 (0.0%) |
| Administrative & Support | 35 (100.0%) | 0 (0.0%) |
| Educational Services | 167 (27.4%) | 442 (72.6%) |
| Health Care & Social Assistance | 26 (8.6%) | 278 (91.4%) |
| Arts, Entertainment & Recreation | 44 (53.0%) | 39 (47.0%) |
| Accommodation & Food Services | 36 (40.0%) | 54 (60.0%) |
| Public Administration | 165 (86.8%) | 25 (13.2%) |
| Total | 1,411 (53.5%) | 1,225 (46.5%) |
Education in West Sayville
School Enrollment in West Sayville
The most common levels of schooling among the 999 students in West Sayville are middle school (241 | 24.1%), college / undergraduate (206 | 20.6%), and elementary school (201 | 20.1%).
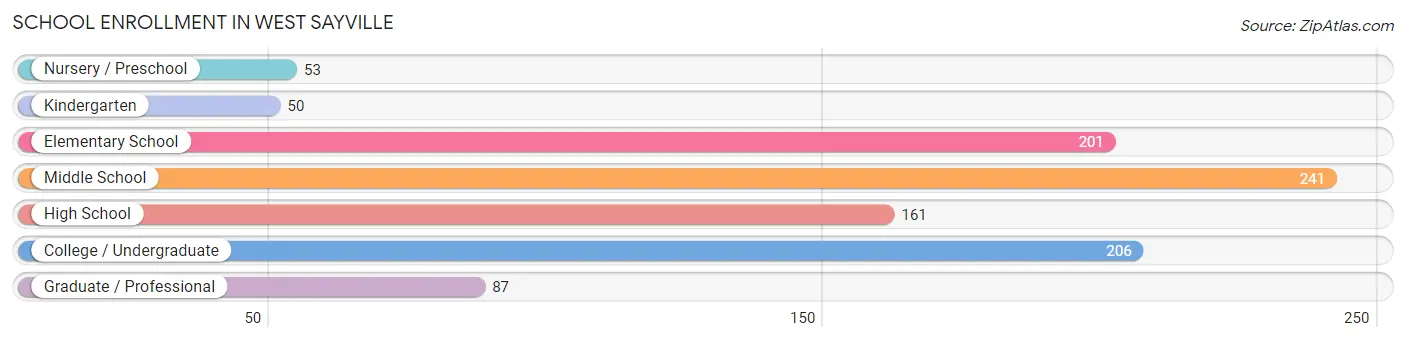
| School Level | # Students | % Students |
| Nursery / Preschool | 53 | 5.3% |
| Kindergarten | 50 | 5.0% |
| Elementary School | 201 | 20.1% |
| Middle School | 241 | 24.1% |
| High School | 161 | 16.1% |
| College / Undergraduate | 206 | 20.6% |
| Graduate / Professional | 87 | 8.7% |
| Total | 999 | 100.0% |
School Enrollment by Age by Funding Source in West Sayville
Out of a total of 999 students who are enrolled in schools in West Sayville, 145 (14.5%) attend a private institution, while the remaining 854 (85.5%) are enrolled in public schools. The age group of 20 to 24 year olds has the highest likelihood of being enrolled in private schools, with 67 (51.5% in the age bracket) enrolled. Conversely, the age group of 3 to 4 year olds has the lowest likelihood of being enrolled in a private school, with 53 (100.0% in the age bracket) attending a public institution.
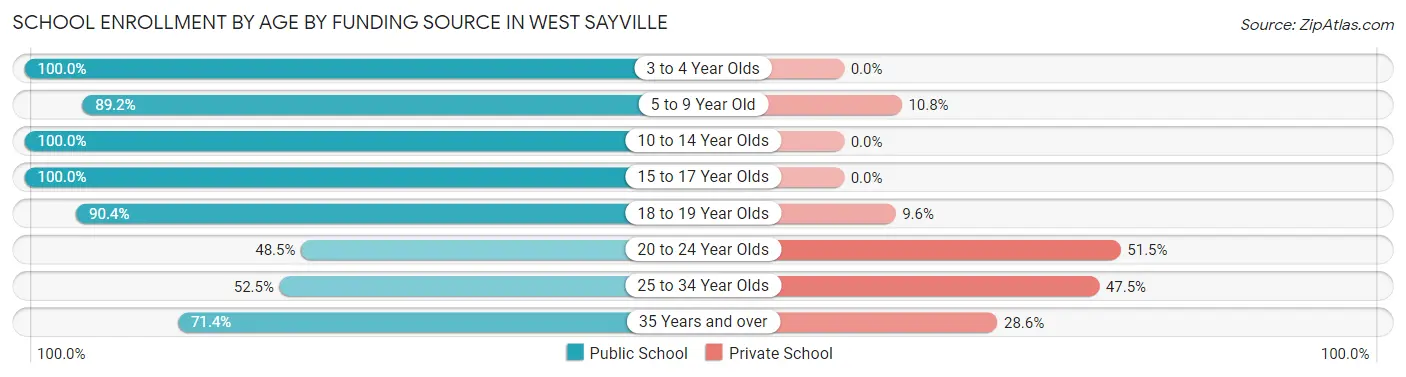
| Age Bracket | Public School | Private School |
| 3 to 4 Year Olds | 53 (100.0%) | 0 (0.0%) |
| 5 to 9 Year Old | 224 (89.2%) | 27 (10.8%) |
| 10 to 14 Year Olds | 228 (100.0%) | 0 (0.0%) |
| 15 to 17 Year Olds | 116 (100.0%) | 0 (0.0%) |
| 18 to 19 Year Olds | 113 (90.4%) | 12 (9.6%) |
| 20 to 24 Year Olds | 63 (48.5%) | 67 (51.5%) |
| 25 to 34 Year Olds | 32 (52.5%) | 29 (47.5%) |
| 35 Years and over | 25 (71.4%) | 10 (28.6%) |
| Total | 854 (85.5%) | 145 (14.5%) |
Educational Attainment by Field of Study in West Sayville
Education (383 | 23.0%), business (251 | 15.1%), science & technology (224 | 13.5%), communications (133 | 8.0%), and liberal arts & history (116 | 7.0%) are the most common fields of study among 1,664 individuals in West Sayville who have obtained a bachelor's degree or higher.
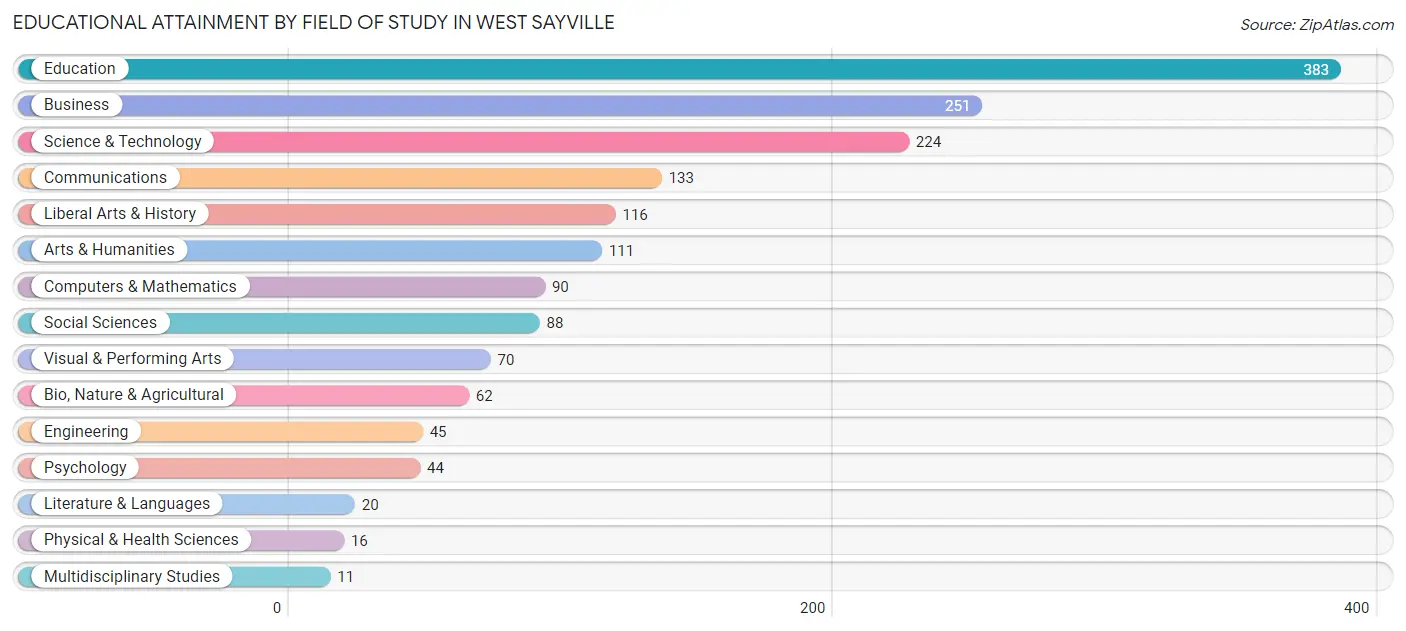
| Field of Study | # Graduates | % Graduates |
| Computers & Mathematics | 90 | 5.4% |
| Bio, Nature & Agricultural | 62 | 3.7% |
| Physical & Health Sciences | 16 | 1.0% |
| Psychology | 44 | 2.6% |
| Social Sciences | 88 | 5.3% |
| Engineering | 45 | 2.7% |
| Multidisciplinary Studies | 11 | 0.7% |
| Science & Technology | 224 | 13.5% |
| Business | 251 | 15.1% |
| Education | 383 | 23.0% |
| Literature & Languages | 20 | 1.2% |
| Liberal Arts & History | 116 | 7.0% |
| Visual & Performing Arts | 70 | 4.2% |
| Communications | 133 | 8.0% |
| Arts & Humanities | 111 | 6.7% |
| Total | 1,664 | 100.0% |
Transportation & Commute in West Sayville
Vehicle Availability by Sex in West Sayville
The most prevalent vehicle ownership categories in West Sayville are males with 2 vehicles (608, accounting for 43.1%) and females with 2 vehicles (472, making up 55.2%).
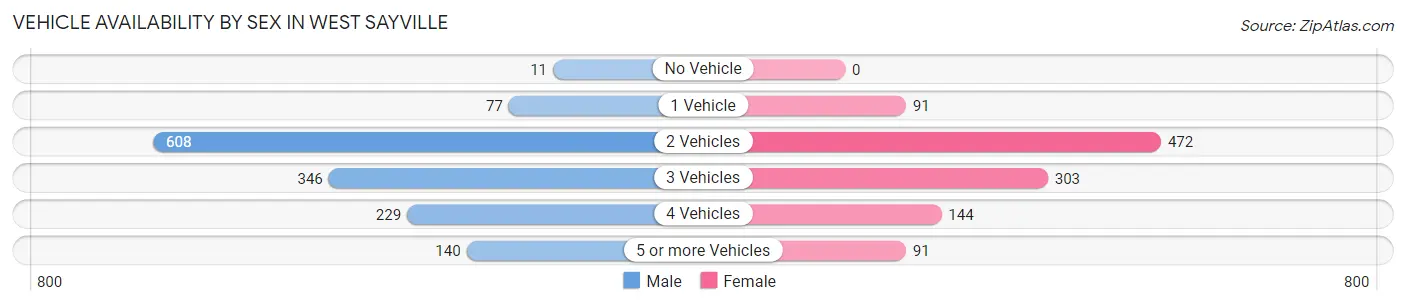
| Vehicles Available | Male | Female |
| No Vehicle | 11 (0.8%) | 0 (0.0%) |
| 1 Vehicle | 77 (5.5%) | 91 (8.3%) |
| 2 Vehicles | 608 (43.1%) | 472 (42.9%) |
| 3 Vehicles | 346 (24.5%) | 303 (27.5%) |
| 4 Vehicles | 229 (16.2%) | 144 (13.1%) |
| 5 or more Vehicles | 140 (9.9%) | 91 (8.3%) |
| Total | 1,411 (100.0%) | 1,101 (100.0%) |
Commute Time in West Sayville
The most frequently occuring commute durations in West Sayville are 30 to 34 minutes (496 commuters, 21.9%), 45 to 59 minutes (259 commuters, 11.4%), and 10 to 14 minutes (248 commuters, 10.9%).
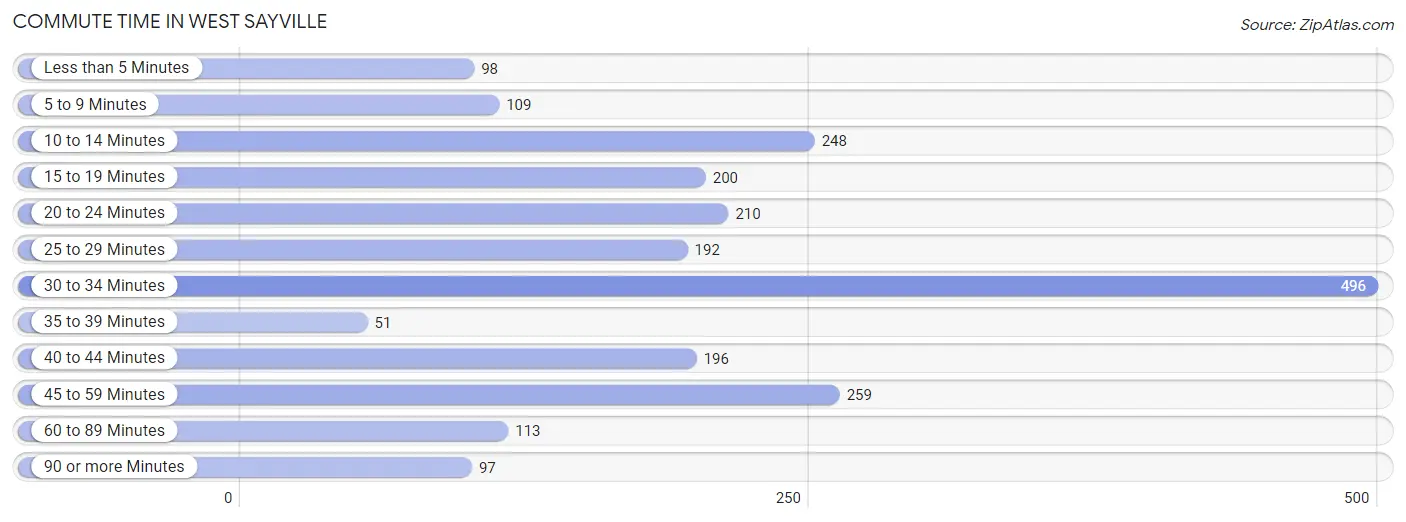
| Commute Time | # Commuters | % Commuters |
| Less than 5 Minutes | 98 | 4.3% |
| 5 to 9 Minutes | 109 | 4.8% |
| 10 to 14 Minutes | 248 | 10.9% |
| 15 to 19 Minutes | 200 | 8.8% |
| 20 to 24 Minutes | 210 | 9.3% |
| 25 to 29 Minutes | 192 | 8.5% |
| 30 to 34 Minutes | 496 | 21.9% |
| 35 to 39 Minutes | 51 | 2.2% |
| 40 to 44 Minutes | 196 | 8.6% |
| 45 to 59 Minutes | 259 | 11.4% |
| 60 to 89 Minutes | 113 | 5.0% |
| 90 or more Minutes | 97 | 4.3% |
Commute Time by Sex in West Sayville
The most common commute times in West Sayville are 30 to 34 minutes (347 commuters, 27.2%) for males and 10 to 14 minutes (172 commuters, 17.3%) for females.
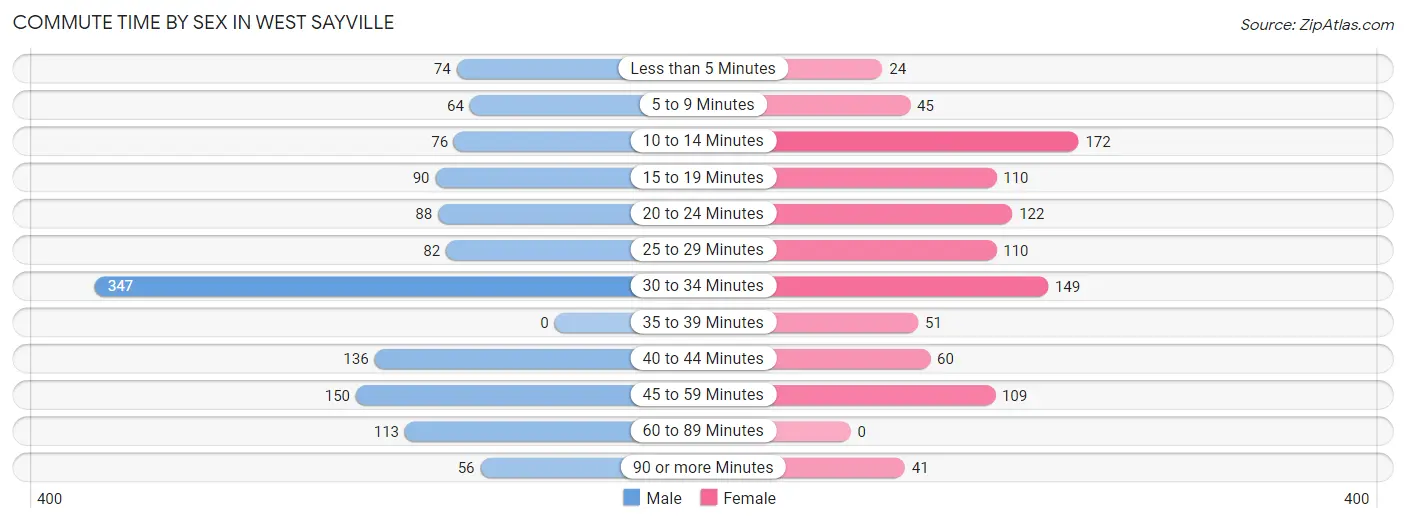
| Commute Time | Male | Female |
| Less than 5 Minutes | 74 (5.8%) | 24 (2.4%) |
| 5 to 9 Minutes | 64 (5.0%) | 45 (4.5%) |
| 10 to 14 Minutes | 76 (6.0%) | 172 (17.3%) |
| 15 to 19 Minutes | 90 (7.0%) | 110 (11.1%) |
| 20 to 24 Minutes | 88 (6.9%) | 122 (12.3%) |
| 25 to 29 Minutes | 82 (6.4%) | 110 (11.1%) |
| 30 to 34 Minutes | 347 (27.2%) | 149 (15.0%) |
| 35 to 39 Minutes | 0 (0.0%) | 51 (5.1%) |
| 40 to 44 Minutes | 136 (10.7%) | 60 (6.0%) |
| 45 to 59 Minutes | 150 (11.8%) | 109 (11.0%) |
| 60 to 89 Minutes | 113 (8.9%) | 0 (0.0%) |
| 90 or more Minutes | 56 (4.4%) | 41 (4.1%) |
Time of Departure to Work by Sex in West Sayville
The most frequent times of departure to work in West Sayville are 8:00 AM to 8:29 AM (309, 24.2%) for males and 8:00 AM to 8:29 AM (244, 24.6%) for females.
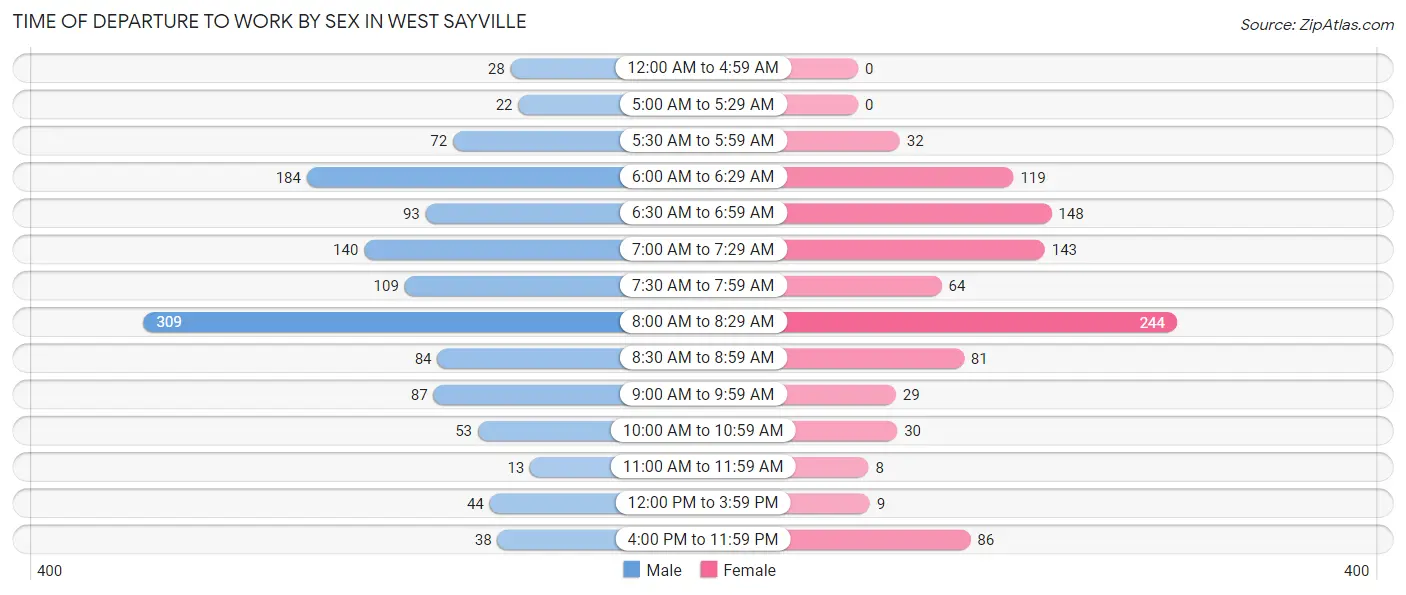
| Time of Departure | Male | Female |
| 12:00 AM to 4:59 AM | 28 (2.2%) | 0 (0.0%) |
| 5:00 AM to 5:29 AM | 22 (1.7%) | 0 (0.0%) |
| 5:30 AM to 5:59 AM | 72 (5.6%) | 32 (3.2%) |
| 6:00 AM to 6:29 AM | 184 (14.4%) | 119 (12.0%) |
| 6:30 AM to 6:59 AM | 93 (7.3%) | 148 (14.9%) |
| 7:00 AM to 7:29 AM | 140 (11.0%) | 143 (14.4%) |
| 7:30 AM to 7:59 AM | 109 (8.5%) | 64 (6.5%) |
| 8:00 AM to 8:29 AM | 309 (24.2%) | 244 (24.6%) |
| 8:30 AM to 8:59 AM | 84 (6.6%) | 81 (8.2%) |
| 9:00 AM to 9:59 AM | 87 (6.8%) | 29 (2.9%) |
| 10:00 AM to 10:59 AM | 53 (4.2%) | 30 (3.0%) |
| 11:00 AM to 11:59 AM | 13 (1.0%) | 8 (0.8%) |
| 12:00 PM to 3:59 PM | 44 (3.5%) | 9 (0.9%) |
| 4:00 PM to 11:59 PM | 38 (3.0%) | 86 (8.7%) |
| Total | 1,276 (100.0%) | 993 (100.0%) |
Housing Occupancy in West Sayville
Occupancy by Ownership in West Sayville
Of the total 1,761 dwellings in West Sayville, owner-occupied units account for 1,520 (86.3%), while renter-occupied units make up 241 (13.7%).
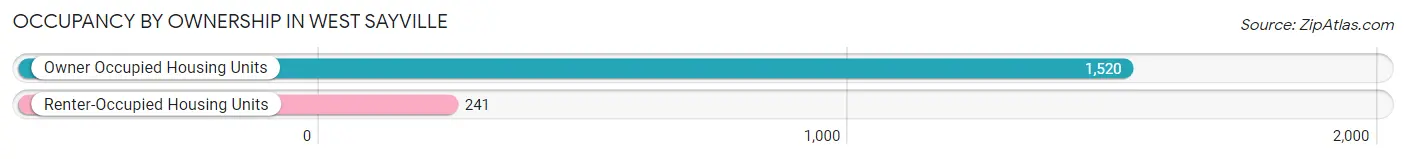
| Occupancy | # Housing Units | % Housing Units |
| Owner Occupied Housing Units | 1,520 | 86.3% |
| Renter-Occupied Housing Units | 241 | 13.7% |
| Total Occupied Housing Units | 1,761 | 100.0% |
Occupancy by Household Size in West Sayville
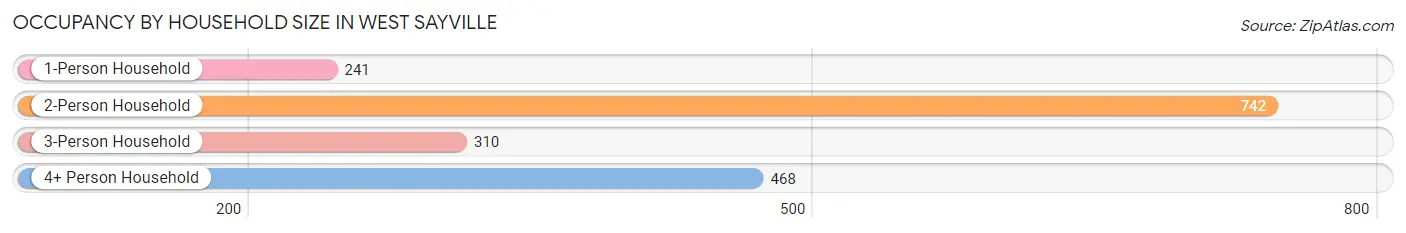
| Household Size | # Housing Units | % Housing Units |
| 1-Person Household | 241 | 13.7% |
| 2-Person Household | 742 | 42.1% |
| 3-Person Household | 310 | 17.6% |
| 4+ Person Household | 468 | 26.6% |
| Total Housing Units | 1,761 | 100.0% |
Occupancy by Ownership by Household Size in West Sayville
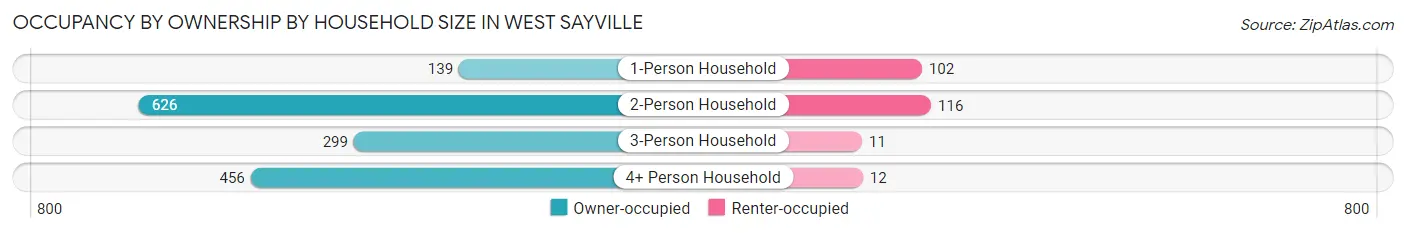
| Household Size | Owner-occupied | Renter-occupied |
| 1-Person Household | 139 (57.7%) | 102 (42.3%) |
| 2-Person Household | 626 (84.4%) | 116 (15.6%) |
| 3-Person Household | 299 (96.5%) | 11 (3.5%) |
| 4+ Person Household | 456 (97.4%) | 12 (2.6%) |
| Total Housing Units | 1,520 (86.3%) | 241 (13.7%) |
Occupancy by Educational Attainment in West Sayville
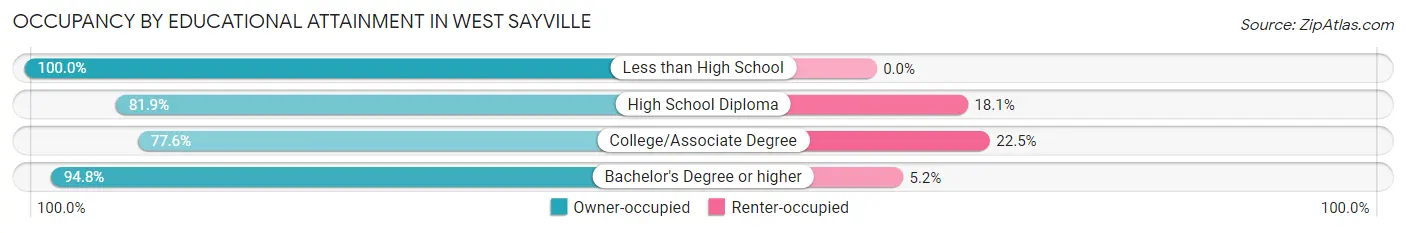
| Household Size | Owner-occupied | Renter-occupied |
| Less than High School | 11 (100.0%) | 0 (0.0%) |
| High School Diploma | 371 (81.9%) | 82 (18.1%) |
| College/Associate Degree | 411 (77.5%) | 119 (22.5%) |
| Bachelor's Degree or higher | 727 (94.8%) | 40 (5.2%) |
Occupancy by Age of Householder in West Sayville
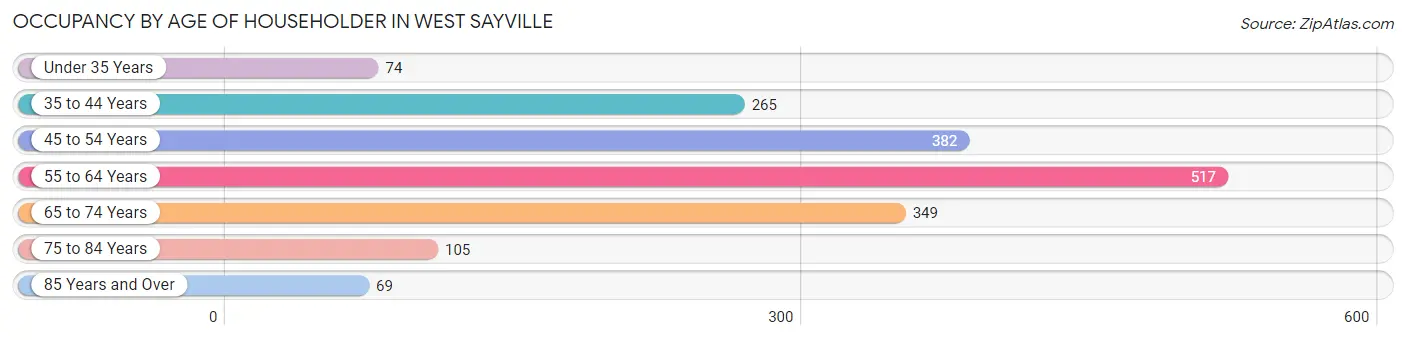
| Age Bracket | # Households | % Households |
| Under 35 Years | 74 | 4.2% |
| 35 to 44 Years | 265 | 15.0% |
| 45 to 54 Years | 382 | 21.7% |
| 55 to 64 Years | 517 | 29.4% |
| 65 to 74 Years | 349 | 19.8% |
| 75 to 84 Years | 105 | 6.0% |
| 85 Years and Over | 69 | 3.9% |
| Total | 1,761 | 100.0% |
Housing Finances in West Sayville
Median Income by Occupancy in West Sayville
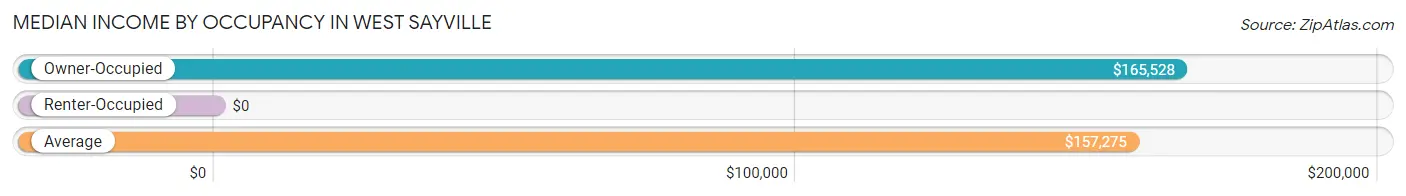
| Occupancy Type | # Households | Median Income |
| Owner-Occupied | 1,520 (86.3%) | $165,528 |
| Renter-Occupied | 241 (13.7%) | $0 |
| Average | 1,761 (100.0%) | $157,275 |
Occupancy by Householder Income Bracket in West Sayville
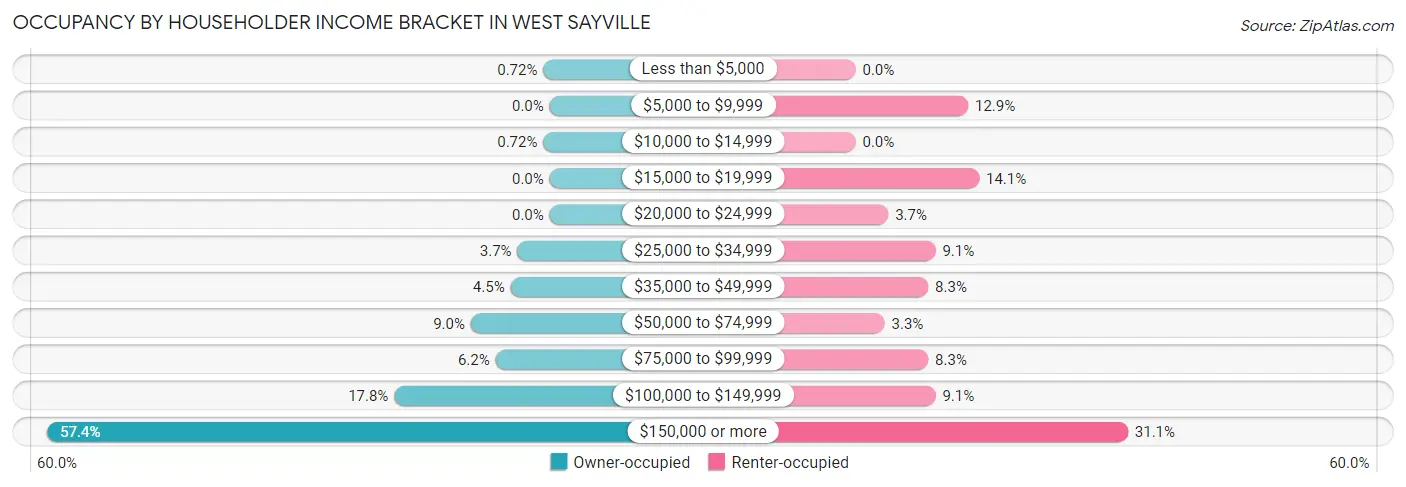
| Income Bracket | Owner-occupied | Renter-occupied |
| Less than $5,000 | 11 (0.7%) | 0 (0.0%) |
| $5,000 to $9,999 | 0 (0.0%) | 31 (12.9%) |
| $10,000 to $14,999 | 11 (0.7%) | 0 (0.0%) |
| $15,000 to $19,999 | 0 (0.0%) | 34 (14.1%) |
| $20,000 to $24,999 | 0 (0.0%) | 9 (3.7%) |
| $25,000 to $34,999 | 56 (3.7%) | 22 (9.1%) |
| $35,000 to $49,999 | 68 (4.5%) | 20 (8.3%) |
| $50,000 to $74,999 | 137 (9.0%) | 8 (3.3%) |
| $75,000 to $99,999 | 94 (6.2%) | 20 (8.3%) |
| $100,000 to $149,999 | 270 (17.8%) | 22 (9.1%) |
| $150,000 or more | 873 (57.4%) | 75 (31.1%) |
| Total | 1,520 (100.0%) | 241 (100.0%) |
Monthly Housing Cost Tiers in West Sayville
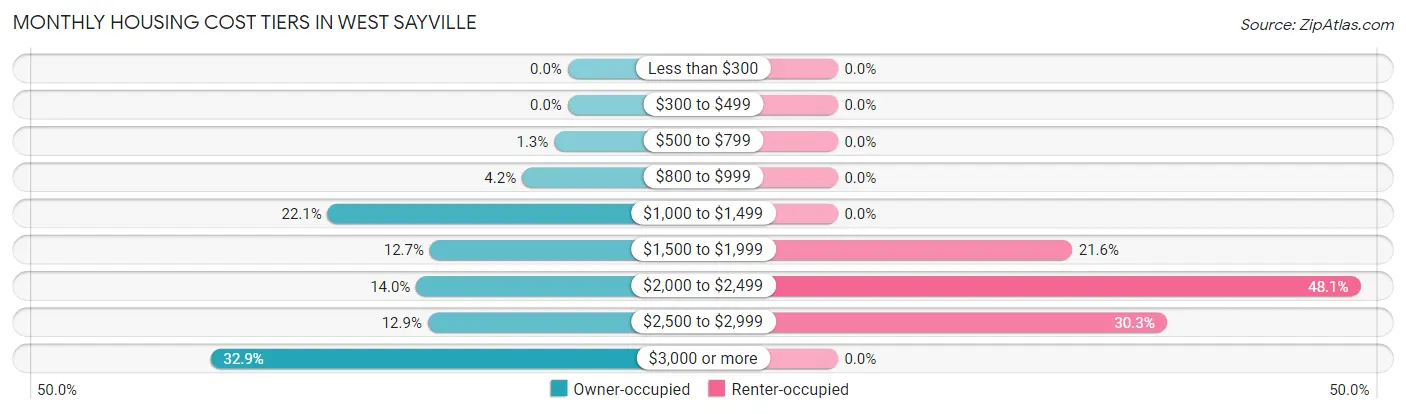
| Monthly Cost | Owner-occupied | Renter-occupied |
| Less than $300 | 0 (0.0%) | 0 (0.0%) |
| $300 to $499 | 0 (0.0%) | 0 (0.0%) |
| $500 to $799 | 19 (1.3%) | 0 (0.0%) |
| $800 to $999 | 64 (4.2%) | 0 (0.0%) |
| $1,000 to $1,499 | 336 (22.1%) | 0 (0.0%) |
| $1,500 to $1,999 | 193 (12.7%) | 52 (21.6%) |
| $2,000 to $2,499 | 212 (14.0%) | 116 (48.1%) |
| $2,500 to $2,999 | 196 (12.9%) | 73 (30.3%) |
| $3,000 or more | 500 (32.9%) | 0 (0.0%) |
| Total | 1,520 (100.0%) | 241 (100.0%) |
Physical Housing Characteristics in West Sayville
Housing Structures in West Sayville
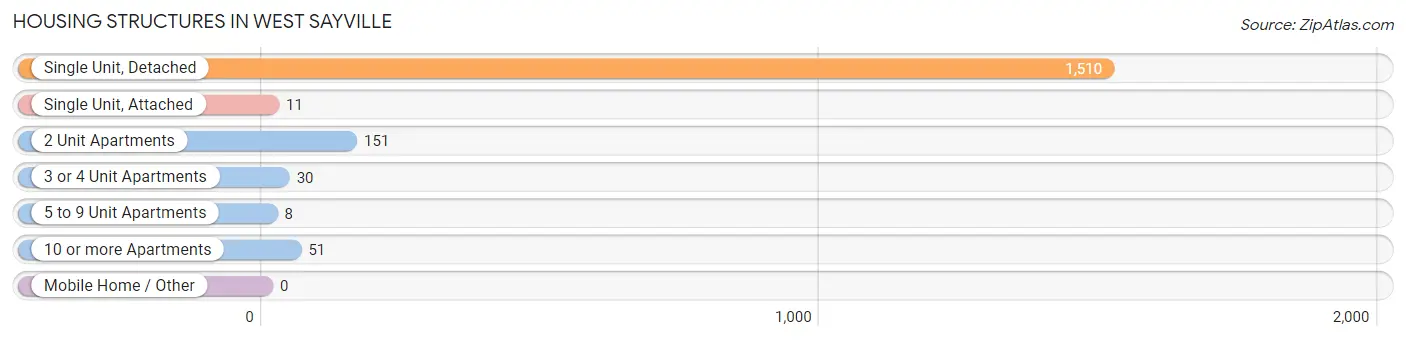
| Structure Type | # Housing Units | % Housing Units |
| Single Unit, Detached | 1,510 | 85.8% |
| Single Unit, Attached | 11 | 0.6% |
| 2 Unit Apartments | 151 | 8.6% |
| 3 or 4 Unit Apartments | 30 | 1.7% |
| 5 to 9 Unit Apartments | 8 | 0.4% |
| 10 or more Apartments | 51 | 2.9% |
| Mobile Home / Other | 0 | 0.0% |
| Total | 1,761 | 100.0% |
Housing Structures by Occupancy in West Sayville
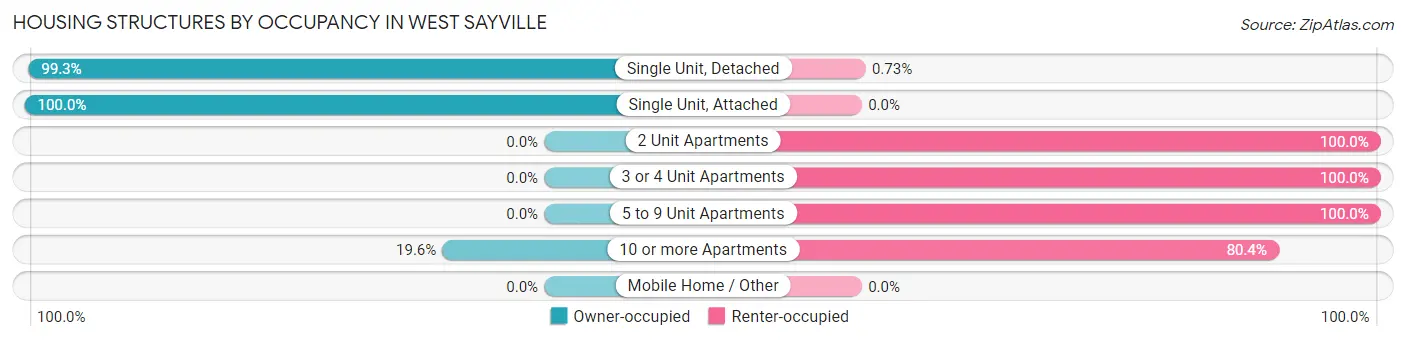
| Structure Type | Owner-occupied | Renter-occupied |
| Single Unit, Detached | 1,499 (99.3%) | 11 (0.7%) |
| Single Unit, Attached | 11 (100.0%) | 0 (0.0%) |
| 2 Unit Apartments | 0 (0.0%) | 151 (100.0%) |
| 3 or 4 Unit Apartments | 0 (0.0%) | 30 (100.0%) |
| 5 to 9 Unit Apartments | 0 (0.0%) | 8 (100.0%) |
| 10 or more Apartments | 10 (19.6%) | 41 (80.4%) |
| Mobile Home / Other | 0 (0.0%) | 0 (0.0%) |
| Total | 1,520 (86.3%) | 241 (13.7%) |
Housing Structures by Number of Rooms in West Sayville
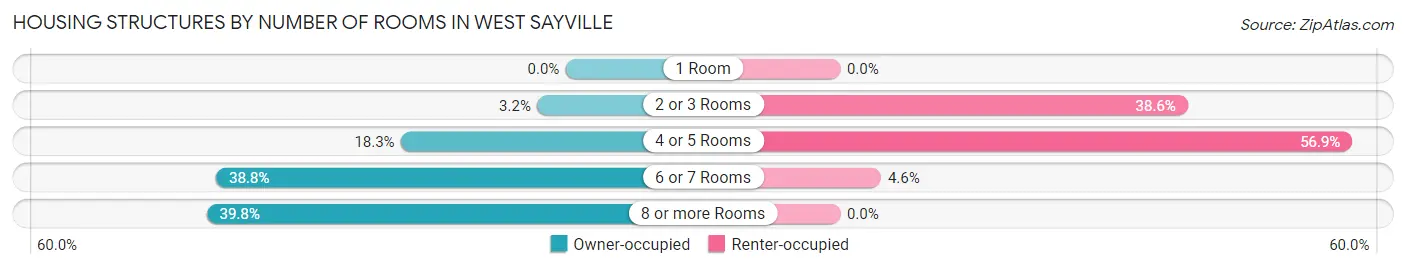
| Number of Rooms | Owner-occupied | Renter-occupied |
| 1 Room | 0 (0.0%) | 0 (0.0%) |
| 2 or 3 Rooms | 48 (3.2%) | 93 (38.6%) |
| 4 or 5 Rooms | 278 (18.3%) | 137 (56.9%) |
| 6 or 7 Rooms | 589 (38.8%) | 11 (4.6%) |
| 8 or more Rooms | 605 (39.8%) | 0 (0.0%) |
| Total | 1,520 (100.0%) | 241 (100.0%) |
Housing Structure by Heating Type in West Sayville
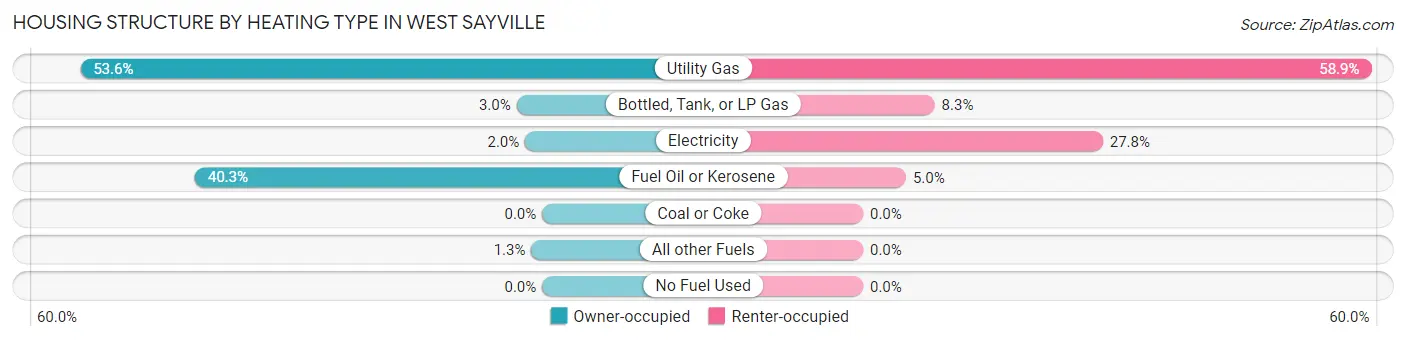
| Heating Type | Owner-occupied | Renter-occupied |
| Utility Gas | 814 (53.5%) | 142 (58.9%) |
| Bottled, Tank, or LP Gas | 45 (3.0%) | 20 (8.3%) |
| Electricity | 30 (2.0%) | 67 (27.8%) |
| Fuel Oil or Kerosene | 612 (40.3%) | 12 (5.0%) |
| Coal or Coke | 0 (0.0%) | 0 (0.0%) |
| All other Fuels | 19 (1.3%) | 0 (0.0%) |
| No Fuel Used | 0 (0.0%) | 0 (0.0%) |
| Total | 1,520 (100.0%) | 241 (100.0%) |
Household Vehicle Usage in West Sayville
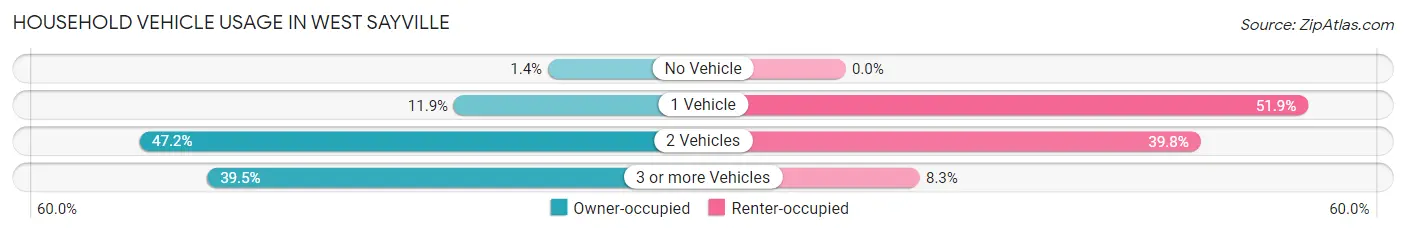
| Vehicles per Household | Owner-occupied | Renter-occupied |
| No Vehicle | 21 (1.4%) | 0 (0.0%) |
| 1 Vehicle | 181 (11.9%) | 125 (51.9%) |
| 2 Vehicles | 717 (47.2%) | 96 (39.8%) |
| 3 or more Vehicles | 601 (39.5%) | 20 (8.3%) |
| Total | 1,520 (100.0%) | 241 (100.0%) |
Real Estate & Mortgages in West Sayville
Real Estate and Mortgage Overview in West Sayville
| Characteristic | Without Mortgage | With Mortgage |
| Housing Units | 519 | 1,001 |
| Median Property Value | $462,500 | $543,600 |
| Median Household Income | $112,813 | $644 |
| Monthly Housing Costs | $1,329 | $500 |
| Real Estate Taxes | $10,001 | $0 |
Property Value by Mortgage Status in West Sayville
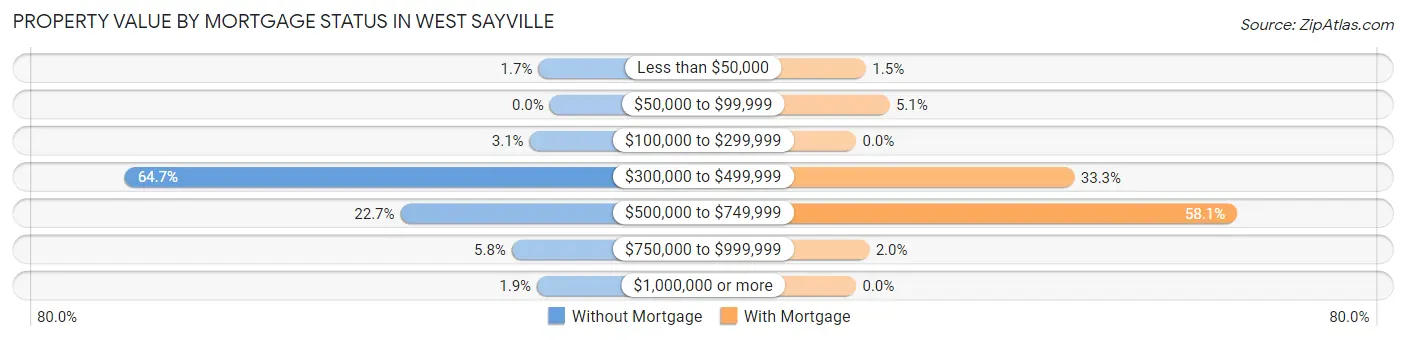
| Property Value | Without Mortgage | With Mortgage |
| Less than $50,000 | 9 (1.7%) | 15 (1.5%) |
| $50,000 to $99,999 | 0 (0.0%) | 51 (5.1%) |
| $100,000 to $299,999 | 16 (3.1%) | 0 (0.0%) |
| $300,000 to $499,999 | 336 (64.7%) | 333 (33.3%) |
| $500,000 to $749,999 | 118 (22.7%) | 582 (58.1%) |
| $750,000 to $999,999 | 30 (5.8%) | 20 (2.0%) |
| $1,000,000 or more | 10 (1.9%) | 0 (0.0%) |
| Total | 519 (100.0%) | 1,001 (100.0%) |
Household Income by Mortgage Status in West Sayville
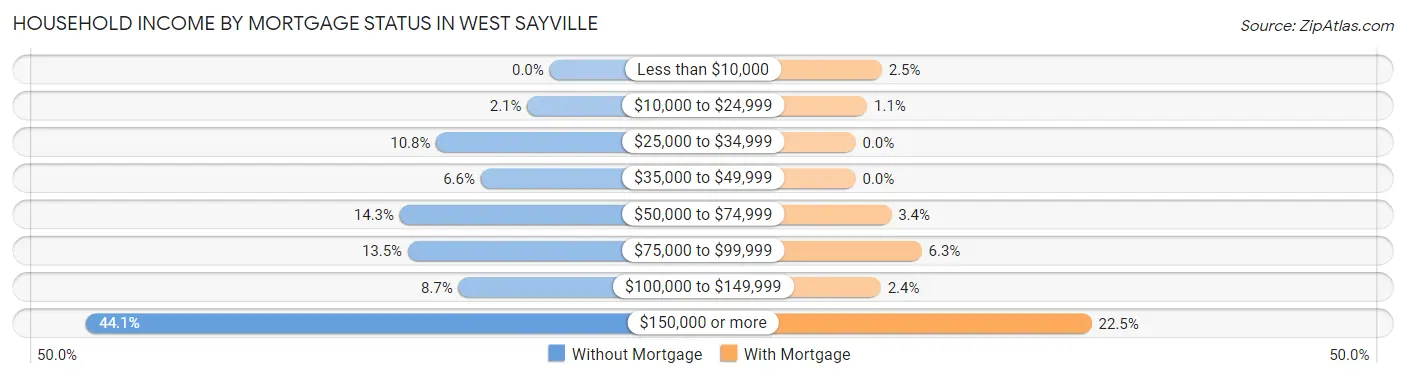
| Household Income | Without Mortgage | With Mortgage |
| Less than $10,000 | 0 (0.0%) | 25 (2.5%) |
| $10,000 to $24,999 | 11 (2.1%) | 11 (1.1%) |
| $25,000 to $34,999 | 56 (10.8%) | 0 (0.0%) |
| $35,000 to $49,999 | 34 (6.6%) | 0 (0.0%) |
| $50,000 to $74,999 | 74 (14.3%) | 34 (3.4%) |
| $75,000 to $99,999 | 70 (13.5%) | 63 (6.3%) |
| $100,000 to $149,999 | 45 (8.7%) | 24 (2.4%) |
| $150,000 or more | 229 (44.1%) | 225 (22.5%) |
| Total | 519 (100.0%) | 1,001 (100.0%) |
Property Value to Household Income Ratio in West Sayville
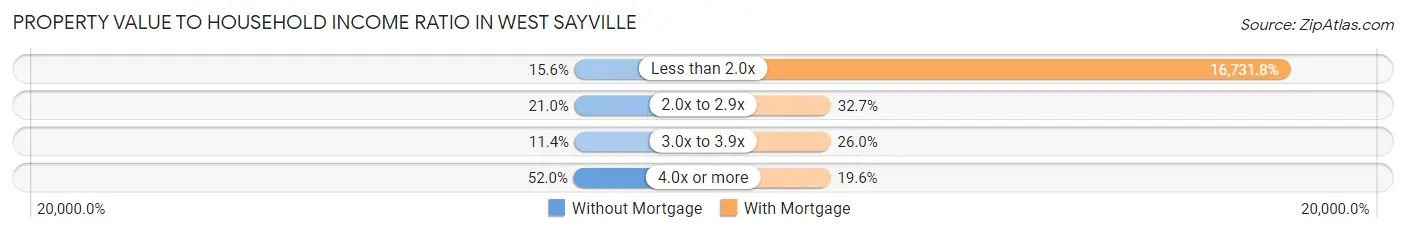
| Value-to-Income Ratio | Without Mortgage | With Mortgage |
| Less than 2.0x | 81 (15.6%) | 167,485 (16,731.8%) |
| 2.0x to 2.9x | 109 (21.0%) | 327 (32.7%) |
| 3.0x to 3.9x | 59 (11.4%) | 260 (26.0%) |
| 4.0x or more | 270 (52.0%) | 196 (19.6%) |
| Total | 519 (100.0%) | 1,001 (100.0%) |
Real Estate Taxes by Mortgage Status in West Sayville
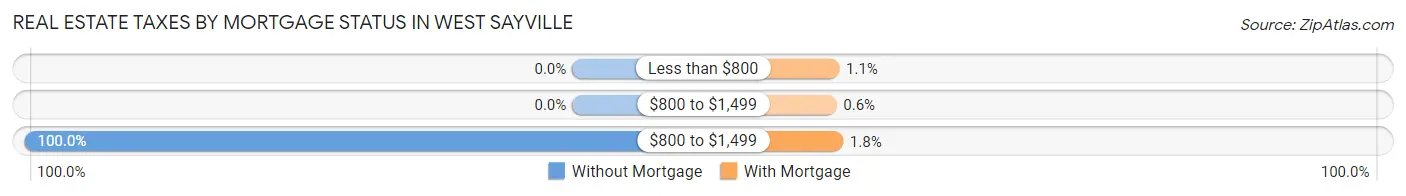
| Property Taxes | Without Mortgage | With Mortgage |
| Less than $800 | 0 (0.0%) | 11 (1.1%) |
| $800 to $1,499 | 0 (0.0%) | 6 (0.6%) |
| $800 to $1,499 | 519 (100.0%) | 18 (1.8%) |
| Total | 519 (100.0%) | 1,001 (100.0%) |
Health & Disability in West Sayville
Health Insurance Coverage by Age in West Sayville
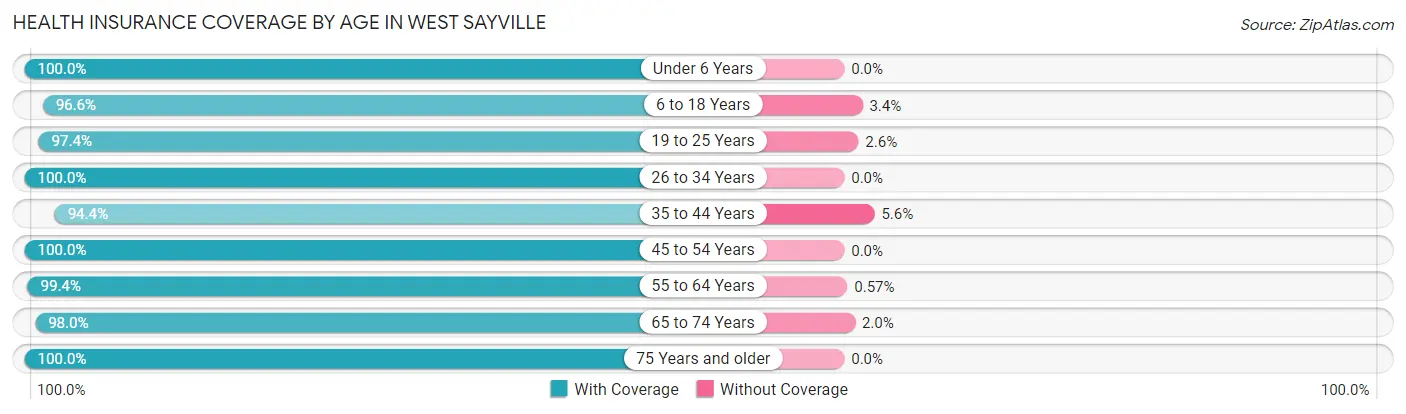
| Age Bracket | With Coverage | Without Coverage |
| Under 6 Years | 284 (100.0%) | 0 (0.0%) |
| 6 to 18 Years | 715 (96.6%) | 25 (3.4%) |
| 19 to 25 Years | 407 (97.4%) | 11 (2.6%) |
| 26 to 34 Years | 386 (100.0%) | 0 (0.0%) |
| 35 to 44 Years | 553 (94.4%) | 33 (5.6%) |
| 45 to 54 Years | 736 (100.0%) | 0 (0.0%) |
| 55 to 64 Years | 1,050 (99.4%) | 6 (0.6%) |
| 65 to 74 Years | 541 (98.0%) | 11 (2.0%) |
| 75 Years and older | 274 (100.0%) | 0 (0.0%) |
| Total | 4,946 (98.3%) | 86 (1.7%) |
Health Insurance Coverage by Citizenship Status in West Sayville
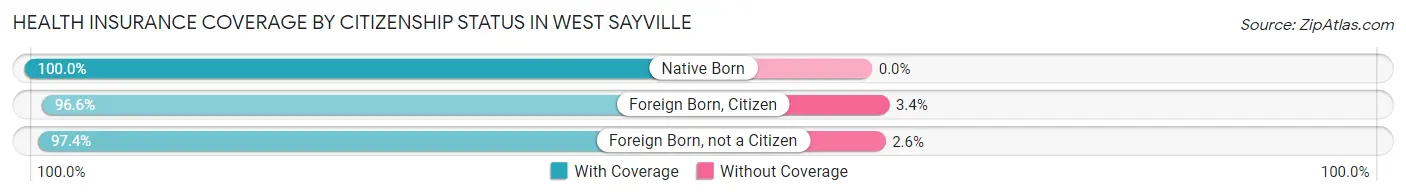
| Citizenship Status | With Coverage | Without Coverage |
| Native Born | 284 (100.0%) | 0 (0.0%) |
| Foreign Born, Citizen | 715 (96.6%) | 25 (3.4%) |
| Foreign Born, not a Citizen | 407 (97.4%) | 11 (2.6%) |
Health Insurance Coverage by Household Income in West Sayville
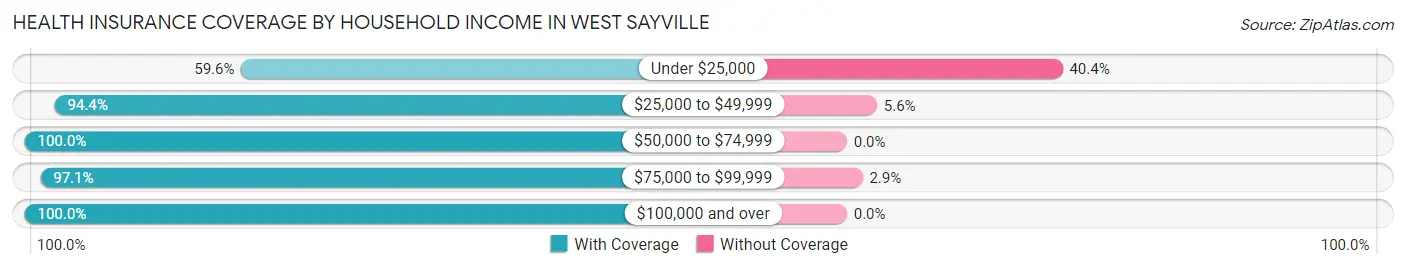
| Household Income | With Coverage | Without Coverage |
| Under $25,000 | 87 (59.6%) | 59 (40.4%) |
| $25,000 to $49,999 | 352 (94.4%) | 21 (5.6%) |
| $50,000 to $74,999 | 443 (100.0%) | 0 (0.0%) |
| $75,000 to $99,999 | 198 (97.1%) | 6 (2.9%) |
| $100,000 and over | 3,762 (100.0%) | 0 (0.0%) |
Public vs Private Health Insurance Coverage by Age in West Sayville
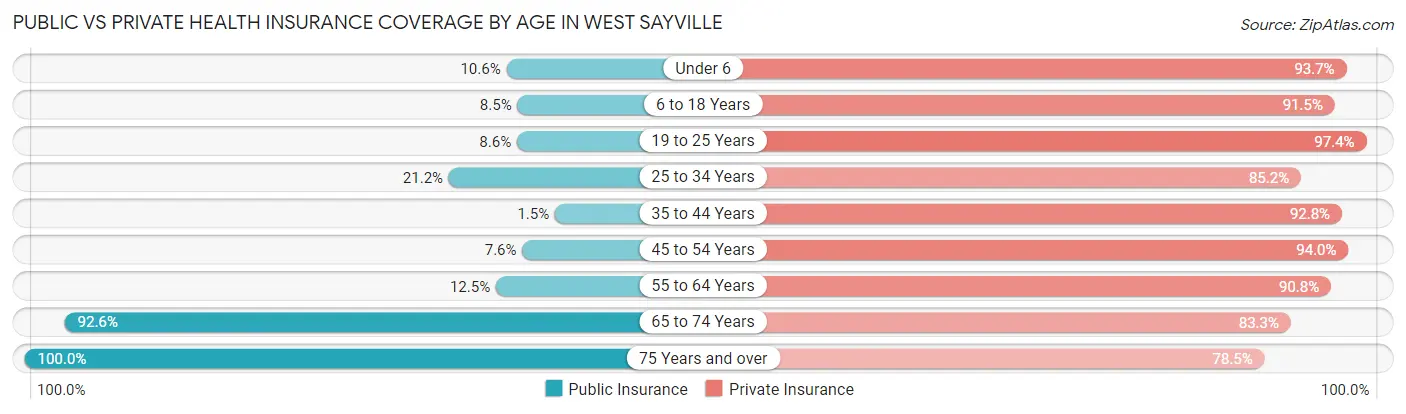
| Age Bracket | Public Insurance | Private Insurance |
| Under 6 | 30 (10.6%) | 266 (93.7%) |
| 6 to 18 Years | 63 (8.5%) | 677 (91.5%) |
| 19 to 25 Years | 36 (8.6%) | 407 (97.4%) |
| 25 to 34 Years | 82 (21.2%) | 329 (85.2%) |
| 35 to 44 Years | 9 (1.5%) | 544 (92.8%) |
| 45 to 54 Years | 56 (7.6%) | 692 (94.0%) |
| 55 to 64 Years | 132 (12.5%) | 959 (90.8%) |
| 65 to 74 Years | 511 (92.6%) | 460 (83.3%) |
| 75 Years and over | 274 (100.0%) | 215 (78.5%) |
| Total | 1,193 (23.7%) | 4,549 (90.4%) |
Disability Status by Sex by Age in West Sayville
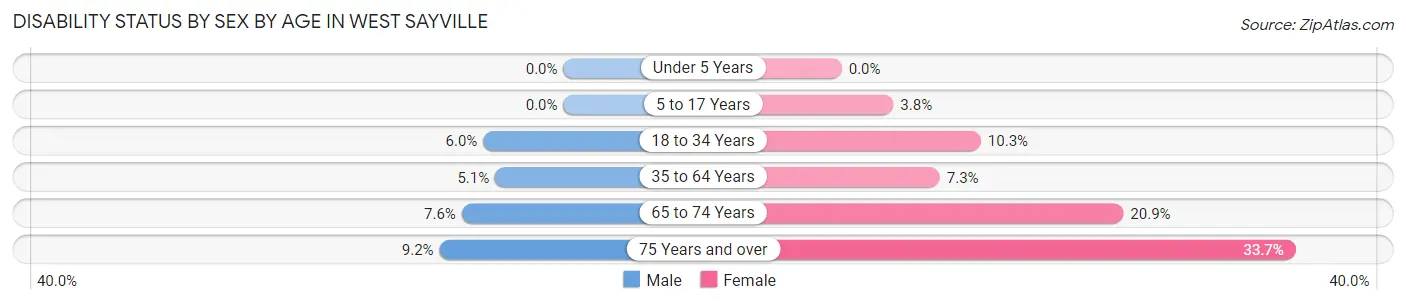
| Age Bracket | Male | Female |
| Under 5 Years | 0 (0.0%) | 0 (0.0%) |
| 5 to 17 Years | 0 (0.0%) | 16 (3.8%) |
| 18 to 34 Years | 26 (5.9%) | 50 (10.3%) |
| 35 to 64 Years | 62 (5.1%) | 84 (7.3%) |
| 65 to 74 Years | 20 (7.5%) | 60 (20.9%) |
| 75 Years and over | 8 (9.2%) | 63 (33.7%) |
Disability Class by Sex by Age in West Sayville
Disability Class: Hearing Difficulty
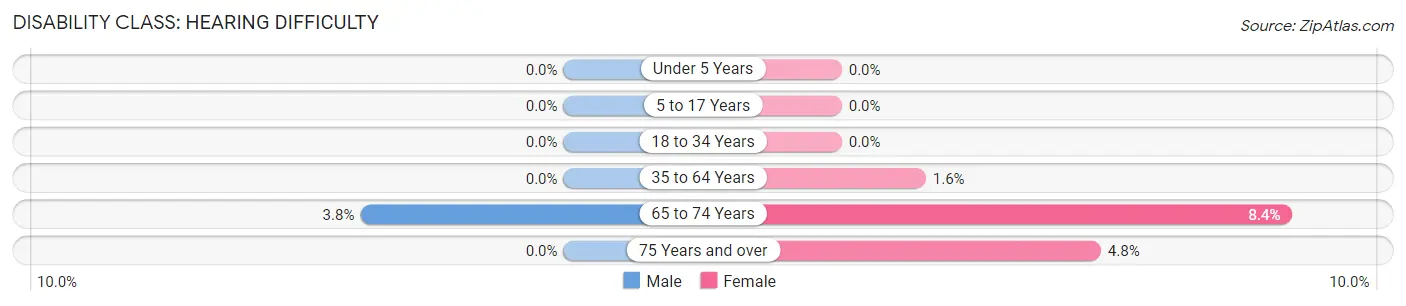
| Age Bracket | Male | Female |
| Under 5 Years | 0 (0.0%) | 0 (0.0%) |
| 5 to 17 Years | 0 (0.0%) | 0 (0.0%) |
| 18 to 34 Years | 0 (0.0%) | 0 (0.0%) |
| 35 to 64 Years | 0 (0.0%) | 18 (1.6%) |
| 65 to 74 Years | 10 (3.8%) | 24 (8.4%) |
| 75 Years and over | 0 (0.0%) | 9 (4.8%) |
Disability Class: Vision Difficulty
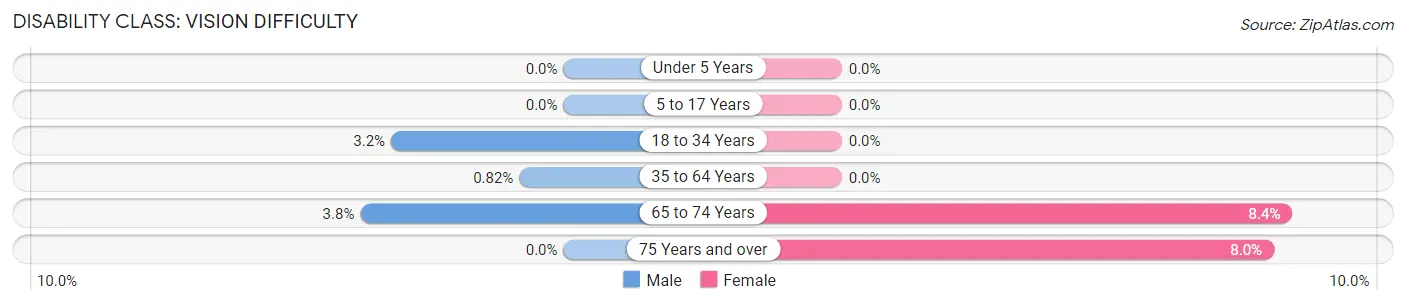
| Age Bracket | Male | Female |
| Under 5 Years | 0 (0.0%) | 0 (0.0%) |
| 5 to 17 Years | 0 (0.0%) | 0 (0.0%) |
| 18 to 34 Years | 14 (3.2%) | 0 (0.0%) |
| 35 to 64 Years | 10 (0.8%) | 0 (0.0%) |
| 65 to 74 Years | 10 (3.8%) | 24 (8.4%) |
| 75 Years and over | 0 (0.0%) | 15 (8.0%) |
Disability Class: Cognitive Difficulty
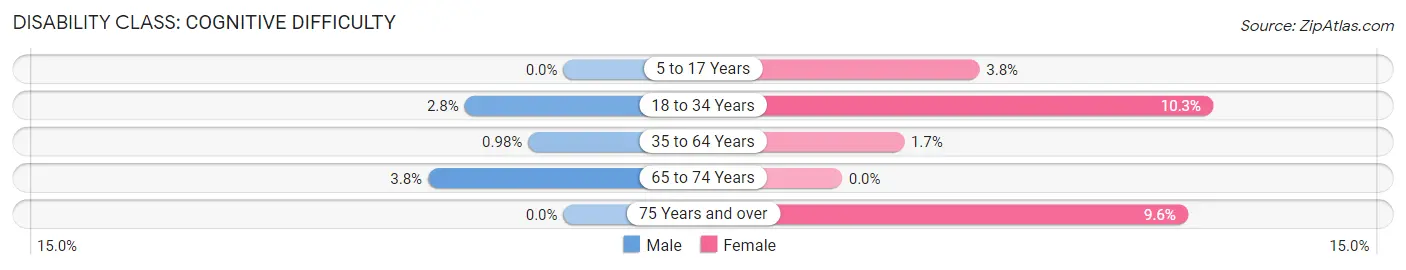
| Age Bracket | Male | Female |
| 5 to 17 Years | 0 (0.0%) | 16 (3.8%) |
| 18 to 34 Years | 12 (2.8%) | 50 (10.3%) |
| 35 to 64 Years | 12 (1.0%) | 20 (1.7%) |
| 65 to 74 Years | 10 (3.8%) | 0 (0.0%) |
| 75 Years and over | 0 (0.0%) | 18 (9.6%) |
Disability Class: Ambulatory Difficulty
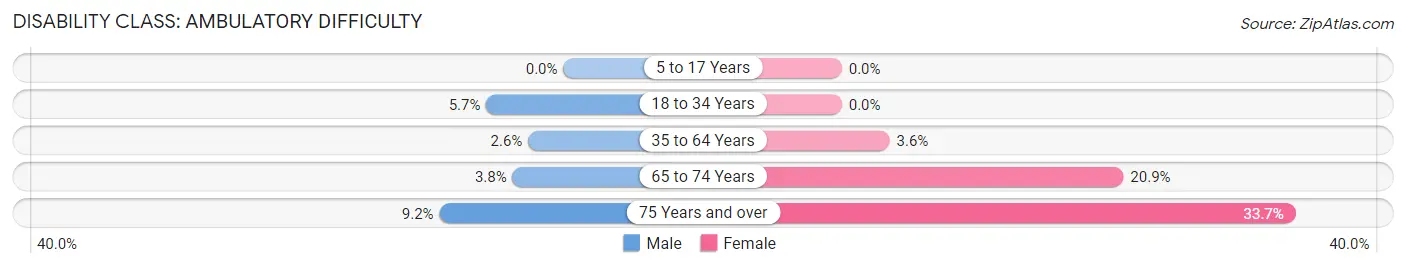
| Age Bracket | Male | Female |
| 5 to 17 Years | 0 (0.0%) | 0 (0.0%) |
| 18 to 34 Years | 25 (5.7%) | 0 (0.0%) |
| 35 to 64 Years | 32 (2.6%) | 41 (3.5%) |
| 65 to 74 Years | 10 (3.8%) | 60 (20.9%) |
| 75 Years and over | 8 (9.2%) | 63 (33.7%) |
Disability Class: Self-Care Difficulty
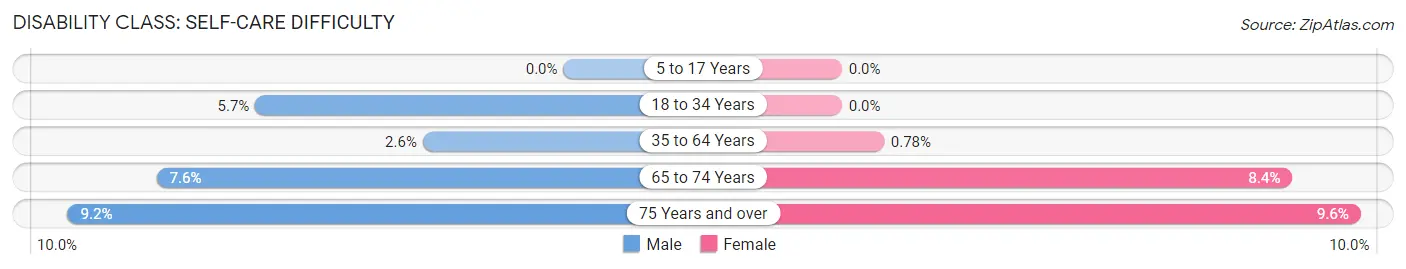
| Age Bracket | Male | Female |
| 5 to 17 Years | 0 (0.0%) | 0 (0.0%) |
| 18 to 34 Years | 25 (5.7%) | 0 (0.0%) |
| 35 to 64 Years | 32 (2.6%) | 9 (0.8%) |
| 65 to 74 Years | 20 (7.5%) | 24 (8.4%) |
| 75 Years and over | 8 (9.2%) | 18 (9.6%) |
Technology Access in West Sayville
Computing Device Access in West Sayville
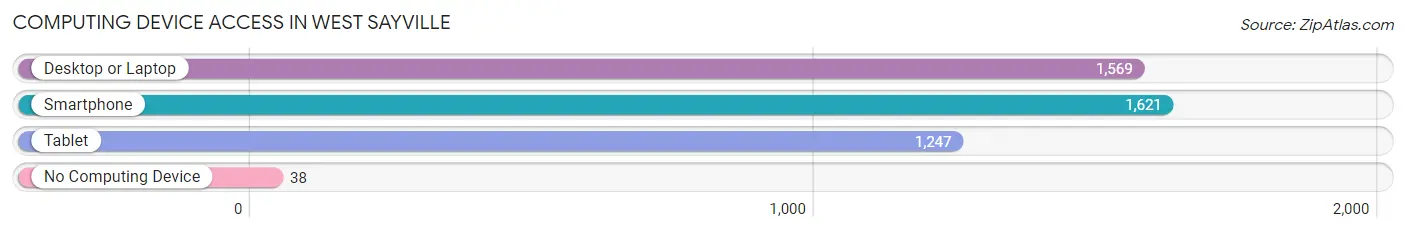
| Device Type | # Households | % Households |
| Desktop or Laptop | 1,569 | 89.1% |
| Smartphone | 1,621 | 92.0% |
| Tablet | 1,247 | 70.8% |
| No Computing Device | 38 | 2.2% |
| Total | 1,761 | 100.0% |
Internet Access in West Sayville
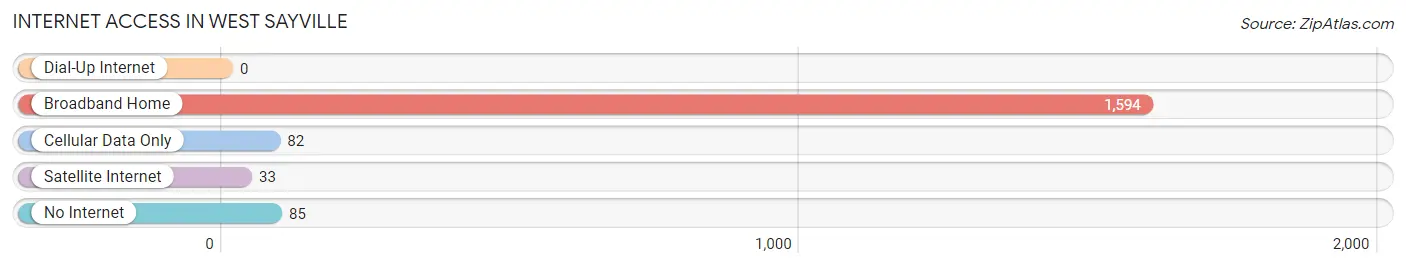
| Internet Type | # Households | % Households |
| Dial-Up Internet | 0 | 0.0% |
| Broadband Home | 1,594 | 90.5% |
| Cellular Data Only | 82 | 4.7% |
| Satellite Internet | 33 | 1.9% |
| No Internet | 85 | 4.8% |
| Total | 1,761 | 100.0% |
West Sayville Summary
Sayville is a hamlet located in the Town of Islip in Suffolk County, New York. It is situated on the south shore of Long Island, approximately 60 miles east of New York City. The hamlet is bordered by the Great South Bay to the north, the hamlet of West Sayville to the west, and the hamlet of Oakdale to the east.
History
The area now known as Sayville was originally inhabited by the Secatogue Indians, a sub-tribe of the Algonquin Nation. The first European settlers arrived in the area in 1664, when a group of English settlers from Connecticut purchased land from the Secatogue Indians. The area was initially known as “West Saybrook”, after the Connecticut town from which the settlers had come. In 1838, the area was renamed “Sayville”, after the Say family, who had been among the first settlers in the area.
In the late 19th century, Sayville became a popular summer resort destination for wealthy New Yorkers. The area was known for its beautiful beaches, and many of the grand Victorian homes that were built during this period still stand today.
Geography
Sayville is located on the south shore of Long Island, approximately 60 miles east of New York City. The hamlet is bordered by the Great South Bay to the north, the hamlet of West Sayville to the west, and the hamlet of Oakdale to the east. The hamlet covers an area of approximately 4.5 square miles, and is home to a population of approximately 11,000 people.
The terrain of Sayville is mostly flat, with some rolling hills in the western part of the hamlet. The area is known for its beautiful beaches, which are popular with both locals and visitors.
Economy
The economy of Sayville is largely based on tourism and retail. The hamlet is home to a number of small businesses, including restaurants, bars, and shops. The area is also home to a number of marinas, which attract visitors from all over the region.
The hamlet is also home to a number of corporate offices, including those of the Long Island Power Authority and the Long Island Rail Road.
Demographics
As of the 2010 census, the population of Sayville was 11,039. The racial makeup of the hamlet was 87.3% White, 5.2% African American, 0.4% Native American, 2.2% Asian, 0.1% Pacific Islander, and 4.8% from other races. Hispanic or Latino of any race were 8.3% of the population.
The median household income in Sayville was $87,813, and the median family income was $102,917. The per capita income for the hamlet was $41,945. About 4.2% of families and 5.7% of the population were below the poverty line, including 6.3% of those under age 18 and 4.2% of those age 65 or over.
Common Questions
What is the Total Population of West Sayville?
Total Population of West Sayville is 5,032.
What is the Total Male Population of West Sayville?
Total Male Population of West Sayville is 2,383.
What is the Total Female Population of West Sayville?
Total Female Population of West Sayville is 2,649.
What is the Ratio of Males per 100 Females in West Sayville?
There are 89.96 Males per 100 Females in West Sayville.
What is the Ratio of Females per 100 Males in West Sayville?
There are 111.16 Females per 100 Males in West Sayville.
What is the Median Population Age in West Sayville?
Median Population Age in West Sayville is 46.4 Years.
What is the Average Family Size in West Sayville
Average Family Size in West Sayville is 3.1 People.
What is the Average Household Size in West Sayville
Average Household Size in West Sayville is 2.8 People.
What is Per Capita Income in West Sayville?
Per Capita income in West Sayville is $62,735.
What is the Median Family Income in West Sayville?
Median Family Income in West Sayville is $166,451.
What is the Median Household income in West Sayville?
Median Household Income in West Sayville is $157,275.
What is Income or Wage Gap in West Sayville?
Income or Wage Gap in West Sayville is 30.2%.
Women in West Sayville earn 69.8 cents for every dollar earned by a man.
What is Inequality or Gini Index in West Sayville?
Inequality or Gini Index in West Sayville is 0.38.
How Large is the Labor Force in West Sayville?
There are 2,736 People in the Labor Forcein in West Sayville.
What is the Percentage of People in the Labor Force in West Sayville?
65.0% of People are in the Labor Force in West Sayville.
What is the Unemployment Rate in West Sayville?
Unemployment Rate in West Sayville is 3.7%.