Wellsville, NY
Wellsville Map
Wellsville Overview
4,871
TOTAL POPULATION
2,584
MALE POPULATION
2,287
FEMALE POPULATION
112.99
MALES / 100 FEMALES
88.51
FEMALES / 100 MALES
44.8
MEDIAN AGE
2.9
AVG FAMILY SIZE
2.1
AVG HOUSEHOLD SIZE
$29,536
PER CAPITA INCOME
$76,118
AVG FAMILY INCOME
$48,784
AVG HOUSEHOLD INCOME
26.8%
WAGE / INCOME GAP [ % ]
73.2¢/ $1
WAGE / INCOME GAP [ $ ]
0.46
INEQUALITY / GINI INDEX
2,036
LABOR FORCE [ PEOPLE ]
49.3%
PERCENT IN LABOR FORCE
5.2%
UNEMPLOYMENT RATE
Wellsville Zip Codes
Wellsville Area Codes
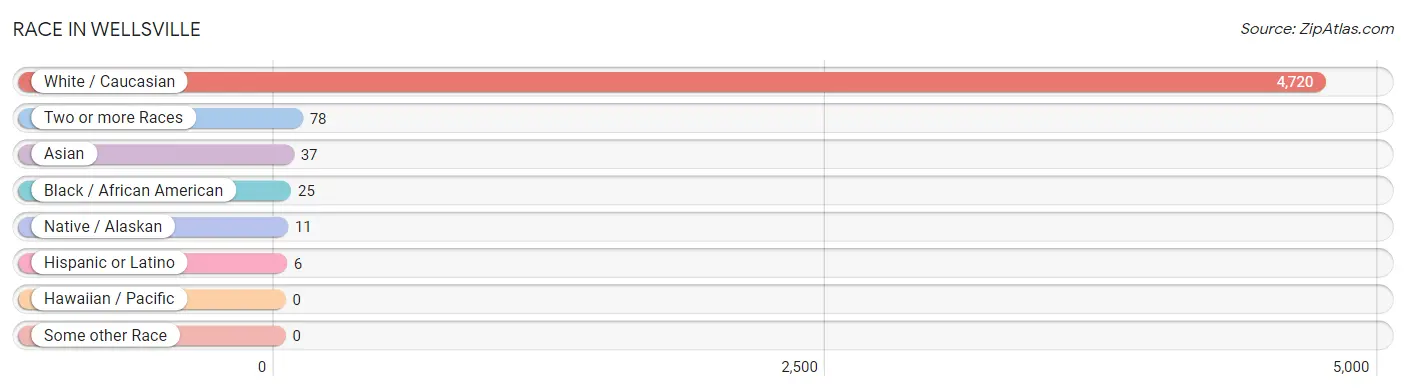
Race in Wellsville
The most populous races in Wellsville are White / Caucasian (4,720 | 96.9%), Two or more Races (78 | 1.6%), and Asian (37 | 0.8%).
| Race | # Population | % Population |
| Asian | 37 | 0.8% |
| Black / African American | 25 | 0.5% |
| Hawaiian / Pacific | 0 | 0.0% |
| Hispanic or Latino | 6 | 0.1% |
| Native / Alaskan | 11 | 0.2% |
| White / Caucasian | 4,720 | 96.9% |
| Two or more Races | 78 | 1.6% |
| Some other Race | 0 | 0.0% |
| Total | 4,871 | 100.0% |
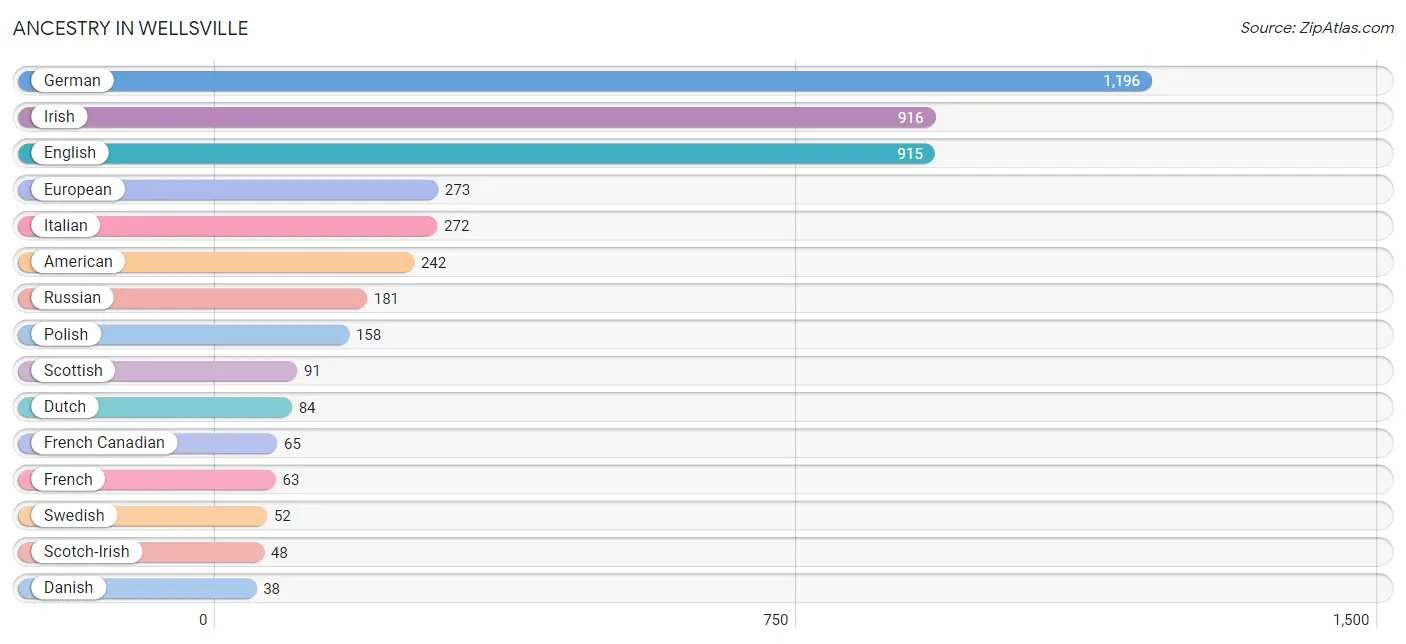
Ancestry in Wellsville
The most populous ancestries reported in Wellsville are German (1,196 | 24.5%), Irish (916 | 18.8%), English (915 | 18.8%), European (273 | 5.6%), and Italian (272 | 5.6%), together accounting for 73.3% of all Wellsville residents.
| Ancestry | # Population | % Population |
| African | 9 | 0.2% |
| American | 242 | 5.0% |
| Belgian | 17 | 0.4% |
| British | 31 | 0.6% |
| Cherokee | 11 | 0.2% |
| Danish | 38 | 0.8% |
| Dutch | 84 | 1.7% |
| Eastern European | 31 | 0.6% |
| English | 915 | 18.8% |
| Estonian | 13 | 0.3% |
| European | 273 | 5.6% |
| French | 63 | 1.3% |
| French Canadian | 65 | 1.3% |
| German | 1,196 | 24.5% |
| Hungarian | 17 | 0.4% |
| Irish | 916 | 18.8% |
| Iroquois | 17 | 0.4% |
| Italian | 272 | 5.6% |
| Korean | 30 | 0.6% |
| Lithuanian | 9 | 0.2% |
| Malaysian | 17 | 0.4% |
| Pennsylvania German | 26 | 0.5% |
| Polish | 158 | 3.2% |
| Puerto Rican | 6 | 0.1% |
| Russian | 181 | 3.7% |
| Scandinavian | 13 | 0.3% |
| Scotch-Irish | 48 | 1.0% |
| Scottish | 91 | 1.9% |
| Slavic | 9 | 0.2% |
| Subsaharan African | 9 | 0.2% |
| Swedish | 52 | 1.1% |
| Welsh | 30 | 0.6% | View All 32 Rows |
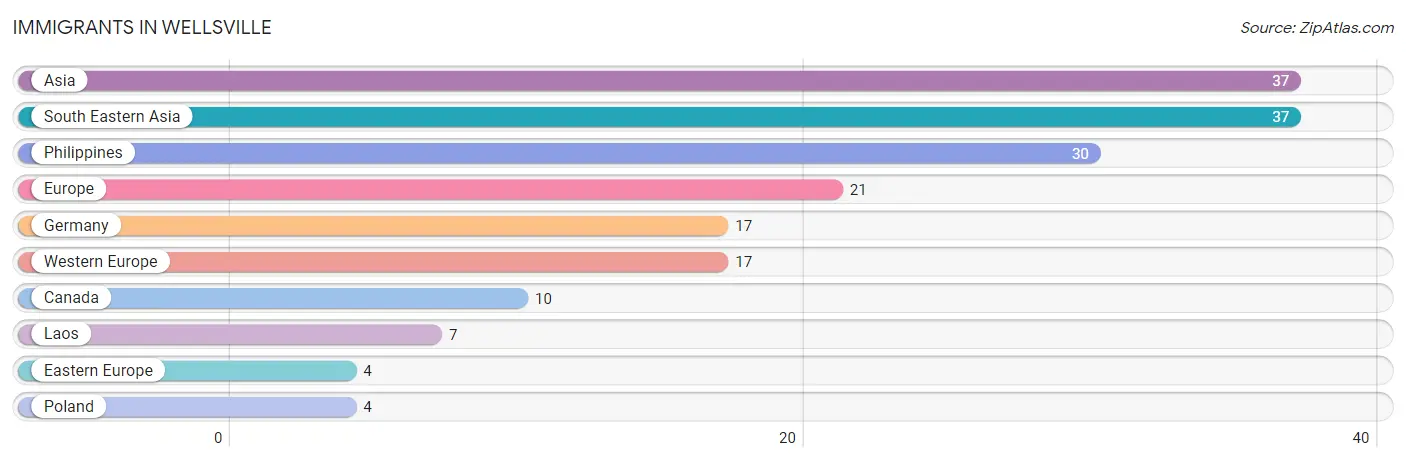
Immigrants in Wellsville
The most numerous immigrant groups reported in Wellsville came from Asia (37 | 0.8%), South Eastern Asia (37 | 0.8%), Philippines (30 | 0.6%), Europe (21 | 0.4%), and Germany (17 | 0.4%), together accounting for 2.9% of all Wellsville residents.
| Immigration Origin | # Population | % Population |
| Asia | 37 | 0.8% |
| Canada | 10 | 0.2% |
| Eastern Europe | 4 | 0.1% |
| Europe | 21 | 0.4% |
| Germany | 17 | 0.4% |
| Laos | 7 | 0.1% |
| Philippines | 30 | 0.6% |
| Poland | 4 | 0.1% |
| South Eastern Asia | 37 | 0.8% |
| Western Europe | 17 | 0.4% | View All 10 Rows |
Sex and Age in Wellsville
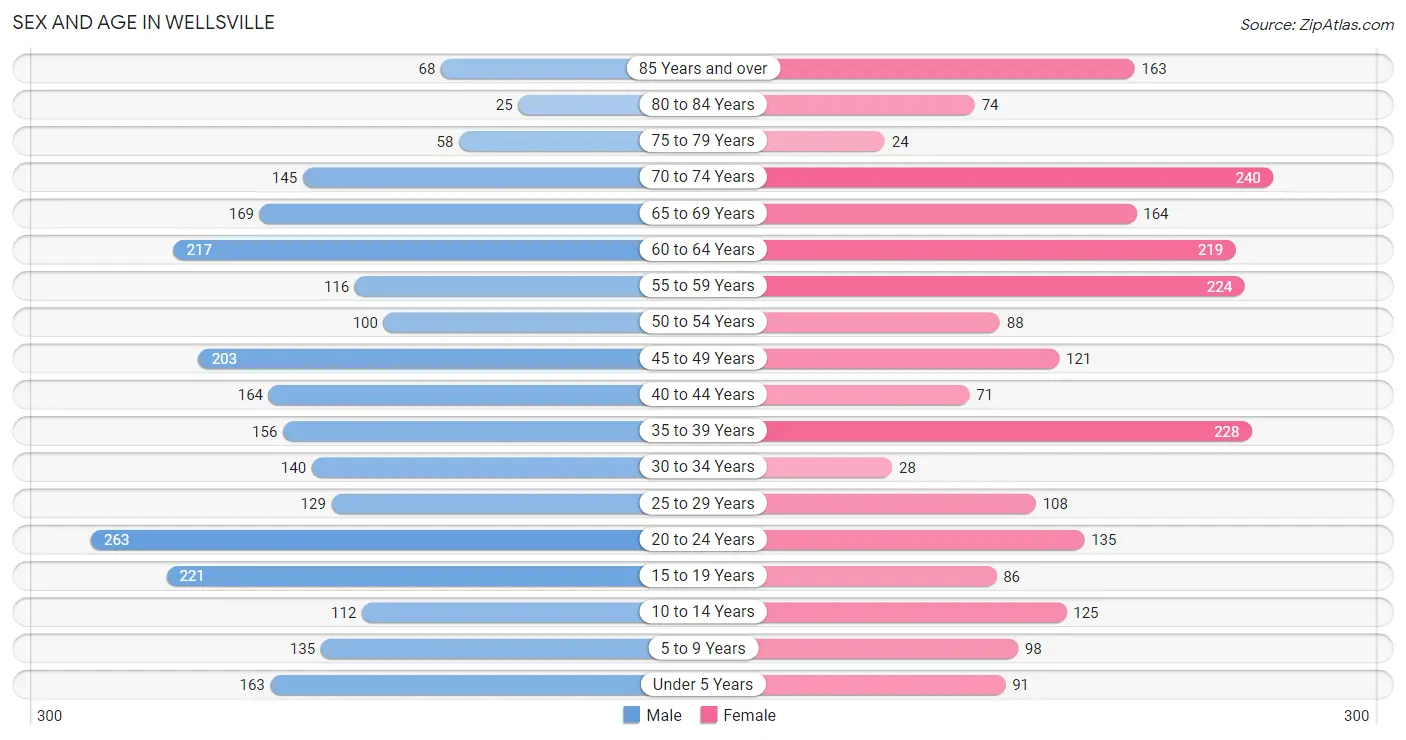
Sex and Age in Wellsville
The most populous age groups in Wellsville are 20 to 24 Years (263 | 10.2%) for men and 70 to 74 Years (240 | 10.5%) for women.
| Age Bracket | Male | Female |
| Under 5 Years | 163 (6.3%) | 91 (4.0%) |
| 5 to 9 Years | 135 (5.2%) | 98 (4.3%) |
| 10 to 14 Years | 112 (4.3%) | 125 (5.5%) |
| 15 to 19 Years | 221 (8.6%) | 86 (3.8%) |
| 20 to 24 Years | 263 (10.2%) | 135 (5.9%) |
| 25 to 29 Years | 129 (5.0%) | 108 (4.7%) |
| 30 to 34 Years | 140 (5.4%) | 28 (1.2%) |
| 35 to 39 Years | 156 (6.0%) | 228 (10.0%) |
| 40 to 44 Years | 164 (6.4%) | 71 (3.1%) |
| 45 to 49 Years | 203 (7.9%) | 121 (5.3%) |
| 50 to 54 Years | 100 (3.9%) | 88 (3.8%) |
| 55 to 59 Years | 116 (4.5%) | 224 (9.8%) |
| 60 to 64 Years | 217 (8.4%) | 219 (9.6%) |
| 65 to 69 Years | 169 (6.5%) | 164 (7.2%) |
| 70 to 74 Years | 145 (5.6%) | 240 (10.5%) |
| 75 to 79 Years | 58 (2.2%) | 24 (1.1%) |
| 80 to 84 Years | 25 (1.0%) | 74 (3.2%) |
| 85 Years and over | 68 (2.6%) | 163 (7.1%) |
| Total | 2,584 (100.0%) | 2,287 (100.0%) |
Families and Households in Wellsville
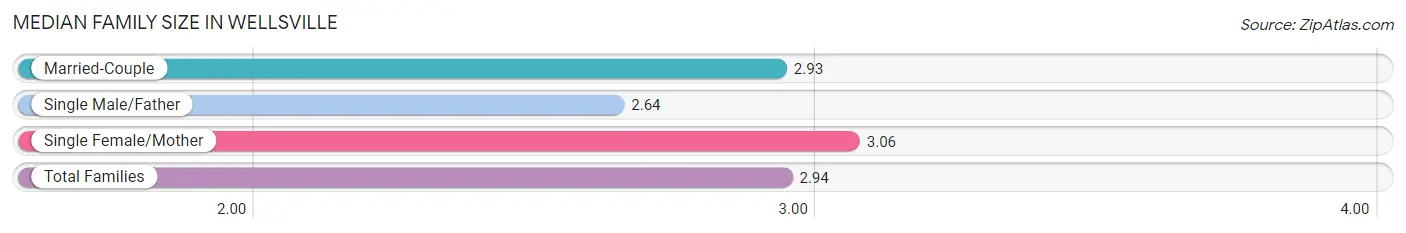
Median Family Size in Wellsville
The median family size in Wellsville is 2.94 persons per family, with single female/mother families (174 | 15.4%) accounting for the largest median family size of 3.06 persons per family. On the other hand, single male/father families (66 | 5.9%) represent the smallest median family size with 2.64 persons per family.
| Family Type | # Families | Family Size |
| Married-Couple | 889 (78.7%) | 2.93 |
| Single Male/Father | 66 (5.9%) | 2.64 |
| Single Female/Mother | 174 (15.4%) | 3.06 |
| Total Families | 1,129 (100.0%) | 2.94 |
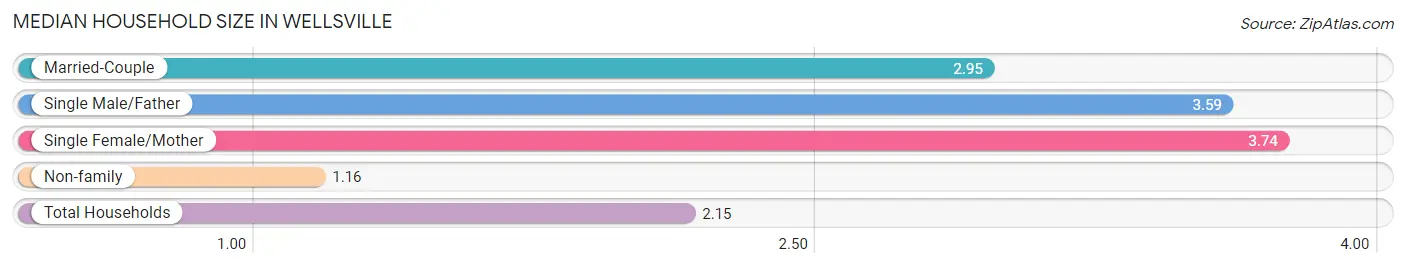
Median Household Size in Wellsville
The median household size in Wellsville is 2.15 persons per household, with single female/mother households (174 | 7.9%) accounting for the largest median household size of 3.74 persons per household. non-family households (1,088 | 49.1%) represent the smallest median household size with 1.16 persons per household.
| Household Type | # Households | Household Size |
| Married-Couple | 889 (40.1%) | 2.95 |
| Single Male/Father | 66 (3.0%) | 3.59 |
| Single Female/Mother | 174 (7.9%) | 3.74 |
| Non-family | 1,088 (49.1%) | 1.16 |
| Total Households | 2,217 (100.0%) | 2.15 |
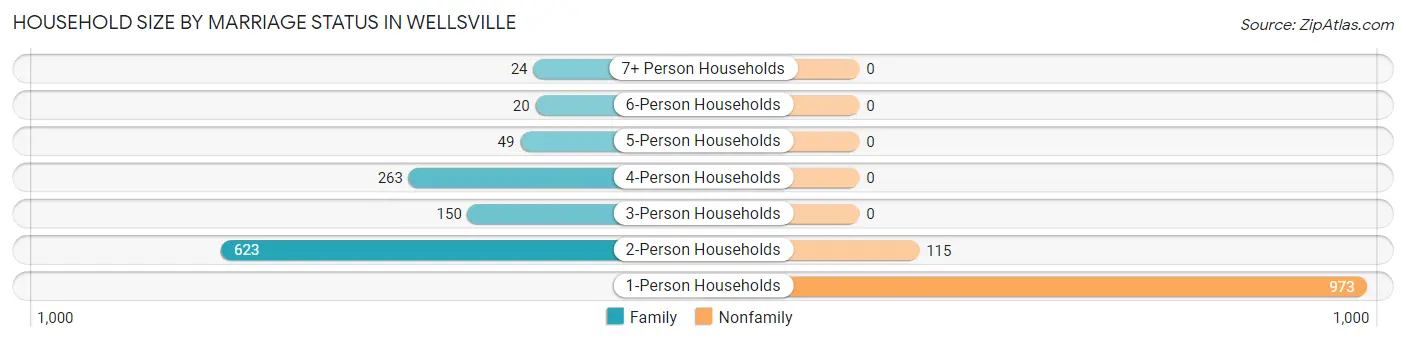
Household Size by Marriage Status in Wellsville
Out of a total of 2,217 households in Wellsville, 1,129 (50.9%) are family households, while 1,088 (49.1%) are nonfamily households. The most numerous type of family households are 2-person households, comprising 623, and the most common type of nonfamily households are 1-person households, comprising 973.
| Household Size | Family Households | Nonfamily Households |
| 1-Person Households | - | 973 (43.9%) |
| 2-Person Households | 623 (28.1%) | 115 (5.2%) |
| 3-Person Households | 150 (6.8%) | 0 (0.0%) |
| 4-Person Households | 263 (11.9%) | 0 (0.0%) |
| 5-Person Households | 49 (2.2%) | 0 (0.0%) |
| 6-Person Households | 20 (0.9%) | 0 (0.0%) |
| 7+ Person Households | 24 (1.1%) | 0 (0.0%) |
| Total | 1,129 (50.9%) | 1,088 (49.1%) |
Female Fertility in Wellsville
Fertility by Age in Wellsville
Average fertility rate in Wellsville is 102.0 births per 1,000 women. Women in the age bracket of 20 to 34 years have the highest fertility rate with 203.0 births per 1,000 women. Women in the age bracket of 20 to 34 years acount for 69.6% of all women with births.
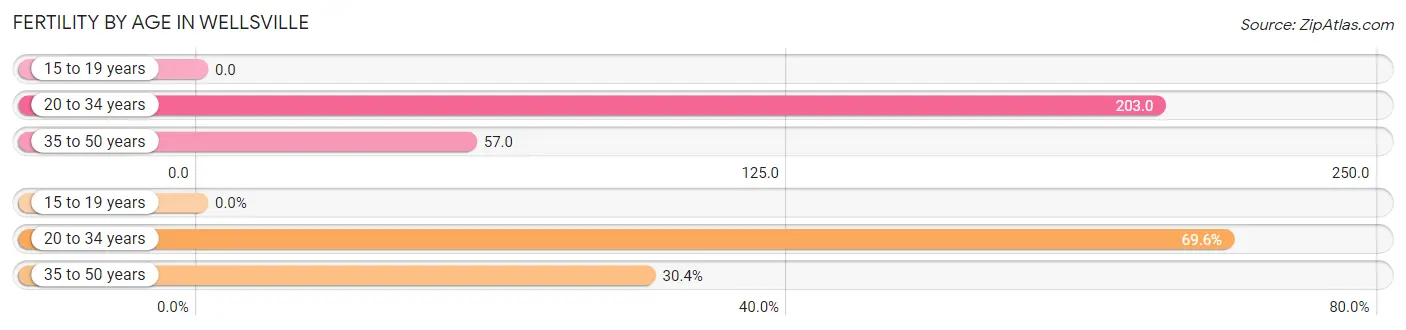
| Age Bracket | Women with Births | Births / 1,000 Women |
| 15 to 19 years | 0 (0.0%) | 0.0 |
| 20 to 34 years | 55 (69.6%) | 203.0 |
| 35 to 50 years | 24 (30.4%) | 57.0 |
| Total | 79 (100.0%) | 102.0 |
Fertility by Age by Marriage Status in Wellsville
30.4% of women with births (79) in Wellsville are married. The highest percentage of unmarried women with births falls into 35 to 50 years age bracket with 100.0% of them unmarried at the time of birth, while the lowest percentage of unmarried women with births belong to 20 to 34 years age bracket with 56.4% of them unmarried.
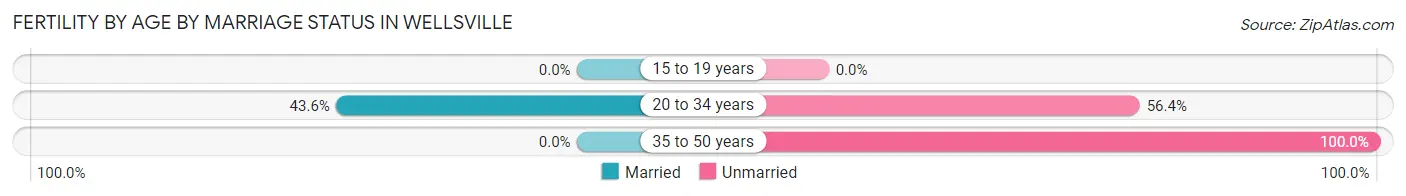
| Age Bracket | Married | Unmarried |
| 15 to 19 years | 0 (0.0%) | 0 (0.0%) |
| 20 to 34 years | 24 (43.6%) | 31 (56.4%) |
| 35 to 50 years | 0 (0.0%) | 24 (100.0%) |
| Total | 24 (30.4%) | 55 (69.6%) |
Fertility by Education in Wellsville
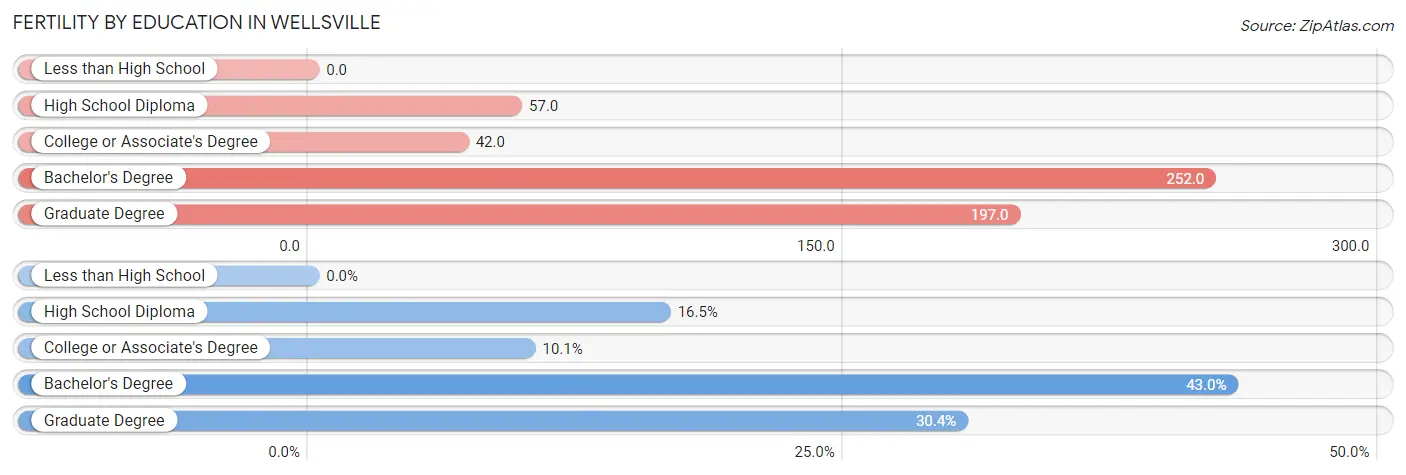
| Educational Attainment | Women with Births | Births / 1,000 Women |
| Less than High School | 0 (0.0%) | 0.0 |
| High School Diploma | 13 (16.5%) | 57.0 |
| College or Associate's Degree | 8 (10.1%) | 42.0 |
| Bachelor's Degree | 34 (43.0%) | 252.0 |
| Graduate Degree | 24 (30.4%) | 197.0 |
| Total | 79 (100.0%) | 102.0 |
Fertility by Education by Marriage Status in Wellsville
69.6% of women with births in Wellsville are unmarried. Women with the educational attainment of bachelor's degree are most likely to be married with 70.6% of them married at childbirth, while women with the educational attainment of high school diploma are least likely to be married with 100.0% of them unmarried at childbirth.
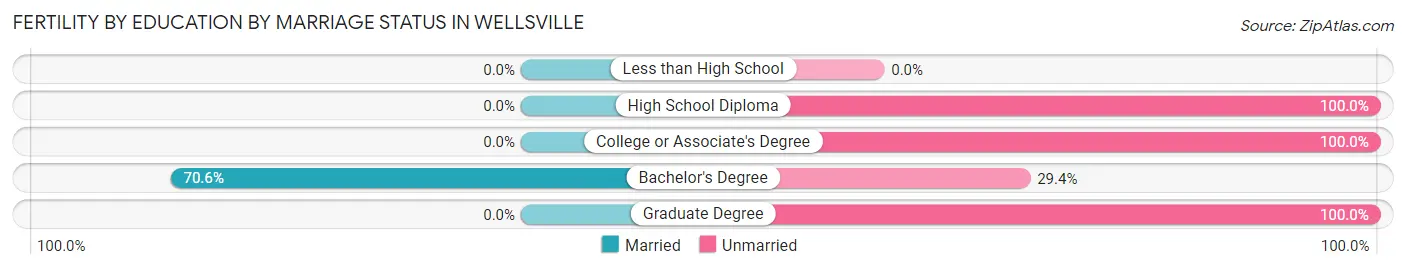
| Educational Attainment | Married | Unmarried |
| Less than High School | 0 (0.0%) | 0 (0.0%) |
| High School Diploma | 0 (0.0%) | 13 (100.0%) |
| College or Associate's Degree | 0 (0.0%) | 8 (100.0%) |
| Bachelor's Degree | 24 (70.6%) | 10 (29.4%) |
| Graduate Degree | 0 (0.0%) | 24 (100.0%) |
| Total | 24 (30.4%) | 55 (69.6%) |
Income in Wellsville
Income Overview in Wellsville
Per Capita Income in Wellsville is $29,536, while median incomes of families and households are $76,118 and $48,784 respectively.
| Characteristic | Number | Measure |
| Per Capita Income | 4,871 | $29,536 |
| Median Family Income | 1,129 | $76,118 |
| Mean Family Income | 1,129 | $88,367 |
| Median Household Income | 2,217 | $48,784 |
| Mean Household Income | 2,217 | $62,628 |
| Income Deficit | 1,129 | $0 |
| Wage / Income Gap (%) | 4,871 | 26.80% |
| Wage / Income Gap ($) | 4,871 | 73.20¢ per $1 |
| Gini / Inequality Index | 4,871 | 0.46 |
Earnings by Sex in Wellsville
Average Earnings in Wellsville are $27,455, $32,857 for men and $24,050 for women, a difference of 26.8%.
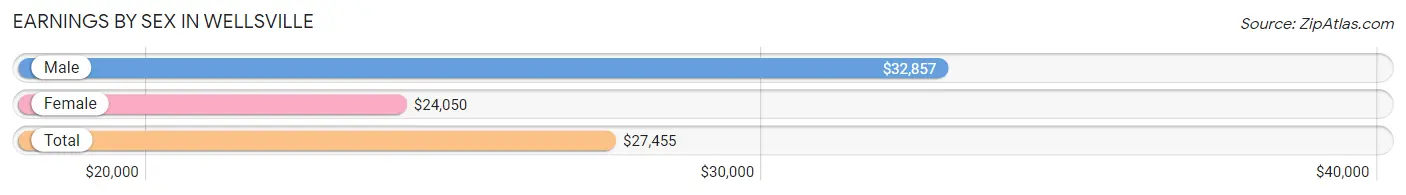
| Sex | Number | Average Earnings |
| Male | 1,300 (58.4%) | $32,857 |
| Female | 928 (41.6%) | $24,050 |
| Total | 2,228 (100.0%) | $27,455 |
Earnings by Sex by Income Bracket in Wellsville
The most common earnings brackets in Wellsville are $2,500 to $4,999 for men (197 | 15.1%) and $25,000 to $29,999 for women (90 | 9.7%).
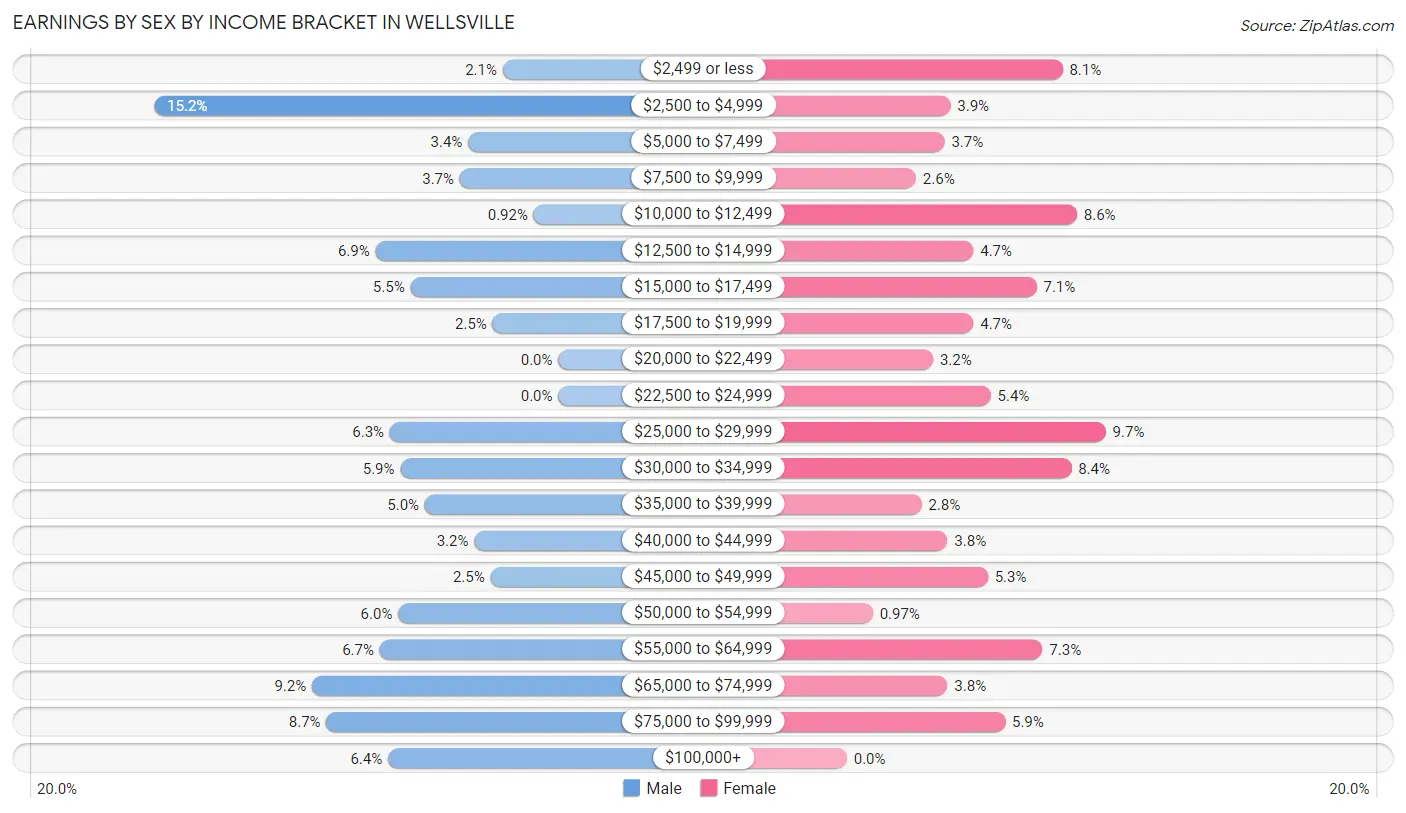
| Income | Male | Female |
| $2,499 or less | 27 (2.1%) | 75 (8.1%) |
| $2,500 to $4,999 | 197 (15.1%) | 36 (3.9%) |
| $5,000 to $7,499 | 44 (3.4%) | 34 (3.7%) |
| $7,500 to $9,999 | 48 (3.7%) | 24 (2.6%) |
| $10,000 to $12,499 | 12 (0.9%) | 80 (8.6%) |
| $12,500 to $14,999 | 89 (6.9%) | 44 (4.7%) |
| $15,000 to $17,499 | 72 (5.5%) | 66 (7.1%) |
| $17,500 to $19,999 | 32 (2.5%) | 44 (4.7%) |
| $20,000 to $22,499 | 0 (0.0%) | 30 (3.2%) |
| $22,500 to $24,999 | 0 (0.0%) | 50 (5.4%) |
| $25,000 to $29,999 | 82 (6.3%) | 90 (9.7%) |
| $30,000 to $34,999 | 77 (5.9%) | 78 (8.4%) |
| $35,000 to $39,999 | 65 (5.0%) | 26 (2.8%) |
| $40,000 to $44,999 | 41 (3.2%) | 35 (3.8%) |
| $45,000 to $49,999 | 33 (2.5%) | 49 (5.3%) |
| $50,000 to $54,999 | 78 (6.0%) | 9 (1.0%) |
| $55,000 to $64,999 | 87 (6.7%) | 68 (7.3%) |
| $65,000 to $74,999 | 120 (9.2%) | 35 (3.8%) |
| $75,000 to $99,999 | 113 (8.7%) | 55 (5.9%) |
| $100,000+ | 83 (6.4%) | 0 (0.0%) |
| Total | 1,300 (100.0%) | 928 (100.0%) |
Earnings by Sex by Educational Attainment in Wellsville
Average earnings in Wellsville are $48,750 for men and $29,125 for women, a difference of 40.3%. Men with an educational attainment of graduate degree enjoy the highest average annual earnings of $200,400, while those with high school diploma education earn the least with $29,750. Women with an educational attainment of bachelor's degree earn the most with the average annual earnings of $30,729, while those with less than high school education have the smallest earnings of $16,645.
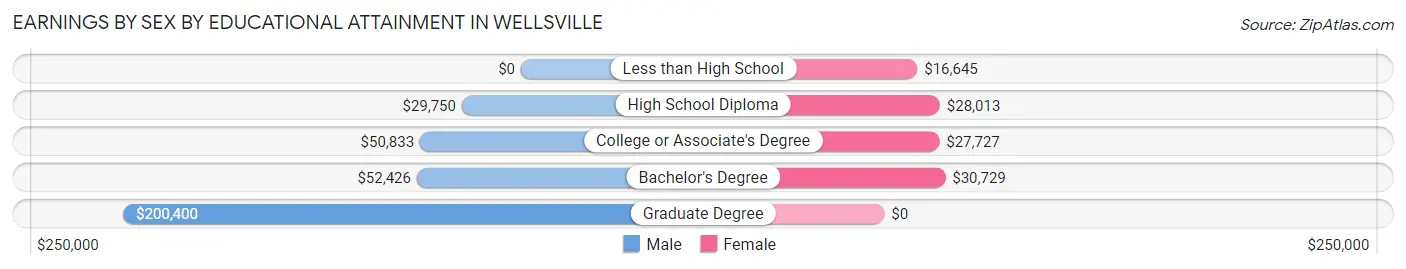
| Educational Attainment | Male Income | Female Income |
| Less than High School | - | - |
| High School Diploma | $29,750 | $28,013 |
| College or Associate's Degree | $50,833 | $27,727 |
| Bachelor's Degree | $52,426 | $30,729 |
| Graduate Degree | $200,400 | $0 |
| Total | $48,750 | $29,125 |
Family Income in Wellsville
Family Income Brackets in Wellsville
According to the Wellsville family income data, there are 222 families falling into the $100,000 to $149,999 income range, which is the most common income bracket and makes up 19.7% of all families. Conversely, the $10,000 to $14,999 income bracket is the least frequent group with only 14 families (1.2%) belonging to this category.
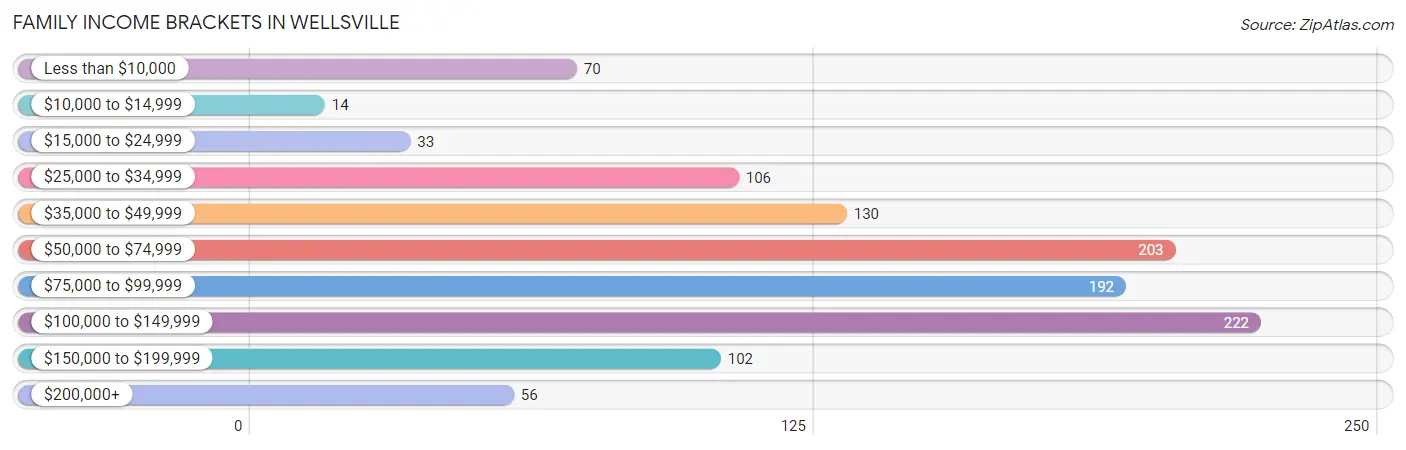
| Income Bracket | # Families | % Families |
| Less than $10,000 | 70 | 6.2% |
| $10,000 to $14,999 | 14 | 1.2% |
| $15,000 to $24,999 | 33 | 2.9% |
| $25,000 to $34,999 | 106 | 9.4% |
| $35,000 to $49,999 | 130 | 11.5% |
| $50,000 to $74,999 | 203 | 18.0% |
| $75,000 to $99,999 | 192 | 17.0% |
| $100,000 to $149,999 | 222 | 19.7% |
| $150,000 to $199,999 | 102 | 9.0% |
| $200,000+ | 56 | 5.0% |
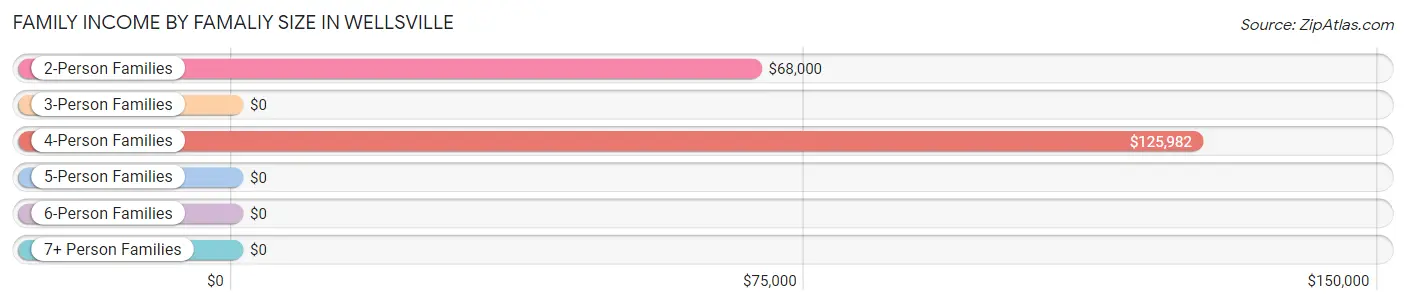
Family Income by Famaliy Size in Wellsville
4-person families (234 | 20.7%) account for the highest median family income in Wellsville with $125,982 per family, while 2-person families (692 | 61.3%) have the highest median income of $34,000 per family member.
| Income Bracket | # Families | Median Income |
| 2-Person Families | 692 (61.3%) | $68,000 |
| 3-Person Families | 121 (10.7%) | $0 |
| 4-Person Families | 234 (20.7%) | $125,982 |
| 5-Person Families | 58 (5.1%) | $0 |
| 6-Person Families | 24 (2.1%) | $0 |
| 7+ Person Families | 0 (0.0%) | $0 |
| Total | 1,129 (100.0%) | $76,118 |
Family Income by Number of Earners in Wellsville
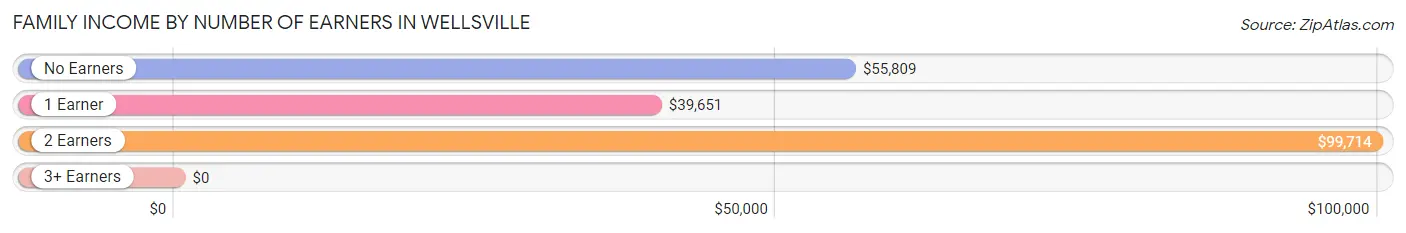
| Number of Earners | # Families | Median Income |
| No Earners | 286 (25.3%) | $55,809 |
| 1 Earner | 350 (31.0%) | $39,651 |
| 2 Earners | 348 (30.8%) | $99,714 |
| 3+ Earners | 145 (12.8%) | $0 |
| Total | 1,129 (100.0%) | $76,118 |
Household Income in Wellsville
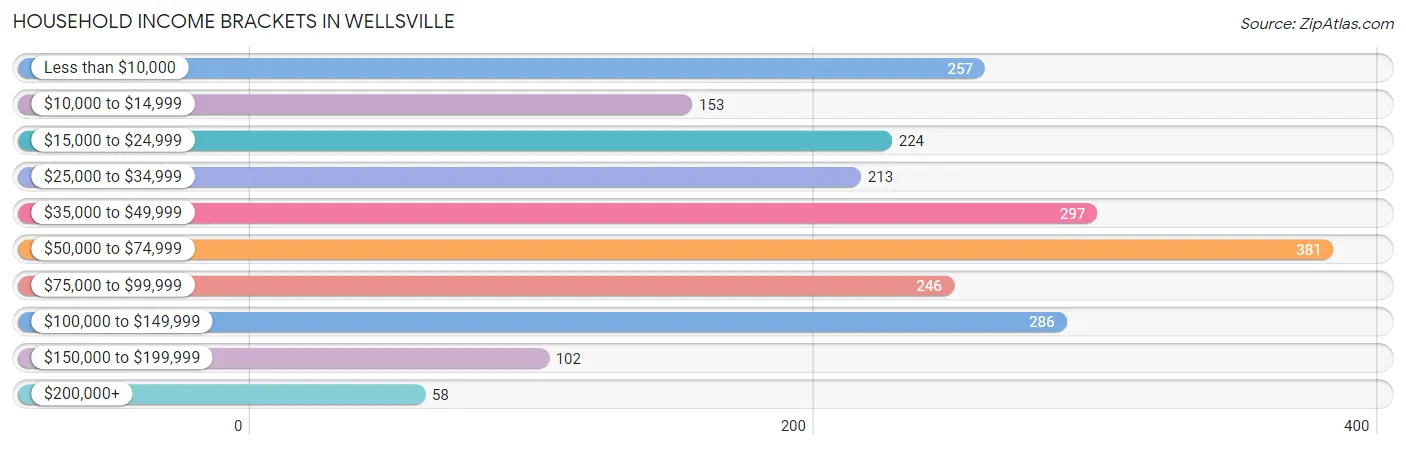
Household Income Brackets in Wellsville
With 381 households falling in the category, the $50,000 to $74,999 income range is the most frequent in Wellsville, accounting for 17.2% of all households. In contrast, only 58 households (2.6%) fall into the $200,000+ income bracket, making it the least populous group.
| Income Bracket | # Households | % Households |
| Less than $10,000 | 257 | 11.6% |
| $10,000 to $14,999 | 153 | 6.9% |
| $15,000 to $24,999 | 224 | 10.1% |
| $25,000 to $34,999 | 213 | 9.6% |
| $35,000 to $49,999 | 297 | 13.4% |
| $50,000 to $74,999 | 381 | 17.2% |
| $75,000 to $99,999 | 246 | 11.1% |
| $100,000 to $149,999 | 286 | 12.9% |
| $150,000 to $199,999 | 102 | 4.6% |
| $200,000+ | 58 | 2.6% |
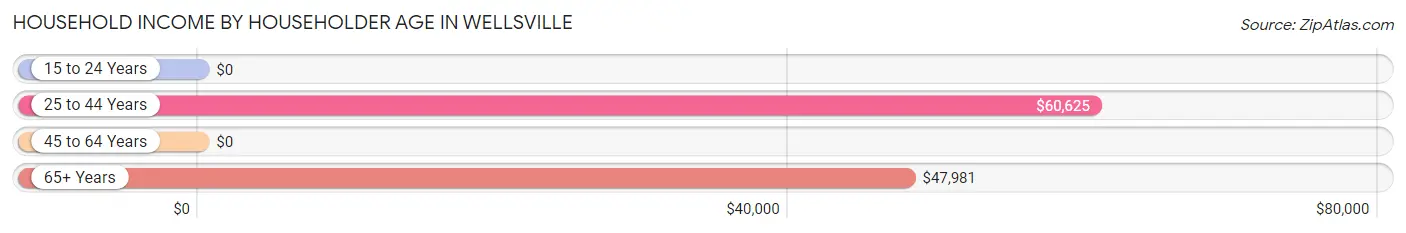
Household Income by Householder Age in Wellsville
The median household income in Wellsville is $48,784, with the highest median household income of $60,625 found in the 25 to 44 years age bracket for the primary householder. A total of 561 households (25.3%) fall into this category. Meanwhile, the 15 to 24 years age bracket for the primary householder has the lowest median household income of $0, with 125 households (5.6%) in this group.
| Income Bracket | # Households | Median Income |
| 15 to 24 Years | 125 (5.6%) | $0 |
| 25 to 44 Years | 561 (25.3%) | $60,625 |
| 45 to 64 Years | 828 (37.3%) | $0 |
| 65+ Years | 703 (31.7%) | $47,981 |
| Total | 2,217 (100.0%) | $48,784 |
Poverty in Wellsville
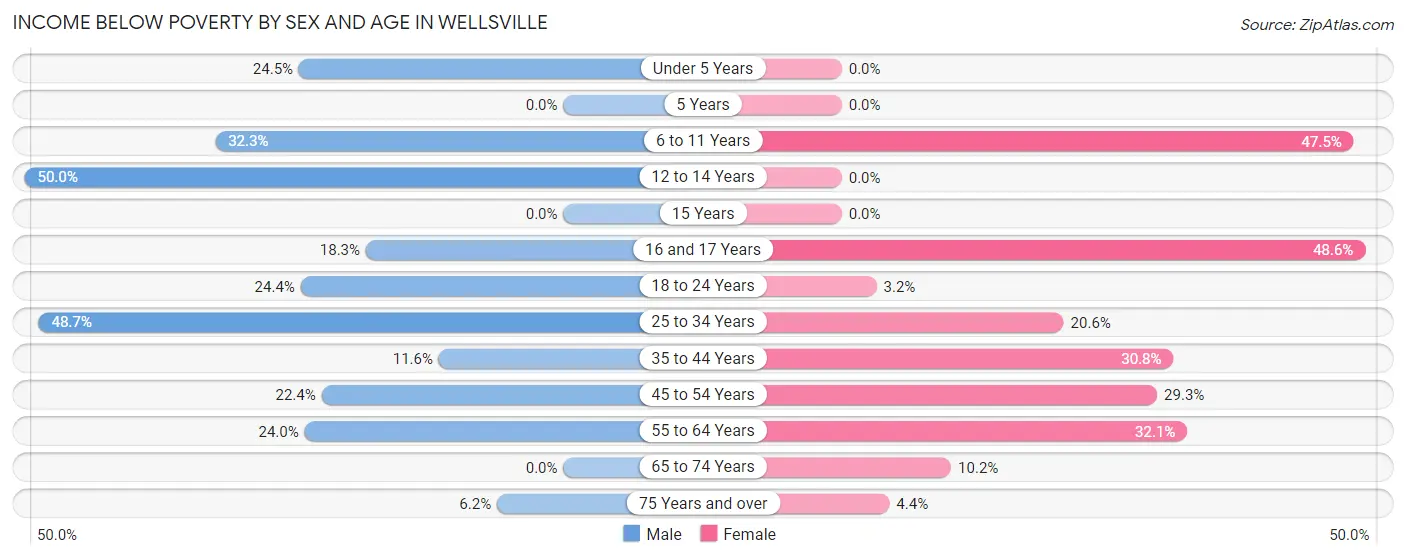
Income Below Poverty by Sex and Age in Wellsville
With 21.9% poverty level for males and 20.2% for females among the residents of Wellsville, 12 to 14 year old males and 16 and 17 year old females are the most vulnerable to poverty, with 26 males (50.0%) and 17 females (48.6%) in their respective age groups living below the poverty level.
| Age Bracket | Male | Female |
| Under 5 Years | 40 (24.5%) | 0 (0.0%) |
| 5 Years | 0 (0.0%) | 0 (0.0%) |
| 6 to 11 Years | 63 (32.3%) | 57 (47.5%) |
| 12 to 14 Years | 26 (50.0%) | 0 (0.0%) |
| 15 Years | 0 (0.0%) | 0 (0.0%) |
| 16 and 17 Years | 11 (18.3%) | 17 (48.6%) |
| 18 to 24 Years | 99 (24.4%) | 6 (3.2%) |
| 25 to 34 Years | 131 (48.7%) | 28 (20.6%) |
| 35 to 44 Years | 37 (11.6%) | 92 (30.8%) |
| 45 to 54 Years | 68 (22.4%) | 60 (29.3%) |
| 55 to 64 Years | 80 (24.0%) | 142 (32.1%) |
| 65 to 74 Years | 0 (0.0%) | 41 (10.2%) |
| 75 Years and over | 9 (6.2%) | 10 (4.4%) |
| Total | 564 (21.9%) | 453 (20.2%) |
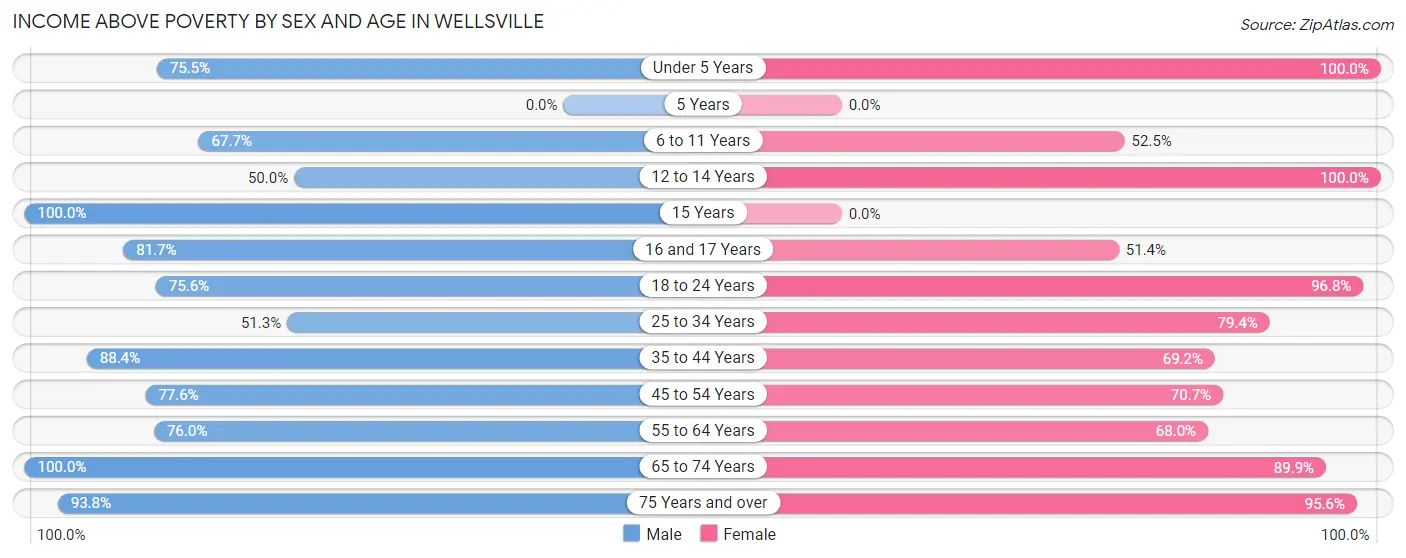
Income Above Poverty by Sex and Age in Wellsville
According to the poverty statistics in Wellsville, males aged 15 years and females aged under 5 years are the age groups that are most secure financially, with 100.0% of males and 100.0% of females in these age groups living above the poverty line.
| Age Bracket | Male | Female |
| Under 5 Years | 123 (75.5%) | 91 (100.0%) |
| 5 Years | 0 (0.0%) | 0 (0.0%) |
| 6 to 11 Years | 132 (67.7%) | 63 (52.5%) |
| 12 to 14 Years | 26 (50.0%) | 103 (100.0%) |
| 15 Years | 18 (100.0%) | 0 (0.0%) |
| 16 and 17 Years | 49 (81.7%) | 18 (51.4%) |
| 18 to 24 Years | 307 (75.6%) | 180 (96.8%) |
| 25 to 34 Years | 138 (51.3%) | 108 (79.4%) |
| 35 to 44 Years | 283 (88.4%) | 207 (69.2%) |
| 45 to 54 Years | 235 (77.6%) | 145 (70.7%) |
| 55 to 64 Years | 253 (76.0%) | 301 (67.9%) |
| 65 to 74 Years | 313 (100.0%) | 363 (89.8%) |
| 75 Years and over | 137 (93.8%) | 216 (95.6%) |
| Total | 2,014 (78.1%) | 1,795 (79.8%) |
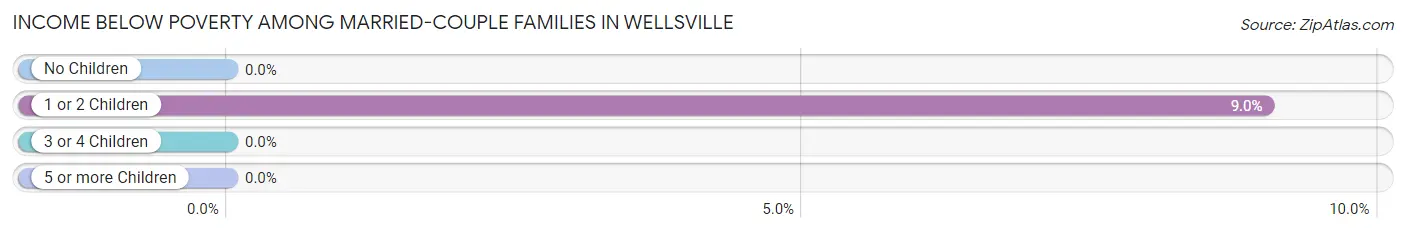
Income Below Poverty Among Married-Couple Families in Wellsville
The poverty statistics for married-couple families in Wellsville show that 2.7% or 24 of the total 889 families live below the poverty line. Families with 1 or 2 children have the highest poverty rate of 9.0%, comprising of 24 families. On the other hand, families with no children have the lowest poverty rate of 0.0%, which includes 0 families.
| Children | Above Poverty | Below Poverty |
| No Children | 598 (100.0%) | 0 (0.0%) |
| 1 or 2 Children | 242 (91.0%) | 24 (9.0%) |
| 3 or 4 Children | 25 (100.0%) | 0 (0.0%) |
| 5 or more Children | 0 (0.0%) | 0 (0.0%) |
| Total | 865 (97.3%) | 24 (2.7%) |
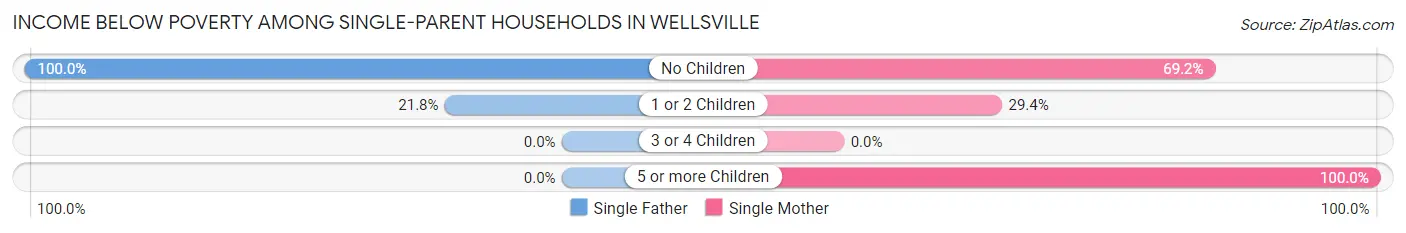
Income Below Poverty Among Single-Parent Households in Wellsville
According to the poverty data in Wellsville, 21.2% or 14 single-father households and 54.0% or 94 single-mother households are living below the poverty line. Among single-father households, those with no children have the highest poverty rate, with 2 households (100.0%) experiencing poverty. Likewise, among single-mother households, those with 5 or more children have the highest poverty rate, with 24 households (100.0%) falling below the poverty line.
| Children | Single Father | Single Mother |
| No Children | 2 (100.0%) | 45 (69.2%) |
| 1 or 2 Children | 12 (21.8%) | 25 (29.4%) |
| 3 or 4 Children | 0 (0.0%) | 0 (0.0%) |
| 5 or more Children | 0 (0.0%) | 24 (100.0%) |
| Total | 14 (21.2%) | 94 (54.0%) |
Income Below Poverty Among Married-Couple vs Single-Parent Households in Wellsville
The poverty data for Wellsville shows that 24 of the married-couple family households (2.7%) and 108 of the single-parent households (45.0%) are living below the poverty level. Within the married-couple family households, those with 1 or 2 children have the highest poverty rate, with 24 households (9.0%) falling below the poverty line. Among the single-parent households, those with 5 or more children have the highest poverty rate, with 24 household (100.0%) living below poverty.
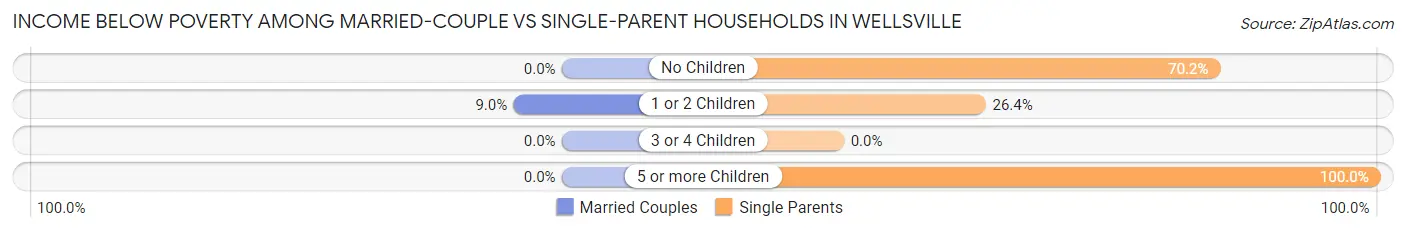
| Children | Married-Couple Families | Single-Parent Households |
| No Children | 0 (0.0%) | 47 (70.2%) |
| 1 or 2 Children | 24 (9.0%) | 37 (26.4%) |
| 3 or 4 Children | 0 (0.0%) | 0 (0.0%) |
| 5 or more Children | 0 (0.0%) | 24 (100.0%) |
| Total | 24 (2.7%) | 108 (45.0%) |
Employment Characteristics in Wellsville
Employment by Class of Employer in Wellsville
Among the 1,930 employed individuals in Wellsville, private company employees (1,090 | 56.5%), local government employees (378 | 19.6%), and not-for-profit organizations (177 | 9.2%) make up the most common classes of employment.
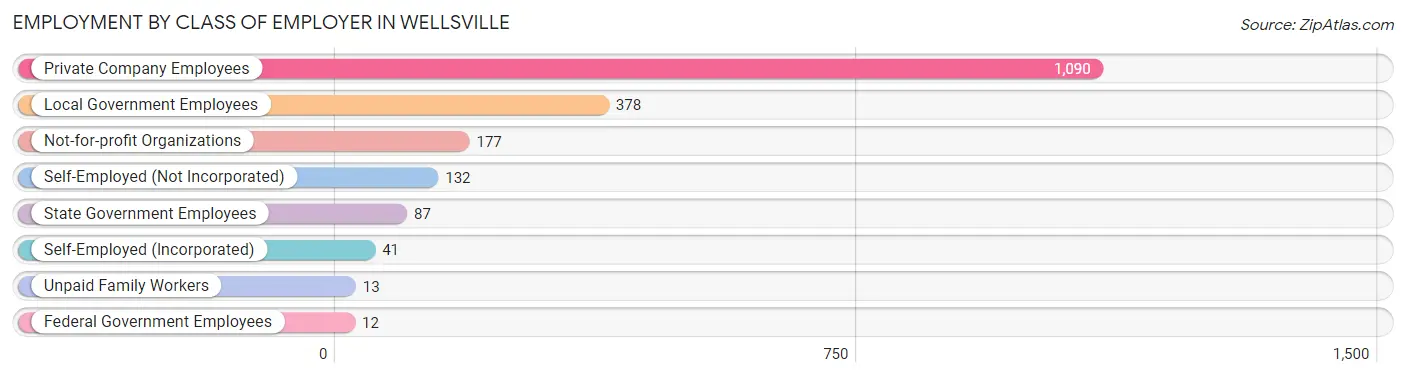
| Employer Class | # Employees | % Employees |
| Private Company Employees | 1,090 | 56.5% |
| Self-Employed (Incorporated) | 41 | 2.1% |
| Self-Employed (Not Incorporated) | 132 | 6.8% |
| Not-for-profit Organizations | 177 | 9.2% |
| Local Government Employees | 378 | 19.6% |
| State Government Employees | 87 | 4.5% |
| Federal Government Employees | 12 | 0.6% |
| Unpaid Family Workers | 13 | 0.7% |
| Total | 1,930 | 100.0% |
Employment Status by Age in Wellsville
According to the labor force statistics for Wellsville, out of the total population over 16 years of age (4,129), 49.3% or 2,036 individuals are in the labor force, with 5.2% or 106 of them unemployed. The age group with the highest labor force participation rate is 30 to 34 years, with 84.5% or 142 individuals in the labor force. Within the labor force, the 16 to 19 years age range has the highest percentage of unemployed individuals, with 15.5% or 26 of them being unemployed.
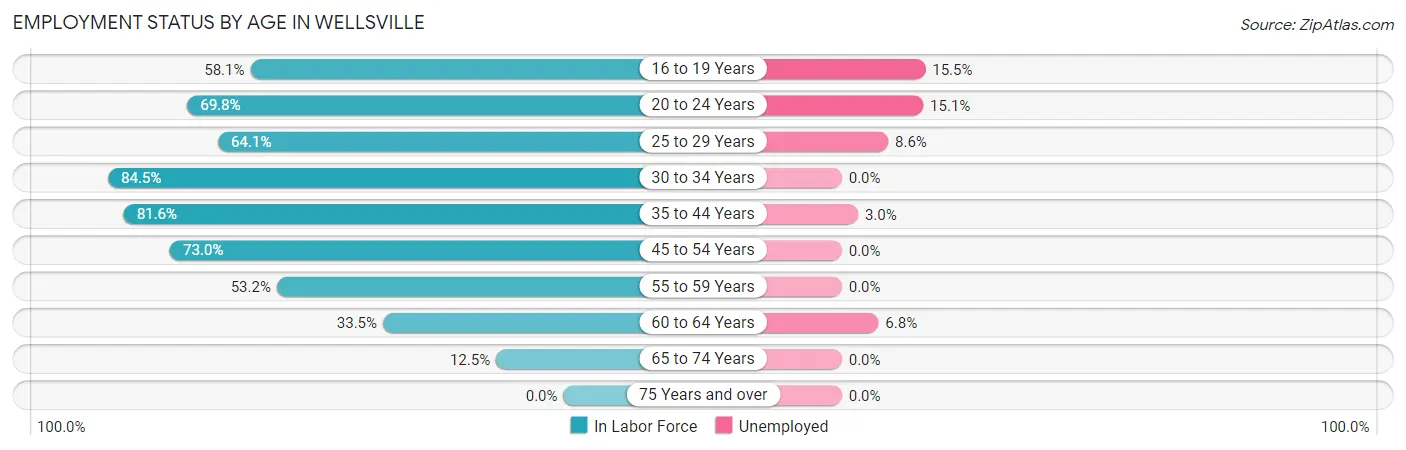
| Age Bracket | In Labor Force | Unemployed |
| 16 to 19 Years | 168 (58.1%) | 26 (15.5%) |
| 20 to 24 Years | 278 (69.8%) | 42 (15.1%) |
| 25 to 29 Years | 152 (64.1%) | 13 (8.6%) |
| 30 to 34 Years | 142 (84.5%) | 0 (0.0%) |
| 35 to 44 Years | 505 (81.6%) | 15 (3.0%) |
| 45 to 54 Years | 374 (73.0%) | 0 (0.0%) |
| 55 to 59 Years | 181 (53.2%) | 0 (0.0%) |
| 60 to 64 Years | 146 (33.5%) | 10 (6.8%) |
| 65 to 74 Years | 90 (12.5%) | 0 (0.0%) |
| 75 Years and over | 0 (0.0%) | 0 (0.0%) |
| Total | 2,036 (49.3%) | 106 (5.2%) |
Employment Status by Educational Attainment in Wellsville
According to labor force statistics for Wellsville, 64.9% of individuals (1,500) out of the total population between 25 and 64 years of age (2,312) are in the labor force, with 2.5% or 38 of them being unemployed. The group with the highest labor force participation rate are those with the educational attainment of bachelor's degree or higher, with 87.1% or 452 individuals in the labor force. Within the labor force, individuals with high school diploma education have the highest percentage of unemployment, with 8.2% or 28 of them being unemployed.
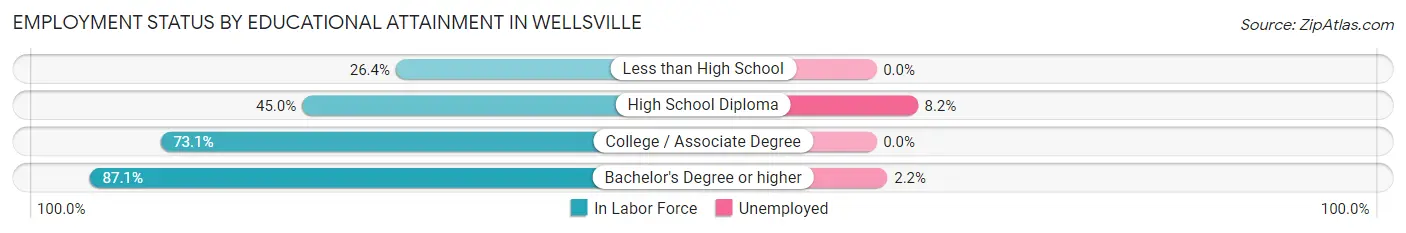
| Educational Attainment | In Labor Force | Unemployed |
| Less than High School | 28 (26.4%) | 0 (0.0%) |
| High School Diploma | 342 (45.0%) | 62 (8.2%) |
| College / Associate Degree | 678 (73.1%) | 0 (0.0%) |
| Bachelor's Degree or higher | 452 (87.1%) | 11 (2.2%) |
| Total | 1,500 (64.9%) | 58 (2.5%) |
Employment Occupations by Sex in Wellsville
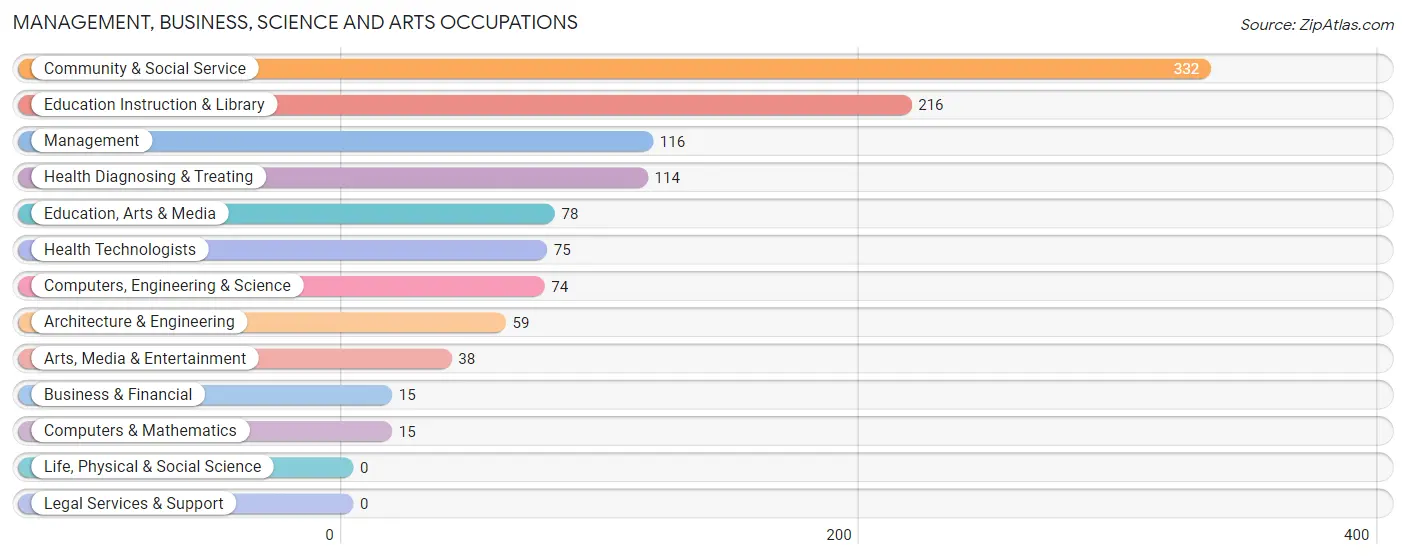
Management, Business, Science and Arts Occupations
The most common Management, Business, Science and Arts occupations in Wellsville are Community & Social Service (332 | 17.2%), Education Instruction & Library (216 | 11.2%), Management (116 | 6.0%), Health Diagnosing & Treating (114 | 5.9%), and Education, Arts & Media (78 | 4.0%).
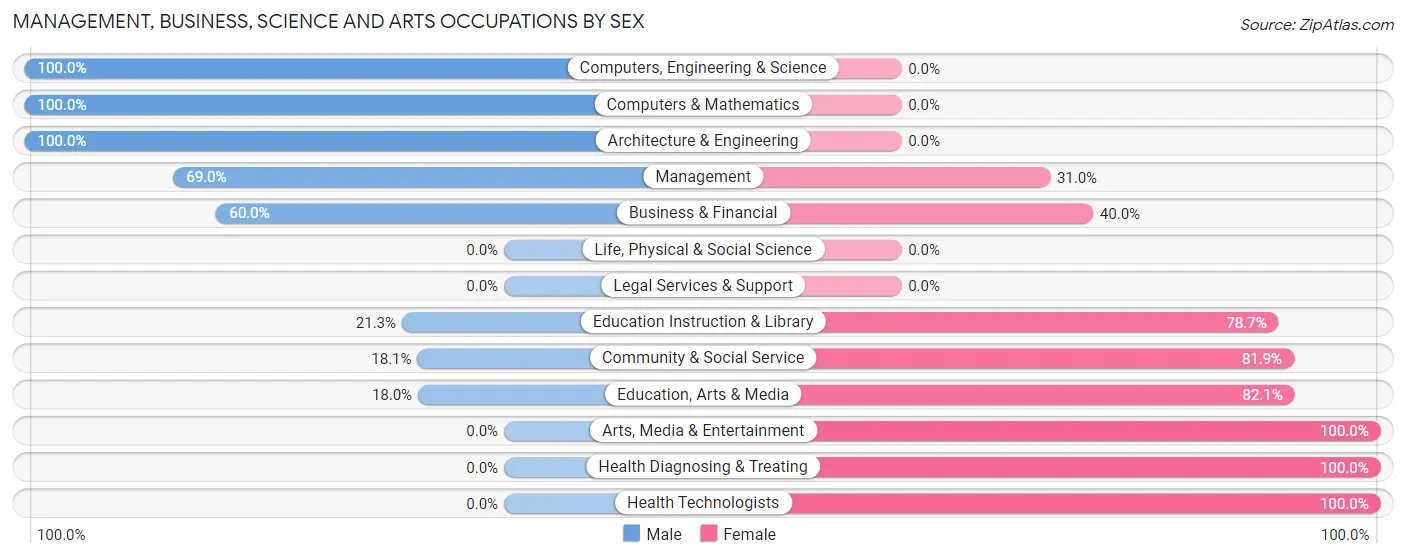
Management, Business, Science and Arts Occupations by Sex
Within the Management, Business, Science and Arts occupations in Wellsville, the most male-oriented occupations are Computers, Engineering & Science (100.0%), Computers & Mathematics (100.0%), and Architecture & Engineering (100.0%), while the most female-oriented occupations are Arts, Media & Entertainment (100.0%), Health Diagnosing & Treating (100.0%), and Health Technologists (100.0%).
| Occupation | Male | Female |
| Management | 80 (69.0%) | 36 (31.0%) |
| Business & Financial | 9 (60.0%) | 6 (40.0%) |
| Computers, Engineering & Science | 74 (100.0%) | 0 (0.0%) |
| Computers & Mathematics | 15 (100.0%) | 0 (0.0%) |
| Architecture & Engineering | 59 (100.0%) | 0 (0.0%) |
| Life, Physical & Social Science | 0 (0.0%) | 0 (0.0%) |
| Community & Social Service | 60 (18.1%) | 272 (81.9%) |
| Education, Arts & Media | 14 (17.9%) | 64 (82.1%) |
| Legal Services & Support | 0 (0.0%) | 0 (0.0%) |
| Education Instruction & Library | 46 (21.3%) | 170 (78.7%) |
| Arts, Media & Entertainment | 0 (0.0%) | 38 (100.0%) |
| Health Diagnosing & Treating | 0 (0.0%) | 114 (100.0%) |
| Health Technologists | 0 (0.0%) | 75 (100.0%) |
| Total (Category) | 223 (34.3%) | 428 (65.7%) |
| Total (Overall) | 1,107 (57.4%) | 823 (42.6%) |
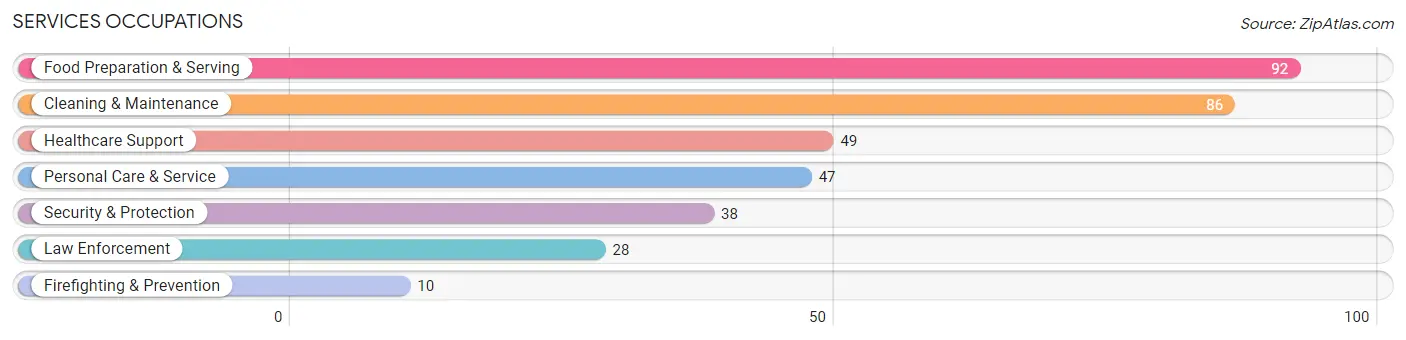
Services Occupations
The most common Services occupations in Wellsville are Food Preparation & Serving (92 | 4.8%), Cleaning & Maintenance (86 | 4.5%), Healthcare Support (49 | 2.5%), Personal Care & Service (47 | 2.4%), and Security & Protection (38 | 2.0%).
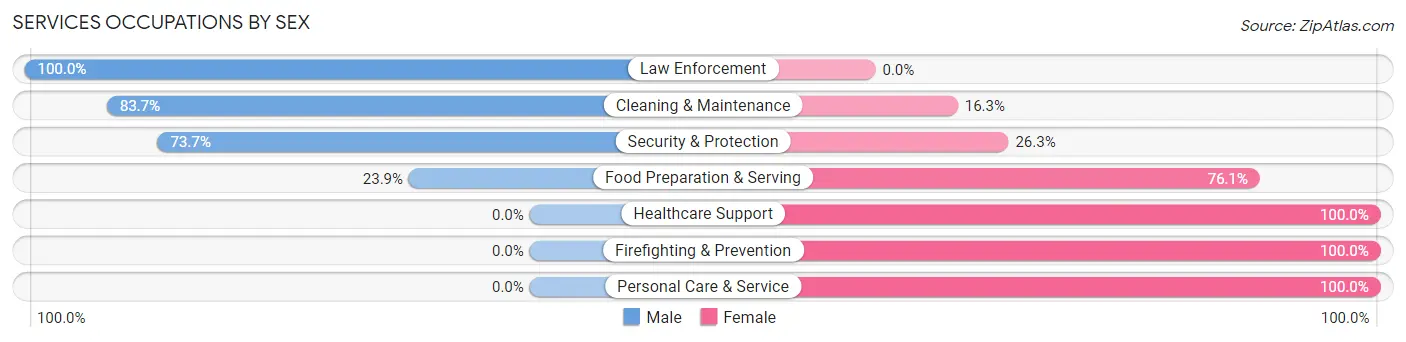
Services Occupations by Sex
Within the Services occupations in Wellsville, the most male-oriented occupations are Law Enforcement (100.0%), Cleaning & Maintenance (83.7%), and Security & Protection (73.7%), while the most female-oriented occupations are Healthcare Support (100.0%), Firefighting & Prevention (100.0%), and Personal Care & Service (100.0%).
| Occupation | Male | Female |
| Healthcare Support | 0 (0.0%) | 49 (100.0%) |
| Security & Protection | 28 (73.7%) | 10 (26.3%) |
| Firefighting & Prevention | 0 (0.0%) | 10 (100.0%) |
| Law Enforcement | 28 (100.0%) | 0 (0.0%) |
| Food Preparation & Serving | 22 (23.9%) | 70 (76.1%) |
| Cleaning & Maintenance | 72 (83.7%) | 14 (16.3%) |
| Personal Care & Service | 0 (0.0%) | 47 (100.0%) |
| Total (Category) | 122 (39.1%) | 190 (60.9%) |
| Total (Overall) | 1,107 (57.4%) | 823 (42.6%) |
Sales and Office Occupations
The most common Sales and Office occupations in Wellsville are Sales & Related (225 | 11.7%), and Office & Administration (202 | 10.5%).
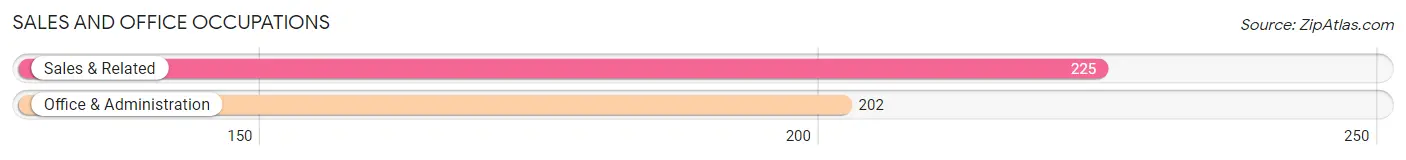
Sales and Office Occupations by Sex

| Occupation | Male | Female |
| Sales & Related | 173 (76.9%) | 52 (23.1%) |
| Office & Administration | 77 (38.1%) | 125 (61.9%) |
| Total (Category) | 250 (58.6%) | 177 (41.4%) |
| Total (Overall) | 1,107 (57.4%) | 823 (42.6%) |
Natural Resources, Construction and Maintenance Occupations
The most common Natural Resources, Construction and Maintenance occupations in Wellsville are Construction & Extraction (113 | 5.9%), and Installation, Maintenance & Repair (74 | 3.8%).
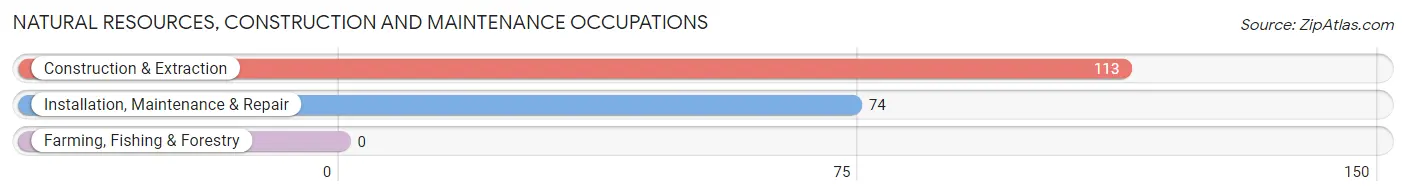
Natural Resources, Construction and Maintenance Occupations by Sex
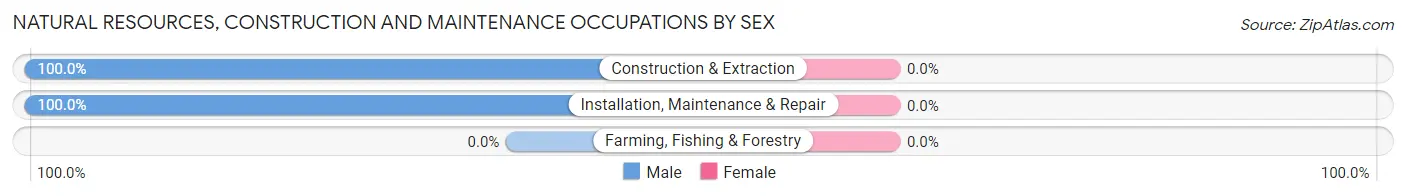
| Occupation | Male | Female |
| Farming, Fishing & Forestry | 0 (0.0%) | 0 (0.0%) |
| Construction & Extraction | 113 (100.0%) | 0 (0.0%) |
| Installation, Maintenance & Repair | 74 (100.0%) | 0 (0.0%) |
| Total (Category) | 187 (100.0%) | 0 (0.0%) |
| Total (Overall) | 1,107 (57.4%) | 823 (42.6%) |
Production, Transportation and Moving Occupations
The most common Production, Transportation and Moving occupations in Wellsville are Material Moving (212 | 11.0%), Transportation (76 | 3.9%), and Production (65 | 3.4%).
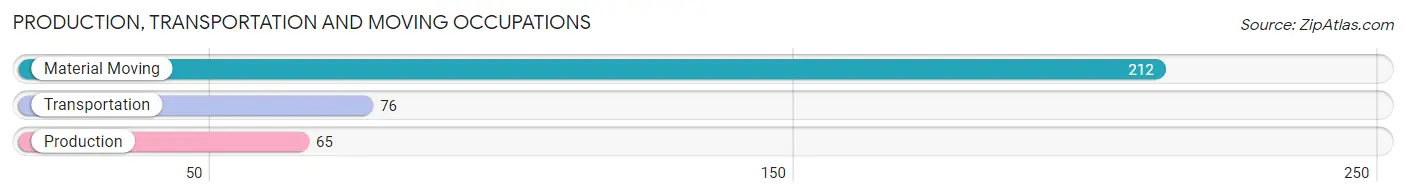
Production, Transportation and Moving Occupations by Sex
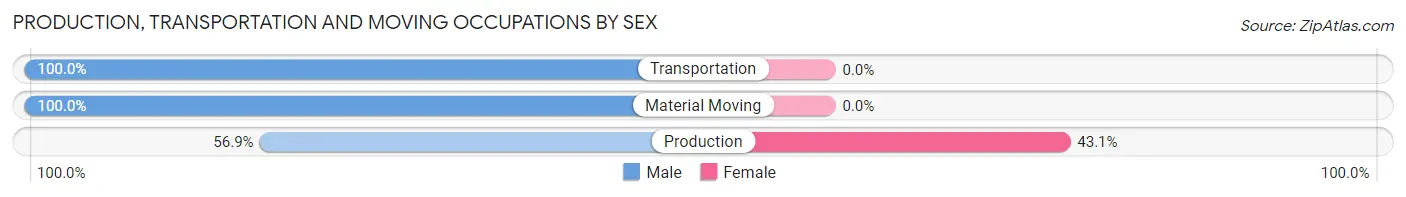
| Occupation | Male | Female |
| Production | 37 (56.9%) | 28 (43.1%) |
| Transportation | 76 (100.0%) | 0 (0.0%) |
| Material Moving | 212 (100.0%) | 0 (0.0%) |
| Total (Category) | 325 (92.1%) | 28 (7.9%) |
| Total (Overall) | 1,107 (57.4%) | 823 (42.6%) |
Employment Industries by Sex in Wellsville
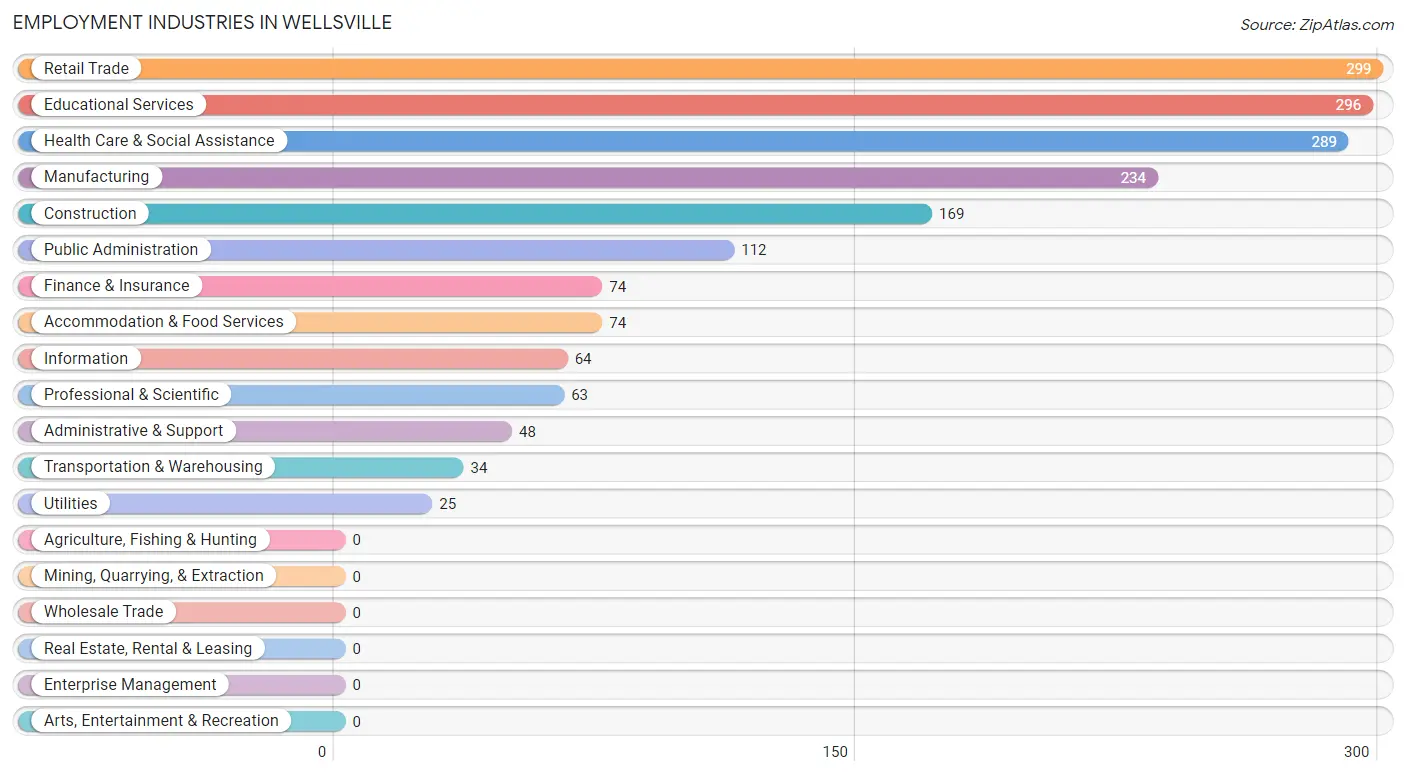
Employment Industries in Wellsville
The major employment industries in Wellsville include Retail Trade (299 | 15.5%), Educational Services (296 | 15.3%), Health Care & Social Assistance (289 | 15.0%), Manufacturing (234 | 12.1%), and Construction (169 | 8.8%).
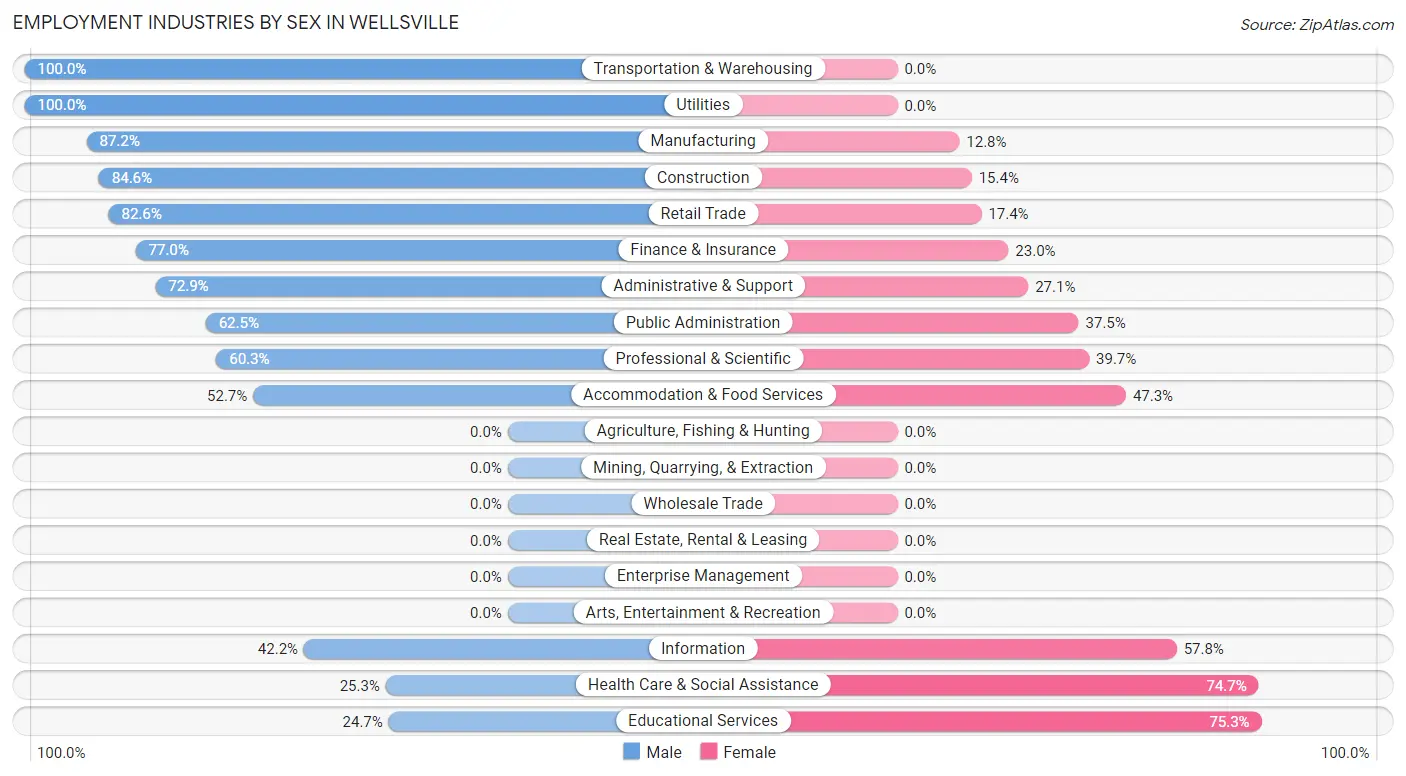
Employment Industries by Sex in Wellsville
The Wellsville industries that see more men than women are Transportation & Warehousing (100.0%), Utilities (100.0%), and Manufacturing (87.2%), whereas the industries that tend to have a higher number of women are Educational Services (75.3%), Health Care & Social Assistance (74.7%), and Information (57.8%).
| Industry | Male | Female |
| Agriculture, Fishing & Hunting | 0 (0.0%) | 0 (0.0%) |
| Mining, Quarrying, & Extraction | 0 (0.0%) | 0 (0.0%) |
| Construction | 143 (84.6%) | 26 (15.4%) |
| Manufacturing | 204 (87.2%) | 30 (12.8%) |
| Wholesale Trade | 0 (0.0%) | 0 (0.0%) |
| Retail Trade | 247 (82.6%) | 52 (17.4%) |
| Transportation & Warehousing | 34 (100.0%) | 0 (0.0%) |
| Utilities | 25 (100.0%) | 0 (0.0%) |
| Information | 27 (42.2%) | 37 (57.8%) |
| Finance & Insurance | 57 (77.0%) | 17 (23.0%) |
| Real Estate, Rental & Leasing | 0 (0.0%) | 0 (0.0%) |
| Professional & Scientific | 38 (60.3%) | 25 (39.7%) |
| Enterprise Management | 0 (0.0%) | 0 (0.0%) |
| Administrative & Support | 35 (72.9%) | 13 (27.1%) |
| Educational Services | 73 (24.7%) | 223 (75.3%) |
| Health Care & Social Assistance | 73 (25.3%) | 216 (74.7%) |
| Arts, Entertainment & Recreation | 0 (0.0%) | 0 (0.0%) |
| Accommodation & Food Services | 39 (52.7%) | 35 (47.3%) |
| Public Administration | 70 (62.5%) | 42 (37.5%) |
| Total | 1,107 (57.4%) | 823 (42.6%) |
Education in Wellsville
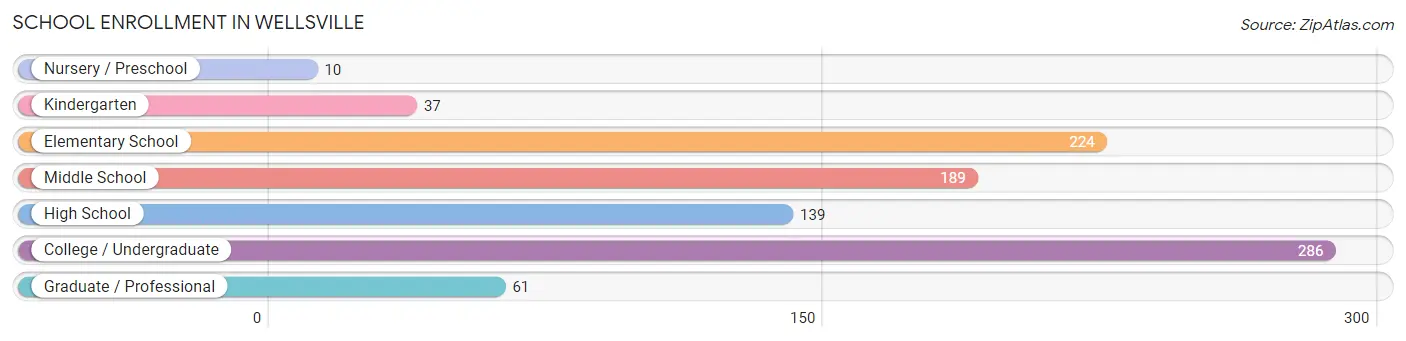
School Enrollment in Wellsville
The most common levels of schooling among the 946 students in Wellsville are college / undergraduate (286 | 30.2%), elementary school (224 | 23.7%), and middle school (189 | 20.0%).
| School Level | # Students | % Students |
| Nursery / Preschool | 10 | 1.1% |
| Kindergarten | 37 | 3.9% |
| Elementary School | 224 | 23.7% |
| Middle School | 189 | 20.0% |
| High School | 139 | 14.7% |
| College / Undergraduate | 286 | 30.2% |
| Graduate / Professional | 61 | 6.5% |
| Total | 946 | 100.0% |
School Enrollment by Age by Funding Source in Wellsville
Out of a total of 946 students who are enrolled in schools in Wellsville, 260 (27.5%) attend a private institution, while the remaining 686 (72.5%) are enrolled in public schools. The age group of 20 to 24 year olds has the highest likelihood of being enrolled in private schools, with 99 (87.6% in the age bracket) enrolled. Conversely, the age group of 3 to 4 year olds has the lowest likelihood of being enrolled in a private school, with 10 (100.0% in the age bracket) attending a public institution.
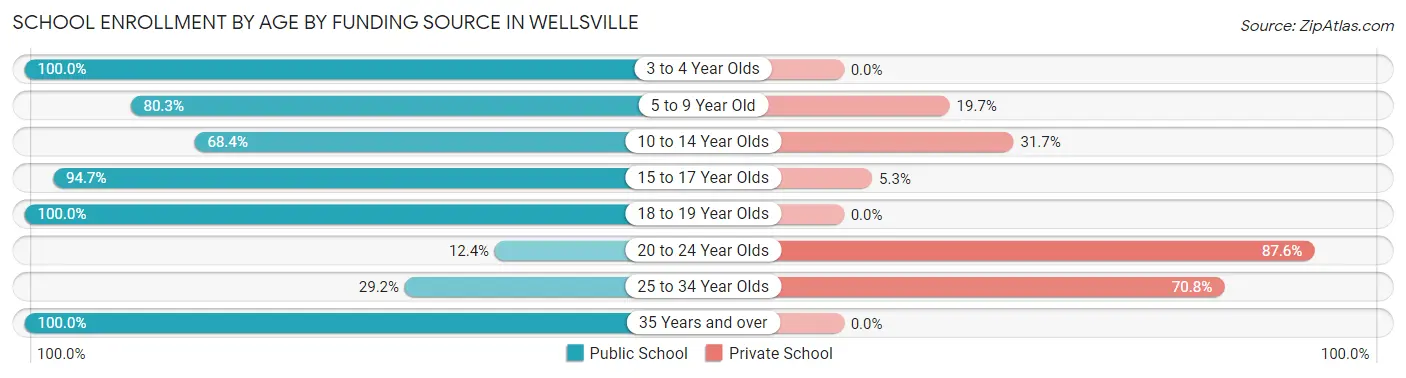
| Age Bracket | Public School | Private School |
| 3 to 4 Year Olds | 10 (100.0%) | 0 (0.0%) |
| 5 to 9 Year Old | 187 (80.3%) | 46 (19.7%) |
| 10 to 14 Year Olds | 162 (68.3%) | 75 (31.7%) |
| 15 to 17 Year Olds | 107 (94.7%) | 6 (5.3%) |
| 18 to 19 Year Olds | 162 (100.0%) | 0 (0.0%) |
| 20 to 24 Year Olds | 14 (12.4%) | 99 (87.6%) |
| 25 to 34 Year Olds | 14 (29.2%) | 34 (70.8%) |
| 35 Years and over | 30 (100.0%) | 0 (0.0%) |
| Total | 686 (72.5%) | 260 (27.5%) |
Educational Attainment by Field of Study in Wellsville
Education (330 | 33.1%), business (220 | 22.1%), literature & languages (82 | 8.2%), liberal arts & history (76 | 7.6%), and engineering (64 | 6.4%) are the most common fields of study among 997 individuals in Wellsville who have obtained a bachelor's degree or higher.
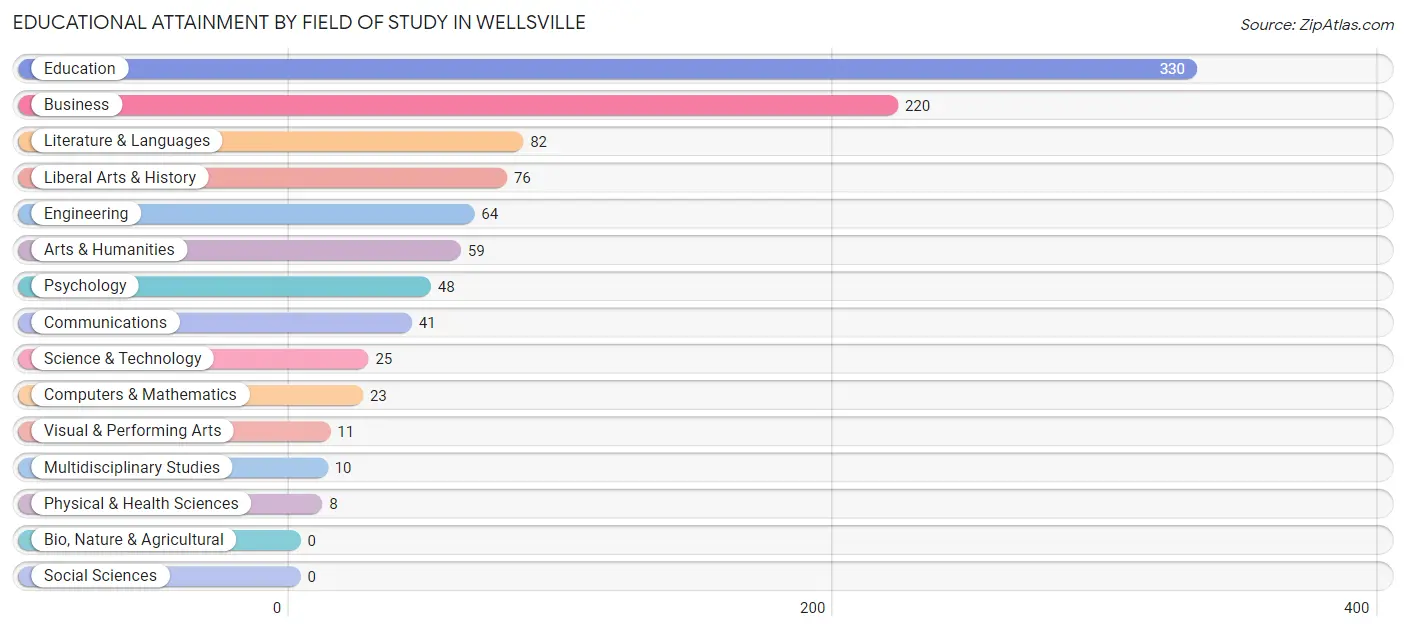
| Field of Study | # Graduates | % Graduates |
| Computers & Mathematics | 23 | 2.3% |
| Bio, Nature & Agricultural | 0 | 0.0% |
| Physical & Health Sciences | 8 | 0.8% |
| Psychology | 48 | 4.8% |
| Social Sciences | 0 | 0.0% |
| Engineering | 64 | 6.4% |
| Multidisciplinary Studies | 10 | 1.0% |
| Science & Technology | 25 | 2.5% |
| Business | 220 | 22.1% |
| Education | 330 | 33.1% |
| Literature & Languages | 82 | 8.2% |
| Liberal Arts & History | 76 | 7.6% |
| Visual & Performing Arts | 11 | 1.1% |
| Communications | 41 | 4.1% |
| Arts & Humanities | 59 | 5.9% |
| Total | 997 | 100.0% |
Transportation & Commute in Wellsville
Vehicle Availability by Sex in Wellsville
The most prevalent vehicle ownership categories in Wellsville are males with 2 vehicles (609, accounting for 55.0%) and females with 2 vehicles (450, making up 74.0%).
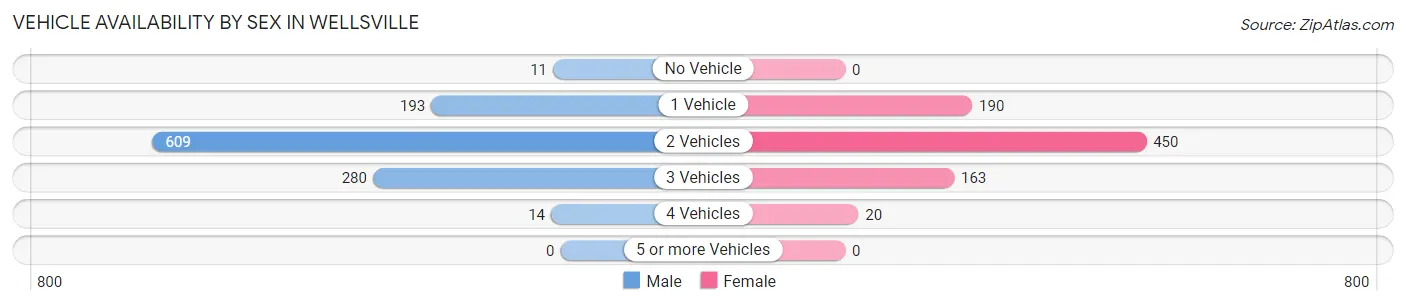
| Vehicles Available | Male | Female |
| No Vehicle | 11 (1.0%) | 0 (0.0%) |
| 1 Vehicle | 193 (17.4%) | 190 (23.1%) |
| 2 Vehicles | 609 (55.0%) | 450 (54.7%) |
| 3 Vehicles | 280 (25.3%) | 163 (19.8%) |
| 4 Vehicles | 14 (1.3%) | 20 (2.4%) |
| 5 or more Vehicles | 0 (0.0%) | 0 (0.0%) |
| Total | 1,107 (100.0%) | 823 (100.0%) |
Commute Time in Wellsville
The most frequently occuring commute durations in Wellsville are 5 to 9 minutes (943 commuters, 50.8%), 10 to 14 minutes (296 commuters, 15.9%), and less than 5 minutes (135 commuters, 7.3%).
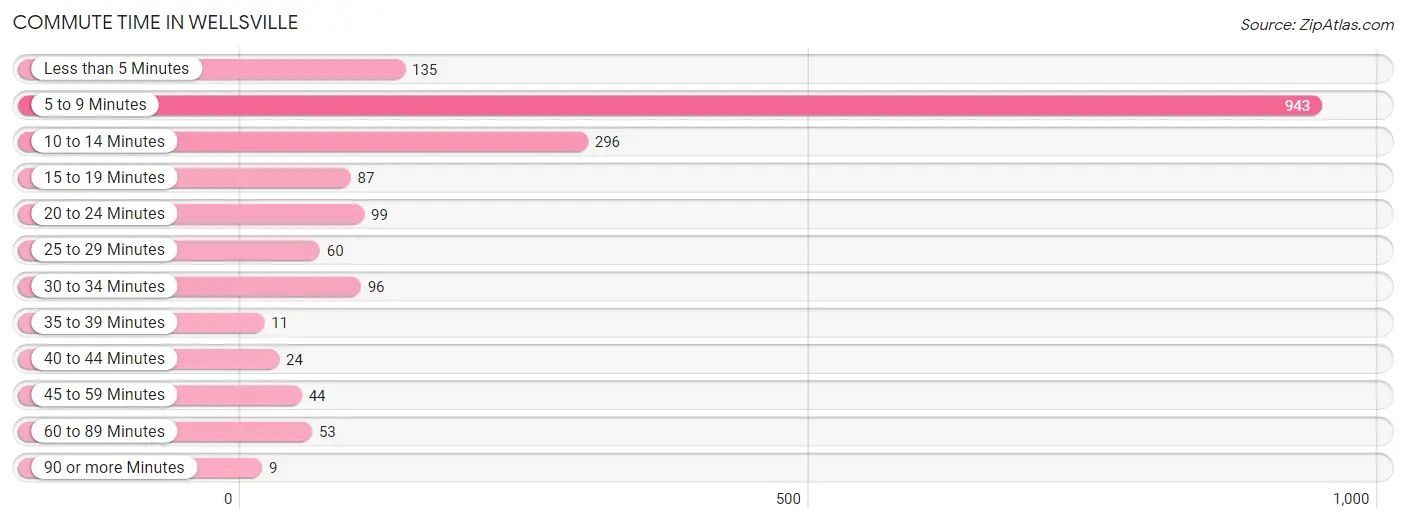
| Commute Time | # Commuters | % Commuters |
| Less than 5 Minutes | 135 | 7.3% |
| 5 to 9 Minutes | 943 | 50.8% |
| 10 to 14 Minutes | 296 | 15.9% |
| 15 to 19 Minutes | 87 | 4.7% |
| 20 to 24 Minutes | 99 | 5.3% |
| 25 to 29 Minutes | 60 | 3.2% |
| 30 to 34 Minutes | 96 | 5.2% |
| 35 to 39 Minutes | 11 | 0.6% |
| 40 to 44 Minutes | 24 | 1.3% |
| 45 to 59 Minutes | 44 | 2.4% |
| 60 to 89 Minutes | 53 | 2.9% |
| 90 or more Minutes | 9 | 0.5% |
Commute Time by Sex in Wellsville
The most common commute times in Wellsville are 5 to 9 minutes (495 commuters, 45.7%) for males and 5 to 9 minutes (448 commuters, 58.0%) for females.
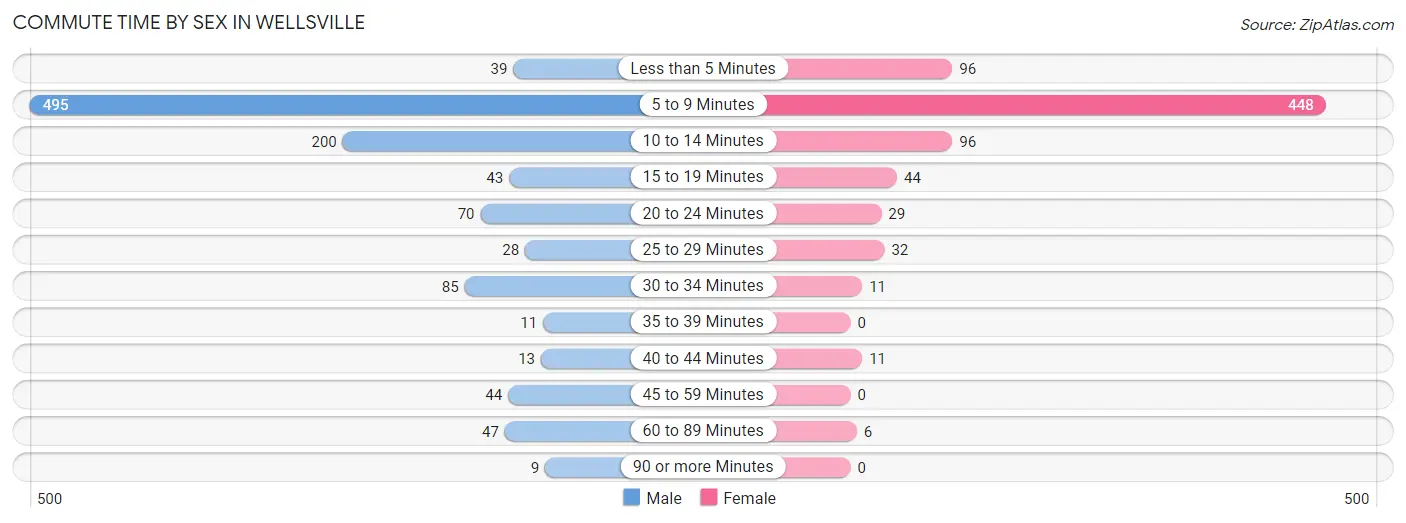
| Commute Time | Male | Female |
| Less than 5 Minutes | 39 (3.6%) | 96 (12.4%) |
| 5 to 9 Minutes | 495 (45.7%) | 448 (58.0%) |
| 10 to 14 Minutes | 200 (18.4%) | 96 (12.4%) |
| 15 to 19 Minutes | 43 (4.0%) | 44 (5.7%) |
| 20 to 24 Minutes | 70 (6.5%) | 29 (3.7%) |
| 25 to 29 Minutes | 28 (2.6%) | 32 (4.1%) |
| 30 to 34 Minutes | 85 (7.8%) | 11 (1.4%) |
| 35 to 39 Minutes | 11 (1.0%) | 0 (0.0%) |
| 40 to 44 Minutes | 13 (1.2%) | 11 (1.4%) |
| 45 to 59 Minutes | 44 (4.1%) | 0 (0.0%) |
| 60 to 89 Minutes | 47 (4.3%) | 6 (0.8%) |
| 90 or more Minutes | 9 (0.8%) | 0 (0.0%) |
Time of Departure to Work by Sex in Wellsville
The most frequent times of departure to work in Wellsville are 6:30 AM to 6:59 AM (380, 35.1%) for males and 8:00 AM to 8:29 AM (224, 29.0%) for females.
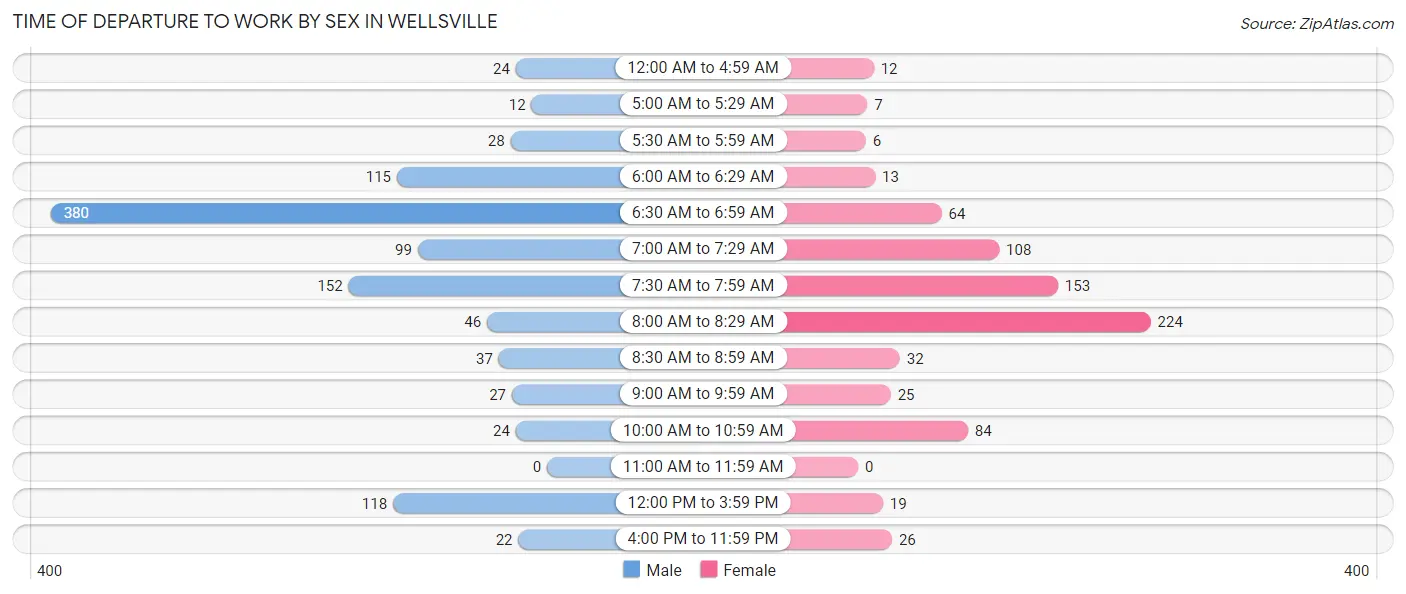
| Time of Departure | Male | Female |
| 12:00 AM to 4:59 AM | 24 (2.2%) | 12 (1.5%) |
| 5:00 AM to 5:29 AM | 12 (1.1%) | 7 (0.9%) |
| 5:30 AM to 5:59 AM | 28 (2.6%) | 6 (0.8%) |
| 6:00 AM to 6:29 AM | 115 (10.6%) | 13 (1.7%) |
| 6:30 AM to 6:59 AM | 380 (35.1%) | 64 (8.3%) |
| 7:00 AM to 7:29 AM | 99 (9.1%) | 108 (14.0%) |
| 7:30 AM to 7:59 AM | 152 (14.0%) | 153 (19.8%) |
| 8:00 AM to 8:29 AM | 46 (4.2%) | 224 (29.0%) |
| 8:30 AM to 8:59 AM | 37 (3.4%) | 32 (4.1%) |
| 9:00 AM to 9:59 AM | 27 (2.5%) | 25 (3.2%) |
| 10:00 AM to 10:59 AM | 24 (2.2%) | 84 (10.9%) |
| 11:00 AM to 11:59 AM | 0 (0.0%) | 0 (0.0%) |
| 12:00 PM to 3:59 PM | 118 (10.9%) | 19 (2.5%) |
| 4:00 PM to 11:59 PM | 22 (2.0%) | 26 (3.4%) |
| Total | 1,084 (100.0%) | 773 (100.0%) |
Housing Occupancy in Wellsville
Occupancy by Ownership in Wellsville
Of the total 2,217 dwellings in Wellsville, owner-occupied units account for 1,398 (63.1%), while renter-occupied units make up 819 (36.9%).
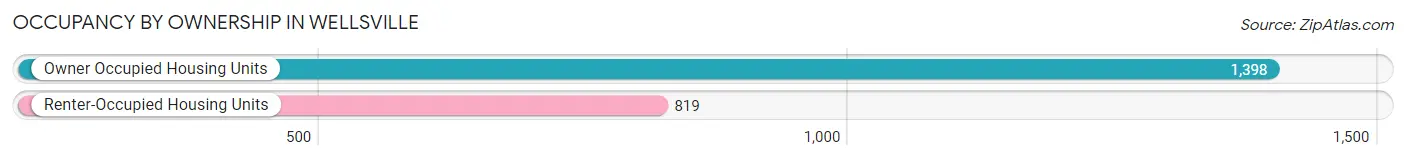
| Occupancy | # Housing Units | % Housing Units |
| Owner Occupied Housing Units | 1,398 | 63.1% |
| Renter-Occupied Housing Units | 819 | 36.9% |
| Total Occupied Housing Units | 2,217 | 100.0% |
Occupancy by Household Size in Wellsville
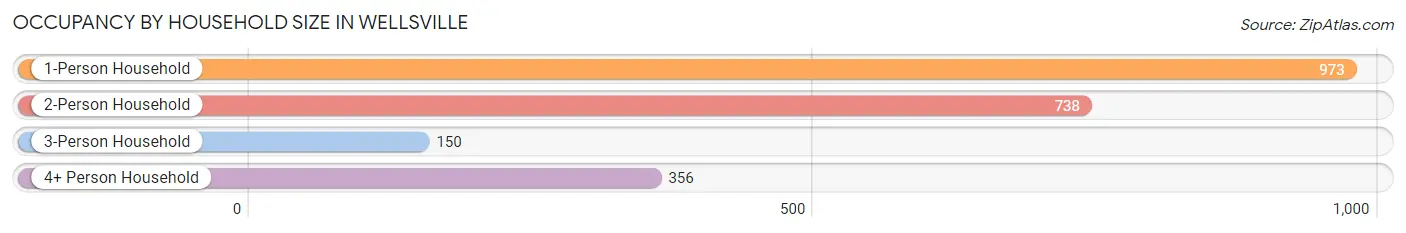
| Household Size | # Housing Units | % Housing Units |
| 1-Person Household | 973 | 43.9% |
| 2-Person Household | 738 | 33.3% |
| 3-Person Household | 150 | 6.8% |
| 4+ Person Household | 356 | 16.1% |
| Total Housing Units | 2,217 | 100.0% |
Occupancy by Ownership by Household Size in Wellsville
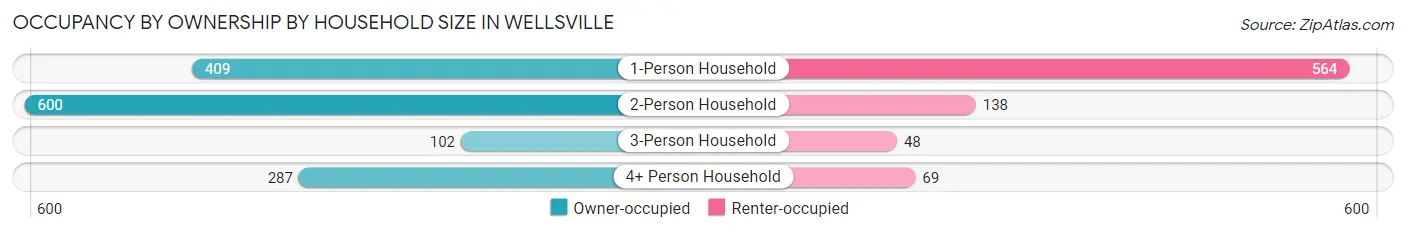
| Household Size | Owner-occupied | Renter-occupied |
| 1-Person Household | 409 (42.0%) | 564 (58.0%) |
| 2-Person Household | 600 (81.3%) | 138 (18.7%) |
| 3-Person Household | 102 (68.0%) | 48 (32.0%) |
| 4+ Person Household | 287 (80.6%) | 69 (19.4%) |
| Total Housing Units | 1,398 (63.1%) | 819 (36.9%) |
Occupancy by Educational Attainment in Wellsville
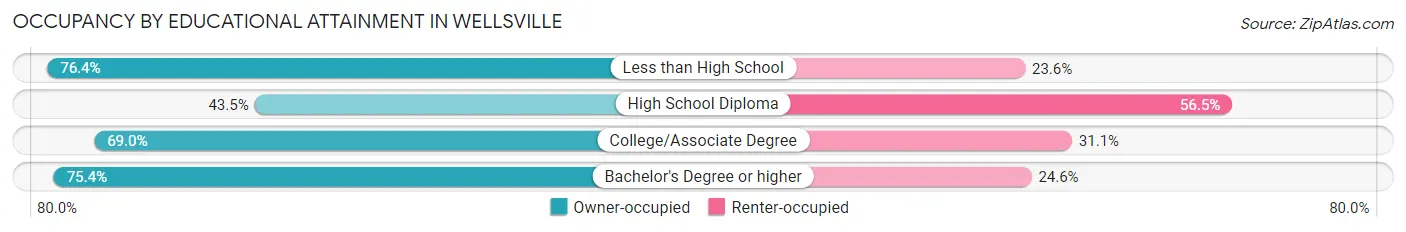
| Household Size | Owner-occupied | Renter-occupied |
| Less than High School | 55 (76.4%) | 17 (23.6%) |
| High School Diploma | 300 (43.5%) | 389 (56.5%) |
| College/Associate Degree | 584 (69.0%) | 263 (31.0%) |
| Bachelor's Degree or higher | 459 (75.4%) | 150 (24.6%) |
Occupancy by Age of Householder in Wellsville
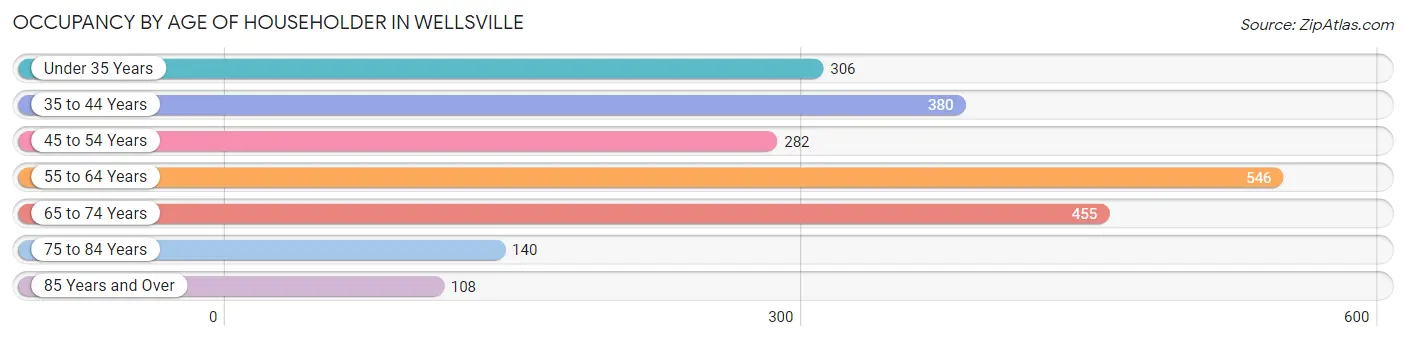
| Age Bracket | # Households | % Households |
| Under 35 Years | 306 | 13.8% |
| 35 to 44 Years | 380 | 17.1% |
| 45 to 54 Years | 282 | 12.7% |
| 55 to 64 Years | 546 | 24.6% |
| 65 to 74 Years | 455 | 20.5% |
| 75 to 84 Years | 140 | 6.3% |
| 85 Years and Over | 108 | 4.9% |
| Total | 2,217 | 100.0% |
Housing Finances in Wellsville
Median Income by Occupancy in Wellsville
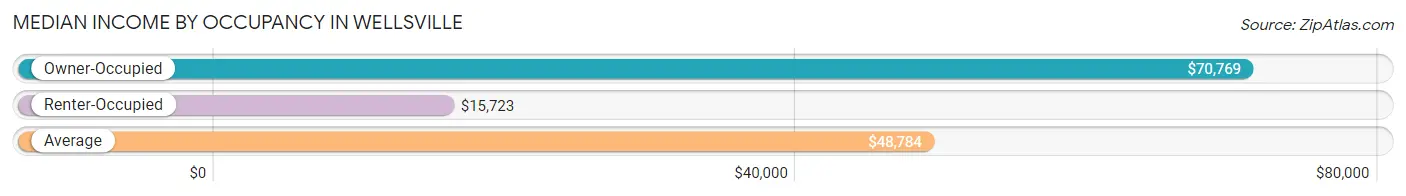
| Occupancy Type | # Households | Median Income |
| Owner-Occupied | 1,398 (63.1%) | $70,769 |
| Renter-Occupied | 819 (36.9%) | $15,723 |
| Average | 2,217 (100.0%) | $48,784 |
Occupancy by Householder Income Bracket in Wellsville
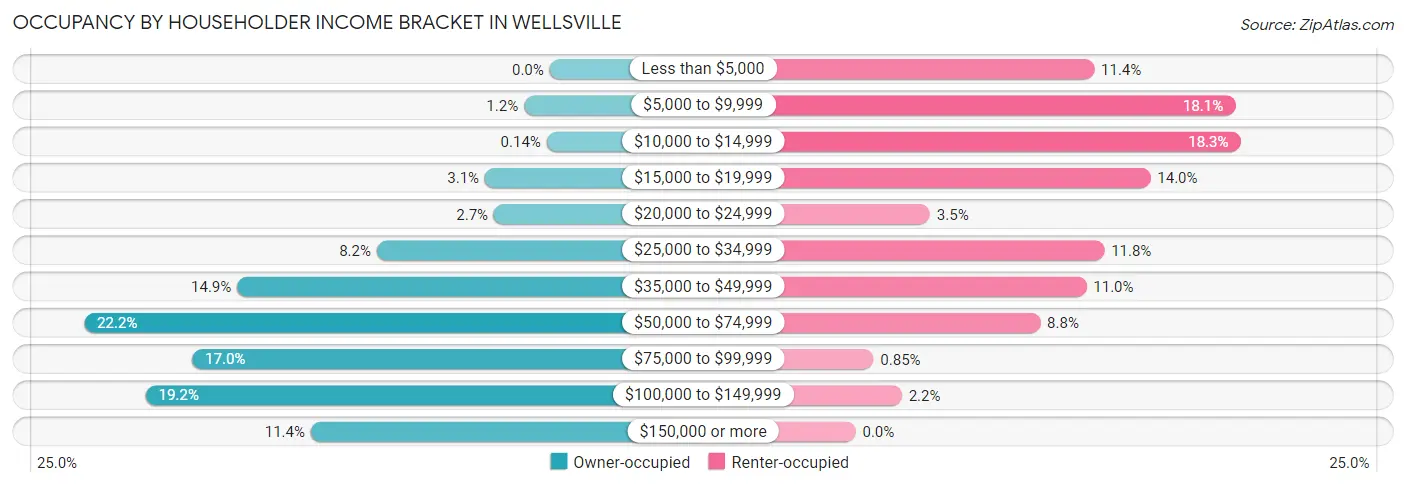
| Income Bracket | Owner-occupied | Renter-occupied |
| Less than $5,000 | 0 (0.0%) | 93 (11.4%) |
| $5,000 to $9,999 | 17 (1.2%) | 148 (18.1%) |
| $10,000 to $14,999 | 2 (0.1%) | 150 (18.3%) |
| $15,000 to $19,999 | 43 (3.1%) | 115 (14.0%) |
| $20,000 to $24,999 | 37 (2.6%) | 29 (3.5%) |
| $25,000 to $34,999 | 115 (8.2%) | 97 (11.8%) |
| $35,000 to $49,999 | 208 (14.9%) | 90 (11.0%) |
| $50,000 to $74,999 | 310 (22.2%) | 72 (8.8%) |
| $75,000 to $99,999 | 238 (17.0%) | 7 (0.9%) |
| $100,000 to $149,999 | 269 (19.2%) | 18 (2.2%) |
| $150,000 or more | 159 (11.4%) | 0 (0.0%) |
| Total | 1,398 (100.0%) | 819 (100.0%) |
Monthly Housing Cost Tiers in Wellsville
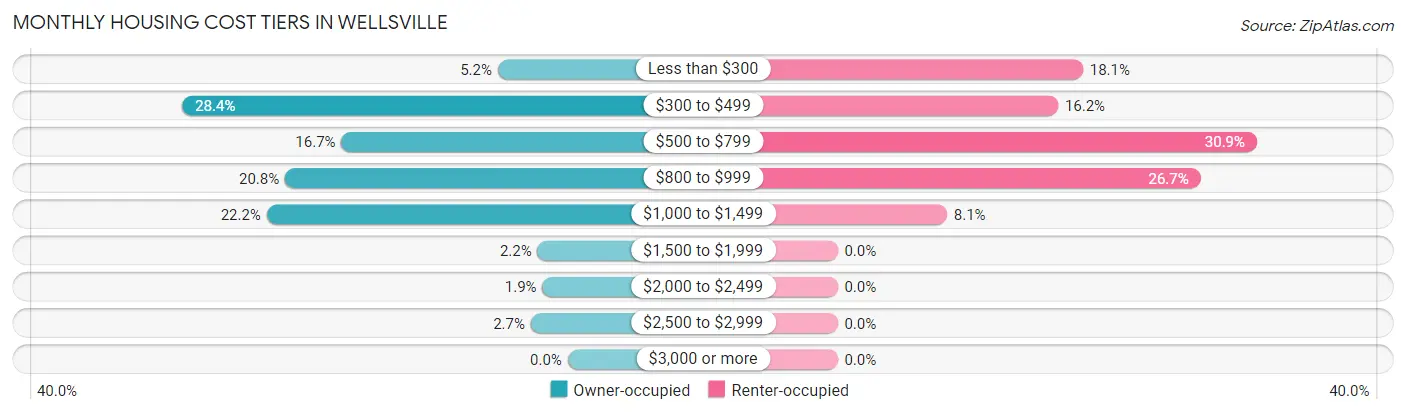
| Monthly Cost | Owner-occupied | Renter-occupied |
| Less than $300 | 72 (5.1%) | 148 (18.1%) |
| $300 to $499 | 397 (28.4%) | 133 (16.2%) |
| $500 to $799 | 233 (16.7%) | 253 (30.9%) |
| $800 to $999 | 291 (20.8%) | 219 (26.7%) |
| $1,000 to $1,499 | 310 (22.2%) | 66 (8.1%) |
| $1,500 to $1,999 | 31 (2.2%) | 0 (0.0%) |
| $2,000 to $2,499 | 26 (1.9%) | 0 (0.0%) |
| $2,500 to $2,999 | 38 (2.7%) | 0 (0.0%) |
| $3,000 or more | 0 (0.0%) | 0 (0.0%) |
| Total | 1,398 (100.0%) | 819 (100.0%) |
Physical Housing Characteristics in Wellsville
Housing Structures in Wellsville
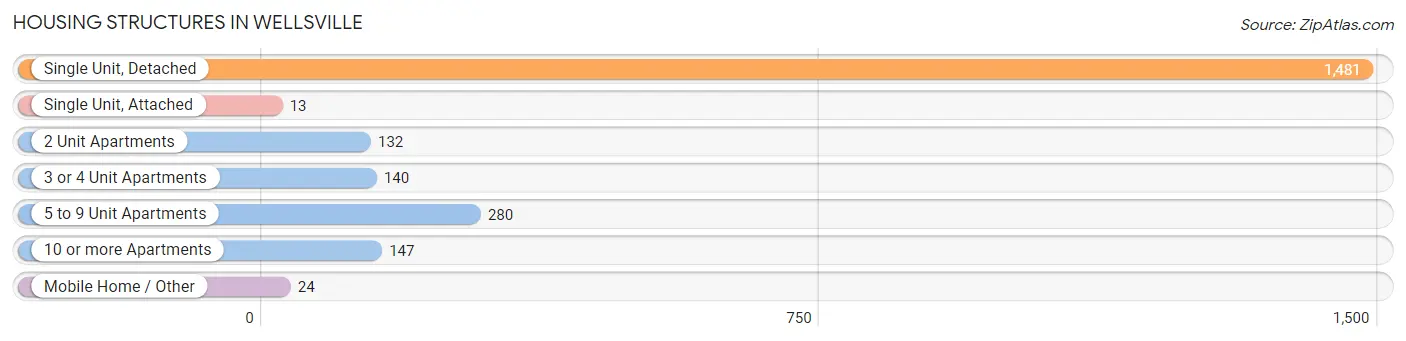
| Structure Type | # Housing Units | % Housing Units |
| Single Unit, Detached | 1,481 | 66.8% |
| Single Unit, Attached | 13 | 0.6% |
| 2 Unit Apartments | 132 | 5.9% |
| 3 or 4 Unit Apartments | 140 | 6.3% |
| 5 to 9 Unit Apartments | 280 | 12.6% |
| 10 or more Apartments | 147 | 6.6% |
| Mobile Home / Other | 24 | 1.1% |
| Total | 2,217 | 100.0% |
Housing Structures by Occupancy in Wellsville
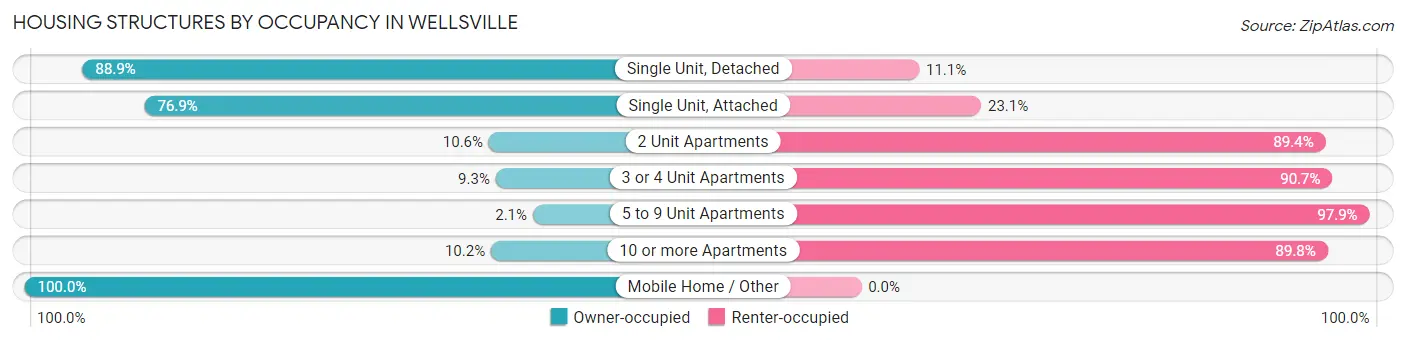
| Structure Type | Owner-occupied | Renter-occupied |
| Single Unit, Detached | 1,316 (88.9%) | 165 (11.1%) |
| Single Unit, Attached | 10 (76.9%) | 3 (23.1%) |
| 2 Unit Apartments | 14 (10.6%) | 118 (89.4%) |
| 3 or 4 Unit Apartments | 13 (9.3%) | 127 (90.7%) |
| 5 to 9 Unit Apartments | 6 (2.1%) | 274 (97.9%) |
| 10 or more Apartments | 15 (10.2%) | 132 (89.8%) |
| Mobile Home / Other | 24 (100.0%) | 0 (0.0%) |
| Total | 1,398 (63.1%) | 819 (36.9%) |
Housing Structures by Number of Rooms in Wellsville
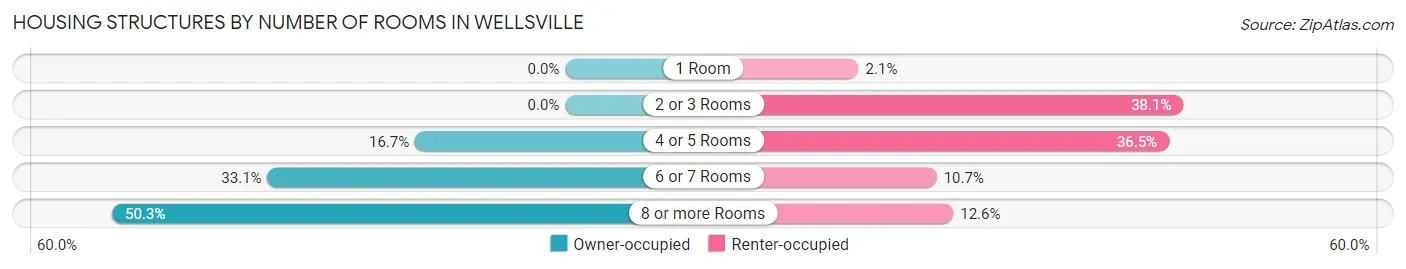
| Number of Rooms | Owner-occupied | Renter-occupied |
| 1 Room | 0 (0.0%) | 17 (2.1%) |
| 2 or 3 Rooms | 0 (0.0%) | 312 (38.1%) |
| 4 or 5 Rooms | 233 (16.7%) | 299 (36.5%) |
| 6 or 7 Rooms | 462 (33.1%) | 88 (10.7%) |
| 8 or more Rooms | 703 (50.3%) | 103 (12.6%) |
| Total | 1,398 (100.0%) | 819 (100.0%) |
Housing Structure by Heating Type in Wellsville
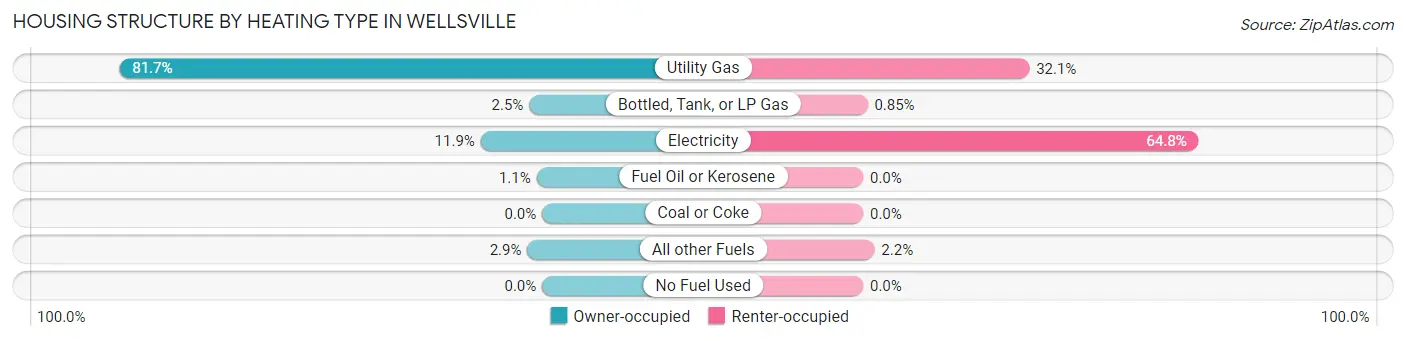
| Heating Type | Owner-occupied | Renter-occupied |
| Utility Gas | 1,142 (81.7%) | 263 (32.1%) |
| Bottled, Tank, or LP Gas | 35 (2.5%) | 7 (0.9%) |
| Electricity | 166 (11.9%) | 531 (64.8%) |
| Fuel Oil or Kerosene | 15 (1.1%) | 0 (0.0%) |
| Coal or Coke | 0 (0.0%) | 0 (0.0%) |
| All other Fuels | 40 (2.9%) | 18 (2.2%) |
| No Fuel Used | 0 (0.0%) | 0 (0.0%) |
| Total | 1,398 (100.0%) | 819 (100.0%) |
Household Vehicle Usage in Wellsville
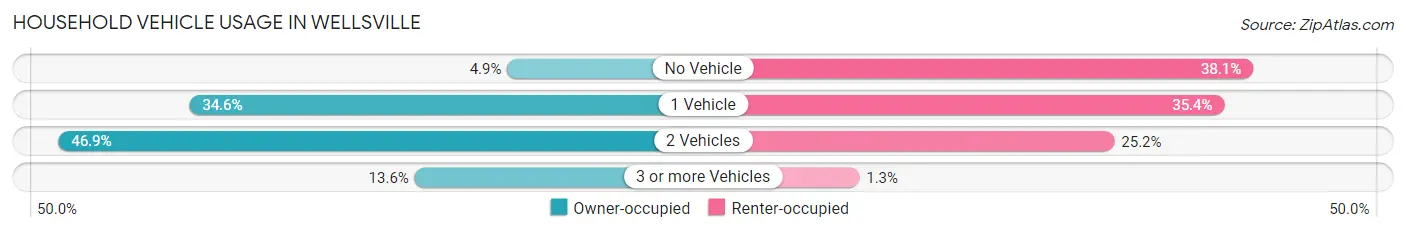
| Vehicles per Household | Owner-occupied | Renter-occupied |
| No Vehicle | 69 (4.9%) | 312 (38.1%) |
| 1 Vehicle | 484 (34.6%) | 290 (35.4%) |
| 2 Vehicles | 655 (46.9%) | 206 (25.2%) |
| 3 or more Vehicles | 190 (13.6%) | 11 (1.3%) |
| Total | 1,398 (100.0%) | 819 (100.0%) |
Real Estate & Mortgages in Wellsville
Real Estate and Mortgage Overview in Wellsville
| Characteristic | Without Mortgage | With Mortgage |
| Housing Units | 835 | 563 |
| Median Property Value | $80,600 | $86,100 |
| Median Household Income | $56,581 | $13 |
| Monthly Housing Costs | $456 | $0 |
| Real Estate Taxes | $3,114 | $17 |
Property Value by Mortgage Status in Wellsville
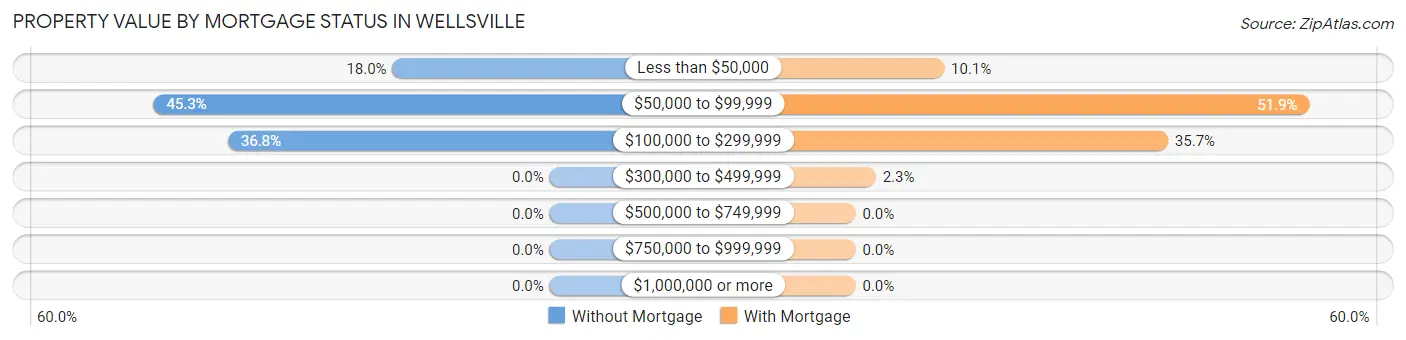
| Property Value | Without Mortgage | With Mortgage |
| Less than $50,000 | 150 (18.0%) | 57 (10.1%) |
| $50,000 to $99,999 | 378 (45.3%) | 292 (51.9%) |
| $100,000 to $299,999 | 307 (36.8%) | 201 (35.7%) |
| $300,000 to $499,999 | 0 (0.0%) | 13 (2.3%) |
| $500,000 to $749,999 | 0 (0.0%) | 0 (0.0%) |
| $750,000 to $999,999 | 0 (0.0%) | 0 (0.0%) |
| $1,000,000 or more | 0 (0.0%) | 0 (0.0%) |
| Total | 835 (100.0%) | 563 (100.0%) |
Household Income by Mortgage Status in Wellsville
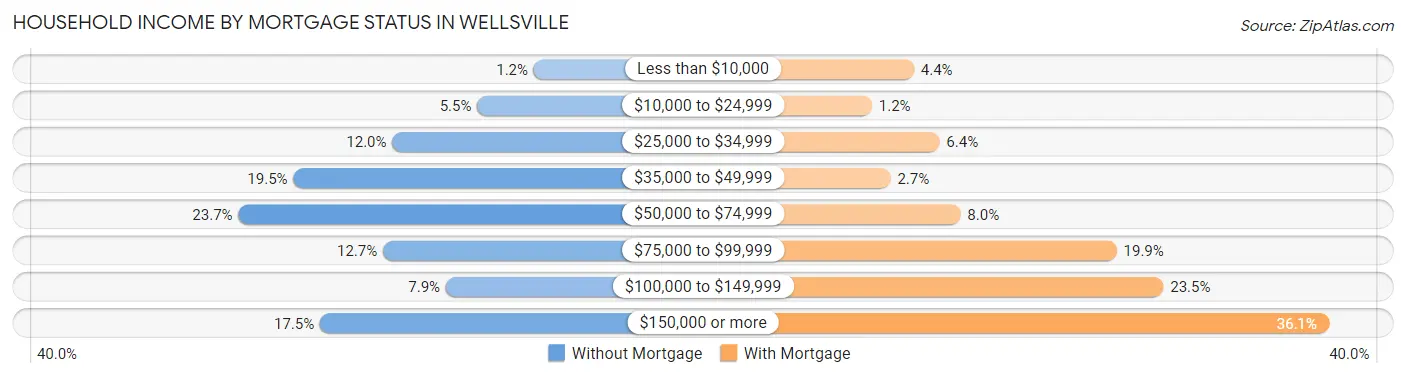
| Household Income | Without Mortgage | With Mortgage |
| Less than $10,000 | 10 (1.2%) | 25 (4.4%) |
| $10,000 to $24,999 | 46 (5.5%) | 7 (1.2%) |
| $25,000 to $34,999 | 100 (12.0%) | 36 (6.4%) |
| $35,000 to $49,999 | 163 (19.5%) | 15 (2.7%) |
| $50,000 to $74,999 | 198 (23.7%) | 45 (8.0%) |
| $75,000 to $99,999 | 106 (12.7%) | 112 (19.9%) |
| $100,000 to $149,999 | 66 (7.9%) | 132 (23.4%) |
| $150,000 or more | 146 (17.5%) | 203 (36.1%) |
| Total | 835 (100.0%) | 563 (100.0%) |
Property Value to Household Income Ratio in Wellsville
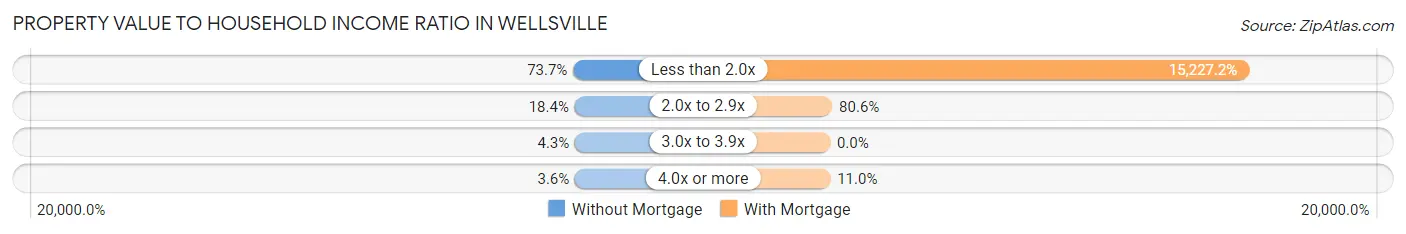
| Value-to-Income Ratio | Without Mortgage | With Mortgage |
| Less than 2.0x | 615 (73.7%) | 85,729 (15,227.2%) |
| 2.0x to 2.9x | 154 (18.4%) | 454 (80.6%) |
| 3.0x to 3.9x | 36 (4.3%) | 0 (0.0%) |
| 4.0x or more | 30 (3.6%) | 62 (11.0%) |
| Total | 835 (100.0%) | 563 (100.0%) |
Real Estate Taxes by Mortgage Status in Wellsville
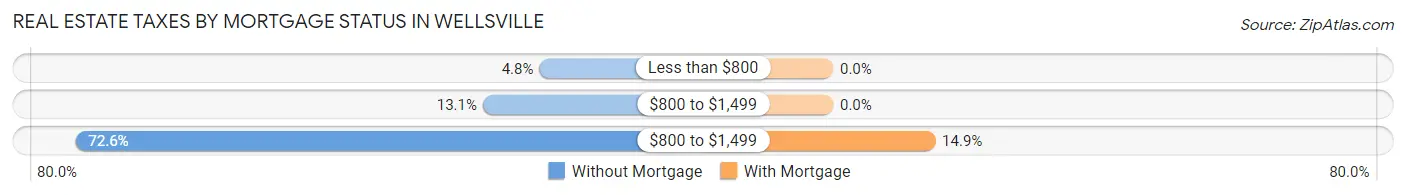
| Property Taxes | Without Mortgage | With Mortgage |
| Less than $800 | 40 (4.8%) | 0 (0.0%) |
| $800 to $1,499 | 109 (13.1%) | 0 (0.0%) |
| $800 to $1,499 | 606 (72.6%) | 84 (14.9%) |
| Total | 835 (100.0%) | 563 (100.0%) |
Health & Disability in Wellsville
Health Insurance Coverage by Age in Wellsville
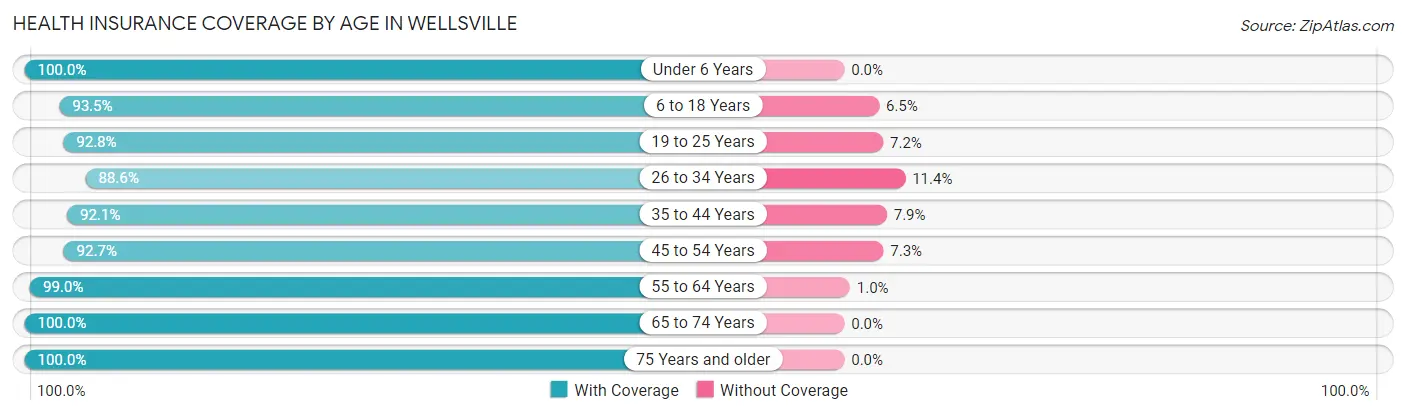
| Age Bracket | With Coverage | Without Coverage |
| Under 6 Years | 254 (100.0%) | 0 (0.0%) |
| 6 to 18 Years | 621 (93.5%) | 43 (6.5%) |
| 19 to 25 Years | 564 (92.8%) | 44 (7.2%) |
| 26 to 34 Years | 273 (88.6%) | 35 (11.4%) |
| 35 to 44 Years | 570 (92.1%) | 49 (7.9%) |
| 45 to 54 Years | 471 (92.7%) | 37 (7.3%) |
| 55 to 64 Years | 768 (99.0%) | 8 (1.0%) |
| 65 to 74 Years | 717 (100.0%) | 0 (0.0%) |
| 75 Years and older | 372 (100.0%) | 0 (0.0%) |
| Total | 4,610 (95.5%) | 216 (4.5%) |
Health Insurance Coverage by Citizenship Status in Wellsville
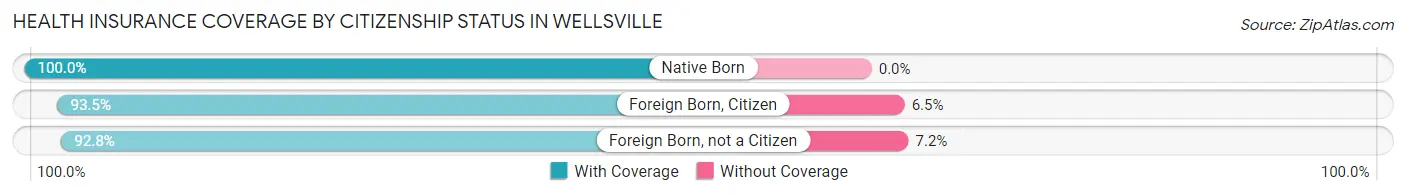
| Citizenship Status | With Coverage | Without Coverage |
| Native Born | 254 (100.0%) | 0 (0.0%) |
| Foreign Born, Citizen | 621 (93.5%) | 43 (6.5%) |
| Foreign Born, not a Citizen | 564 (92.8%) | 44 (7.2%) |
Health Insurance Coverage by Household Income in Wellsville
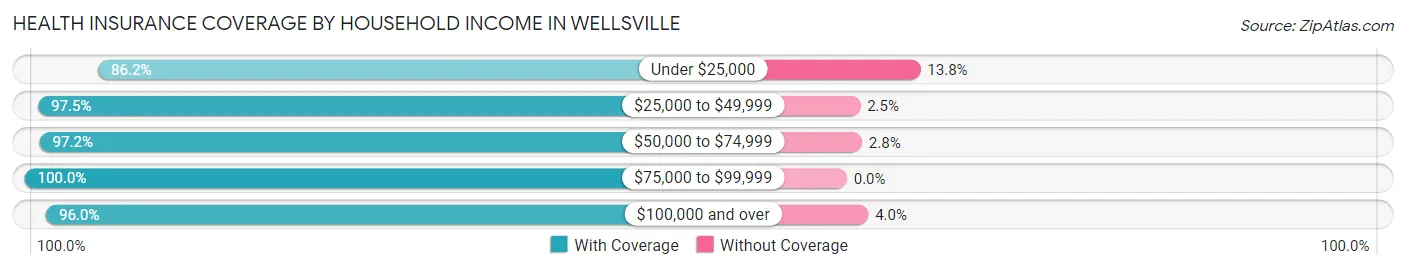
| Household Income | With Coverage | Without Coverage |
| Under $25,000 | 694 (86.2%) | 111 (13.8%) |
| $25,000 to $49,999 | 890 (97.5%) | 23 (2.5%) |
| $50,000 to $74,999 | 756 (97.2%) | 22 (2.8%) |
| $75,000 to $99,999 | 783 (100.0%) | 0 (0.0%) |
| $100,000 and over | 1,433 (96.0%) | 60 (4.0%) |
Public vs Private Health Insurance Coverage by Age in Wellsville
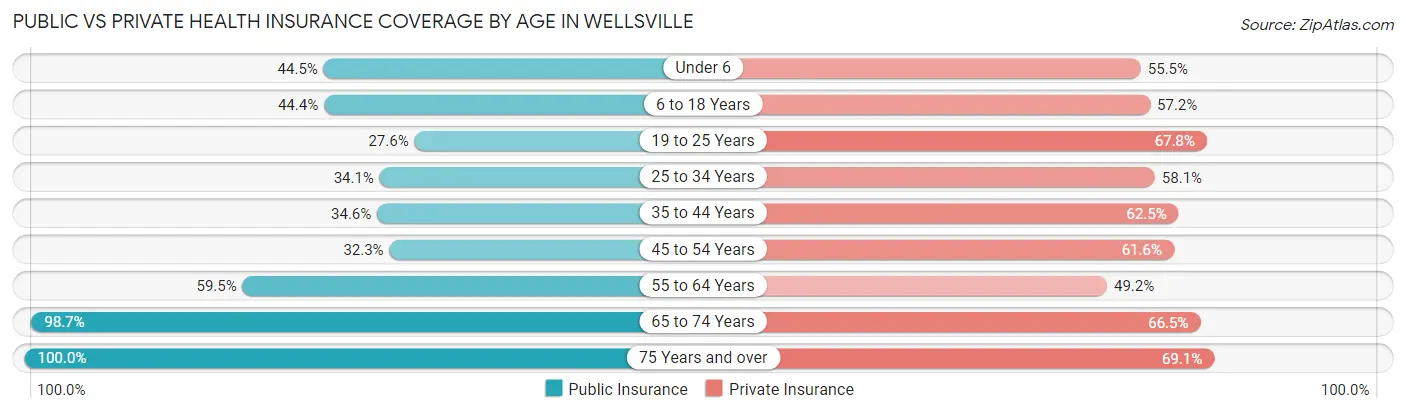
| Age Bracket | Public Insurance | Private Insurance |
| Under 6 | 113 (44.5%) | 141 (55.5%) |
| 6 to 18 Years | 295 (44.4%) | 380 (57.2%) |
| 19 to 25 Years | 168 (27.6%) | 412 (67.8%) |
| 25 to 34 Years | 105 (34.1%) | 179 (58.1%) |
| 35 to 44 Years | 214 (34.6%) | 387 (62.5%) |
| 45 to 54 Years | 164 (32.3%) | 313 (61.6%) |
| 55 to 64 Years | 462 (59.5%) | 382 (49.2%) |
| 65 to 74 Years | 708 (98.7%) | 477 (66.5%) |
| 75 Years and over | 372 (100.0%) | 257 (69.1%) |
| Total | 2,601 (53.9%) | 2,928 (60.7%) |
Disability Status by Sex by Age in Wellsville
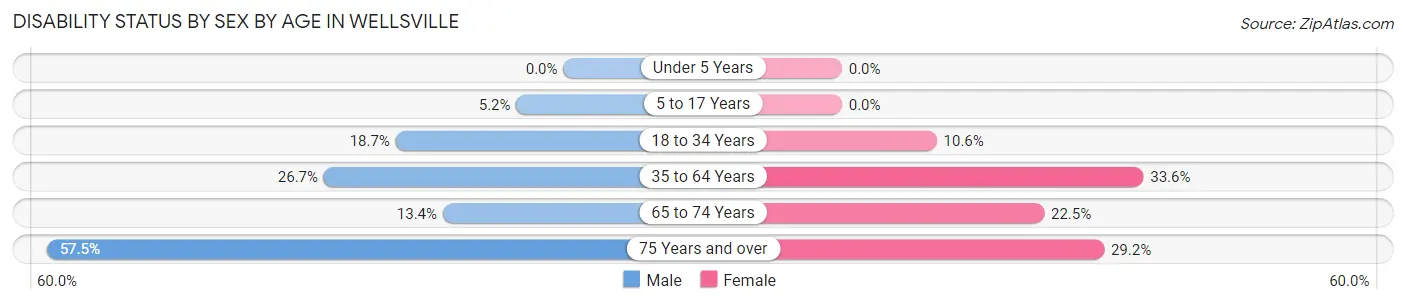
| Age Bracket | Male | Female |
| Under 5 Years | 0 (0.0%) | 0 (0.0%) |
| 5 to 17 Years | 17 (5.2%) | 0 (0.0%) |
| 18 to 34 Years | 126 (18.7%) | 34 (10.6%) |
| 35 to 64 Years | 255 (26.7%) | 318 (33.6%) |
| 65 to 74 Years | 42 (13.4%) | 91 (22.5%) |
| 75 Years and over | 84 (57.5%) | 66 (29.2%) |
Disability Class by Sex by Age in Wellsville
Disability Class: Hearing Difficulty
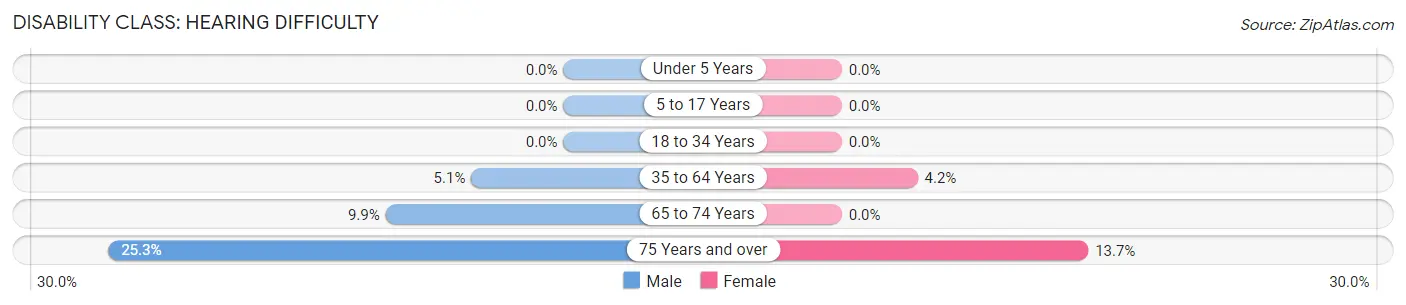
| Age Bracket | Male | Female |
| Under 5 Years | 0 (0.0%) | 0 (0.0%) |
| 5 to 17 Years | 0 (0.0%) | 0 (0.0%) |
| 18 to 34 Years | 0 (0.0%) | 0 (0.0%) |
| 35 to 64 Years | 49 (5.1%) | 40 (4.2%) |
| 65 to 74 Years | 31 (9.9%) | 0 (0.0%) |
| 75 Years and over | 37 (25.3%) | 31 (13.7%) |
Disability Class: Vision Difficulty
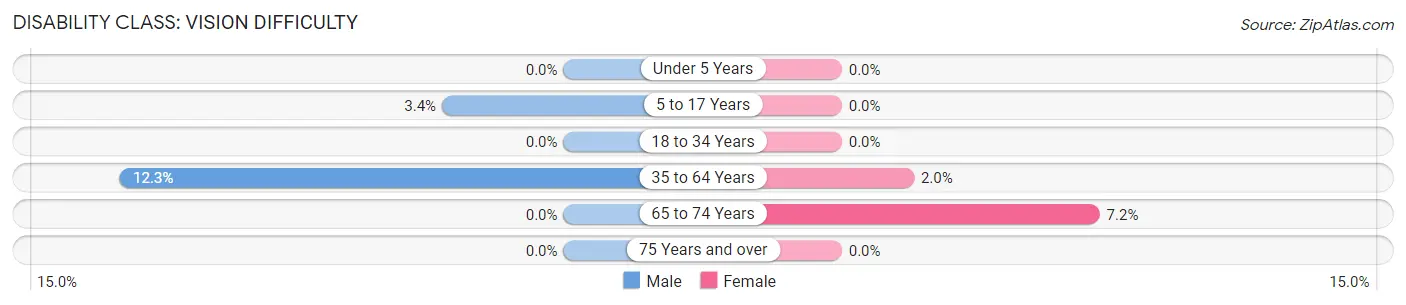
| Age Bracket | Male | Female |
| Under 5 Years | 0 (0.0%) | 0 (0.0%) |
| 5 to 17 Years | 11 (3.4%) | 0 (0.0%) |
| 18 to 34 Years | 0 (0.0%) | 0 (0.0%) |
| 35 to 64 Years | 118 (12.3%) | 19 (2.0%) |
| 65 to 74 Years | 0 (0.0%) | 29 (7.2%) |
| 75 Years and over | 0 (0.0%) | 0 (0.0%) |
Disability Class: Cognitive Difficulty
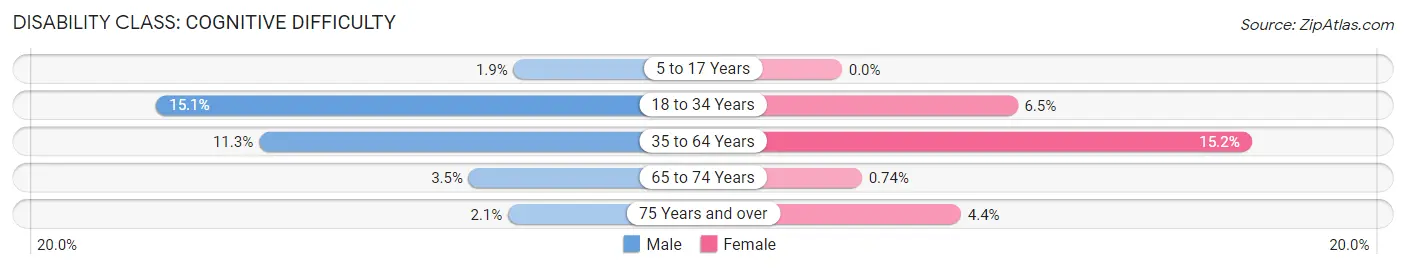
| Age Bracket | Male | Female |
| 5 to 17 Years | 6 (1.8%) | 0 (0.0%) |
| 18 to 34 Years | 102 (15.1%) | 21 (6.5%) |
| 35 to 64 Years | 108 (11.3%) | 144 (15.2%) |
| 65 to 74 Years | 11 (3.5%) | 3 (0.7%) |
| 75 Years and over | 3 (2.1%) | 10 (4.4%) |
Disability Class: Ambulatory Difficulty
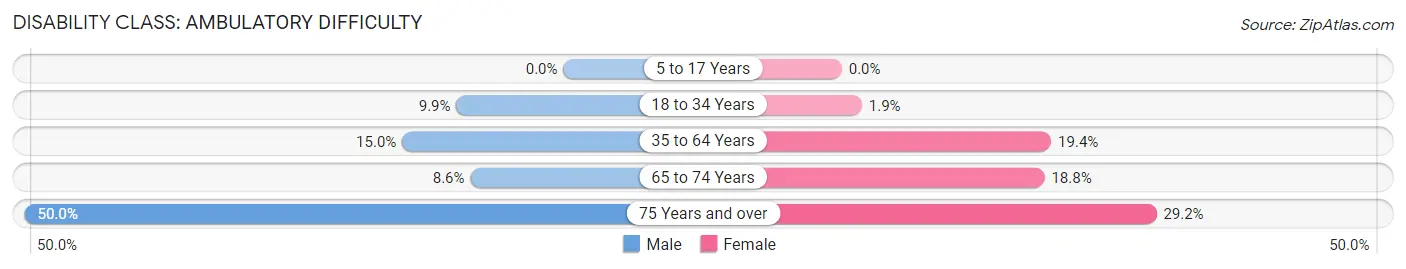
| Age Bracket | Male | Female |
| 5 to 17 Years | 0 (0.0%) | 0 (0.0%) |
| 18 to 34 Years | 67 (9.9%) | 6 (1.9%) |
| 35 to 64 Years | 143 (15.0%) | 184 (19.4%) |
| 65 to 74 Years | 27 (8.6%) | 76 (18.8%) |
| 75 Years and over | 73 (50.0%) | 66 (29.2%) |
Disability Class: Self-Care Difficulty
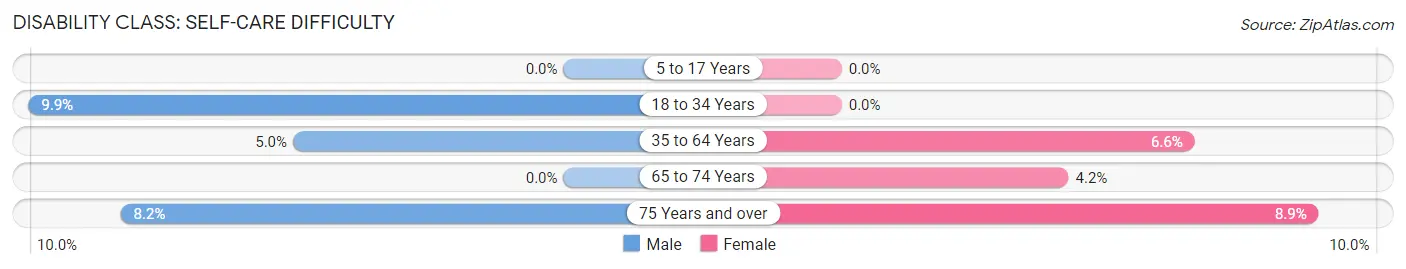
| Age Bracket | Male | Female |
| 5 to 17 Years | 0 (0.0%) | 0 (0.0%) |
| 18 to 34 Years | 67 (9.9%) | 0 (0.0%) |
| 35 to 64 Years | 48 (5.0%) | 62 (6.6%) |
| 65 to 74 Years | 0 (0.0%) | 17 (4.2%) |
| 75 Years and over | 12 (8.2%) | 20 (8.8%) |
Technology Access in Wellsville
Computing Device Access in Wellsville
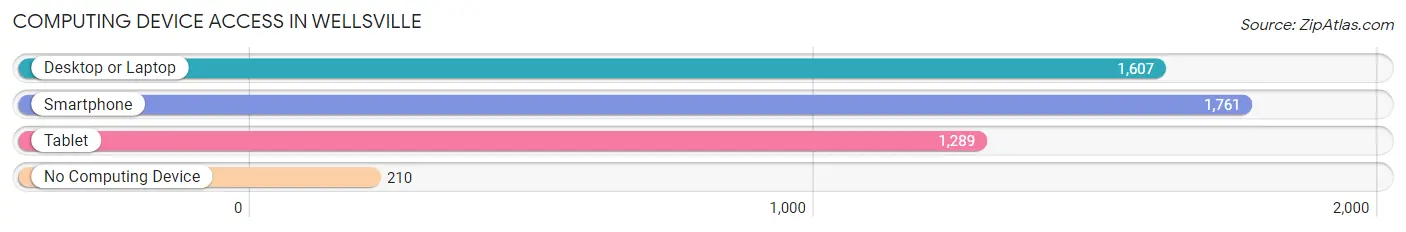
| Device Type | # Households | % Households |
| Desktop or Laptop | 1,607 | 72.5% |
| Smartphone | 1,761 | 79.4% |
| Tablet | 1,289 | 58.1% |
| No Computing Device | 210 | 9.5% |
| Total | 2,217 | 100.0% |
Internet Access in Wellsville
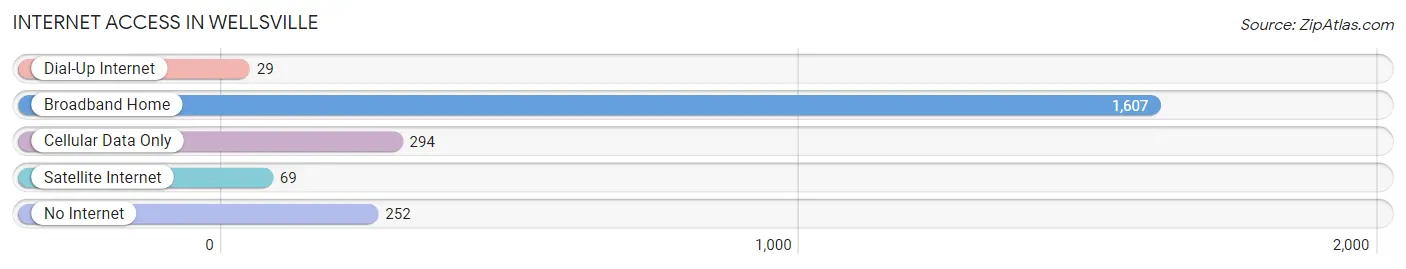
| Internet Type | # Households | % Households |
| Dial-Up Internet | 29 | 1.3% |
| Broadband Home | 1,607 | 72.5% |
| Cellular Data Only | 294 | 13.3% |
| Satellite Internet | 69 | 3.1% |
| No Internet | 252 | 11.4% |
| Total | 2,217 | 100.0% |
Wellsville Summary
Wellsville, New York is a small town located in Allegany County, New York. It is situated in the foothills of the Allegheny Mountains, and is the county seat of Allegany County. The town has a population of approximately 4,500 people, and is located about 50 miles south of Buffalo, New York.
History
The area that is now Wellsville was first settled in 1797 by a group of settlers from Connecticut. The town was originally known as "Hardscrabble," and was later renamed "Wellsville" in honor of William Wells, a local landowner. The town was officially incorporated in 1824.
In the early 19th century, Wellsville was a thriving agricultural community, with a variety of crops being grown in the area. The town was also home to several mills, including a sawmill, a gristmill, and a woolen mill.
In the late 19th century, the town began to experience a period of industrialization. The first railroad line was built in 1872, and the town soon became a hub for the lumber and coal industries. The town also became a center for the manufacture of furniture, and several furniture factories were established in the area.
In the early 20th century, Wellsville experienced a period of economic decline. The lumber and coal industries declined, and the furniture factories closed. The town was also hit hard by the Great Depression, and many of its residents were forced to leave in search of work.
Geography
Wellsville is located in the foothills of the Allegheny Mountains, and is situated on the Genesee River. The town is located about 50 miles south of Buffalo, New York, and is about 25 miles east of the Pennsylvania border.
The town has a total area of 4.2 square miles, all of which is land. The town is located at an elevation of 1,400 feet above sea level.
Economy
Wellsville's economy is largely based on agriculture and tourism. The town is home to several farms, and produces a variety of crops, including corn, soybeans, and hay. The town is also home to several wineries, and is a popular destination for wine tours.
The town is also home to several manufacturing companies, including a furniture factory and a plastics factory. The town is also home to several retail stores, including a grocery store, a hardware store, and a variety of specialty shops.
Demographics
As of the 2010 census, the town had a population of 4,500 people. The racial makeup of the town was 95.3% White, 1.2% African American, 0.4% Native American, 0.7% Asian, 0.1% Pacific Islander, 0.7% from other races, and 1.6% from two or more races. Hispanic or Latino of any race were 2.2% of the population.
The median household income in the town was $37,500, and the median family income was $45,000. The per capita income in the town was $18,000. About 11.3% of the population was below the poverty line.
Common Questions
What is the Total Population of Wellsville?
Total Population of Wellsville is 4,871.
What is the Total Male Population of Wellsville?
Total Male Population of Wellsville is 2,584.
What is the Total Female Population of Wellsville?
Total Female Population of Wellsville is 2,287.
What is the Ratio of Males per 100 Females in Wellsville?
There are 112.99 Males per 100 Females in Wellsville.
What is the Ratio of Females per 100 Males in Wellsville?
There are 88.51 Females per 100 Males in Wellsville.
What is the Median Population Age in Wellsville?
Median Population Age in Wellsville is 44.8 Years.
What is the Average Family Size in Wellsville
Average Family Size in Wellsville is 2.9 People.
What is the Average Household Size in Wellsville
Average Household Size in Wellsville is 2.1 People.
What is Per Capita Income in Wellsville?
Per Capita income in Wellsville is $29,536.
What is the Median Family Income in Wellsville?
Median Family Income in Wellsville is $76,118.
What is the Median Household income in Wellsville?
Median Household Income in Wellsville is $48,784.
What is Income or Wage Gap in Wellsville?
Income or Wage Gap in Wellsville is 26.8%.
Women in Wellsville earn 73.2 cents for every dollar earned by a man.
What is Inequality or Gini Index in Wellsville?
Inequality or Gini Index in Wellsville is 0.46.
How Large is the Labor Force in Wellsville?
There are 2,036 People in the Labor Forcein in Wellsville.
What is the Percentage of People in the Labor Force in Wellsville?
49.3% of People are in the Labor Force in Wellsville.
What is the Unemployment Rate in Wellsville?
Unemployment Rate in Wellsville is 5.2%.