Zip Codes with the Highest Percentage of Population Employed in Agriculture, Fishing & Hunting in Utica, NY
RELATED REPORTS & OPTIONS
Agriculture, Fishing & Hunting
Utica
Compare Zip Codes
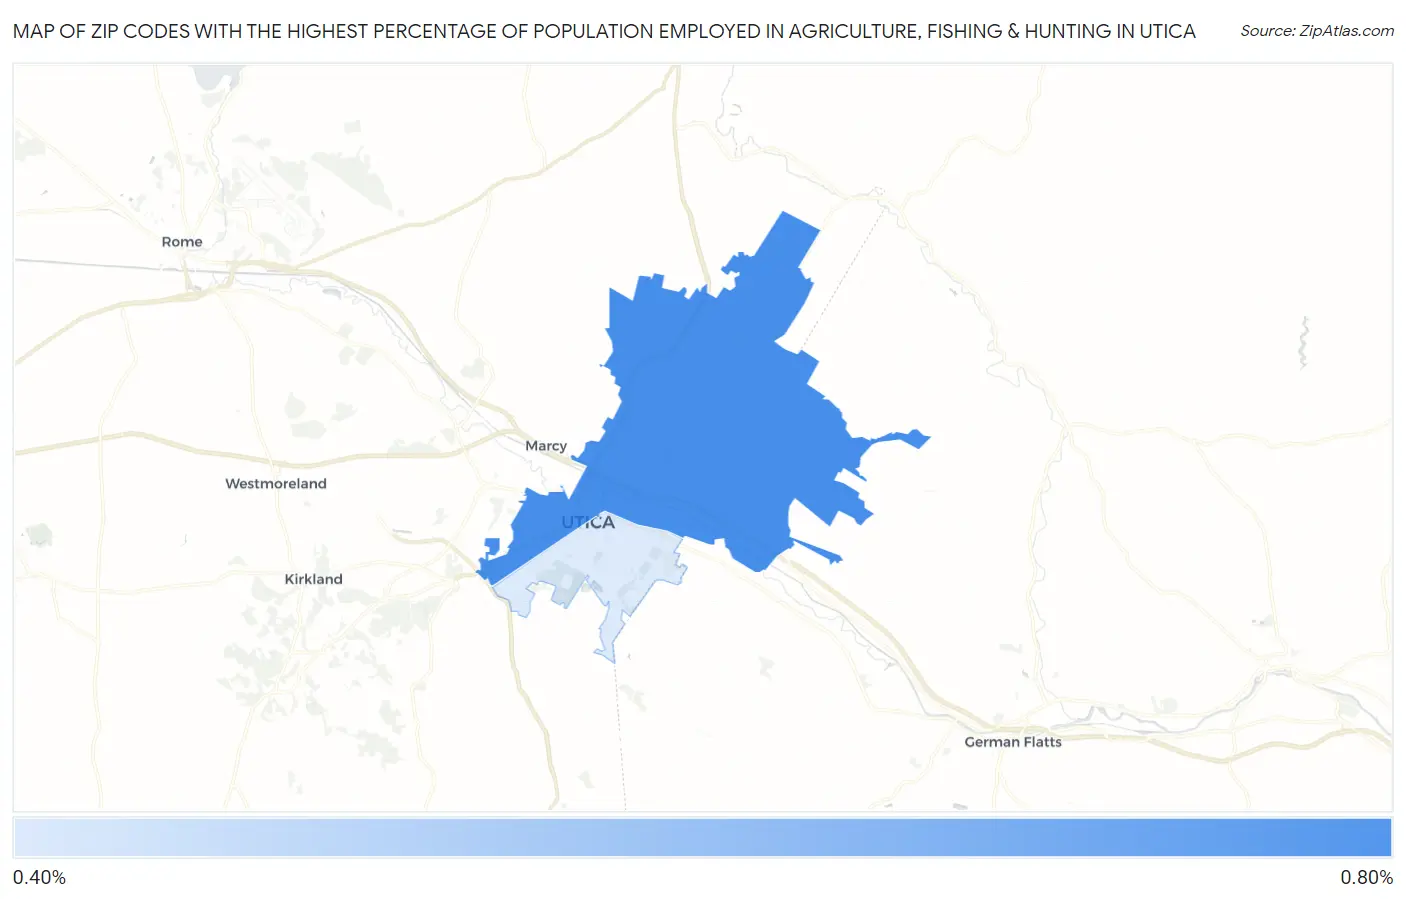
Map of Zip Codes with the Highest Percentage of Population Employed in Agriculture, Fishing & Hunting in Utica
0.0%
0.80%
Zip Codes with the Highest Percentage of Population Employed in Agriculture, Fishing & Hunting in Utica, NY
| Zip Code | % Employed | vs State | vs National | |
| 1. | 13502 | 0.68% | 0.50%(+0.178)#705 | 1.2%(-0.522)#17,970 |
| 2. | 13501 | 0.42% | 0.50%(-0.084)#791 | 1.2%(-0.784)#20,019 |
1
Common Questions
What are the Top Zip Codes with the Highest Percentage of Population Employed in Agriculture, Fishing & Hunting in Utica, NY?
Top Zip Codes with the Highest Percentage of Population Employed in Agriculture, Fishing & Hunting in Utica, NY are:
What zip code has the Highest Percentage of Population Employed in Agriculture, Fishing & Hunting in Utica, NY?
13502 has the Highest Percentage of Population Employed in Agriculture, Fishing & Hunting in Utica, NY with 0.68%.
What is the Percentage of Population Employed in Agriculture, Fishing & Hunting in Utica, NY?
Percentage of Population Employed in Agriculture, Fishing & Hunting in Utica is 0.57%.
What is the Percentage of Population Employed in Agriculture, Fishing & Hunting in New York?
Percentage of Population Employed in Agriculture, Fishing & Hunting in New York is 0.50%.
What is the Percentage of Population Employed in Agriculture, Fishing & Hunting in the United States?
Percentage of Population Employed in Agriculture, Fishing & Hunting in the United States is 1.2%.