Unadilla, NY
Unadilla Map
Unadilla Overview
945
TOTAL POPULATION
410
MALE POPULATION
535
FEMALE POPULATION
76.64
MALES / 100 FEMALES
130.49
FEMALES / 100 MALES
46.0
MEDIAN AGE
3.5
AVG FAMILY SIZE
2.3
AVG HOUSEHOLD SIZE
$25,120
PER CAPITA INCOME
$65,809
AVG FAMILY INCOME
$42,917
AVG HOUSEHOLD INCOME
42.3%
WAGE / INCOME GAP [ % ]
57.7¢/ $1
WAGE / INCOME GAP [ $ ]
0.42
INEQUALITY / GINI INDEX
485
LABOR FORCE [ PEOPLE ]
58.9%
PERCENT IN LABOR FORCE
7.0%
UNEMPLOYMENT RATE
Unadilla Zip Codes
Unadilla Area Codes
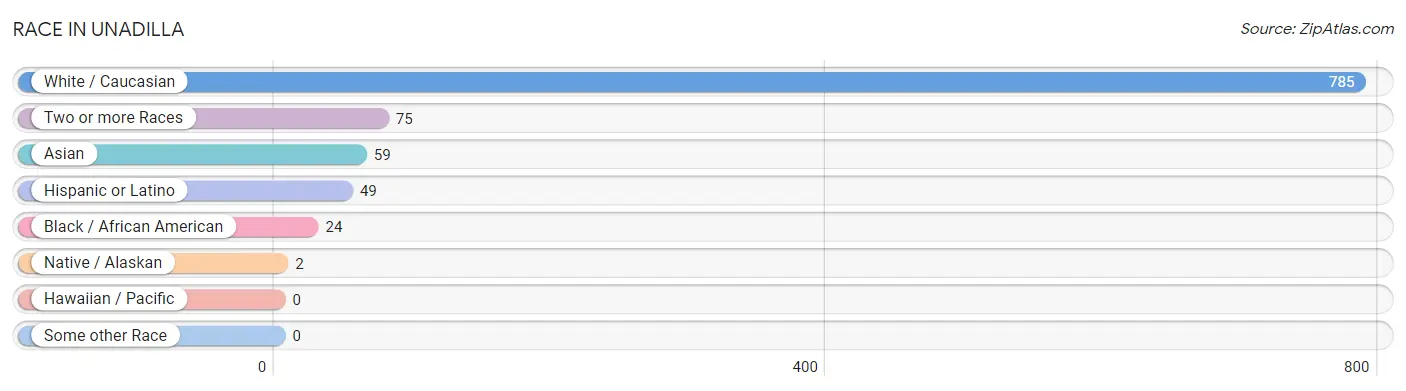
Race in Unadilla
The most populous races in Unadilla are White / Caucasian (785 | 83.1%), Two or more Races (75 | 7.9%), and Asian (59 | 6.2%).
| Race | # Population | % Population |
| Asian | 59 | 6.2% |
| Black / African American | 24 | 2.5% |
| Hawaiian / Pacific | 0 | 0.0% |
| Hispanic or Latino | 49 | 5.2% |
| Native / Alaskan | 2 | 0.2% |
| White / Caucasian | 785 | 83.1% |
| Two or more Races | 75 | 7.9% |
| Some other Race | 0 | 0.0% |
| Total | 945 | 100.0% |
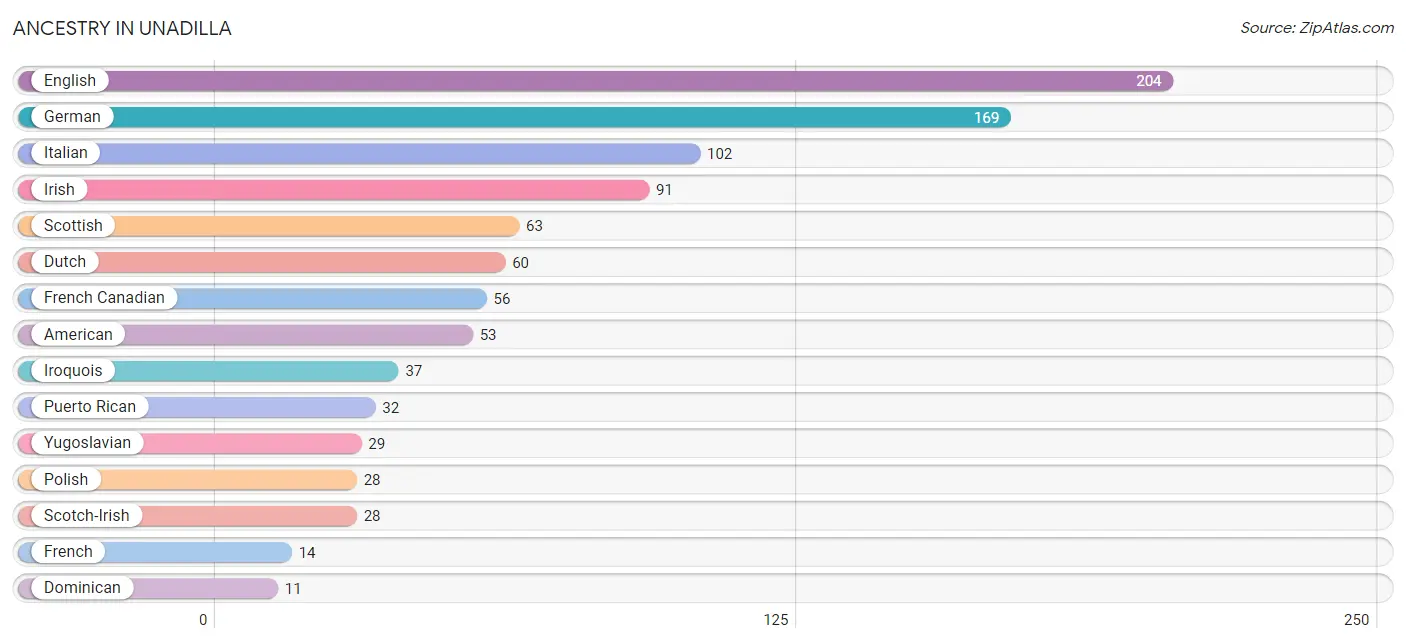
Ancestry in Unadilla
The most populous ancestries reported in Unadilla are English (204 | 21.6%), German (169 | 17.9%), Italian (102 | 10.8%), Irish (91 | 9.6%), and Scottish (63 | 6.7%), together accounting for 66.6% of all Unadilla residents.
| Ancestry | # Population | % Population |
| American | 53 | 5.6% |
| Austrian | 5 | 0.5% |
| Cherokee | 6 | 0.6% |
| Choctaw | 9 | 0.9% |
| Czechoslovakian | 4 | 0.4% |
| Danish | 8 | 0.9% |
| Dominican | 11 | 1.2% |
| Dutch | 60 | 6.4% |
| Eastern European | 3 | 0.3% |
| English | 204 | 21.6% |
| Finnish | 2 | 0.2% |
| French | 14 | 1.5% |
| French Canadian | 56 | 5.9% |
| German | 169 | 17.9% |
| Greek | 4 | 0.4% |
| Iranian | 3 | 0.3% |
| Irish | 91 | 9.6% |
| Iroquois | 37 | 3.9% |
| Italian | 102 | 10.8% |
| Northern European | 5 | 0.5% |
| Polish | 28 | 3.0% |
| Puerto Rican | 32 | 3.4% |
| Romanian | 9 | 0.9% |
| Scotch-Irish | 28 | 3.0% |
| Scottish | 63 | 6.7% |
| Slovak | 6 | 0.6% |
| Spanish | 6 | 0.6% |
| Swedish | 8 | 0.9% |
| Swiss | 3 | 0.3% |
| Turkish | 6 | 0.6% |
| Yugoslavian | 29 | 3.1% | View All 31 Rows |
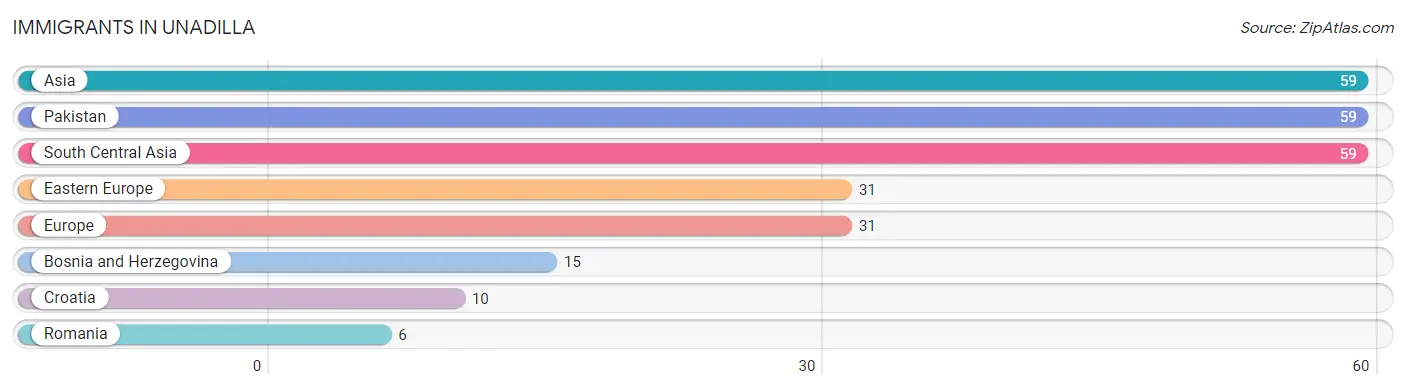
Immigrants in Unadilla
The most numerous immigrant groups reported in Unadilla came from Asia (59 | 6.2%), Pakistan (59 | 6.2%), South Central Asia (59 | 6.2%), Eastern Europe (31 | 3.3%), and Europe (31 | 3.3%), together accounting for 25.3% of all Unadilla residents.
| Immigration Origin | # Population | % Population |
| Asia | 59 | 6.2% |
| Bosnia and Herzegovina | 15 | 1.6% |
| Croatia | 10 | 1.1% |
| Eastern Europe | 31 | 3.3% |
| Europe | 31 | 3.3% |
| Pakistan | 59 | 6.2% |
| Romania | 6 | 0.6% |
| South Central Asia | 59 | 6.2% | View All 8 Rows |
Sex and Age in Unadilla
Sex and Age in Unadilla
The most populous age groups in Unadilla are 20 to 24 Years (62 | 15.1%) for men and 55 to 59 Years (74 | 13.8%) for women.
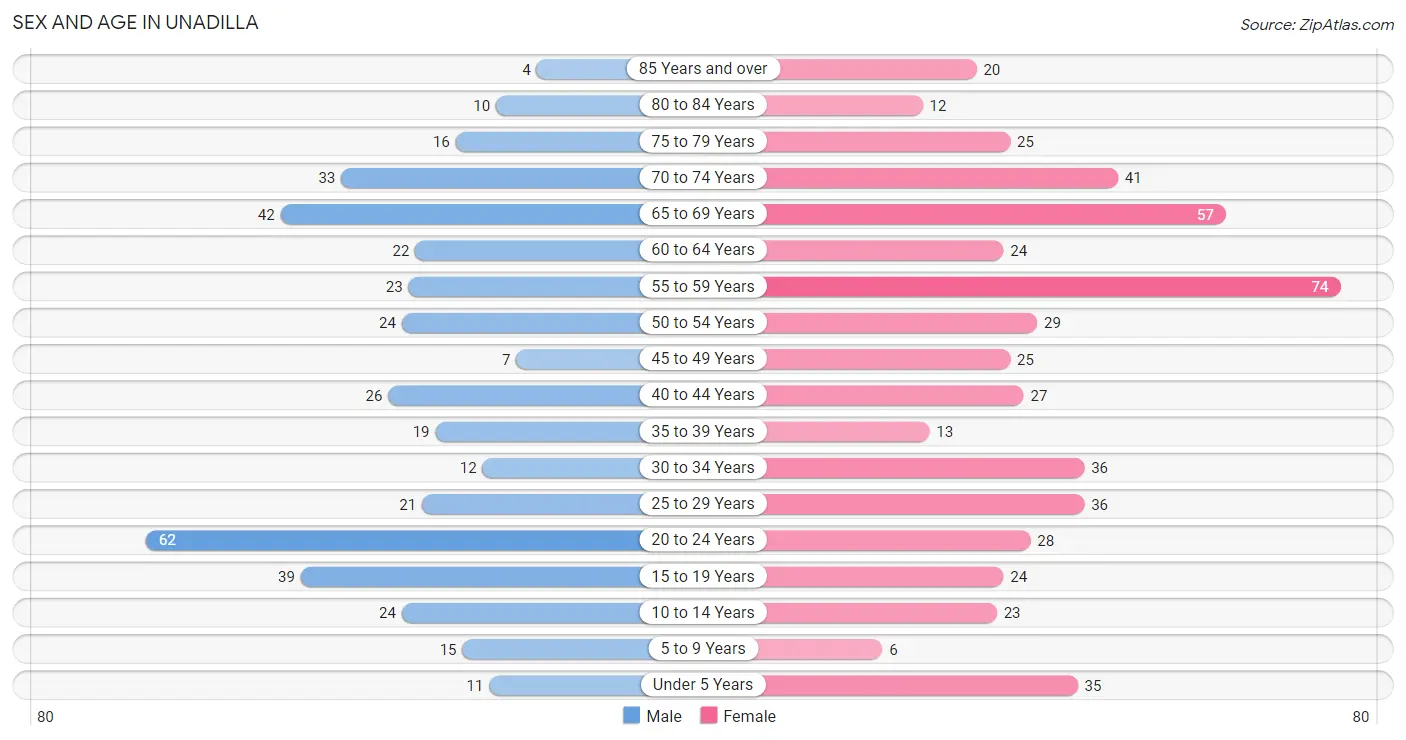
| Age Bracket | Male | Female |
| Under 5 Years | 11 (2.7%) | 35 (6.5%) |
| 5 to 9 Years | 15 (3.7%) | 6 (1.1%) |
| 10 to 14 Years | 24 (5.9%) | 23 (4.3%) |
| 15 to 19 Years | 39 (9.5%) | 24 (4.5%) |
| 20 to 24 Years | 62 (15.1%) | 28 (5.2%) |
| 25 to 29 Years | 21 (5.1%) | 36 (6.7%) |
| 30 to 34 Years | 12 (2.9%) | 36 (6.7%) |
| 35 to 39 Years | 19 (4.6%) | 13 (2.4%) |
| 40 to 44 Years | 26 (6.3%) | 27 (5.1%) |
| 45 to 49 Years | 7 (1.7%) | 25 (4.7%) |
| 50 to 54 Years | 24 (5.9%) | 29 (5.4%) |
| 55 to 59 Years | 23 (5.6%) | 74 (13.8%) |
| 60 to 64 Years | 22 (5.4%) | 24 (4.5%) |
| 65 to 69 Years | 42 (10.2%) | 57 (10.6%) |
| 70 to 74 Years | 33 (8.1%) | 41 (7.7%) |
| 75 to 79 Years | 16 (3.9%) | 25 (4.7%) |
| 80 to 84 Years | 10 (2.4%) | 12 (2.2%) |
| 85 Years and over | 4 (1.0%) | 20 (3.7%) |
| Total | 410 (100.0%) | 535 (100.0%) |
Families and Households in Unadilla
Median Family Size in Unadilla
The median family size in Unadilla is 3.48 persons per family, with single male/father families (17 | 9.1%) accounting for the largest median family size of 5.53 persons per family. On the other hand, married-couple families (125 | 66.8%) represent the smallest median family size with 2.86 persons per family.
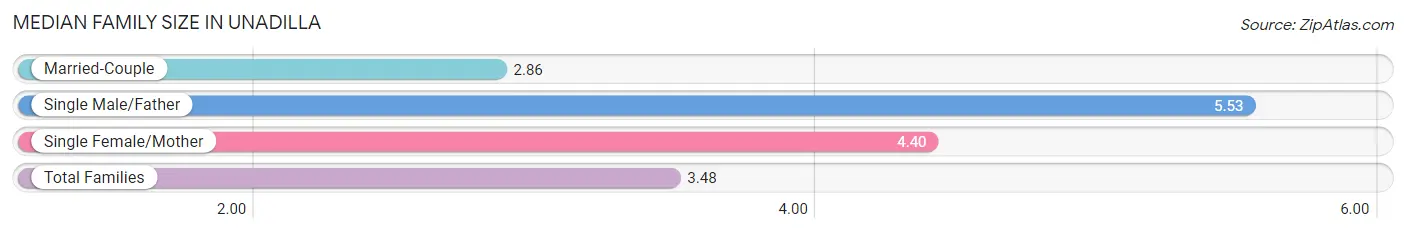
| Family Type | # Families | Family Size |
| Married-Couple | 125 (66.8%) | 2.86 |
| Single Male/Father | 17 (9.1%) | 5.53 |
| Single Female/Mother | 45 (24.1%) | 4.40 |
| Total Families | 187 (100.0%) | 3.48 |
Median Household Size in Unadilla
The median household size in Unadilla is 2.33 persons per household, with single male/father households (17 | 4.2%) accounting for the largest median household size of 6.53 persons per household. non-family households (219 | 53.9%) represent the smallest median household size with 1.09 persons per household.
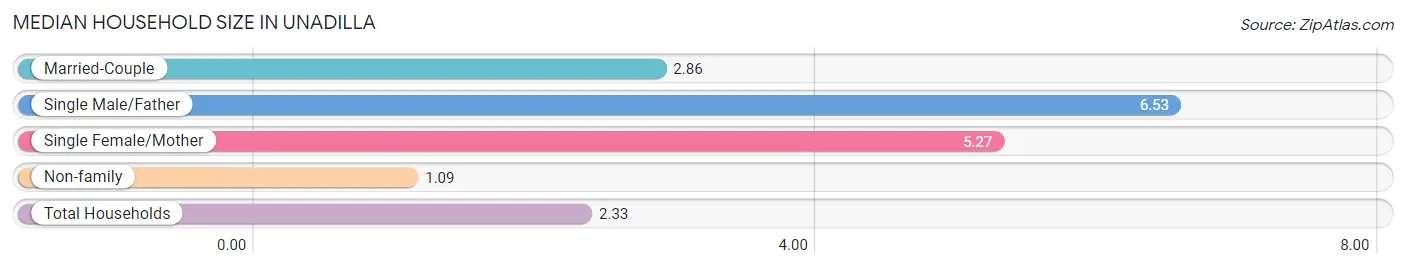
| Household Type | # Households | Household Size |
| Married-Couple | 125 (30.8%) | 2.86 |
| Single Male/Father | 17 (4.2%) | 6.53 |
| Single Female/Mother | 45 (11.1%) | 5.27 |
| Non-family | 219 (53.9%) | 1.09 |
| Total Households | 406 (100.0%) | 2.33 |
Household Size by Marriage Status in Unadilla
Out of a total of 406 households in Unadilla, 187 (46.1%) are family households, while 219 (53.9%) are nonfamily households. The most numerous type of family households are 2-person households, comprising 113, and the most common type of nonfamily households are 1-person households, comprising 200.
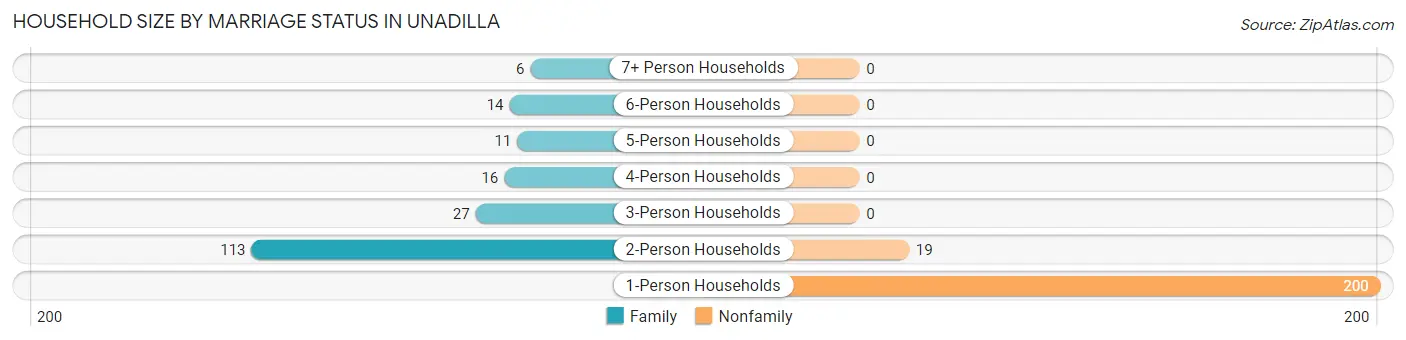
| Household Size | Family Households | Nonfamily Households |
| 1-Person Households | - | 200 (49.3%) |
| 2-Person Households | 113 (27.8%) | 19 (4.7%) |
| 3-Person Households | 27 (6.7%) | 0 (0.0%) |
| 4-Person Households | 16 (3.9%) | 0 (0.0%) |
| 5-Person Households | 11 (2.7%) | 0 (0.0%) |
| 6-Person Households | 14 (3.5%) | 0 (0.0%) |
| 7+ Person Households | 6 (1.5%) | 0 (0.0%) |
| Total | 187 (46.1%) | 219 (53.9%) |
Female Fertility in Unadilla
Fertility by Age in Unadilla
Average fertility rate in Unadilla is 111.0 births per 1,000 women. Women in the age bracket of 15 to 19 years have the highest fertility rate with 625.0 births per 1,000 women. Women in the age bracket of 15 to 19 years acount for 71.4% of all women with births.
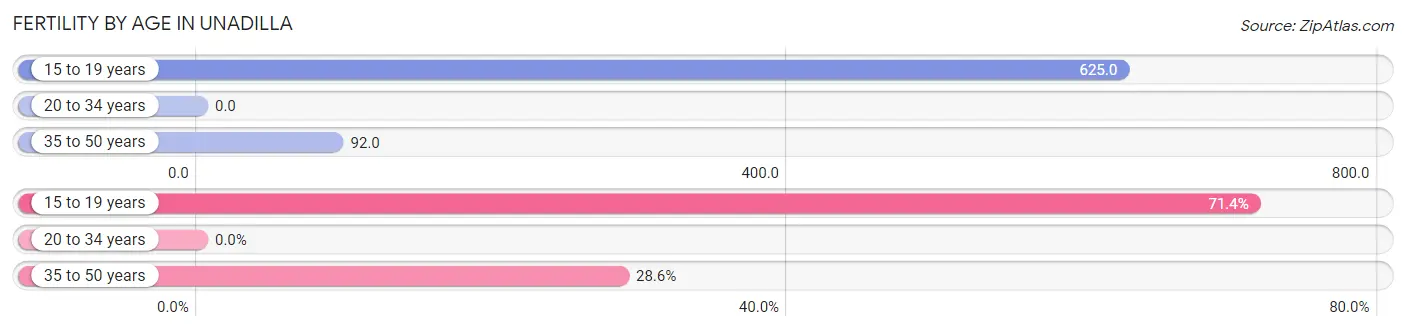
| Age Bracket | Women with Births | Births / 1,000 Women |
| 15 to 19 years | 15 (71.4%) | 625.0 |
| 20 to 34 years | 0 (0.0%) | 0.0 |
| 35 to 50 years | 6 (28.6%) | 92.0 |
| Total | 21 (100.0%) | 111.0 |
Fertility by Age by Marriage Status in Unadilla
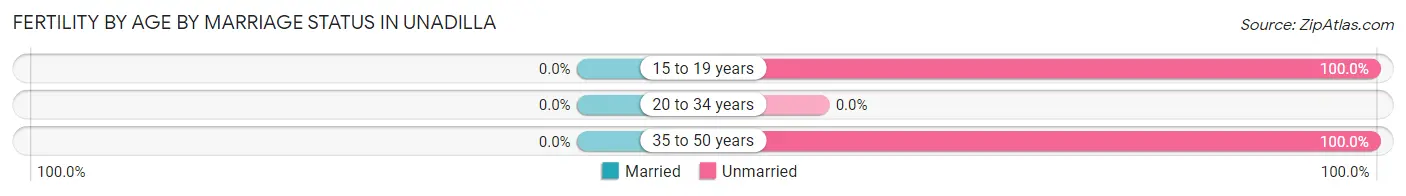
| Age Bracket | Married | Unmarried |
| 15 to 19 years | 0 (0.0%) | 15 (100.0%) |
| 20 to 34 years | 0 (0.0%) | 0 (0.0%) |
| 35 to 50 years | 0 (0.0%) | 6 (100.0%) |
| Total | 0 (0.0%) | 21 (100.0%) |
Fertility by Education in Unadilla
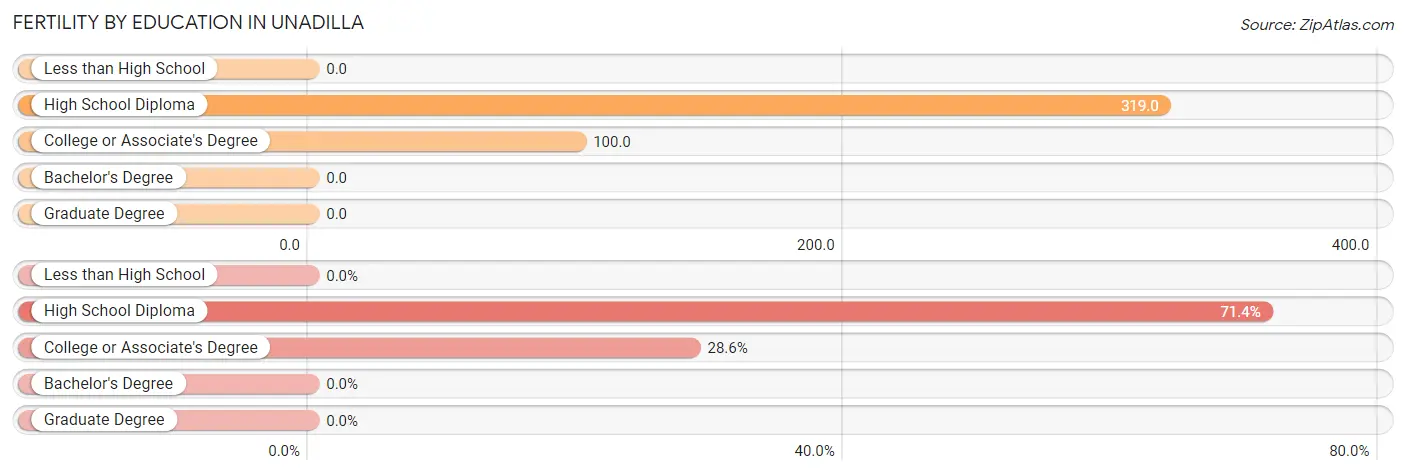
| Educational Attainment | Women with Births | Births / 1,000 Women |
| Less than High School | 0 (0.0%) | 0.0 |
| High School Diploma | 15 (71.4%) | 319.0 |
| College or Associate's Degree | 6 (28.6%) | 100.0 |
| Bachelor's Degree | 0 (0.0%) | 0.0 |
| Graduate Degree | 0 (0.0%) | 0.0 |
| Total | 21 (100.0%) | 111.0 |
Fertility by Education by Marriage Status in Unadilla
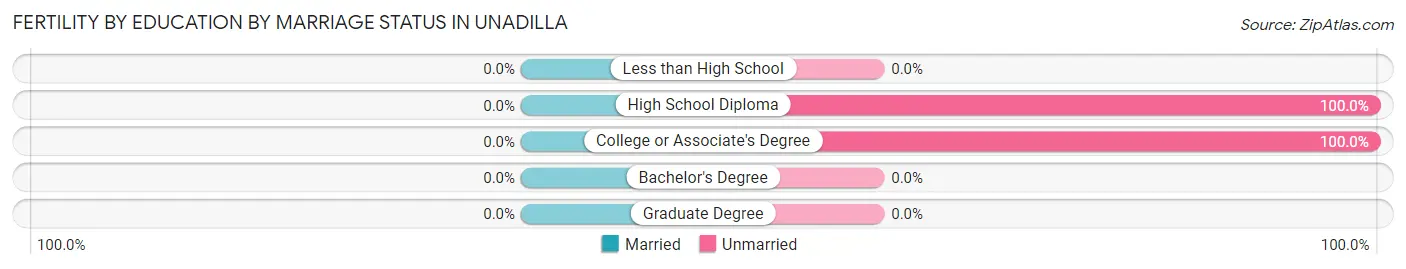
| Educational Attainment | Married | Unmarried |
| Less than High School | 0 (0.0%) | 0 (0.0%) |
| High School Diploma | 0 (0.0%) | 15 (100.0%) |
| College or Associate's Degree | 0 (0.0%) | 6 (100.0%) |
| Bachelor's Degree | 0 (0.0%) | 0 (0.0%) |
| Graduate Degree | 0 (0.0%) | 0 (0.0%) |
| Total | 0 (0.0%) | 21 (100.0%) |
Income in Unadilla
Income Overview in Unadilla
Per Capita Income in Unadilla is $25,120, while median incomes of families and households are $65,809 and $42,917 respectively.
| Characteristic | Number | Measure |
| Per Capita Income | 945 | $25,120 |
| Median Family Income | 187 | $65,809 |
| Mean Family Income | 187 | $66,702 |
| Median Household Income | 406 | $42,917 |
| Mean Household Income | 406 | $53,092 |
| Income Deficit | 187 | $0 |
| Wage / Income Gap (%) | 945 | 42.30% |
| Wage / Income Gap ($) | 945 | 57.70¢ per $1 |
| Gini / Inequality Index | 945 | 0.42 |
Earnings by Sex in Unadilla
Average Earnings in Unadilla are $20,694, $14,485 for men and $25,104 for women, a difference of 42.3%.
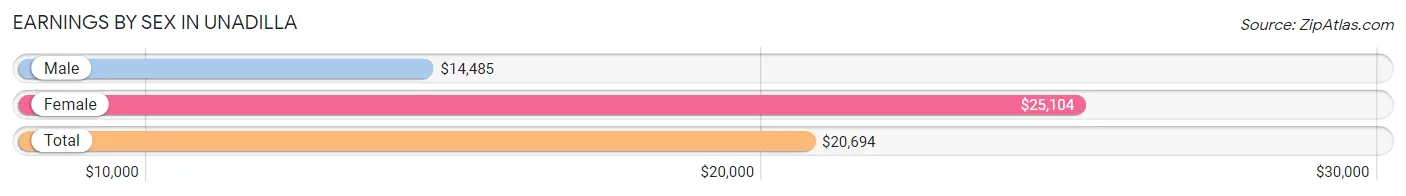
| Sex | Number | Average Earnings |
| Male | 214 (43.2%) | $14,485 |
| Female | 281 (56.8%) | $25,104 |
| Total | 495 (100.0%) | $20,694 |
Earnings by Sex by Income Bracket in Unadilla
The most common earnings brackets in Unadilla are $5,000 to $7,499 for men (37 | 17.3%) and $5,000 to $7,499 for women (55 | 19.6%).
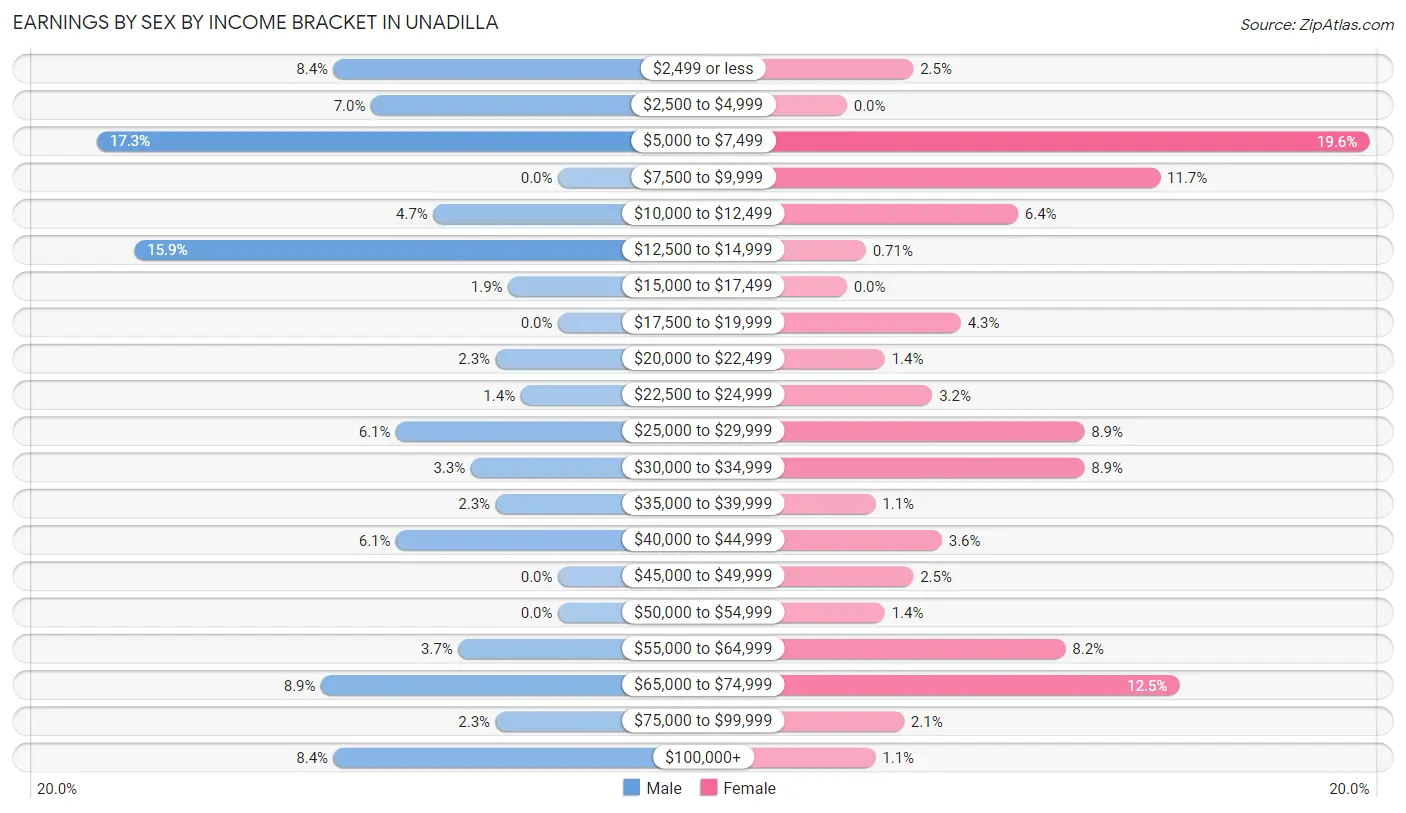
| Income | Male | Female |
| $2,499 or less | 18 (8.4%) | 7 (2.5%) |
| $2,500 to $4,999 | 15 (7.0%) | 0 (0.0%) |
| $5,000 to $7,499 | 37 (17.3%) | 55 (19.6%) |
| $7,500 to $9,999 | 0 (0.0%) | 33 (11.7%) |
| $10,000 to $12,499 | 10 (4.7%) | 18 (6.4%) |
| $12,500 to $14,999 | 34 (15.9%) | 2 (0.7%) |
| $15,000 to $17,499 | 4 (1.9%) | 0 (0.0%) |
| $17,500 to $19,999 | 0 (0.0%) | 12 (4.3%) |
| $20,000 to $22,499 | 5 (2.3%) | 4 (1.4%) |
| $22,500 to $24,999 | 3 (1.4%) | 9 (3.2%) |
| $25,000 to $29,999 | 13 (6.1%) | 25 (8.9%) |
| $30,000 to $34,999 | 7 (3.3%) | 25 (8.9%) |
| $35,000 to $39,999 | 5 (2.3%) | 3 (1.1%) |
| $40,000 to $44,999 | 13 (6.1%) | 10 (3.6%) |
| $45,000 to $49,999 | 0 (0.0%) | 7 (2.5%) |
| $50,000 to $54,999 | 0 (0.0%) | 4 (1.4%) |
| $55,000 to $64,999 | 8 (3.7%) | 23 (8.2%) |
| $65,000 to $74,999 | 19 (8.9%) | 35 (12.5%) |
| $75,000 to $99,999 | 5 (2.3%) | 6 (2.1%) |
| $100,000+ | 18 (8.4%) | 3 (1.1%) |
| Total | 214 (100.0%) | 281 (100.0%) |
Earnings by Sex by Educational Attainment in Unadilla
Average earnings in Unadilla are $30,893 for men and $29,423 for women, a difference of 4.8%. Men with an educational attainment of high school diploma enjoy the highest average annual earnings of $32,143, while those with high school diploma education earn the least with $32,143. Women with an educational attainment of college or associate's degree earn the most with the average annual earnings of $30,833, while those with high school diploma education have the smallest earnings of $24,861.
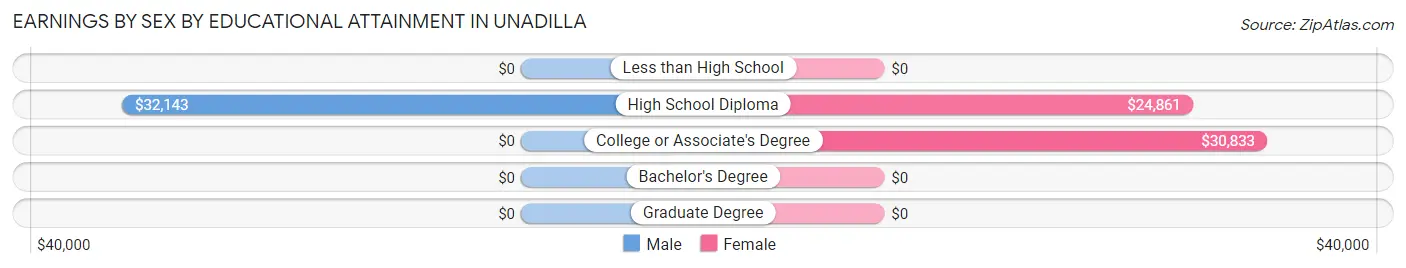
| Educational Attainment | Male Income | Female Income |
| Less than High School | - | - |
| High School Diploma | $32,143 | $24,861 |
| College or Associate's Degree | - | - |
| Bachelor's Degree | - | - |
| Graduate Degree | - | - |
| Total | $30,893 | $29,423 |
Family Income in Unadilla
Family Income Brackets in Unadilla
According to the Unadilla family income data, there are 40 families falling into the $50,000 to $74,999 income range, which is the most common income bracket and makes up 21.4% of all families.
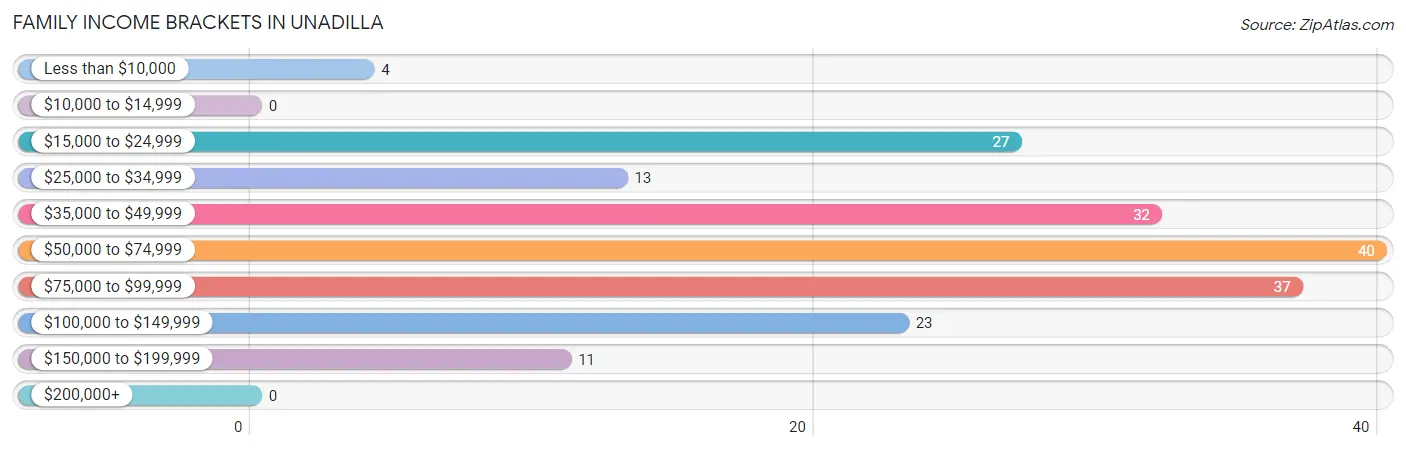
| Income Bracket | # Families | % Families |
| Less than $10,000 | 4 | 2.1% |
| $10,000 to $14,999 | 0 | 0.0% |
| $15,000 to $24,999 | 27 | 14.4% |
| $25,000 to $34,999 | 13 | 7.0% |
| $35,000 to $49,999 | 32 | 17.1% |
| $50,000 to $74,999 | 40 | 21.4% |
| $75,000 to $99,999 | 37 | 19.8% |
| $100,000 to $149,999 | 23 | 12.3% |
| $150,000 to $199,999 | 11 | 5.9% |
| $200,000+ | 0 | 0.0% |
Family Income by Famaliy Size in Unadilla
5-person families (11 | 5.9%) account for the highest median family income in Unadilla with $83,750 per family, while 2-person families (125 | 66.8%) have the highest median income of $36,719 per family member.
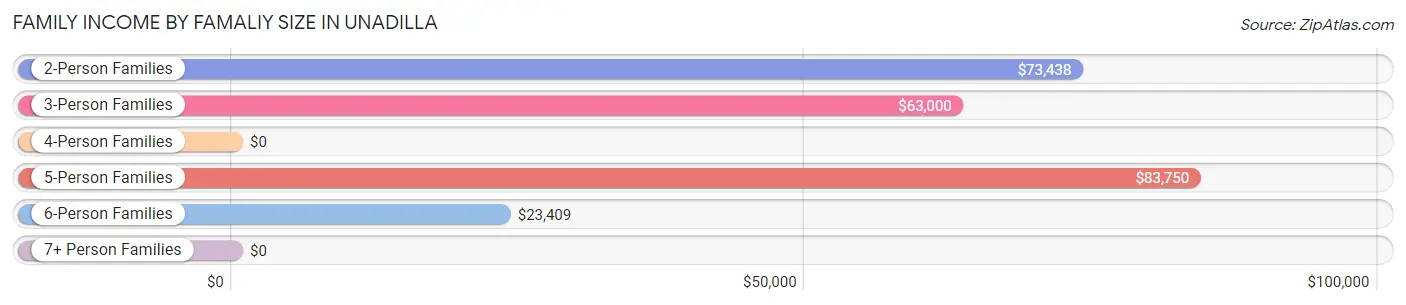
| Income Bracket | # Families | Median Income |
| 2-Person Families | 125 (66.8%) | $73,438 |
| 3-Person Families | 24 (12.8%) | $63,000 |
| 4-Person Families | 7 (3.7%) | $0 |
| 5-Person Families | 11 (5.9%) | $83,750 |
| 6-Person Families | 14 (7.5%) | $23,409 |
| 7+ Person Families | 6 (3.2%) | $0 |
| Total | 187 (100.0%) | $65,809 |
Family Income by Number of Earners in Unadilla
The median family income in Unadilla is $65,809, with families comprising 2 earners (70) having the highest median family income of $94,167, while families with 1 earner (76) have the lowest median family income of $44,792, accounting for 37.4% and 40.6% of families, respectively.
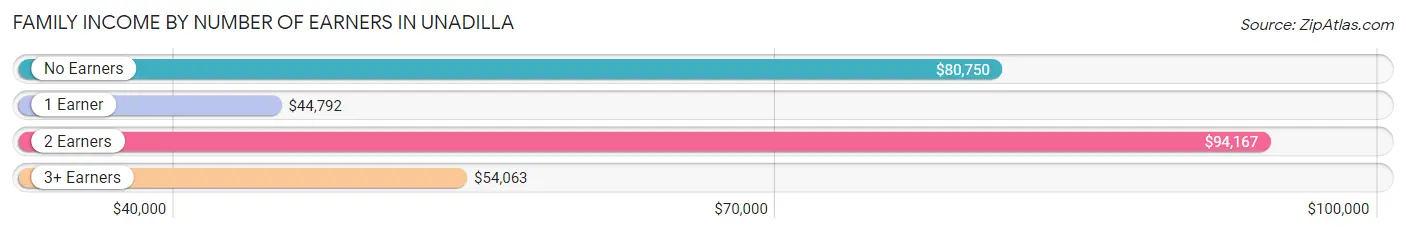
| Number of Earners | # Families | Median Income |
| No Earners | 30 (16.0%) | $80,750 |
| 1 Earner | 76 (40.6%) | $44,792 |
| 2 Earners | 70 (37.4%) | $94,167 |
| 3+ Earners | 11 (5.9%) | $54,063 |
| Total | 187 (100.0%) | $65,809 |
Household Income in Unadilla
Household Income Brackets in Unadilla
With 73 households falling in the category, the $50,000 to $74,999 income range is the most frequent in Unadilla, accounting for 18.0% of all households.
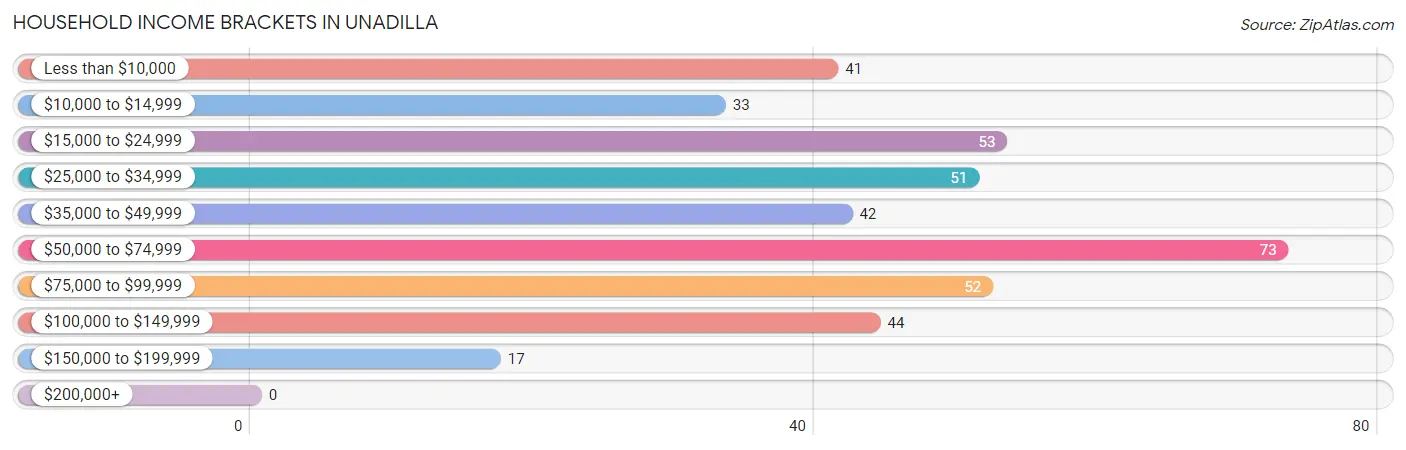
| Income Bracket | # Households | % Households |
| Less than $10,000 | 41 | 10.1% |
| $10,000 to $14,999 | 33 | 8.1% |
| $15,000 to $24,999 | 53 | 13.1% |
| $25,000 to $34,999 | 51 | 12.6% |
| $35,000 to $49,999 | 42 | 10.3% |
| $50,000 to $74,999 | 73 | 18.0% |
| $75,000 to $99,999 | 52 | 12.8% |
| $100,000 to $149,999 | 44 | 10.8% |
| $150,000 to $199,999 | 17 | 4.2% |
| $200,000+ | 0 | 0.0% |
Household Income by Householder Age in Unadilla
The median household income in Unadilla is $42,917, with the highest median household income of $63,750 found in the 25 to 44 years age bracket for the primary householder. A total of 85 households (20.9%) fall into this category. Meanwhile, the 15 to 24 years age bracket for the primary householder has the lowest median household income of $0, with 13 households (3.2%) in this group.

| Income Bracket | # Households | Median Income |
| 15 to 24 Years | 13 (3.2%) | $0 |
| 25 to 44 Years | 85 (20.9%) | $63,750 |
| 45 to 64 Years | 125 (30.8%) | $51,094 |
| 65+ Years | 183 (45.1%) | $41,375 |
| Total | 406 (100.0%) | $42,917 |
Poverty in Unadilla
Income Below Poverty by Sex and Age in Unadilla
With 29.0% poverty level for males and 35.3% for females among the residents of Unadilla, under 5 year old males and 16 and 17 year old females are the most vulnerable to poverty, with 9 males (81.8%) and 9 females (100.0%) in their respective age groups living below the poverty level.
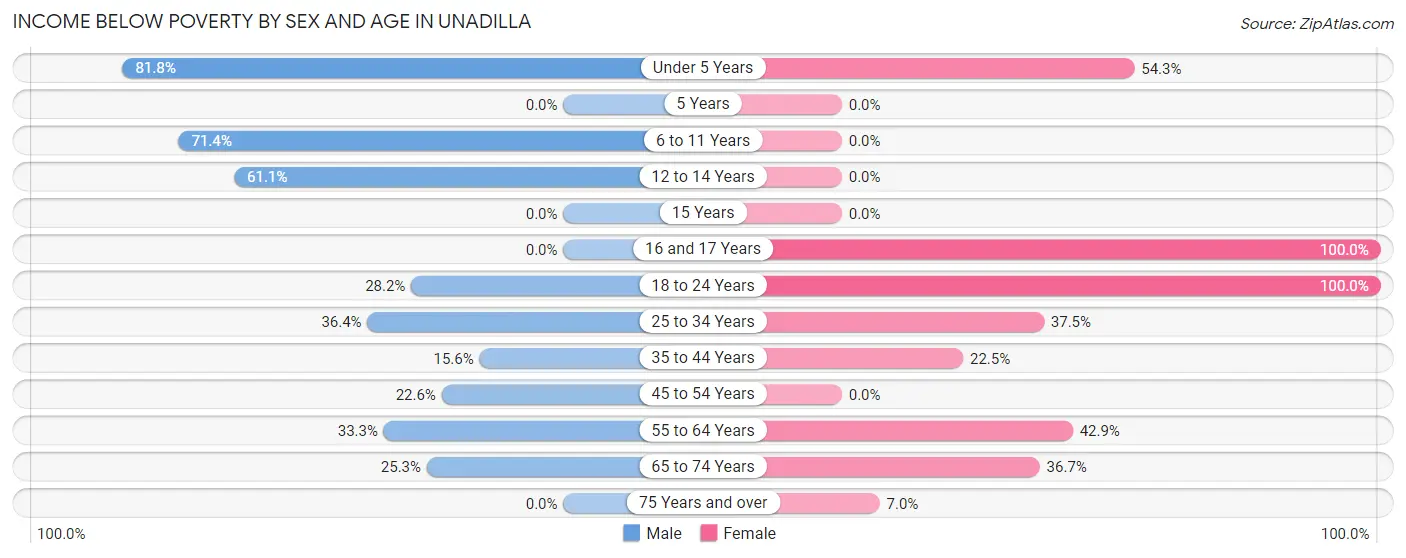
| Age Bracket | Male | Female |
| Under 5 Years | 9 (81.8%) | 19 (54.3%) |
| 5 Years | 0 (0.0%) | 0 (0.0%) |
| 6 to 11 Years | 15 (71.4%) | 0 (0.0%) |
| 12 to 14 Years | 11 (61.1%) | 0 (0.0%) |
| 15 Years | 0 (0.0%) | 0 (0.0%) |
| 16 and 17 Years | 0 (0.0%) | 9 (100.0%) |
| 18 to 24 Years | 24 (28.2%) | 43 (100.0%) |
| 25 to 34 Years | 12 (36.4%) | 27 (37.5%) |
| 35 to 44 Years | 7 (15.6%) | 9 (22.5%) |
| 45 to 54 Years | 7 (22.6%) | 0 (0.0%) |
| 55 to 64 Years | 15 (33.3%) | 42 (42.9%) |
| 65 to 74 Years | 19 (25.3%) | 36 (36.7%) |
| 75 Years and over | 0 (0.0%) | 4 (7.0%) |
| Total | 119 (29.0%) | 189 (35.3%) |
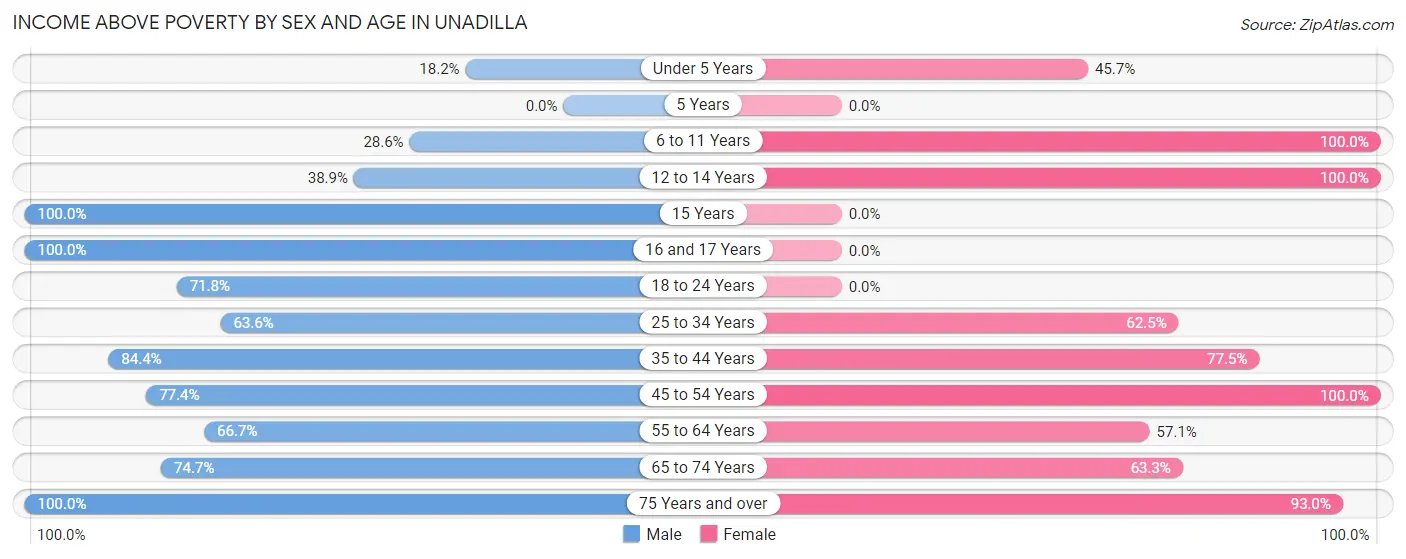
Income Above Poverty by Sex and Age in Unadilla
According to the poverty statistics in Unadilla, males aged 15 years and females aged 6 to 11 years are the age groups that are most secure financially, with 100.0% of males and 100.0% of females in these age groups living above the poverty line.
| Age Bracket | Male | Female |
| Under 5 Years | 2 (18.2%) | 16 (45.7%) |
| 5 Years | 0 (0.0%) | 0 (0.0%) |
| 6 to 11 Years | 6 (28.6%) | 17 (100.0%) |
| 12 to 14 Years | 7 (38.9%) | 12 (100.0%) |
| 15 Years | 7 (100.0%) | 0 (0.0%) |
| 16 and 17 Years | 9 (100.0%) | 0 (0.0%) |
| 18 to 24 Years | 61 (71.8%) | 0 (0.0%) |
| 25 to 34 Years | 21 (63.6%) | 45 (62.5%) |
| 35 to 44 Years | 38 (84.4%) | 31 (77.5%) |
| 45 to 54 Years | 24 (77.4%) | 54 (100.0%) |
| 55 to 64 Years | 30 (66.7%) | 56 (57.1%) |
| 65 to 74 Years | 56 (74.7%) | 62 (63.3%) |
| 75 Years and over | 30 (100.0%) | 53 (93.0%) |
| Total | 291 (71.0%) | 346 (64.7%) |
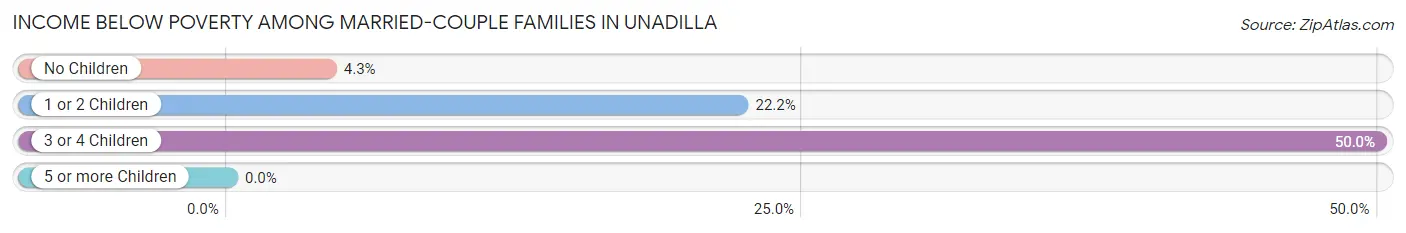
Income Below Poverty Among Married-Couple Families in Unadilla
The poverty statistics for married-couple families in Unadilla show that 12.0% or 15 of the total 125 families live below the poverty line. Families with 3 or 4 children have the highest poverty rate of 50.0%, comprising of 7 families. On the other hand, families with no children have the lowest poverty rate of 4.3%, which includes 4 families.
| Children | Above Poverty | Below Poverty |
| No Children | 89 (95.7%) | 4 (4.3%) |
| 1 or 2 Children | 14 (77.8%) | 4 (22.2%) |
| 3 or 4 Children | 7 (50.0%) | 7 (50.0%) |
| 5 or more Children | 0 (0.0%) | 0 (0.0%) |
| Total | 110 (88.0%) | 15 (12.0%) |
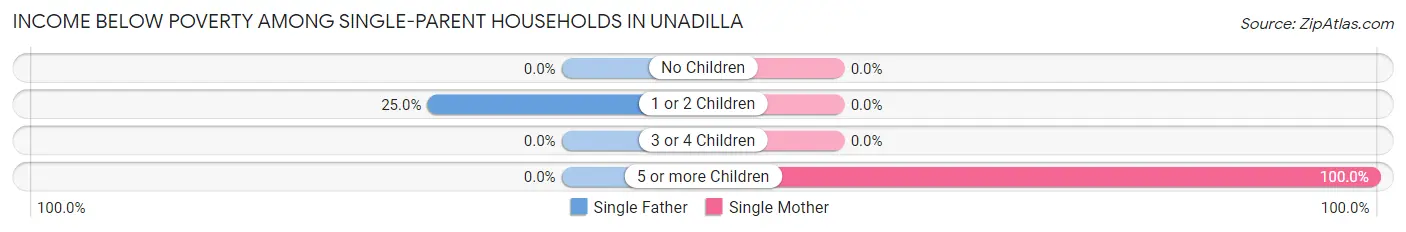
Income Below Poverty Among Single-Parent Households in Unadilla
According to the poverty data in Unadilla, 17.6% or 3 single-father households and 13.3% or 6 single-mother households are living below the poverty line. Among single-father households, those with 1 or 2 children have the highest poverty rate, with 3 households (25.0%) experiencing poverty. Likewise, among single-mother households, those with 5 or more children have the highest poverty rate, with 6 households (100.0%) falling below the poverty line.
| Children | Single Father | Single Mother |
| No Children | 0 (0.0%) | 0 (0.0%) |
| 1 or 2 Children | 3 (25.0%) | 0 (0.0%) |
| 3 or 4 Children | 0 (0.0%) | 0 (0.0%) |
| 5 or more Children | 0 (0.0%) | 6 (100.0%) |
| Total | 3 (17.6%) | 6 (13.3%) |
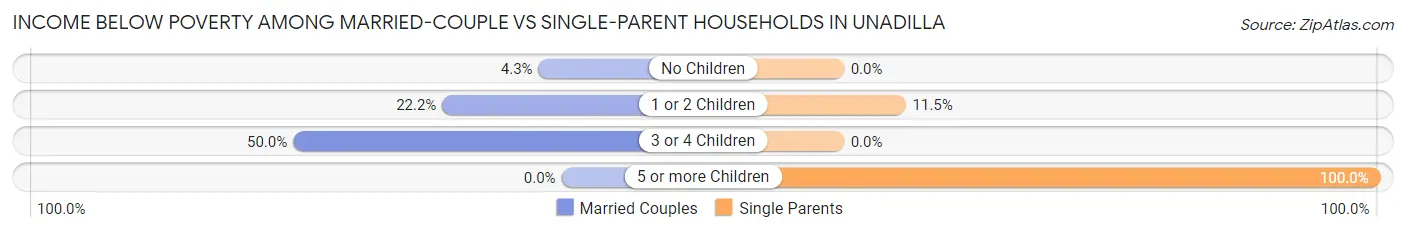
Income Below Poverty Among Married-Couple vs Single-Parent Households in Unadilla
The poverty data for Unadilla shows that 15 of the married-couple family households (12.0%) and 9 of the single-parent households (14.5%) are living below the poverty level. Within the married-couple family households, those with 3 or 4 children have the highest poverty rate, with 7 households (50.0%) falling below the poverty line. Among the single-parent households, those with 5 or more children have the highest poverty rate, with 6 household (100.0%) living below poverty.
| Children | Married-Couple Families | Single-Parent Households |
| No Children | 4 (4.3%) | 0 (0.0%) |
| 1 or 2 Children | 4 (22.2%) | 3 (11.5%) |
| 3 or 4 Children | 7 (50.0%) | 0 (0.0%) |
| 5 or more Children | 0 (0.0%) | 6 (100.0%) |
| Total | 15 (12.0%) | 9 (14.5%) |
Employment Characteristics in Unadilla
Employment by Class of Employer in Unadilla
Among the 439 employed individuals in Unadilla, private company employees (264 | 60.1%), not-for-profit organizations (54 | 12.3%), and local government employees (54 | 12.3%) make up the most common classes of employment.
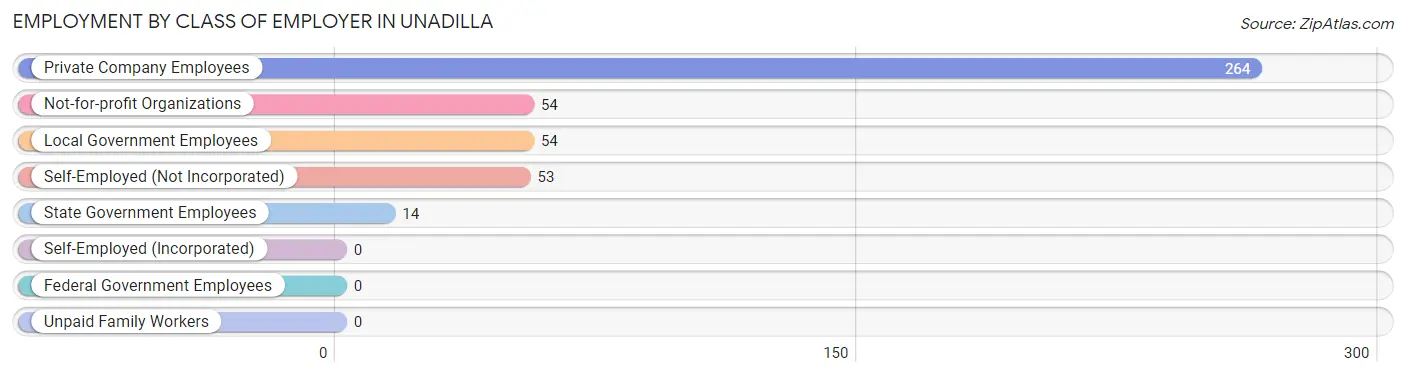
| Employer Class | # Employees | % Employees |
| Private Company Employees | 264 | 60.1% |
| Self-Employed (Incorporated) | 0 | 0.0% |
| Self-Employed (Not Incorporated) | 53 | 12.1% |
| Not-for-profit Organizations | 54 | 12.3% |
| Local Government Employees | 54 | 12.3% |
| State Government Employees | 14 | 3.2% |
| Federal Government Employees | 0 | 0.0% |
| Unpaid Family Workers | 0 | 0.0% |
| Total | 439 | 100.0% |
Employment Status by Age in Unadilla
According to the labor force statistics for Unadilla, out of the total population over 16 years of age (824), 58.9% or 485 individuals are in the labor force, with 7.0% or 34 of them unemployed. The age group with the highest labor force participation rate is 30 to 34 years, with 100.0% or 48 individuals in the labor force. Within the labor force, the 25 to 29 years age range has the highest percentage of unemployed individuals, with 22.6% or 12 of them being unemployed.
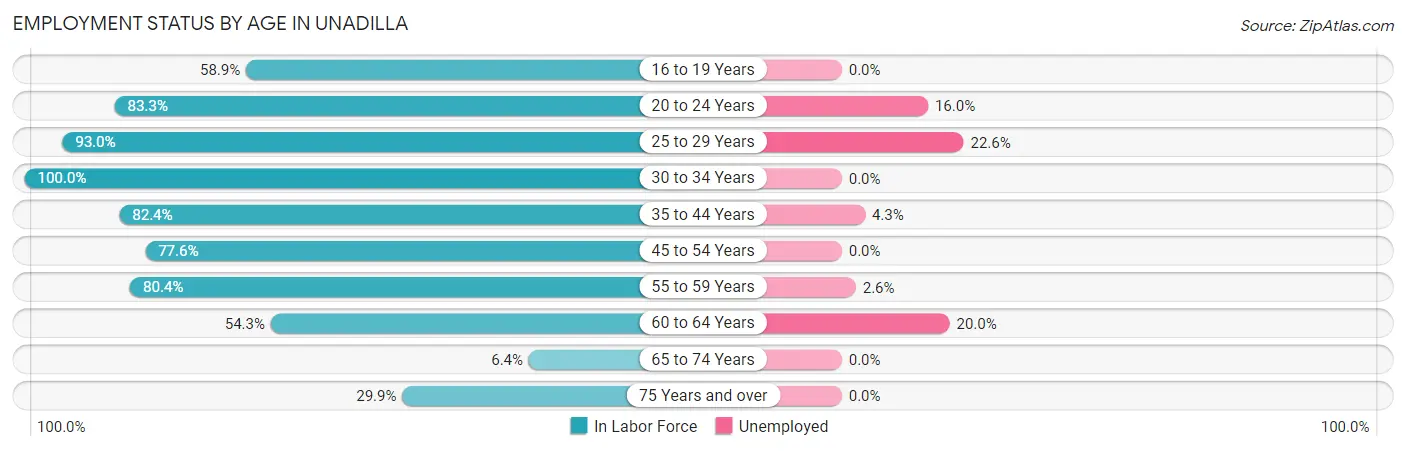
| Age Bracket | In Labor Force | Unemployed |
| 16 to 19 Years | 33 (58.9%) | 0 (0.0%) |
| 20 to 24 Years | 75 (83.3%) | 12 (16.0%) |
| 25 to 29 Years | 53 (93.0%) | 12 (22.6%) |
| 30 to 34 Years | 48 (100.0%) | 0 (0.0%) |
| 35 to 44 Years | 70 (82.4%) | 3 (4.3%) |
| 45 to 54 Years | 66 (77.6%) | 0 (0.0%) |
| 55 to 59 Years | 78 (80.4%) | 2 (2.6%) |
| 60 to 64 Years | 25 (54.3%) | 5 (20.0%) |
| 65 to 74 Years | 11 (6.4%) | 0 (0.0%) |
| 75 Years and over | 26 (29.9%) | 0 (0.0%) |
| Total | 485 (58.9%) | 34 (7.0%) |
Employment Status by Educational Attainment in Unadilla
According to labor force statistics for Unadilla, 81.3% of individuals (340) out of the total population between 25 and 64 years of age (418) are in the labor force, with 6.5% or 22 of them being unemployed. The group with the highest labor force participation rate are those with the educational attainment of bachelor's degree or higher, with 100.0% or 125 individuals in the labor force. Within the labor force, individuals with less than high school education have the highest percentage of unemployment, with 66.7% or 14 of them being unemployed.
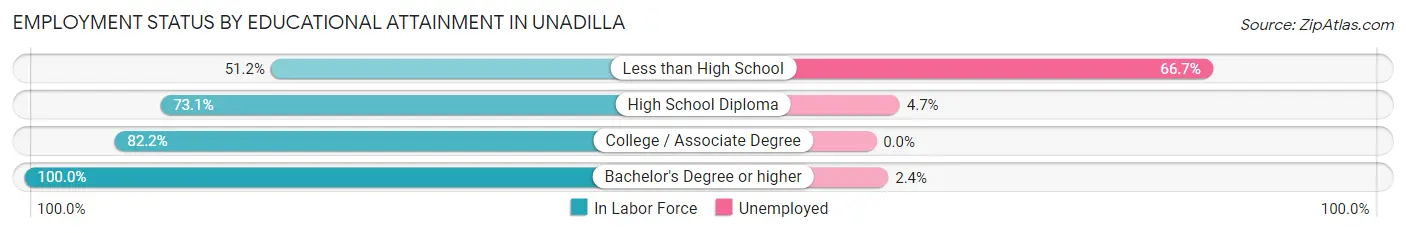
| Educational Attainment | In Labor Force | Unemployed |
| Less than High School | 21 (51.2%) | 27 (66.7%) |
| High School Diploma | 106 (73.1%) | 7 (4.7%) |
| College / Associate Degree | 88 (82.2%) | 0 (0.0%) |
| Bachelor's Degree or higher | 125 (100.0%) | 3 (2.4%) |
| Total | 340 (81.3%) | 27 (6.5%) |
Employment Occupations by Sex in Unadilla
Management, Business, Science and Arts Occupations
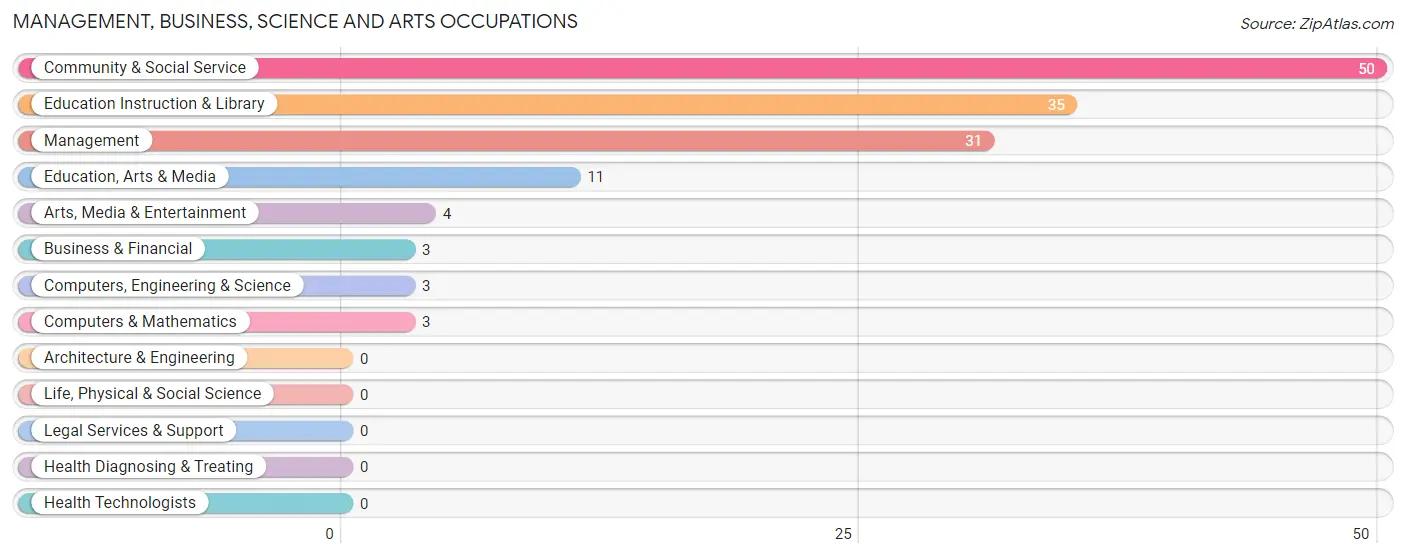
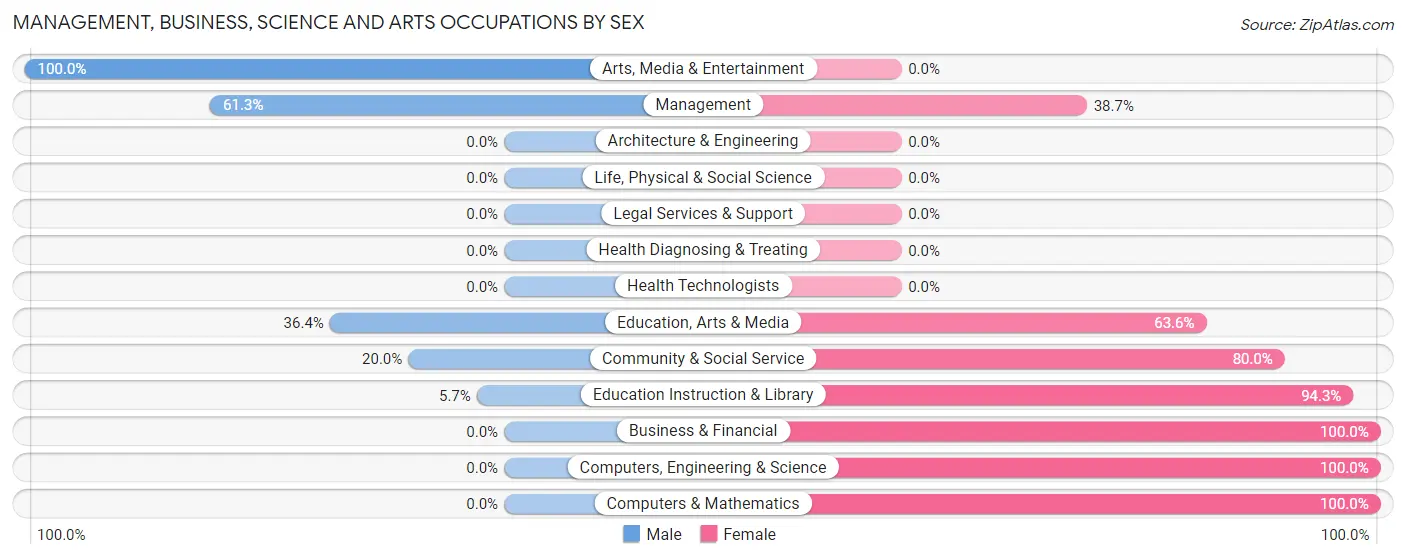
The most common Management, Business, Science and Arts occupations in Unadilla are Community & Social Service (50 | 11.1%), Education Instruction & Library (35 | 7.8%), Management (31 | 6.9%), Education, Arts & Media (11 | 2.4%), and Arts, Media & Entertainment (4 | 0.9%).
Management, Business, Science and Arts Occupations by Sex
Within the Management, Business, Science and Arts occupations in Unadilla, the most male-oriented occupations are Arts, Media & Entertainment (100.0%), Management (61.3%), and Education, Arts & Media (36.4%), while the most female-oriented occupations are Business & Financial (100.0%), Computers, Engineering & Science (100.0%), and Computers & Mathematics (100.0%).
| Occupation | Male | Female |
| Management | 19 (61.3%) | 12 (38.7%) |
| Business & Financial | 0 (0.0%) | 3 (100.0%) |
| Computers, Engineering & Science | 0 (0.0%) | 3 (100.0%) |
| Computers & Mathematics | 0 (0.0%) | 3 (100.0%) |
| Architecture & Engineering | 0 (0.0%) | 0 (0.0%) |
| Life, Physical & Social Science | 0 (0.0%) | 0 (0.0%) |
| Community & Social Service | 10 (20.0%) | 40 (80.0%) |
| Education, Arts & Media | 4 (36.4%) | 7 (63.6%) |
| Legal Services & Support | 0 (0.0%) | 0 (0.0%) |
| Education Instruction & Library | 2 (5.7%) | 33 (94.3%) |
| Arts, Media & Entertainment | 4 (100.0%) | 0 (0.0%) |
| Health Diagnosing & Treating | 0 (0.0%) | 0 (0.0%) |
| Health Technologists | 0 (0.0%) | 0 (0.0%) |
| Total (Category) | 29 (33.3%) | 58 (66.7%) |
| Total (Overall) | 178 (39.5%) | 273 (60.5%) |
Services Occupations
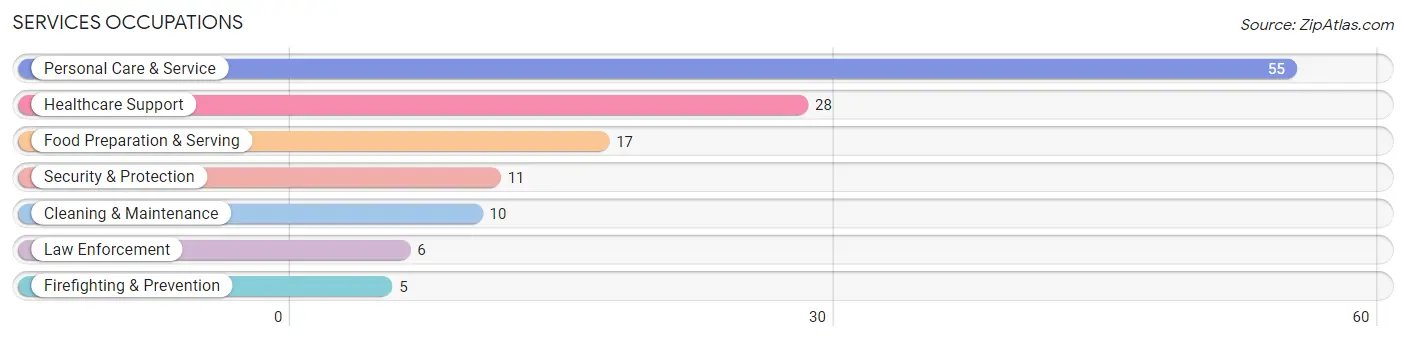
The most common Services occupations in Unadilla are Personal Care & Service (55 | 12.2%), Healthcare Support (28 | 6.2%), Food Preparation & Serving (17 | 3.8%), Security & Protection (11 | 2.4%), and Cleaning & Maintenance (10 | 2.2%).
Services Occupations by Sex
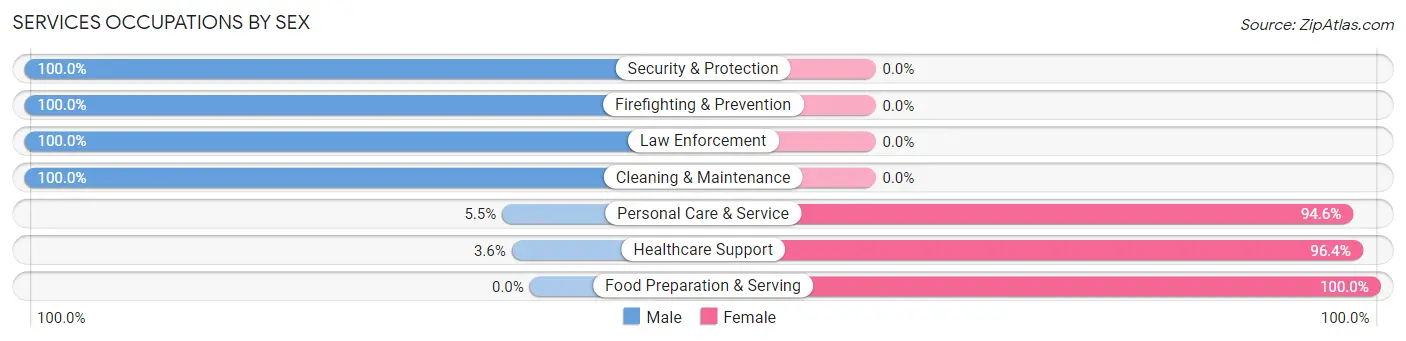
Within the Services occupations in Unadilla, the most male-oriented occupations are Security & Protection (100.0%), Firefighting & Prevention (100.0%), and Law Enforcement (100.0%), while the most female-oriented occupations are Food Preparation & Serving (100.0%), Healthcare Support (96.4%), and Personal Care & Service (94.6%).
| Occupation | Male | Female |
| Healthcare Support | 1 (3.6%) | 27 (96.4%) |
| Security & Protection | 11 (100.0%) | 0 (0.0%) |
| Firefighting & Prevention | 5 (100.0%) | 0 (0.0%) |
| Law Enforcement | 6 (100.0%) | 0 (0.0%) |
| Food Preparation & Serving | 0 (0.0%) | 17 (100.0%) |
| Cleaning & Maintenance | 10 (100.0%) | 0 (0.0%) |
| Personal Care & Service | 3 (5.4%) | 52 (94.6%) |
| Total (Category) | 25 (20.7%) | 96 (79.3%) |
| Total (Overall) | 178 (39.5%) | 273 (60.5%) |
Sales and Office Occupations
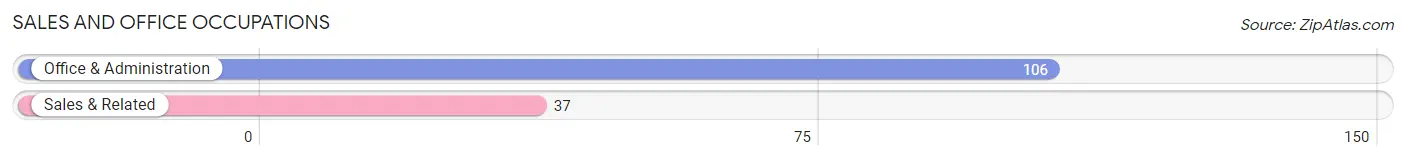
The most common Sales and Office occupations in Unadilla are Office & Administration (106 | 23.5%), and Sales & Related (37 | 8.2%).
Sales and Office Occupations by Sex
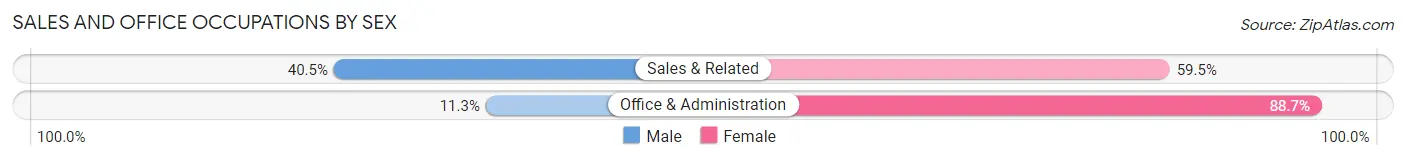
| Occupation | Male | Female |
| Sales & Related | 15 (40.5%) | 22 (59.5%) |
| Office & Administration | 12 (11.3%) | 94 (88.7%) |
| Total (Category) | 27 (18.9%) | 116 (81.1%) |
| Total (Overall) | 178 (39.5%) | 273 (60.5%) |
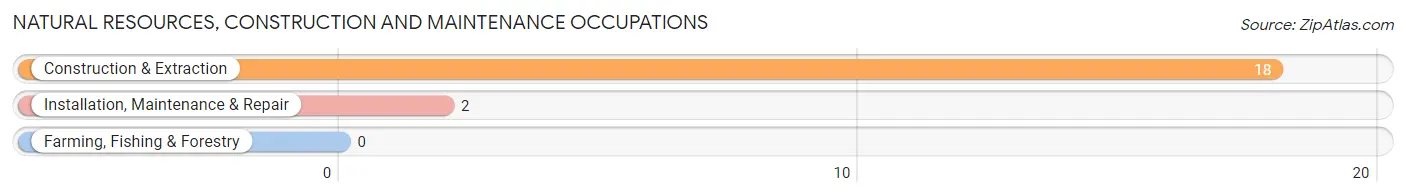
Natural Resources, Construction and Maintenance Occupations
The most common Natural Resources, Construction and Maintenance occupations in Unadilla are Construction & Extraction (18 | 4.0%), and Installation, Maintenance & Repair (2 | 0.4%).
Natural Resources, Construction and Maintenance Occupations by Sex
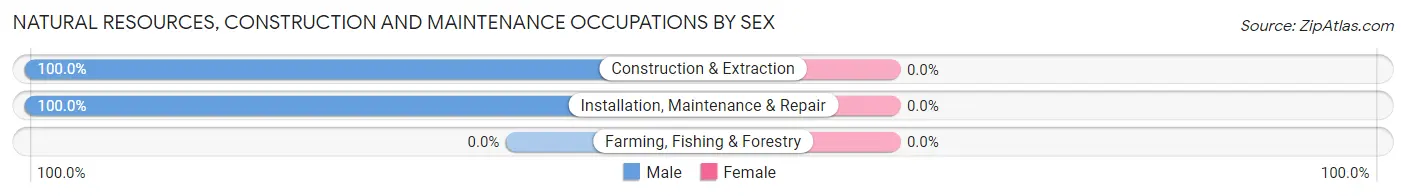
| Occupation | Male | Female |
| Farming, Fishing & Forestry | 0 (0.0%) | 0 (0.0%) |
| Construction & Extraction | 18 (100.0%) | 0 (0.0%) |
| Installation, Maintenance & Repair | 2 (100.0%) | 0 (0.0%) |
| Total (Category) | 20 (100.0%) | 0 (0.0%) |
| Total (Overall) | 178 (39.5%) | 273 (60.5%) |
Production, Transportation and Moving Occupations
The most common Production, Transportation and Moving occupations in Unadilla are Material Moving (43 | 9.5%), Transportation (25 | 5.5%), and Production (12 | 2.7%).
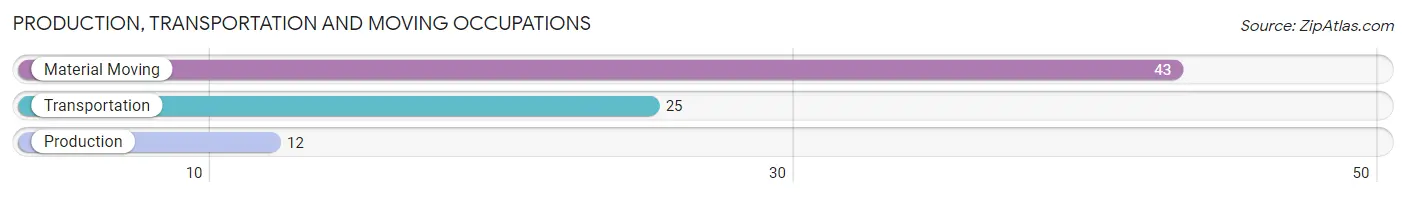
Production, Transportation and Moving Occupations by Sex
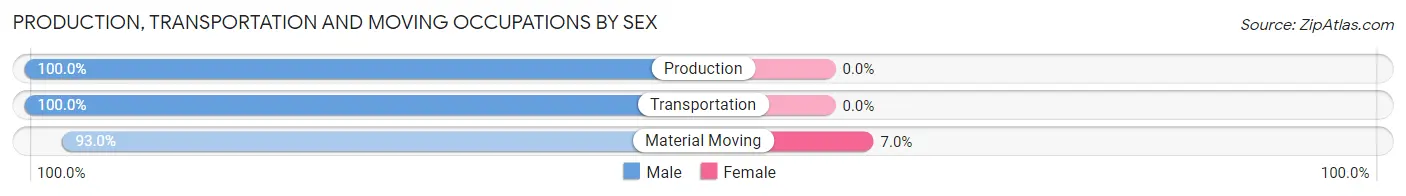
| Occupation | Male | Female |
| Production | 12 (100.0%) | 0 (0.0%) |
| Transportation | 25 (100.0%) | 0 (0.0%) |
| Material Moving | 40 (93.0%) | 3 (7.0%) |
| Total (Category) | 77 (96.3%) | 3 (3.7%) |
| Total (Overall) | 178 (39.5%) | 273 (60.5%) |
Employment Industries by Sex in Unadilla
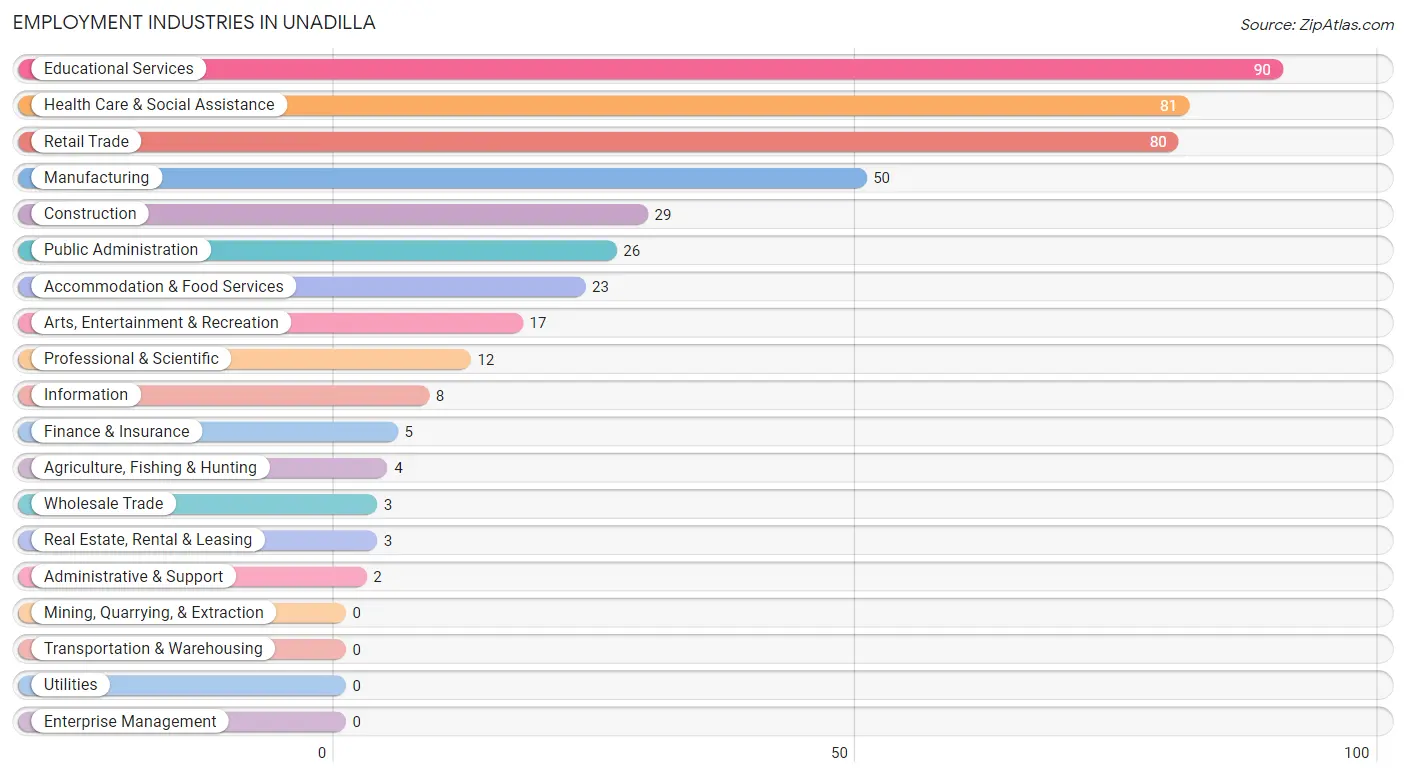
Employment Industries in Unadilla
The major employment industries in Unadilla include Educational Services (90 | 20.0%), Health Care & Social Assistance (81 | 18.0%), Retail Trade (80 | 17.7%), Manufacturing (50 | 11.1%), and Construction (29 | 6.4%).
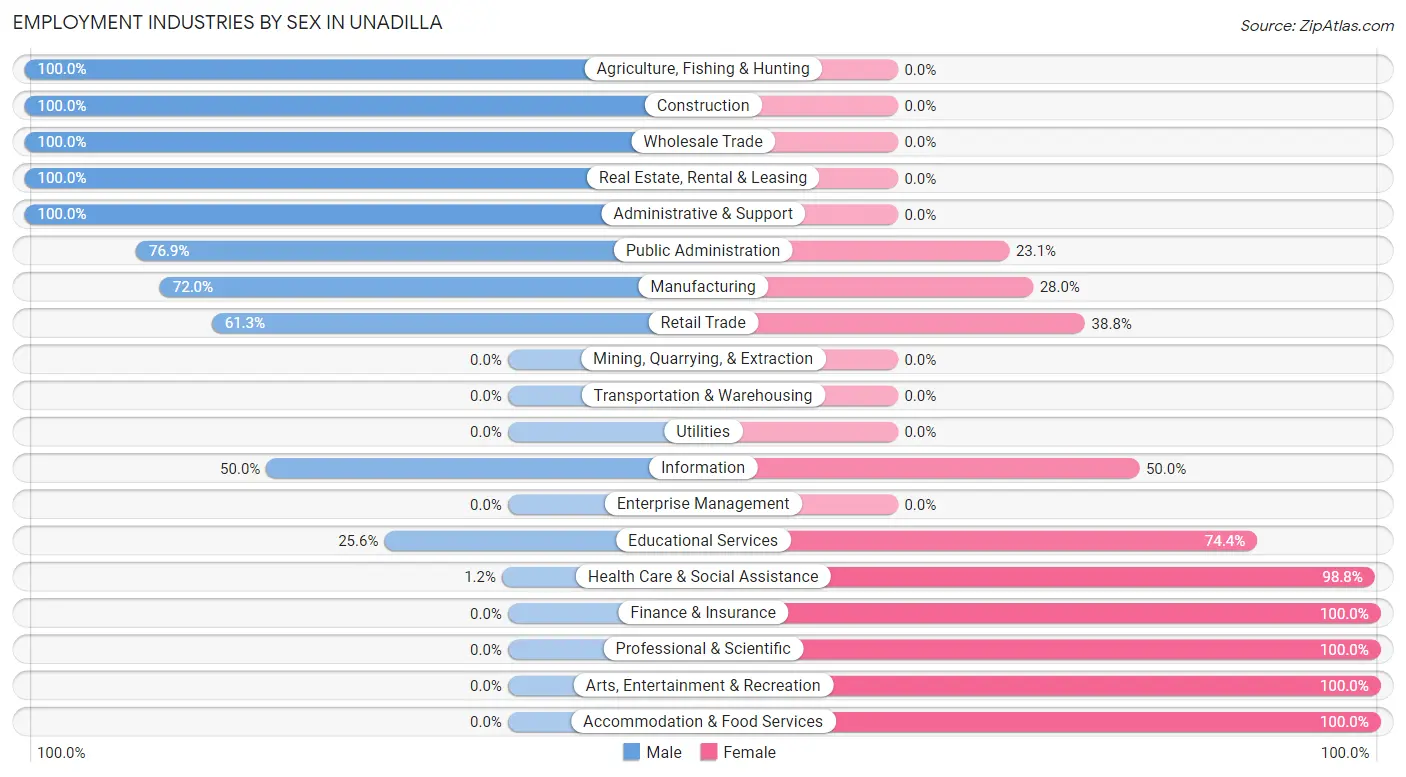
Employment Industries by Sex in Unadilla
The Unadilla industries that see more men than women are Agriculture, Fishing & Hunting (100.0%), Construction (100.0%), and Wholesale Trade (100.0%), whereas the industries that tend to have a higher number of women are Finance & Insurance (100.0%), Professional & Scientific (100.0%), and Arts, Entertainment & Recreation (100.0%).
| Industry | Male | Female |
| Agriculture, Fishing & Hunting | 4 (100.0%) | 0 (0.0%) |
| Mining, Quarrying, & Extraction | 0 (0.0%) | 0 (0.0%) |
| Construction | 29 (100.0%) | 0 (0.0%) |
| Manufacturing | 36 (72.0%) | 14 (28.0%) |
| Wholesale Trade | 3 (100.0%) | 0 (0.0%) |
| Retail Trade | 49 (61.3%) | 31 (38.8%) |
| Transportation & Warehousing | 0 (0.0%) | 0 (0.0%) |
| Utilities | 0 (0.0%) | 0 (0.0%) |
| Information | 4 (50.0%) | 4 (50.0%) |
| Finance & Insurance | 0 (0.0%) | 5 (100.0%) |
| Real Estate, Rental & Leasing | 3 (100.0%) | 0 (0.0%) |
| Professional & Scientific | 0 (0.0%) | 12 (100.0%) |
| Enterprise Management | 0 (0.0%) | 0 (0.0%) |
| Administrative & Support | 2 (100.0%) | 0 (0.0%) |
| Educational Services | 23 (25.6%) | 67 (74.4%) |
| Health Care & Social Assistance | 1 (1.2%) | 80 (98.8%) |
| Arts, Entertainment & Recreation | 0 (0.0%) | 17 (100.0%) |
| Accommodation & Food Services | 0 (0.0%) | 23 (100.0%) |
| Public Administration | 20 (76.9%) | 6 (23.1%) |
| Total | 178 (39.5%) | 273 (60.5%) |
Education in Unadilla
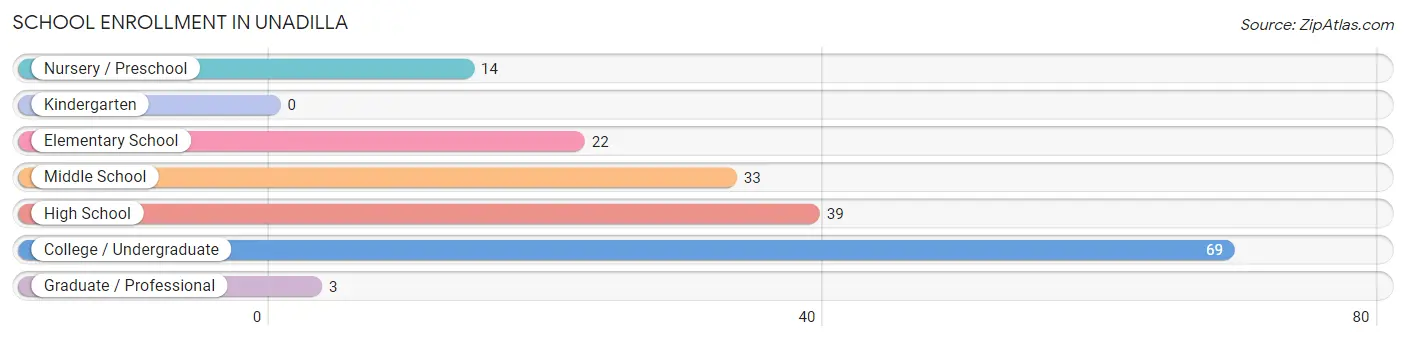
School Enrollment in Unadilla
The most common levels of schooling among the 180 students in Unadilla are college / undergraduate (69 | 38.3%), high school (39 | 21.7%), and middle school (33 | 18.3%).
| School Level | # Students | % Students |
| Nursery / Preschool | 14 | 7.8% |
| Kindergarten | 0 | 0.0% |
| Elementary School | 22 | 12.2% |
| Middle School | 33 | 18.3% |
| High School | 39 | 21.7% |
| College / Undergraduate | 69 | 38.3% |
| Graduate / Professional | 3 | 1.7% |
| Total | 180 | 100.0% |
School Enrollment by Age by Funding Source in Unadilla
Out of a total of 180 students who are enrolled in schools in Unadilla, 26 (14.4%) attend a private institution, while the remaining 154 (85.6%) are enrolled in public schools. The age group of 25 to 34 year olds has the highest likelihood of being enrolled in private schools, with 3 (100.0% in the age bracket) enrolled. Conversely, the age group of 3 to 4 year olds has the lowest likelihood of being enrolled in a private school, with 14 (100.0% in the age bracket) attending a public institution.
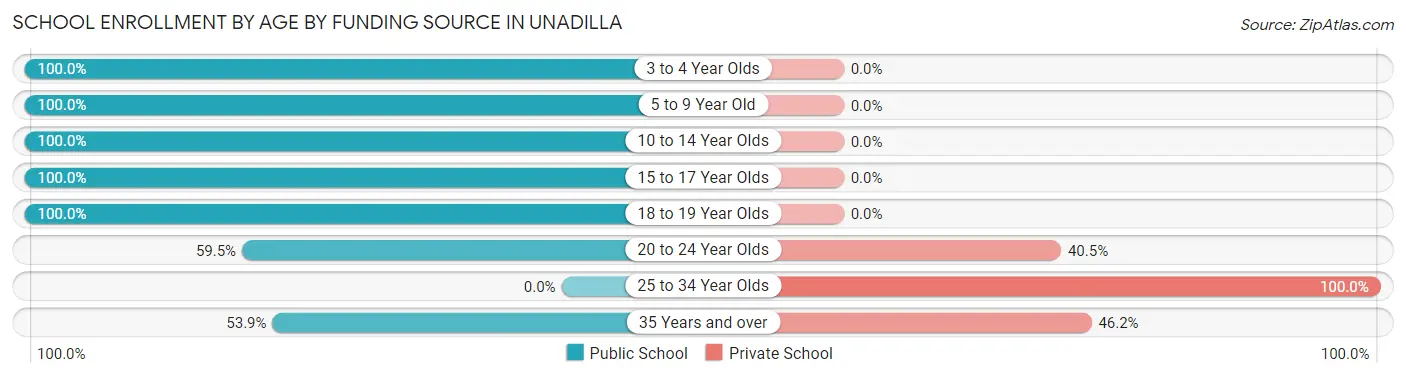
| Age Bracket | Public School | Private School |
| 3 to 4 Year Olds | 14 (100.0%) | 0 (0.0%) |
| 5 to 9 Year Old | 16 (100.0%) | 0 (0.0%) |
| 10 to 14 Year Olds | 44 (100.0%) | 0 (0.0%) |
| 15 to 17 Year Olds | 25 (100.0%) | 0 (0.0%) |
| 18 to 19 Year Olds | 23 (100.0%) | 0 (0.0%) |
| 20 to 24 Year Olds | 25 (59.5%) | 17 (40.5%) |
| 25 to 34 Year Olds | 0 (0.0%) | 3 (100.0%) |
| 35 Years and over | 7 (53.8%) | 6 (46.2%) |
| Total | 154 (85.6%) | 26 (14.4%) |
Educational Attainment by Field of Study in Unadilla
Science & technology (38 | 16.9%), multidisciplinary studies (31 | 13.8%), education (28 | 12.4%), arts & humanities (28 | 12.4%), and bio, nature & agricultural (25 | 11.1%) are the most common fields of study among 225 individuals in Unadilla who have obtained a bachelor's degree or higher.
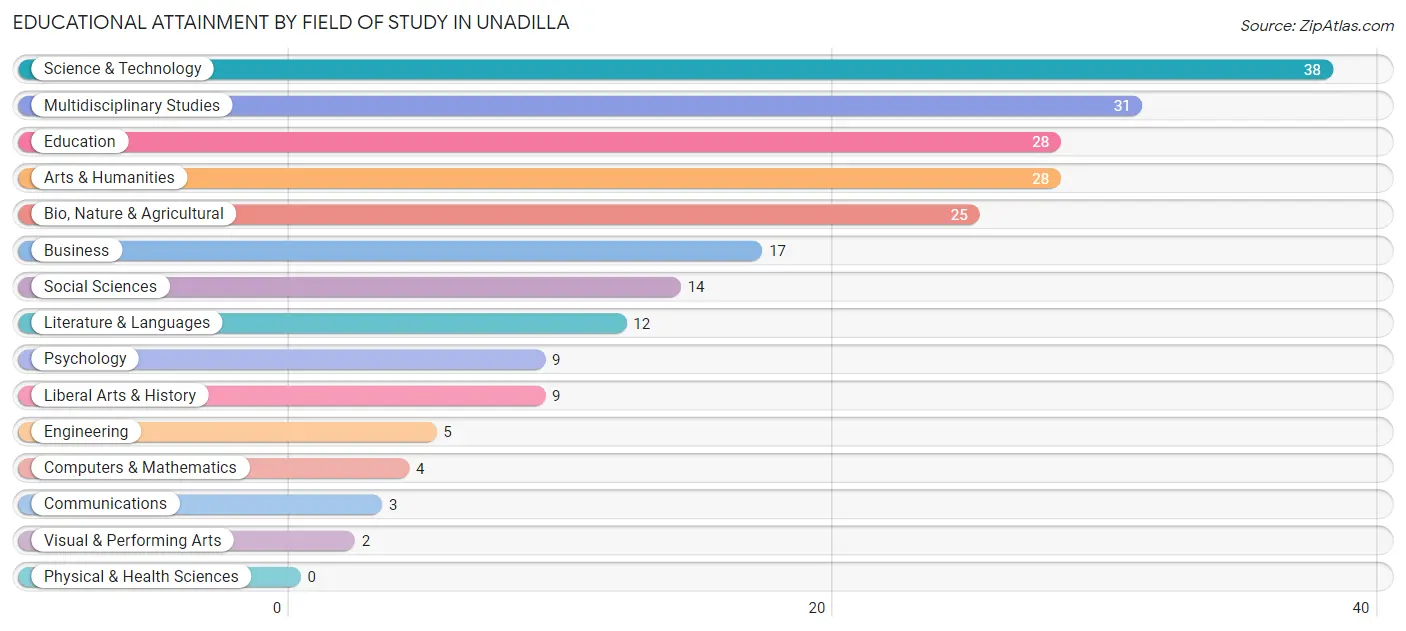
| Field of Study | # Graduates | % Graduates |
| Computers & Mathematics | 4 | 1.8% |
| Bio, Nature & Agricultural | 25 | 11.1% |
| Physical & Health Sciences | 0 | 0.0% |
| Psychology | 9 | 4.0% |
| Social Sciences | 14 | 6.2% |
| Engineering | 5 | 2.2% |
| Multidisciplinary Studies | 31 | 13.8% |
| Science & Technology | 38 | 16.9% |
| Business | 17 | 7.6% |
| Education | 28 | 12.4% |
| Literature & Languages | 12 | 5.3% |
| Liberal Arts & History | 9 | 4.0% |
| Visual & Performing Arts | 2 | 0.9% |
| Communications | 3 | 1.3% |
| Arts & Humanities | 28 | 12.4% |
| Total | 225 | 100.0% |
Transportation & Commute in Unadilla
Vehicle Availability by Sex in Unadilla
The most prevalent vehicle ownership categories in Unadilla are males with 2 vehicles (93, accounting for 56.0%) and females with 2 vehicles (111, making up 34.1%).
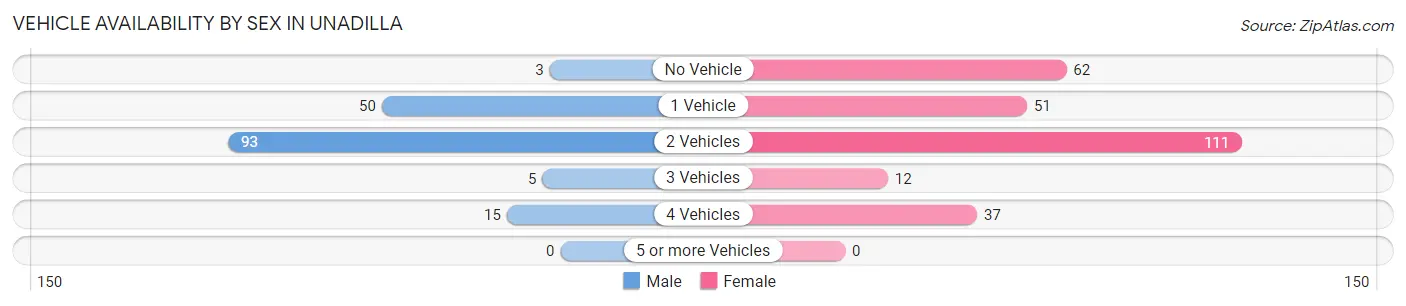
| Vehicles Available | Male | Female |
| No Vehicle | 3 (1.8%) | 62 (22.7%) |
| 1 Vehicle | 50 (30.1%) | 51 (18.7%) |
| 2 Vehicles | 93 (56.0%) | 111 (40.7%) |
| 3 Vehicles | 5 (3.0%) | 12 (4.4%) |
| 4 Vehicles | 15 (9.0%) | 37 (13.6%) |
| 5 or more Vehicles | 0 (0.0%) | 0 (0.0%) |
| Total | 166 (100.0%) | 273 (100.0%) |
Commute Time in Unadilla
The most frequently occuring commute durations in Unadilla are 20 to 24 minutes (84 commuters, 21.8%), 15 to 19 minutes (66 commuters, 17.1%), and 10 to 14 minutes (62 commuters, 16.1%).
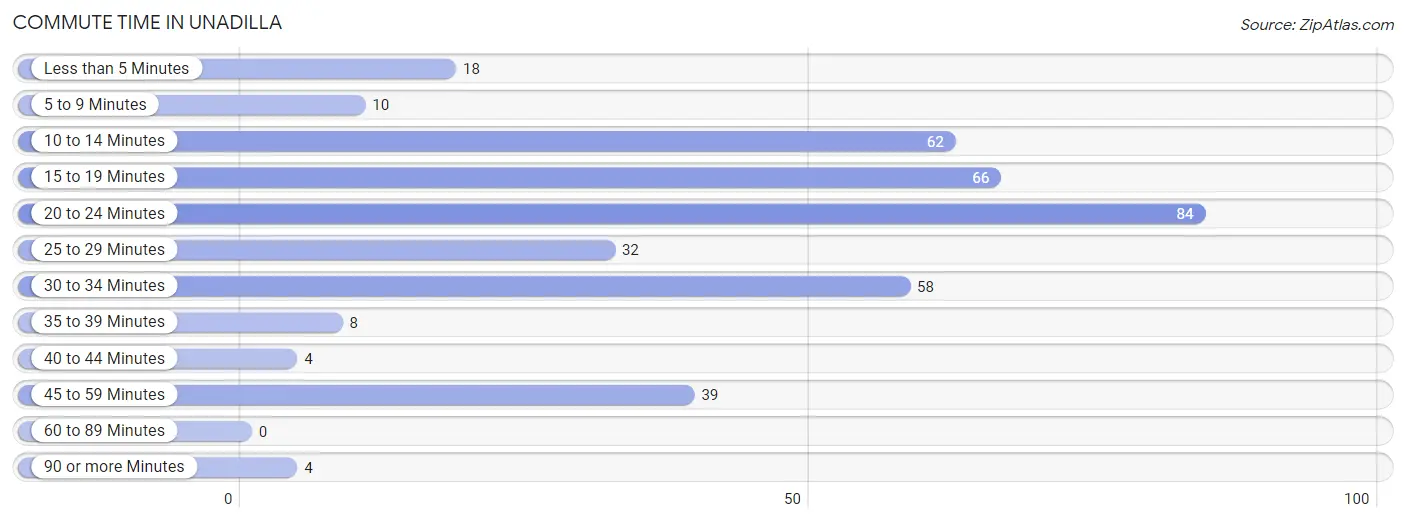
| Commute Time | # Commuters | % Commuters |
| Less than 5 Minutes | 18 | 4.7% |
| 5 to 9 Minutes | 10 | 2.6% |
| 10 to 14 Minutes | 62 | 16.1% |
| 15 to 19 Minutes | 66 | 17.1% |
| 20 to 24 Minutes | 84 | 21.8% |
| 25 to 29 Minutes | 32 | 8.3% |
| 30 to 34 Minutes | 58 | 15.1% |
| 35 to 39 Minutes | 8 | 2.1% |
| 40 to 44 Minutes | 4 | 1.0% |
| 45 to 59 Minutes | 39 | 10.1% |
| 60 to 89 Minutes | 0 | 0.0% |
| 90 or more Minutes | 4 | 1.0% |
Commute Time by Sex in Unadilla
The most common commute times in Unadilla are 10 to 14 minutes (43 commuters, 29.0%) for males and 15 to 19 minutes (66 commuters, 27.9%) for females.
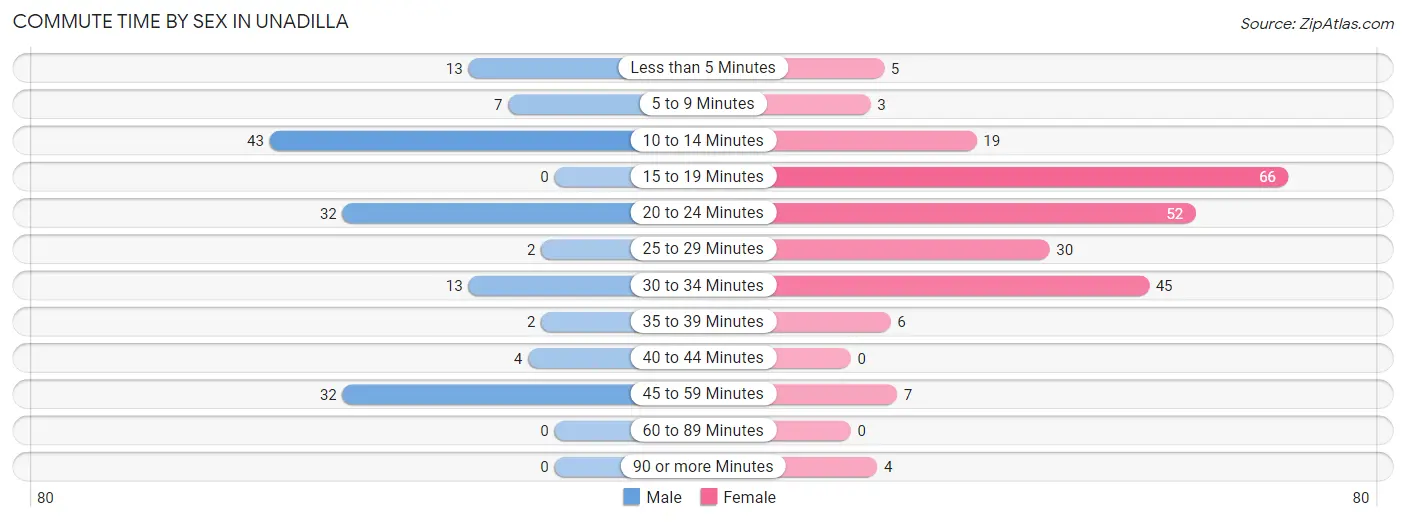
| Commute Time | Male | Female |
| Less than 5 Minutes | 13 (8.8%) | 5 (2.1%) |
| 5 to 9 Minutes | 7 (4.7%) | 3 (1.3%) |
| 10 to 14 Minutes | 43 (29.0%) | 19 (8.0%) |
| 15 to 19 Minutes | 0 (0.0%) | 66 (27.9%) |
| 20 to 24 Minutes | 32 (21.6%) | 52 (21.9%) |
| 25 to 29 Minutes | 2 (1.3%) | 30 (12.7%) |
| 30 to 34 Minutes | 13 (8.8%) | 45 (19.0%) |
| 35 to 39 Minutes | 2 (1.3%) | 6 (2.5%) |
| 40 to 44 Minutes | 4 (2.7%) | 0 (0.0%) |
| 45 to 59 Minutes | 32 (21.6%) | 7 (2.9%) |
| 60 to 89 Minutes | 0 (0.0%) | 0 (0.0%) |
| 90 or more Minutes | 0 (0.0%) | 4 (1.7%) |
Time of Departure to Work by Sex in Unadilla
The most frequent times of departure to work in Unadilla are 12:00 PM to 3:59 PM (38, 25.7%) for males and 8:30 AM to 8:59 AM (38, 16.0%) for females.
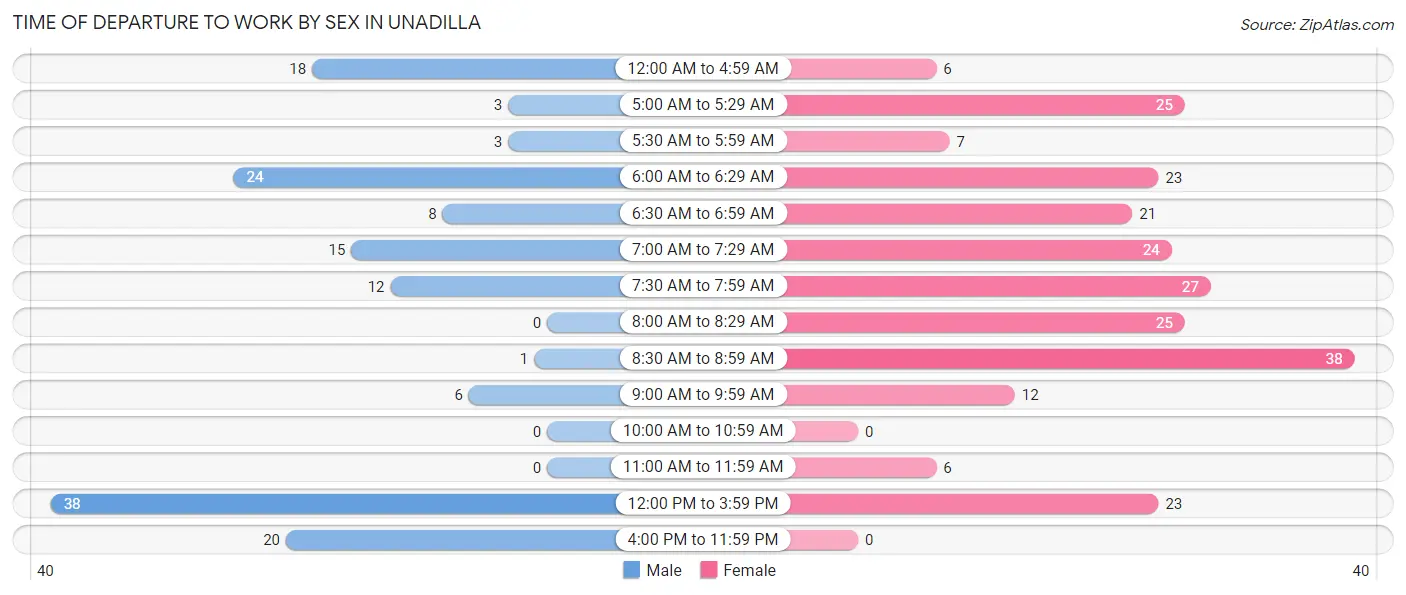
| Time of Departure | Male | Female |
| 12:00 AM to 4:59 AM | 18 (12.2%) | 6 (2.5%) |
| 5:00 AM to 5:29 AM | 3 (2.0%) | 25 (10.5%) |
| 5:30 AM to 5:59 AM | 3 (2.0%) | 7 (2.9%) |
| 6:00 AM to 6:29 AM | 24 (16.2%) | 23 (9.7%) |
| 6:30 AM to 6:59 AM | 8 (5.4%) | 21 (8.9%) |
| 7:00 AM to 7:29 AM | 15 (10.1%) | 24 (10.1%) |
| 7:30 AM to 7:59 AM | 12 (8.1%) | 27 (11.4%) |
| 8:00 AM to 8:29 AM | 0 (0.0%) | 25 (10.5%) |
| 8:30 AM to 8:59 AM | 1 (0.7%) | 38 (16.0%) |
| 9:00 AM to 9:59 AM | 6 (4.1%) | 12 (5.1%) |
| 10:00 AM to 10:59 AM | 0 (0.0%) | 0 (0.0%) |
| 11:00 AM to 11:59 AM | 0 (0.0%) | 6 (2.5%) |
| 12:00 PM to 3:59 PM | 38 (25.7%) | 23 (9.7%) |
| 4:00 PM to 11:59 PM | 20 (13.5%) | 0 (0.0%) |
| Total | 148 (100.0%) | 237 (100.0%) |
Housing Occupancy in Unadilla
Occupancy by Ownership in Unadilla
Of the total 406 dwellings in Unadilla, owner-occupied units account for 263 (64.8%), while renter-occupied units make up 143 (35.2%).
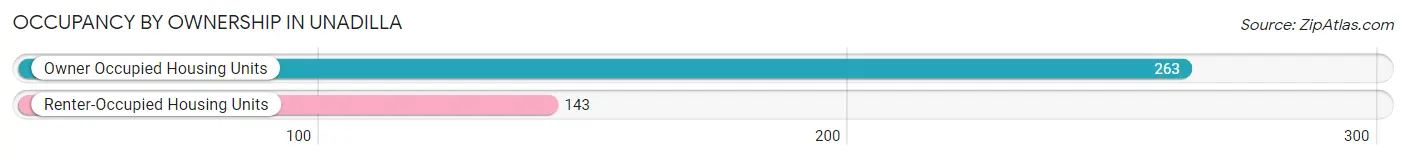
| Occupancy | # Housing Units | % Housing Units |
| Owner Occupied Housing Units | 263 | 64.8% |
| Renter-Occupied Housing Units | 143 | 35.2% |
| Total Occupied Housing Units | 406 | 100.0% |
Occupancy by Household Size in Unadilla
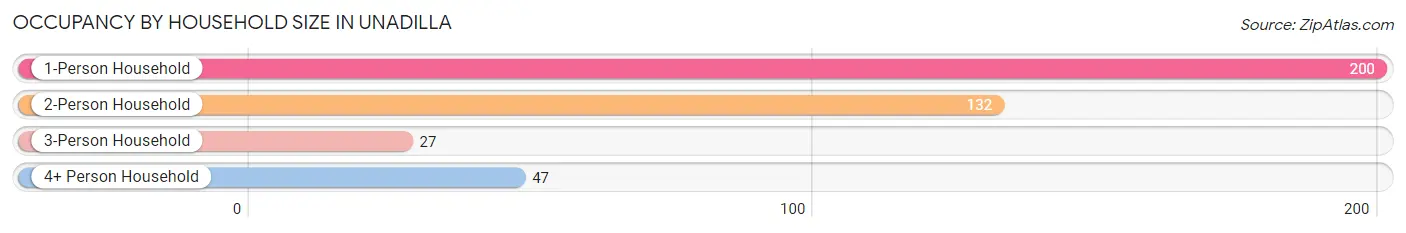
| Household Size | # Housing Units | % Housing Units |
| 1-Person Household | 200 | 49.3% |
| 2-Person Household | 132 | 32.5% |
| 3-Person Household | 27 | 6.7% |
| 4+ Person Household | 47 | 11.6% |
| Total Housing Units | 406 | 100.0% |
Occupancy by Ownership by Household Size in Unadilla
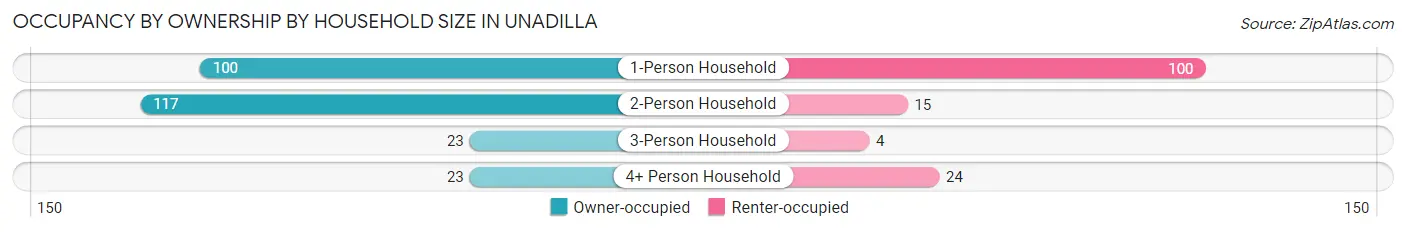
| Household Size | Owner-occupied | Renter-occupied |
| 1-Person Household | 100 (50.0%) | 100 (50.0%) |
| 2-Person Household | 117 (88.6%) | 15 (11.4%) |
| 3-Person Household | 23 (85.2%) | 4 (14.8%) |
| 4+ Person Household | 23 (48.9%) | 24 (51.1%) |
| Total Housing Units | 263 (64.8%) | 143 (35.2%) |
Occupancy by Educational Attainment in Unadilla
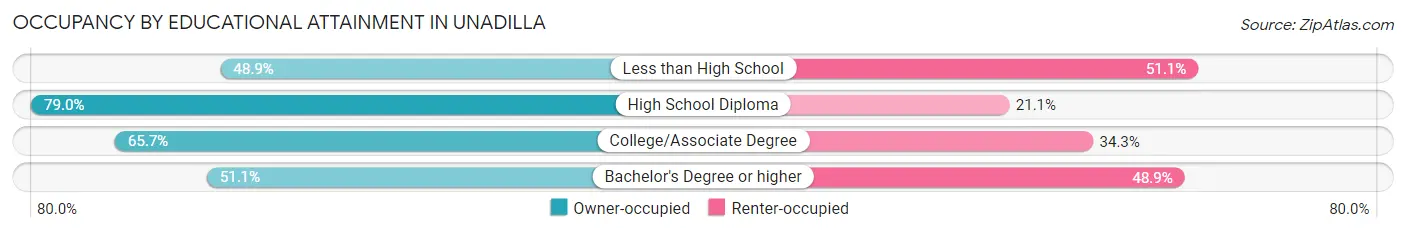
| Household Size | Owner-occupied | Renter-occupied |
| Less than High School | 23 (48.9%) | 24 (51.1%) |
| High School Diploma | 105 (78.9%) | 28 (21.0%) |
| College/Associate Degree | 88 (65.7%) | 46 (34.3%) |
| Bachelor's Degree or higher | 47 (51.1%) | 45 (48.9%) |
Occupancy by Age of Householder in Unadilla
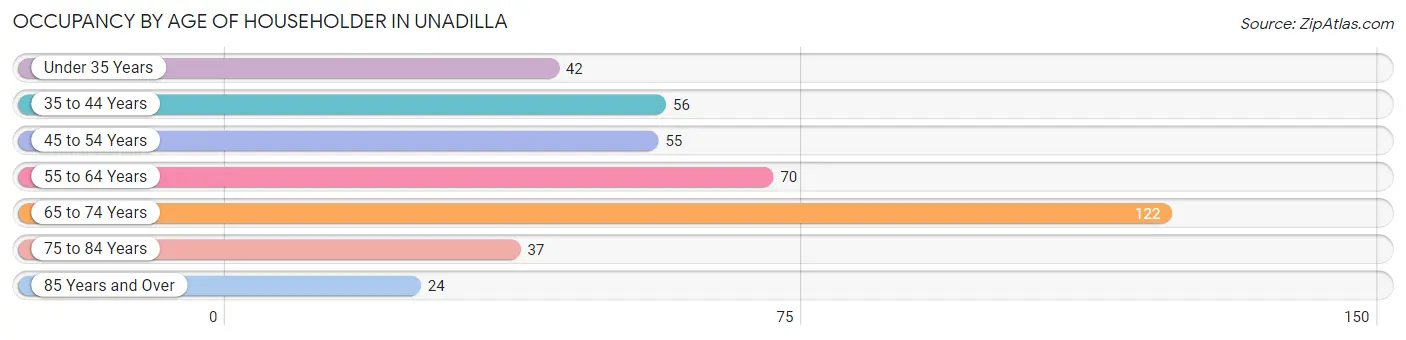
| Age Bracket | # Households | % Households |
| Under 35 Years | 42 | 10.3% |
| 35 to 44 Years | 56 | 13.8% |
| 45 to 54 Years | 55 | 13.6% |
| 55 to 64 Years | 70 | 17.2% |
| 65 to 74 Years | 122 | 30.0% |
| 75 to 84 Years | 37 | 9.1% |
| 85 Years and Over | 24 | 5.9% |
| Total | 406 | 100.0% |
Housing Finances in Unadilla
Median Income by Occupancy in Unadilla
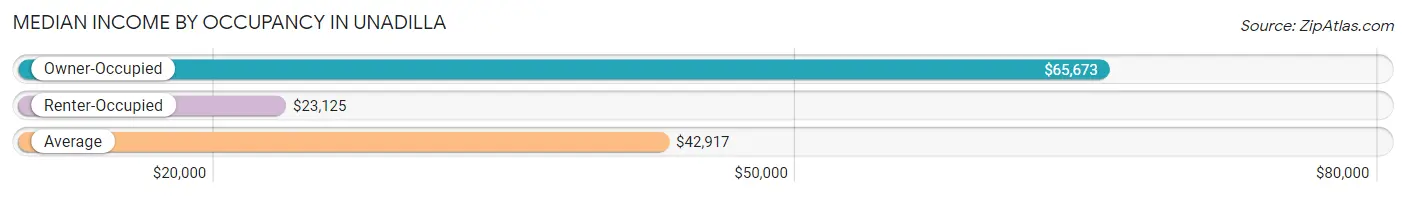
| Occupancy Type | # Households | Median Income |
| Owner-Occupied | 263 (64.8%) | $65,673 |
| Renter-Occupied | 143 (35.2%) | $23,125 |
| Average | 406 (100.0%) | $42,917 |
Occupancy by Householder Income Bracket in Unadilla
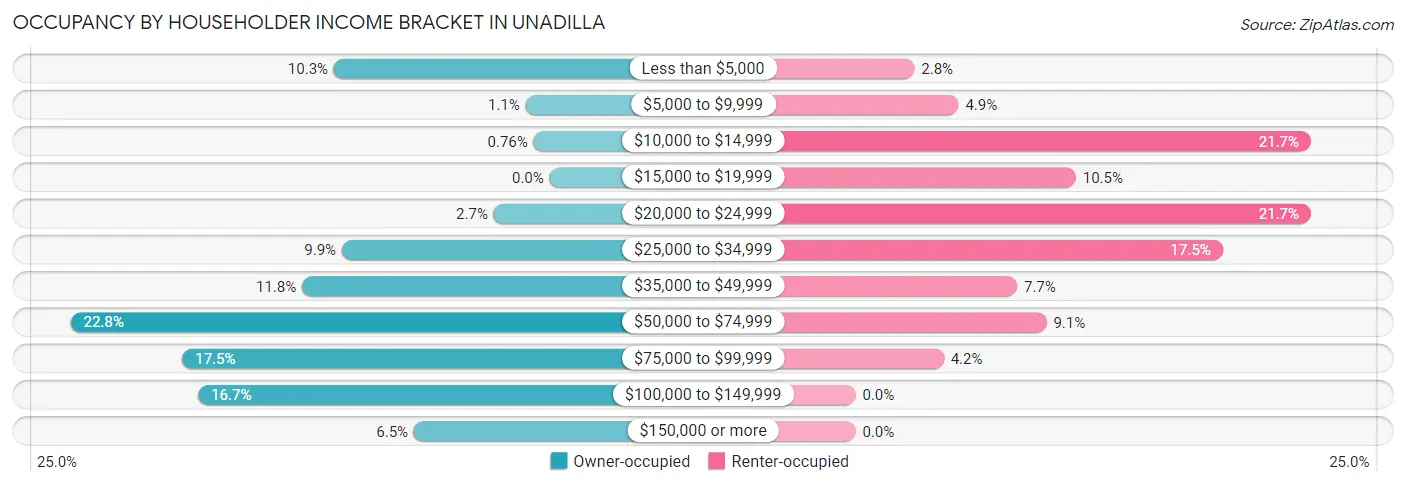
| Income Bracket | Owner-occupied | Renter-occupied |
| Less than $5,000 | 27 (10.3%) | 4 (2.8%) |
| $5,000 to $9,999 | 3 (1.1%) | 7 (4.9%) |
| $10,000 to $14,999 | 2 (0.8%) | 31 (21.7%) |
| $15,000 to $19,999 | 0 (0.0%) | 15 (10.5%) |
| $20,000 to $24,999 | 7 (2.7%) | 31 (21.7%) |
| $25,000 to $34,999 | 26 (9.9%) | 25 (17.5%) |
| $35,000 to $49,999 | 31 (11.8%) | 11 (7.7%) |
| $50,000 to $74,999 | 60 (22.8%) | 13 (9.1%) |
| $75,000 to $99,999 | 46 (17.5%) | 6 (4.2%) |
| $100,000 to $149,999 | 44 (16.7%) | 0 (0.0%) |
| $150,000 or more | 17 (6.5%) | 0 (0.0%) |
| Total | 263 (100.0%) | 143 (100.0%) |
Monthly Housing Cost Tiers in Unadilla
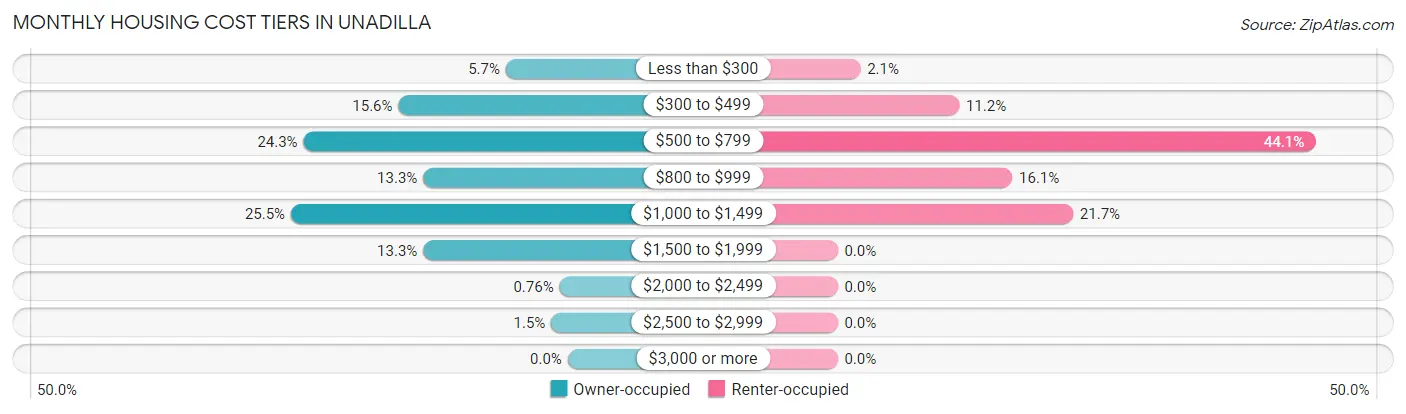
| Monthly Cost | Owner-occupied | Renter-occupied |
| Less than $300 | 15 (5.7%) | 3 (2.1%) |
| $300 to $499 | 41 (15.6%) | 16 (11.2%) |
| $500 to $799 | 64 (24.3%) | 63 (44.1%) |
| $800 to $999 | 35 (13.3%) | 23 (16.1%) |
| $1,000 to $1,499 | 67 (25.5%) | 31 (21.7%) |
| $1,500 to $1,999 | 35 (13.3%) | 0 (0.0%) |
| $2,000 to $2,499 | 2 (0.8%) | 0 (0.0%) |
| $2,500 to $2,999 | 4 (1.5%) | 0 (0.0%) |
| $3,000 or more | 0 (0.0%) | 0 (0.0%) |
| Total | 263 (100.0%) | 143 (100.0%) |
Physical Housing Characteristics in Unadilla
Housing Structures in Unadilla
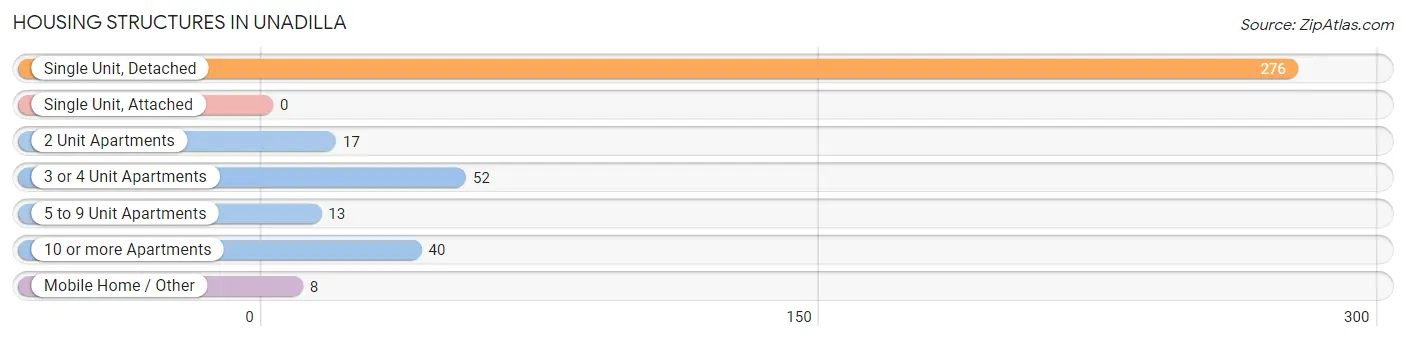
| Structure Type | # Housing Units | % Housing Units |
| Single Unit, Detached | 276 | 68.0% |
| Single Unit, Attached | 0 | 0.0% |
| 2 Unit Apartments | 17 | 4.2% |
| 3 or 4 Unit Apartments | 52 | 12.8% |
| 5 to 9 Unit Apartments | 13 | 3.2% |
| 10 or more Apartments | 40 | 9.9% |
| Mobile Home / Other | 8 | 2.0% |
| Total | 406 | 100.0% |
Housing Structures by Occupancy in Unadilla
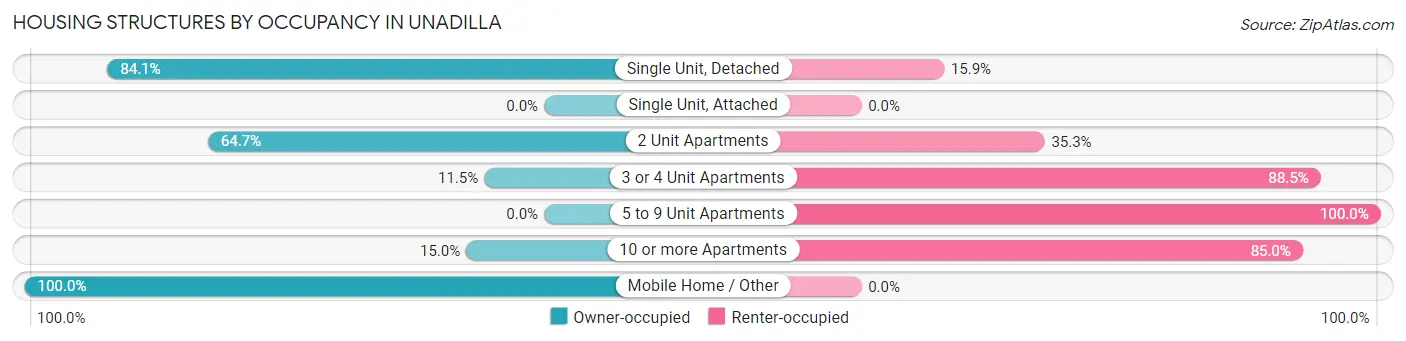
| Structure Type | Owner-occupied | Renter-occupied |
| Single Unit, Detached | 232 (84.1%) | 44 (15.9%) |
| Single Unit, Attached | 0 (0.0%) | 0 (0.0%) |
| 2 Unit Apartments | 11 (64.7%) | 6 (35.3%) |
| 3 or 4 Unit Apartments | 6 (11.5%) | 46 (88.5%) |
| 5 to 9 Unit Apartments | 0 (0.0%) | 13 (100.0%) |
| 10 or more Apartments | 6 (15.0%) | 34 (85.0%) |
| Mobile Home / Other | 8 (100.0%) | 0 (0.0%) |
| Total | 263 (64.8%) | 143 (35.2%) |
Housing Structures by Number of Rooms in Unadilla
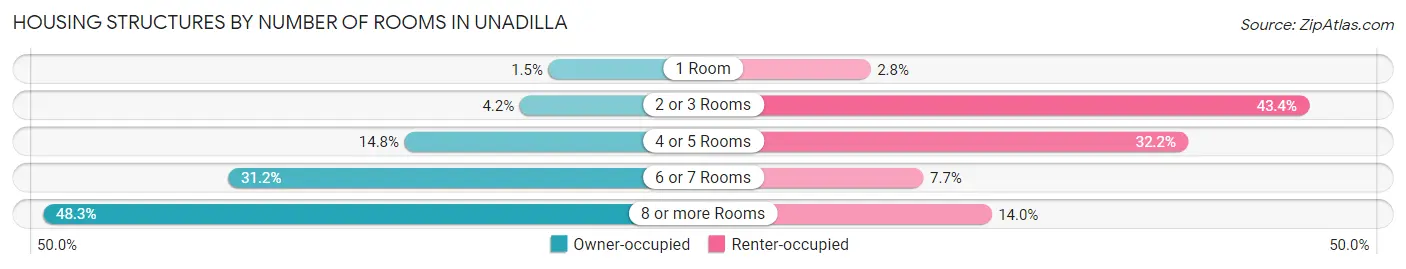
| Number of Rooms | Owner-occupied | Renter-occupied |
| 1 Room | 4 (1.5%) | 4 (2.8%) |
| 2 or 3 Rooms | 11 (4.2%) | 62 (43.4%) |
| 4 or 5 Rooms | 39 (14.8%) | 46 (32.2%) |
| 6 or 7 Rooms | 82 (31.2%) | 11 (7.7%) |
| 8 or more Rooms | 127 (48.3%) | 20 (14.0%) |
| Total | 263 (100.0%) | 143 (100.0%) |
Housing Structure by Heating Type in Unadilla
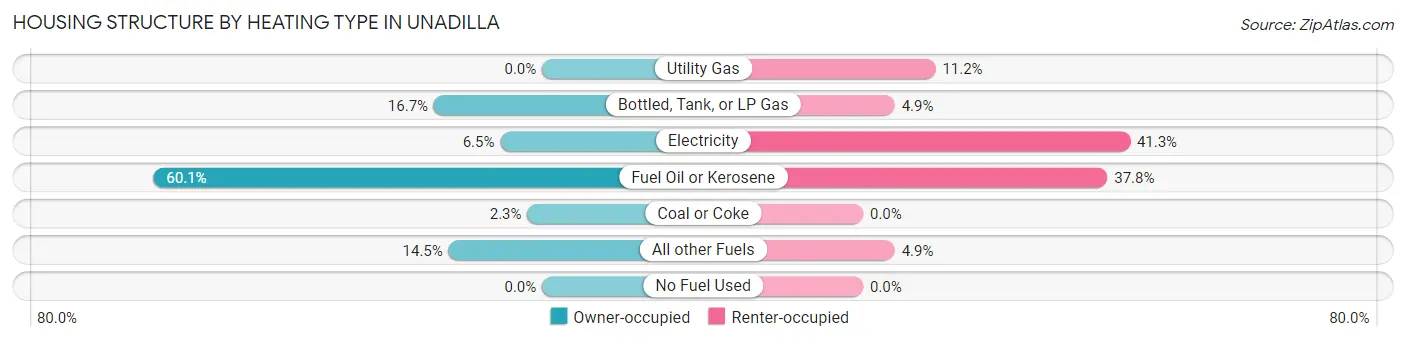
| Heating Type | Owner-occupied | Renter-occupied |
| Utility Gas | 0 (0.0%) | 16 (11.2%) |
| Bottled, Tank, or LP Gas | 44 (16.7%) | 7 (4.9%) |
| Electricity | 17 (6.5%) | 59 (41.3%) |
| Fuel Oil or Kerosene | 158 (60.1%) | 54 (37.8%) |
| Coal or Coke | 6 (2.3%) | 0 (0.0%) |
| All other Fuels | 38 (14.4%) | 7 (4.9%) |
| No Fuel Used | 0 (0.0%) | 0 (0.0%) |
| Total | 263 (100.0%) | 143 (100.0%) |
Household Vehicle Usage in Unadilla
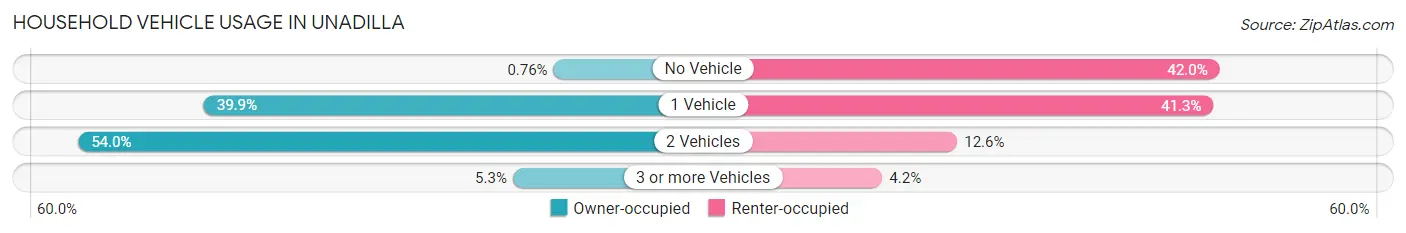
| Vehicles per Household | Owner-occupied | Renter-occupied |
| No Vehicle | 2 (0.8%) | 60 (42.0%) |
| 1 Vehicle | 105 (39.9%) | 59 (41.3%) |
| 2 Vehicles | 142 (54.0%) | 18 (12.6%) |
| 3 or more Vehicles | 14 (5.3%) | 6 (4.2%) |
| Total | 263 (100.0%) | 143 (100.0%) |
Real Estate & Mortgages in Unadilla
Real Estate and Mortgage Overview in Unadilla
| Characteristic | Without Mortgage | With Mortgage |
| Housing Units | 101 | 162 |
| Median Property Value | $115,200 | $98,200 |
| Median Household Income | $66,250 | $17 |
| Monthly Housing Costs | $573 | $0 |
| Real Estate Taxes | $3,118 | $36 |
Property Value by Mortgage Status in Unadilla
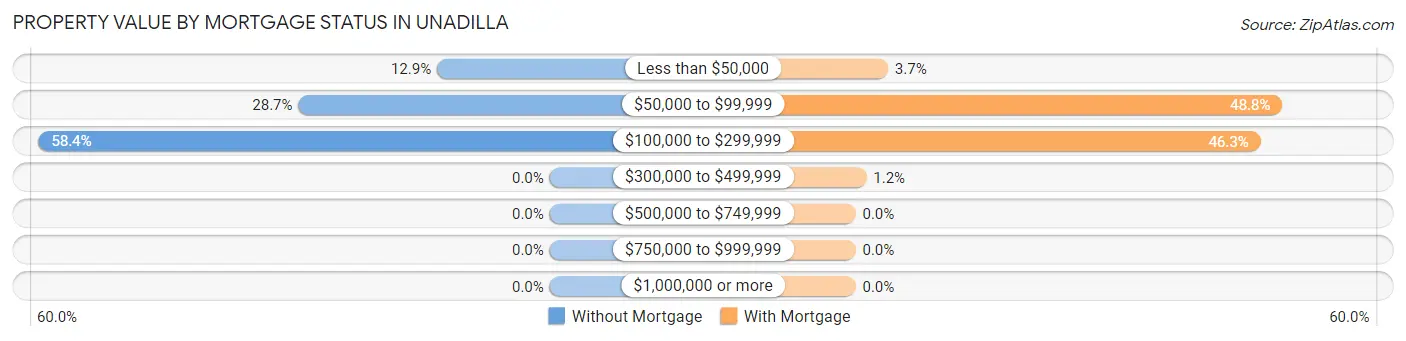
| Property Value | Without Mortgage | With Mortgage |
| Less than $50,000 | 13 (12.9%) | 6 (3.7%) |
| $50,000 to $99,999 | 29 (28.7%) | 79 (48.8%) |
| $100,000 to $299,999 | 59 (58.4%) | 75 (46.3%) |
| $300,000 to $499,999 | 0 (0.0%) | 2 (1.2%) |
| $500,000 to $749,999 | 0 (0.0%) | 0 (0.0%) |
| $750,000 to $999,999 | 0 (0.0%) | 0 (0.0%) |
| $1,000,000 or more | 0 (0.0%) | 0 (0.0%) |
| Total | 101 (100.0%) | 162 (100.0%) |
Household Income by Mortgage Status in Unadilla
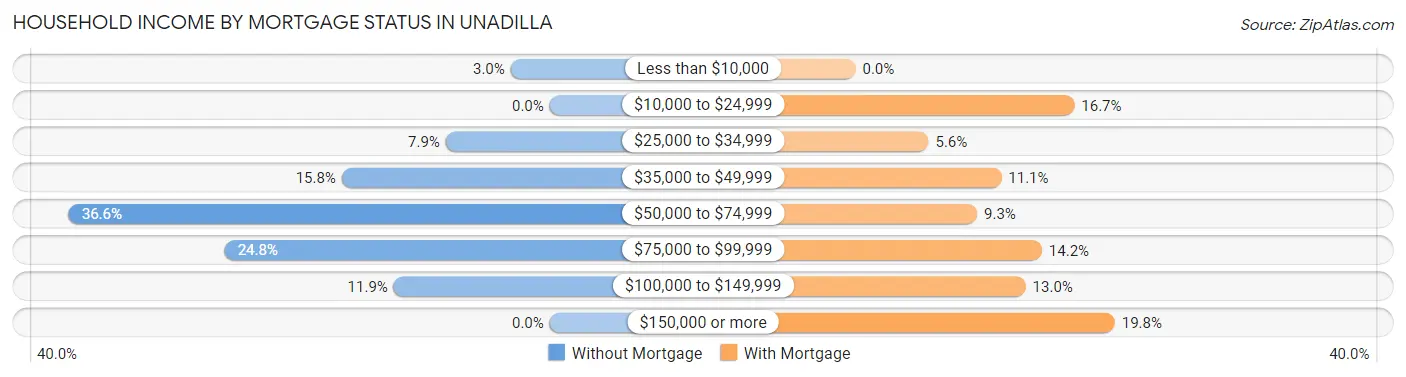
| Household Income | Without Mortgage | With Mortgage |
| Less than $10,000 | 3 (3.0%) | 0 (0.0%) |
| $10,000 to $24,999 | 0 (0.0%) | 27 (16.7%) |
| $25,000 to $34,999 | 8 (7.9%) | 9 (5.6%) |
| $35,000 to $49,999 | 16 (15.8%) | 18 (11.1%) |
| $50,000 to $74,999 | 37 (36.6%) | 15 (9.3%) |
| $75,000 to $99,999 | 25 (24.7%) | 23 (14.2%) |
| $100,000 to $149,999 | 12 (11.9%) | 21 (13.0%) |
| $150,000 or more | 0 (0.0%) | 32 (19.8%) |
| Total | 101 (100.0%) | 162 (100.0%) |
Property Value to Household Income Ratio in Unadilla

| Value-to-Income Ratio | Without Mortgage | With Mortgage |
| Less than 2.0x | 32 (31.7%) | 63,500 (39,197.5%) |
| 2.0x to 2.9x | 55 (54.5%) | 87 (53.7%) |
| 3.0x to 3.9x | 7 (6.9%) | 25 (15.4%) |
| 4.0x or more | 7 (6.9%) | 11 (6.8%) |
| Total | 101 (100.0%) | 162 (100.0%) |
Real Estate Taxes by Mortgage Status in Unadilla
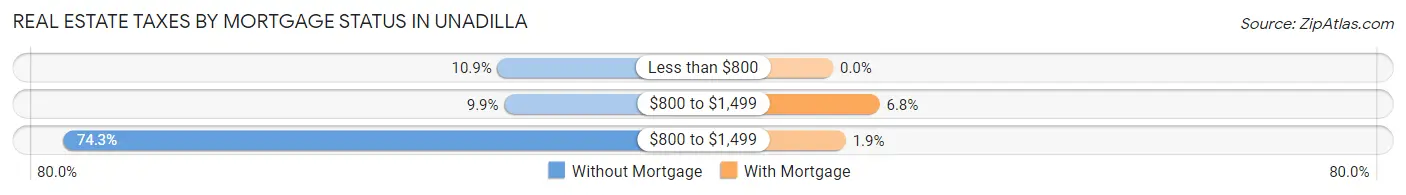
| Property Taxes | Without Mortgage | With Mortgage |
| Less than $800 | 11 (10.9%) | 0 (0.0%) |
| $800 to $1,499 | 10 (9.9%) | 11 (6.8%) |
| $800 to $1,499 | 75 (74.3%) | 3 (1.8%) |
| Total | 101 (100.0%) | 162 (100.0%) |
Health & Disability in Unadilla
Health Insurance Coverage by Age in Unadilla
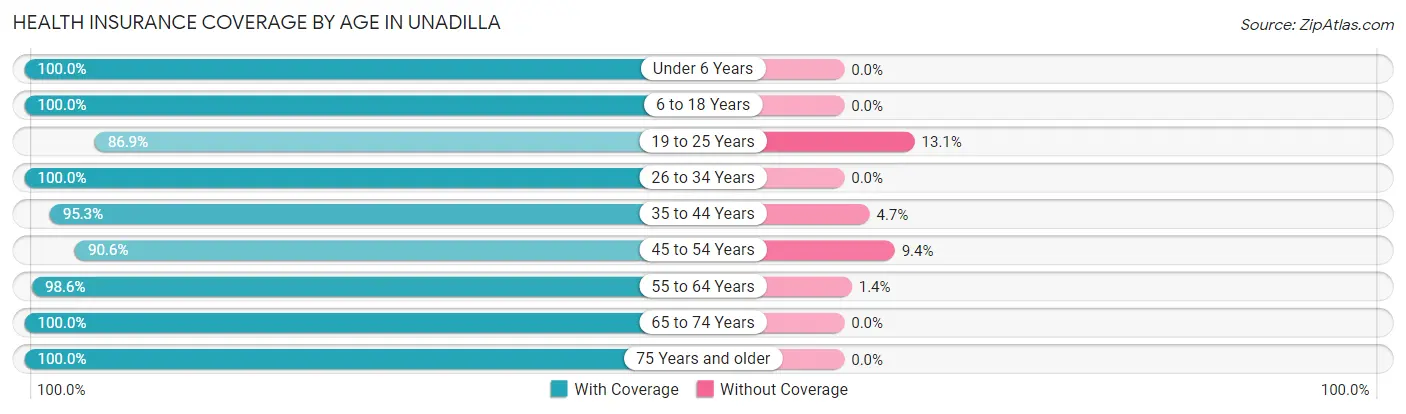
| Age Bracket | With Coverage | Without Coverage |
| Under 6 Years | 46 (100.0%) | 0 (0.0%) |
| 6 to 18 Years | 102 (100.0%) | 0 (0.0%) |
| 19 to 25 Years | 106 (86.9%) | 16 (13.1%) |
| 26 to 34 Years | 102 (100.0%) | 0 (0.0%) |
| 35 to 44 Years | 81 (95.3%) | 4 (4.7%) |
| 45 to 54 Years | 77 (90.6%) | 8 (9.4%) |
| 55 to 64 Years | 141 (98.6%) | 2 (1.4%) |
| 65 to 74 Years | 173 (100.0%) | 0 (0.0%) |
| 75 Years and older | 87 (100.0%) | 0 (0.0%) |
| Total | 915 (96.8%) | 30 (3.2%) |
Health Insurance Coverage by Citizenship Status in Unadilla
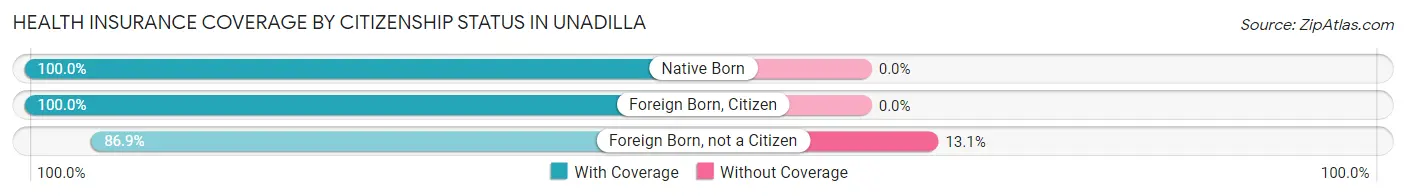
| Citizenship Status | With Coverage | Without Coverage |
| Native Born | 46 (100.0%) | 0 (0.0%) |
| Foreign Born, Citizen | 102 (100.0%) | 0 (0.0%) |
| Foreign Born, not a Citizen | 106 (86.9%) | 16 (13.1%) |
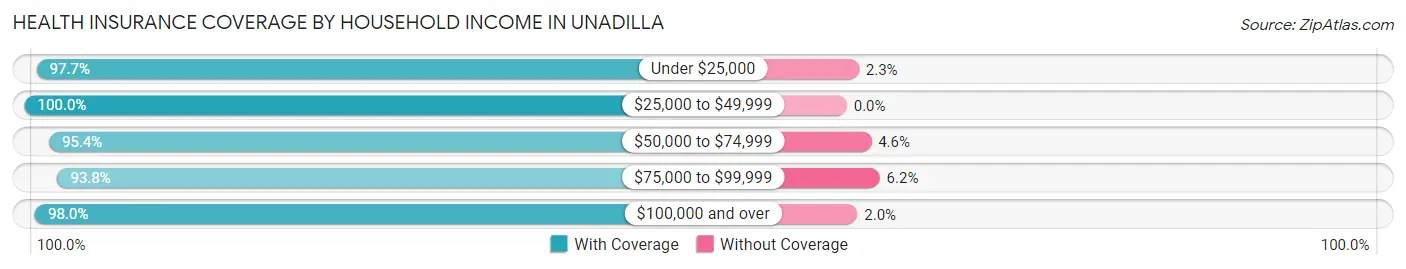
Health Insurance Coverage by Household Income in Unadilla
| Household Income | With Coverage | Without Coverage |
| Under $25,000 | 260 (97.7%) | 6 (2.3%) |
| $25,000 to $49,999 | 141 (100.0%) | 0 (0.0%) |
| $50,000 to $74,999 | 167 (95.4%) | 8 (4.6%) |
| $75,000 to $99,999 | 198 (93.8%) | 13 (6.2%) |
| $100,000 and over | 149 (98.0%) | 3 (2.0%) |
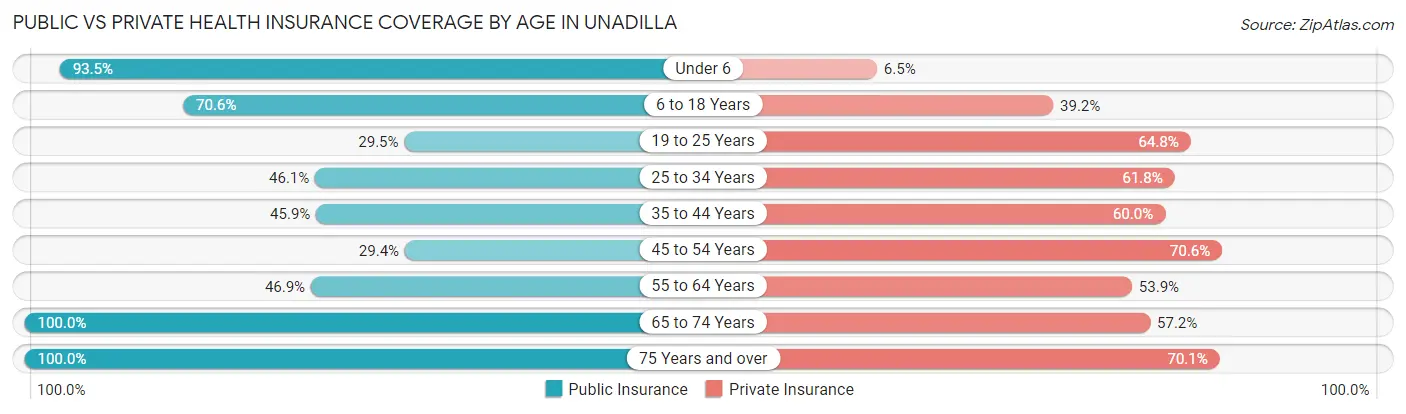
Public vs Private Health Insurance Coverage by Age in Unadilla
| Age Bracket | Public Insurance | Private Insurance |
| Under 6 | 43 (93.5%) | 3 (6.5%) |
| 6 to 18 Years | 72 (70.6%) | 40 (39.2%) |
| 19 to 25 Years | 36 (29.5%) | 79 (64.7%) |
| 25 to 34 Years | 47 (46.1%) | 63 (61.8%) |
| 35 to 44 Years | 39 (45.9%) | 51 (60.0%) |
| 45 to 54 Years | 25 (29.4%) | 60 (70.6%) |
| 55 to 64 Years | 67 (46.9%) | 77 (53.8%) |
| 65 to 74 Years | 173 (100.0%) | 99 (57.2%) |
| 75 Years and over | 87 (100.0%) | 61 (70.1%) |
| Total | 589 (62.3%) | 533 (56.4%) |
Disability Status by Sex by Age in Unadilla
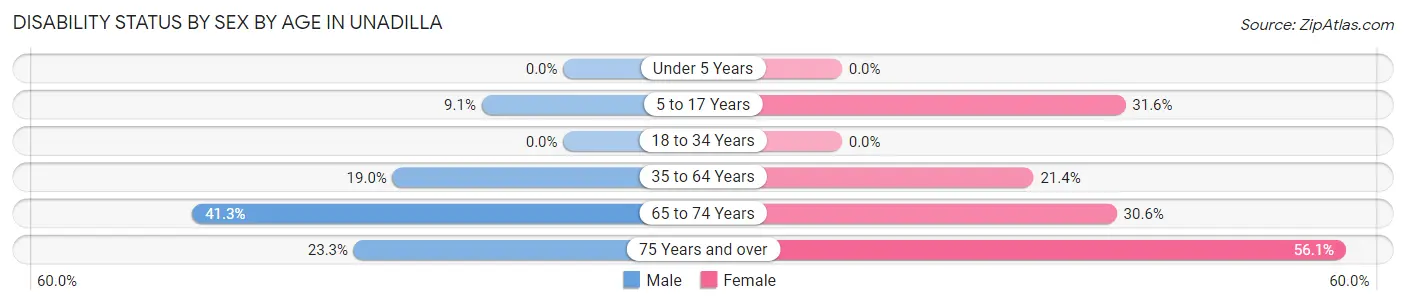
| Age Bracket | Male | Female |
| Under 5 Years | 0 (0.0%) | 0 (0.0%) |
| 5 to 17 Years | 5 (9.1%) | 12 (31.6%) |
| 18 to 34 Years | 0 (0.0%) | 0 (0.0%) |
| 35 to 64 Years | 23 (19.0%) | 41 (21.3%) |
| 65 to 74 Years | 31 (41.3%) | 30 (30.6%) |
| 75 Years and over | 7 (23.3%) | 32 (56.1%) |
Disability Class by Sex by Age in Unadilla
Disability Class: Hearing Difficulty
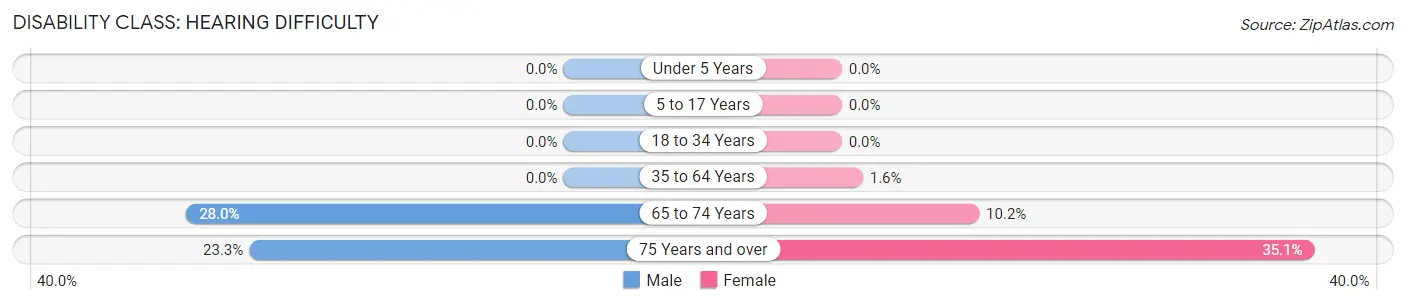
| Age Bracket | Male | Female |
| Under 5 Years | 0 (0.0%) | 0 (0.0%) |
| 5 to 17 Years | 0 (0.0%) | 0 (0.0%) |
| 18 to 34 Years | 0 (0.0%) | 0 (0.0%) |
| 35 to 64 Years | 0 (0.0%) | 3 (1.6%) |
| 65 to 74 Years | 21 (28.0%) | 10 (10.2%) |
| 75 Years and over | 7 (23.3%) | 20 (35.1%) |
Disability Class: Vision Difficulty
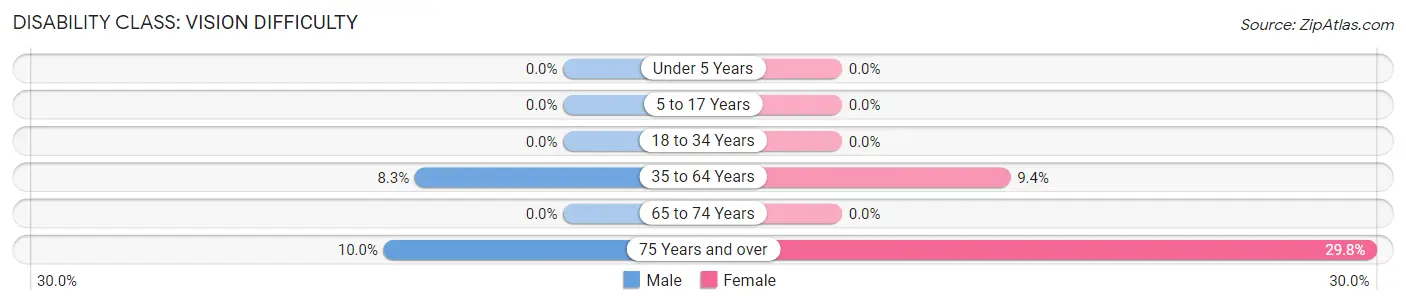
| Age Bracket | Male | Female |
| Under 5 Years | 0 (0.0%) | 0 (0.0%) |
| 5 to 17 Years | 0 (0.0%) | 0 (0.0%) |
| 18 to 34 Years | 0 (0.0%) | 0 (0.0%) |
| 35 to 64 Years | 10 (8.3%) | 18 (9.4%) |
| 65 to 74 Years | 0 (0.0%) | 0 (0.0%) |
| 75 Years and over | 3 (10.0%) | 17 (29.8%) |
Disability Class: Cognitive Difficulty
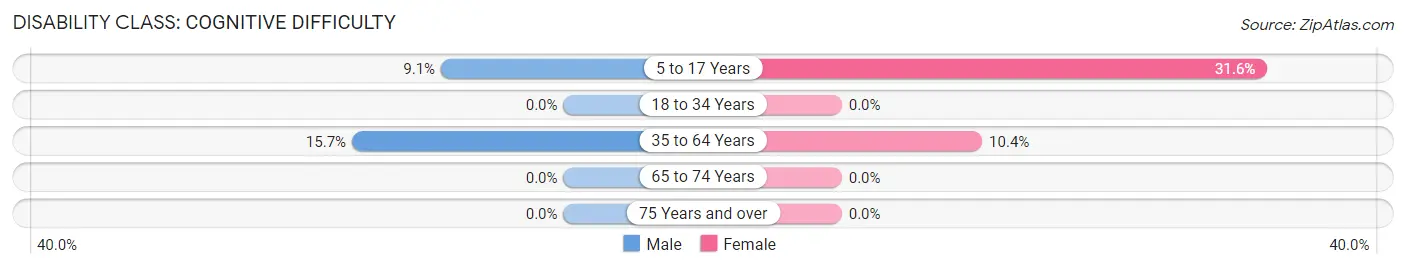
| Age Bracket | Male | Female |
| 5 to 17 Years | 5 (9.1%) | 12 (31.6%) |
| 18 to 34 Years | 0 (0.0%) | 0 (0.0%) |
| 35 to 64 Years | 19 (15.7%) | 20 (10.4%) |
| 65 to 74 Years | 0 (0.0%) | 0 (0.0%) |
| 75 Years and over | 0 (0.0%) | 0 (0.0%) |
Disability Class: Ambulatory Difficulty
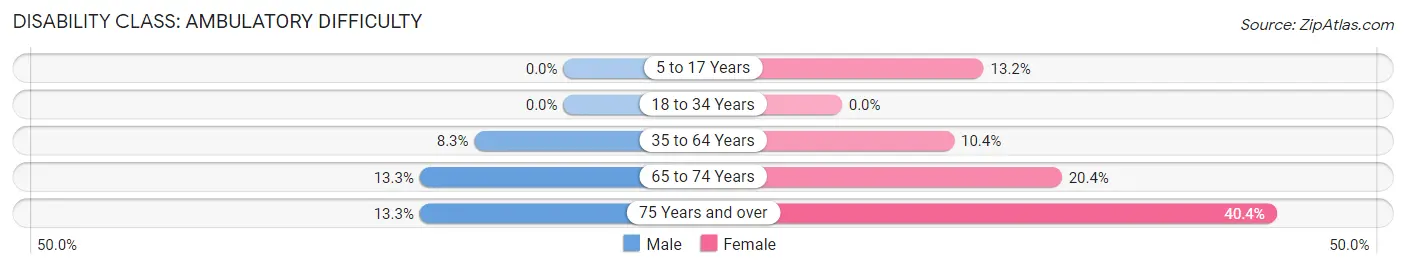
| Age Bracket | Male | Female |
| 5 to 17 Years | 0 (0.0%) | 5 (13.2%) |
| 18 to 34 Years | 0 (0.0%) | 0 (0.0%) |
| 35 to 64 Years | 10 (8.3%) | 20 (10.4%) |
| 65 to 74 Years | 10 (13.3%) | 20 (20.4%) |
| 75 Years and over | 4 (13.3%) | 23 (40.4%) |
Disability Class: Self-Care Difficulty
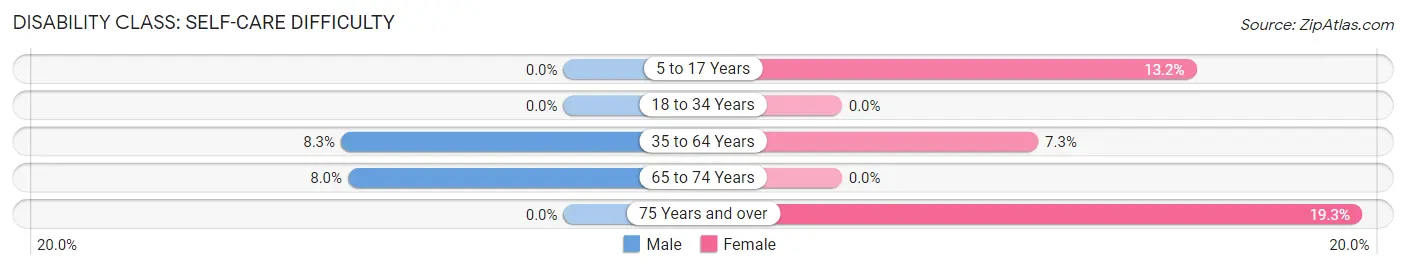
| Age Bracket | Male | Female |
| 5 to 17 Years | 0 (0.0%) | 5 (13.2%) |
| 18 to 34 Years | 0 (0.0%) | 0 (0.0%) |
| 35 to 64 Years | 10 (8.3%) | 14 (7.3%) |
| 65 to 74 Years | 6 (8.0%) | 0 (0.0%) |
| 75 Years and over | 0 (0.0%) | 11 (19.3%) |
Technology Access in Unadilla
Computing Device Access in Unadilla
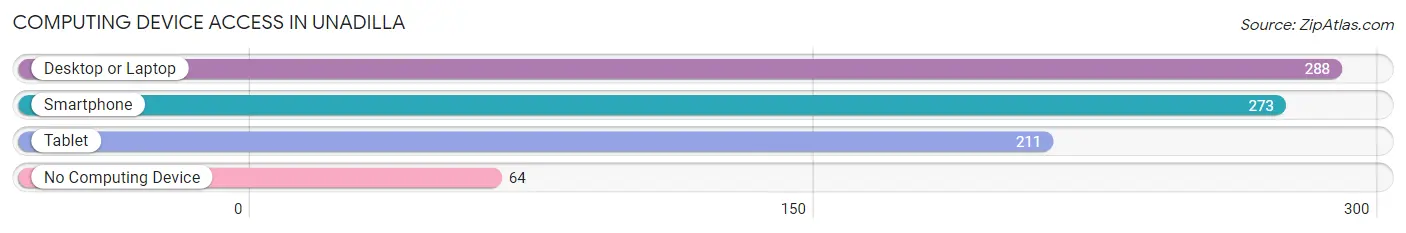
| Device Type | # Households | % Households |
| Desktop or Laptop | 288 | 70.9% |
| Smartphone | 273 | 67.2% |
| Tablet | 211 | 52.0% |
| No Computing Device | 64 | 15.8% |
| Total | 406 | 100.0% |
Internet Access in Unadilla
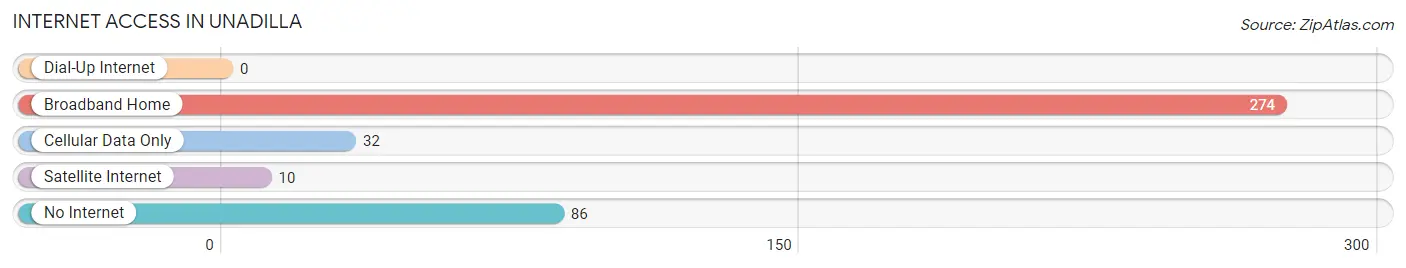
| Internet Type | # Households | % Households |
| Dial-Up Internet | 0 | 0.0% |
| Broadband Home | 274 | 67.5% |
| Cellular Data Only | 32 | 7.9% |
| Satellite Internet | 10 | 2.5% |
| No Internet | 86 | 21.2% |
| Total | 406 | 100.0% |
Unadilla Summary
Unadilla is a small town located in Otsego County, New York, United States. It is situated on the Susquehanna River, approximately halfway between Binghamton and Albany. The population was 1,845 at the 2010 census. Unadilla is part of the Town of Unadilla and is the county seat of Otsego County.
History
Unadilla was first settled in 1773 by a group of settlers from Connecticut. The town was originally known as "Unadilla Flats" and was part of the Town of Otego. In 1791, the Town of Unadilla was formed from the Town of Otego. The town was named after the Unadilla River, which was named by the Iroquois Indians.
The first courthouse in Unadilla was built in 1793 and the first jail was built in 1802. The first post office was established in 1804. The first school was built in 1810 and the first newspaper, the Unadilla Gazette, was established in 1820.
In 1825, the Chenango Canal was built, connecting Unadilla to Binghamton and Utica. The canal was a major factor in the growth of the town, as it allowed for the transportation of goods and people.
In 1836, the Unadilla and Susquehanna Railroad was built, connecting Unadilla to Binghamton and Albany. The railroad was a major factor in the growth of the town, as it allowed for the transportation of goods and people.
In 1848, the Unadilla and Susquehanna Railroad was extended to Cooperstown, allowing for the transportation of goods and people to and from the area.
In 1851, the Unadilla and Susquehanna Railroad was extended to Oneonta, allowing for the transportation of goods and people to and from the area.
In 1853, the Unadilla and Susquehanna Railroad was extended to Utica, allowing for the transportation of goods and people to and from the area.
In 1854, the Unadilla and Susquehanna Railroad was extended to Syracuse, allowing for the transportation of goods and people to and from the area.
In 1855, the Unadilla and Susquehanna Railroad was extended to Rochester, allowing for the transportation of goods and people to and from the area.
In 1856, the Unadilla and Susquehanna Railroad was extended to Buffalo, allowing for the transportation of goods and people to and from the area.
In 1858, the Unadilla and Susquehanna Railroad was extended to Niagara Falls, allowing for the transportation of goods and people to and from the area.
In 1859, the Unadilla and Susquehanna Railroad was extended to Toronto, allowing for the transportation of goods and people to and from the area.
In 1864, the Unadilla and Susquehanna Railroad was extended to Montreal, allowing for the transportation of goods and people to and from the area.
In 1867, the Unadilla and Susquehanna Railroad was extended to Quebec City, allowing for the transportation of goods and people to and from the area.
In 1868, the Unadilla and Susquehanna Railroad was extended to Halifax, allowing for the transportation of goods and people to and from the area.
In 1869, the Unadilla and Susquehanna Railroad was extended to St. John's, Newfoundland, allowing for the transportation of goods and people to and from the area.
In 1871, the Unadilla and Susquehanna Railroad was extended to Portland, Maine, allowing for the transportation of goods and people to and from the area.
In 1872, the Unadilla and Susquehanna Railroad was extended to Boston, allowing for the transportation of goods and people to and from the area.
In 1873, the Unadilla and Susquehanna Railroad was extended to New York City, allowing for the transportation of goods and people to and from the area.
Geography
Unadilla is located at 42°37′N 75°20′W (42.619, -75.333). According to the United States Census Bureau, the town has a total area of 2.2 square miles (5.7 km2), all of it land.
Unadilla is located on the Susquehanna River, approximately halfway between Binghamton and Albany. The town is bordered by the towns of Otego to the north, Laurens to the east, and Oneonta to the south.
Economy
Unadilla is a small rural town with a population of 1,845 as of the 2010 census. The town is home to several small businesses, including a grocery store, a hardware store, a pharmacy, a bank, and several restaurants.
The town is also home to several manufacturing companies, including a paper mill, a plastics factory, and a metal fabrication plant.
Demographics
As of the census of 2000, there were 1,845 people, 745 households, and 486 families residing in the town. The population density was 830.3 people per square mile (320.3/km2). There were 809 housing units at an average density of 361.2 per square mile (139.6/km2). The racial makeup of the town was 97.7% White, 0.7% African American, 0.2% Native American, 0.2% Asian, 0.2% from other races, and 1.1% from two or more races. Hispanic or Latino of any race were 0.7% of the population.
There were 745 households, out of which 30.2% had children under the age of 18 living with them, 49.3% were married couples living together, 11.2% had a female householder with no husband present, and 35.2% were non-families. 30.2% of all households were made up of individuals, and 14.2% had someone living alone who was 65 years of age or older. The average household size was 2.45 and the average family size was 3.04.
In the town, the population was spread out, with 25.3% under the age of 18, 7.2% from 18 to 24, 27.2% from 25 to 44, 23.2% from 45 to 64, and 17.1% who were 65 years of age or older. The median age was 38 years. For every 100 females, there were 91.2 males. For every 100 females age 18 and over, there were 87.2 males.
The median income for a household in the town was $33,750, and the median income for a family was $41,250. Males had a median income of $30,000 versus $21,250 for females. The per capita income for the town was $17,845. About 8.2% of families and 11.2% of the population were below the poverty line, including 14.2% of those under age 18 and 8.2% of those age 65 or over.
Common Questions
What is the Total Population of Unadilla?
Total Population of Unadilla is 945.
What is the Total Male Population of Unadilla?
Total Male Population of Unadilla is 410.
What is the Total Female Population of Unadilla?
Total Female Population of Unadilla is 535.
What is the Ratio of Males per 100 Females in Unadilla?
There are 76.64 Males per 100 Females in Unadilla.
What is the Ratio of Females per 100 Males in Unadilla?
There are 130.49 Females per 100 Males in Unadilla.
What is the Median Population Age in Unadilla?
Median Population Age in Unadilla is 46.0 Years.
What is the Average Family Size in Unadilla
Average Family Size in Unadilla is 3.5 People.
What is the Average Household Size in Unadilla
Average Household Size in Unadilla is 2.3 People.
What is Per Capita Income in Unadilla?
Per Capita income in Unadilla is $25,120.
What is the Median Family Income in Unadilla?
Median Family Income in Unadilla is $65,809.
What is the Median Household income in Unadilla?
Median Household Income in Unadilla is $42,917.
What is Income or Wage Gap in Unadilla?
Income or Wage Gap in Unadilla is 42.3%.
Women in Unadilla earn 57.7 cents for every dollar earned by a man.
What is Inequality or Gini Index in Unadilla?
Inequality or Gini Index in Unadilla is 0.42.
How Large is the Labor Force in Unadilla?
There are 485 People in the Labor Forcein in Unadilla.
What is the Percentage of People in the Labor Force in Unadilla?
58.9% of People are in the Labor Force in Unadilla.
What is the Unemployment Rate in Unadilla?
Unemployment Rate in Unadilla is 7.0%.