Tully, NY
Tully Map
Tully Overview
985
TOTAL POPULATION
430
MALE POPULATION
555
FEMALE POPULATION
77.48
MALES / 100 FEMALES
129.07
FEMALES / 100 MALES
40.3
MEDIAN AGE
3.4
AVG FAMILY SIZE
2.5
AVG HOUSEHOLD SIZE
$40,881
PER CAPITA INCOME
$84,688
AVG FAMILY INCOME
$77,700
AVG HOUSEHOLD INCOME
26.4%
WAGE / INCOME GAP [ % ]
73.6¢/ $1
WAGE / INCOME GAP [ $ ]
0.55
INEQUALITY / GINI INDEX
513
LABOR FORCE [ PEOPLE ]
62.3%
PERCENT IN LABOR FORCE
3.1%
UNEMPLOYMENT RATE
Tully Zip Codes
Tully Area Codes
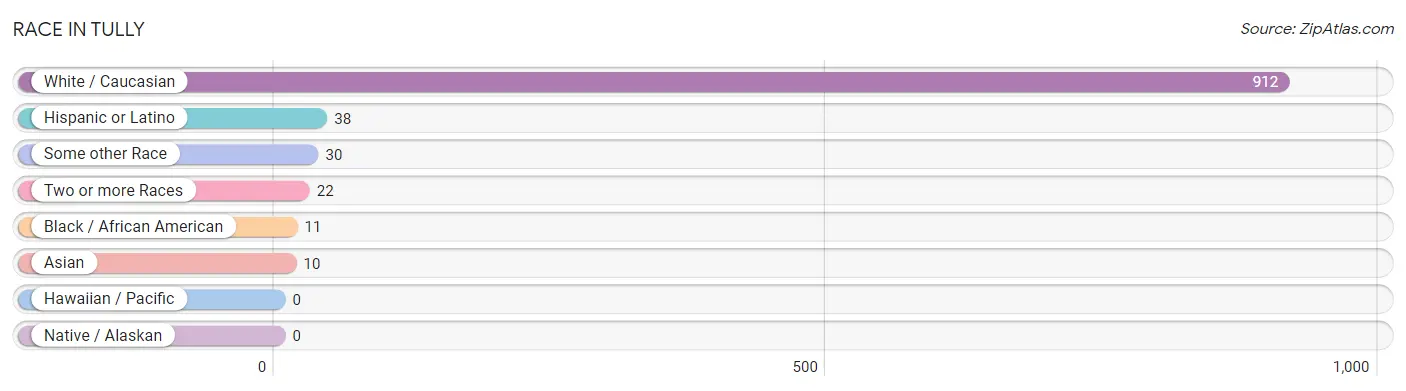
Race in Tully
The most populous races in Tully are White / Caucasian (912 | 92.6%), Hispanic or Latino (38 | 3.9%), and Some other Race (30 | 3.0%).
| Race | # Population | % Population |
| Asian | 10 | 1.0% |
| Black / African American | 11 | 1.1% |
| Hawaiian / Pacific | 0 | 0.0% |
| Hispanic or Latino | 38 | 3.9% |
| Native / Alaskan | 0 | 0.0% |
| White / Caucasian | 912 | 92.6% |
| Two or more Races | 22 | 2.2% |
| Some other Race | 30 | 3.0% |
| Total | 985 | 100.0% |
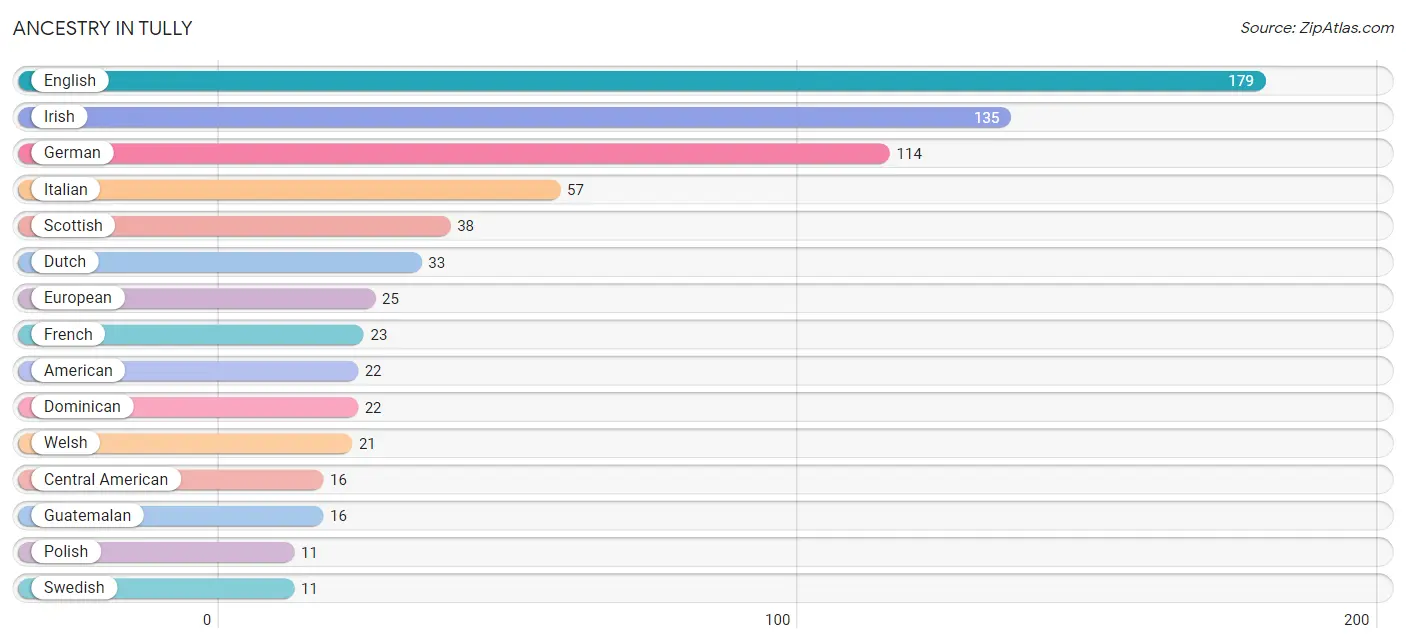
Ancestry in Tully
The most populous ancestries reported in Tully are English (179 | 18.2%), Irish (135 | 13.7%), German (114 | 11.6%), Italian (57 | 5.8%), and Scottish (38 | 3.9%), together accounting for 53.1% of all Tully residents.
| Ancestry | # Population | % Population |
| American | 22 | 2.2% |
| Bhutanese | 2 | 0.2% |
| British | 4 | 0.4% |
| Burmese | 8 | 0.8% |
| Central American | 16 | 1.6% |
| Dominican | 22 | 2.2% |
| Dutch | 33 | 3.4% |
| Eastern European | 3 | 0.3% |
| English | 179 | 18.2% |
| European | 25 | 2.5% |
| French | 23 | 2.3% |
| French Canadian | 4 | 0.4% |
| German | 114 | 11.6% |
| Guatemalan | 16 | 1.6% |
| Indian (Asian) | 7 | 0.7% |
| Irish | 135 | 13.7% |
| Italian | 57 | 5.8% |
| Norwegian | 4 | 0.4% |
| Polish | 11 | 1.1% |
| Scandinavian | 8 | 0.8% |
| Scottish | 38 | 3.9% |
| Swedish | 11 | 1.1% |
| Ukrainian | 5 | 0.5% |
| Welsh | 21 | 2.1% | View All 24 Rows |
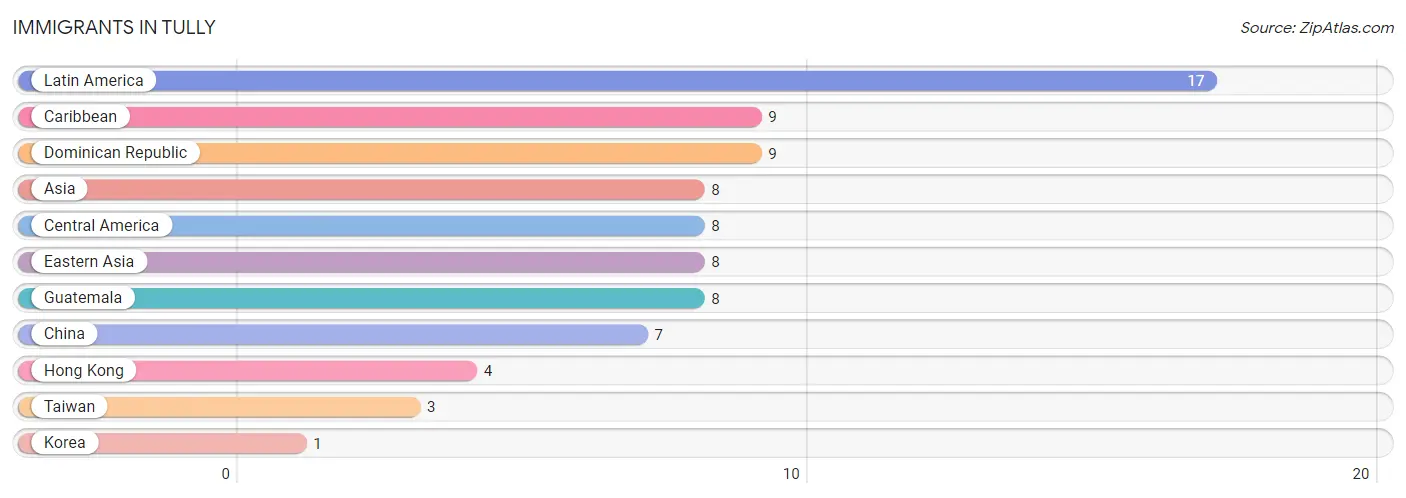
Immigrants in Tully
The most numerous immigrant groups reported in Tully came from Latin America (17 | 1.7%), Caribbean (9 | 0.9%), Dominican Republic (9 | 0.9%), Asia (8 | 0.8%), and Central America (8 | 0.8%), together accounting for 5.2% of all Tully residents.
| Immigration Origin | # Population | % Population |
| Asia | 8 | 0.8% |
| Caribbean | 9 | 0.9% |
| Central America | 8 | 0.8% |
| China | 7 | 0.7% |
| Dominican Republic | 9 | 0.9% |
| Eastern Asia | 8 | 0.8% |
| Guatemala | 8 | 0.8% |
| Hong Kong | 4 | 0.4% |
| Korea | 1 | 0.1% |
| Latin America | 17 | 1.7% |
| Taiwan | 3 | 0.3% | View All 11 Rows |
Sex and Age in Tully
Sex and Age in Tully
The most populous age groups in Tully are 40 to 44 Years (48 | 11.2%) for men and Under 5 Years (82 | 14.8%) for women.
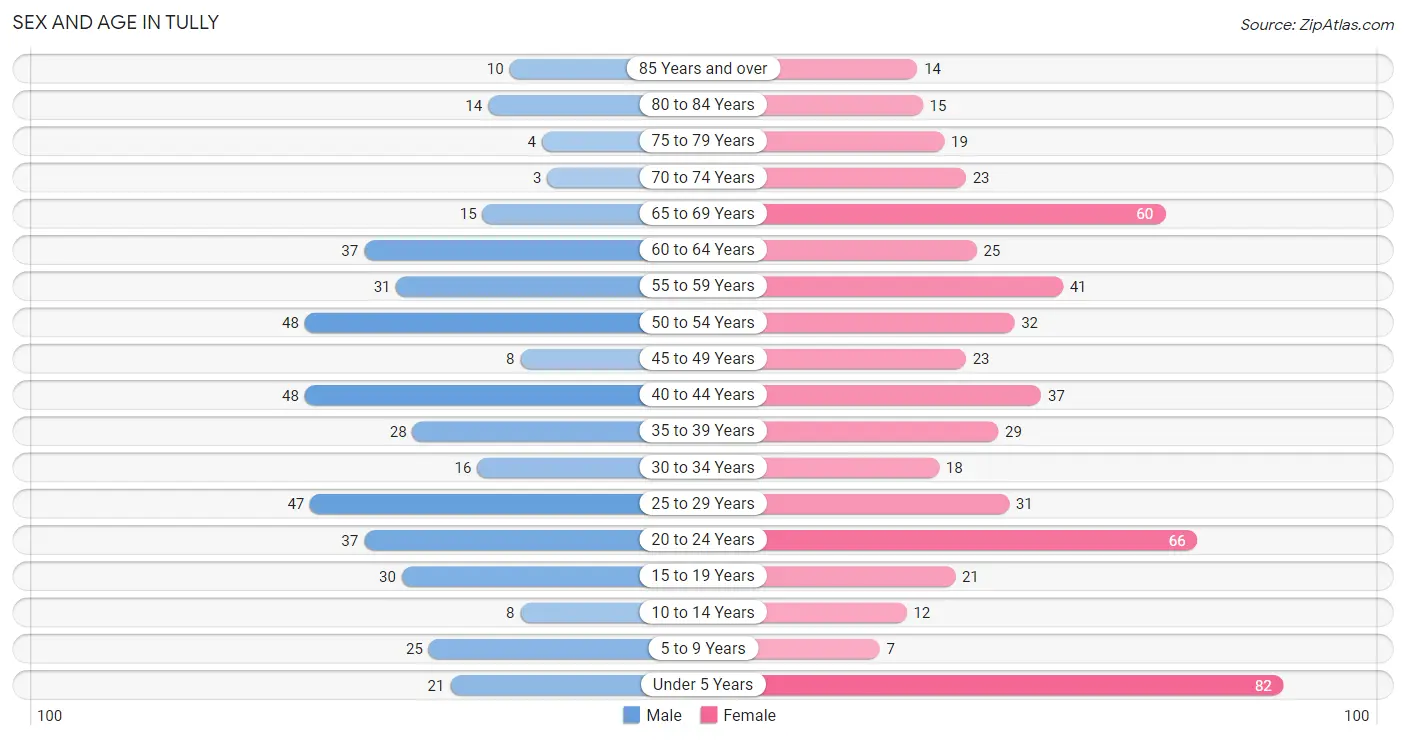
| Age Bracket | Male | Female |
| Under 5 Years | 21 (4.9%) | 82 (14.8%) |
| 5 to 9 Years | 25 (5.8%) | 7 (1.3%) |
| 10 to 14 Years | 8 (1.9%) | 12 (2.2%) |
| 15 to 19 Years | 30 (7.0%) | 21 (3.8%) |
| 20 to 24 Years | 37 (8.6%) | 66 (11.9%) |
| 25 to 29 Years | 47 (10.9%) | 31 (5.6%) |
| 30 to 34 Years | 16 (3.7%) | 18 (3.2%) |
| 35 to 39 Years | 28 (6.5%) | 29 (5.2%) |
| 40 to 44 Years | 48 (11.2%) | 37 (6.7%) |
| 45 to 49 Years | 8 (1.9%) | 23 (4.1%) |
| 50 to 54 Years | 48 (11.2%) | 32 (5.8%) |
| 55 to 59 Years | 31 (7.2%) | 41 (7.4%) |
| 60 to 64 Years | 37 (8.6%) | 25 (4.5%) |
| 65 to 69 Years | 15 (3.5%) | 60 (10.8%) |
| 70 to 74 Years | 3 (0.7%) | 23 (4.1%) |
| 75 to 79 Years | 4 (0.9%) | 19 (3.4%) |
| 80 to 84 Years | 14 (3.3%) | 15 (2.7%) |
| 85 Years and over | 10 (2.3%) | 14 (2.5%) |
| Total | 430 (100.0%) | 555 (100.0%) |
Families and Households in Tully
Median Family Size in Tully
The median family size in Tully is 3.36 persons per family, with married-couple families (148 | 68.8%) accounting for the largest median family size of 3.66 persons per family. On the other hand, single male/father families (14 | 6.5%) represent the smallest median family size with 2.14 persons per family.
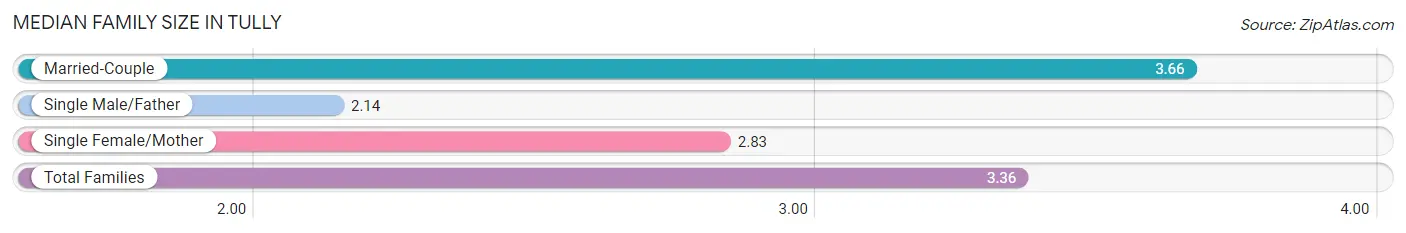
| Family Type | # Families | Family Size |
| Married-Couple | 148 (68.8%) | 3.66 |
| Single Male/Father | 14 (6.5%) | 2.14 |
| Single Female/Mother | 53 (24.6%) | 2.83 |
| Total Families | 215 (100.0%) | 3.36 |
Median Household Size in Tully
The median household size in Tully is 2.52 persons per household, with married-couple households (148 | 38.5%) accounting for the largest median household size of 3.72 persons per household. non-family households (169 | 44.0%) represent the smallest median household size with 1.33 persons per household.
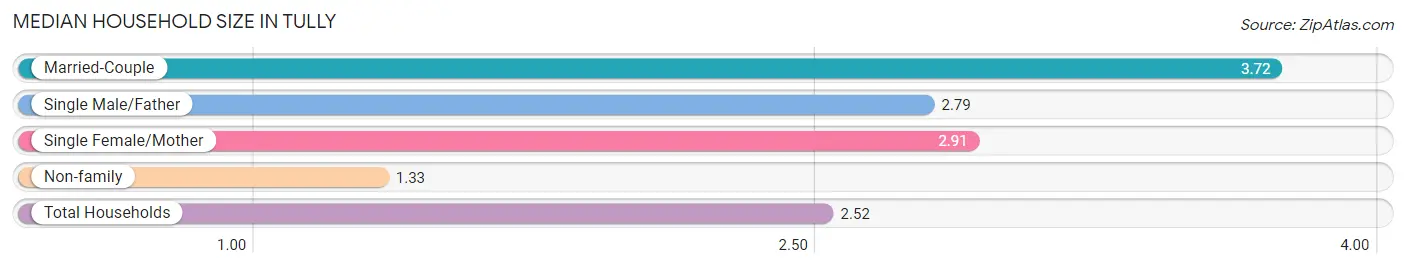
| Household Type | # Households | Household Size |
| Married-Couple | 148 (38.5%) | 3.72 |
| Single Male/Father | 14 (3.6%) | 2.79 |
| Single Female/Mother | 53 (13.8%) | 2.91 |
| Non-family | 169 (44.0%) | 1.33 |
| Total Households | 384 (100.0%) | 2.52 |
Household Size by Marriage Status in Tully
Out of a total of 384 households in Tully, 215 (56.0%) are family households, while 169 (44.0%) are nonfamily households. The most numerous type of family households are 2-person households, comprising 64, and the most common type of nonfamily households are 1-person households, comprising 132.
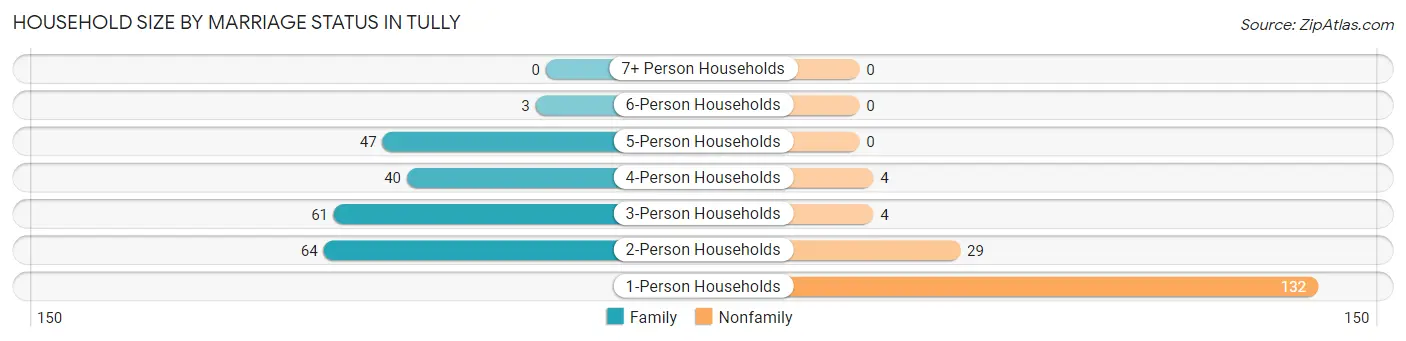
| Household Size | Family Households | Nonfamily Households |
| 1-Person Households | - | 132 (34.4%) |
| 2-Person Households | 64 (16.7%) | 29 (7.5%) |
| 3-Person Households | 61 (15.9%) | 4 (1.0%) |
| 4-Person Households | 40 (10.4%) | 4 (1.0%) |
| 5-Person Households | 47 (12.2%) | 0 (0.0%) |
| 6-Person Households | 3 (0.8%) | 0 (0.0%) |
| 7+ Person Households | 0 (0.0%) | 0 (0.0%) |
| Total | 215 (56.0%) | 169 (44.0%) |
Female Fertility in Tully
Fertility by Age in Tully
Average fertility rate in Tully is 31.0 births per 1,000 women. Women in the age bracket of 35 to 50 years have the highest fertility rate with 76.0 births per 1,000 women. Women in the age bracket of 35 to 50 years acount for 100.0% of all women with births.
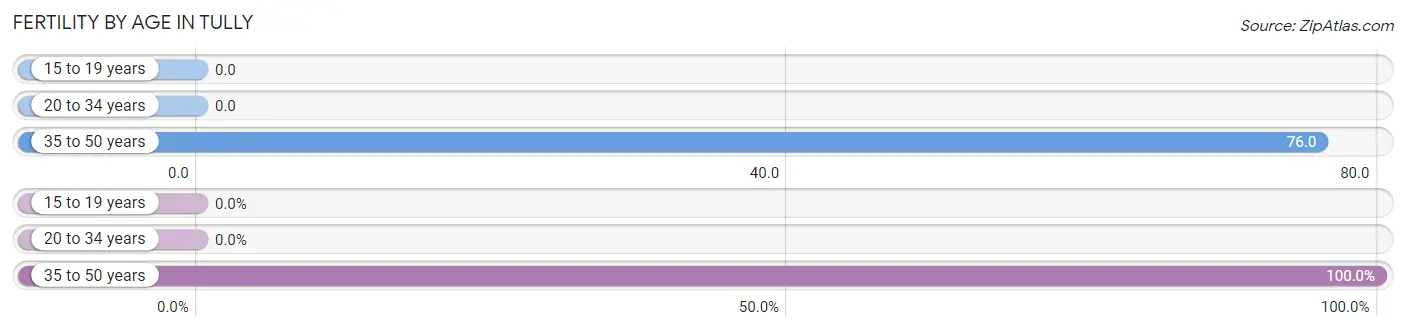
| Age Bracket | Women with Births | Births / 1,000 Women |
| 15 to 19 years | 0 (0.0%) | 0.0 |
| 20 to 34 years | 0 (0.0%) | 0.0 |
| 35 to 50 years | 7 (100.0%) | 76.0 |
| Total | 7 (100.0%) | 31.0 |
Fertility by Age by Marriage Status in Tully
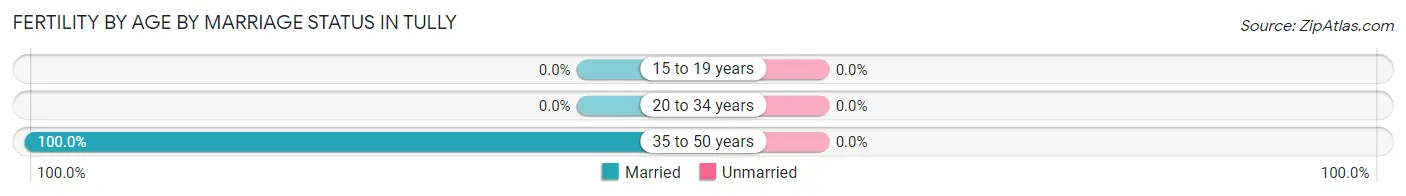
| Age Bracket | Married | Unmarried |
| 15 to 19 years | 0 (0.0%) | 0 (0.0%) |
| 20 to 34 years | 0 (0.0%) | 0 (0.0%) |
| 35 to 50 years | 7 (100.0%) | 0 (0.0%) |
| Total | 7 (100.0%) | 0 (0.0%) |
Fertility by Education in Tully
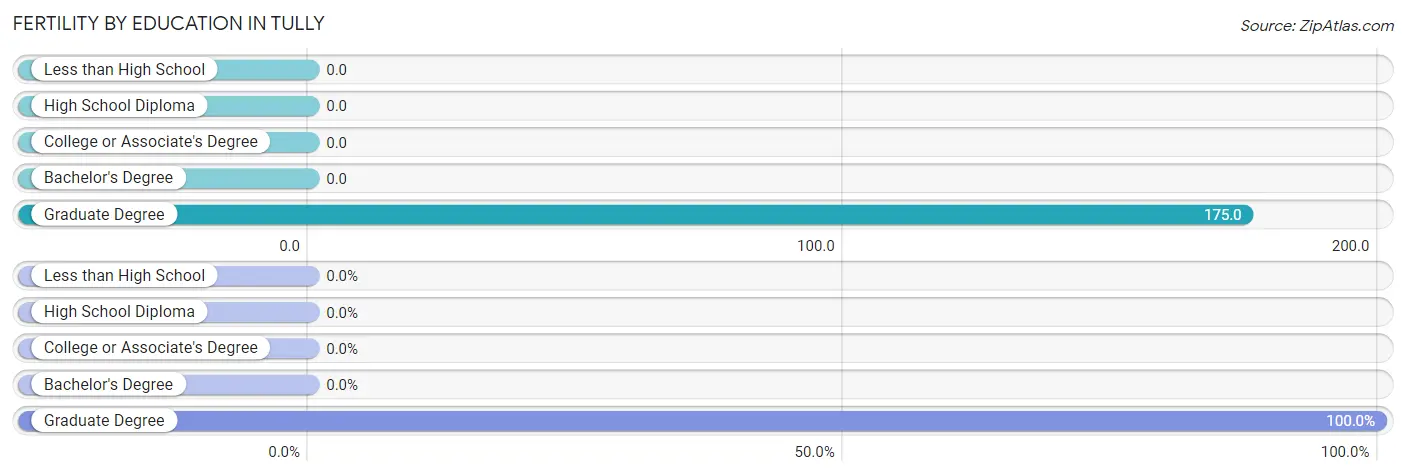
| Educational Attainment | Women with Births | Births / 1,000 Women |
| Less than High School | 0 (0.0%) | 0.0 |
| High School Diploma | 0 (0.0%) | 0.0 |
| College or Associate's Degree | 0 (0.0%) | 0.0 |
| Bachelor's Degree | 0 (0.0%) | 0.0 |
| Graduate Degree | 7 (100.0%) | 175.0 |
| Total | 7 (100.0%) | 31.0 |
Fertility by Education by Marriage Status in Tully
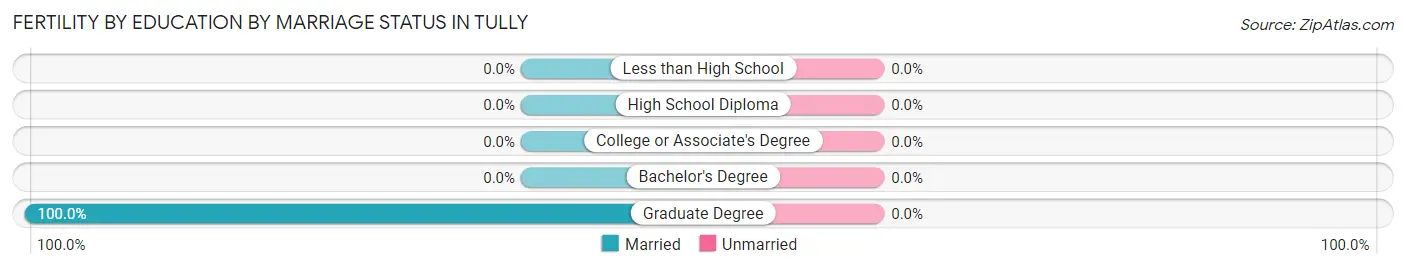
| Educational Attainment | Married | Unmarried |
| Less than High School | 0 (0.0%) | 0 (0.0%) |
| High School Diploma | 0 (0.0%) | 0 (0.0%) |
| College or Associate's Degree | 0 (0.0%) | 0 (0.0%) |
| Bachelor's Degree | 0 (0.0%) | 0 (0.0%) |
| Graduate Degree | 7 (100.0%) | 0 (0.0%) |
| Total | 7 (100.0%) | 0 (0.0%) |
Income in Tully
Income Overview in Tully
Per Capita Income in Tully is $40,881, while median incomes of families and households are $84,688 and $77,700 respectively.
| Characteristic | Number | Measure |
| Per Capita Income | 985 | $40,881 |
| Median Family Income | 215 | $84,688 |
| Mean Family Income | 215 | $119,890 |
| Median Household Income | 384 | $77,700 |
| Mean Household Income | 384 | $99,908 |
| Income Deficit | 215 | $0 |
| Wage / Income Gap (%) | 985 | 26.40% |
| Wage / Income Gap ($) | 985 | 73.60¢ per $1 |
| Gini / Inequality Index | 985 | 0.55 |
Earnings by Sex in Tully
Average Earnings in Tully are $42,983, $44,659 for men and $32,868 for women, a difference of 26.4%.
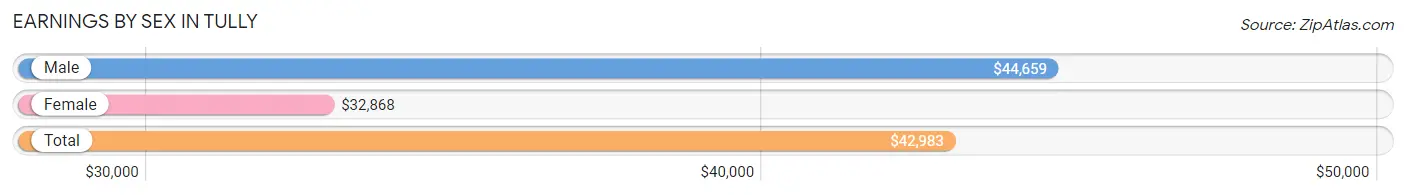
| Sex | Number | Average Earnings |
| Male | 298 (53.9%) | $44,659 |
| Female | 255 (46.1%) | $32,868 |
| Total | 553 (100.0%) | $42,983 |
Earnings by Sex by Income Bracket in Tully
The most common earnings brackets in Tully are $40,000 to $44,999 for men (59 | 19.8%) and $5,000 to $7,499 for women (31 | 12.2%).
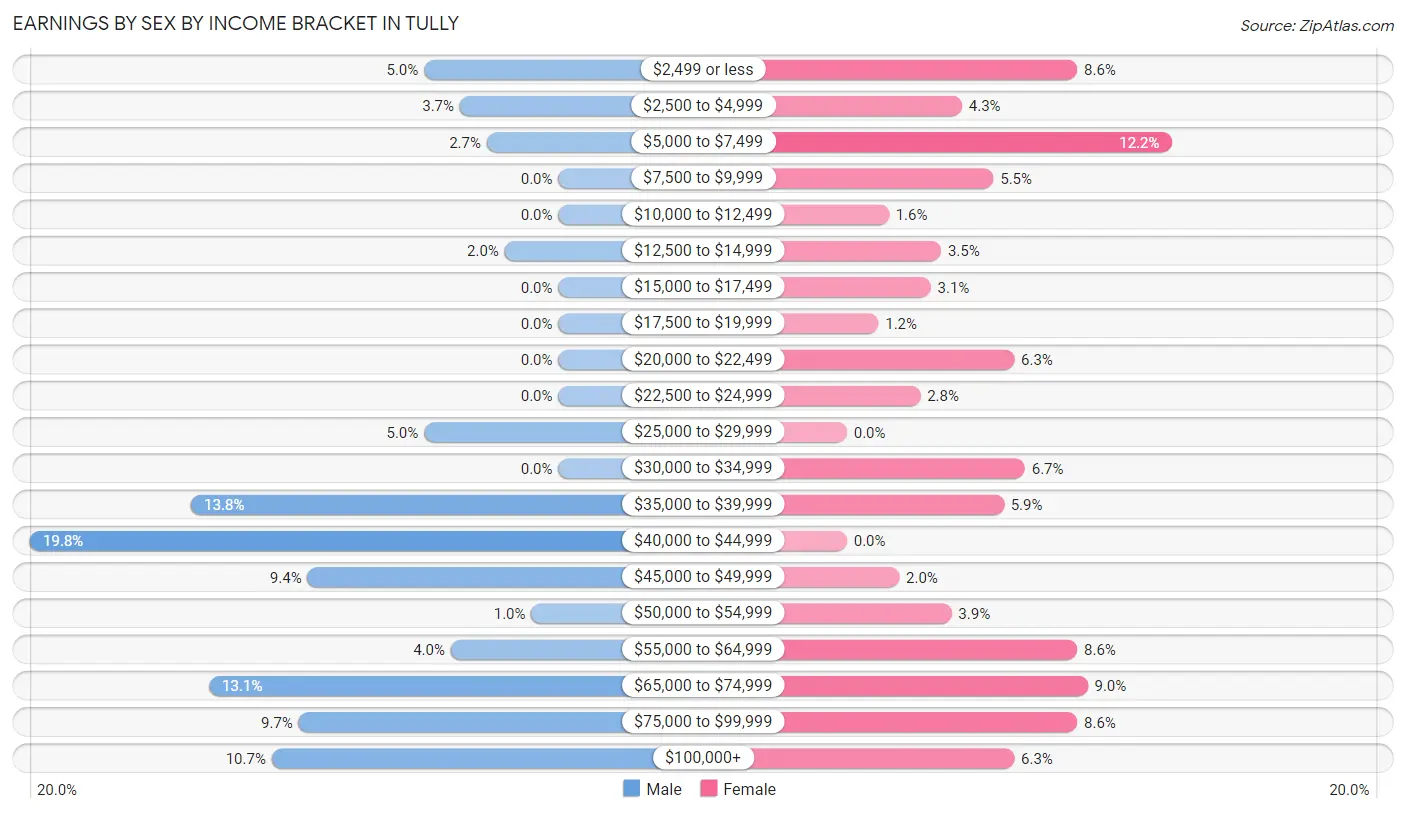
| Income | Male | Female |
| $2,499 or less | 15 (5.0%) | 22 (8.6%) |
| $2,500 to $4,999 | 11 (3.7%) | 11 (4.3%) |
| $5,000 to $7,499 | 8 (2.7%) | 31 (12.2%) |
| $7,500 to $9,999 | 0 (0.0%) | 14 (5.5%) |
| $10,000 to $12,499 | 0 (0.0%) | 4 (1.6%) |
| $12,500 to $14,999 | 6 (2.0%) | 9 (3.5%) |
| $15,000 to $17,499 | 0 (0.0%) | 8 (3.1%) |
| $17,500 to $19,999 | 0 (0.0%) | 3 (1.2%) |
| $20,000 to $22,499 | 0 (0.0%) | 16 (6.3%) |
| $22,500 to $24,999 | 0 (0.0%) | 7 (2.8%) |
| $25,000 to $29,999 | 15 (5.0%) | 0 (0.0%) |
| $30,000 to $34,999 | 0 (0.0%) | 17 (6.7%) |
| $35,000 to $39,999 | 41 (13.8%) | 15 (5.9%) |
| $40,000 to $44,999 | 59 (19.8%) | 0 (0.0%) |
| $45,000 to $49,999 | 28 (9.4%) | 5 (2.0%) |
| $50,000 to $54,999 | 3 (1.0%) | 10 (3.9%) |
| $55,000 to $64,999 | 12 (4.0%) | 22 (8.6%) |
| $65,000 to $74,999 | 39 (13.1%) | 23 (9.0%) |
| $75,000 to $99,999 | 29 (9.7%) | 22 (8.6%) |
| $100,000+ | 32 (10.7%) | 16 (6.3%) |
| Total | 298 (100.0%) | 255 (100.0%) |
Earnings by Sex by Educational Attainment in Tully
Average earnings in Tully are $48,676 for men and $36,583 for women, a difference of 24.8%. Men with an educational attainment of bachelor's degree enjoy the highest average annual earnings of $67,688, while those with less than high school education earn the least with $43,512. Women with an educational attainment of graduate degree earn the most with the average annual earnings of $60,536, while those with college or associate's degree education have the smallest earnings of $37,250.
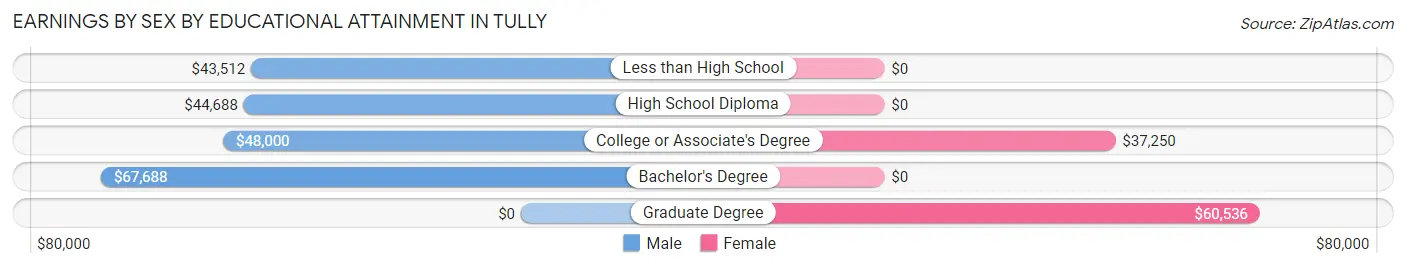
| Educational Attainment | Male Income | Female Income |
| Less than High School | $43,512 | $0 |
| High School Diploma | $44,688 | $0 |
| College or Associate's Degree | $48,000 | $37,250 |
| Bachelor's Degree | $67,688 | $0 |
| Graduate Degree | - | - |
| Total | $48,676 | $36,583 |
Family Income in Tully
Family Income Brackets in Tully
According to the Tully family income data, there are 64 families falling into the $100,000 to $149,999 income range, which is the most common income bracket and makes up 29.8% of all families.
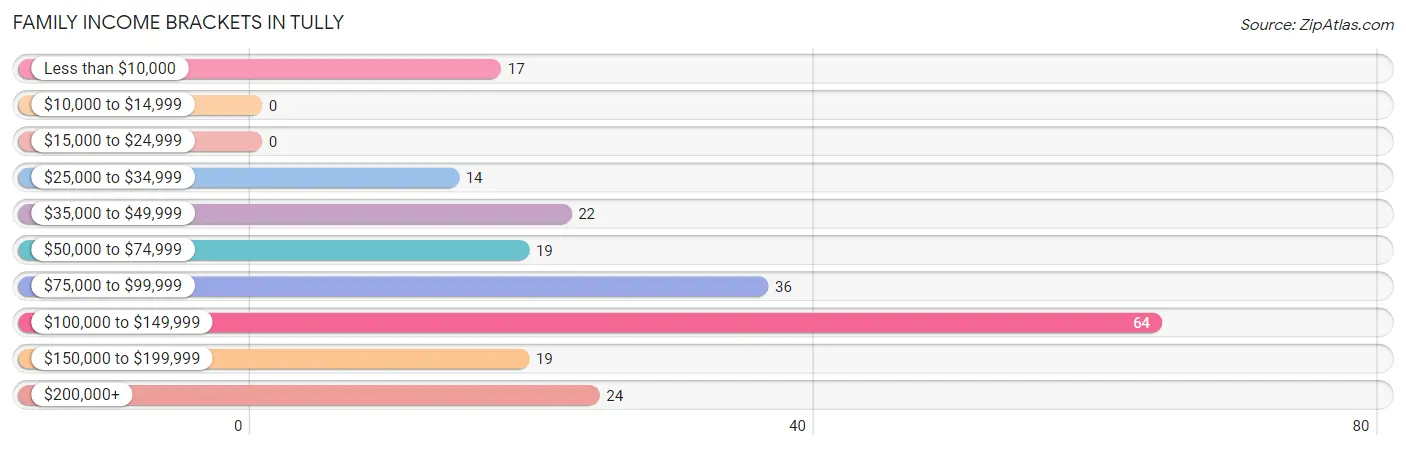
| Income Bracket | # Families | % Families |
| Less than $10,000 | 17 | 7.9% |
| $10,000 to $14,999 | 0 | 0.0% |
| $15,000 to $24,999 | 0 | 0.0% |
| $25,000 to $34,999 | 14 | 6.5% |
| $35,000 to $49,999 | 22 | 10.2% |
| $50,000 to $74,999 | 19 | 8.8% |
| $75,000 to $99,999 | 36 | 16.7% |
| $100,000 to $149,999 | 64 | 29.8% |
| $150,000 to $199,999 | 19 | 8.8% |
| $200,000+ | 24 | 11.2% |
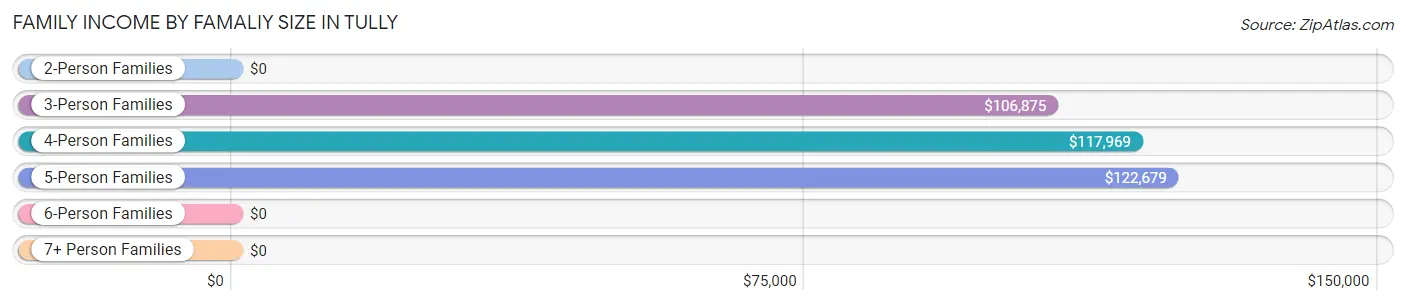
Family Income by Famaliy Size in Tully
5-person families (47 | 21.9%) account for the highest median family income in Tully with $122,679 per family, while 3-person families (46 | 21.4%) have the highest median income of $35,625 per family member.
| Income Bracket | # Families | Median Income |
| 2-Person Families | 79 (36.7%) | $0 |
| 3-Person Families | 46 (21.4%) | $106,875 |
| 4-Person Families | 43 (20.0%) | $117,969 |
| 5-Person Families | 47 (21.9%) | $122,679 |
| 6-Person Families | 0 (0.0%) | $0 |
| 7+ Person Families | 0 (0.0%) | $0 |
| Total | 215 (100.0%) | $84,688 |
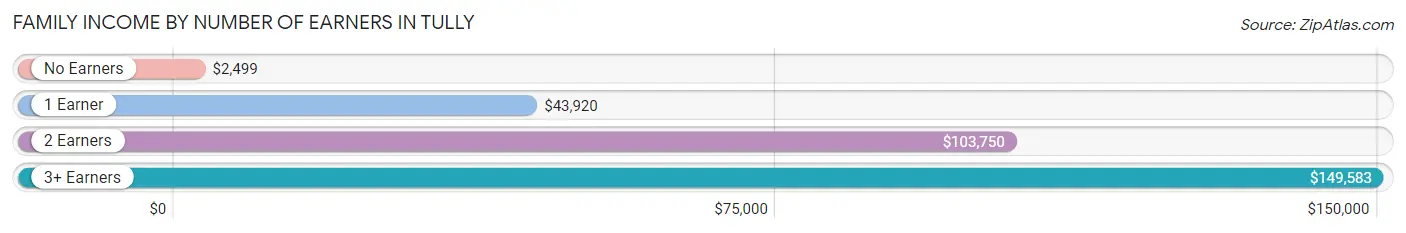
Family Income by Number of Earners in Tully
The median family income in Tully is $84,688, with families comprising 3+ earners (43) having the highest median family income of $149,583, while families with no earners (20) have the lowest median family income of $2,499, accounting for 20.0% and 9.3% of families, respectively.
| Number of Earners | # Families | Median Income |
| No Earners | 20 (9.3%) | $2,499 |
| 1 Earner | 53 (24.6%) | $43,920 |
| 2 Earners | 99 (46.1%) | $103,750 |
| 3+ Earners | 43 (20.0%) | $149,583 |
| Total | 215 (100.0%) | $84,688 |
Household Income in Tully
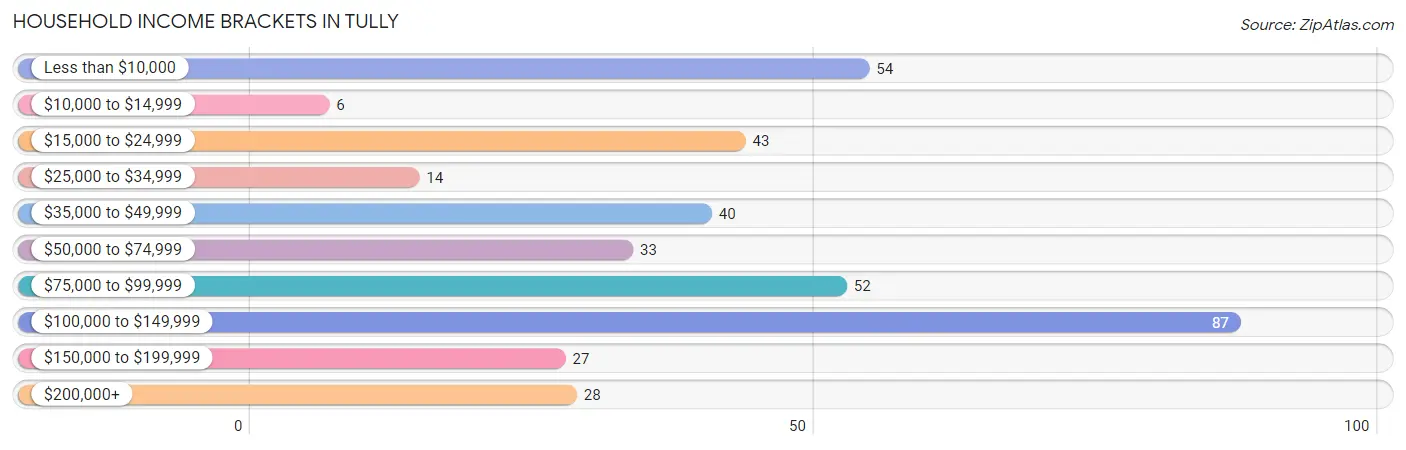
Household Income Brackets in Tully
With 87 households falling in the category, the $100,000 to $149,999 income range is the most frequent in Tully, accounting for 22.7% of all households. In contrast, only 6 households (1.6%) fall into the $10,000 to $14,999 income bracket, making it the least populous group.
| Income Bracket | # Households | % Households |
| Less than $10,000 | 54 | 14.1% |
| $10,000 to $14,999 | 6 | 1.6% |
| $15,000 to $24,999 | 43 | 11.2% |
| $25,000 to $34,999 | 14 | 3.6% |
| $35,000 to $49,999 | 40 | 10.4% |
| $50,000 to $74,999 | 33 | 8.6% |
| $75,000 to $99,999 | 52 | 13.5% |
| $100,000 to $149,999 | 87 | 22.7% |
| $150,000 to $199,999 | 27 | 7.0% |
| $200,000+ | 28 | 7.3% |
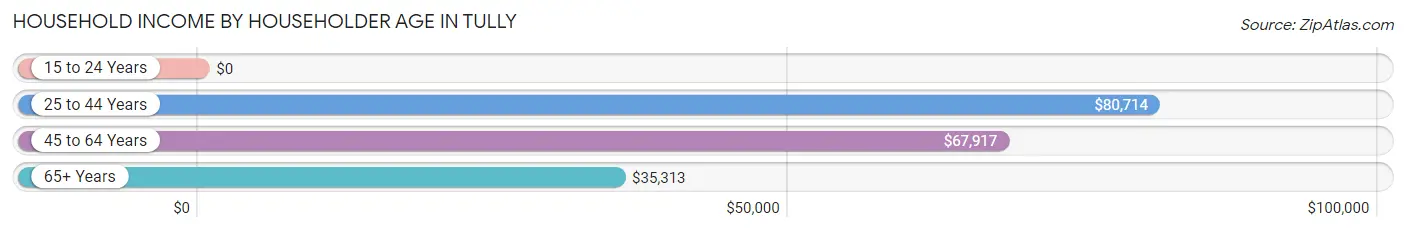
Household Income by Householder Age in Tully
The median household income in Tully is $77,700, with the highest median household income of $80,714 found in the 25 to 44 years age bracket for the primary householder. A total of 126 households (32.8%) fall into this category. Meanwhile, the 15 to 24 years age bracket for the primary householder has the lowest median household income of $0, with 15 households (3.9%) in this group.
| Income Bracket | # Households | Median Income |
| 15 to 24 Years | 15 (3.9%) | $0 |
| 25 to 44 Years | 126 (32.8%) | $80,714 |
| 45 to 64 Years | 132 (34.4%) | $67,917 |
| 65+ Years | 111 (28.9%) | $35,313 |
| Total | 384 (100.0%) | $77,700 |
Poverty in Tully
Income Below Poverty by Sex and Age in Tully
With 11.4% poverty level for males and 12.1% for females among the residents of Tully, 5 year old males and 12 to 14 year old females are the most vulnerable to poverty, with 4 males (100.0%) and 6 females (50.0%) in their respective age groups living below the poverty level.
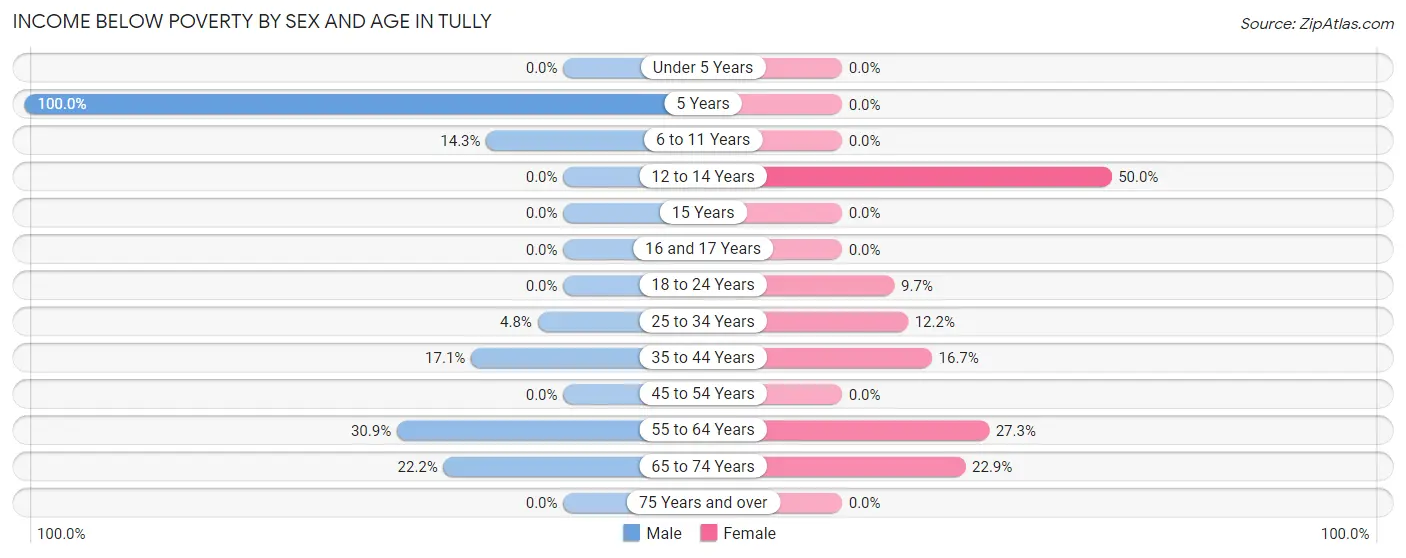
| Age Bracket | Male | Female |
| Under 5 Years | 0 (0.0%) | 0 (0.0%) |
| 5 Years | 4 (100.0%) | 0 (0.0%) |
| 6 to 11 Years | 3 (14.3%) | 0 (0.0%) |
| 12 to 14 Years | 0 (0.0%) | 6 (50.0%) |
| 15 Years | 0 (0.0%) | 0 (0.0%) |
| 16 and 17 Years | 0 (0.0%) | 0 (0.0%) |
| 18 to 24 Years | 0 (0.0%) | 7 (9.7%) |
| 25 to 34 Years | 3 (4.8%) | 6 (12.2%) |
| 35 to 44 Years | 13 (17.1%) | 11 (16.7%) |
| 45 to 54 Years | 0 (0.0%) | 0 (0.0%) |
| 55 to 64 Years | 21 (30.9%) | 18 (27.3%) |
| 65 to 74 Years | 4 (22.2%) | 19 (22.9%) |
| 75 Years and over | 0 (0.0%) | 0 (0.0%) |
| Total | 48 (11.4%) | 67 (12.1%) |
Income Above Poverty by Sex and Age in Tully
According to the poverty statistics in Tully, males aged under 5 years and females aged under 5 years are the age groups that are most secure financially, with 100.0% of males and 100.0% of females in these age groups living above the poverty line.
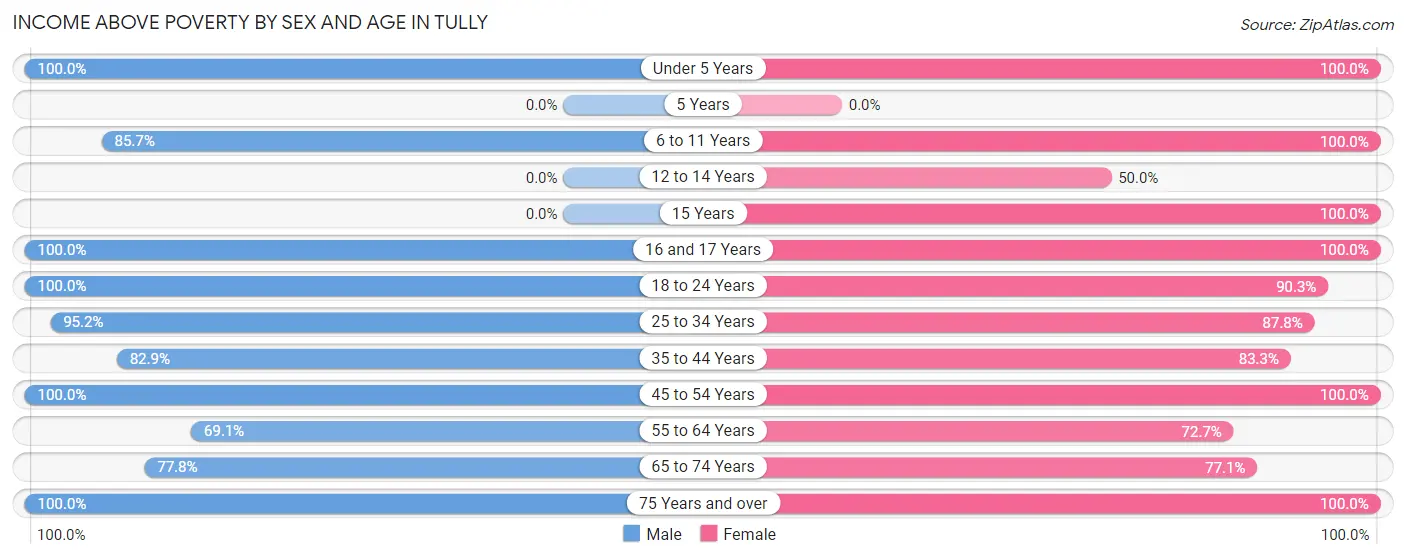
| Age Bracket | Male | Female |
| Under 5 Years | 21 (100.0%) | 82 (100.0%) |
| 5 Years | 0 (0.0%) | 0 (0.0%) |
| 6 to 11 Years | 18 (85.7%) | 7 (100.0%) |
| 12 to 14 Years | 0 (0.0%) | 6 (50.0%) |
| 15 Years | 0 (0.0%) | 6 (100.0%) |
| 16 and 17 Years | 16 (100.0%) | 9 (100.0%) |
| 18 to 24 Years | 51 (100.0%) | 65 (90.3%) |
| 25 to 34 Years | 60 (95.2%) | 43 (87.8%) |
| 35 to 44 Years | 63 (82.9%) | 55 (83.3%) |
| 45 to 54 Years | 56 (100.0%) | 55 (100.0%) |
| 55 to 64 Years | 47 (69.1%) | 48 (72.7%) |
| 65 to 74 Years | 14 (77.8%) | 64 (77.1%) |
| 75 Years and over | 28 (100.0%) | 48 (100.0%) |
| Total | 374 (88.6%) | 488 (87.9%) |
Income Below Poverty Among Married-Couple Families in Tully
The poverty statistics for married-couple families in Tully show that 9.5% or 14 of the total 148 families live below the poverty line. Families with no children have the highest poverty rate of 13.7%, comprising of 10 families. On the other hand, families with 3 or 4 children have the lowest poverty rate of 0.0%, which includes 0 families.
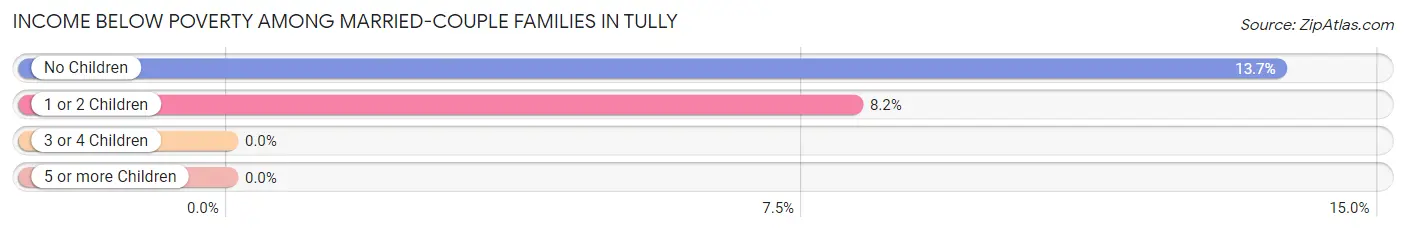
| Children | Above Poverty | Below Poverty |
| No Children | 63 (86.3%) | 10 (13.7%) |
| 1 or 2 Children | 45 (91.8%) | 4 (8.2%) |
| 3 or 4 Children | 26 (100.0%) | 0 (0.0%) |
| 5 or more Children | 0 (0.0%) | 0 (0.0%) |
| Total | 134 (90.5%) | 14 (9.5%) |
Income Below Poverty Among Single-Parent Households in Tully
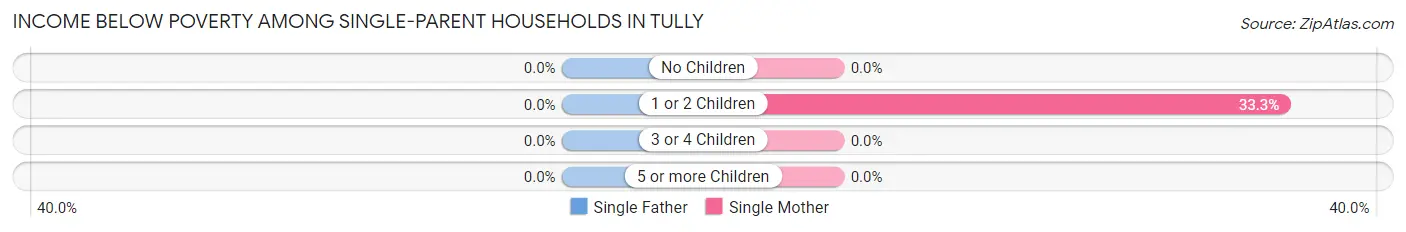
| Children | Single Father | Single Mother |
| No Children | 0 (0.0%) | 0 (0.0%) |
| 1 or 2 Children | 0 (0.0%) | 7 (33.3%) |
| 3 or 4 Children | 0 (0.0%) | 0 (0.0%) |
| 5 or more Children | 0 (0.0%) | 0 (0.0%) |
| Total | 0 (0.0%) | 7 (13.2%) |
Income Below Poverty Among Married-Couple vs Single-Parent Households in Tully
The poverty data for Tully shows that 14 of the married-couple family households (9.5%) and 7 of the single-parent households (10.4%) are living below the poverty level. Within the married-couple family households, those with no children have the highest poverty rate, with 10 households (13.7%) falling below the poverty line. Among the single-parent households, those with 1 or 2 children have the highest poverty rate, with 7 household (20.0%) living below poverty.
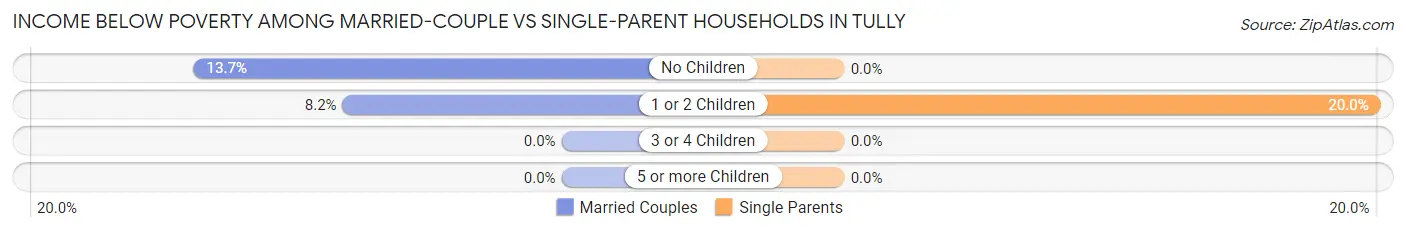
| Children | Married-Couple Families | Single-Parent Households |
| No Children | 10 (13.7%) | 0 (0.0%) |
| 1 or 2 Children | 4 (8.2%) | 7 (20.0%) |
| 3 or 4 Children | 0 (0.0%) | 0 (0.0%) |
| 5 or more Children | 0 (0.0%) | 0 (0.0%) |
| Total | 14 (9.5%) | 7 (10.4%) |
Employment Characteristics in Tully
Employment by Class of Employer in Tully
Among the 479 employed individuals in Tully, private company employees (297 | 62.0%), not-for-profit organizations (76 | 15.9%), and local government employees (50 | 10.4%) make up the most common classes of employment.
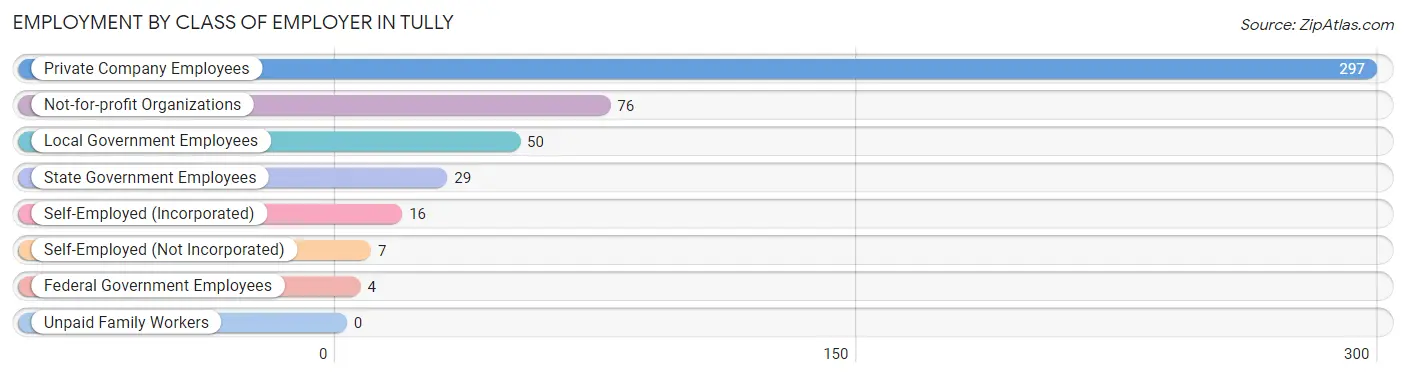
| Employer Class | # Employees | % Employees |
| Private Company Employees | 297 | 62.0% |
| Self-Employed (Incorporated) | 16 | 3.3% |
| Self-Employed (Not Incorporated) | 7 | 1.5% |
| Not-for-profit Organizations | 76 | 15.9% |
| Local Government Employees | 50 | 10.4% |
| State Government Employees | 29 | 6.0% |
| Federal Government Employees | 4 | 0.8% |
| Unpaid Family Workers | 0 | 0.0% |
| Total | 479 | 100.0% |
Employment Status by Age in Tully
According to the labor force statistics for Tully, out of the total population over 16 years of age (824), 62.3% or 513 individuals are in the labor force, with 3.1% or 16 of them unemployed. The age group with the highest labor force participation rate is 30 to 34 years, with 88.2% or 30 individuals in the labor force. Within the labor force, the 16 to 19 years age range has the highest percentage of unemployed individuals, with 27.8% or 5 of them being unemployed.
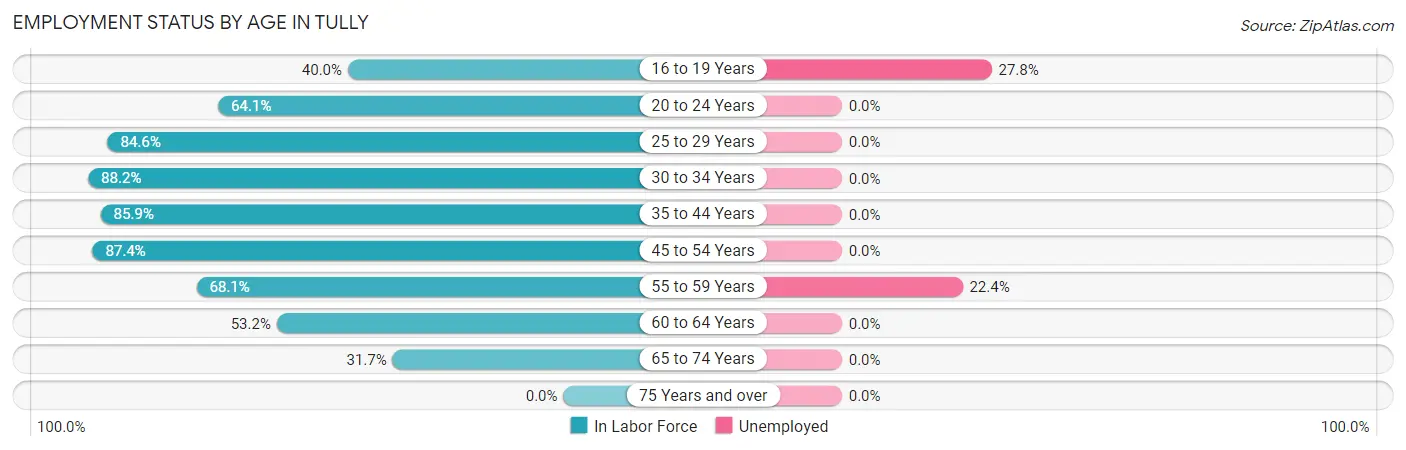
| Age Bracket | In Labor Force | Unemployed |
| 16 to 19 Years | 18 (40.0%) | 5 (27.8%) |
| 20 to 24 Years | 66 (64.1%) | 0 (0.0%) |
| 25 to 29 Years | 66 (84.6%) | 0 (0.0%) |
| 30 to 34 Years | 30 (88.2%) | 0 (0.0%) |
| 35 to 44 Years | 122 (85.9%) | 0 (0.0%) |
| 45 to 54 Years | 97 (87.4%) | 0 (0.0%) |
| 55 to 59 Years | 49 (68.1%) | 11 (22.4%) |
| 60 to 64 Years | 33 (53.2%) | 0 (0.0%) |
| 65 to 74 Years | 32 (31.7%) | 0 (0.0%) |
| 75 Years and over | 0 (0.0%) | 0 (0.0%) |
| Total | 513 (62.3%) | 16 (3.1%) |
Employment Status by Educational Attainment in Tully
According to labor force statistics for Tully, 79.6% of individuals (397) out of the total population between 25 and 64 years of age (499) are in the labor force, with 2.8% or 11 of them being unemployed. The group with the highest labor force participation rate are those with the educational attainment of bachelor's degree or higher, with 99.5% or 196 individuals in the labor force. Within the labor force, individuals with high school diploma education have the highest percentage of unemployment, with 20.0% or 11 of them being unemployed.
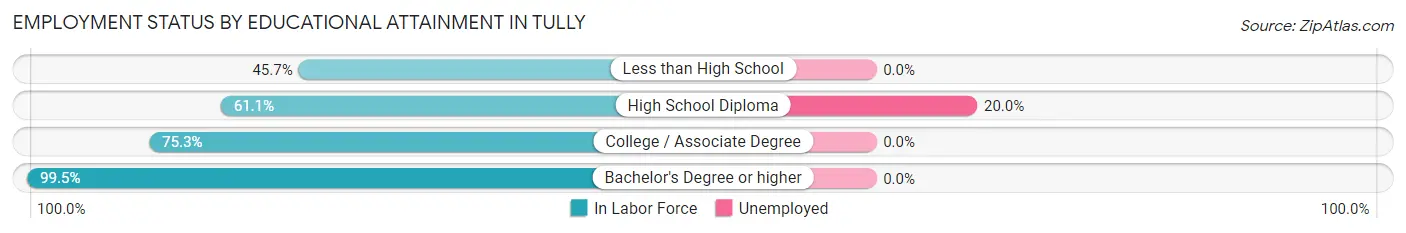
| Educational Attainment | In Labor Force | Unemployed |
| Less than High School | 21 (45.7%) | 0 (0.0%) |
| High School Diploma | 55 (61.1%) | 18 (20.0%) |
| College / Associate Degree | 125 (75.3%) | 0 (0.0%) |
| Bachelor's Degree or higher | 196 (99.5%) | 0 (0.0%) |
| Total | 397 (79.6%) | 14 (2.8%) |
Employment Occupations by Sex in Tully
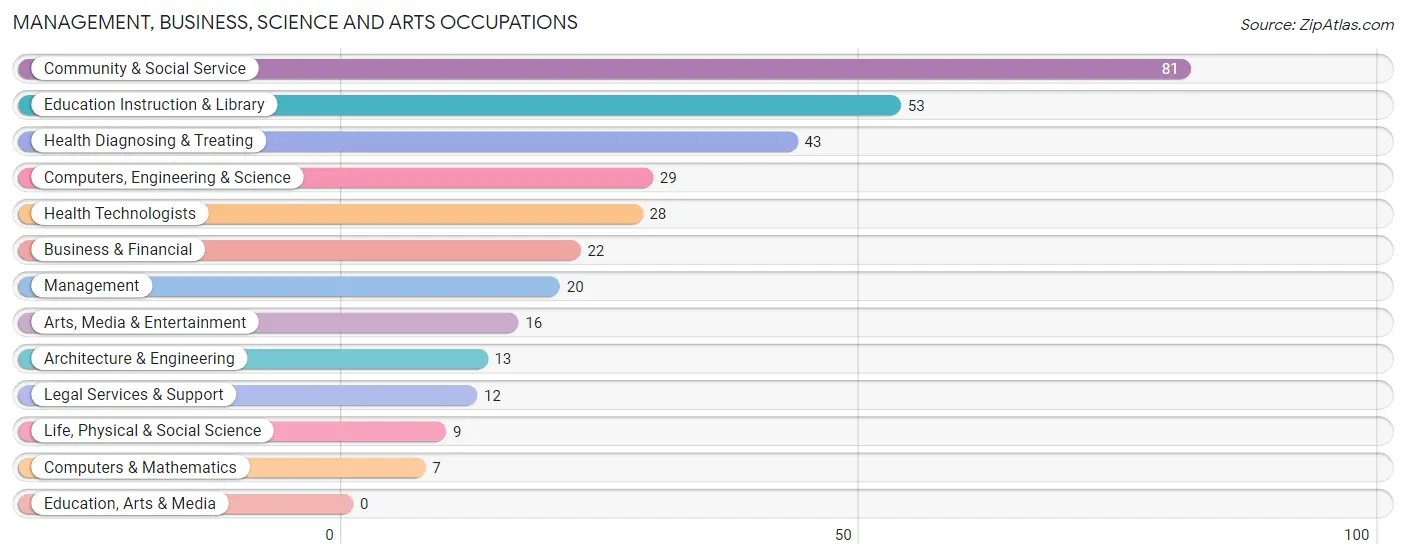
Management, Business, Science and Arts Occupations
The most common Management, Business, Science and Arts occupations in Tully are Community & Social Service (81 | 16.3%), Education Instruction & Library (53 | 10.7%), Health Diagnosing & Treating (43 | 8.6%), Computers, Engineering & Science (29 | 5.8%), and Health Technologists (28 | 5.6%).
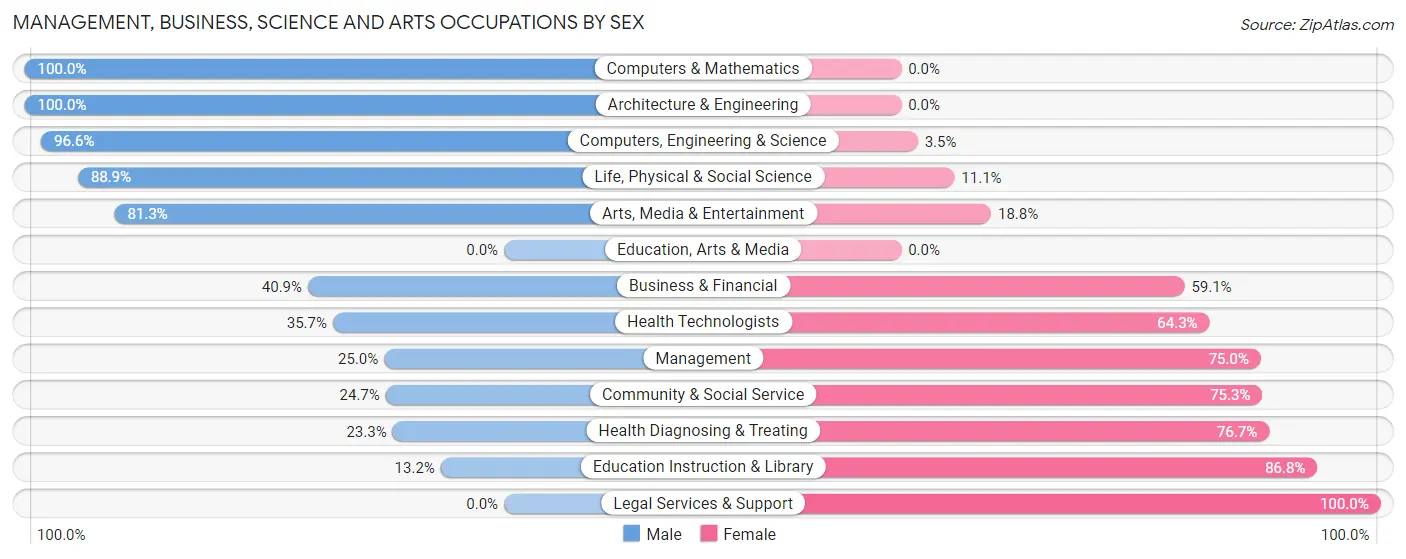
Management, Business, Science and Arts Occupations by Sex
Within the Management, Business, Science and Arts occupations in Tully, the most male-oriented occupations are Computers & Mathematics (100.0%), Architecture & Engineering (100.0%), and Computers, Engineering & Science (96.6%), while the most female-oriented occupations are Legal Services & Support (100.0%), Education Instruction & Library (86.8%), and Health Diagnosing & Treating (76.7%).
| Occupation | Male | Female |
| Management | 5 (25.0%) | 15 (75.0%) |
| Business & Financial | 9 (40.9%) | 13 (59.1%) |
| Computers, Engineering & Science | 28 (96.6%) | 1 (3.5%) |
| Computers & Mathematics | 7 (100.0%) | 0 (0.0%) |
| Architecture & Engineering | 13 (100.0%) | 0 (0.0%) |
| Life, Physical & Social Science | 8 (88.9%) | 1 (11.1%) |
| Community & Social Service | 20 (24.7%) | 61 (75.3%) |
| Education, Arts & Media | 0 (0.0%) | 0 (0.0%) |
| Legal Services & Support | 0 (0.0%) | 12 (100.0%) |
| Education Instruction & Library | 7 (13.2%) | 46 (86.8%) |
| Arts, Media & Entertainment | 13 (81.2%) | 3 (18.8%) |
| Health Diagnosing & Treating | 10 (23.3%) | 33 (76.7%) |
| Health Technologists | 10 (35.7%) | 18 (64.3%) |
| Total (Category) | 72 (36.9%) | 123 (63.1%) |
| Total (Overall) | 267 (53.7%) | 230 (46.3%) |
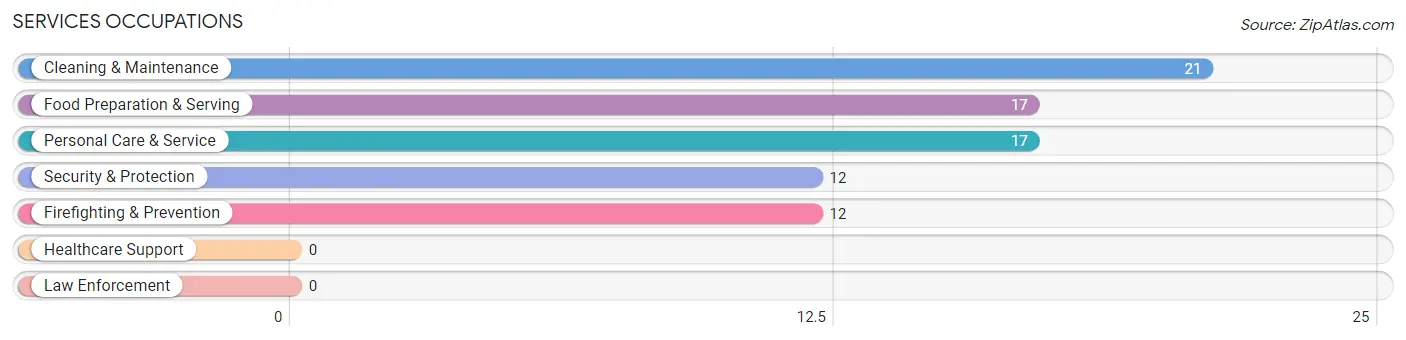
Services Occupations
The most common Services occupations in Tully are Cleaning & Maintenance (21 | 4.2%), Food Preparation & Serving (17 | 3.4%), Personal Care & Service (17 | 3.4%), Security & Protection (12 | 2.4%), and Firefighting & Prevention (12 | 2.4%).
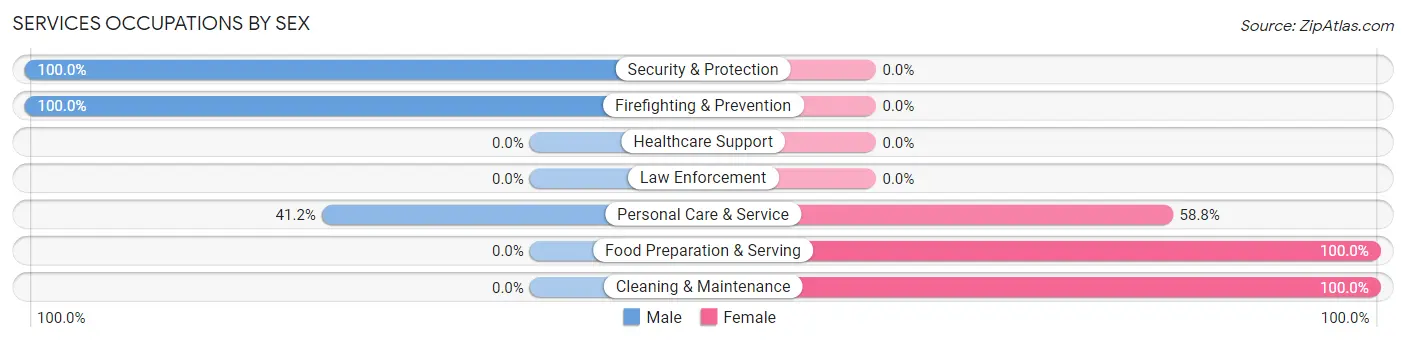
Services Occupations by Sex
Within the Services occupations in Tully, the most male-oriented occupations are Security & Protection (100.0%), Firefighting & Prevention (100.0%), and Personal Care & Service (41.2%), while the most female-oriented occupations are Food Preparation & Serving (100.0%), Cleaning & Maintenance (100.0%), and Personal Care & Service (58.8%).
| Occupation | Male | Female |
| Healthcare Support | 0 (0.0%) | 0 (0.0%) |
| Security & Protection | 12 (100.0%) | 0 (0.0%) |
| Firefighting & Prevention | 12 (100.0%) | 0 (0.0%) |
| Law Enforcement | 0 (0.0%) | 0 (0.0%) |
| Food Preparation & Serving | 0 (0.0%) | 17 (100.0%) |
| Cleaning & Maintenance | 0 (0.0%) | 21 (100.0%) |
| Personal Care & Service | 7 (41.2%) | 10 (58.8%) |
| Total (Category) | 19 (28.4%) | 48 (71.6%) |
| Total (Overall) | 267 (53.7%) | 230 (46.3%) |
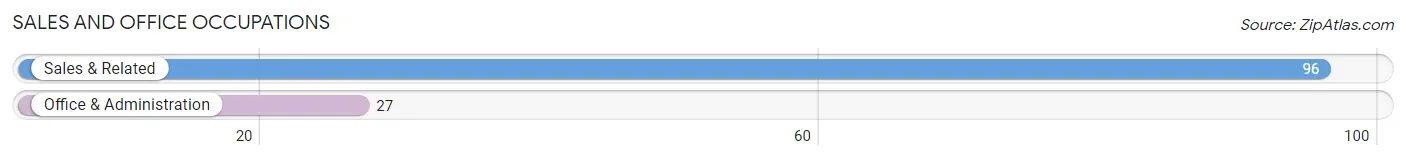
Sales and Office Occupations
The most common Sales and Office occupations in Tully are Sales & Related (96 | 19.3%), and Office & Administration (27 | 5.4%).
Sales and Office Occupations by Sex
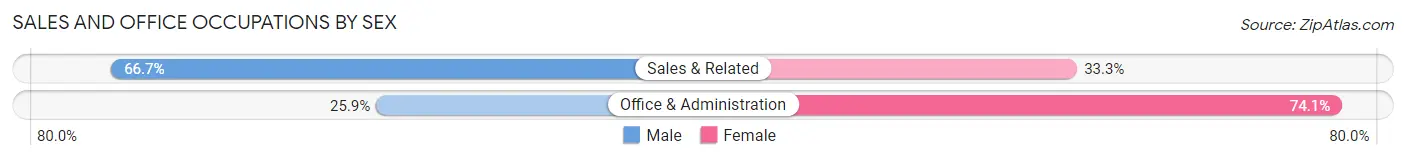
| Occupation | Male | Female |
| Sales & Related | 64 (66.7%) | 32 (33.3%) |
| Office & Administration | 7 (25.9%) | 20 (74.1%) |
| Total (Category) | 71 (57.7%) | 52 (42.3%) |
| Total (Overall) | 267 (53.7%) | 230 (46.3%) |
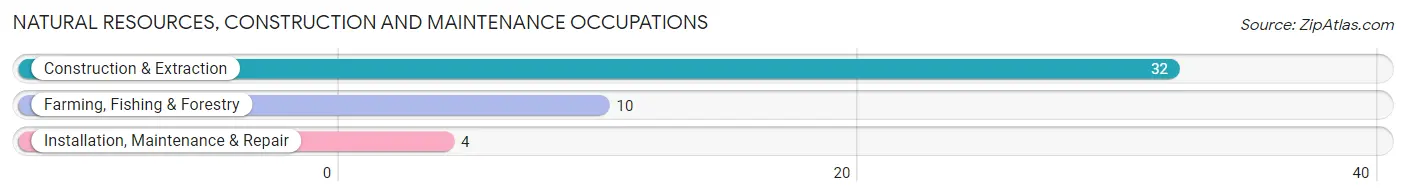
Natural Resources, Construction and Maintenance Occupations
The most common Natural Resources, Construction and Maintenance occupations in Tully are Construction & Extraction (32 | 6.4%), Farming, Fishing & Forestry (10 | 2.0%), and Installation, Maintenance & Repair (4 | 0.8%).
Natural Resources, Construction and Maintenance Occupations by Sex
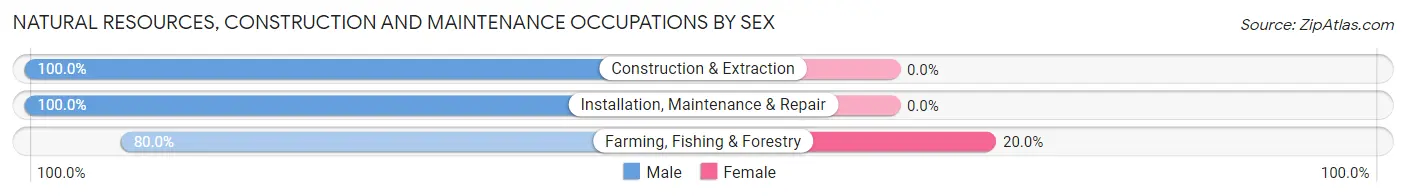
| Occupation | Male | Female |
| Farming, Fishing & Forestry | 8 (80.0%) | 2 (20.0%) |
| Construction & Extraction | 32 (100.0%) | 0 (0.0%) |
| Installation, Maintenance & Repair | 4 (100.0%) | 0 (0.0%) |
| Total (Category) | 44 (95.7%) | 2 (4.3%) |
| Total (Overall) | 267 (53.7%) | 230 (46.3%) |
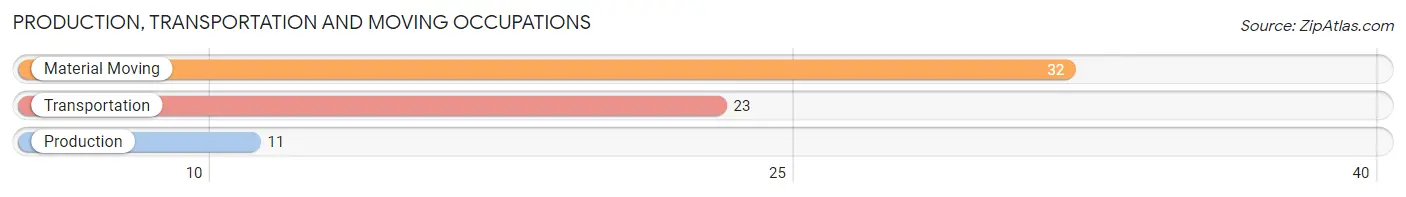
Production, Transportation and Moving Occupations
The most common Production, Transportation and Moving occupations in Tully are Material Moving (32 | 6.4%), Transportation (23 | 4.6%), and Production (11 | 2.2%).
Production, Transportation and Moving Occupations by Sex
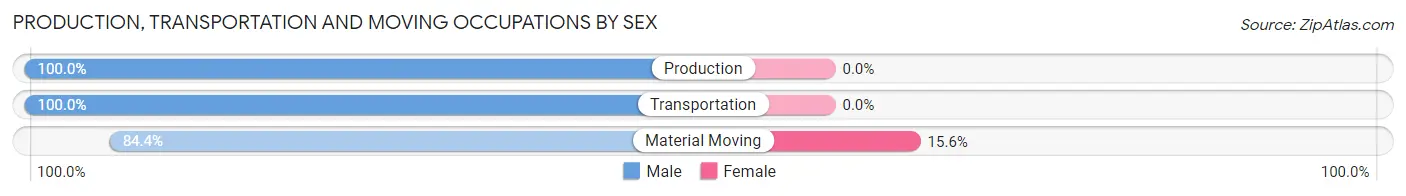
| Occupation | Male | Female |
| Production | 11 (100.0%) | 0 (0.0%) |
| Transportation | 23 (100.0%) | 0 (0.0%) |
| Material Moving | 27 (84.4%) | 5 (15.6%) |
| Total (Category) | 61 (92.4%) | 5 (7.6%) |
| Total (Overall) | 267 (53.7%) | 230 (46.3%) |
Employment Industries by Sex in Tully
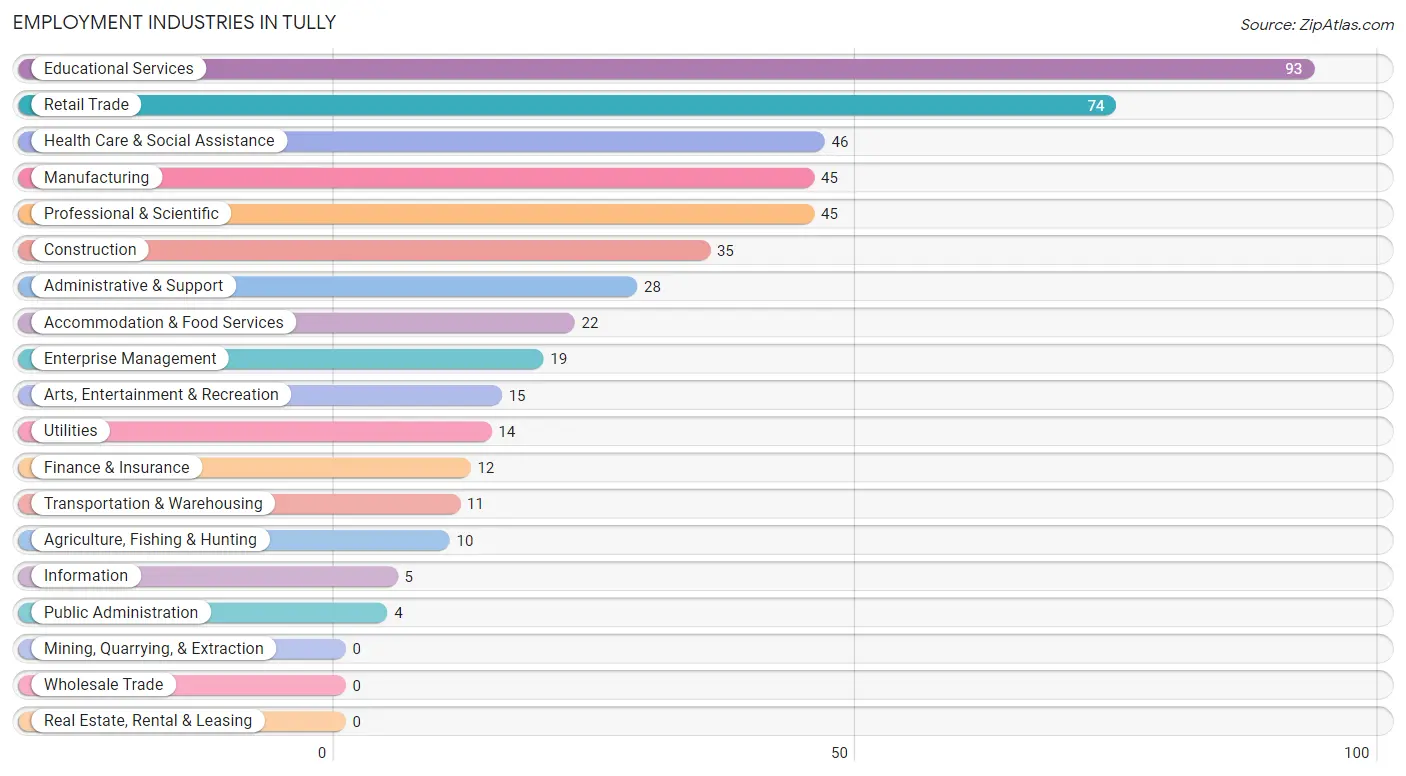
Employment Industries in Tully
The major employment industries in Tully include Educational Services (93 | 18.7%), Retail Trade (74 | 14.9%), Health Care & Social Assistance (46 | 9.3%), Manufacturing (45 | 9.0%), and Professional & Scientific (45 | 9.0%).
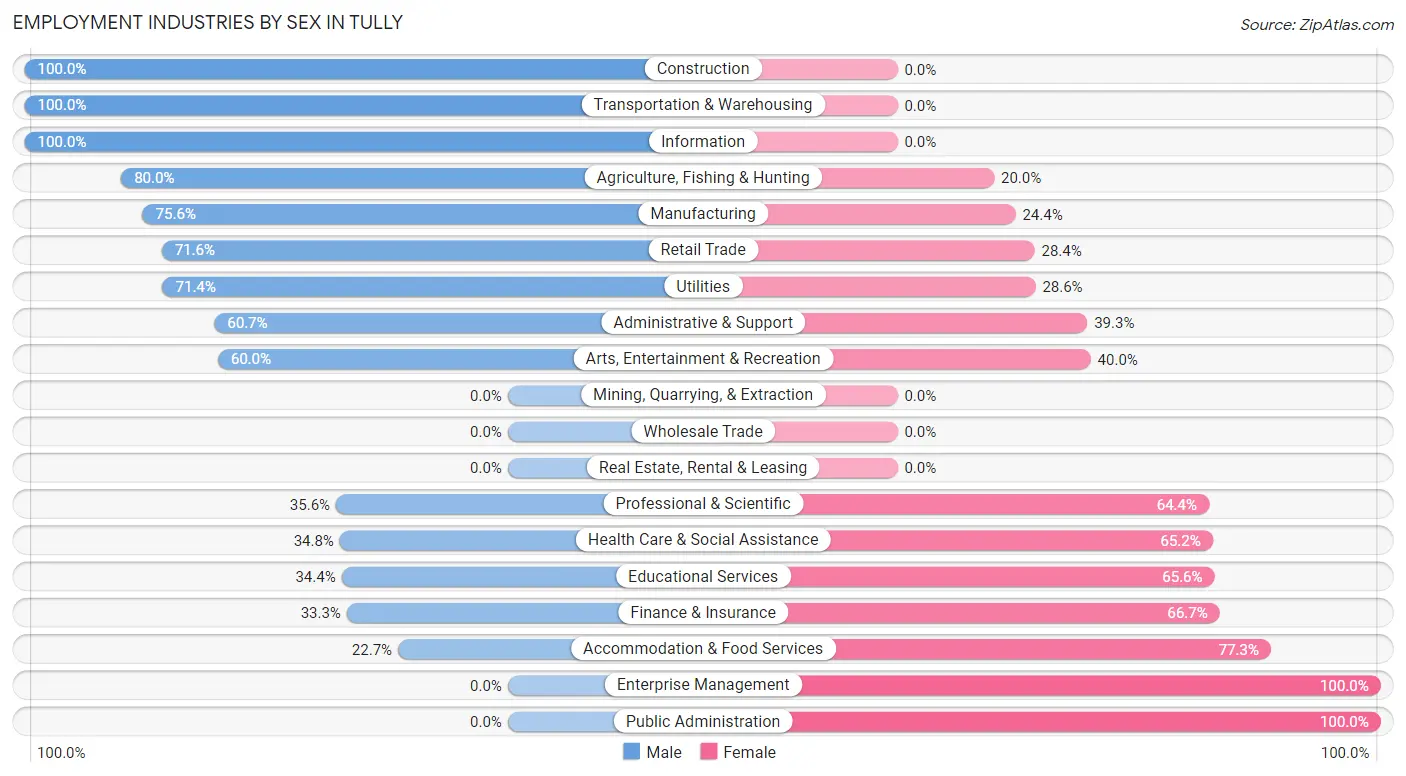
Employment Industries by Sex in Tully
The Tully industries that see more men than women are Construction (100.0%), Transportation & Warehousing (100.0%), and Information (100.0%), whereas the industries that tend to have a higher number of women are Enterprise Management (100.0%), Public Administration (100.0%), and Accommodation & Food Services (77.3%).
| Industry | Male | Female |
| Agriculture, Fishing & Hunting | 8 (80.0%) | 2 (20.0%) |
| Mining, Quarrying, & Extraction | 0 (0.0%) | 0 (0.0%) |
| Construction | 35 (100.0%) | 0 (0.0%) |
| Manufacturing | 34 (75.6%) | 11 (24.4%) |
| Wholesale Trade | 0 (0.0%) | 0 (0.0%) |
| Retail Trade | 53 (71.6%) | 21 (28.4%) |
| Transportation & Warehousing | 11 (100.0%) | 0 (0.0%) |
| Utilities | 10 (71.4%) | 4 (28.6%) |
| Information | 5 (100.0%) | 0 (0.0%) |
| Finance & Insurance | 4 (33.3%) | 8 (66.7%) |
| Real Estate, Rental & Leasing | 0 (0.0%) | 0 (0.0%) |
| Professional & Scientific | 16 (35.6%) | 29 (64.4%) |
| Enterprise Management | 0 (0.0%) | 19 (100.0%) |
| Administrative & Support | 17 (60.7%) | 11 (39.3%) |
| Educational Services | 32 (34.4%) | 61 (65.6%) |
| Health Care & Social Assistance | 16 (34.8%) | 30 (65.2%) |
| Arts, Entertainment & Recreation | 9 (60.0%) | 6 (40.0%) |
| Accommodation & Food Services | 5 (22.7%) | 17 (77.3%) |
| Public Administration | 0 (0.0%) | 4 (100.0%) |
| Total | 267 (53.7%) | 230 (46.3%) |
Education in Tully
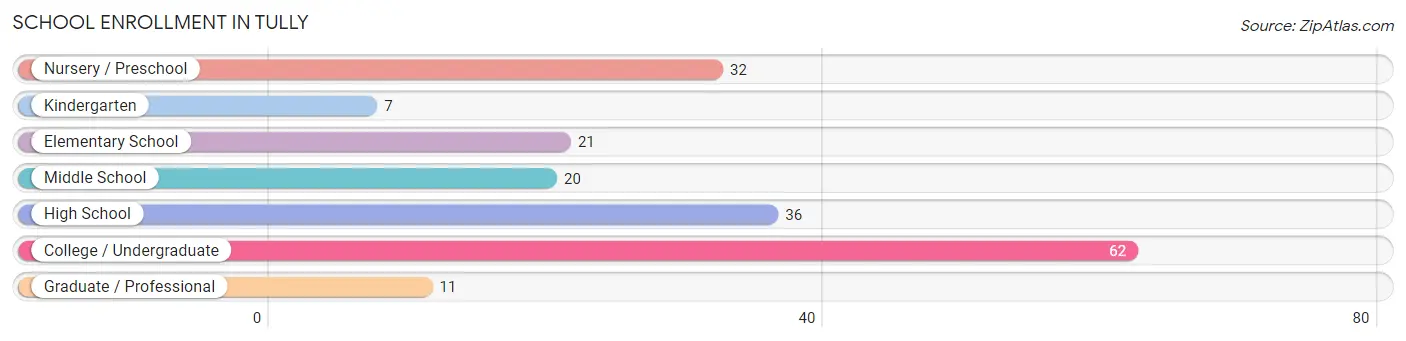
School Enrollment in Tully
The most common levels of schooling among the 189 students in Tully are college / undergraduate (62 | 32.8%), high school (36 | 19.1%), and nursery / preschool (32 | 16.9%).
| School Level | # Students | % Students |
| Nursery / Preschool | 32 | 16.9% |
| Kindergarten | 7 | 3.7% |
| Elementary School | 21 | 11.1% |
| Middle School | 20 | 10.6% |
| High School | 36 | 19.1% |
| College / Undergraduate | 62 | 32.8% |
| Graduate / Professional | 11 | 5.8% |
| Total | 189 | 100.0% |
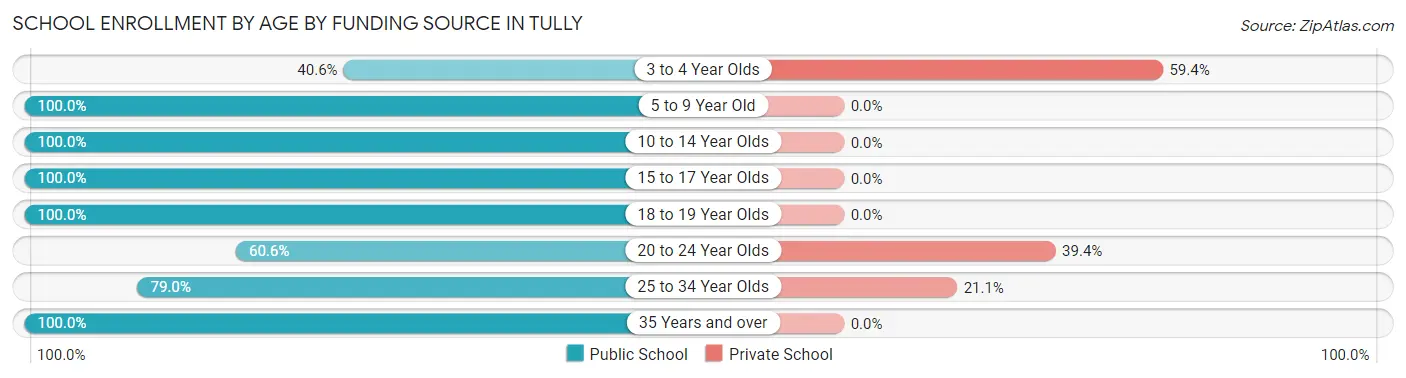
School Enrollment by Age by Funding Source in Tully
Out of a total of 189 students who are enrolled in schools in Tully, 36 (19.0%) attend a private institution, while the remaining 153 (81.0%) are enrolled in public schools. The age group of 3 to 4 year olds has the highest likelihood of being enrolled in private schools, with 19 (59.4% in the age bracket) enrolled. Conversely, the age group of 5 to 9 year old has the lowest likelihood of being enrolled in a private school, with 28 (100.0% in the age bracket) attending a public institution.
| Age Bracket | Public School | Private School |
| 3 to 4 Year Olds | 13 (40.6%) | 19 (59.4%) |
| 5 to 9 Year Old | 28 (100.0%) | 0 (0.0%) |
| 10 to 14 Year Olds | 20 (100.0%) | 0 (0.0%) |
| 15 to 17 Year Olds | 31 (100.0%) | 0 (0.0%) |
| 18 to 19 Year Olds | 15 (100.0%) | 0 (0.0%) |
| 20 to 24 Year Olds | 20 (60.6%) | 13 (39.4%) |
| 25 to 34 Year Olds | 15 (78.9%) | 4 (21.0%) |
| 35 Years and over | 11 (100.0%) | 0 (0.0%) |
| Total | 153 (81.0%) | 36 (19.0%) |
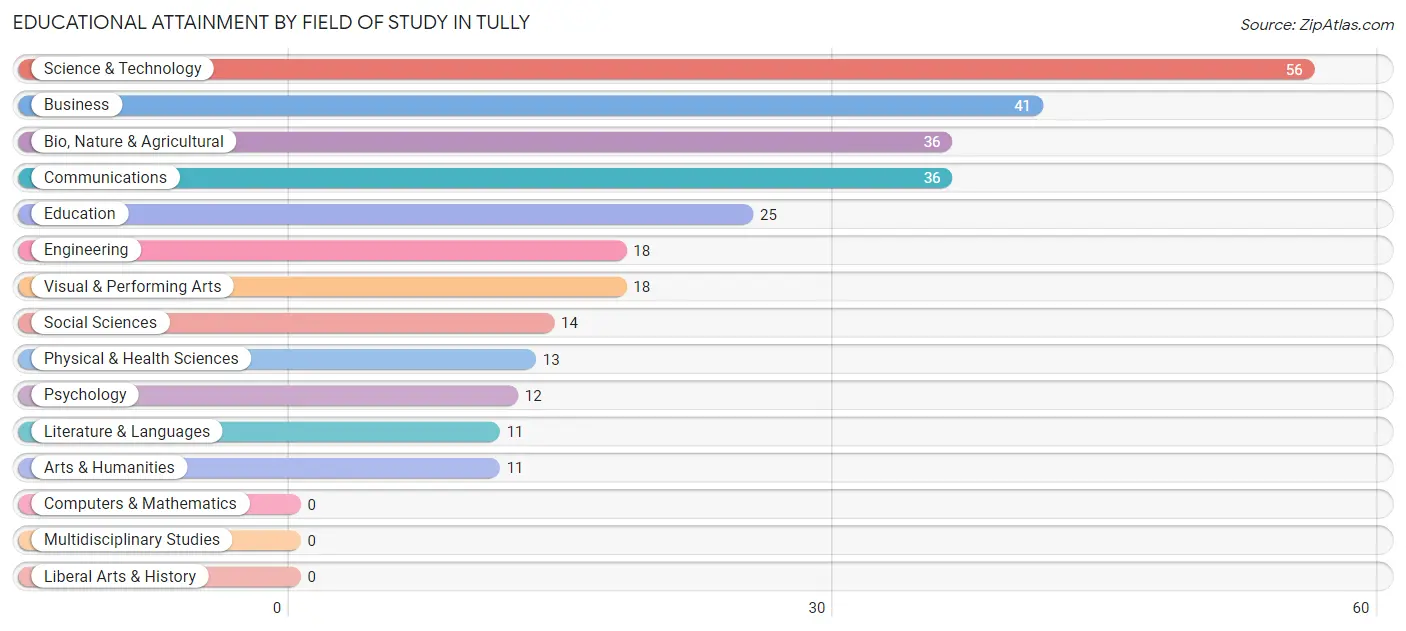
Educational Attainment by Field of Study in Tully
Science & technology (56 | 19.2%), business (41 | 14.1%), bio, nature & agricultural (36 | 12.4%), communications (36 | 12.4%), and education (25 | 8.6%) are the most common fields of study among 291 individuals in Tully who have obtained a bachelor's degree or higher.
| Field of Study | # Graduates | % Graduates |
| Computers & Mathematics | 0 | 0.0% |
| Bio, Nature & Agricultural | 36 | 12.4% |
| Physical & Health Sciences | 13 | 4.5% |
| Psychology | 12 | 4.1% |
| Social Sciences | 14 | 4.8% |
| Engineering | 18 | 6.2% |
| Multidisciplinary Studies | 0 | 0.0% |
| Science & Technology | 56 | 19.2% |
| Business | 41 | 14.1% |
| Education | 25 | 8.6% |
| Literature & Languages | 11 | 3.8% |
| Liberal Arts & History | 0 | 0.0% |
| Visual & Performing Arts | 18 | 6.2% |
| Communications | 36 | 12.4% |
| Arts & Humanities | 11 | 3.8% |
| Total | 291 | 100.0% |
Transportation & Commute in Tully
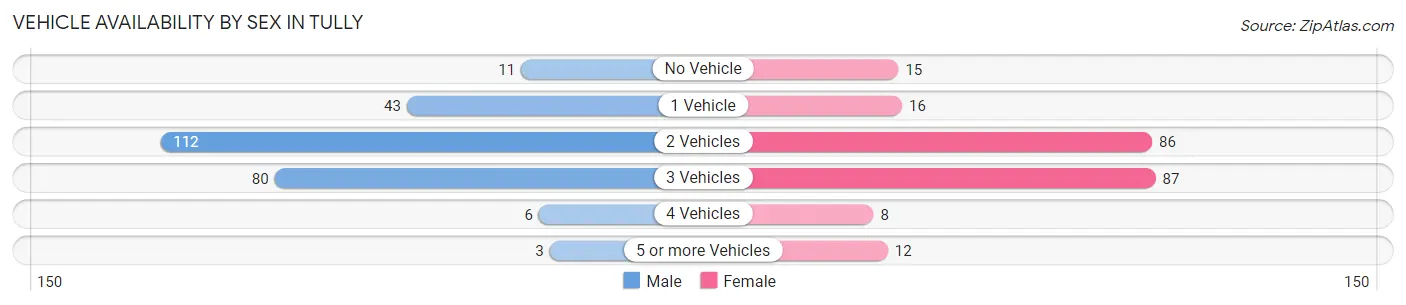
Vehicle Availability by Sex in Tully
The most prevalent vehicle ownership categories in Tully are males with 2 vehicles (112, accounting for 43.9%) and females with 2 vehicles (86, making up 50.0%).
| Vehicles Available | Male | Female |
| No Vehicle | 11 (4.3%) | 15 (6.7%) |
| 1 Vehicle | 43 (16.9%) | 16 (7.1%) |
| 2 Vehicles | 112 (43.9%) | 86 (38.4%) |
| 3 Vehicles | 80 (31.4%) | 87 (38.8%) |
| 4 Vehicles | 6 (2.4%) | 8 (3.6%) |
| 5 or more Vehicles | 3 (1.2%) | 12 (5.4%) |
| Total | 255 (100.0%) | 224 (100.0%) |
Commute Time in Tully
The most frequently occuring commute durations in Tully are 30 to 34 minutes (138 commuters, 30.7%), 20 to 24 minutes (76 commuters, 16.9%), and 25 to 29 minutes (66 commuters, 14.7%).
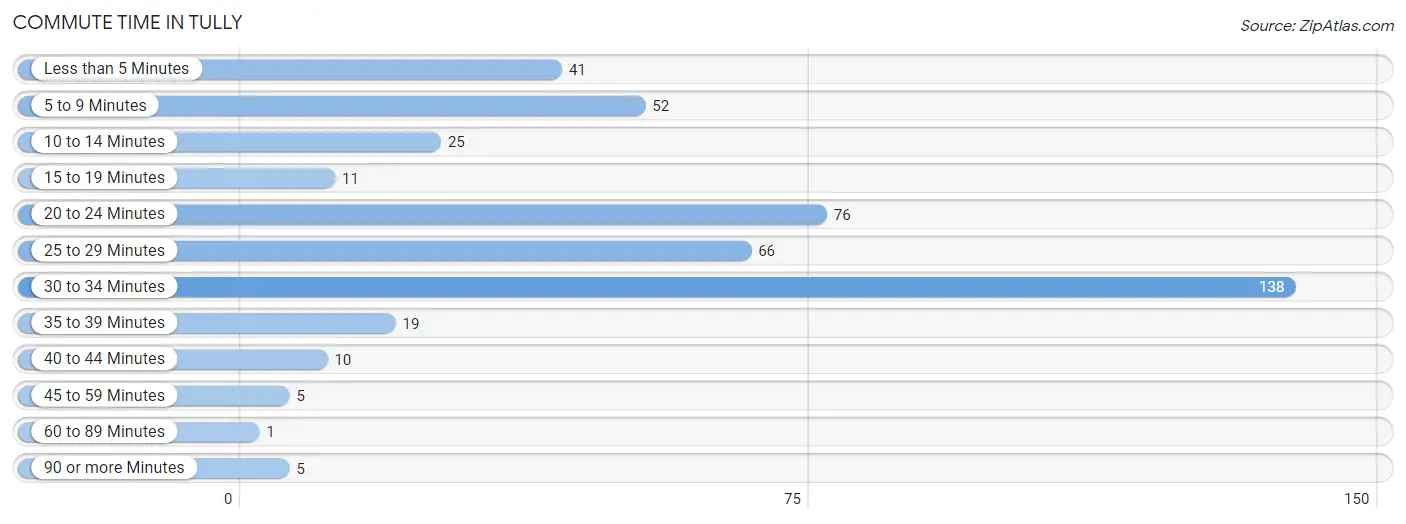
| Commute Time | # Commuters | % Commuters |
| Less than 5 Minutes | 41 | 9.1% |
| 5 to 9 Minutes | 52 | 11.6% |
| 10 to 14 Minutes | 25 | 5.6% |
| 15 to 19 Minutes | 11 | 2.5% |
| 20 to 24 Minutes | 76 | 16.9% |
| 25 to 29 Minutes | 66 | 14.7% |
| 30 to 34 Minutes | 138 | 30.7% |
| 35 to 39 Minutes | 19 | 4.2% |
| 40 to 44 Minutes | 10 | 2.2% |
| 45 to 59 Minutes | 5 | 1.1% |
| 60 to 89 Minutes | 1 | 0.2% |
| 90 or more Minutes | 5 | 1.1% |
Commute Time by Sex in Tully
The most common commute times in Tully are 30 to 34 minutes (72 commuters, 30.6%) for males and 30 to 34 minutes (66 commuters, 30.8%) for females.
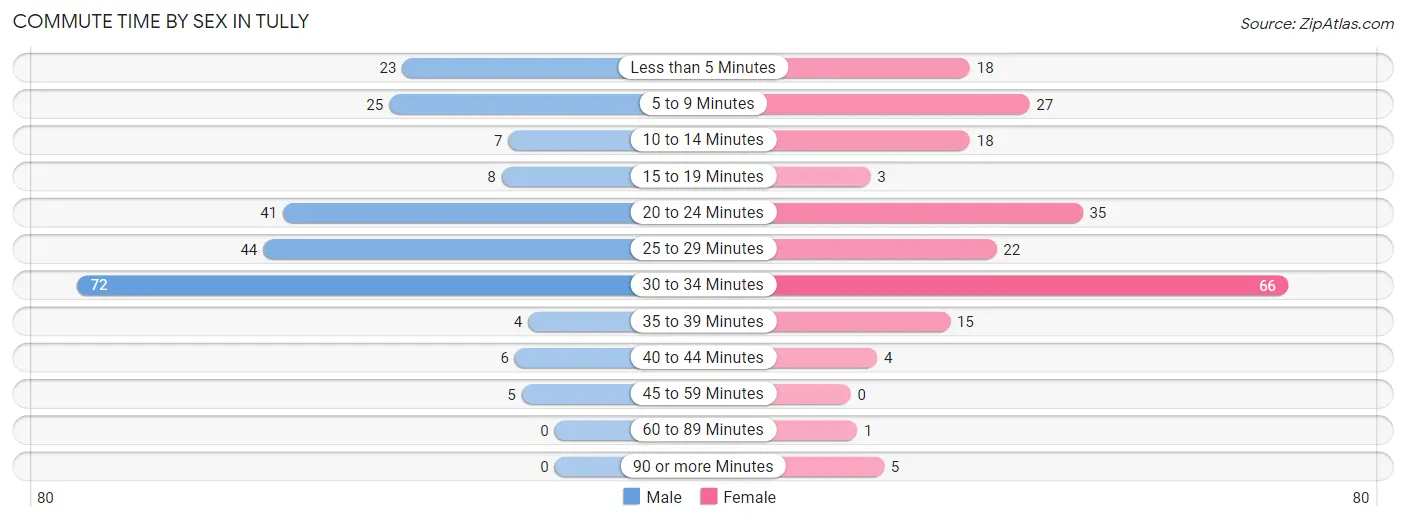
| Commute Time | Male | Female |
| Less than 5 Minutes | 23 (9.8%) | 18 (8.4%) |
| 5 to 9 Minutes | 25 (10.6%) | 27 (12.6%) |
| 10 to 14 Minutes | 7 (3.0%) | 18 (8.4%) |
| 15 to 19 Minutes | 8 (3.4%) | 3 (1.4%) |
| 20 to 24 Minutes | 41 (17.4%) | 35 (16.4%) |
| 25 to 29 Minutes | 44 (18.7%) | 22 (10.3%) |
| 30 to 34 Minutes | 72 (30.6%) | 66 (30.8%) |
| 35 to 39 Minutes | 4 (1.7%) | 15 (7.0%) |
| 40 to 44 Minutes | 6 (2.5%) | 4 (1.9%) |
| 45 to 59 Minutes | 5 (2.1%) | 0 (0.0%) |
| 60 to 89 Minutes | 0 (0.0%) | 1 (0.5%) |
| 90 or more Minutes | 0 (0.0%) | 5 (2.3%) |
Time of Departure to Work by Sex in Tully
The most frequent times of departure to work in Tully are 7:00 AM to 7:29 AM (38, 16.2%) for males and 7:30 AM to 7:59 AM (55, 25.7%) for females.
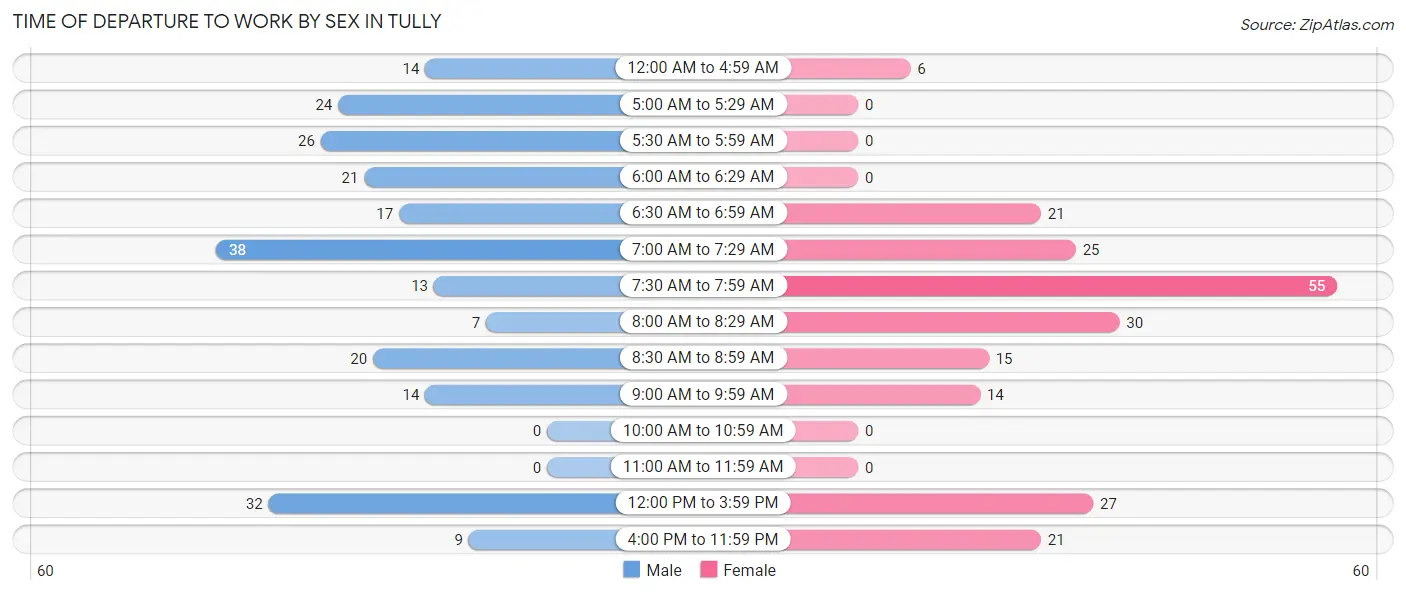
| Time of Departure | Male | Female |
| 12:00 AM to 4:59 AM | 14 (6.0%) | 6 (2.8%) |
| 5:00 AM to 5:29 AM | 24 (10.2%) | 0 (0.0%) |
| 5:30 AM to 5:59 AM | 26 (11.1%) | 0 (0.0%) |
| 6:00 AM to 6:29 AM | 21 (8.9%) | 0 (0.0%) |
| 6:30 AM to 6:59 AM | 17 (7.2%) | 21 (9.8%) |
| 7:00 AM to 7:29 AM | 38 (16.2%) | 25 (11.7%) |
| 7:30 AM to 7:59 AM | 13 (5.5%) | 55 (25.7%) |
| 8:00 AM to 8:29 AM | 7 (3.0%) | 30 (14.0%) |
| 8:30 AM to 8:59 AM | 20 (8.5%) | 15 (7.0%) |
| 9:00 AM to 9:59 AM | 14 (6.0%) | 14 (6.5%) |
| 10:00 AM to 10:59 AM | 0 (0.0%) | 0 (0.0%) |
| 11:00 AM to 11:59 AM | 0 (0.0%) | 0 (0.0%) |
| 12:00 PM to 3:59 PM | 32 (13.6%) | 27 (12.6%) |
| 4:00 PM to 11:59 PM | 9 (3.8%) | 21 (9.8%) |
| Total | 235 (100.0%) | 214 (100.0%) |
Housing Occupancy in Tully
Occupancy by Ownership in Tully
Of the total 384 dwellings in Tully, owner-occupied units account for 226 (58.9%), while renter-occupied units make up 158 (41.1%).
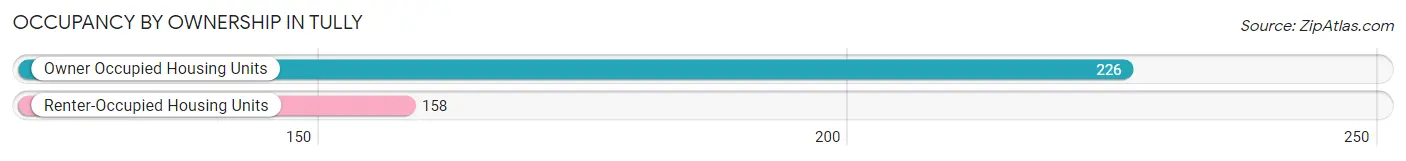
| Occupancy | # Housing Units | % Housing Units |
| Owner Occupied Housing Units | 226 | 58.9% |
| Renter-Occupied Housing Units | 158 | 41.1% |
| Total Occupied Housing Units | 384 | 100.0% |
Occupancy by Household Size in Tully
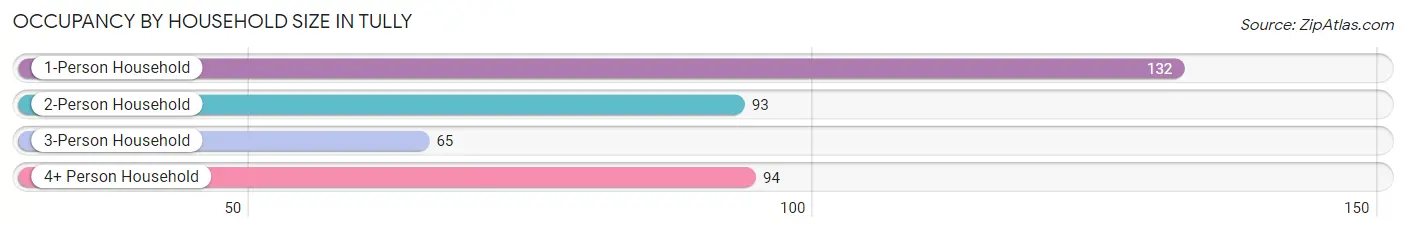
| Household Size | # Housing Units | % Housing Units |
| 1-Person Household | 132 | 34.4% |
| 2-Person Household | 93 | 24.2% |
| 3-Person Household | 65 | 16.9% |
| 4+ Person Household | 94 | 24.5% |
| Total Housing Units | 384 | 100.0% |
Occupancy by Ownership by Household Size in Tully
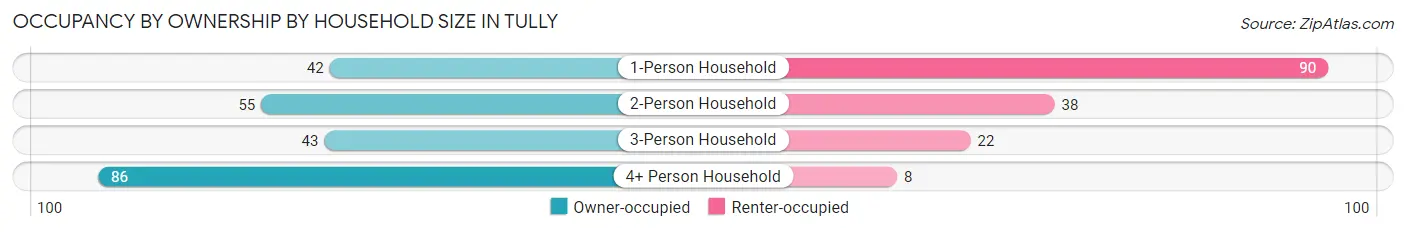
| Household Size | Owner-occupied | Renter-occupied |
| 1-Person Household | 42 (31.8%) | 90 (68.2%) |
| 2-Person Household | 55 (59.1%) | 38 (40.9%) |
| 3-Person Household | 43 (66.1%) | 22 (33.9%) |
| 4+ Person Household | 86 (91.5%) | 8 (8.5%) |
| Total Housing Units | 226 (58.9%) | 158 (41.1%) |
Occupancy by Educational Attainment in Tully
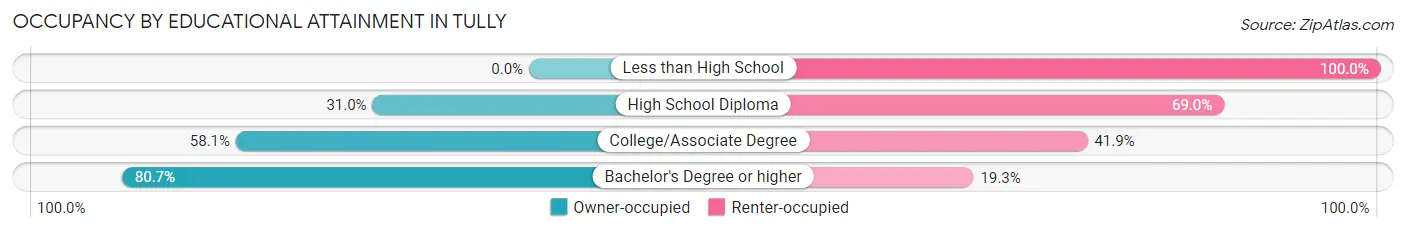
| Household Size | Owner-occupied | Renter-occupied |
| Less than High School | 0 (0.0%) | 9 (100.0%) |
| High School Diploma | 27 (31.0%) | 60 (69.0%) |
| College/Associate Degree | 86 (58.1%) | 62 (41.9%) |
| Bachelor's Degree or higher | 113 (80.7%) | 27 (19.3%) |
Occupancy by Age of Householder in Tully
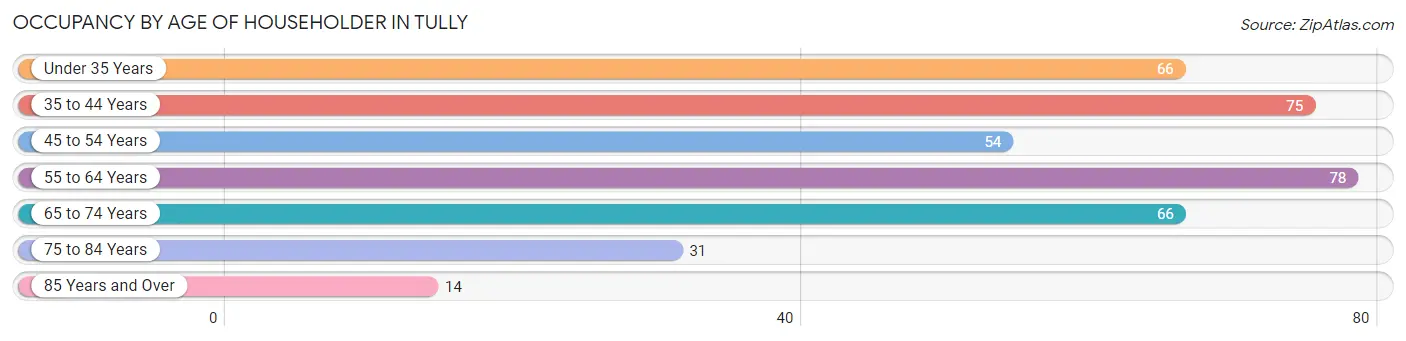
| Age Bracket | # Households | % Households |
| Under 35 Years | 66 | 17.2% |
| 35 to 44 Years | 75 | 19.5% |
| 45 to 54 Years | 54 | 14.1% |
| 55 to 64 Years | 78 | 20.3% |
| 65 to 74 Years | 66 | 17.2% |
| 75 to 84 Years | 31 | 8.1% |
| 85 Years and Over | 14 | 3.6% |
| Total | 384 | 100.0% |
Housing Finances in Tully
Median Income by Occupancy in Tully
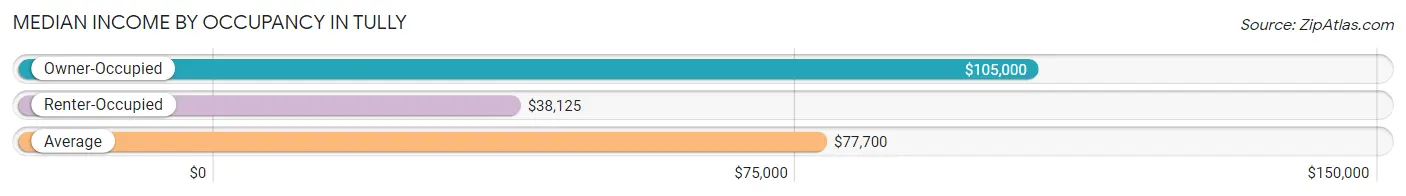
| Occupancy Type | # Households | Median Income |
| Owner-Occupied | 226 (58.9%) | $105,000 |
| Renter-Occupied | 158 (41.1%) | $38,125 |
| Average | 384 (100.0%) | $77,700 |
Occupancy by Householder Income Bracket in Tully
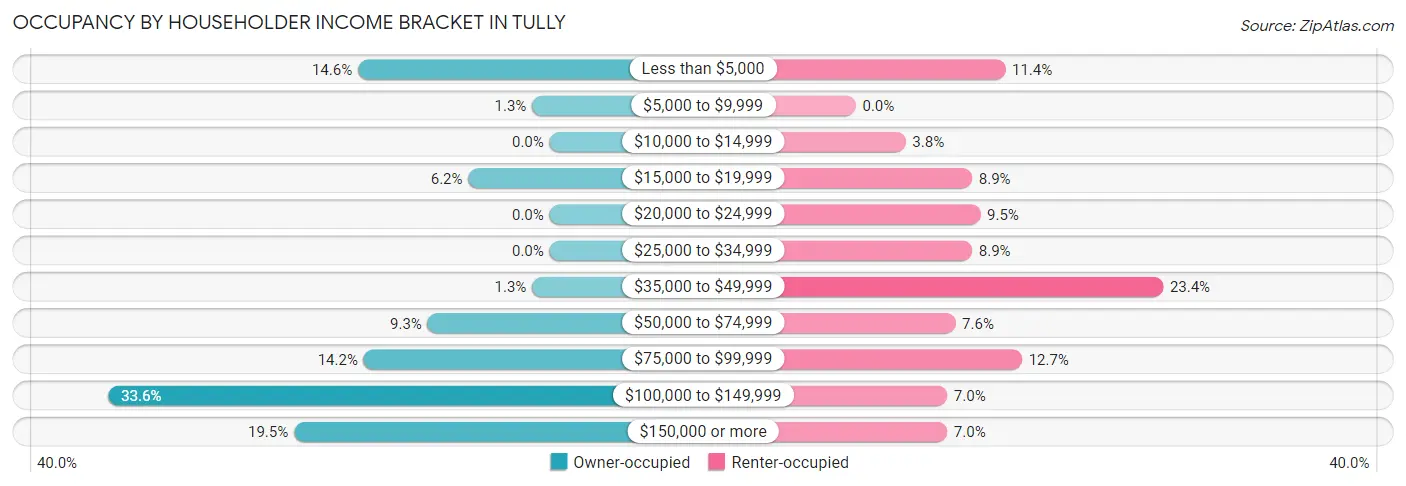
| Income Bracket | Owner-occupied | Renter-occupied |
| Less than $5,000 | 33 (14.6%) | 18 (11.4%) |
| $5,000 to $9,999 | 3 (1.3%) | 0 (0.0%) |
| $10,000 to $14,999 | 0 (0.0%) | 6 (3.8%) |
| $15,000 to $19,999 | 14 (6.2%) | 14 (8.9%) |
| $20,000 to $24,999 | 0 (0.0%) | 15 (9.5%) |
| $25,000 to $34,999 | 0 (0.0%) | 14 (8.9%) |
| $35,000 to $49,999 | 3 (1.3%) | 37 (23.4%) |
| $50,000 to $74,999 | 21 (9.3%) | 12 (7.6%) |
| $75,000 to $99,999 | 32 (14.2%) | 20 (12.7%) |
| $100,000 to $149,999 | 76 (33.6%) | 11 (7.0%) |
| $150,000 or more | 44 (19.5%) | 11 (7.0%) |
| Total | 226 (100.0%) | 158 (100.0%) |
Monthly Housing Cost Tiers in Tully
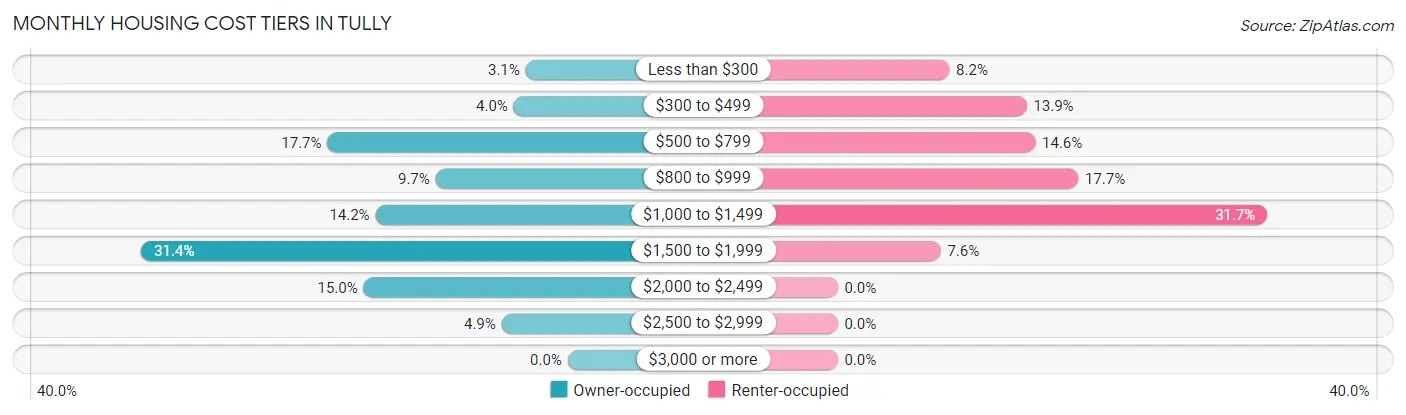
| Monthly Cost | Owner-occupied | Renter-occupied |
| Less than $300 | 7 (3.1%) | 13 (8.2%) |
| $300 to $499 | 9 (4.0%) | 22 (13.9%) |
| $500 to $799 | 40 (17.7%) | 23 (14.6%) |
| $800 to $999 | 22 (9.7%) | 28 (17.7%) |
| $1,000 to $1,499 | 32 (14.2%) | 50 (31.7%) |
| $1,500 to $1,999 | 71 (31.4%) | 12 (7.6%) |
| $2,000 to $2,499 | 34 (15.0%) | 0 (0.0%) |
| $2,500 to $2,999 | 11 (4.9%) | 0 (0.0%) |
| $3,000 or more | 0 (0.0%) | 0 (0.0%) |
| Total | 226 (100.0%) | 158 (100.0%) |
Physical Housing Characteristics in Tully
Housing Structures in Tully
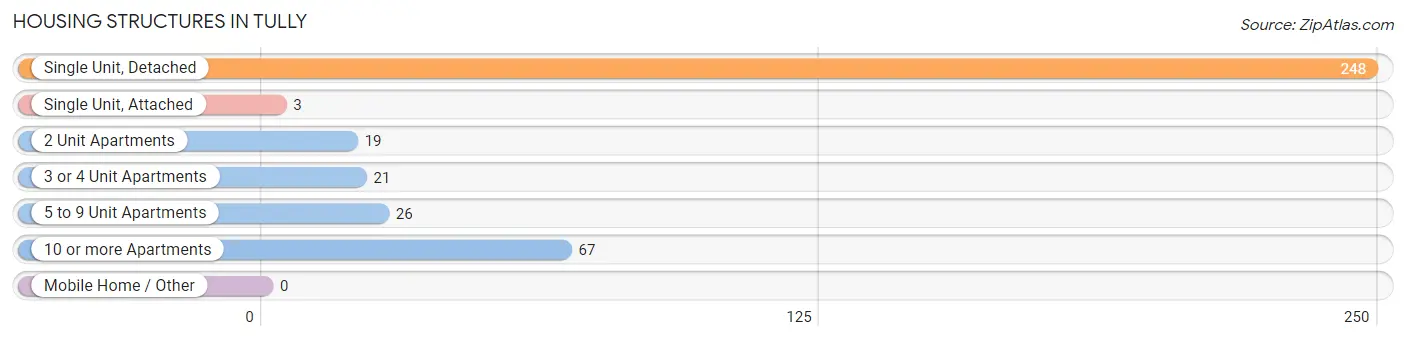
| Structure Type | # Housing Units | % Housing Units |
| Single Unit, Detached | 248 | 64.6% |
| Single Unit, Attached | 3 | 0.8% |
| 2 Unit Apartments | 19 | 5.0% |
| 3 or 4 Unit Apartments | 21 | 5.5% |
| 5 to 9 Unit Apartments | 26 | 6.8% |
| 10 or more Apartments | 67 | 17.4% |
| Mobile Home / Other | 0 | 0.0% |
| Total | 384 | 100.0% |
Housing Structures by Occupancy in Tully
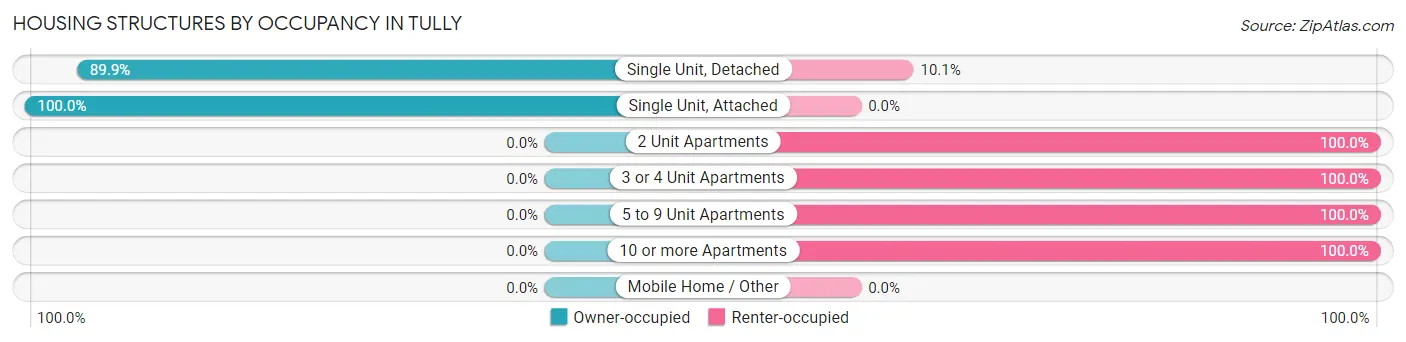
| Structure Type | Owner-occupied | Renter-occupied |
| Single Unit, Detached | 223 (89.9%) | 25 (10.1%) |
| Single Unit, Attached | 3 (100.0%) | 0 (0.0%) |
| 2 Unit Apartments | 0 (0.0%) | 19 (100.0%) |
| 3 or 4 Unit Apartments | 0 (0.0%) | 21 (100.0%) |
| 5 to 9 Unit Apartments | 0 (0.0%) | 26 (100.0%) |
| 10 or more Apartments | 0 (0.0%) | 67 (100.0%) |
| Mobile Home / Other | 0 (0.0%) | 0 (0.0%) |
| Total | 226 (58.9%) | 158 (41.1%) |
Housing Structures by Number of Rooms in Tully
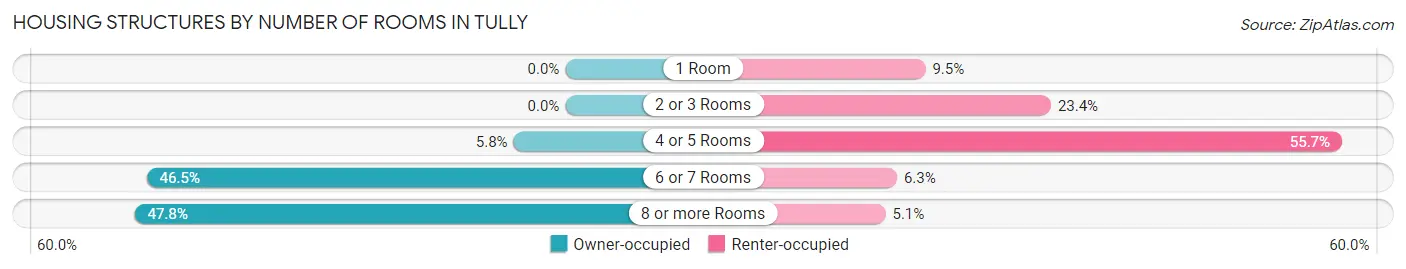
| Number of Rooms | Owner-occupied | Renter-occupied |
| 1 Room | 0 (0.0%) | 15 (9.5%) |
| 2 or 3 Rooms | 0 (0.0%) | 37 (23.4%) |
| 4 or 5 Rooms | 13 (5.8%) | 88 (55.7%) |
| 6 or 7 Rooms | 105 (46.5%) | 10 (6.3%) |
| 8 or more Rooms | 108 (47.8%) | 8 (5.1%) |
| Total | 226 (100.0%) | 158 (100.0%) |
Housing Structure by Heating Type in Tully
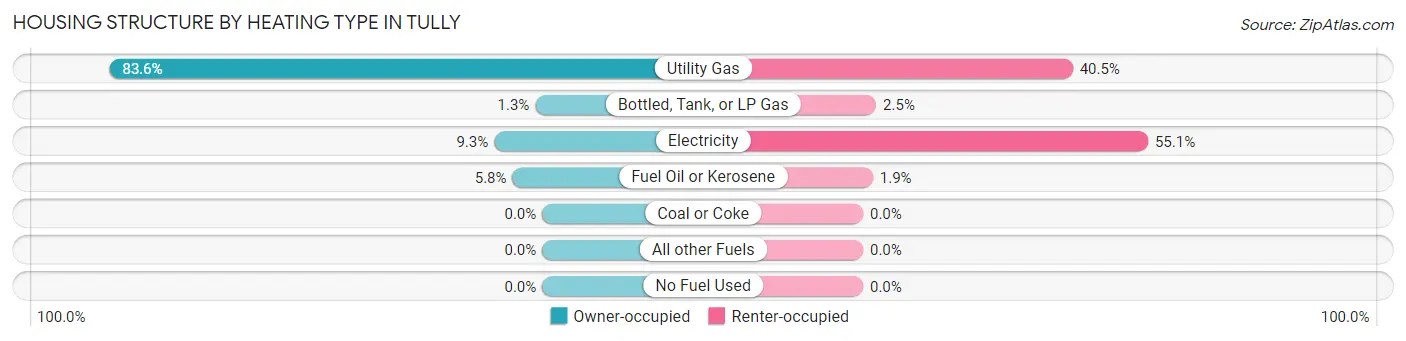
| Heating Type | Owner-occupied | Renter-occupied |
| Utility Gas | 189 (83.6%) | 64 (40.5%) |
| Bottled, Tank, or LP Gas | 3 (1.3%) | 4 (2.5%) |
| Electricity | 21 (9.3%) | 87 (55.1%) |
| Fuel Oil or Kerosene | 13 (5.8%) | 3 (1.9%) |
| Coal or Coke | 0 (0.0%) | 0 (0.0%) |
| All other Fuels | 0 (0.0%) | 0 (0.0%) |
| No Fuel Used | 0 (0.0%) | 0 (0.0%) |
| Total | 226 (100.0%) | 158 (100.0%) |
Household Vehicle Usage in Tully
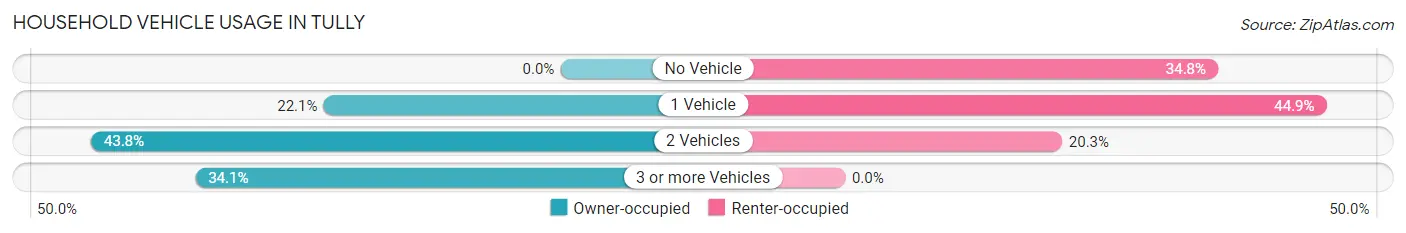
| Vehicles per Household | Owner-occupied | Renter-occupied |
| No Vehicle | 0 (0.0%) | 55 (34.8%) |
| 1 Vehicle | 50 (22.1%) | 71 (44.9%) |
| 2 Vehicles | 99 (43.8%) | 32 (20.3%) |
| 3 or more Vehicles | 77 (34.1%) | 0 (0.0%) |
| Total | 226 (100.0%) | 158 (100.0%) |
Real Estate & Mortgages in Tully
Real Estate and Mortgage Overview in Tully
| Characteristic | Without Mortgage | With Mortgage |
| Housing Units | 78 | 148 |
| Median Property Value | $141,700 | $167,700 |
| Median Household Income | $108,125 | $18 |
| Monthly Housing Costs | $733 | $0 |
| Real Estate Taxes | $4,875 | $0 |
Property Value by Mortgage Status in Tully
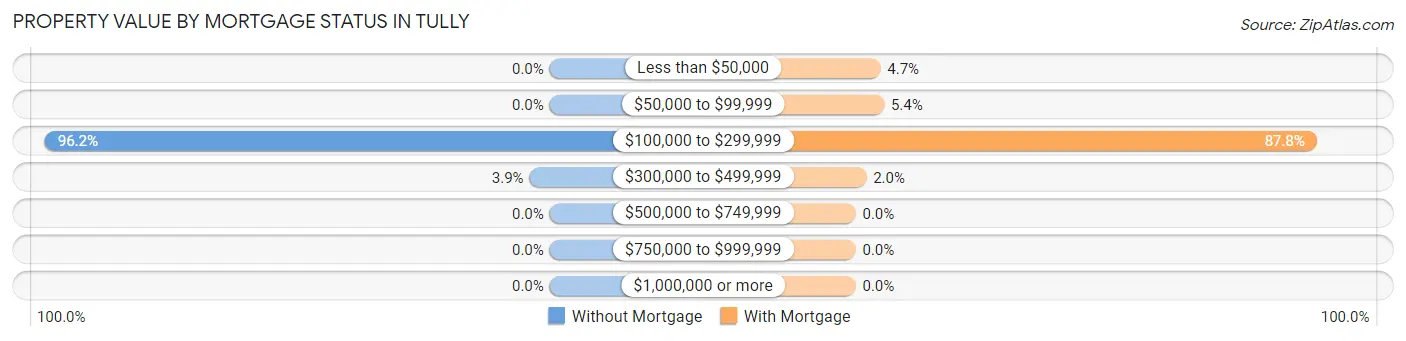
| Property Value | Without Mortgage | With Mortgage |
| Less than $50,000 | 0 (0.0%) | 7 (4.7%) |
| $50,000 to $99,999 | 0 (0.0%) | 8 (5.4%) |
| $100,000 to $299,999 | 75 (96.2%) | 130 (87.8%) |
| $300,000 to $499,999 | 3 (3.8%) | 3 (2.0%) |
| $500,000 to $749,999 | 0 (0.0%) | 0 (0.0%) |
| $750,000 to $999,999 | 0 (0.0%) | 0 (0.0%) |
| $1,000,000 or more | 0 (0.0%) | 0 (0.0%) |
| Total | 78 (100.0%) | 148 (100.0%) |
Household Income by Mortgage Status in Tully
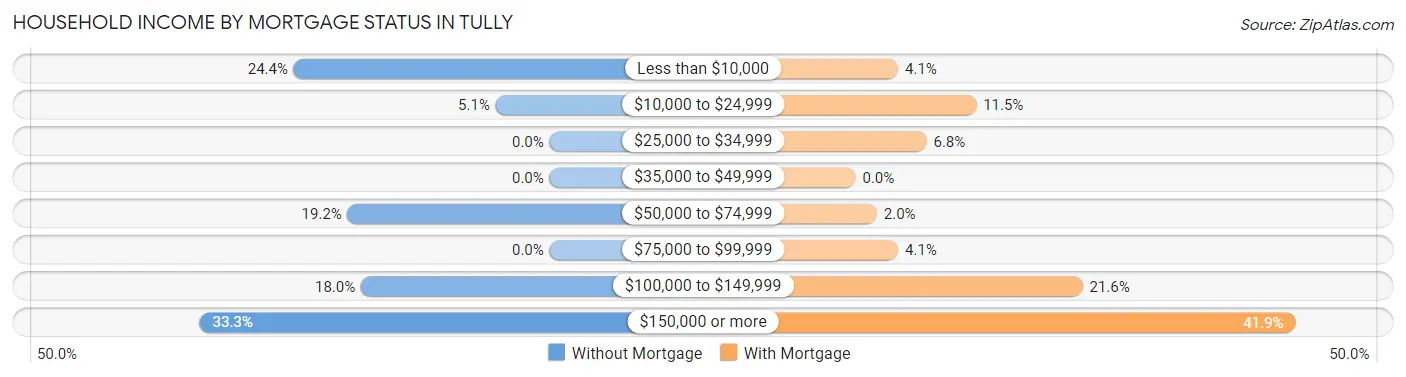
| Household Income | Without Mortgage | With Mortgage |
| Less than $10,000 | 19 (24.4%) | 6 (4.1%) |
| $10,000 to $24,999 | 4 (5.1%) | 17 (11.5%) |
| $25,000 to $34,999 | 0 (0.0%) | 10 (6.8%) |
| $35,000 to $49,999 | 0 (0.0%) | 0 (0.0%) |
| $50,000 to $74,999 | 15 (19.2%) | 3 (2.0%) |
| $75,000 to $99,999 | 0 (0.0%) | 6 (4.1%) |
| $100,000 to $149,999 | 14 (17.9%) | 32 (21.6%) |
| $150,000 or more | 26 (33.3%) | 62 (41.9%) |
| Total | 78 (100.0%) | 148 (100.0%) |
Property Value to Household Income Ratio in Tully
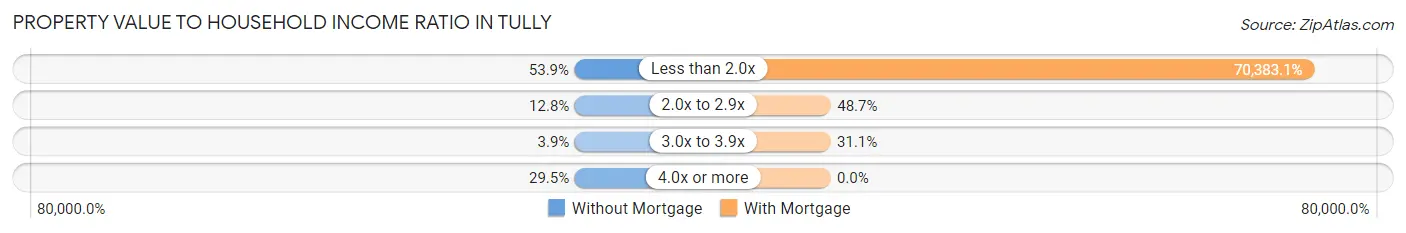
| Value-to-Income Ratio | Without Mortgage | With Mortgage |
| Less than 2.0x | 42 (53.8%) | 104,167 (70,383.1%) |
| 2.0x to 2.9x | 10 (12.8%) | 72 (48.6%) |
| 3.0x to 3.9x | 3 (3.8%) | 46 (31.1%) |
| 4.0x or more | 23 (29.5%) | 0 (0.0%) |
| Total | 78 (100.0%) | 148 (100.0%) |
Real Estate Taxes by Mortgage Status in Tully
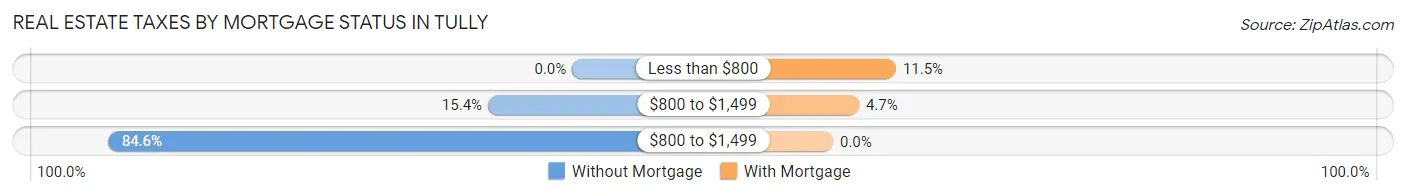
| Property Taxes | Without Mortgage | With Mortgage |
| Less than $800 | 0 (0.0%) | 17 (11.5%) |
| $800 to $1,499 | 12 (15.4%) | 7 (4.7%) |
| $800 to $1,499 | 66 (84.6%) | 0 (0.0%) |
| Total | 78 (100.0%) | 148 (100.0%) |
Health & Disability in Tully
Health Insurance Coverage by Age in Tully
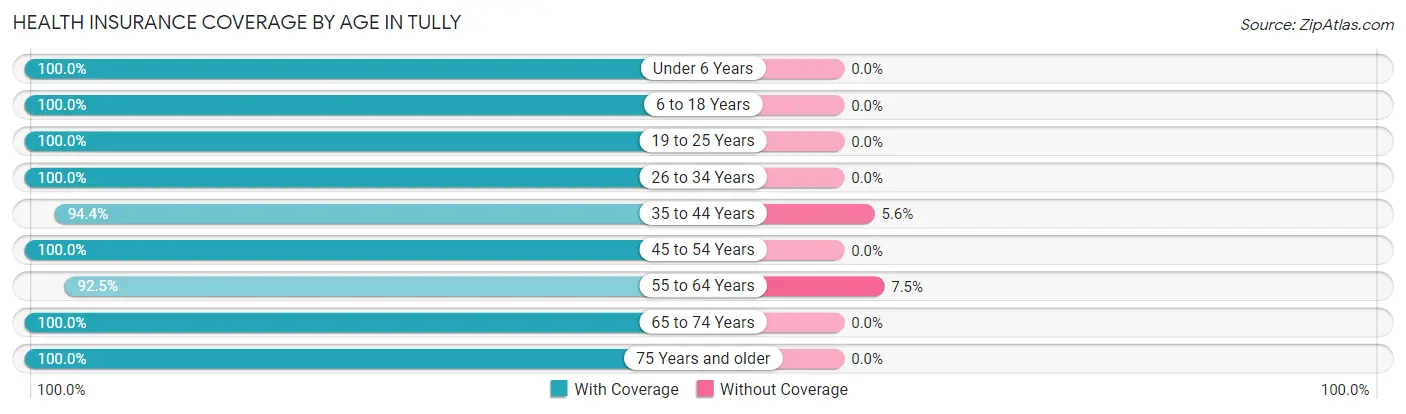
| Age Bracket | With Coverage | Without Coverage |
| Under 6 Years | 107 (100.0%) | 0 (0.0%) |
| 6 to 18 Years | 90 (100.0%) | 0 (0.0%) |
| 19 to 25 Years | 125 (100.0%) | 0 (0.0%) |
| 26 to 34 Years | 99 (100.0%) | 0 (0.0%) |
| 35 to 44 Years | 134 (94.4%) | 8 (5.6%) |
| 45 to 54 Years | 111 (100.0%) | 0 (0.0%) |
| 55 to 64 Years | 124 (92.5%) | 10 (7.5%) |
| 65 to 74 Years | 101 (100.0%) | 0 (0.0%) |
| 75 Years and older | 76 (100.0%) | 0 (0.0%) |
| Total | 967 (98.2%) | 18 (1.8%) |
Health Insurance Coverage by Citizenship Status in Tully
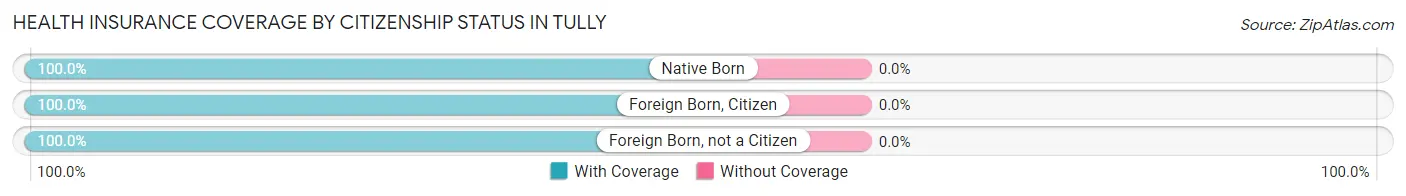
| Citizenship Status | With Coverage | Without Coverage |
| Native Born | 107 (100.0%) | 0 (0.0%) |
| Foreign Born, Citizen | 90 (100.0%) | 0 (0.0%) |
| Foreign Born, not a Citizen | 125 (100.0%) | 0 (0.0%) |
Health Insurance Coverage by Household Income in Tully
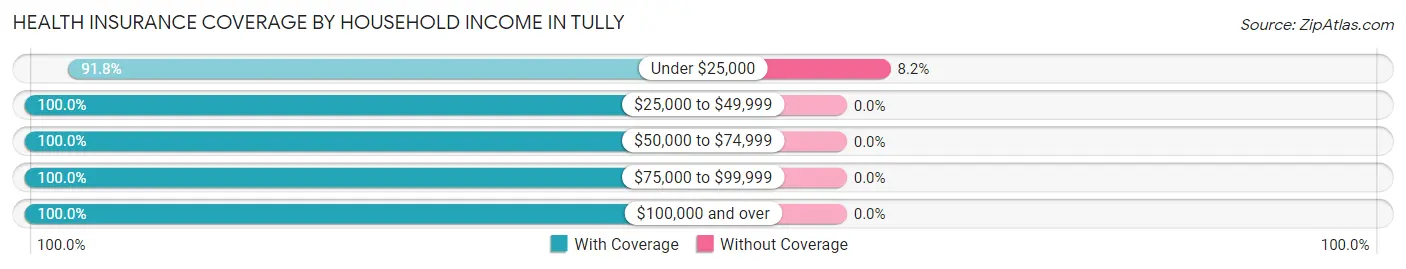
| Household Income | With Coverage | Without Coverage |
| Under $25,000 | 112 (91.8%) | 10 (8.2%) |
| $25,000 to $49,999 | 106 (100.0%) | 0 (0.0%) |
| $50,000 to $74,999 | 78 (100.0%) | 0 (0.0%) |
| $75,000 to $99,999 | 183 (100.0%) | 0 (0.0%) |
| $100,000 and over | 478 (100.0%) | 0 (0.0%) |
Public vs Private Health Insurance Coverage by Age in Tully
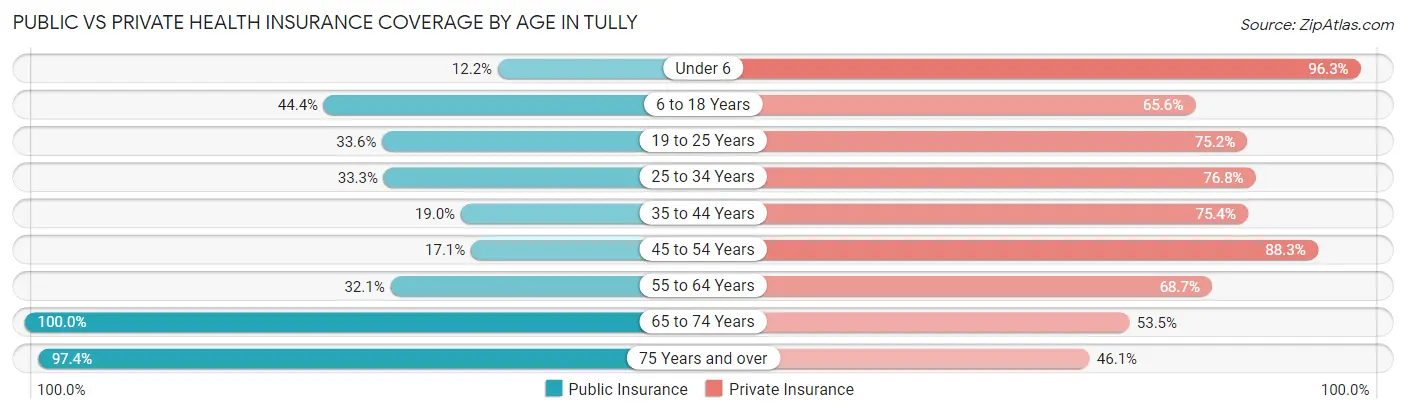
| Age Bracket | Public Insurance | Private Insurance |
| Under 6 | 13 (12.1%) | 103 (96.3%) |
| 6 to 18 Years | 40 (44.4%) | 59 (65.6%) |
| 19 to 25 Years | 42 (33.6%) | 94 (75.2%) |
| 25 to 34 Years | 33 (33.3%) | 76 (76.8%) |
| 35 to 44 Years | 27 (19.0%) | 107 (75.3%) |
| 45 to 54 Years | 19 (17.1%) | 98 (88.3%) |
| 55 to 64 Years | 43 (32.1%) | 92 (68.7%) |
| 65 to 74 Years | 101 (100.0%) | 54 (53.5%) |
| 75 Years and over | 74 (97.4%) | 35 (46.1%) |
| Total | 392 (39.8%) | 718 (72.9%) |
Disability Status by Sex by Age in Tully
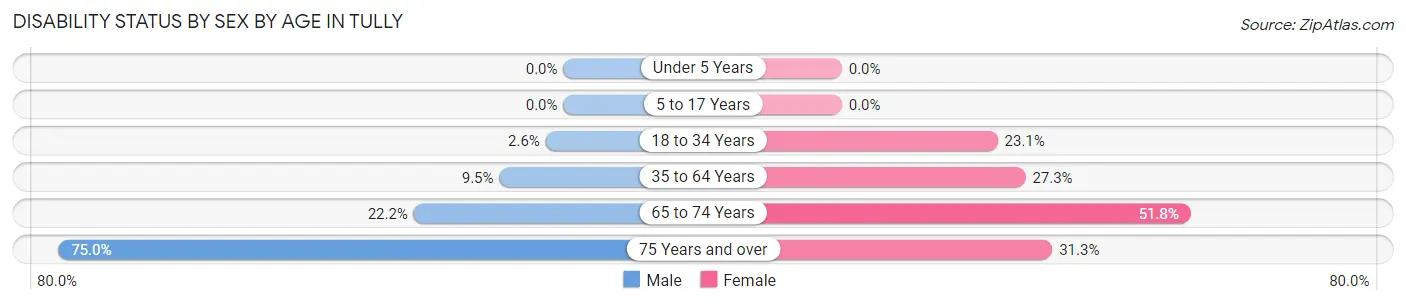
| Age Bracket | Male | Female |
| Under 5 Years | 0 (0.0%) | 0 (0.0%) |
| 5 to 17 Years | 0 (0.0%) | 0 (0.0%) |
| 18 to 34 Years | 3 (2.6%) | 28 (23.1%) |
| 35 to 64 Years | 19 (9.5%) | 51 (27.3%) |
| 65 to 74 Years | 4 (22.2%) | 43 (51.8%) |
| 75 Years and over | 21 (75.0%) | 15 (31.2%) |
Disability Class by Sex by Age in Tully
Disability Class: Hearing Difficulty
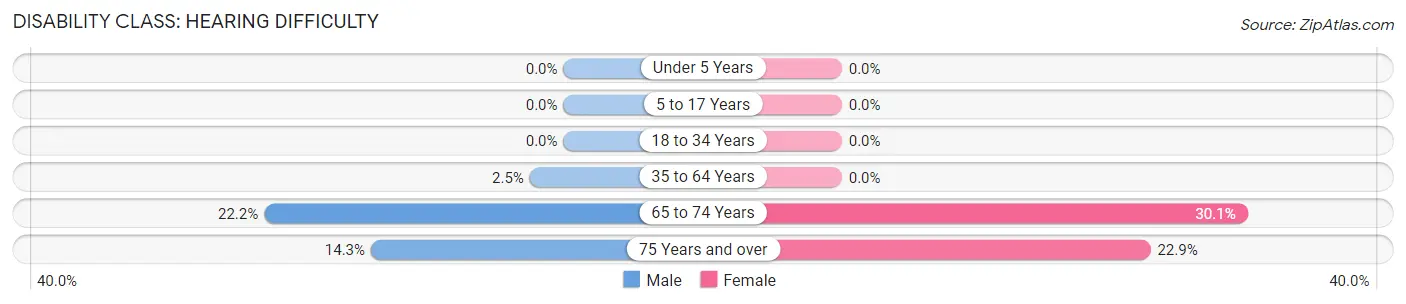
| Age Bracket | Male | Female |
| Under 5 Years | 0 (0.0%) | 0 (0.0%) |
| 5 to 17 Years | 0 (0.0%) | 0 (0.0%) |
| 18 to 34 Years | 0 (0.0%) | 0 (0.0%) |
| 35 to 64 Years | 5 (2.5%) | 0 (0.0%) |
| 65 to 74 Years | 4 (22.2%) | 25 (30.1%) |
| 75 Years and over | 4 (14.3%) | 11 (22.9%) |
Disability Class: Vision Difficulty
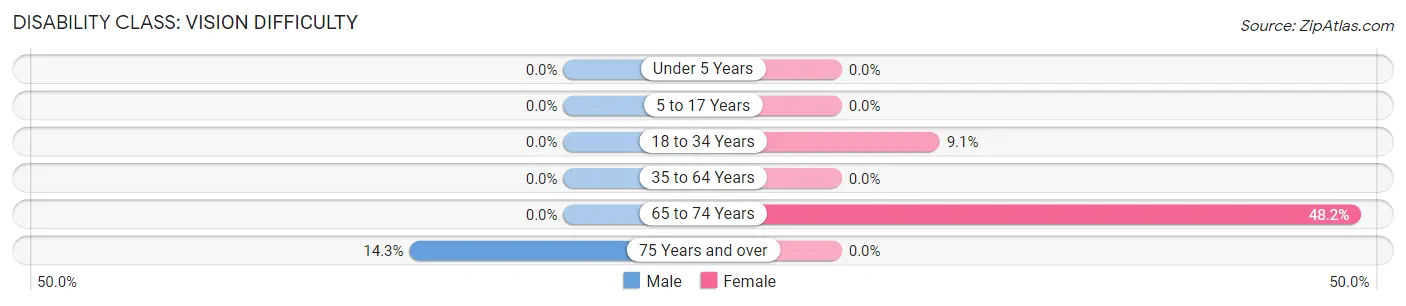
| Age Bracket | Male | Female |
| Under 5 Years | 0 (0.0%) | 0 (0.0%) |
| 5 to 17 Years | 0 (0.0%) | 0 (0.0%) |
| 18 to 34 Years | 0 (0.0%) | 11 (9.1%) |
| 35 to 64 Years | 0 (0.0%) | 0 (0.0%) |
| 65 to 74 Years | 0 (0.0%) | 40 (48.2%) |
| 75 Years and over | 4 (14.3%) | 0 (0.0%) |
Disability Class: Cognitive Difficulty
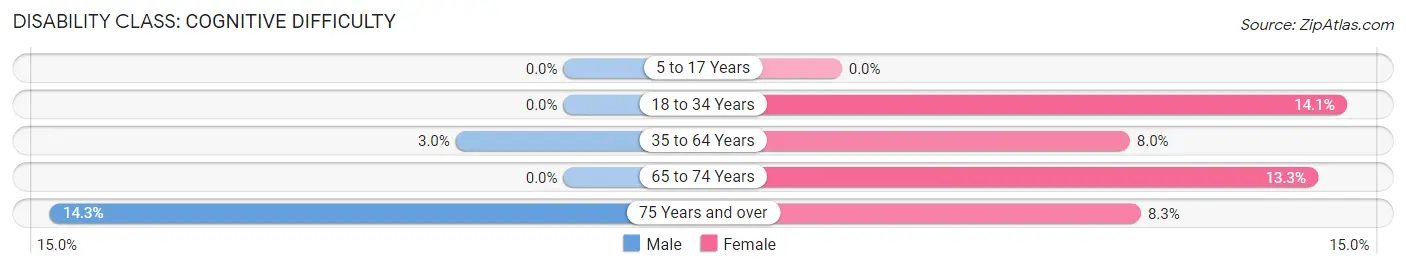
| Age Bracket | Male | Female |
| 5 to 17 Years | 0 (0.0%) | 0 (0.0%) |
| 18 to 34 Years | 0 (0.0%) | 17 (14.1%) |
| 35 to 64 Years | 6 (3.0%) | 15 (8.0%) |
| 65 to 74 Years | 0 (0.0%) | 11 (13.3%) |
| 75 Years and over | 4 (14.3%) | 4 (8.3%) |
Disability Class: Ambulatory Difficulty
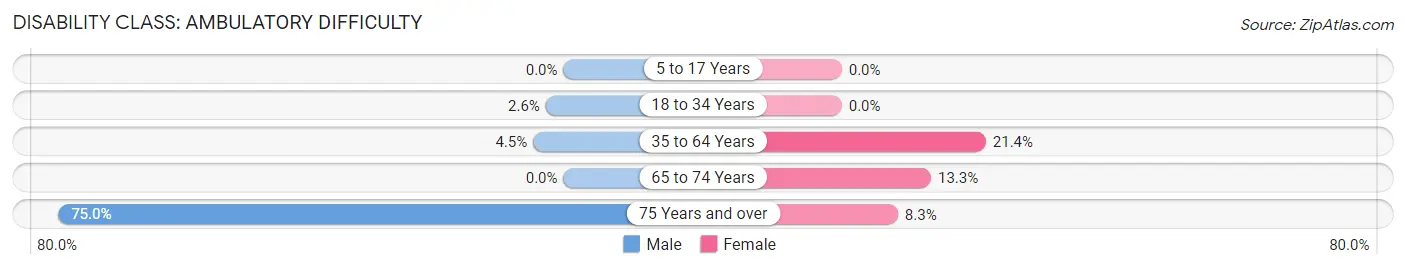
| Age Bracket | Male | Female |
| 5 to 17 Years | 0 (0.0%) | 0 (0.0%) |
| 18 to 34 Years | 3 (2.6%) | 0 (0.0%) |
| 35 to 64 Years | 9 (4.5%) | 40 (21.4%) |
| 65 to 74 Years | 0 (0.0%) | 11 (13.3%) |
| 75 Years and over | 21 (75.0%) | 4 (8.3%) |
Disability Class: Self-Care Difficulty
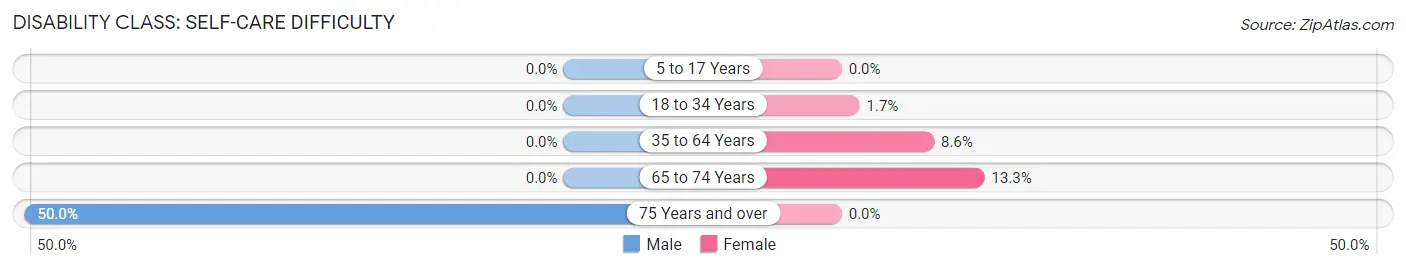
| Age Bracket | Male | Female |
| 5 to 17 Years | 0 (0.0%) | 0 (0.0%) |
| 18 to 34 Years | 0 (0.0%) | 2 (1.7%) |
| 35 to 64 Years | 0 (0.0%) | 16 (8.6%) |
| 65 to 74 Years | 0 (0.0%) | 11 (13.3%) |
| 75 Years and over | 14 (50.0%) | 0 (0.0%) |
Technology Access in Tully
Computing Device Access in Tully
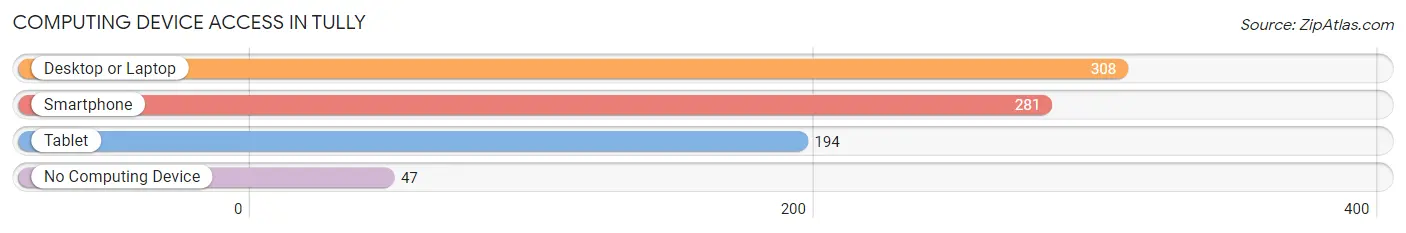
| Device Type | # Households | % Households |
| Desktop or Laptop | 308 | 80.2% |
| Smartphone | 281 | 73.2% |
| Tablet | 194 | 50.5% |
| No Computing Device | 47 | 12.2% |
| Total | 384 | 100.0% |
Internet Access in Tully
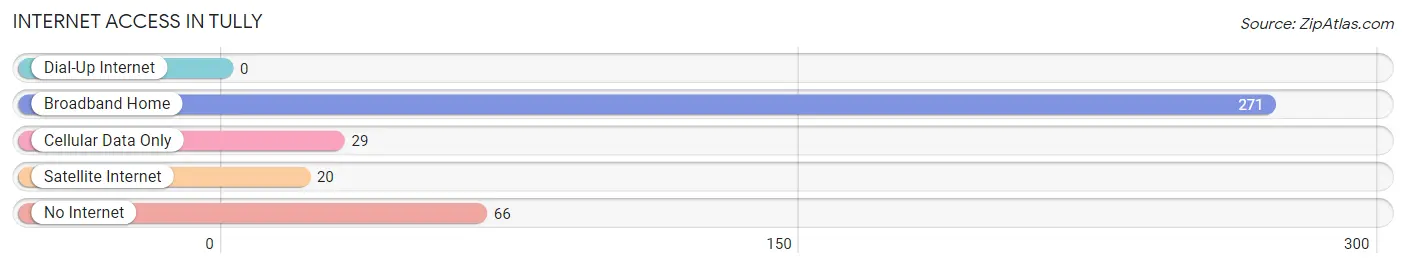
| Internet Type | # Households | % Households |
| Dial-Up Internet | 0 | 0.0% |
| Broadband Home | 271 | 70.6% |
| Cellular Data Only | 29 | 7.5% |
| Satellite Internet | 20 | 5.2% |
| No Internet | 66 | 17.2% |
| Total | 384 | 100.0% |
Tully Summary
Tully is a small town located in Onondaga County, New York. It is situated in the Finger Lakes region of the state, and is part of the Syracuse Metropolitan Statistical Area. The town was founded in 1794 and has a population of approximately 3,000 people.
Geography
Tully is located in the Finger Lakes region of New York, and is situated in the northern part of Onondaga County. It is bordered by the towns of Fabius, LaFayette, and Otisco. The town is located on the Tully Valley, which is a narrow valley that runs through the town. The valley is surrounded by hills and is home to several small streams and ponds. The highest point in the town is located at the summit of Tully Hill, which is 1,890 feet above sea level.
The town is located in the humid continental climate zone, and experiences four distinct seasons. Summers are warm and humid, while winters are cold and snowy. The average annual temperature is around 48 degrees Fahrenheit, and the average annual precipitation is around 40 inches.
Economy
The economy of Tully is largely based on agriculture and tourism. The town is home to several farms, which produce a variety of crops, including corn, soybeans, and hay. The town is also home to several wineries, which produce a variety of wines.
Tourism is also an important part of the economy. The town is home to several attractions, including the Tully Valley Museum, which showcases the history of the town, and the Tully Valley Nature Center, which offers educational programs and activities. The town is also home to several parks, including the Tully Valley State Park, which offers camping, hiking, and fishing.
Demographics
As of the 2010 census, the population of Tully was 3,037. The racial makeup of the town was 97.3% White, 0.7% African American, 0.3% Native American, 0.3% Asian, 0.1% Pacific Islander, and 1.3% from other races. The median household income was $50,938, and the median family income was $60,938.
The town is home to several churches, including the Tully United Methodist Church, the Tully Presbyterian Church, and the Tully Baptist Church. The town is also home to several schools, including the Tully Central School District, which serves students in grades K-12.
Conclusion
Tully is a small town located in Onondaga County, New York. It is situated in the Finger Lakes region of the state, and is part of the Syracuse Metropolitan Statistical Area. The town was founded in 1794 and has a population of approximately 3,000 people. The economy of Tully is largely based on agriculture and tourism, and the town is home to several attractions, churches, and schools. The racial makeup of the town is 97.3% White, 0.7% African American, 0.3% Native American, 0.3% Asian, 0.1% Pacific Islander, and 1.3% from other races. The median household income was $50,938, and the median family income was $60,938.
Common Questions
What is the Total Population of Tully?
Total Population of Tully is 985.
What is the Total Male Population of Tully?
Total Male Population of Tully is 430.
What is the Total Female Population of Tully?
Total Female Population of Tully is 555.
What is the Ratio of Males per 100 Females in Tully?
There are 77.48 Males per 100 Females in Tully.
What is the Ratio of Females per 100 Males in Tully?
There are 129.07 Females per 100 Males in Tully.
What is the Median Population Age in Tully?
Median Population Age in Tully is 40.3 Years.
What is the Average Family Size in Tully
Average Family Size in Tully is 3.4 People.
What is the Average Household Size in Tully
Average Household Size in Tully is 2.5 People.
What is Per Capita Income in Tully?
Per Capita income in Tully is $40,881.
What is the Median Family Income in Tully?
Median Family Income in Tully is $84,688.
What is the Median Household income in Tully?
Median Household Income in Tully is $77,700.
What is Income or Wage Gap in Tully?
Income or Wage Gap in Tully is 26.4%.
Women in Tully earn 73.6 cents for every dollar earned by a man.
What is Inequality or Gini Index in Tully?
Inequality or Gini Index in Tully is 0.55.
How Large is the Labor Force in Tully?
There are 513 People in the Labor Forcein in Tully.
What is the Percentage of People in the Labor Force in Tully?
62.3% of People are in the Labor Force in Tully.
What is the Unemployment Rate in Tully?
Unemployment Rate in Tully is 3.1%.