Tivoli, NY
Tivoli Map
Tivoli Overview
802
TOTAL POPULATION
291
MALE POPULATION
511
FEMALE POPULATION
56.95
MALES / 100 FEMALES
175.60
FEMALES / 100 MALES
34.5
MEDIAN AGE
3.2
AVG FAMILY SIZE
2.2
AVG HOUSEHOLD SIZE
$35,134
PER CAPITA INCOME
$98,194
AVG FAMILY INCOME
$44,583
AVG HOUSEHOLD INCOME
77.1%
WAGE / INCOME GAP [ % ]
22.9¢/ $1
WAGE / INCOME GAP [ $ ]
0.54
INEQUALITY / GINI INDEX
421
LABOR FORCE [ PEOPLE ]
63.4%
PERCENT IN LABOR FORCE
10.9%
UNEMPLOYMENT RATE
Tivoli Zip Codes
Tivoli Area Codes
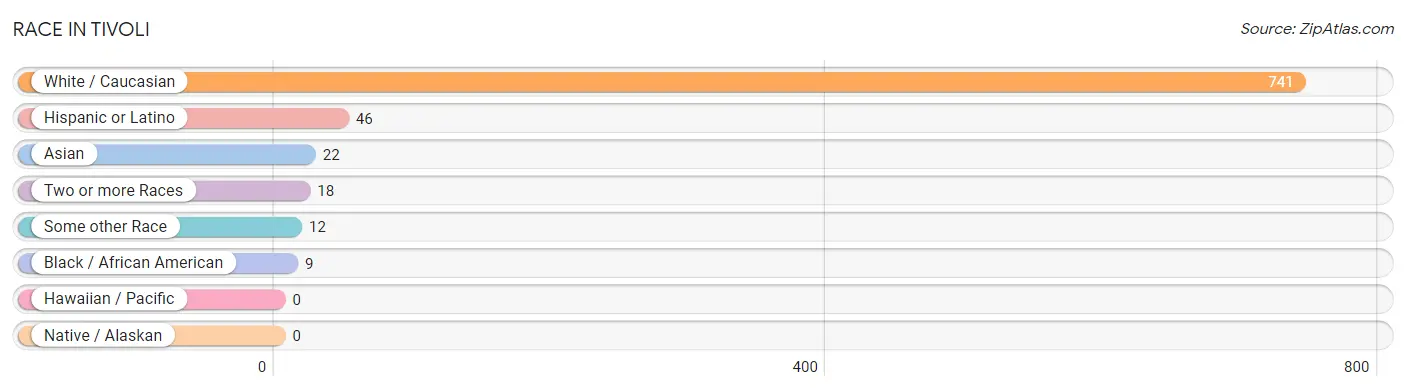
Race in Tivoli
The most populous races in Tivoli are White / Caucasian (741 | 92.4%), Hispanic or Latino (46 | 5.7%), and Asian (22 | 2.7%).
| Race | # Population | % Population |
| Asian | 22 | 2.7% |
| Black / African American | 9 | 1.1% |
| Hawaiian / Pacific | 0 | 0.0% |
| Hispanic or Latino | 46 | 5.7% |
| Native / Alaskan | 0 | 0.0% |
| White / Caucasian | 741 | 92.4% |
| Two or more Races | 18 | 2.2% |
| Some other Race | 12 | 1.5% |
| Total | 802 | 100.0% |
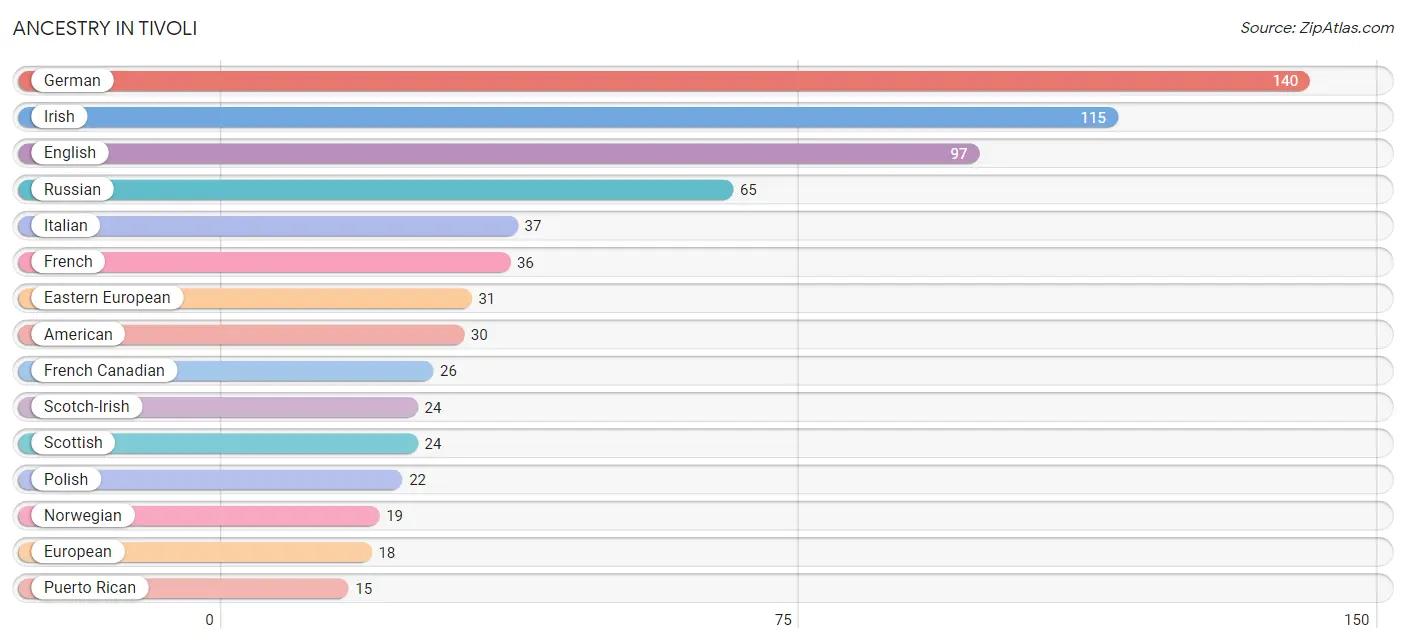
Ancestry in Tivoli
The most populous ancestries reported in Tivoli are German (140 | 17.5%), Irish (115 | 14.3%), English (97 | 12.1%), Russian (65 | 8.1%), and Italian (37 | 4.6%), together accounting for 56.6% of all Tivoli residents.
| Ancestry | # Population | % Population |
| American | 30 | 3.7% |
| Arab | 1 | 0.1% |
| Argentinean | 4 | 0.5% |
| Austrian | 2 | 0.3% |
| British | 7 | 0.9% |
| Burmese | 6 | 0.7% |
| Canadian | 3 | 0.4% |
| Chilean | 11 | 1.4% |
| Dominican | 3 | 0.4% |
| Dutch | 3 | 0.4% |
| Eastern European | 31 | 3.9% |
| English | 97 | 12.1% |
| European | 18 | 2.2% |
| Finnish | 5 | 0.6% |
| French | 36 | 4.5% |
| French Canadian | 26 | 3.2% |
| German | 140 | 17.5% |
| Hungarian | 3 | 0.4% |
| Indian (Asian) | 10 | 1.3% |
| Irish | 115 | 14.3% |
| Israeli | 12 | 1.5% |
| Italian | 37 | 4.6% |
| Latvian | 7 | 0.9% |
| Lebanese | 1 | 0.1% |
| Lithuanian | 9 | 1.1% |
| Mexican | 12 | 1.5% |
| Northern European | 9 | 1.1% |
| Norwegian | 19 | 2.4% |
| Polish | 22 | 2.7% |
| Puerto Rican | 15 | 1.9% |
| Russian | 65 | 8.1% |
| Scotch-Irish | 24 | 3.0% |
| Scottish | 24 | 3.0% |
| South American | 15 | 1.9% |
| Swedish | 12 | 1.5% |
| Thai | 6 | 0.7% |
| Ukrainian | 9 | 1.1% |
| Welsh | 11 | 1.4% |
| West Indian | 3 | 0.4% | View All 39 Rows |
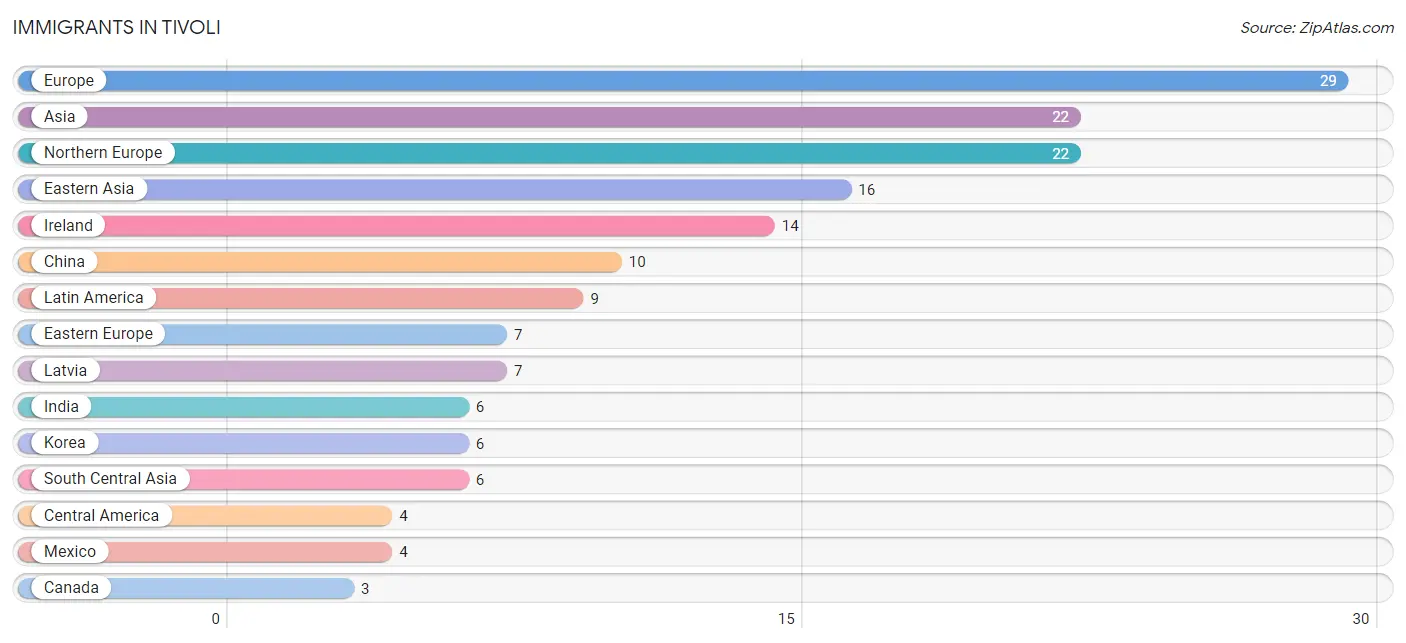
Immigrants in Tivoli
The most numerous immigrant groups reported in Tivoli came from Europe (29 | 3.6%), Asia (22 | 2.7%), Northern Europe (22 | 2.7%), Eastern Asia (16 | 2.0%), and Ireland (14 | 1.8%), together accounting for 12.9% of all Tivoli residents.
| Immigration Origin | # Population | % Population |
| Argentina | 2 | 0.3% |
| Asia | 22 | 2.7% |
| Canada | 3 | 0.4% |
| Caribbean | 3 | 0.4% |
| Central America | 4 | 0.5% |
| China | 10 | 1.3% |
| Dominican Republic | 3 | 0.4% |
| Eastern Asia | 16 | 2.0% |
| Eastern Europe | 7 | 0.9% |
| Europe | 29 | 3.6% |
| India | 6 | 0.7% |
| Ireland | 14 | 1.8% |
| Korea | 6 | 0.7% |
| Latin America | 9 | 1.1% |
| Latvia | 7 | 0.9% |
| Mexico | 4 | 0.5% |
| Northern Europe | 22 | 2.7% |
| South America | 2 | 0.3% |
| South Central Asia | 6 | 0.7% | View All 19 Rows |
Sex and Age in Tivoli
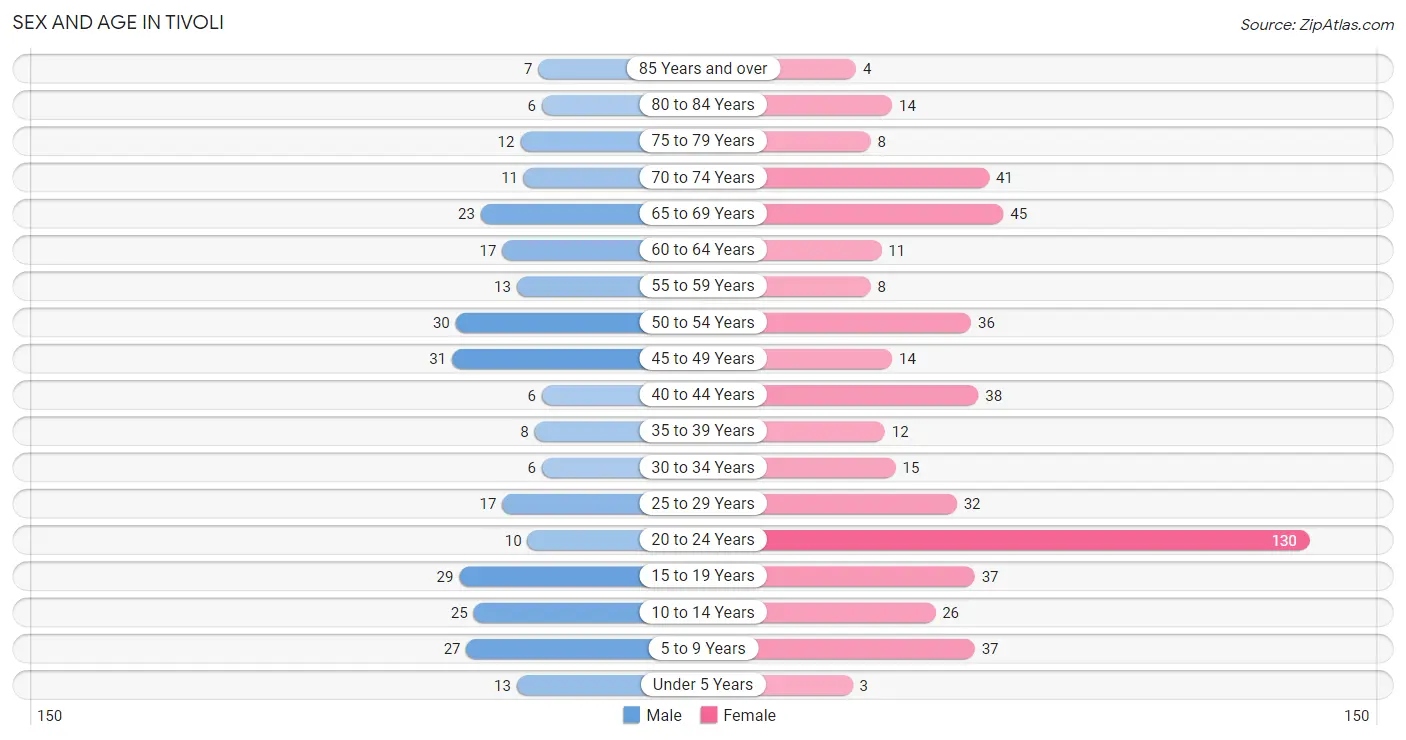
Sex and Age in Tivoli
The most populous age groups in Tivoli are 45 to 49 Years (31 | 10.6%) for men and 20 to 24 Years (130 | 25.4%) for women.
| Age Bracket | Male | Female |
| Under 5 Years | 13 (4.5%) | 3 (0.6%) |
| 5 to 9 Years | 27 (9.3%) | 37 (7.2%) |
| 10 to 14 Years | 25 (8.6%) | 26 (5.1%) |
| 15 to 19 Years | 29 (10.0%) | 37 (7.2%) |
| 20 to 24 Years | 10 (3.4%) | 130 (25.4%) |
| 25 to 29 Years | 17 (5.8%) | 32 (6.3%) |
| 30 to 34 Years | 6 (2.1%) | 15 (2.9%) |
| 35 to 39 Years | 8 (2.8%) | 12 (2.4%) |
| 40 to 44 Years | 6 (2.1%) | 38 (7.4%) |
| 45 to 49 Years | 31 (10.6%) | 14 (2.7%) |
| 50 to 54 Years | 30 (10.3%) | 36 (7.0%) |
| 55 to 59 Years | 13 (4.5%) | 8 (1.6%) |
| 60 to 64 Years | 17 (5.8%) | 11 (2.1%) |
| 65 to 69 Years | 23 (7.9%) | 45 (8.8%) |
| 70 to 74 Years | 11 (3.8%) | 41 (8.0%) |
| 75 to 79 Years | 12 (4.1%) | 8 (1.6%) |
| 80 to 84 Years | 6 (2.1%) | 14 (2.7%) |
| 85 Years and over | 7 (2.4%) | 4 (0.8%) |
| Total | 291 (100.0%) | 511 (100.0%) |
Families and Households in Tivoli
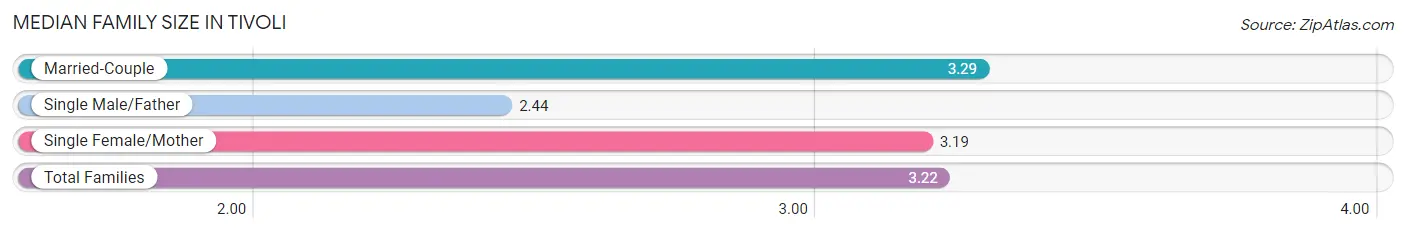
Median Family Size in Tivoli
The median family size in Tivoli is 3.22 persons per family, with married-couple families (114 | 82.0%) accounting for the largest median family size of 3.29 persons per family. On the other hand, single male/father families (9 | 6.5%) represent the smallest median family size with 2.44 persons per family.
| Family Type | # Families | Family Size |
| Married-Couple | 114 (82.0%) | 3.29 |
| Single Male/Father | 9 (6.5%) | 2.44 |
| Single Female/Mother | 16 (11.5%) | 3.19 |
| Total Families | 139 (100.0%) | 3.22 |
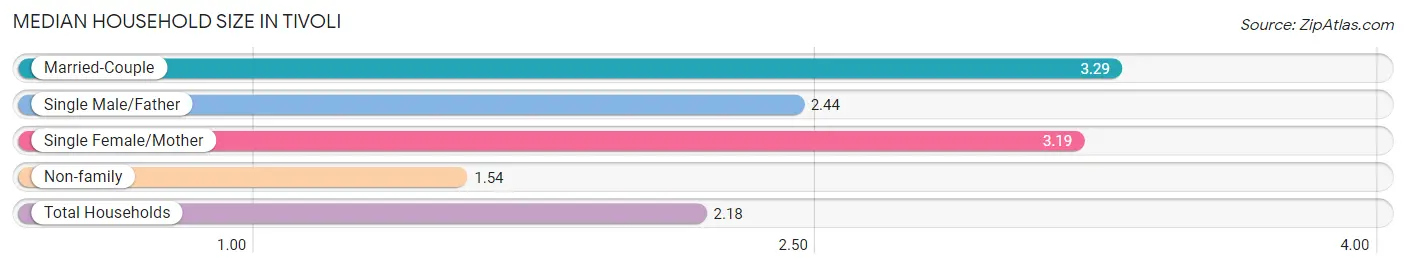
Median Household Size in Tivoli
The median household size in Tivoli is 2.18 persons per household, with married-couple households (114 | 31.1%) accounting for the largest median household size of 3.29 persons per household. non-family households (227 | 62.0%) represent the smallest median household size with 1.54 persons per household.
| Household Type | # Households | Household Size |
| Married-Couple | 114 (31.1%) | 3.29 |
| Single Male/Father | 9 (2.5%) | 2.44 |
| Single Female/Mother | 16 (4.4%) | 3.19 |
| Non-family | 227 (62.0%) | 1.54 |
| Total Households | 366 (100.0%) | 2.18 |
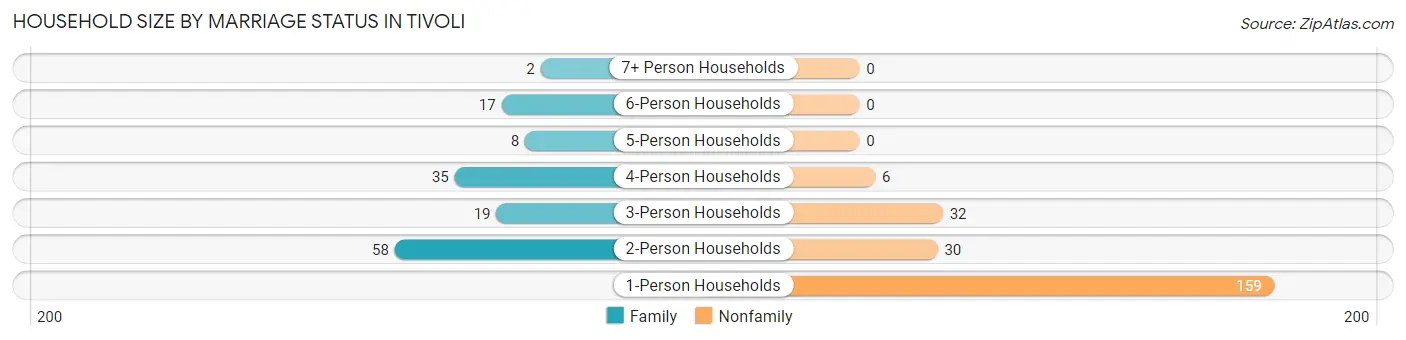
Household Size by Marriage Status in Tivoli
Out of a total of 366 households in Tivoli, 139 (38.0%) are family households, while 227 (62.0%) are nonfamily households. The most numerous type of family households are 2-person households, comprising 58, and the most common type of nonfamily households are 1-person households, comprising 159.
| Household Size | Family Households | Nonfamily Households |
| 1-Person Households | - | 159 (43.4%) |
| 2-Person Households | 58 (15.9%) | 30 (8.2%) |
| 3-Person Households | 19 (5.2%) | 32 (8.7%) |
| 4-Person Households | 35 (9.6%) | 6 (1.6%) |
| 5-Person Households | 8 (2.2%) | 0 (0.0%) |
| 6-Person Households | 17 (4.6%) | 0 (0.0%) |
| 7+ Person Households | 2 (0.5%) | 0 (0.0%) |
| Total | 139 (38.0%) | 227 (62.0%) |
Female Fertility in Tivoli
Fertility by Age in Tivoli
Average fertility rate in Tivoli is 49.0 births per 1,000 women. Women in the age bracket of 35 to 50 years have the highest fertility rate with 153.0 births per 1,000 women. Women in the age bracket of 35 to 50 years acount for 78.6% of all women with births.
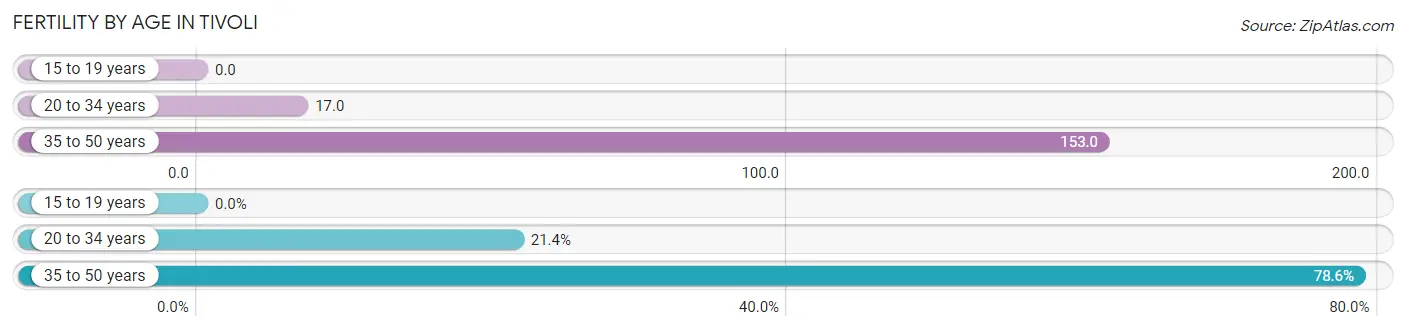
| Age Bracket | Women with Births | Births / 1,000 Women |
| 15 to 19 years | 0 (0.0%) | 0.0 |
| 20 to 34 years | 3 (21.4%) | 17.0 |
| 35 to 50 years | 11 (78.6%) | 153.0 |
| Total | 14 (100.0%) | 49.0 |
Fertility by Age by Marriage Status in Tivoli
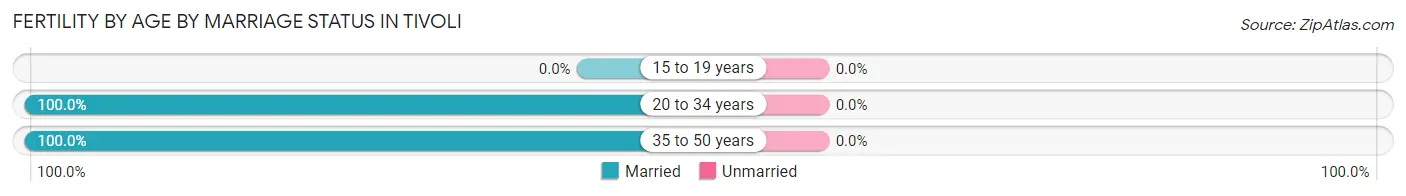
| Age Bracket | Married | Unmarried |
| 15 to 19 years | 0 (0.0%) | 0 (0.0%) |
| 20 to 34 years | 3 (100.0%) | 0 (0.0%) |
| 35 to 50 years | 11 (100.0%) | 0 (0.0%) |
| Total | 14 (100.0%) | 0 (0.0%) |
Fertility by Education in Tivoli
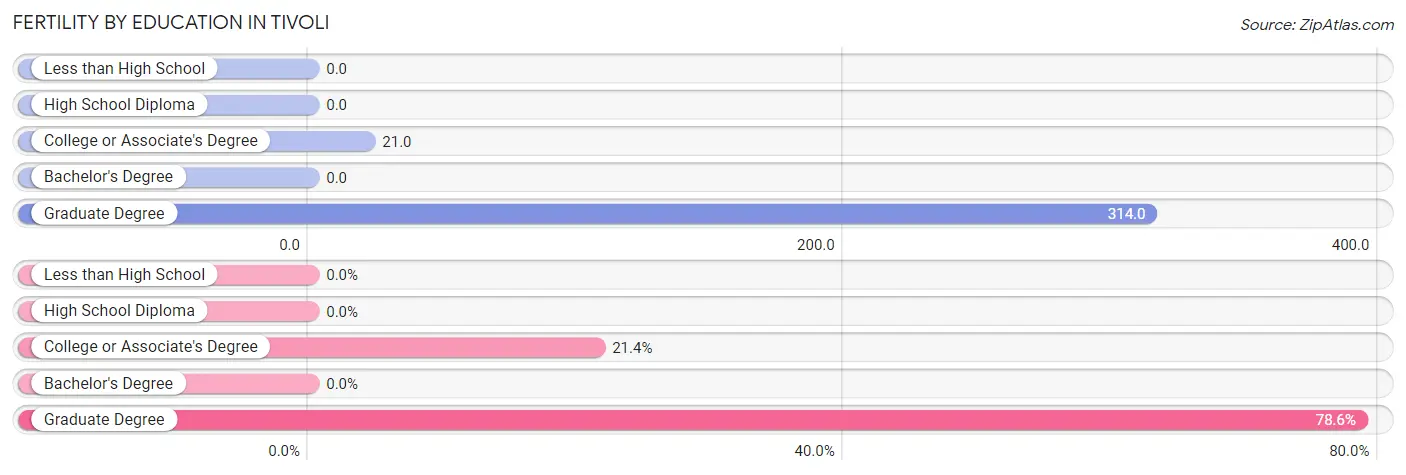
| Educational Attainment | Women with Births | Births / 1,000 Women |
| Less than High School | 0 (0.0%) | 0.0 |
| High School Diploma | 0 (0.0%) | 0.0 |
| College or Associate's Degree | 3 (21.4%) | 21.0 |
| Bachelor's Degree | 0 (0.0%) | 0.0 |
| Graduate Degree | 11 (78.6%) | 314.0 |
| Total | 14 (100.0%) | 49.0 |
Fertility by Education by Marriage Status in Tivoli
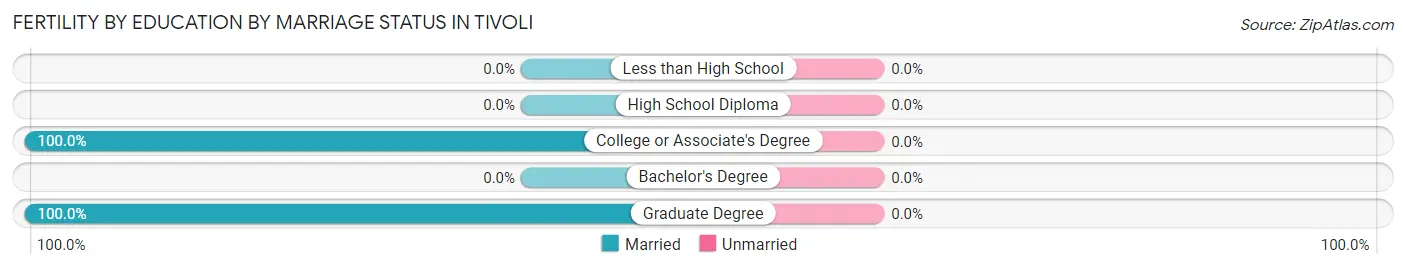
| Educational Attainment | Married | Unmarried |
| Less than High School | 0 (0.0%) | 0 (0.0%) |
| High School Diploma | 0 (0.0%) | 0 (0.0%) |
| College or Associate's Degree | 3 (100.0%) | 0 (0.0%) |
| Bachelor's Degree | 0 (0.0%) | 0 (0.0%) |
| Graduate Degree | 11 (100.0%) | 0 (0.0%) |
| Total | 14 (100.0%) | 0 (0.0%) |
Income in Tivoli
Income Overview in Tivoli
Per Capita Income in Tivoli is $35,134, while median incomes of families and households are $98,194 and $44,583 respectively.
| Characteristic | Number | Measure |
| Per Capita Income | 802 | $35,134 |
| Median Family Income | 139 | $98,194 |
| Mean Family Income | 139 | $135,813 |
| Median Household Income | 366 | $44,583 |
| Mean Household Income | 366 | $77,227 |
| Income Deficit | 139 | $0 |
| Wage / Income Gap (%) | 802 | 77.09% |
| Wage / Income Gap ($) | 802 | 22.91¢ per $1 |
| Gini / Inequality Index | 802 | 0.54 |
Earnings by Sex in Tivoli
Average Earnings in Tivoli are $15,221, $46,771 for men and $10,714 for women, a difference of 77.1%.
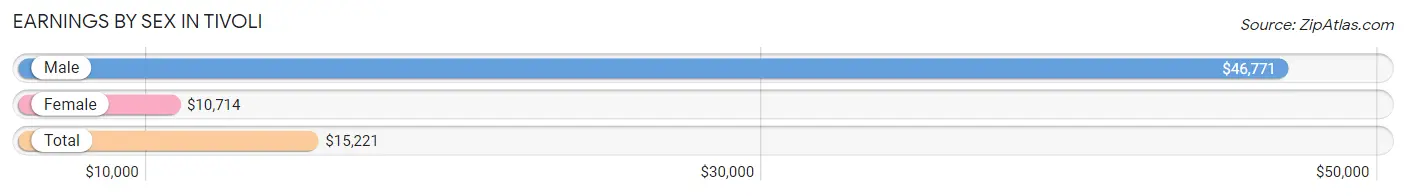
| Sex | Number | Average Earnings |
| Male | 161 (31.6%) | $46,771 |
| Female | 348 (68.4%) | $10,714 |
| Total | 509 (100.0%) | $15,221 |
Earnings by Sex by Income Bracket in Tivoli
The most common earnings brackets in Tivoli are $100,000+ for men (27 | 16.8%) and $2,499 or less for women (65 | 18.7%).
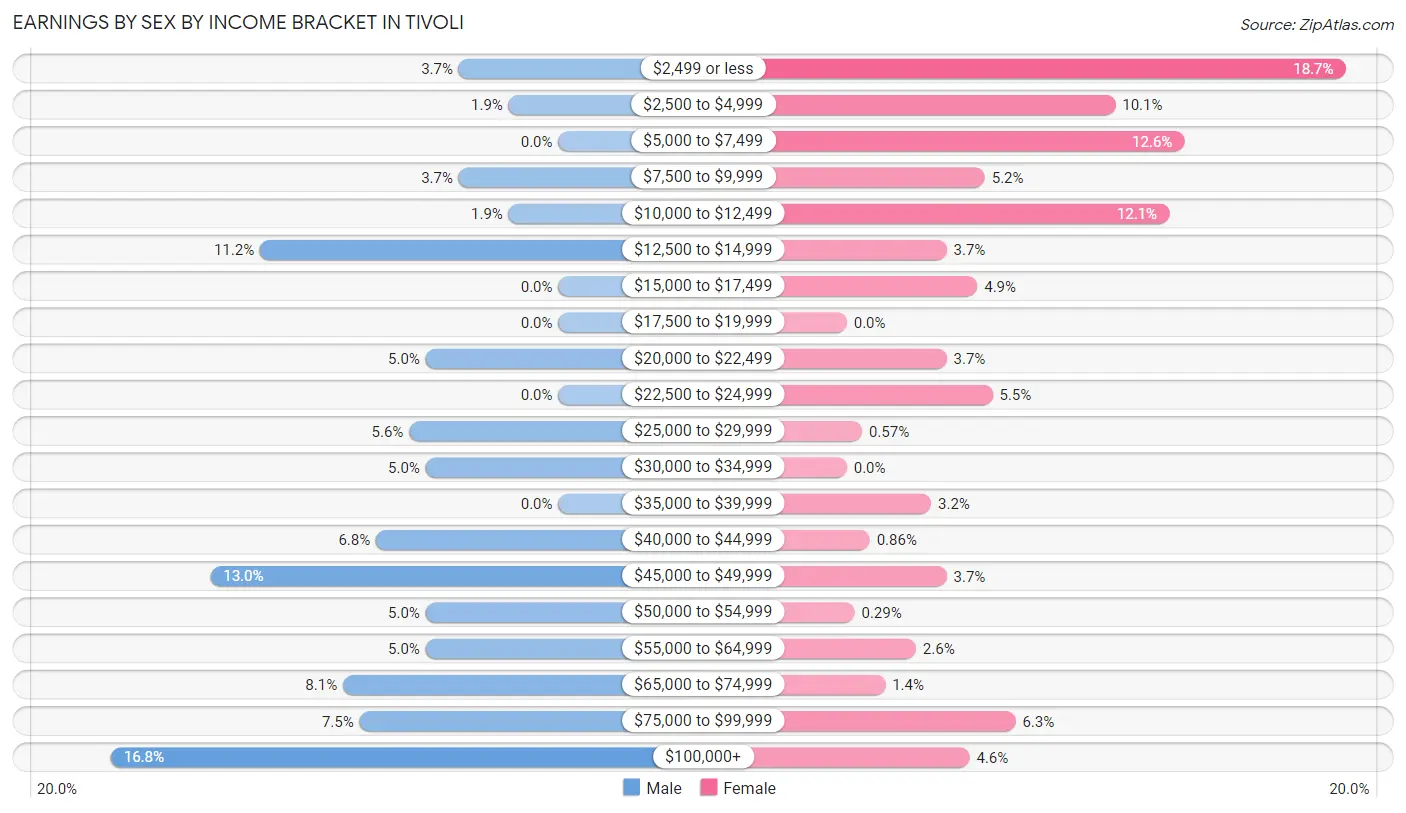
| Income | Male | Female |
| $2,499 or less | 6 (3.7%) | 65 (18.7%) |
| $2,500 to $4,999 | 3 (1.9%) | 35 (10.1%) |
| $5,000 to $7,499 | 0 (0.0%) | 44 (12.6%) |
| $7,500 to $9,999 | 6 (3.7%) | 18 (5.2%) |
| $10,000 to $12,499 | 3 (1.9%) | 42 (12.1%) |
| $12,500 to $14,999 | 18 (11.2%) | 13 (3.7%) |
| $15,000 to $17,499 | 0 (0.0%) | 17 (4.9%) |
| $17,500 to $19,999 | 0 (0.0%) | 0 (0.0%) |
| $20,000 to $22,499 | 8 (5.0%) | 13 (3.7%) |
| $22,500 to $24,999 | 0 (0.0%) | 19 (5.5%) |
| $25,000 to $29,999 | 9 (5.6%) | 2 (0.6%) |
| $30,000 to $34,999 | 8 (5.0%) | 0 (0.0%) |
| $35,000 to $39,999 | 0 (0.0%) | 11 (3.2%) |
| $40,000 to $44,999 | 11 (6.8%) | 3 (0.9%) |
| $45,000 to $49,999 | 21 (13.0%) | 13 (3.7%) |
| $50,000 to $54,999 | 8 (5.0%) | 1 (0.3%) |
| $55,000 to $64,999 | 8 (5.0%) | 9 (2.6%) |
| $65,000 to $74,999 | 13 (8.1%) | 5 (1.4%) |
| $75,000 to $99,999 | 12 (7.4%) | 22 (6.3%) |
| $100,000+ | 27 (16.8%) | 16 (4.6%) |
| Total | 161 (100.0%) | 348 (100.0%) |
Earnings by Sex by Educational Attainment in Tivoli
Average earnings in Tivoli are $48,472 for men and $23,158 for women, a difference of 52.2%. Men with an educational attainment of bachelor's degree enjoy the highest average annual earnings of $68,750, while those with high school diploma education earn the least with $47,917. Women with an educational attainment of high school diploma earn the most with the average annual earnings of $55,833, while those with bachelor's degree education have the smallest earnings of $20,694.
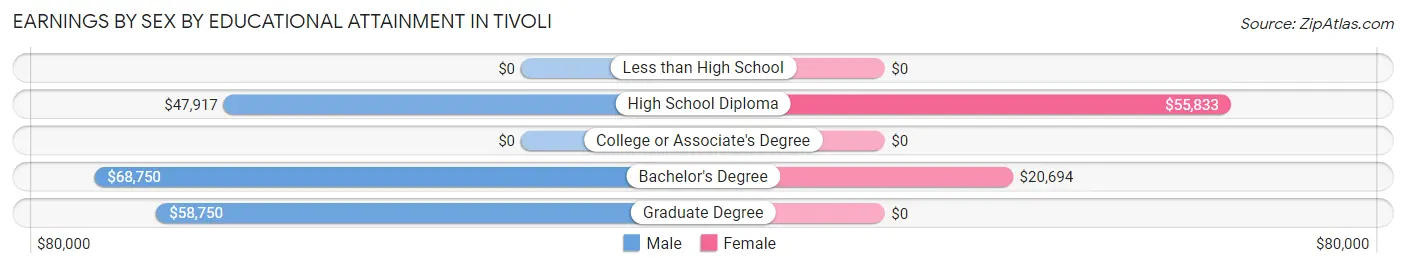
| Educational Attainment | Male Income | Female Income |
| Less than High School | - | - |
| High School Diploma | $47,917 | $55,833 |
| College or Associate's Degree | - | - |
| Bachelor's Degree | $68,750 | $20,694 |
| Graduate Degree | $58,750 | $0 |
| Total | $48,472 | $23,158 |
Family Income in Tivoli
Family Income Brackets in Tivoli
According to the Tivoli family income data, there are 40 families falling into the $75,000 to $99,999 income range, which is the most common income bracket and makes up 28.8% of all families.
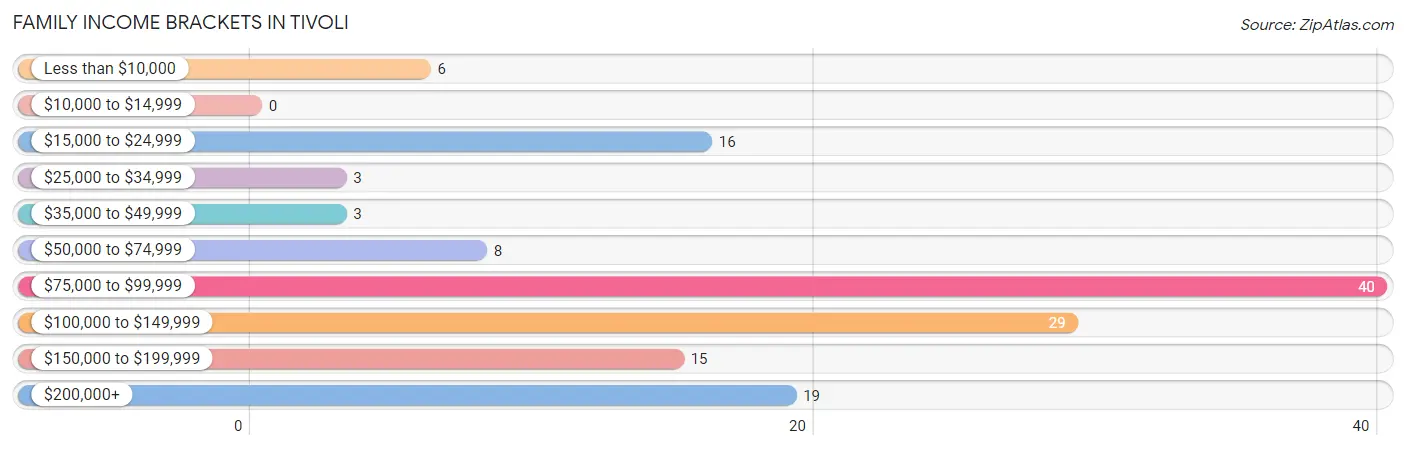
| Income Bracket | # Families | % Families |
| Less than $10,000 | 6 | 4.3% |
| $10,000 to $14,999 | 0 | 0.0% |
| $15,000 to $24,999 | 16 | 11.5% |
| $25,000 to $34,999 | 3 | 2.2% |
| $35,000 to $49,999 | 3 | 2.2% |
| $50,000 to $74,999 | 8 | 5.8% |
| $75,000 to $99,999 | 40 | 28.8% |
| $100,000 to $149,999 | 29 | 20.9% |
| $150,000 to $199,999 | 15 | 10.8% |
| $200,000+ | 19 | 13.7% |
Family Income by Famaliy Size in Tivoli
5-person families (8 | 5.8%) account for the highest median family income in Tivoli with $171,250 per family, while 2-person families (58 | 41.7%) have the highest median income of $47,841 per family member.
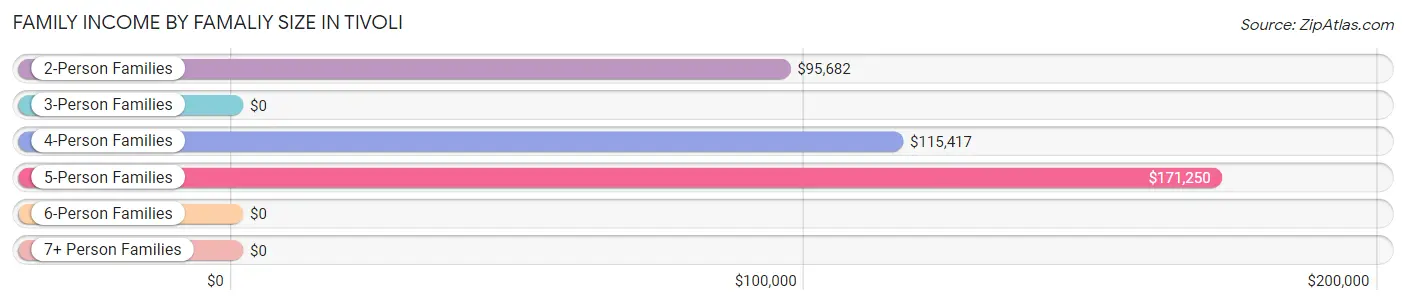
| Income Bracket | # Families | Median Income |
| 2-Person Families | 58 (41.7%) | $95,682 |
| 3-Person Families | 19 (13.7%) | $0 |
| 4-Person Families | 35 (25.2%) | $115,417 |
| 5-Person Families | 8 (5.8%) | $171,250 |
| 6-Person Families | 17 (12.2%) | $0 |
| 7+ Person Families | 2 (1.4%) | $0 |
| Total | 139 (100.0%) | $98,194 |
Family Income by Number of Earners in Tivoli
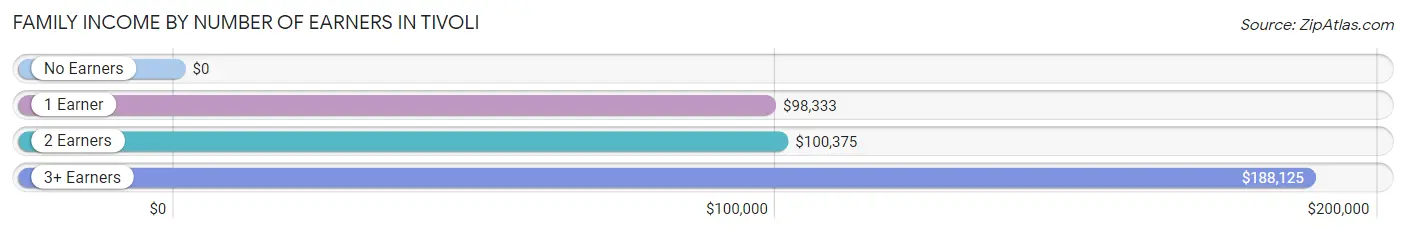
| Number of Earners | # Families | Median Income |
| No Earners | 22 (15.8%) | $0 |
| 1 Earner | 32 (23.0%) | $98,333 |
| 2 Earners | 67 (48.2%) | $100,375 |
| 3+ Earners | 18 (13.0%) | $188,125 |
| Total | 139 (100.0%) | $98,194 |
Household Income in Tivoli
Household Income Brackets in Tivoli
With 69 households falling in the category, the $75,000 to $99,999 income range is the most frequent in Tivoli, accounting for 18.9% of all households. In contrast, only 19 households (5.2%) fall into the $150,000 to $199,999 income bracket, making it the least populous group.
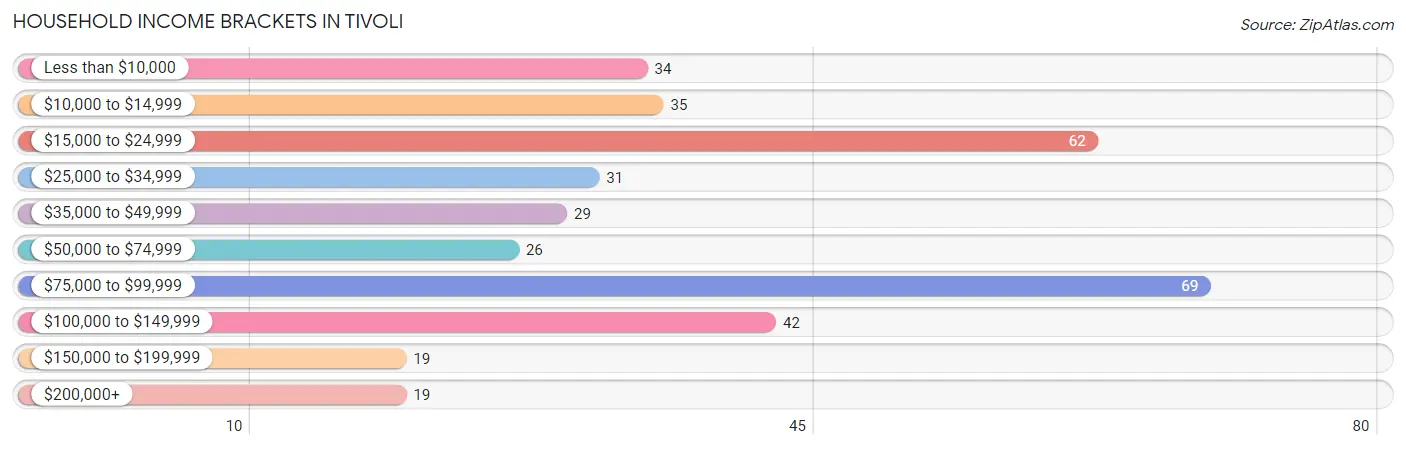
| Income Bracket | # Households | % Households |
| Less than $10,000 | 34 | 9.3% |
| $10,000 to $14,999 | 35 | 9.6% |
| $15,000 to $24,999 | 62 | 16.9% |
| $25,000 to $34,999 | 31 | 8.5% |
| $35,000 to $49,999 | 29 | 7.9% |
| $50,000 to $74,999 | 26 | 7.1% |
| $75,000 to $99,999 | 69 | 18.9% |
| $100,000 to $149,999 | 42 | 11.5% |
| $150,000 to $199,999 | 19 | 5.2% |
| $200,000+ | 19 | 5.2% |
Household Income by Householder Age in Tivoli
The median household income in Tivoli is $44,583, with the highest median household income of $101,625 found in the 45 to 64 years age bracket for the primary householder. A total of 103 households (28.1%) fall into this category. Meanwhile, the 15 to 24 years age bracket for the primary householder has the lowest median household income of $20,083, with 63 households (17.2%) in this group.
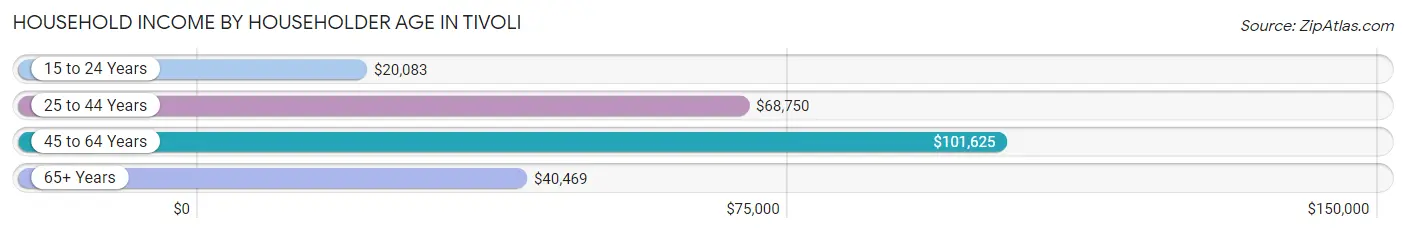
| Income Bracket | # Households | Median Income |
| 15 to 24 Years | 63 (17.2%) | $20,083 |
| 25 to 44 Years | 57 (15.6%) | $68,750 |
| 45 to 64 Years | 103 (28.1%) | $101,625 |
| 65+ Years | 143 (39.1%) | $40,469 |
| Total | 366 (100.0%) | $44,583 |
Poverty in Tivoli
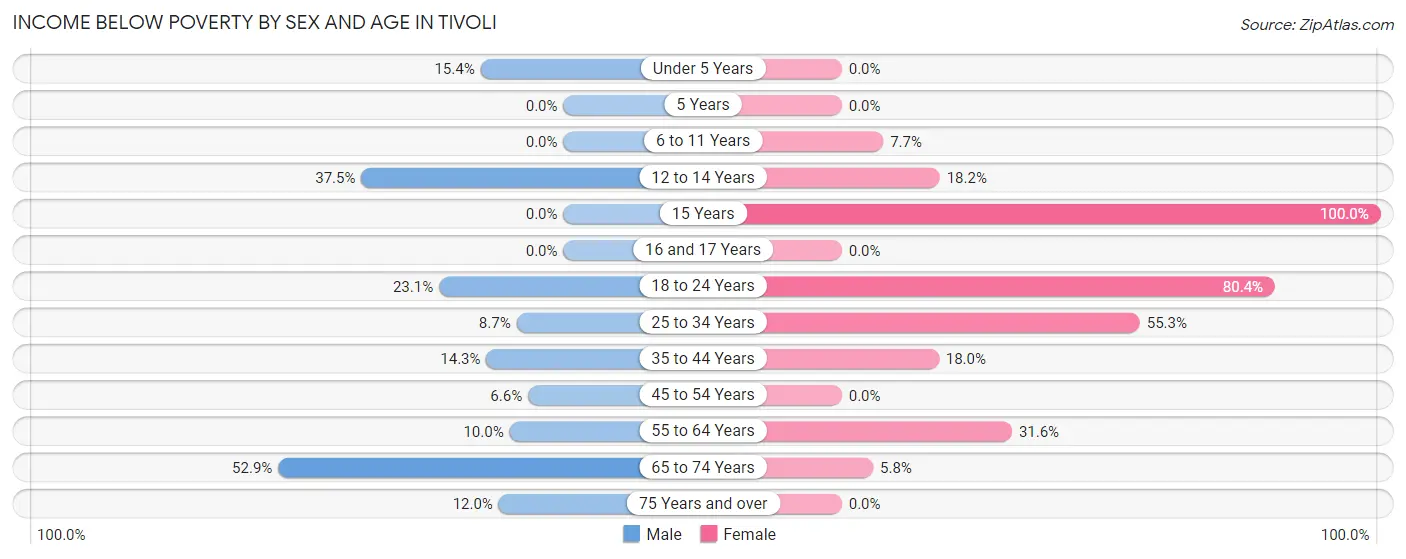
Income Below Poverty by Sex and Age in Tivoli
With 13.8% poverty level for males and 34.8% for females among the residents of Tivoli, 65 to 74 year old males and 15 year old females are the most vulnerable to poverty, with 18 males (52.9%) and 3 females (100.0%) in their respective age groups living below the poverty level.
| Age Bracket | Male | Female |
| Under 5 Years | 2 (15.4%) | 0 (0.0%) |
| 5 Years | 0 (0.0%) | 0 (0.0%) |
| 6 to 11 Years | 0 (0.0%) | 4 (7.7%) |
| 12 to 14 Years | 3 (37.5%) | 2 (18.2%) |
| 15 Years | 0 (0.0%) | 3 (100.0%) |
| 16 and 17 Years | 0 (0.0%) | 0 (0.0%) |
| 18 to 24 Years | 3 (23.1%) | 123 (80.4%) |
| 25 to 34 Years | 2 (8.7%) | 26 (55.3%) |
| 35 to 44 Years | 2 (14.3%) | 9 (18.0%) |
| 45 to 54 Years | 4 (6.6%) | 0 (0.0%) |
| 55 to 64 Years | 3 (10.0%) | 6 (31.6%) |
| 65 to 74 Years | 18 (52.9%) | 5 (5.8%) |
| 75 Years and over | 3 (12.0%) | 0 (0.0%) |
| Total | 40 (13.8%) | 178 (34.8%) |
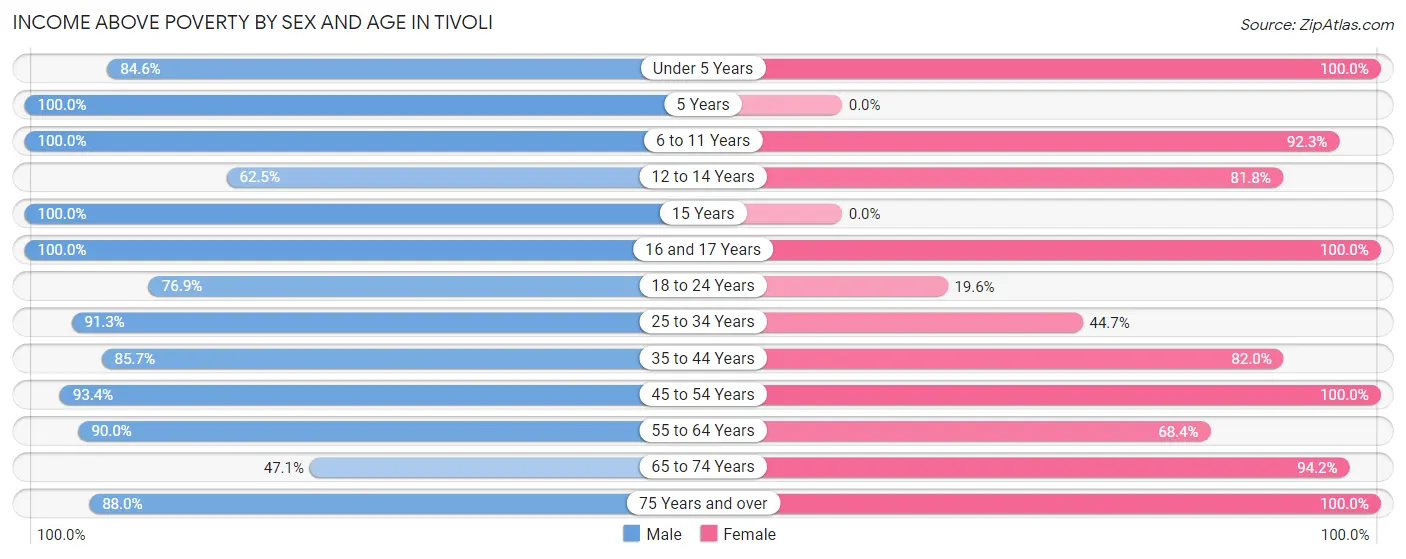
Income Above Poverty by Sex and Age in Tivoli
According to the poverty statistics in Tivoli, males aged 5 years and females aged under 5 years are the age groups that are most secure financially, with 100.0% of males and 100.0% of females in these age groups living above the poverty line.
| Age Bracket | Male | Female |
| Under 5 Years | 11 (84.6%) | 3 (100.0%) |
| 5 Years | 3 (100.0%) | 0 (0.0%) |
| 6 to 11 Years | 41 (100.0%) | 48 (92.3%) |
| 12 to 14 Years | 5 (62.5%) | 9 (81.8%) |
| 15 Years | 4 (100.0%) | 0 (0.0%) |
| 16 and 17 Years | 22 (100.0%) | 11 (100.0%) |
| 18 to 24 Years | 10 (76.9%) | 30 (19.6%) |
| 25 to 34 Years | 21 (91.3%) | 21 (44.7%) |
| 35 to 44 Years | 12 (85.7%) | 41 (82.0%) |
| 45 to 54 Years | 57 (93.4%) | 50 (100.0%) |
| 55 to 64 Years | 27 (90.0%) | 13 (68.4%) |
| 65 to 74 Years | 16 (47.1%) | 81 (94.2%) |
| 75 Years and over | 22 (88.0%) | 26 (100.0%) |
| Total | 251 (86.3%) | 333 (65.2%) |
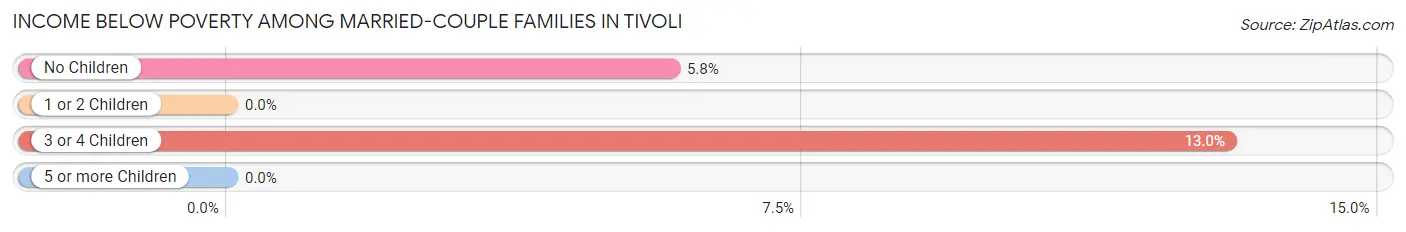
Income Below Poverty Among Married-Couple Families in Tivoli
The poverty statistics for married-couple families in Tivoli show that 5.3% or 6 of the total 114 families live below the poverty line. Families with 3 or 4 children have the highest poverty rate of 13.0%, comprising of 3 families. On the other hand, families with 1 or 2 children have the lowest poverty rate of 0.0%, which includes 0 families.
| Children | Above Poverty | Below Poverty |
| No Children | 49 (94.2%) | 3 (5.8%) |
| 1 or 2 Children | 39 (100.0%) | 0 (0.0%) |
| 3 or 4 Children | 20 (87.0%) | 3 (13.0%) |
| 5 or more Children | 0 (0.0%) | 0 (0.0%) |
| Total | 108 (94.7%) | 6 (5.3%) |
Income Below Poverty Among Single-Parent Households in Tivoli
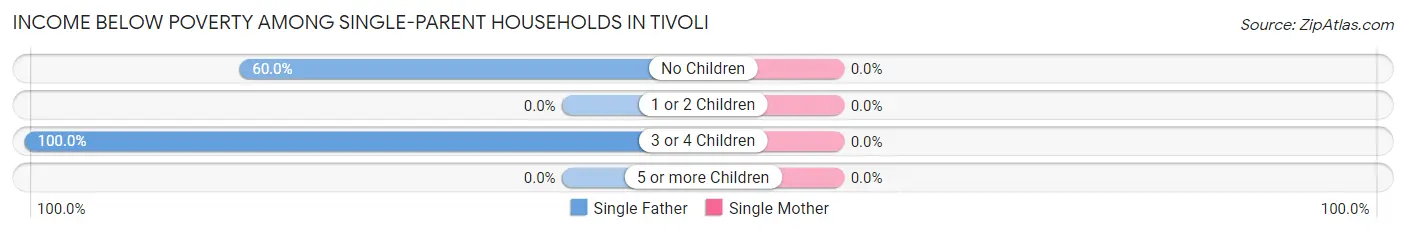
| Children | Single Father | Single Mother |
| No Children | 3 (60.0%) | 0 (0.0%) |
| 1 or 2 Children | 0 (0.0%) | 0 (0.0%) |
| 3 or 4 Children | 4 (100.0%) | 0 (0.0%) |
| 5 or more Children | 0 (0.0%) | 0 (0.0%) |
| Total | 7 (77.8%) | 0 (0.0%) |
Income Below Poverty Among Married-Couple vs Single-Parent Households in Tivoli
The poverty data for Tivoli shows that 6 of the married-couple family households (5.3%) and 7 of the single-parent households (28.0%) are living below the poverty level. Within the married-couple family households, those with 3 or 4 children have the highest poverty rate, with 3 households (13.0%) falling below the poverty line. Among the single-parent households, those with 3 or 4 children have the highest poverty rate, with 4 household (66.7%) living below poverty.
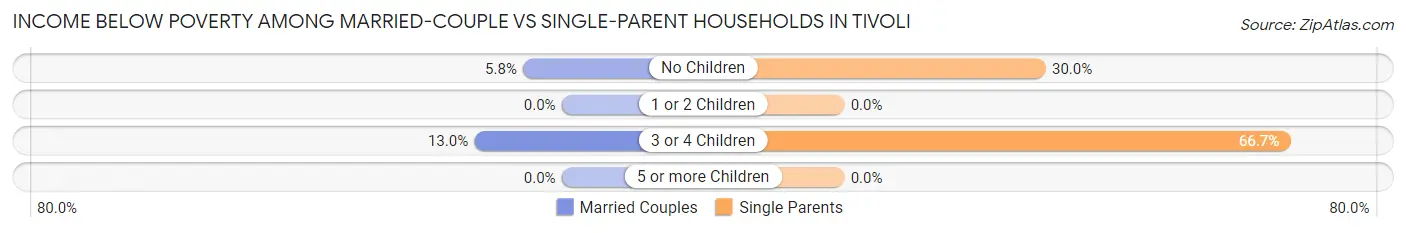
| Children | Married-Couple Families | Single-Parent Households |
| No Children | 3 (5.8%) | 3 (30.0%) |
| 1 or 2 Children | 0 (0.0%) | 0 (0.0%) |
| 3 or 4 Children | 3 (13.0%) | 4 (66.7%) |
| 5 or more Children | 0 (0.0%) | 0 (0.0%) |
| Total | 6 (5.3%) | 7 (28.0%) |
Employment Characteristics in Tivoli
Employment by Class of Employer in Tivoli
Among the 362 employed individuals in Tivoli, private company employees (185 | 51.1%), not-for-profit organizations (55 | 15.2%), and self-employed (not incorporated) (54 | 14.9%) make up the most common classes of employment.
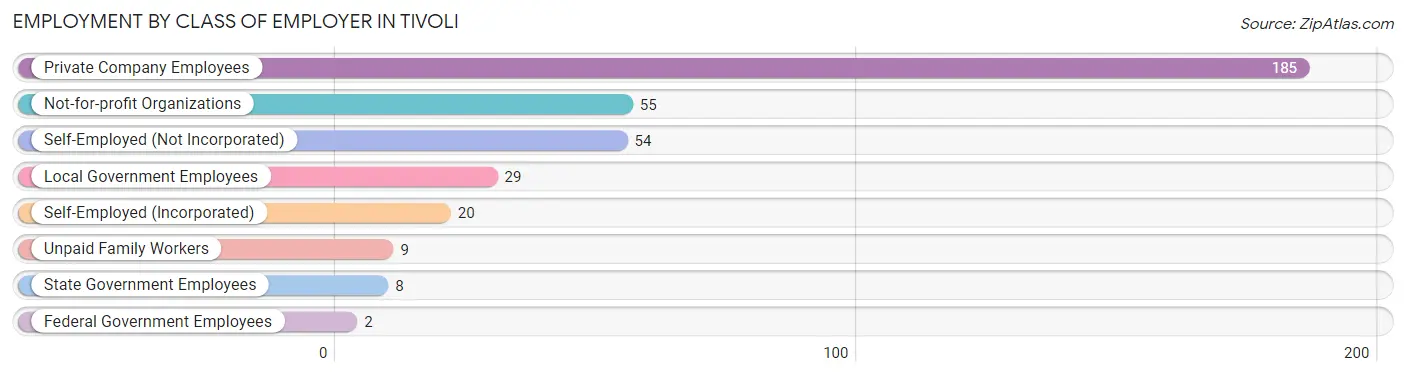
| Employer Class | # Employees | % Employees |
| Private Company Employees | 185 | 51.1% |
| Self-Employed (Incorporated) | 20 | 5.5% |
| Self-Employed (Not Incorporated) | 54 | 14.9% |
| Not-for-profit Organizations | 55 | 15.2% |
| Local Government Employees | 29 | 8.0% |
| State Government Employees | 8 | 2.2% |
| Federal Government Employees | 2 | 0.5% |
| Unpaid Family Workers | 9 | 2.5% |
| Total | 362 | 100.0% |
Employment Status by Age in Tivoli
According to the labor force statistics for Tivoli, out of the total population over 16 years of age (664), 63.4% or 421 individuals are in the labor force, with 10.9% or 46 of them unemployed. The age group with the highest labor force participation rate is 20 to 24 years, with 83.6% or 117 individuals in the labor force. Within the labor force, the 45 to 54 years age range has the highest percentage of unemployed individuals, with 28.3% or 26 of them being unemployed.
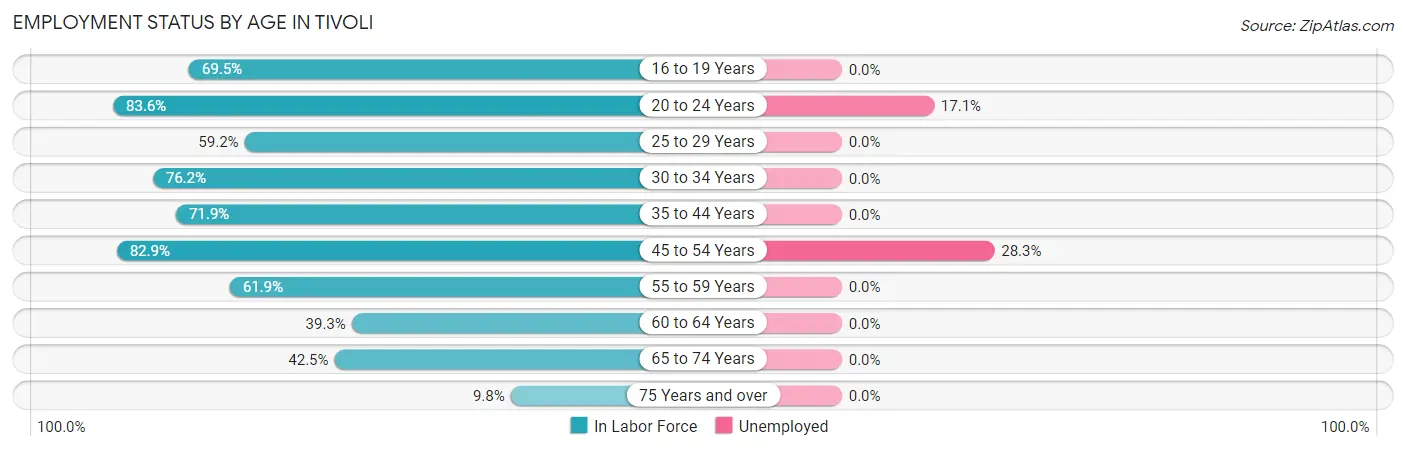
| Age Bracket | In Labor Force | Unemployed |
| 16 to 19 Years | 41 (69.5%) | 0 (0.0%) |
| 20 to 24 Years | 117 (83.6%) | 20 (17.1%) |
| 25 to 29 Years | 29 (59.2%) | 0 (0.0%) |
| 30 to 34 Years | 16 (76.2%) | 0 (0.0%) |
| 35 to 44 Years | 46 (71.9%) | 0 (0.0%) |
| 45 to 54 Years | 92 (82.9%) | 26 (28.3%) |
| 55 to 59 Years | 13 (61.9%) | 0 (0.0%) |
| 60 to 64 Years | 11 (39.3%) | 0 (0.0%) |
| 65 to 74 Years | 51 (42.5%) | 0 (0.0%) |
| 75 Years and over | 5 (9.8%) | 0 (0.0%) |
| Total | 421 (63.4%) | 46 (10.9%) |
Employment Status by Educational Attainment in Tivoli
According to labor force statistics for Tivoli, 70.4% of individuals (207) out of the total population between 25 and 64 years of age (294) are in the labor force, with 12.6% or 26 of them being unemployed. The group with the highest labor force participation rate are those with the educational attainment of high school diploma, with 73.0% or 27 individuals in the labor force. Within the labor force, individuals with college / associate degree education have the highest percentage of unemployment, with 23.5% or 8 of them being unemployed.
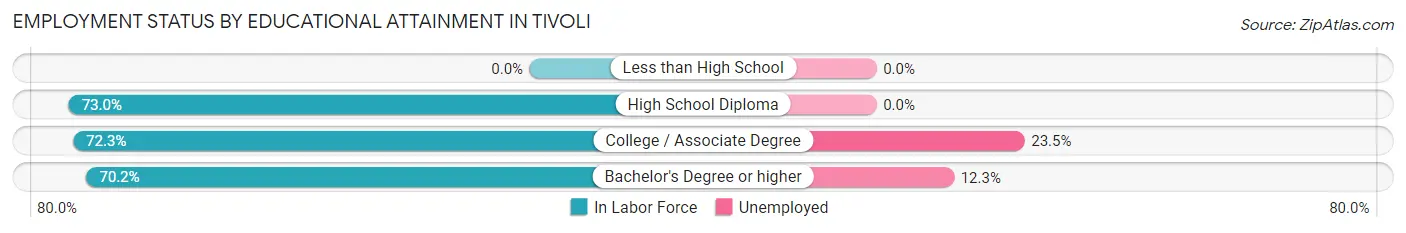
| Educational Attainment | In Labor Force | Unemployed |
| Less than High School | 0 (0.0%) | 0 (0.0%) |
| High School Diploma | 27 (73.0%) | 0 (0.0%) |
| College / Associate Degree | 34 (72.3%) | 11 (23.5%) |
| Bachelor's Degree or higher | 146 (70.2%) | 26 (12.3%) |
| Total | 207 (70.4%) | 37 (12.6%) |
Employment Occupations by Sex in Tivoli
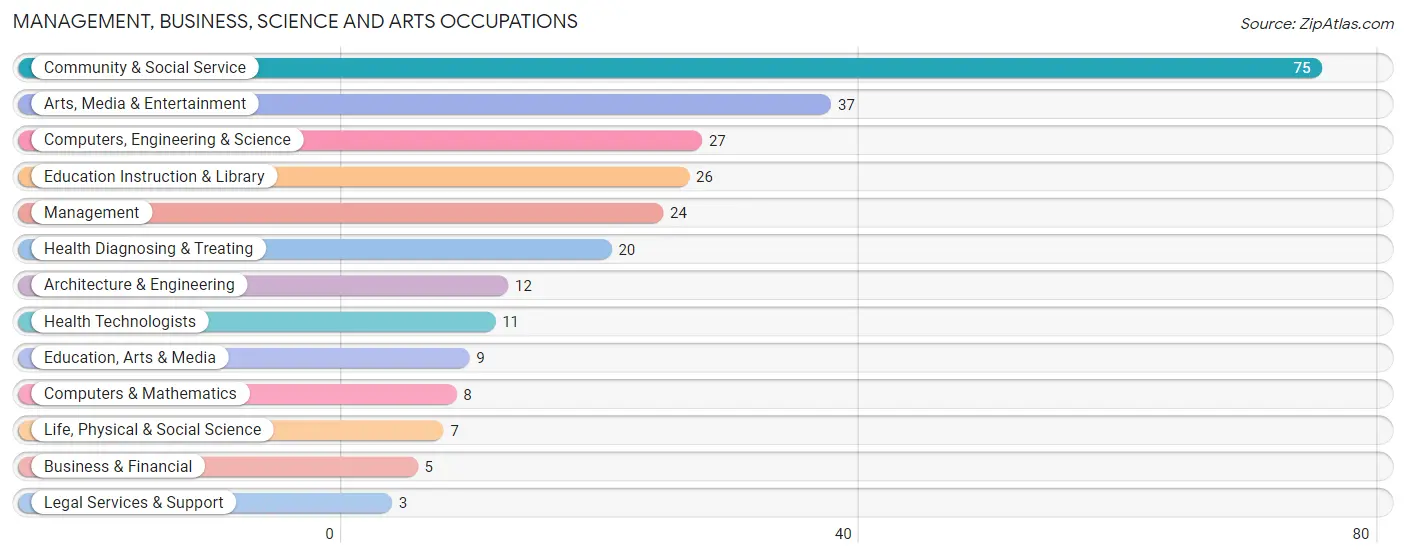
Management, Business, Science and Arts Occupations
The most common Management, Business, Science and Arts occupations in Tivoli are Community & Social Service (75 | 20.0%), Arts, Media & Entertainment (37 | 9.9%), Computers, Engineering & Science (27 | 7.2%), Education Instruction & Library (26 | 6.9%), and Management (24 | 6.4%).
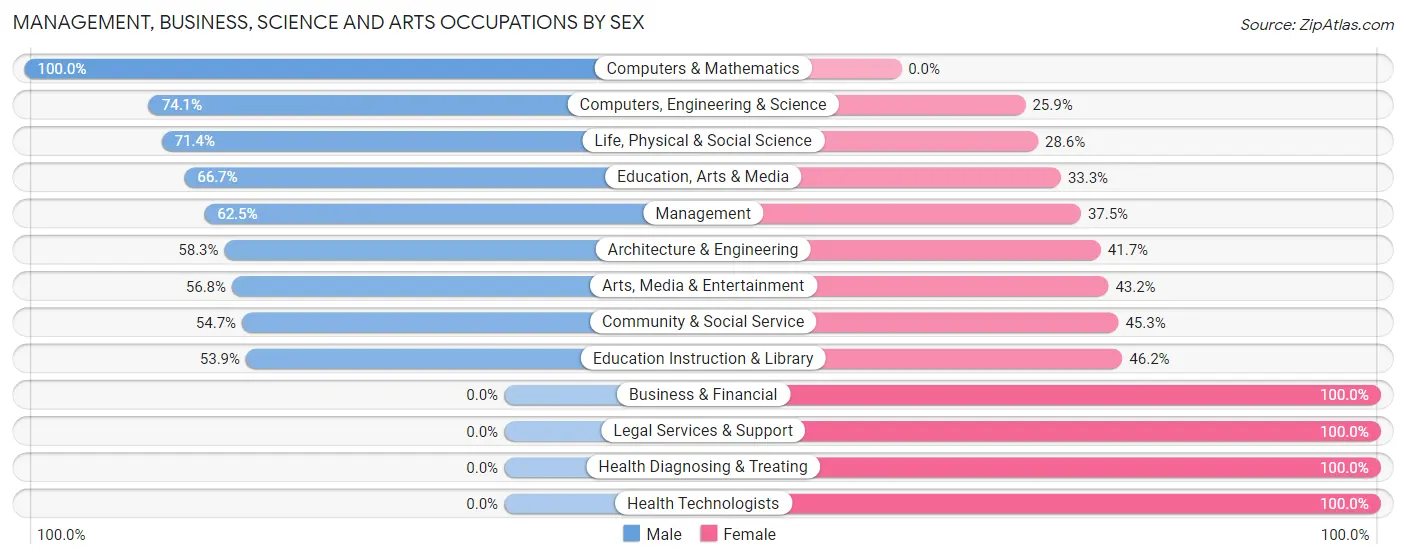
Management, Business, Science and Arts Occupations by Sex
Within the Management, Business, Science and Arts occupations in Tivoli, the most male-oriented occupations are Computers & Mathematics (100.0%), Computers, Engineering & Science (74.1%), and Life, Physical & Social Science (71.4%), while the most female-oriented occupations are Business & Financial (100.0%), Legal Services & Support (100.0%), and Health Diagnosing & Treating (100.0%).
| Occupation | Male | Female |
| Management | 15 (62.5%) | 9 (37.5%) |
| Business & Financial | 0 (0.0%) | 5 (100.0%) |
| Computers, Engineering & Science | 20 (74.1%) | 7 (25.9%) |
| Computers & Mathematics | 8 (100.0%) | 0 (0.0%) |
| Architecture & Engineering | 7 (58.3%) | 5 (41.7%) |
| Life, Physical & Social Science | 5 (71.4%) | 2 (28.6%) |
| Community & Social Service | 41 (54.7%) | 34 (45.3%) |
| Education, Arts & Media | 6 (66.7%) | 3 (33.3%) |
| Legal Services & Support | 0 (0.0%) | 3 (100.0%) |
| Education Instruction & Library | 14 (53.8%) | 12 (46.2%) |
| Arts, Media & Entertainment | 21 (56.8%) | 16 (43.2%) |
| Health Diagnosing & Treating | 0 (0.0%) | 20 (100.0%) |
| Health Technologists | 0 (0.0%) | 11 (100.0%) |
| Total (Category) | 76 (50.3%) | 75 (49.7%) |
| Total (Overall) | 140 (37.3%) | 235 (62.7%) |
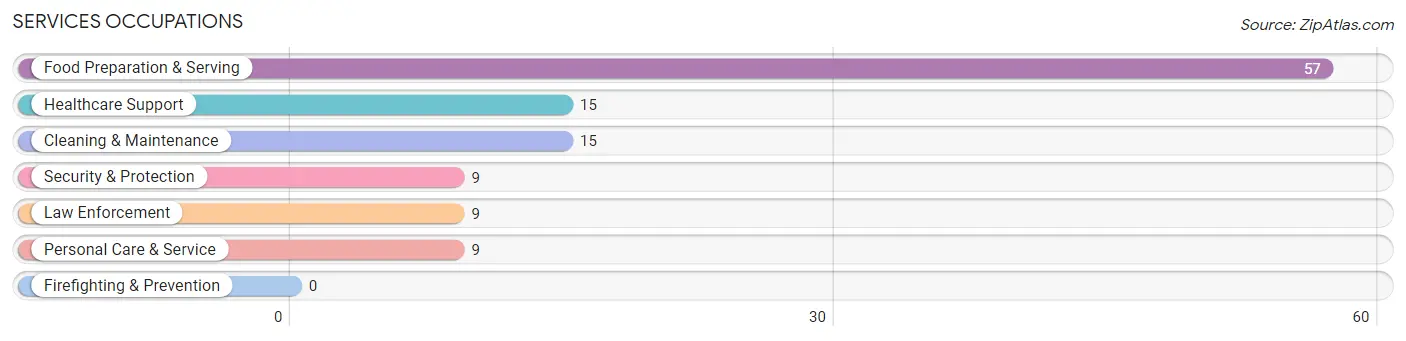
Services Occupations
The most common Services occupations in Tivoli are Food Preparation & Serving (57 | 15.2%), Healthcare Support (15 | 4.0%), Cleaning & Maintenance (15 | 4.0%), Security & Protection (9 | 2.4%), and Law Enforcement (9 | 2.4%).
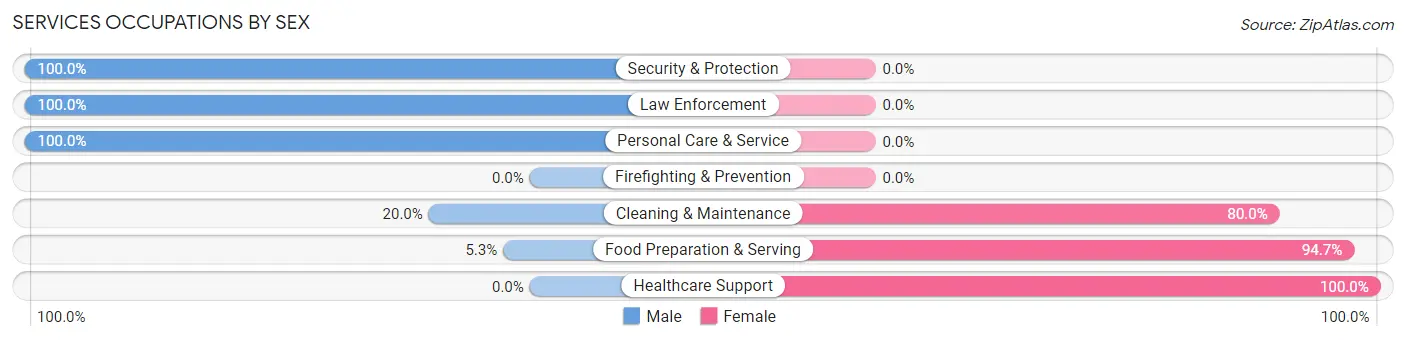
Services Occupations by Sex
Within the Services occupations in Tivoli, the most male-oriented occupations are Security & Protection (100.0%), Law Enforcement (100.0%), and Personal Care & Service (100.0%), while the most female-oriented occupations are Healthcare Support (100.0%), Food Preparation & Serving (94.7%), and Cleaning & Maintenance (80.0%).
| Occupation | Male | Female |
| Healthcare Support | 0 (0.0%) | 15 (100.0%) |
| Security & Protection | 9 (100.0%) | 0 (0.0%) |
| Firefighting & Prevention | 0 (0.0%) | 0 (0.0%) |
| Law Enforcement | 9 (100.0%) | 0 (0.0%) |
| Food Preparation & Serving | 3 (5.3%) | 54 (94.7%) |
| Cleaning & Maintenance | 3 (20.0%) | 12 (80.0%) |
| Personal Care & Service | 9 (100.0%) | 0 (0.0%) |
| Total (Category) | 24 (22.9%) | 81 (77.1%) |
| Total (Overall) | 140 (37.3%) | 235 (62.7%) |
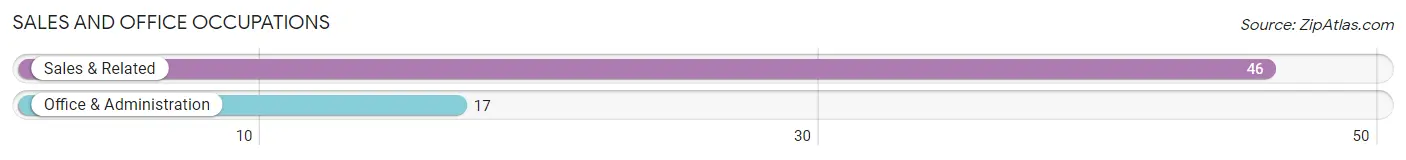
Sales and Office Occupations
The most common Sales and Office occupations in Tivoli are Sales & Related (46 | 12.3%), and Office & Administration (17 | 4.5%).
Sales and Office Occupations by Sex
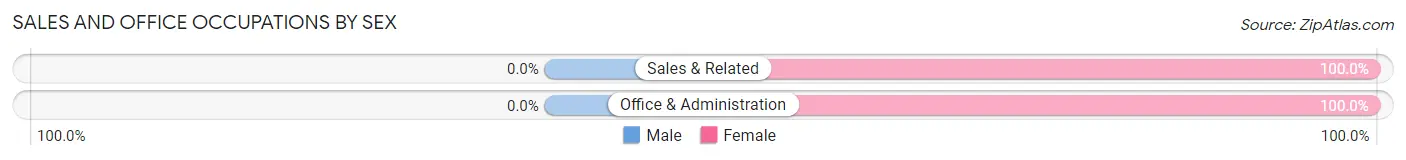
| Occupation | Male | Female |
| Sales & Related | 0 (0.0%) | 46 (100.0%) |
| Office & Administration | 0 (0.0%) | 17 (100.0%) |
| Total (Category) | 0 (0.0%) | 63 (100.0%) |
| Total (Overall) | 140 (37.3%) | 235 (62.7%) |
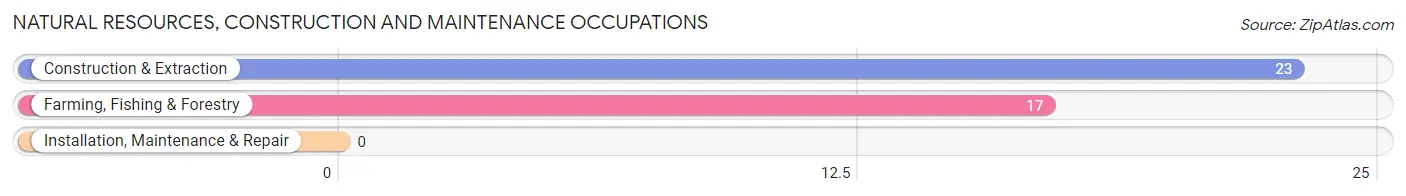
Natural Resources, Construction and Maintenance Occupations
The most common Natural Resources, Construction and Maintenance occupations in Tivoli are Construction & Extraction (23 | 6.1%), and Farming, Fishing & Forestry (17 | 4.5%).
Natural Resources, Construction and Maintenance Occupations by Sex
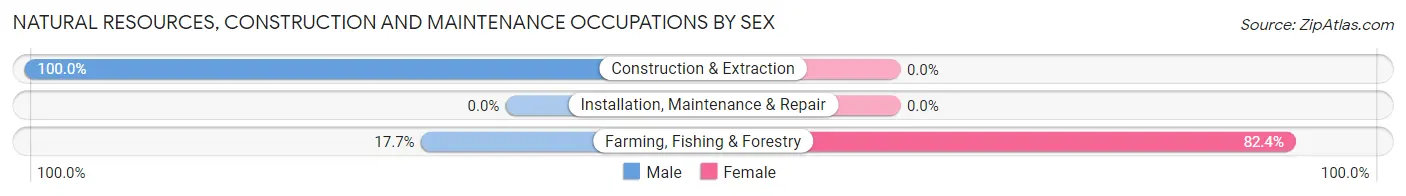
| Occupation | Male | Female |
| Farming, Fishing & Forestry | 3 (17.6%) | 14 (82.4%) |
| Construction & Extraction | 23 (100.0%) | 0 (0.0%) |
| Installation, Maintenance & Repair | 0 (0.0%) | 0 (0.0%) |
| Total (Category) | 26 (65.0%) | 14 (35.0%) |
| Total (Overall) | 140 (37.3%) | 235 (62.7%) |
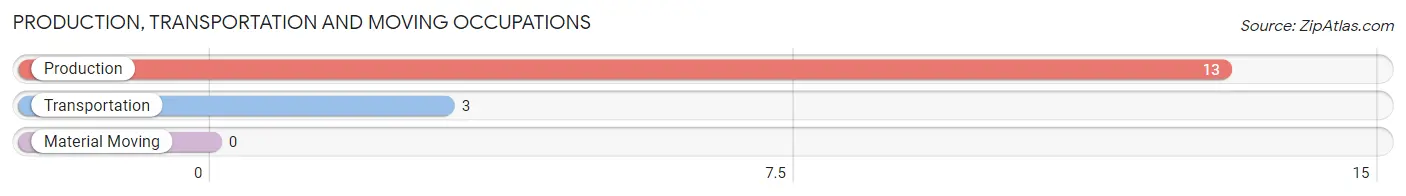
Production, Transportation and Moving Occupations
The most common Production, Transportation and Moving occupations in Tivoli are Production (13 | 3.5%), and Transportation (3 | 0.8%).
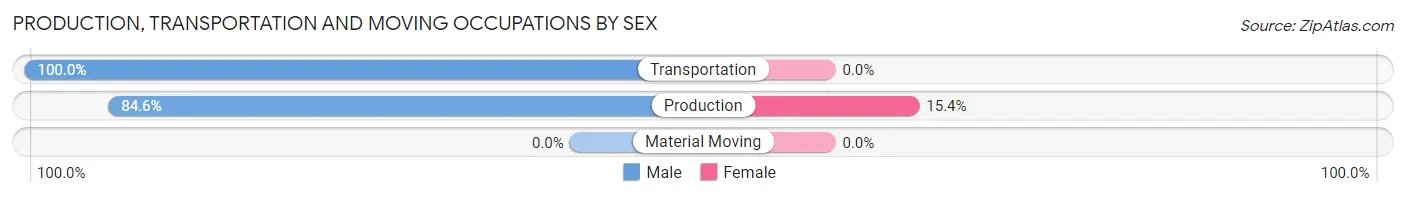
Production, Transportation and Moving Occupations by Sex
| Occupation | Male | Female |
| Production | 11 (84.6%) | 2 (15.4%) |
| Transportation | 3 (100.0%) | 0 (0.0%) |
| Material Moving | 0 (0.0%) | 0 (0.0%) |
| Total (Category) | 14 (87.5%) | 2 (12.5%) |
| Total (Overall) | 140 (37.3%) | 235 (62.7%) |
Employment Industries by Sex in Tivoli
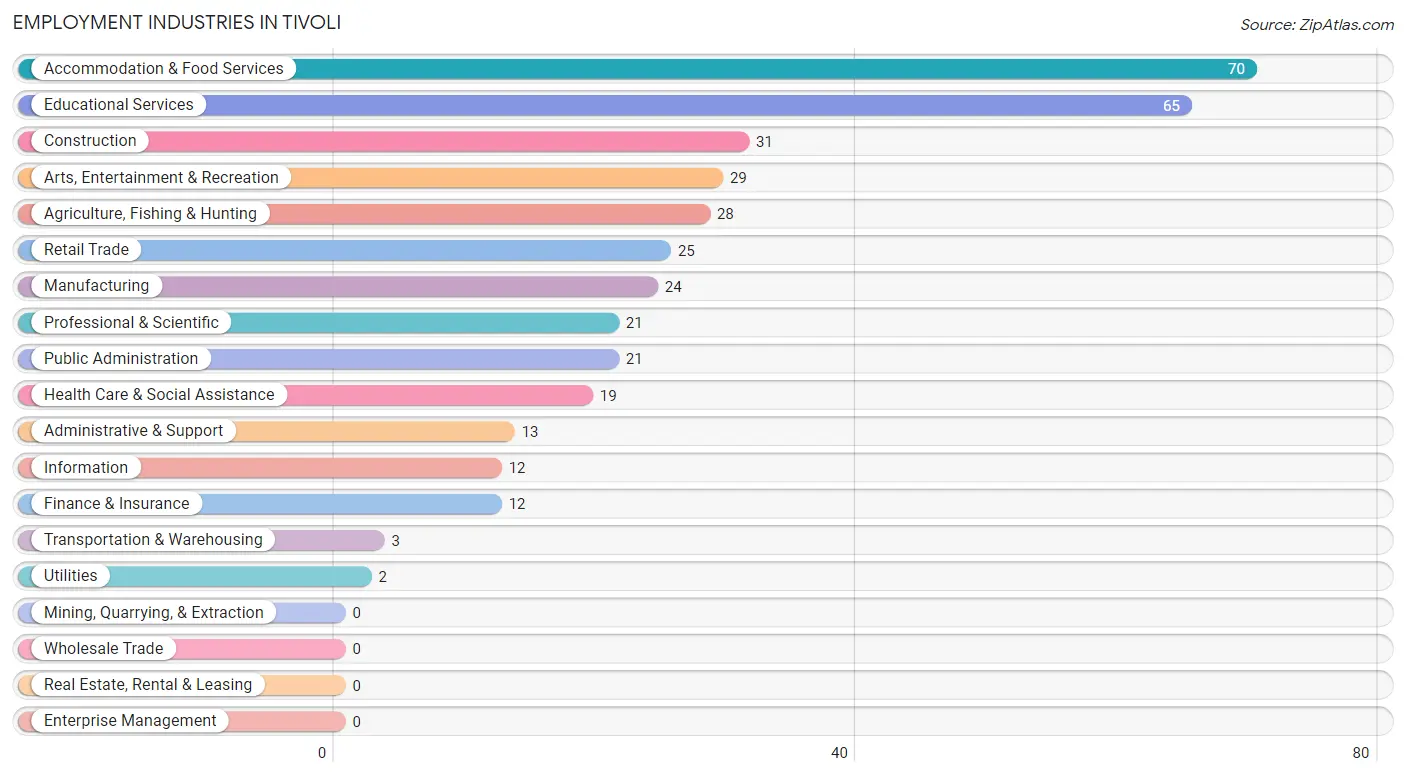
Employment Industries in Tivoli
The major employment industries in Tivoli include Accommodation & Food Services (70 | 18.7%), Educational Services (65 | 17.3%), Construction (31 | 8.3%), Arts, Entertainment & Recreation (29 | 7.7%), and Agriculture, Fishing & Hunting (28 | 7.5%).
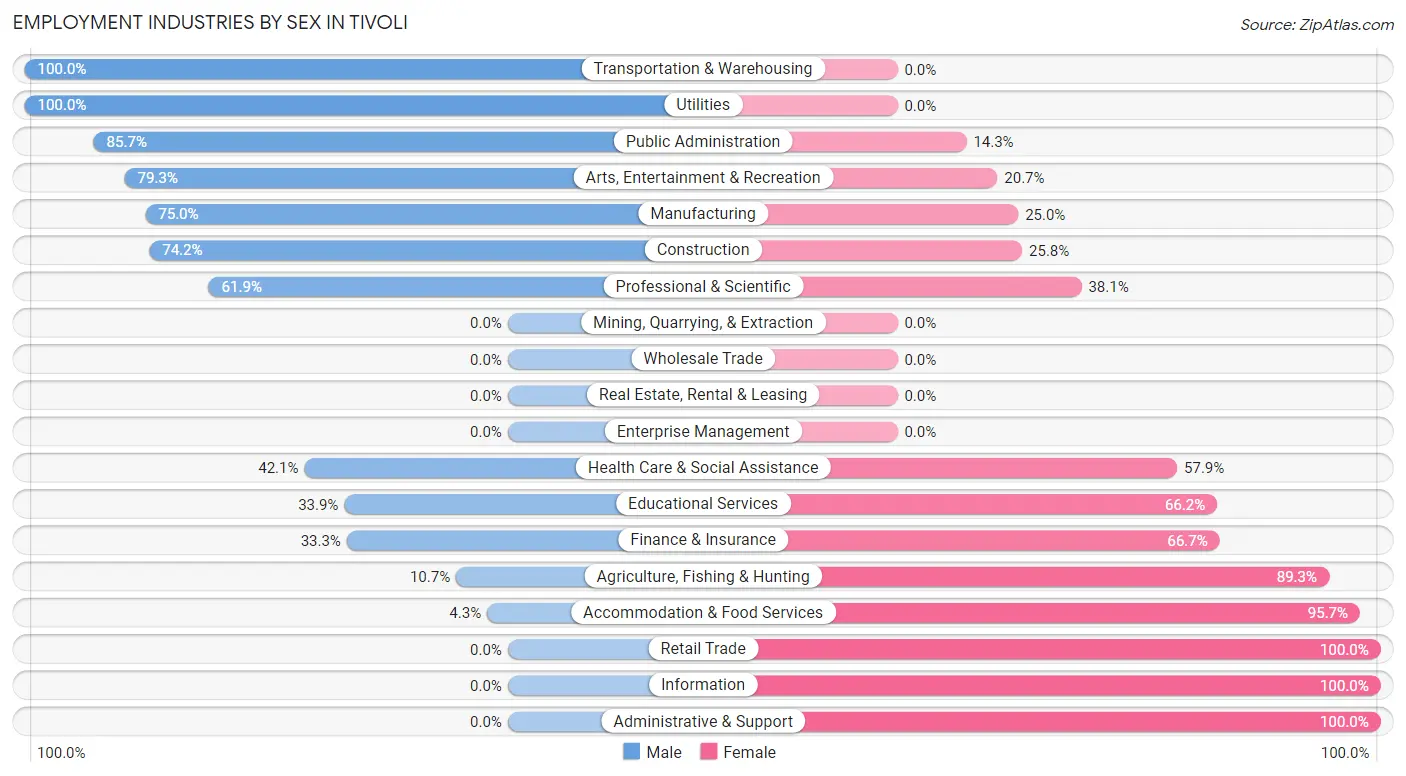
Employment Industries by Sex in Tivoli
The Tivoli industries that see more men than women are Transportation & Warehousing (100.0%), Utilities (100.0%), and Public Administration (85.7%), whereas the industries that tend to have a higher number of women are Retail Trade (100.0%), Information (100.0%), and Administrative & Support (100.0%).
| Industry | Male | Female |
| Agriculture, Fishing & Hunting | 3 (10.7%) | 25 (89.3%) |
| Mining, Quarrying, & Extraction | 0 (0.0%) | 0 (0.0%) |
| Construction | 23 (74.2%) | 8 (25.8%) |
| Manufacturing | 18 (75.0%) | 6 (25.0%) |
| Wholesale Trade | 0 (0.0%) | 0 (0.0%) |
| Retail Trade | 0 (0.0%) | 25 (100.0%) |
| Transportation & Warehousing | 3 (100.0%) | 0 (0.0%) |
| Utilities | 2 (100.0%) | 0 (0.0%) |
| Information | 0 (0.0%) | 12 (100.0%) |
| Finance & Insurance | 4 (33.3%) | 8 (66.7%) |
| Real Estate, Rental & Leasing | 0 (0.0%) | 0 (0.0%) |
| Professional & Scientific | 13 (61.9%) | 8 (38.1%) |
| Enterprise Management | 0 (0.0%) | 0 (0.0%) |
| Administrative & Support | 0 (0.0%) | 13 (100.0%) |
| Educational Services | 22 (33.9%) | 43 (66.1%) |
| Health Care & Social Assistance | 8 (42.1%) | 11 (57.9%) |
| Arts, Entertainment & Recreation | 23 (79.3%) | 6 (20.7%) |
| Accommodation & Food Services | 3 (4.3%) | 67 (95.7%) |
| Public Administration | 18 (85.7%) | 3 (14.3%) |
| Total | 140 (37.3%) | 235 (62.7%) |
Education in Tivoli
School Enrollment in Tivoli
The most common levels of schooling among the 342 students in Tivoli are college / undergraduate (158 | 46.2%), elementary school (61 | 17.8%), and middle school (46 | 13.5%).
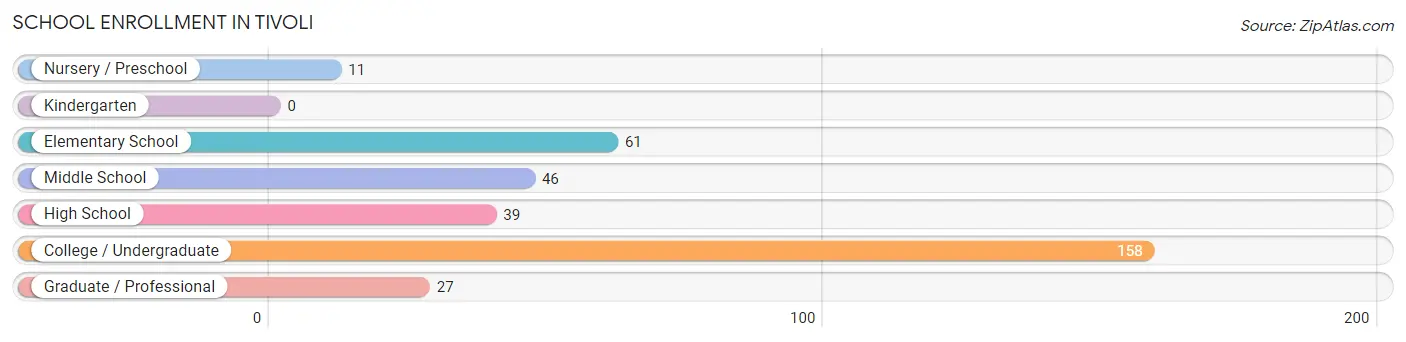
| School Level | # Students | % Students |
| Nursery / Preschool | 11 | 3.2% |
| Kindergarten | 0 | 0.0% |
| Elementary School | 61 | 17.8% |
| Middle School | 46 | 13.5% |
| High School | 39 | 11.4% |
| College / Undergraduate | 158 | 46.2% |
| Graduate / Professional | 27 | 7.9% |
| Total | 342 | 100.0% |
School Enrollment by Age by Funding Source in Tivoli
Out of a total of 342 students who are enrolled in schools in Tivoli, 196 (57.3%) attend a private institution, while the remaining 146 (42.7%) are enrolled in public schools. The age group of 25 to 34 year olds has the highest likelihood of being enrolled in private schools, with 23 (88.5% in the age bracket) enrolled. Conversely, the age group of 3 to 4 year olds has the lowest likelihood of being enrolled in a private school, with 8 (100.0% in the age bracket) attending a public institution.
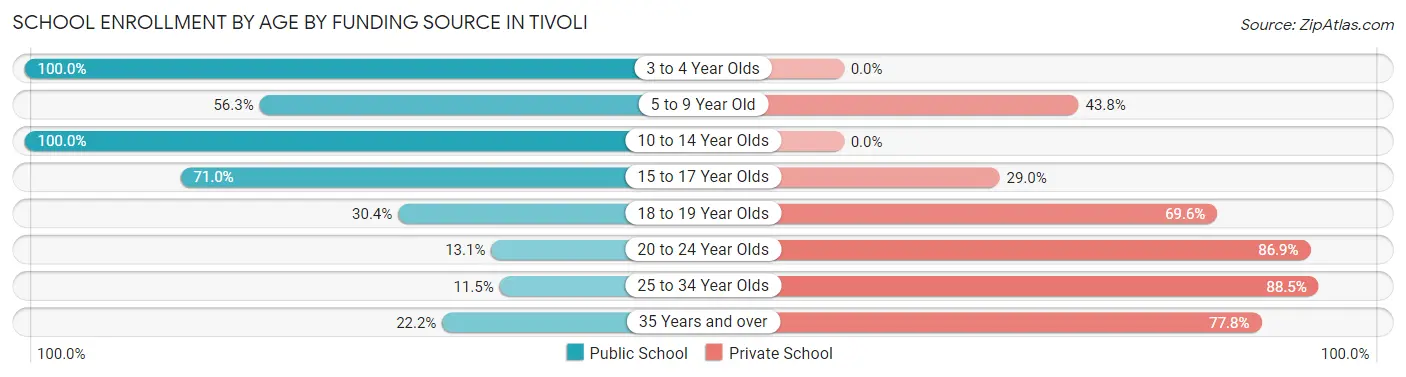
| Age Bracket | Public School | Private School |
| 3 to 4 Year Olds | 8 (100.0%) | 0 (0.0%) |
| 5 to 9 Year Old | 36 (56.2%) | 28 (43.8%) |
| 10 to 14 Year Olds | 51 (100.0%) | 0 (0.0%) |
| 15 to 17 Year Olds | 22 (71.0%) | 9 (29.0%) |
| 18 to 19 Year Olds | 7 (30.4%) | 16 (69.6%) |
| 20 to 24 Year Olds | 17 (13.1%) | 113 (86.9%) |
| 25 to 34 Year Olds | 3 (11.5%) | 23 (88.5%) |
| 35 Years and over | 2 (22.2%) | 7 (77.8%) |
| Total | 146 (42.7%) | 196 (57.3%) |
Educational Attainment by Field of Study in Tivoli
Visual & performing arts (100 | 29.1%), literature & languages (56 | 16.3%), science & technology (31 | 9.0%), communications (29 | 8.4%), and arts & humanities (24 | 7.0%) are the most common fields of study among 344 individuals in Tivoli who have obtained a bachelor's degree or higher.
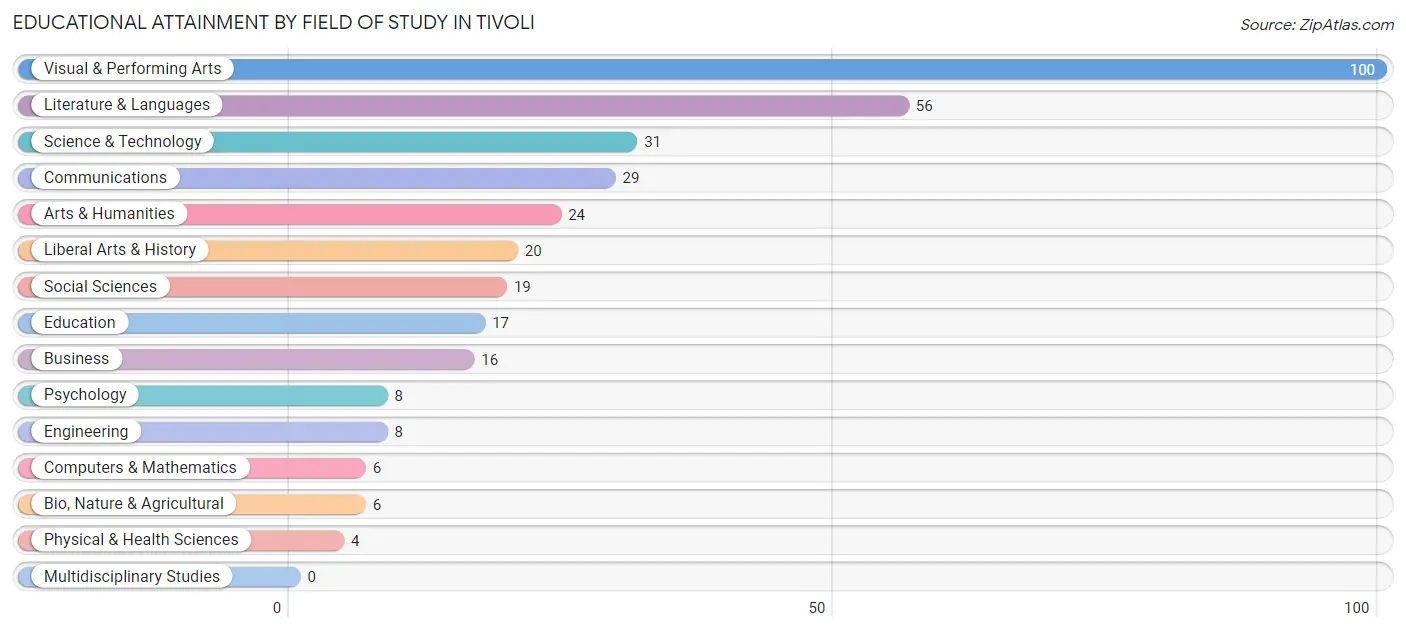
| Field of Study | # Graduates | % Graduates |
| Computers & Mathematics | 6 | 1.7% |
| Bio, Nature & Agricultural | 6 | 1.7% |
| Physical & Health Sciences | 4 | 1.2% |
| Psychology | 8 | 2.3% |
| Social Sciences | 19 | 5.5% |
| Engineering | 8 | 2.3% |
| Multidisciplinary Studies | 0 | 0.0% |
| Science & Technology | 31 | 9.0% |
| Business | 16 | 4.6% |
| Education | 17 | 4.9% |
| Literature & Languages | 56 | 16.3% |
| Liberal Arts & History | 20 | 5.8% |
| Visual & Performing Arts | 100 | 29.1% |
| Communications | 29 | 8.4% |
| Arts & Humanities | 24 | 7.0% |
| Total | 344 | 100.0% |
Transportation & Commute in Tivoli
Vehicle Availability by Sex in Tivoli
The most prevalent vehicle ownership categories in Tivoli are males with 1 vehicle (52, accounting for 37.1%) and females with 1 vehicle (54, making up 23.4%).
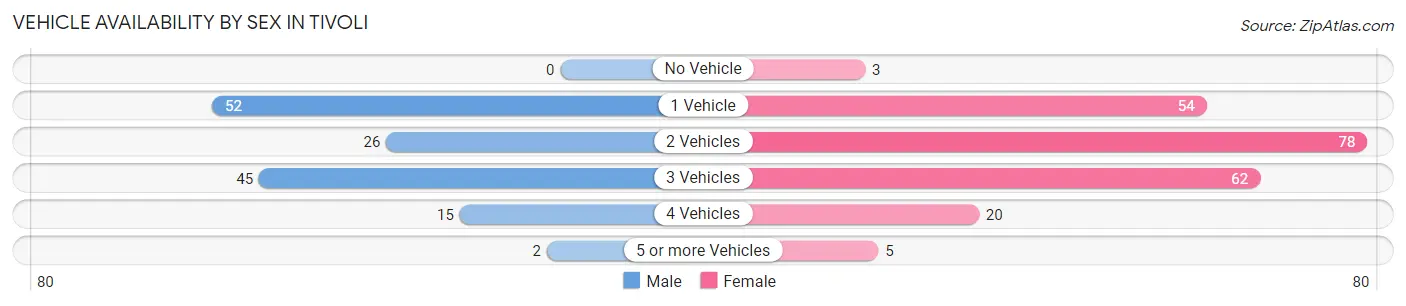
| Vehicles Available | Male | Female |
| No Vehicle | 0 (0.0%) | 3 (1.3%) |
| 1 Vehicle | 52 (37.1%) | 54 (24.3%) |
| 2 Vehicles | 26 (18.6%) | 78 (35.1%) |
| 3 Vehicles | 45 (32.1%) | 62 (27.9%) |
| 4 Vehicles | 15 (10.7%) | 20 (9.0%) |
| 5 or more Vehicles | 2 (1.4%) | 5 (2.2%) |
| Total | 140 (100.0%) | 222 (100.0%) |
Commute Time in Tivoli
The most frequently occuring commute durations in Tivoli are 5 to 9 minutes (77 commuters, 23.6%), 15 to 19 minutes (48 commuters, 14.7%), and 20 to 24 minutes (40 commuters, 12.3%).
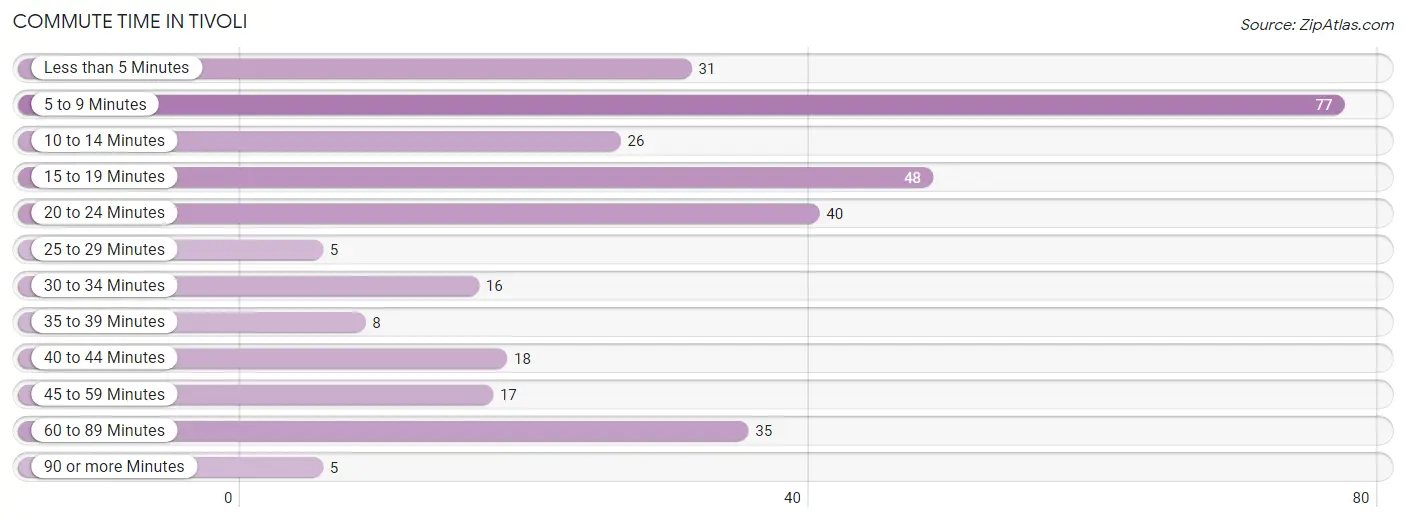
| Commute Time | # Commuters | % Commuters |
| Less than 5 Minutes | 31 | 9.5% |
| 5 to 9 Minutes | 77 | 23.6% |
| 10 to 14 Minutes | 26 | 8.0% |
| 15 to 19 Minutes | 48 | 14.7% |
| 20 to 24 Minutes | 40 | 12.3% |
| 25 to 29 Minutes | 5 | 1.5% |
| 30 to 34 Minutes | 16 | 4.9% |
| 35 to 39 Minutes | 8 | 2.5% |
| 40 to 44 Minutes | 18 | 5.5% |
| 45 to 59 Minutes | 17 | 5.2% |
| 60 to 89 Minutes | 35 | 10.7% |
| 90 or more Minutes | 5 | 1.5% |
Commute Time by Sex in Tivoli
The most common commute times in Tivoli are 15 to 19 minutes (27 commuters, 22.7%) for males and 5 to 9 minutes (54 commuters, 26.1%) for females.
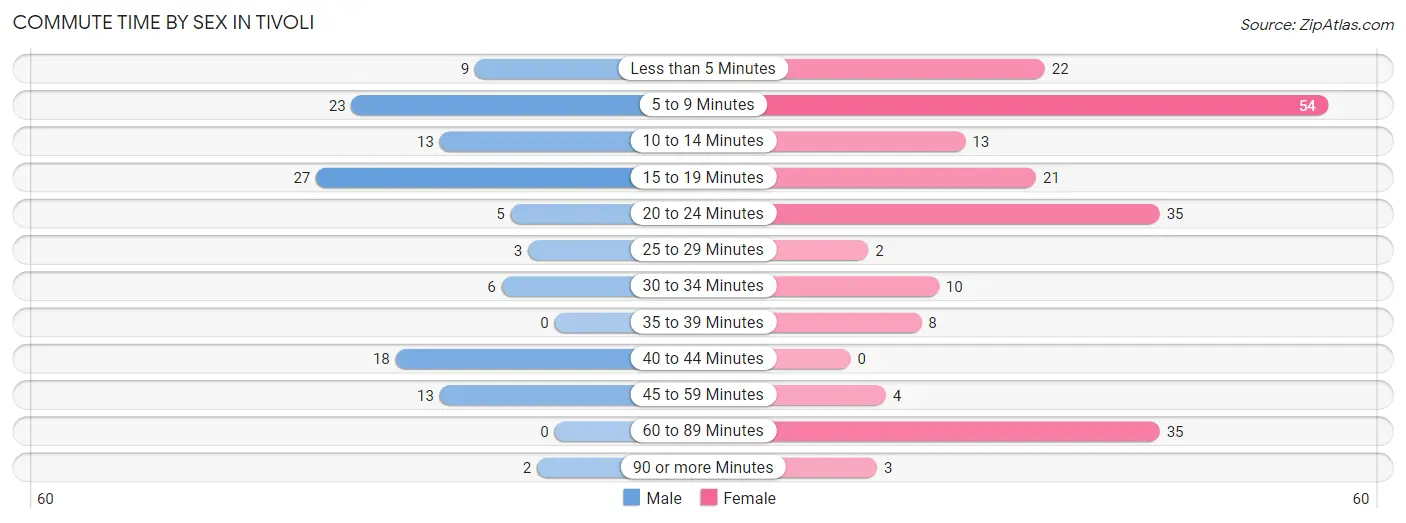
| Commute Time | Male | Female |
| Less than 5 Minutes | 9 (7.6%) | 22 (10.6%) |
| 5 to 9 Minutes | 23 (19.3%) | 54 (26.1%) |
| 10 to 14 Minutes | 13 (10.9%) | 13 (6.3%) |
| 15 to 19 Minutes | 27 (22.7%) | 21 (10.1%) |
| 20 to 24 Minutes | 5 (4.2%) | 35 (16.9%) |
| 25 to 29 Minutes | 3 (2.5%) | 2 (1.0%) |
| 30 to 34 Minutes | 6 (5.0%) | 10 (4.8%) |
| 35 to 39 Minutes | 0 (0.0%) | 8 (3.9%) |
| 40 to 44 Minutes | 18 (15.1%) | 0 (0.0%) |
| 45 to 59 Minutes | 13 (10.9%) | 4 (1.9%) |
| 60 to 89 Minutes | 0 (0.0%) | 35 (16.9%) |
| 90 or more Minutes | 2 (1.7%) | 3 (1.5%) |
Time of Departure to Work by Sex in Tivoli
The most frequent times of departure to work in Tivoli are 12:00 PM to 3:59 PM (24, 20.2%) for males and 6:30 AM to 6:59 AM (37, 17.9%) for females.
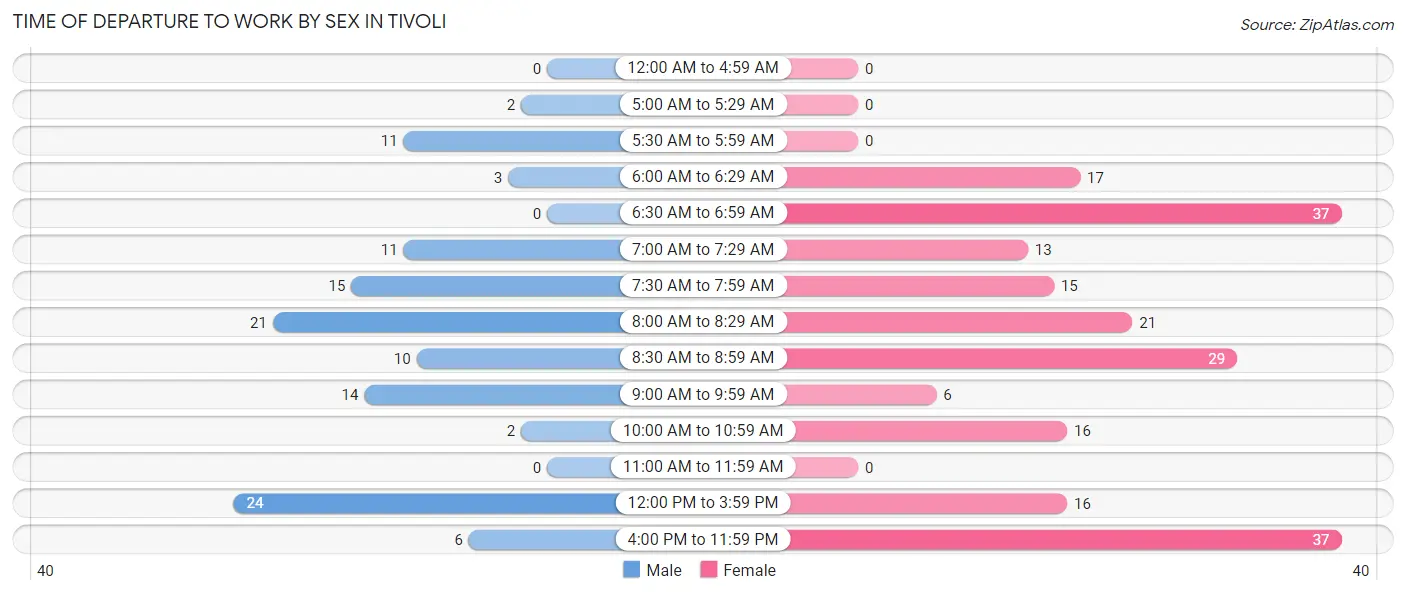
| Time of Departure | Male | Female |
| 12:00 AM to 4:59 AM | 0 (0.0%) | 0 (0.0%) |
| 5:00 AM to 5:29 AM | 2 (1.7%) | 0 (0.0%) |
| 5:30 AM to 5:59 AM | 11 (9.2%) | 0 (0.0%) |
| 6:00 AM to 6:29 AM | 3 (2.5%) | 17 (8.2%) |
| 6:30 AM to 6:59 AM | 0 (0.0%) | 37 (17.9%) |
| 7:00 AM to 7:29 AM | 11 (9.2%) | 13 (6.3%) |
| 7:30 AM to 7:59 AM | 15 (12.6%) | 15 (7.2%) |
| 8:00 AM to 8:29 AM | 21 (17.6%) | 21 (10.1%) |
| 8:30 AM to 8:59 AM | 10 (8.4%) | 29 (14.0%) |
| 9:00 AM to 9:59 AM | 14 (11.8%) | 6 (2.9%) |
| 10:00 AM to 10:59 AM | 2 (1.7%) | 16 (7.7%) |
| 11:00 AM to 11:59 AM | 0 (0.0%) | 0 (0.0%) |
| 12:00 PM to 3:59 PM | 24 (20.2%) | 16 (7.7%) |
| 4:00 PM to 11:59 PM | 6 (5.0%) | 37 (17.9%) |
| Total | 119 (100.0%) | 207 (100.0%) |
Housing Occupancy in Tivoli
Occupancy by Ownership in Tivoli
Of the total 366 dwellings in Tivoli, owner-occupied units account for 185 (50.5%), while renter-occupied units make up 181 (49.4%).
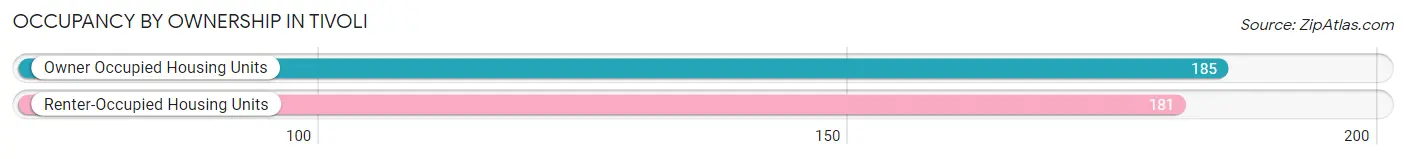
| Occupancy | # Housing Units | % Housing Units |
| Owner Occupied Housing Units | 185 | 50.5% |
| Renter-Occupied Housing Units | 181 | 49.4% |
| Total Occupied Housing Units | 366 | 100.0% |
Occupancy by Household Size in Tivoli
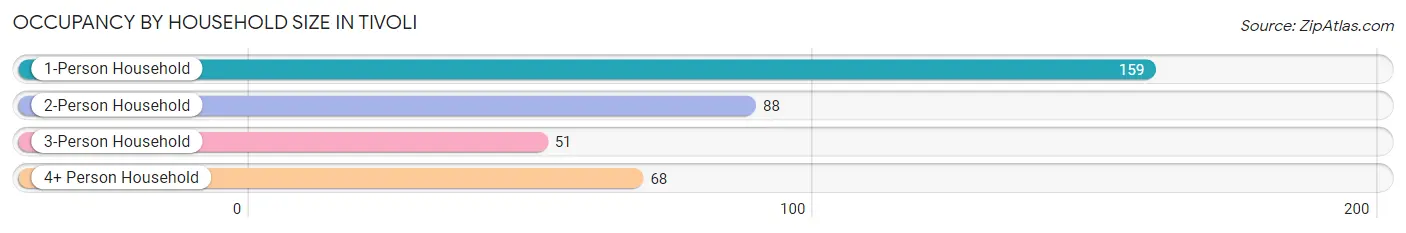
| Household Size | # Housing Units | % Housing Units |
| 1-Person Household | 159 | 43.4% |
| 2-Person Household | 88 | 24.0% |
| 3-Person Household | 51 | 13.9% |
| 4+ Person Household | 68 | 18.6% |
| Total Housing Units | 366 | 100.0% |
Occupancy by Ownership by Household Size in Tivoli
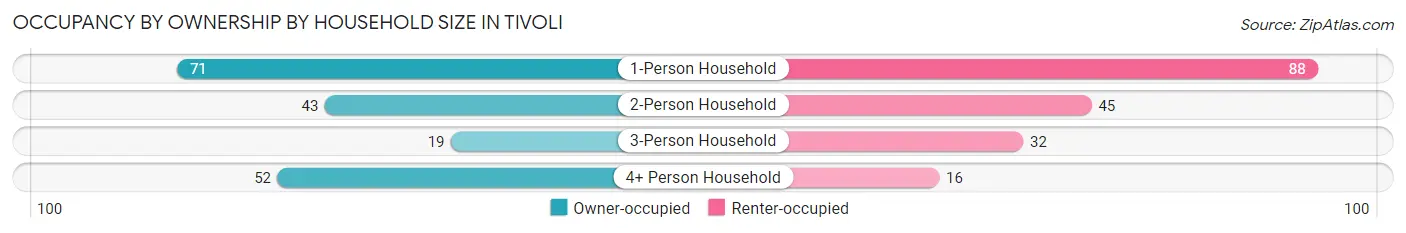
| Household Size | Owner-occupied | Renter-occupied |
| 1-Person Household | 71 (44.7%) | 88 (55.3%) |
| 2-Person Household | 43 (48.9%) | 45 (51.1%) |
| 3-Person Household | 19 (37.2%) | 32 (62.7%) |
| 4+ Person Household | 52 (76.5%) | 16 (23.5%) |
| Total Housing Units | 185 (50.5%) | 181 (49.4%) |
Occupancy by Educational Attainment in Tivoli
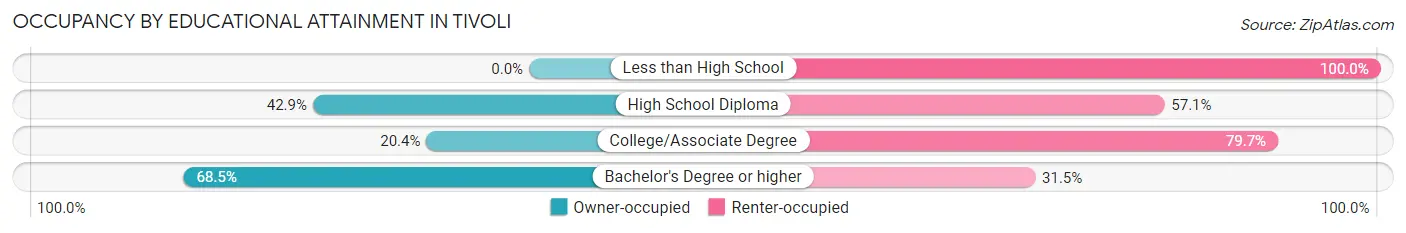
| Household Size | Owner-occupied | Renter-occupied |
| Less than High School | 0 (0.0%) | 6 (100.0%) |
| High School Diploma | 12 (42.9%) | 16 (57.1%) |
| College/Associate Degree | 23 (20.3%) | 90 (79.6%) |
| Bachelor's Degree or higher | 150 (68.5%) | 69 (31.5%) |
Occupancy by Age of Householder in Tivoli
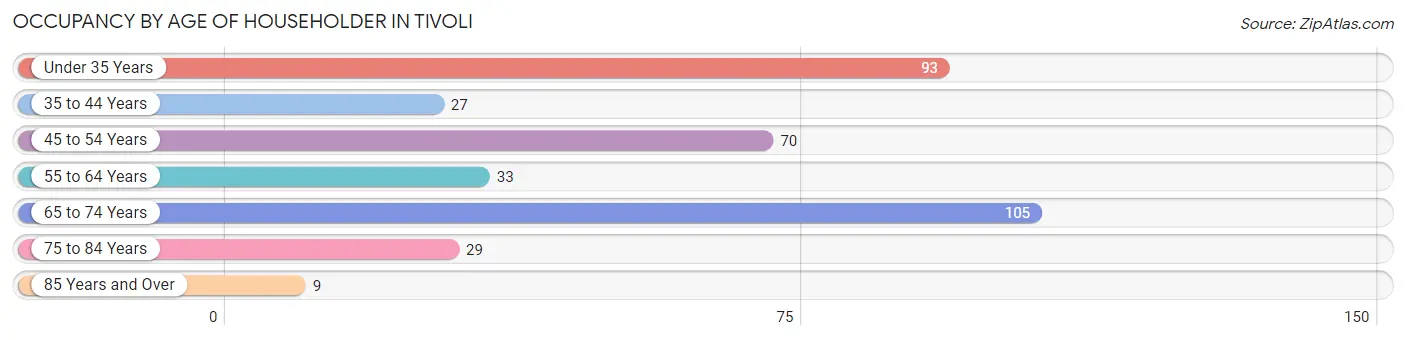
| Age Bracket | # Households | % Households |
| Under 35 Years | 93 | 25.4% |
| 35 to 44 Years | 27 | 7.4% |
| 45 to 54 Years | 70 | 19.1% |
| 55 to 64 Years | 33 | 9.0% |
| 65 to 74 Years | 105 | 28.7% |
| 75 to 84 Years | 29 | 7.9% |
| 85 Years and Over | 9 | 2.5% |
| Total | 366 | 100.0% |
Housing Finances in Tivoli
Median Income by Occupancy in Tivoli
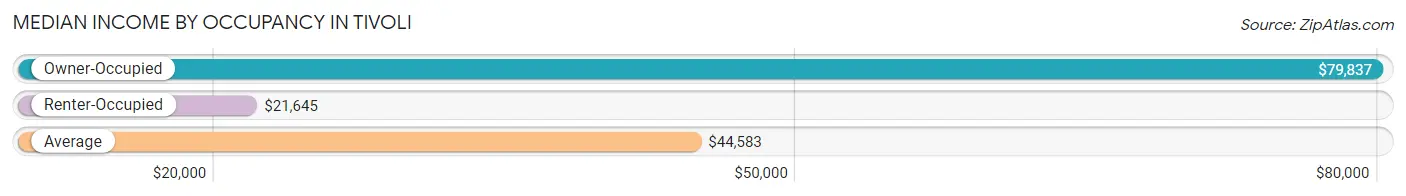
| Occupancy Type | # Households | Median Income |
| Owner-Occupied | 185 (50.5%) | $79,837 |
| Renter-Occupied | 181 (49.4%) | $21,645 |
| Average | 366 (100.0%) | $44,583 |
Occupancy by Householder Income Bracket in Tivoli
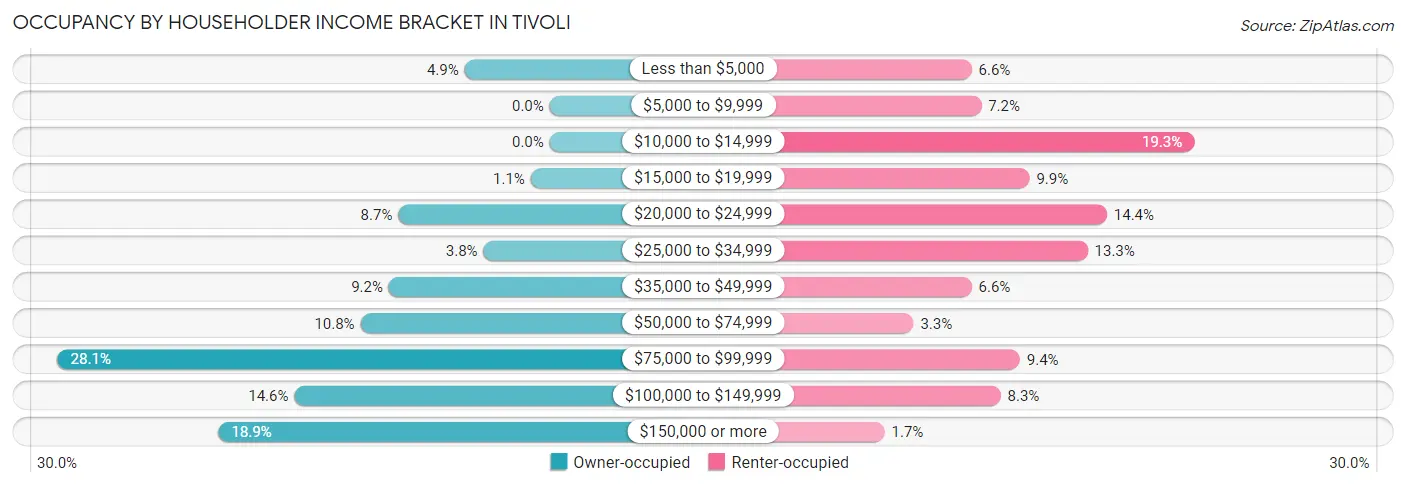
| Income Bracket | Owner-occupied | Renter-occupied |
| Less than $5,000 | 9 (4.9%) | 12 (6.6%) |
| $5,000 to $9,999 | 0 (0.0%) | 13 (7.2%) |
| $10,000 to $14,999 | 0 (0.0%) | 35 (19.3%) |
| $15,000 to $19,999 | 2 (1.1%) | 18 (9.9%) |
| $20,000 to $24,999 | 16 (8.6%) | 26 (14.4%) |
| $25,000 to $34,999 | 7 (3.8%) | 24 (13.3%) |
| $35,000 to $49,999 | 17 (9.2%) | 12 (6.6%) |
| $50,000 to $74,999 | 20 (10.8%) | 6 (3.3%) |
| $75,000 to $99,999 | 52 (28.1%) | 17 (9.4%) |
| $100,000 to $149,999 | 27 (14.6%) | 15 (8.3%) |
| $150,000 or more | 35 (18.9%) | 3 (1.7%) |
| Total | 185 (100.0%) | 181 (100.0%) |
Monthly Housing Cost Tiers in Tivoli
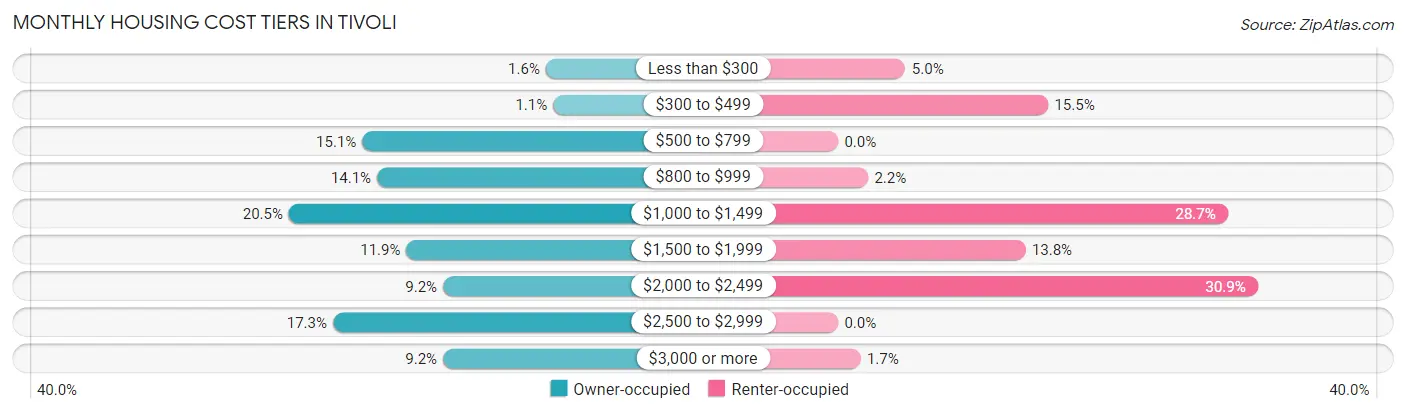
| Monthly Cost | Owner-occupied | Renter-occupied |
| Less than $300 | 3 (1.6%) | 9 (5.0%) |
| $300 to $499 | 2 (1.1%) | 28 (15.5%) |
| $500 to $799 | 28 (15.1%) | 0 (0.0%) |
| $800 to $999 | 26 (14.1%) | 4 (2.2%) |
| $1,000 to $1,499 | 38 (20.5%) | 52 (28.7%) |
| $1,500 to $1,999 | 22 (11.9%) | 25 (13.8%) |
| $2,000 to $2,499 | 17 (9.2%) | 56 (30.9%) |
| $2,500 to $2,999 | 32 (17.3%) | 0 (0.0%) |
| $3,000 or more | 17 (9.2%) | 3 (1.7%) |
| Total | 185 (100.0%) | 181 (100.0%) |
Physical Housing Characteristics in Tivoli
Housing Structures in Tivoli
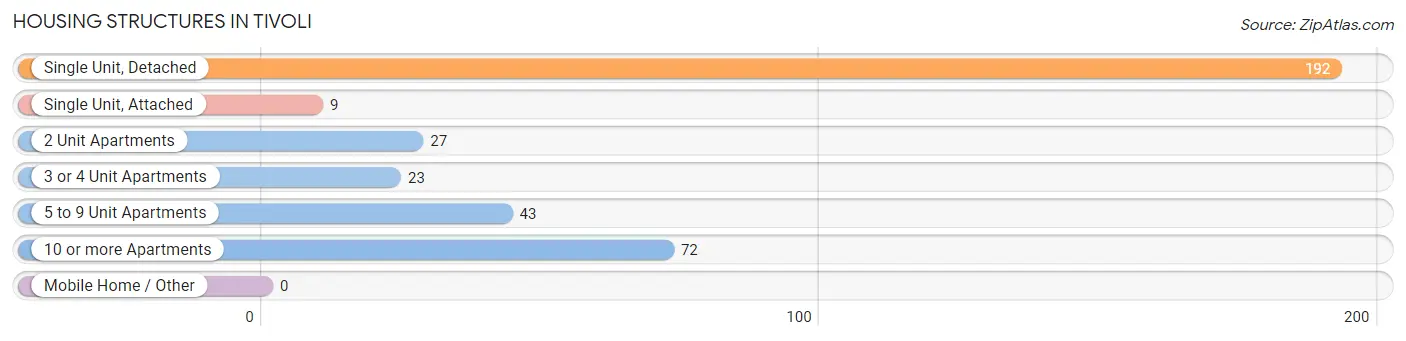
| Structure Type | # Housing Units | % Housing Units |
| Single Unit, Detached | 192 | 52.5% |
| Single Unit, Attached | 9 | 2.5% |
| 2 Unit Apartments | 27 | 7.4% |
| 3 or 4 Unit Apartments | 23 | 6.3% |
| 5 to 9 Unit Apartments | 43 | 11.7% |
| 10 or more Apartments | 72 | 19.7% |
| Mobile Home / Other | 0 | 0.0% |
| Total | 366 | 100.0% |
Housing Structures by Occupancy in Tivoli
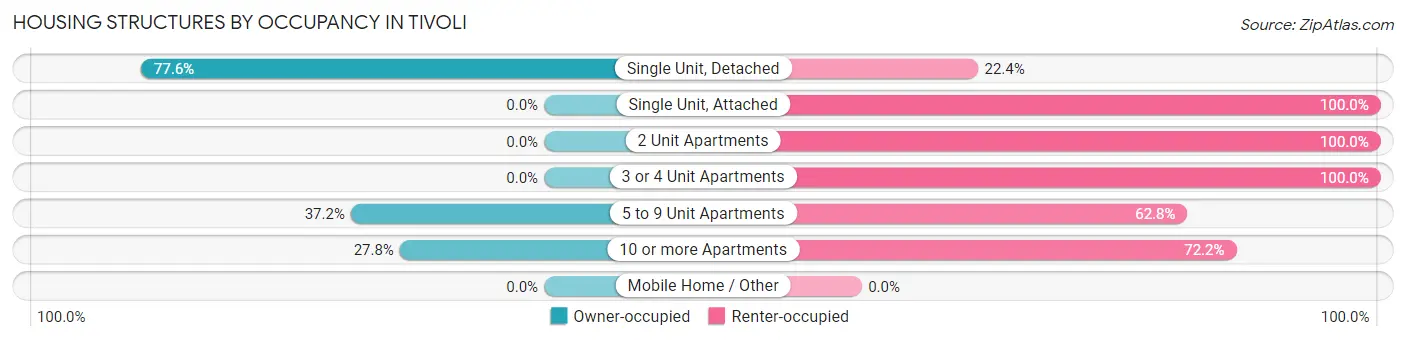
| Structure Type | Owner-occupied | Renter-occupied |
| Single Unit, Detached | 149 (77.6%) | 43 (22.4%) |
| Single Unit, Attached | 0 (0.0%) | 9 (100.0%) |
| 2 Unit Apartments | 0 (0.0%) | 27 (100.0%) |
| 3 or 4 Unit Apartments | 0 (0.0%) | 23 (100.0%) |
| 5 to 9 Unit Apartments | 16 (37.2%) | 27 (62.8%) |
| 10 or more Apartments | 20 (27.8%) | 52 (72.2%) |
| Mobile Home / Other | 0 (0.0%) | 0 (0.0%) |
| Total | 185 (50.5%) | 181 (49.4%) |
Housing Structures by Number of Rooms in Tivoli
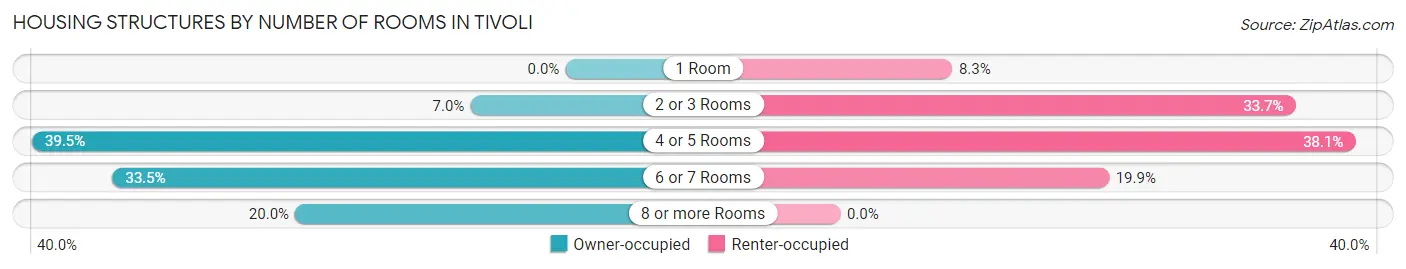
| Number of Rooms | Owner-occupied | Renter-occupied |
| 1 Room | 0 (0.0%) | 15 (8.3%) |
| 2 or 3 Rooms | 13 (7.0%) | 61 (33.7%) |
| 4 or 5 Rooms | 73 (39.5%) | 69 (38.1%) |
| 6 or 7 Rooms | 62 (33.5%) | 36 (19.9%) |
| 8 or more Rooms | 37 (20.0%) | 0 (0.0%) |
| Total | 185 (100.0%) | 181 (100.0%) |
Housing Structure by Heating Type in Tivoli
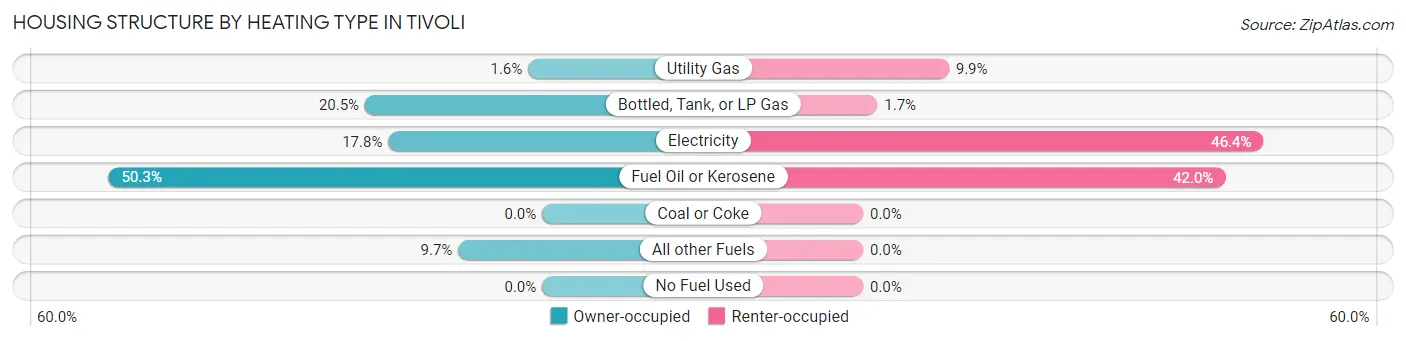
| Heating Type | Owner-occupied | Renter-occupied |
| Utility Gas | 3 (1.6%) | 18 (9.9%) |
| Bottled, Tank, or LP Gas | 38 (20.5%) | 3 (1.7%) |
| Electricity | 33 (17.8%) | 84 (46.4%) |
| Fuel Oil or Kerosene | 93 (50.3%) | 76 (42.0%) |
| Coal or Coke | 0 (0.0%) | 0 (0.0%) |
| All other Fuels | 18 (9.7%) | 0 (0.0%) |
| No Fuel Used | 0 (0.0%) | 0 (0.0%) |
| Total | 185 (100.0%) | 181 (100.0%) |
Household Vehicle Usage in Tivoli
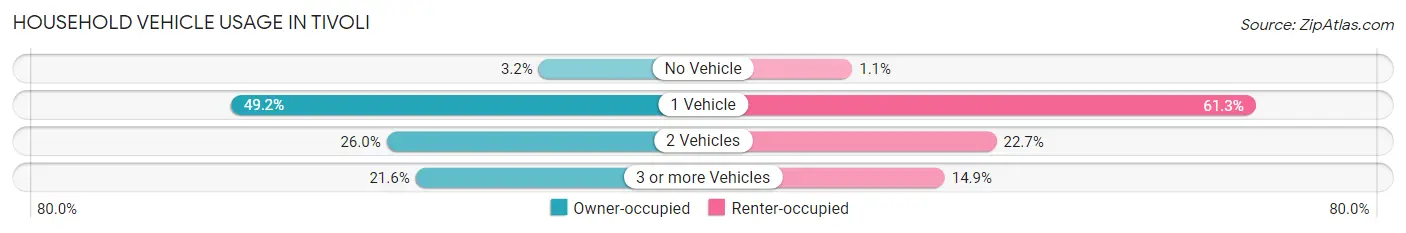
| Vehicles per Household | Owner-occupied | Renter-occupied |
| No Vehicle | 6 (3.2%) | 2 (1.1%) |
| 1 Vehicle | 91 (49.2%) | 111 (61.3%) |
| 2 Vehicles | 48 (26.0%) | 41 (22.7%) |
| 3 or more Vehicles | 40 (21.6%) | 27 (14.9%) |
| Total | 185 (100.0%) | 181 (100.0%) |
Real Estate & Mortgages in Tivoli
Real Estate and Mortgage Overview in Tivoli
| Characteristic | Without Mortgage | With Mortgage |
| Housing Units | 84 | 101 |
| Median Property Value | $320,000 | $366,100 |
| Median Household Income | $81,667 | $28 |
| Monthly Housing Costs | $920 | $17 |
| Real Estate Taxes | $6,319 | $0 |
Property Value by Mortgage Status in Tivoli
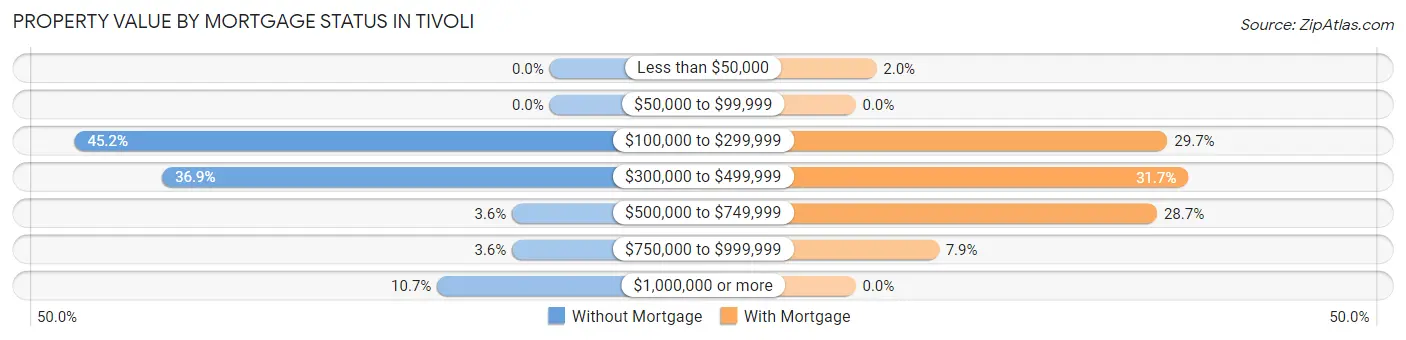
| Property Value | Without Mortgage | With Mortgage |
| Less than $50,000 | 0 (0.0%) | 2 (2.0%) |
| $50,000 to $99,999 | 0 (0.0%) | 0 (0.0%) |
| $100,000 to $299,999 | 38 (45.2%) | 30 (29.7%) |
| $300,000 to $499,999 | 31 (36.9%) | 32 (31.7%) |
| $500,000 to $749,999 | 3 (3.6%) | 29 (28.7%) |
| $750,000 to $999,999 | 3 (3.6%) | 8 (7.9%) |
| $1,000,000 or more | 9 (10.7%) | 0 (0.0%) |
| Total | 84 (100.0%) | 101 (100.0%) |
Household Income by Mortgage Status in Tivoli
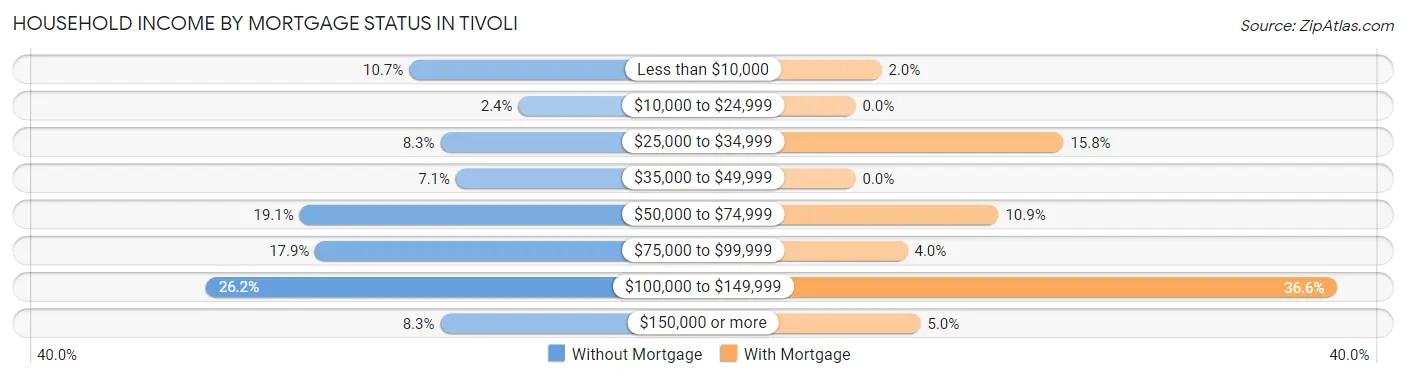
| Household Income | Without Mortgage | With Mortgage |
| Less than $10,000 | 9 (10.7%) | 2 (2.0%) |
| $10,000 to $24,999 | 2 (2.4%) | 0 (0.0%) |
| $25,000 to $34,999 | 7 (8.3%) | 16 (15.8%) |
| $35,000 to $49,999 | 6 (7.1%) | 0 (0.0%) |
| $50,000 to $74,999 | 16 (19.1%) | 11 (10.9%) |
| $75,000 to $99,999 | 15 (17.9%) | 4 (4.0%) |
| $100,000 to $149,999 | 22 (26.2%) | 37 (36.6%) |
| $150,000 or more | 7 (8.3%) | 5 (5.0%) |
| Total | 84 (100.0%) | 101 (100.0%) |
Property Value to Household Income Ratio in Tivoli
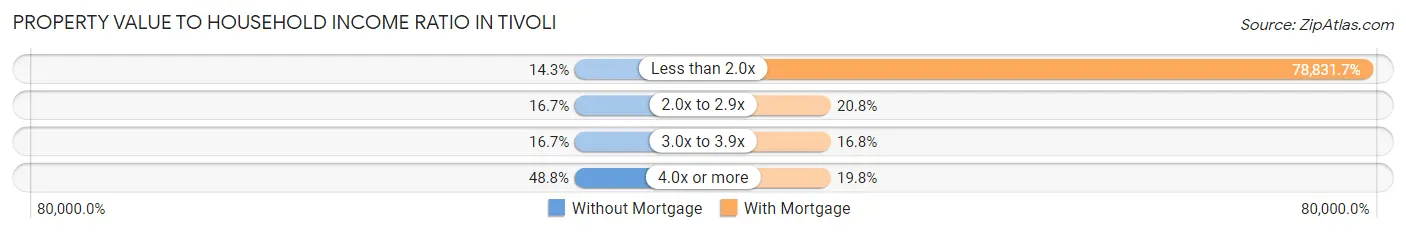
| Value-to-Income Ratio | Without Mortgage | With Mortgage |
| Less than 2.0x | 12 (14.3%) | 79,620 (78,831.7%) |
| 2.0x to 2.9x | 14 (16.7%) | 21 (20.8%) |
| 3.0x to 3.9x | 14 (16.7%) | 17 (16.8%) |
| 4.0x or more | 41 (48.8%) | 20 (19.8%) |
| Total | 84 (100.0%) | 101 (100.0%) |
Real Estate Taxes by Mortgage Status in Tivoli
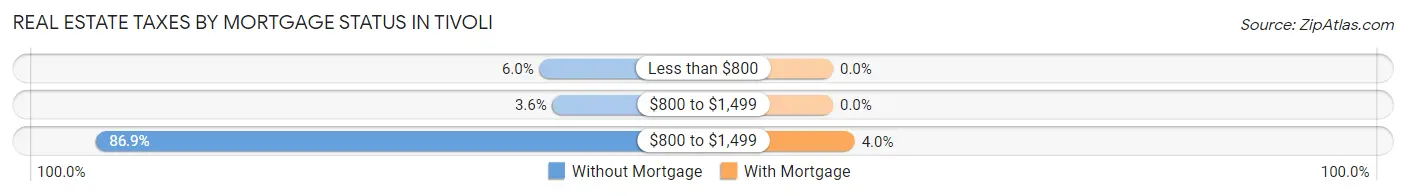
| Property Taxes | Without Mortgage | With Mortgage |
| Less than $800 | 5 (5.9%) | 0 (0.0%) |
| $800 to $1,499 | 3 (3.6%) | 0 (0.0%) |
| $800 to $1,499 | 73 (86.9%) | 4 (4.0%) |
| Total | 84 (100.0%) | 101 (100.0%) |
Health & Disability in Tivoli
Health Insurance Coverage by Age in Tivoli
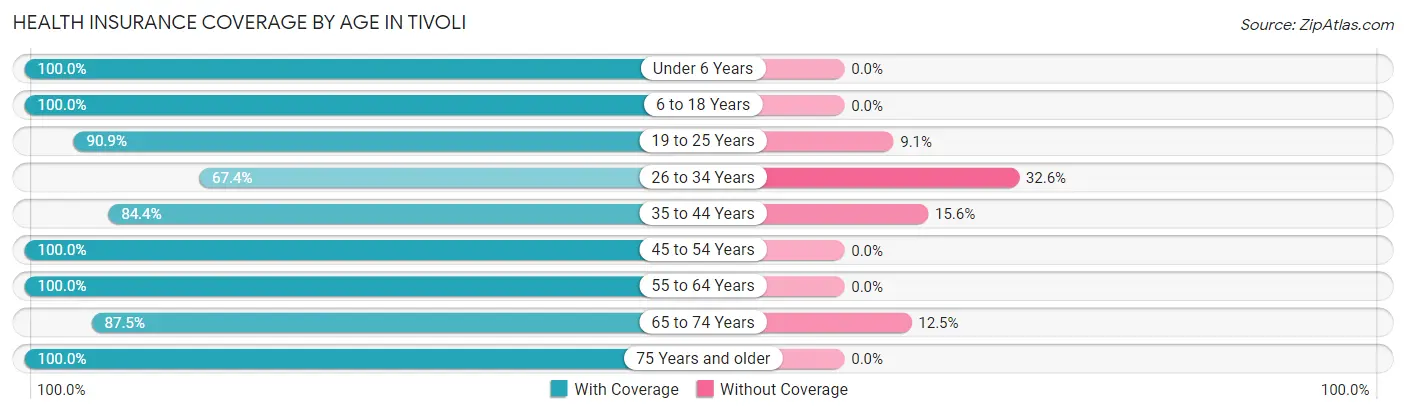
| Age Bracket | With Coverage | Without Coverage |
| Under 6 Years | 19 (100.0%) | 0 (0.0%) |
| 6 to 18 Years | 159 (100.0%) | 0 (0.0%) |
| 19 to 25 Years | 169 (90.9%) | 17 (9.1%) |
| 26 to 34 Years | 29 (67.4%) | 14 (32.6%) |
| 35 to 44 Years | 54 (84.4%) | 10 (15.6%) |
| 45 to 54 Years | 111 (100.0%) | 0 (0.0%) |
| 55 to 64 Years | 49 (100.0%) | 0 (0.0%) |
| 65 to 74 Years | 105 (87.5%) | 15 (12.5%) |
| 75 Years and older | 51 (100.0%) | 0 (0.0%) |
| Total | 746 (93.0%) | 56 (7.0%) |
Health Insurance Coverage by Citizenship Status in Tivoli
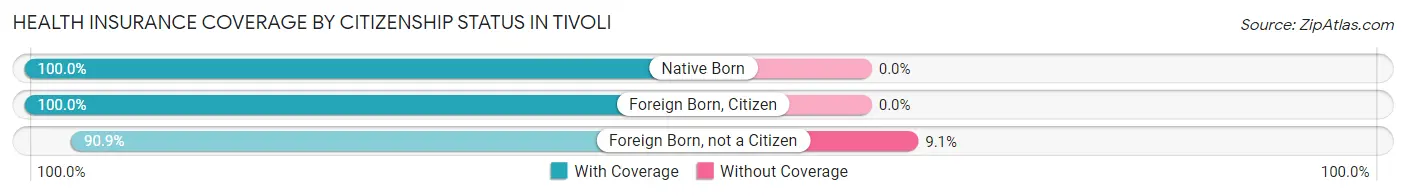
| Citizenship Status | With Coverage | Without Coverage |
| Native Born | 19 (100.0%) | 0 (0.0%) |
| Foreign Born, Citizen | 159 (100.0%) | 0 (0.0%) |
| Foreign Born, not a Citizen | 169 (90.9%) | 17 (9.1%) |
Health Insurance Coverage by Household Income in Tivoli
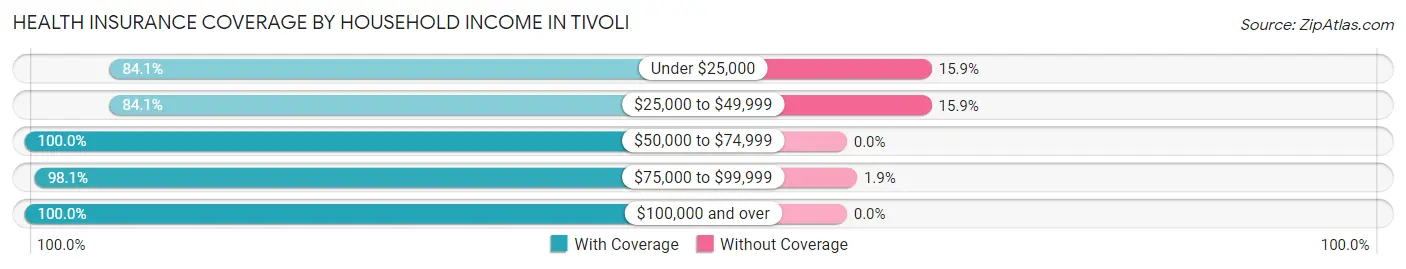
| Household Income | With Coverage | Without Coverage |
| Under $25,000 | 190 (84.1%) | 36 (15.9%) |
| $25,000 to $49,999 | 90 (84.1%) | 17 (15.9%) |
| $50,000 to $74,999 | 41 (100.0%) | 0 (0.0%) |
| $75,000 to $99,999 | 155 (98.1%) | 3 (1.9%) |
| $100,000 and over | 265 (100.0%) | 0 (0.0%) |
Public vs Private Health Insurance Coverage by Age in Tivoli
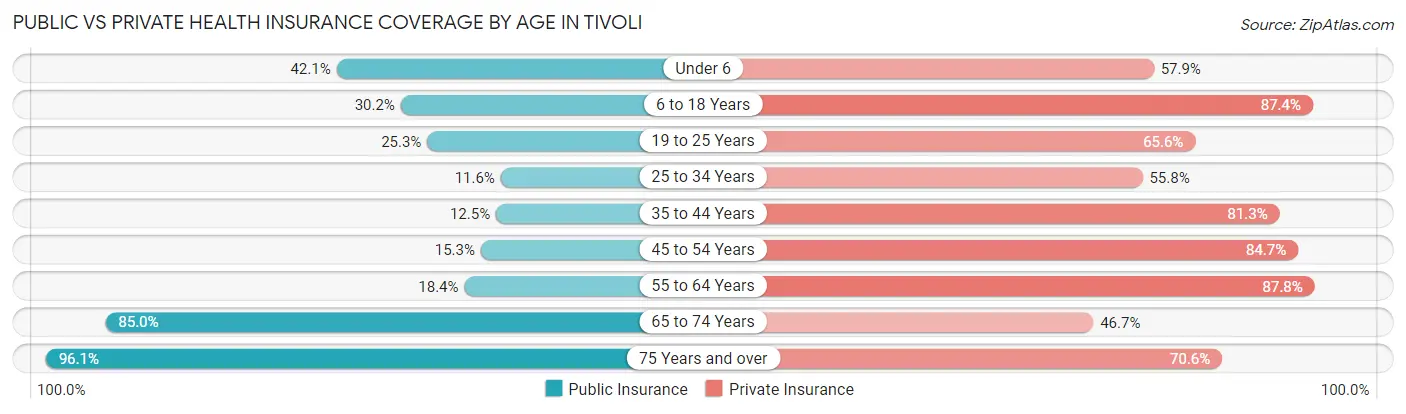
| Age Bracket | Public Insurance | Private Insurance |
| Under 6 | 8 (42.1%) | 11 (57.9%) |
| 6 to 18 Years | 48 (30.2%) | 139 (87.4%) |
| 19 to 25 Years | 47 (25.3%) | 122 (65.6%) |
| 25 to 34 Years | 5 (11.6%) | 24 (55.8%) |
| 35 to 44 Years | 8 (12.5%) | 52 (81.2%) |
| 45 to 54 Years | 17 (15.3%) | 94 (84.7%) |
| 55 to 64 Years | 9 (18.4%) | 43 (87.8%) |
| 65 to 74 Years | 102 (85.0%) | 56 (46.7%) |
| 75 Years and over | 49 (96.1%) | 36 (70.6%) |
| Total | 293 (36.5%) | 577 (72.0%) |
Disability Status by Sex by Age in Tivoli
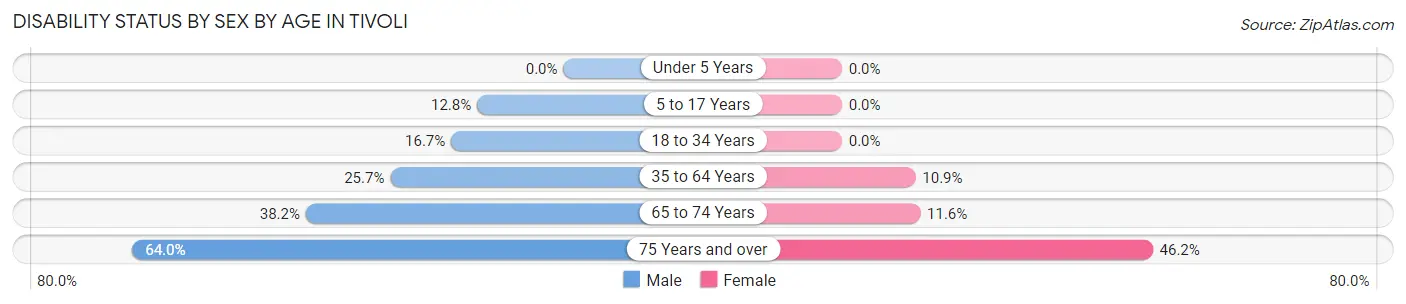
| Age Bracket | Male | Female |
| Under 5 Years | 0 (0.0%) | 0 (0.0%) |
| 5 to 17 Years | 10 (12.8%) | 0 (0.0%) |
| 18 to 34 Years | 6 (16.7%) | 0 (0.0%) |
| 35 to 64 Years | 27 (25.7%) | 13 (10.9%) |
| 65 to 74 Years | 13 (38.2%) | 10 (11.6%) |
| 75 Years and over | 16 (64.0%) | 12 (46.2%) |
Disability Class by Sex by Age in Tivoli
Disability Class: Hearing Difficulty
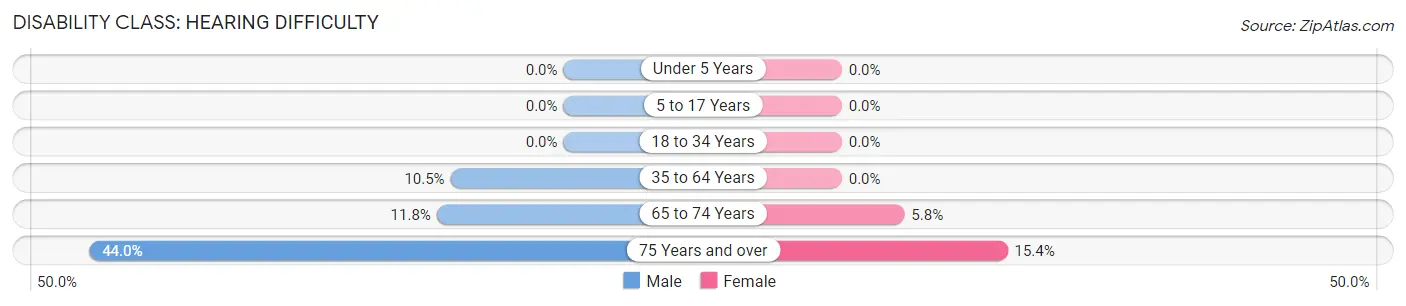
| Age Bracket | Male | Female |
| Under 5 Years | 0 (0.0%) | 0 (0.0%) |
| 5 to 17 Years | 0 (0.0%) | 0 (0.0%) |
| 18 to 34 Years | 0 (0.0%) | 0 (0.0%) |
| 35 to 64 Years | 11 (10.5%) | 0 (0.0%) |
| 65 to 74 Years | 4 (11.8%) | 5 (5.8%) |
| 75 Years and over | 11 (44.0%) | 4 (15.4%) |
Disability Class: Vision Difficulty
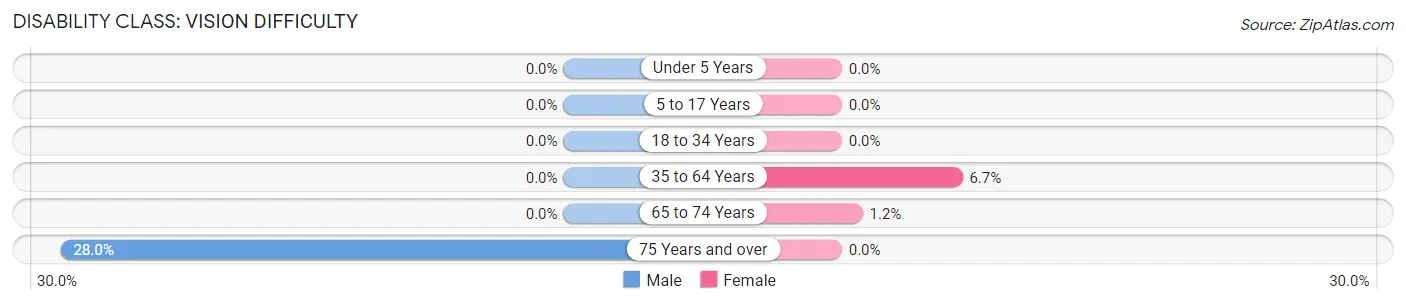
| Age Bracket | Male | Female |
| Under 5 Years | 0 (0.0%) | 0 (0.0%) |
| 5 to 17 Years | 0 (0.0%) | 0 (0.0%) |
| 18 to 34 Years | 0 (0.0%) | 0 (0.0%) |
| 35 to 64 Years | 0 (0.0%) | 8 (6.7%) |
| 65 to 74 Years | 0 (0.0%) | 1 (1.2%) |
| 75 Years and over | 7 (28.0%) | 0 (0.0%) |
Disability Class: Cognitive Difficulty
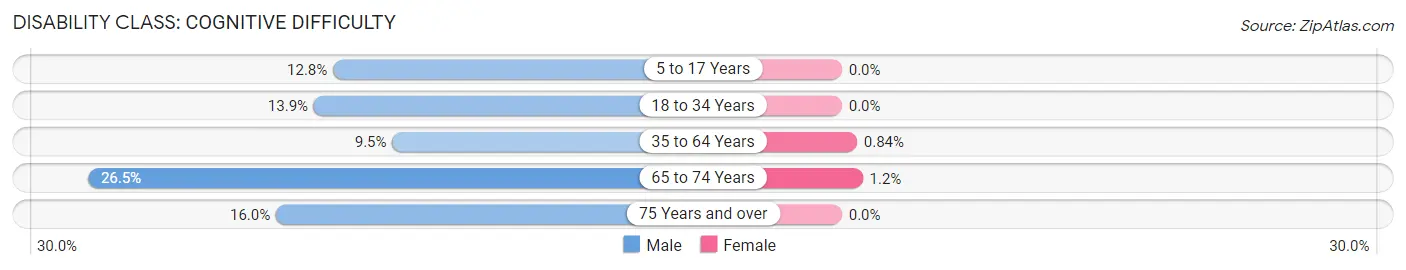
| Age Bracket | Male | Female |
| 5 to 17 Years | 10 (12.8%) | 0 (0.0%) |
| 18 to 34 Years | 5 (13.9%) | 0 (0.0%) |
| 35 to 64 Years | 10 (9.5%) | 1 (0.8%) |
| 65 to 74 Years | 9 (26.5%) | 1 (1.2%) |
| 75 Years and over | 4 (16.0%) | 0 (0.0%) |
Disability Class: Ambulatory Difficulty
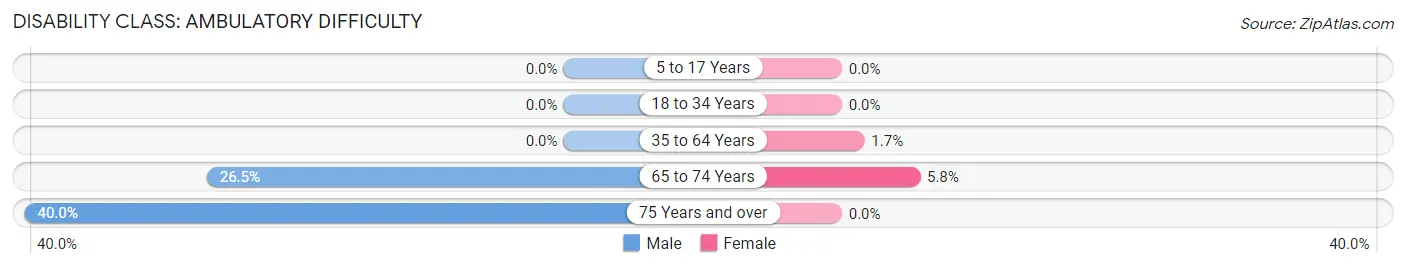
| Age Bracket | Male | Female |
| 5 to 17 Years | 0 (0.0%) | 0 (0.0%) |
| 18 to 34 Years | 0 (0.0%) | 0 (0.0%) |
| 35 to 64 Years | 0 (0.0%) | 2 (1.7%) |
| 65 to 74 Years | 9 (26.5%) | 5 (5.8%) |
| 75 Years and over | 10 (40.0%) | 0 (0.0%) |
Disability Class: Self-Care Difficulty
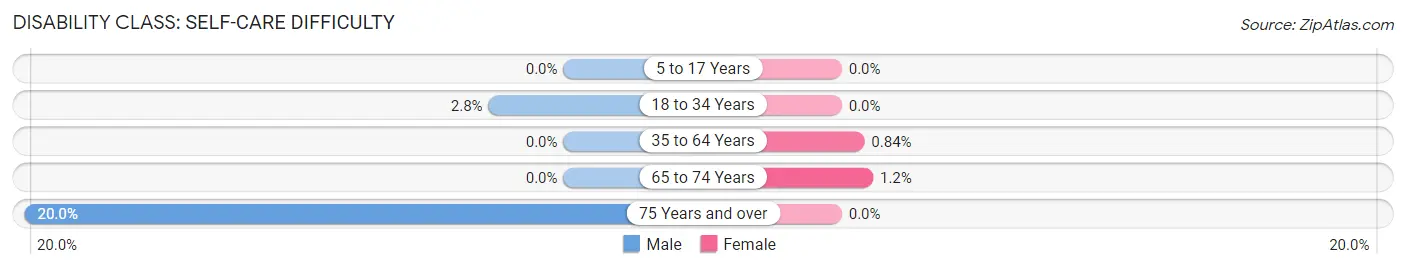
| Age Bracket | Male | Female |
| 5 to 17 Years | 0 (0.0%) | 0 (0.0%) |
| 18 to 34 Years | 1 (2.8%) | 0 (0.0%) |
| 35 to 64 Years | 0 (0.0%) | 1 (0.8%) |
| 65 to 74 Years | 0 (0.0%) | 1 (1.2%) |
| 75 Years and over | 5 (20.0%) | 0 (0.0%) |
Technology Access in Tivoli
Computing Device Access in Tivoli
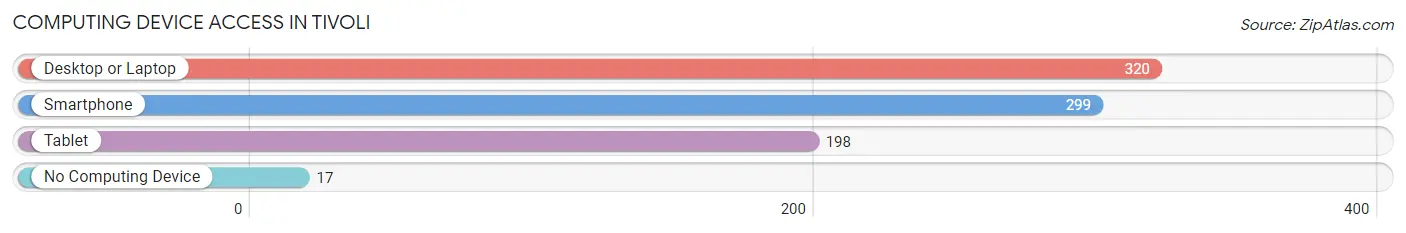
| Device Type | # Households | % Households |
| Desktop or Laptop | 320 | 87.4% |
| Smartphone | 299 | 81.7% |
| Tablet | 198 | 54.1% |
| No Computing Device | 17 | 4.6% |
| Total | 366 | 100.0% |
Internet Access in Tivoli
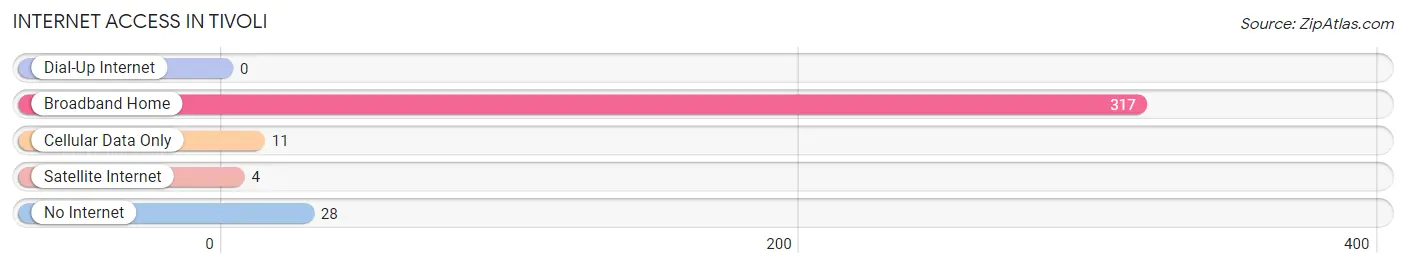
| Internet Type | # Households | % Households |
| Dial-Up Internet | 0 | 0.0% |
| Broadband Home | 317 | 86.6% |
| Cellular Data Only | 11 | 3.0% |
| Satellite Internet | 4 | 1.1% |
| No Internet | 28 | 7.6% |
| Total | 366 | 100.0% |
Tivoli Summary
Tivoli is a small village located in Dutchess County, New York, United States. It is situated on the east bank of the Hudson River, about 60 miles north of New York City. The village is part of the Town of Red Hook and is bordered by the towns of Rhinebeck and Red Hook. As of the 2010 census, the village had a population of 1,118.
History
The area that is now Tivoli was originally inhabited by the Wappinger Indians. The first European settlers arrived in the area in the late 17th century. The village was originally known as “Tivoli Landing” and was a major port for the Hudson River steamboats. In 1872, the village was incorporated as the Village of Tivoli.
Geography
Tivoli is located at 41°45'25" North, 73°55'45" West (41.7569, -73.9293). According to the United States Census Bureau, the village has a total area of 0.6 square miles, all of it land.
Economy
The economy of Tivoli is largely based on tourism. The village is home to several historic sites, including the Tivoli Bays Wildlife Management Area, the Tivoli Shingle Mill, and the Tivoli Free Library. The village is also home to several restaurants, shops, and galleries.
Demographics
As of the 2010 census, there were 1,118 people, 463 households, and 279 families residing in the village. The population density was 1,845.3 people per square mile. The racial makeup of the village was 94.2% White, 1.7% African American, 0.2% Native American, 0.9% Asian, 0.1% Pacific Islander, 1.2% from other races, and 1.7% from two or more races. Hispanic or Latino of any race were 4.2% of the population.
The median income for a household in the village was $50,000, and the median income for a family was $60,000. About 8.2% of families and 11.2% of the population were below the poverty line, including 16.2% of those under age 18 and 4.2% of those age 65 or over.
Common Questions
What is the Total Population of Tivoli?
Total Population of Tivoli is 802.
What is the Total Male Population of Tivoli?
Total Male Population of Tivoli is 291.
What is the Total Female Population of Tivoli?
Total Female Population of Tivoli is 511.
What is the Ratio of Males per 100 Females in Tivoli?
There are 56.95 Males per 100 Females in Tivoli.
What is the Ratio of Females per 100 Males in Tivoli?
There are 175.60 Females per 100 Males in Tivoli.
What is the Median Population Age in Tivoli?
Median Population Age in Tivoli is 34.5 Years.
What is the Average Family Size in Tivoli
Average Family Size in Tivoli is 3.2 People.
What is the Average Household Size in Tivoli
Average Household Size in Tivoli is 2.2 People.
What is Per Capita Income in Tivoli?
Per Capita income in Tivoli is $35,134.
What is the Median Family Income in Tivoli?
Median Family Income in Tivoli is $98,194.
What is the Median Household income in Tivoli?
Median Household Income in Tivoli is $44,583.
What is Income or Wage Gap in Tivoli?
Income or Wage Gap in Tivoli is 77.1%.
Women in Tivoli earn 22.9 cents for every dollar earned by a man.
What is Inequality or Gini Index in Tivoli?
Inequality or Gini Index in Tivoli is 0.54.
How Large is the Labor Force in Tivoli?
There are 421 People in the Labor Forcein in Tivoli.
What is the Percentage of People in the Labor Force in Tivoli?
63.4% of People are in the Labor Force in Tivoli.
What is the Unemployment Rate in Tivoli?
Unemployment Rate in Tivoli is 10.9%.