Salt Point, NY
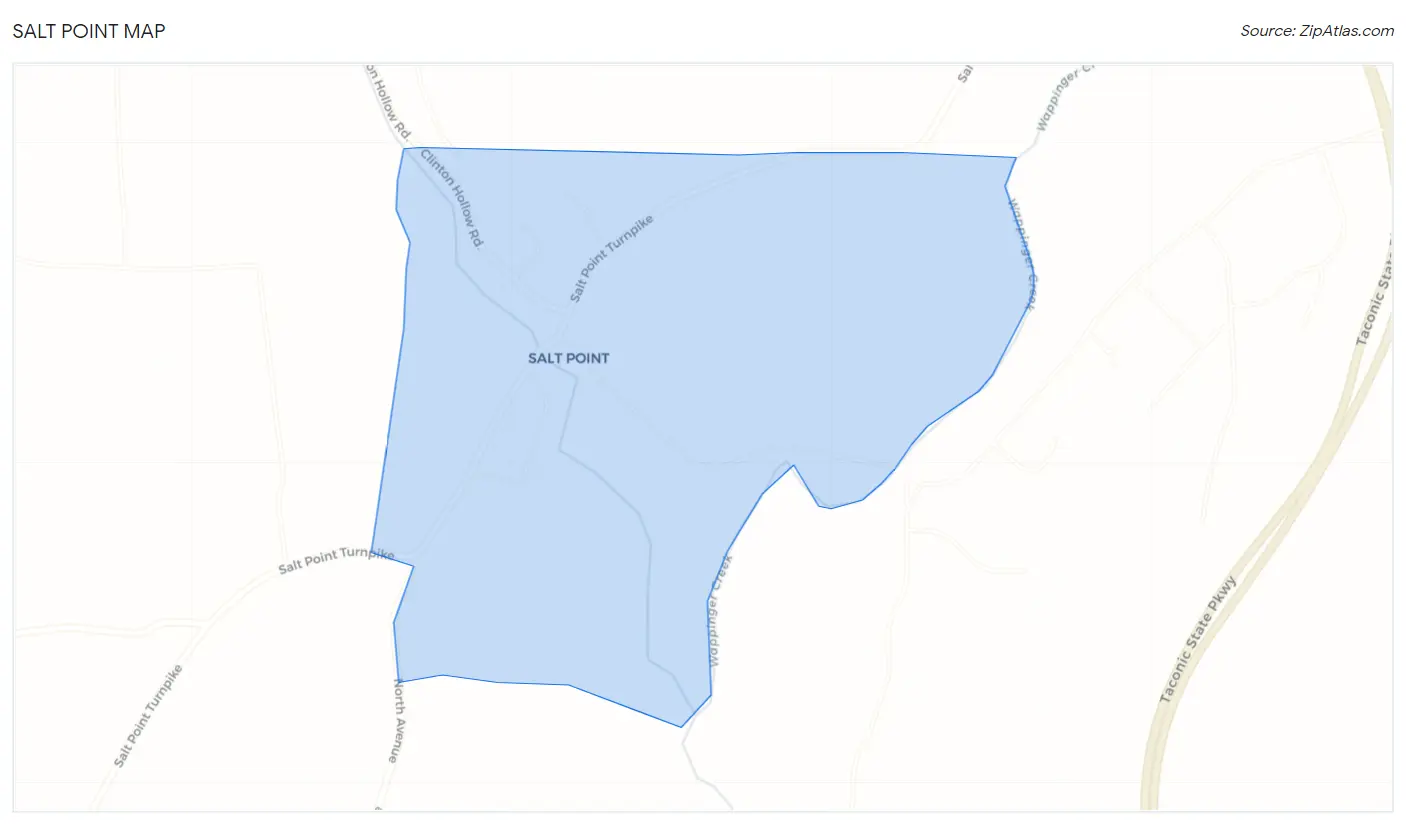
Salt Point Map
Salt Point Overview
306
TOTAL POPULATION
155
MALE POPULATION
151
FEMALE POPULATION
102.65
MALES / 100 FEMALES
97.42
FEMALES / 100 MALES
35.4
MEDIAN AGE
2.8
AVG FAMILY SIZE
3.4
AVG HOUSEHOLD SIZE
$34,333
PER CAPITA INCOME
$96,932
AVG FAMILY INCOME
$103,438
AVG HOUSEHOLD INCOME
12.3%
WAGE / INCOME GAP [ % ]
87.7¢/ $1
WAGE / INCOME GAP [ $ ]
0.22
INEQUALITY / GINI INDEX
222
LABOR FORCE [ PEOPLE ]
73.8%
PERCENT IN LABOR FORCE
9.5%
UNEMPLOYMENT RATE
Salt Point Zip Codes
Salt Point Area Codes
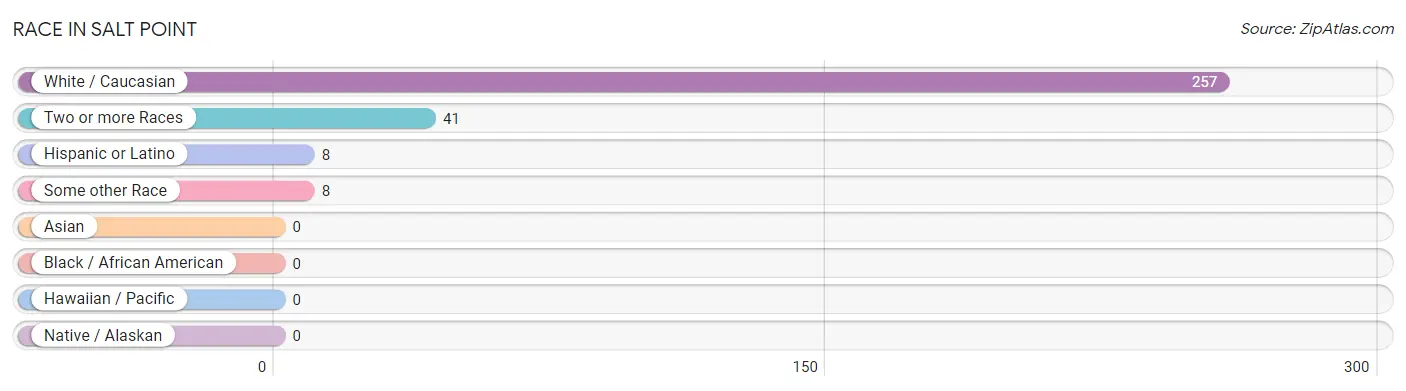
Race in Salt Point
The most populous races in Salt Point are White / Caucasian (257 | 84.0%), Two or more Races (41 | 13.4%), and Hispanic or Latino (8 | 2.6%).
| Race | # Population | % Population |
| Asian | 0 | 0.0% |
| Black / African American | 0 | 0.0% |
| Hawaiian / Pacific | 0 | 0.0% |
| Hispanic or Latino | 8 | 2.6% |
| Native / Alaskan | 0 | 0.0% |
| White / Caucasian | 257 | 84.0% |
| Two or more Races | 41 | 13.4% |
| Some other Race | 8 | 2.6% |
| Total | 306 | 100.0% |
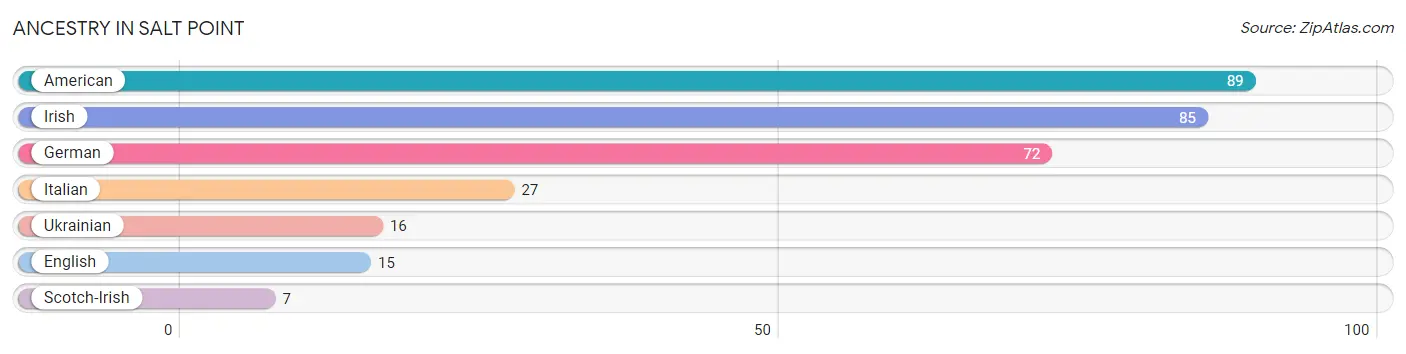
Ancestry in Salt Point
The most populous ancestries reported in Salt Point are American (89 | 29.1%), Irish (85 | 27.8%), German (72 | 23.5%), Italian (27 | 8.8%), and Ukrainian (16 | 5.2%), together accounting for 94.4% of all Salt Point residents.
| Ancestry | # Population | % Population |
| American | 89 | 29.1% |
| English | 15 | 4.9% |
| German | 72 | 23.5% |
| Irish | 85 | 27.8% |
| Italian | 27 | 8.8% |
| Scotch-Irish | 7 | 2.3% |
| Ukrainian | 16 | 5.2% | View All 7 Rows |
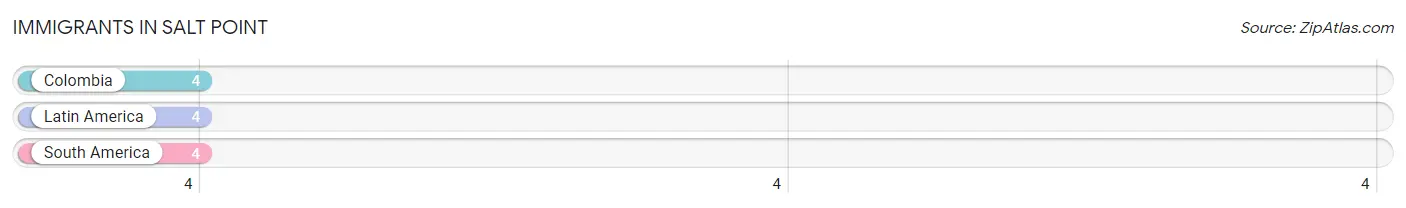
Immigrants in Salt Point
The most numerous immigrant groups reported in Salt Point came from Colombia (4 | 1.3%), Latin America (4 | 1.3%), and South America (4 | 1.3%), together accounting for 3.9% of all Salt Point residents.
| Immigration Origin | # Population | % Population |
| Colombia | 4 | 1.3% |
| Latin America | 4 | 1.3% |
| South America | 4 | 1.3% | View All 3 Rows |
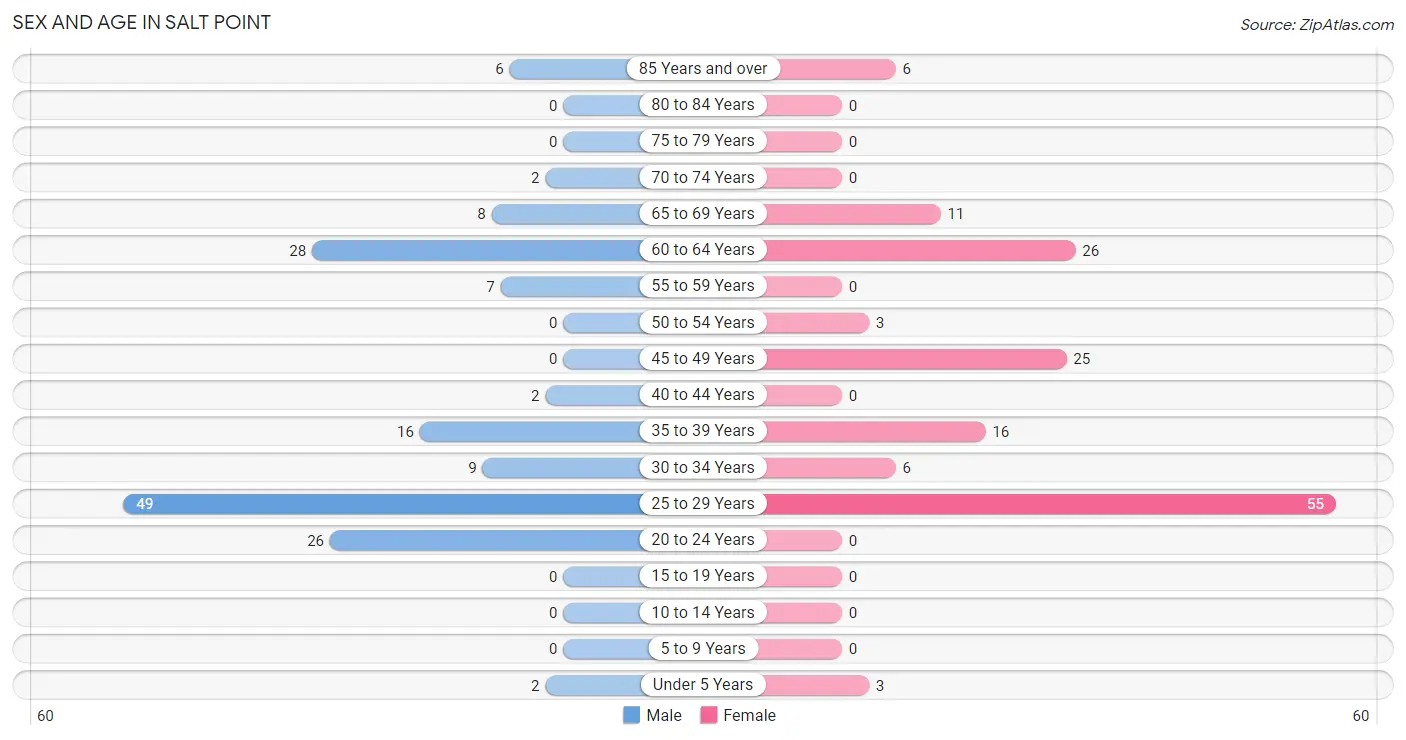
Sex and Age in Salt Point
Sex and Age in Salt Point
The most populous age groups in Salt Point are 25 to 29 Years (49 | 31.6%) for men and 25 to 29 Years (55 | 36.4%) for women.
| Age Bracket | Male | Female |
| Under 5 Years | 2 (1.3%) | 3 (2.0%) |
| 5 to 9 Years | 0 (0.0%) | 0 (0.0%) |
| 10 to 14 Years | 0 (0.0%) | 0 (0.0%) |
| 15 to 19 Years | 0 (0.0%) | 0 (0.0%) |
| 20 to 24 Years | 26 (16.8%) | 0 (0.0%) |
| 25 to 29 Years | 49 (31.6%) | 55 (36.4%) |
| 30 to 34 Years | 9 (5.8%) | 6 (4.0%) |
| 35 to 39 Years | 16 (10.3%) | 16 (10.6%) |
| 40 to 44 Years | 2 (1.3%) | 0 (0.0%) |
| 45 to 49 Years | 0 (0.0%) | 25 (16.6%) |
| 50 to 54 Years | 0 (0.0%) | 3 (2.0%) |
| 55 to 59 Years | 7 (4.5%) | 0 (0.0%) |
| 60 to 64 Years | 28 (18.1%) | 26 (17.2%) |
| 65 to 69 Years | 8 (5.2%) | 11 (7.3%) |
| 70 to 74 Years | 2 (1.3%) | 0 (0.0%) |
| 75 to 79 Years | 0 (0.0%) | 0 (0.0%) |
| 80 to 84 Years | 0 (0.0%) | 0 (0.0%) |
| 85 Years and over | 6 (3.9%) | 6 (4.0%) |
| Total | 155 (100.0%) | 151 (100.0%) |
Families and Households in Salt Point
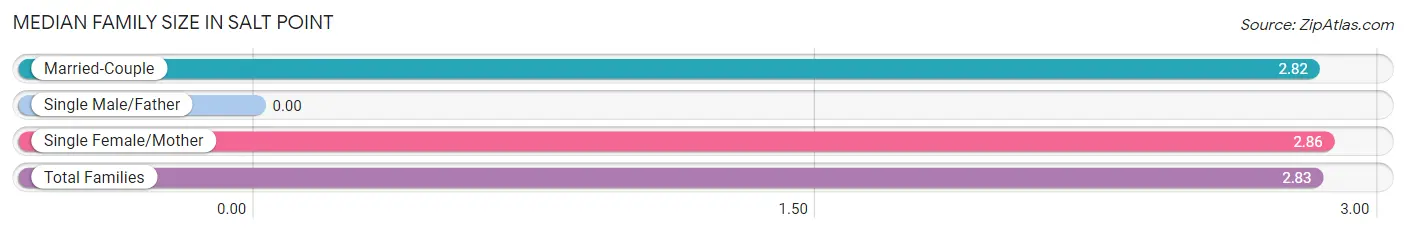
Median Family Size in Salt Point
| Family Type | # Families | Family Size |
| Married-Couple | 60 (68.2%) | 2.82 |
| Single Male/Father | 0 (0.0%) | - |
| Single Female/Mother | 28 (31.8%) | 2.86 |
| Total Families | 88 (100.0%) | 2.83 |
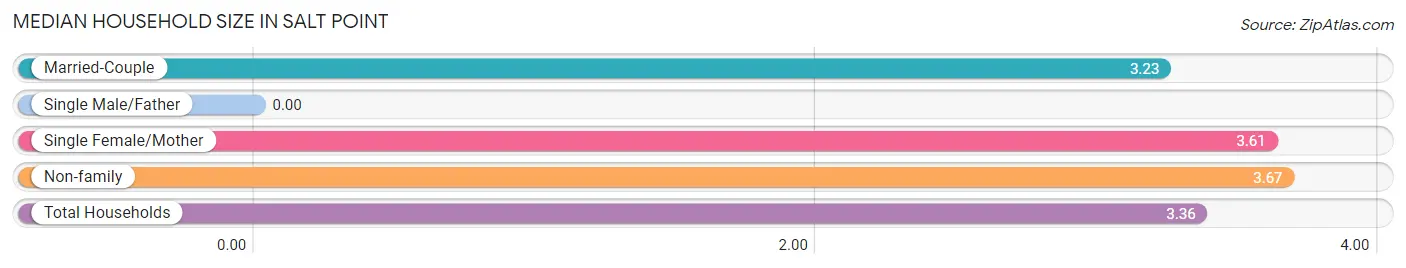
Median Household Size in Salt Point
| Household Type | # Households | Household Size |
| Married-Couple | 60 (65.9%) | 3.23 |
| Single Male/Father | 0 (0.0%) | - |
| Single Female/Mother | 28 (30.8%) | 3.61 |
| Non-family | 3 (3.3%) | 3.67 |
| Total Households | 91 (100.0%) | 3.36 |
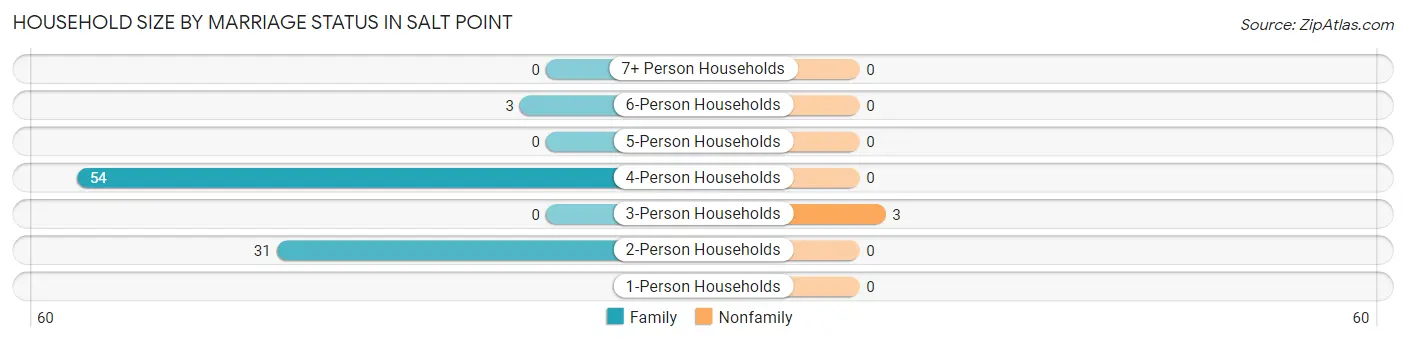
Household Size by Marriage Status in Salt Point
Out of a total of 91 households in Salt Point, 88 (96.7%) are family households, while 3 (3.3%) are nonfamily households. The most numerous type of family households are 4-person households, comprising 54, and the most common type of nonfamily households are 3-person households, comprising 3.
| Household Size | Family Households | Nonfamily Households |
| 1-Person Households | - | 0 (0.0%) |
| 2-Person Households | 31 (34.1%) | 0 (0.0%) |
| 3-Person Households | 0 (0.0%) | 3 (3.3%) |
| 4-Person Households | 54 (59.3%) | 0 (0.0%) |
| 5-Person Households | 0 (0.0%) | 0 (0.0%) |
| 6-Person Households | 3 (3.3%) | 0 (0.0%) |
| 7+ Person Households | 0 (0.0%) | 0 (0.0%) |
| Total | 88 (96.7%) | 3 (3.3%) |
Female Fertility in Salt Point
Fertility by Age in Salt Point
Average fertility rate in Salt Point is 39.0 births per 1,000 women. Women in the age bracket of 20 to 34 years have the highest fertility rate with 66.0 births per 1,000 women. Women in the age bracket of 20 to 34 years acount for 100.0% of all women with births.
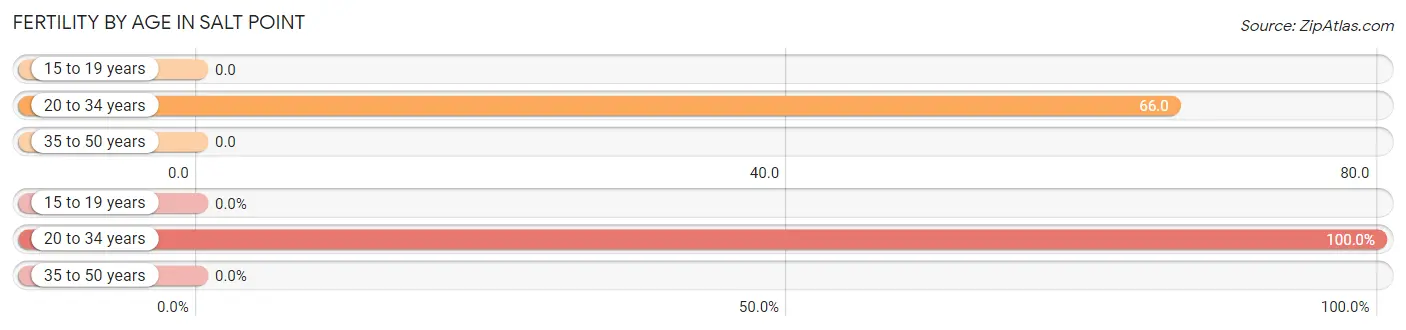
| Age Bracket | Women with Births | Births / 1,000 Women |
| 15 to 19 years | 0 (0.0%) | 0.0 |
| 20 to 34 years | 4 (100.0%) | 66.0 |
| 35 to 50 years | 0 (0.0%) | 0.0 |
| Total | 4 (100.0%) | 39.0 |
Fertility by Age by Marriage Status in Salt Point
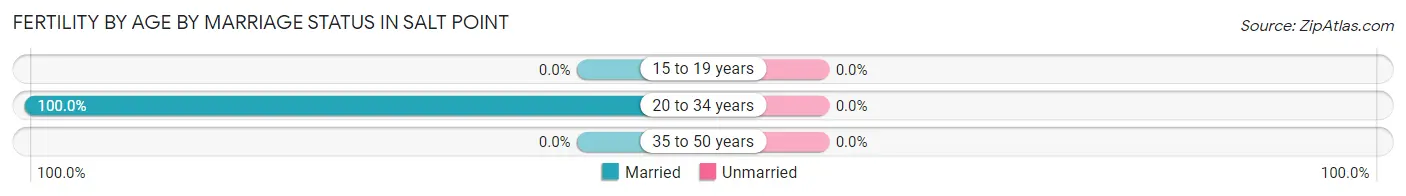
| Age Bracket | Married | Unmarried |
| 15 to 19 years | 0 (0.0%) | 0 (0.0%) |
| 20 to 34 years | 4 (100.0%) | 0 (0.0%) |
| 35 to 50 years | 0 (0.0%) | 0 (0.0%) |
| Total | 4 (100.0%) | 0 (0.0%) |
Fertility by Education in Salt Point
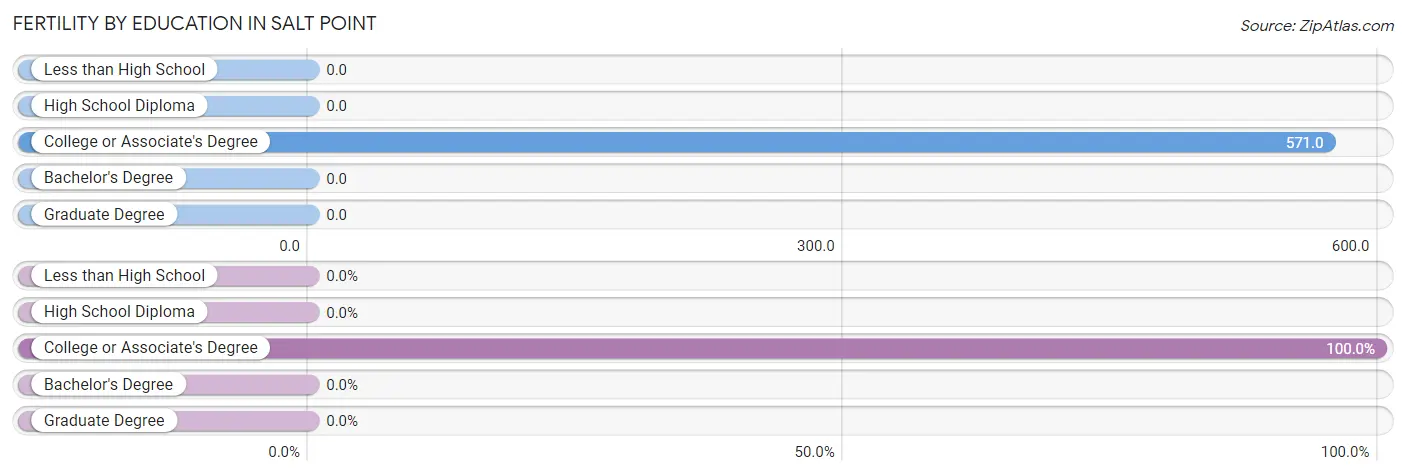
| Educational Attainment | Women with Births | Births / 1,000 Women |
| Less than High School | 0 (0.0%) | 0.0 |
| High School Diploma | 0 (0.0%) | 0.0 |
| College or Associate's Degree | 4 (100.0%) | 571.0 |
| Bachelor's Degree | 0 (0.0%) | 0.0 |
| Graduate Degree | 0 (0.0%) | 0.0 |
| Total | 4 (100.0%) | 39.0 |
Fertility by Education by Marriage Status in Salt Point
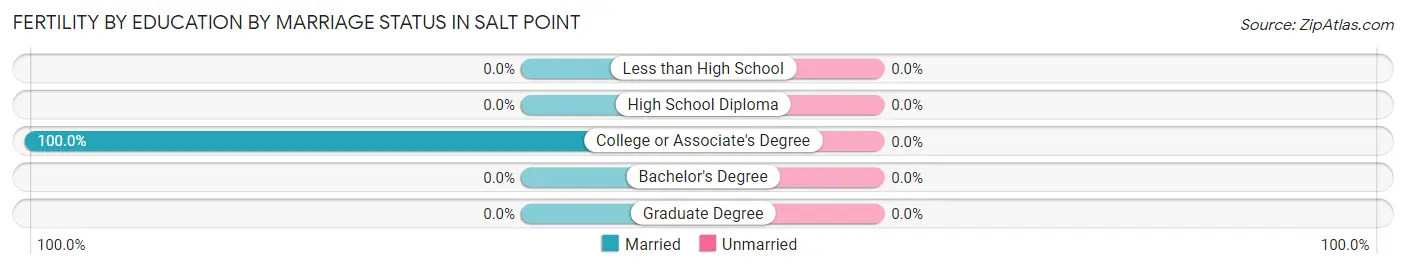
| Educational Attainment | Married | Unmarried |
| Less than High School | 0 (0.0%) | 0 (0.0%) |
| High School Diploma | 0 (0.0%) | 0 (0.0%) |
| College or Associate's Degree | 4 (100.0%) | 0 (0.0%) |
| Bachelor's Degree | 0 (0.0%) | 0 (0.0%) |
| Graduate Degree | 0 (0.0%) | 0 (0.0%) |
| Total | 4 (100.0%) | 0 (0.0%) |
Income in Salt Point
Income Overview in Salt Point
Per Capita Income in Salt Point is $34,333, while median incomes of families and households are $96,932 and $103,438 respectively.
| Characteristic | Number | Measure |
| Per Capita Income | 306 | $34,333 |
| Median Family Income | 88 | $96,932 |
| Mean Family Income | 88 | $97,411 |
| Median Household Income | 91 | $103,438 |
| Mean Household Income | 91 | $113,799 |
| Income Deficit | 88 | $0 |
| Wage / Income Gap (%) | 306 | 12.35% |
| Wage / Income Gap ($) | 306 | 87.65¢ per $1 |
| Gini / Inequality Index | 306 | 0.22 |
Earnings by Sex in Salt Point
Average Earnings in Salt Point are $41,992, $40,769 for men and $46,513 for women, a difference of 12.3%.
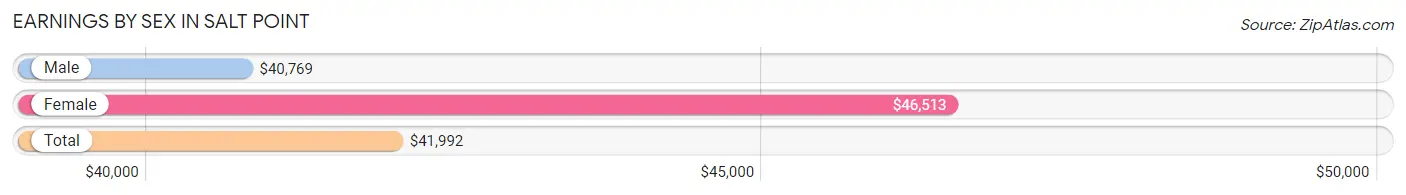
| Sex | Number | Average Earnings |
| Male | 104 (51.7%) | $40,769 |
| Female | 97 (48.3%) | $46,513 |
| Total | 201 (100.0%) | $41,992 |
Earnings by Sex by Income Bracket in Salt Point
The most common earnings brackets in Salt Point are $40,000 to $44,999 for men (26 | 25.0%) and $50,000 to $54,999 for women (22 | 22.7%).
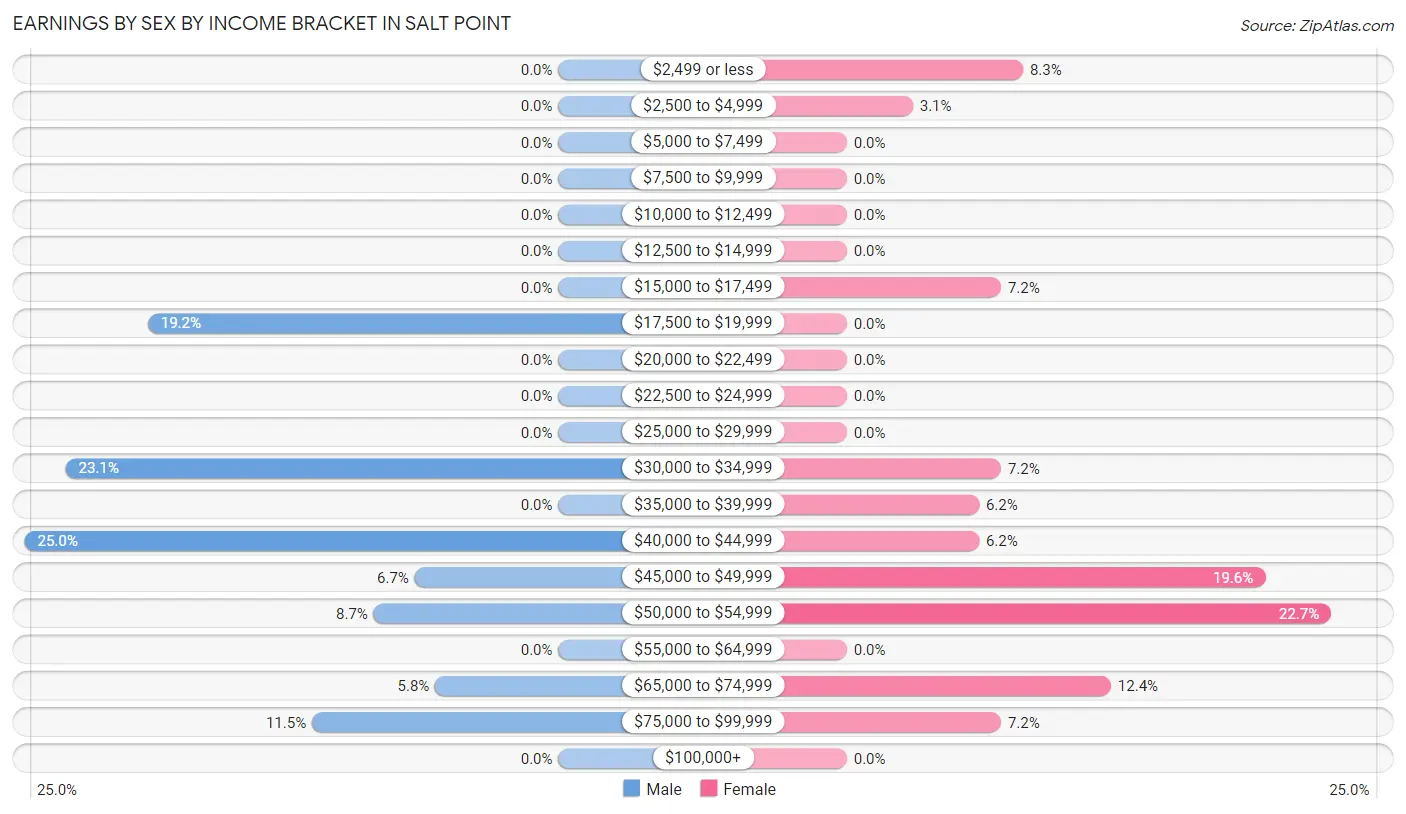
| Income | Male | Female |
| $2,499 or less | 0 (0.0%) | 8 (8.3%) |
| $2,500 to $4,999 | 0 (0.0%) | 3 (3.1%) |
| $5,000 to $7,499 | 0 (0.0%) | 0 (0.0%) |
| $7,500 to $9,999 | 0 (0.0%) | 0 (0.0%) |
| $10,000 to $12,499 | 0 (0.0%) | 0 (0.0%) |
| $12,500 to $14,999 | 0 (0.0%) | 0 (0.0%) |
| $15,000 to $17,499 | 0 (0.0%) | 7 (7.2%) |
| $17,500 to $19,999 | 20 (19.2%) | 0 (0.0%) |
| $20,000 to $22,499 | 0 (0.0%) | 0 (0.0%) |
| $22,500 to $24,999 | 0 (0.0%) | 0 (0.0%) |
| $25,000 to $29,999 | 0 (0.0%) | 0 (0.0%) |
| $30,000 to $34,999 | 24 (23.1%) | 7 (7.2%) |
| $35,000 to $39,999 | 0 (0.0%) | 6 (6.2%) |
| $40,000 to $44,999 | 26 (25.0%) | 6 (6.2%) |
| $45,000 to $49,999 | 7 (6.7%) | 19 (19.6%) |
| $50,000 to $54,999 | 9 (8.6%) | 22 (22.7%) |
| $55,000 to $64,999 | 0 (0.0%) | 0 (0.0%) |
| $65,000 to $74,999 | 6 (5.8%) | 12 (12.4%) |
| $75,000 to $99,999 | 12 (11.5%) | 7 (7.2%) |
| $100,000+ | 0 (0.0%) | 0 (0.0%) |
| Total | 104 (100.0%) | 97 (100.0%) |
Earnings by Sex by Educational Attainment in Salt Point
Average earnings in Salt Point are $31,979 for men and $46,513 for women, a difference of 31.2%. Men with an educational attainment of high school diploma enjoy the highest average annual earnings of $45,893, while those with high school diploma education earn the least with $45,893. Women with an educational attainment of bachelor's degree earn the most with the average annual earnings of $73,125, while those with high school diploma education have the smallest earnings of $50,000.
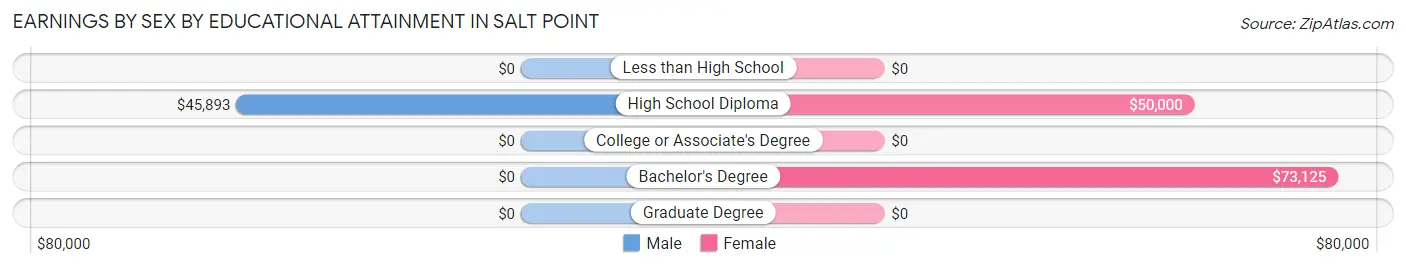
| Educational Attainment | Male Income | Female Income |
| Less than High School | - | - |
| High School Diploma | $45,893 | $50,000 |
| College or Associate's Degree | - | - |
| Bachelor's Degree | - | - |
| Graduate Degree | - | - |
| Total | $31,979 | $46,513 |
Family Income in Salt Point
Family Income Brackets in Salt Point
According to the Salt Point family income data, there are 32 families falling into the $100,000 to $149,999 income range, which is the most common income bracket and makes up 36.4% of all families.
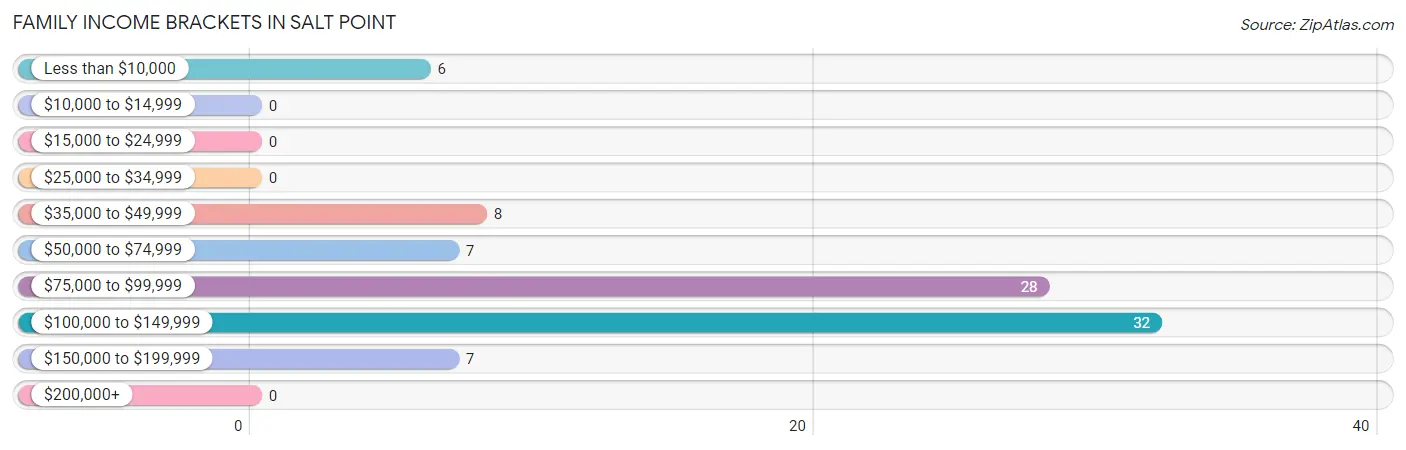
| Income Bracket | # Families | % Families |
| Less than $10,000 | 6 | 6.8% |
| $10,000 to $14,999 | 0 | 0.0% |
| $15,000 to $24,999 | 0 | 0.0% |
| $25,000 to $34,999 | 0 | 0.0% |
| $35,000 to $49,999 | 8 | 9.1% |
| $50,000 to $74,999 | 7 | 8.0% |
| $75,000 to $99,999 | 28 | 31.8% |
| $100,000 to $149,999 | 32 | 36.4% |
| $150,000 to $199,999 | 7 | 8.0% |
| $200,000+ | 0 | 0.0% |
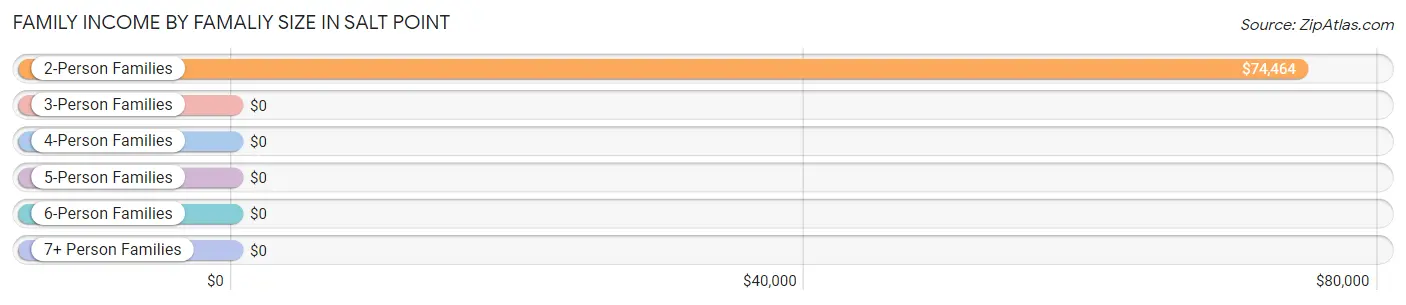
Family Income by Famaliy Size in Salt Point
2-person families (39 | 44.3%) account for the highest median family income in Salt Point with $74,464 per family, while 2-person families (39 | 44.3%) have the highest median income of $37,232 per family member.
| Income Bracket | # Families | Median Income |
| 2-Person Families | 39 (44.3%) | $74,464 |
| 3-Person Families | 25 (28.4%) | $0 |
| 4-Person Families | 24 (27.3%) | $0 |
| 5-Person Families | 0 (0.0%) | $0 |
| 6-Person Families | 0 (0.0%) | $0 |
| 7+ Person Families | 0 (0.0%) | $0 |
| Total | 88 (100.0%) | $96,932 |
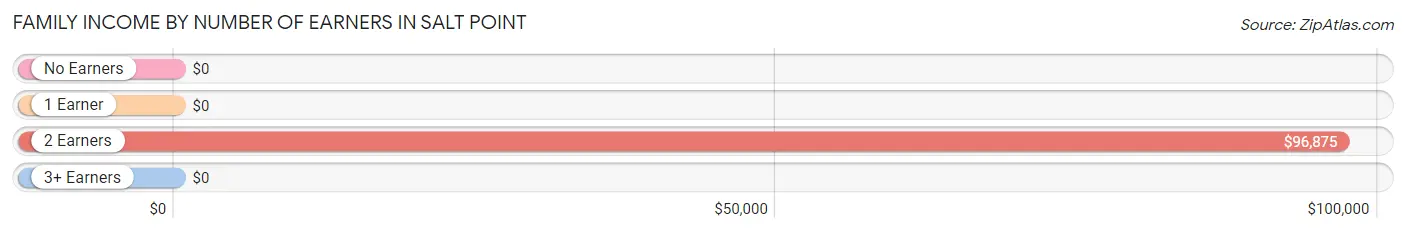
Family Income by Number of Earners in Salt Point
| Number of Earners | # Families | Median Income |
| No Earners | 6 (6.8%) | $0 |
| 1 Earner | 3 (3.4%) | $0 |
| 2 Earners | 75 (85.2%) | $96,875 |
| 3+ Earners | 4 (4.5%) | $0 |
| Total | 88 (100.0%) | $96,932 |
Household Income in Salt Point
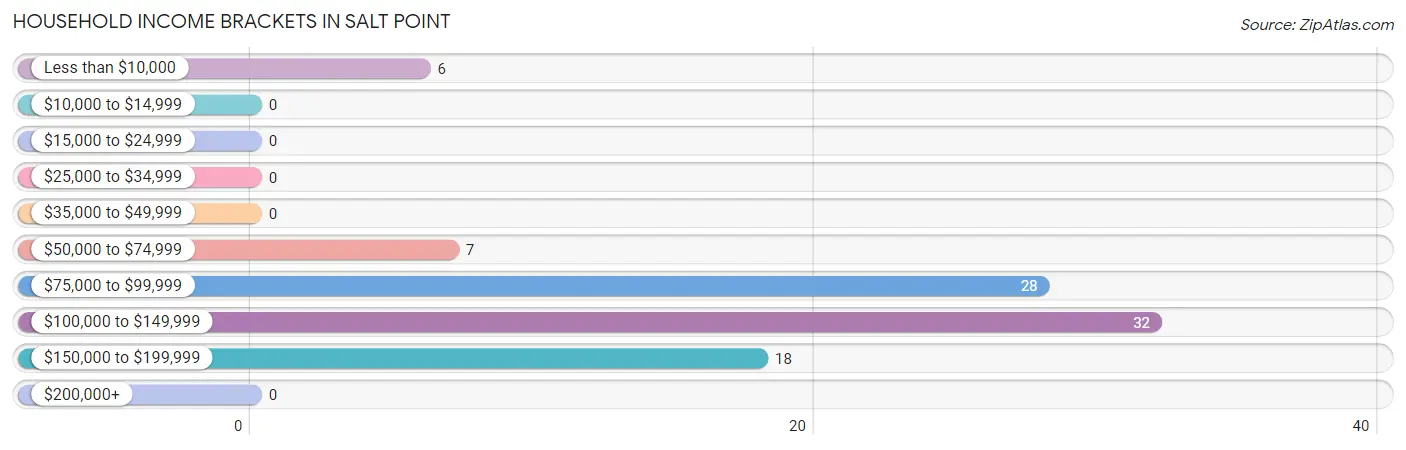
Household Income Brackets in Salt Point
With 32 households falling in the category, the $100,000 to $149,999 income range is the most frequent in Salt Point, accounting for 35.2% of all households.
| Income Bracket | # Households | % Households |
| Less than $10,000 | 6 | 6.6% |
| $10,000 to $14,999 | 0 | 0.0% |
| $15,000 to $24,999 | 0 | 0.0% |
| $25,000 to $34,999 | 0 | 0.0% |
| $35,000 to $49,999 | 0 | 0.0% |
| $50,000 to $74,999 | 7 | 7.7% |
| $75,000 to $99,999 | 28 | 30.8% |
| $100,000 to $149,999 | 32 | 35.2% |
| $150,000 to $199,999 | 18 | 19.8% |
| $200,000+ | 0 | 0.0% |
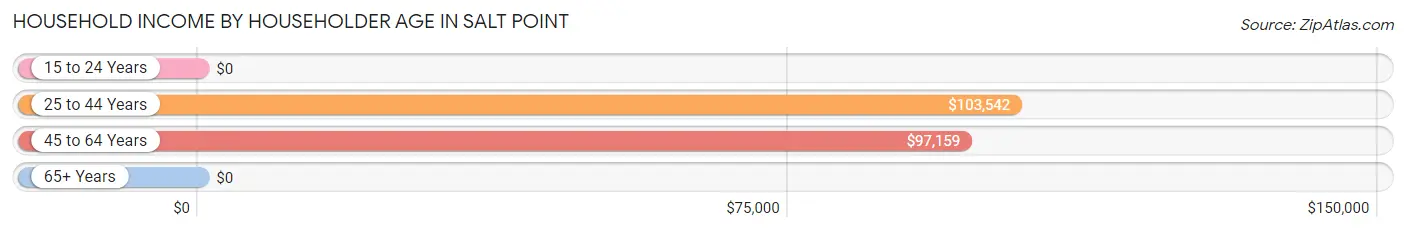
Household Income by Householder Age in Salt Point
The median household income in Salt Point is $103,438, with the highest median household income of $103,542 found in the 25 to 44 years age bracket for the primary householder. A total of 22 households (24.2%) fall into this category.
| Income Bracket | # Households | Median Income |
| 15 to 24 Years | 0 (0.0%) | $0 |
| 25 to 44 Years | 22 (24.2%) | $103,542 |
| 45 to 64 Years | 52 (57.1%) | $97,159 |
| 65+ Years | 17 (18.7%) | $0 |
| Total | 91 (100.0%) | $103,438 |
Poverty in Salt Point
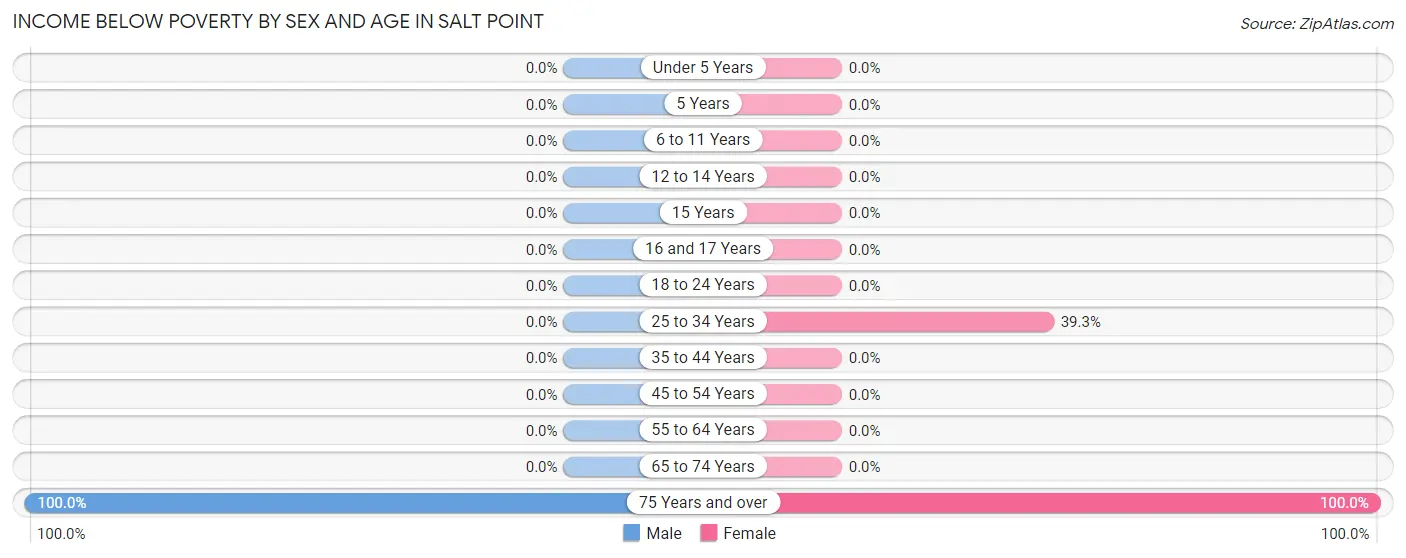
Income Below Poverty by Sex and Age in Salt Point
With 3.9% poverty level for males and 19.9% for females among the residents of Salt Point, 75 year old and over males and 75 year old and over females are the most vulnerable to poverty, with 6 males (100.0%) and 6 females (100.0%) in their respective age groups living below the poverty level.
| Age Bracket | Male | Female |
| Under 5 Years | 0 (0.0%) | 0 (0.0%) |
| 5 Years | 0 (0.0%) | 0 (0.0%) |
| 6 to 11 Years | 0 (0.0%) | 0 (0.0%) |
| 12 to 14 Years | 0 (0.0%) | 0 (0.0%) |
| 15 Years | 0 (0.0%) | 0 (0.0%) |
| 16 and 17 Years | 0 (0.0%) | 0 (0.0%) |
| 18 to 24 Years | 0 (0.0%) | 0 (0.0%) |
| 25 to 34 Years | 0 (0.0%) | 24 (39.3%) |
| 35 to 44 Years | 0 (0.0%) | 0 (0.0%) |
| 45 to 54 Years | 0 (0.0%) | 0 (0.0%) |
| 55 to 64 Years | 0 (0.0%) | 0 (0.0%) |
| 65 to 74 Years | 0 (0.0%) | 0 (0.0%) |
| 75 Years and over | 6 (100.0%) | 6 (100.0%) |
| Total | 6 (3.9%) | 30 (19.9%) |
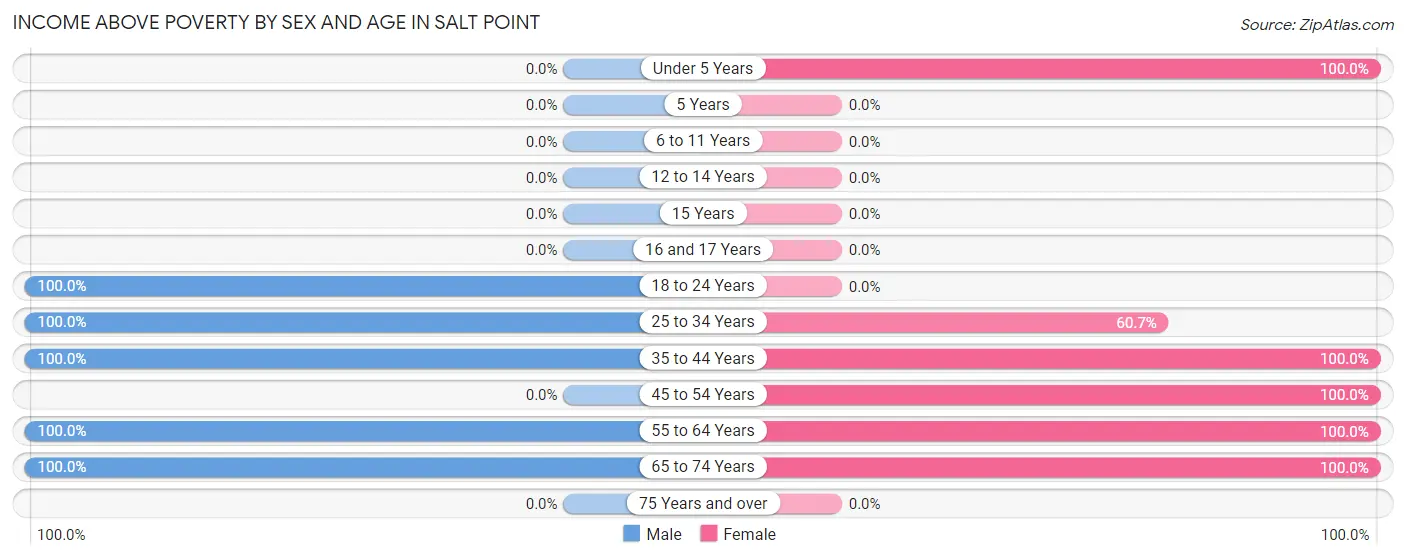
Income Above Poverty by Sex and Age in Salt Point
According to the poverty statistics in Salt Point, males aged 18 to 24 years and females aged under 5 years are the age groups that are most secure financially, with 100.0% of males and 100.0% of females in these age groups living above the poverty line.
| Age Bracket | Male | Female |
| Under 5 Years | 0 (0.0%) | 3 (100.0%) |
| 5 Years | 0 (0.0%) | 0 (0.0%) |
| 6 to 11 Years | 0 (0.0%) | 0 (0.0%) |
| 12 to 14 Years | 0 (0.0%) | 0 (0.0%) |
| 15 Years | 0 (0.0%) | 0 (0.0%) |
| 16 and 17 Years | 0 (0.0%) | 0 (0.0%) |
| 18 to 24 Years | 26 (100.0%) | 0 (0.0%) |
| 25 to 34 Years | 58 (100.0%) | 37 (60.7%) |
| 35 to 44 Years | 18 (100.0%) | 16 (100.0%) |
| 45 to 54 Years | 0 (0.0%) | 28 (100.0%) |
| 55 to 64 Years | 35 (100.0%) | 26 (100.0%) |
| 65 to 74 Years | 10 (100.0%) | 11 (100.0%) |
| 75 Years and over | 0 (0.0%) | 0 (0.0%) |
| Total | 147 (96.1%) | 121 (80.1%) |
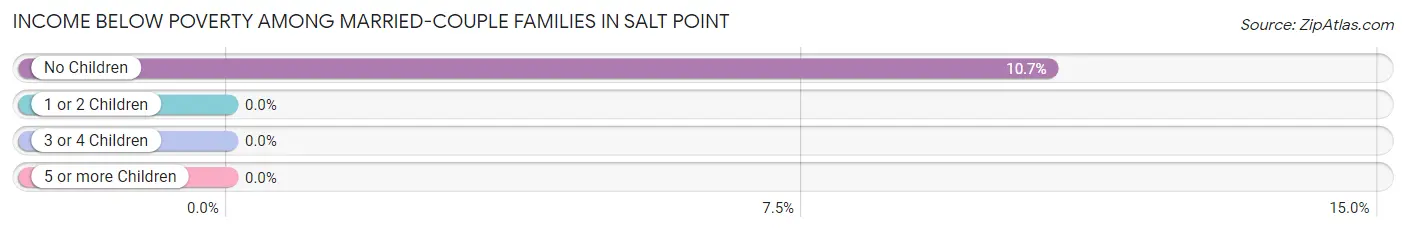
Income Below Poverty Among Married-Couple Families in Salt Point
The poverty statistics for married-couple families in Salt Point show that 10.0% or 6 of the total 60 families live below the poverty line. Families with no children have the highest poverty rate of 10.7%, comprising of 6 families. On the other hand, families with 1 or 2 children have the lowest poverty rate of 0.0%, which includes 0 families.
| Children | Above Poverty | Below Poverty |
| No Children | 50 (89.3%) | 6 (10.7%) |
| 1 or 2 Children | 4 (100.0%) | 0 (0.0%) |
| 3 or 4 Children | 0 (0.0%) | 0 (0.0%) |
| 5 or more Children | 0 (0.0%) | 0 (0.0%) |
| Total | 54 (90.0%) | 6 (10.0%) |
Income Below Poverty Among Single-Parent Households in Salt Point
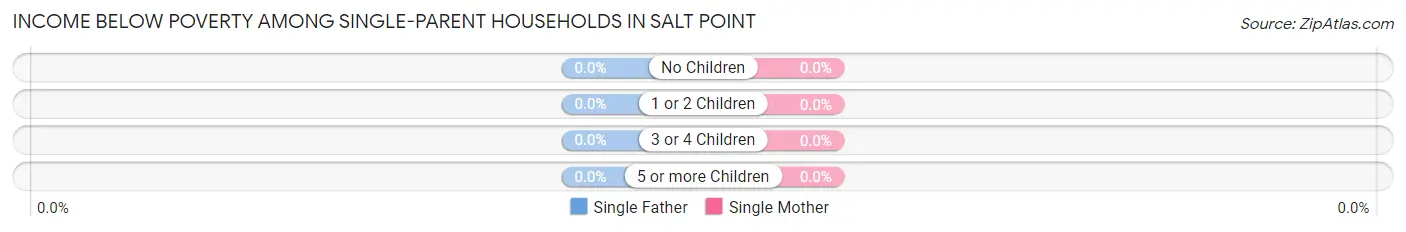
| Children | Single Father | Single Mother |
| No Children | 0 (0.0%) | 0 (0.0%) |
| 1 or 2 Children | 0 (0.0%) | 0 (0.0%) |
| 3 or 4 Children | 0 (0.0%) | 0 (0.0%) |
| 5 or more Children | 0 (0.0%) | 0 (0.0%) |
| Total | 0 (0.0%) | 0 (0.0%) |
Income Below Poverty Among Married-Couple vs Single-Parent Households in Salt Point
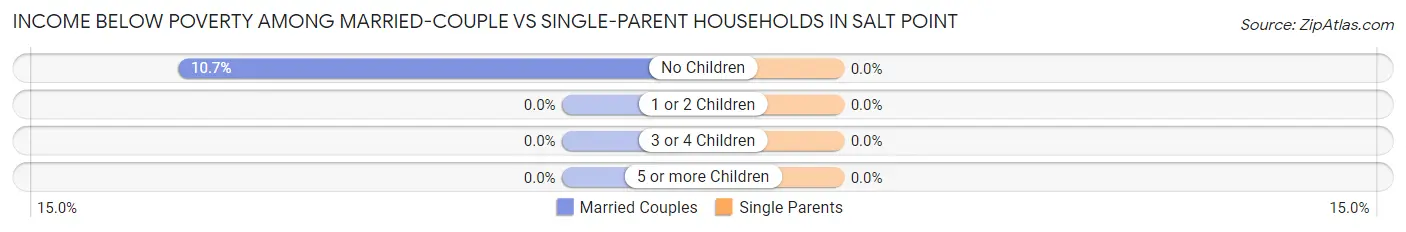
| Children | Married-Couple Families | Single-Parent Households |
| No Children | 6 (10.7%) | 0 (0.0%) |
| 1 or 2 Children | 0 (0.0%) | 0 (0.0%) |
| 3 or 4 Children | 0 (0.0%) | 0 (0.0%) |
| 5 or more Children | 0 (0.0%) | 0 (0.0%) |
| Total | 6 (10.0%) | 0 (0.0%) |
Employment Characteristics in Salt Point
Employment by Class of Employer in Salt Point
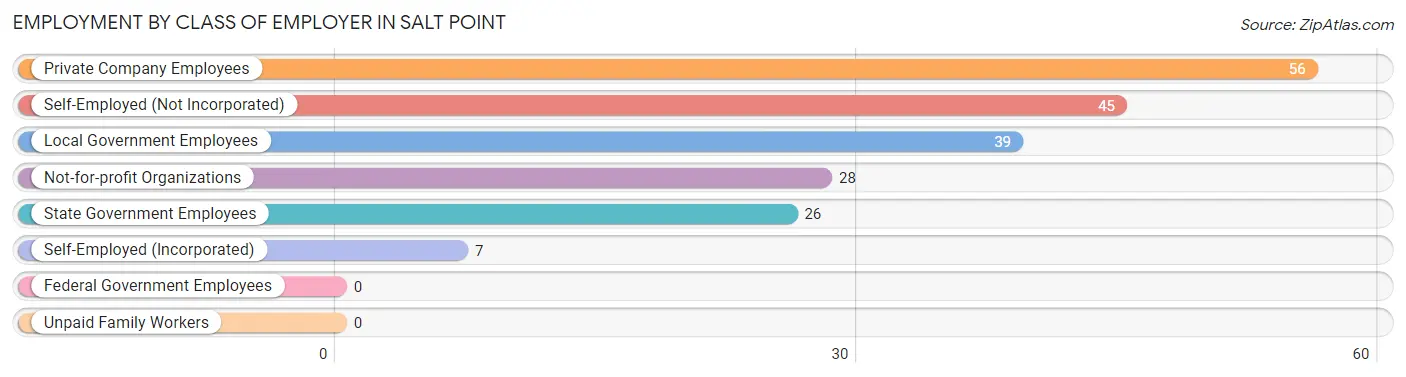
Among the 201 employed individuals in Salt Point, private company employees (56 | 27.9%), self-employed (not incorporated) (45 | 22.4%), and local government employees (39 | 19.4%) make up the most common classes of employment.
| Employer Class | # Employees | % Employees |
| Private Company Employees | 56 | 27.9% |
| Self-Employed (Incorporated) | 7 | 3.5% |
| Self-Employed (Not Incorporated) | 45 | 22.4% |
| Not-for-profit Organizations | 28 | 13.9% |
| Local Government Employees | 39 | 19.4% |
| State Government Employees | 26 | 12.9% |
| Federal Government Employees | 0 | 0.0% |
| Unpaid Family Workers | 0 | 0.0% |
| Total | 201 | 100.0% |
Employment Status by Age in Salt Point
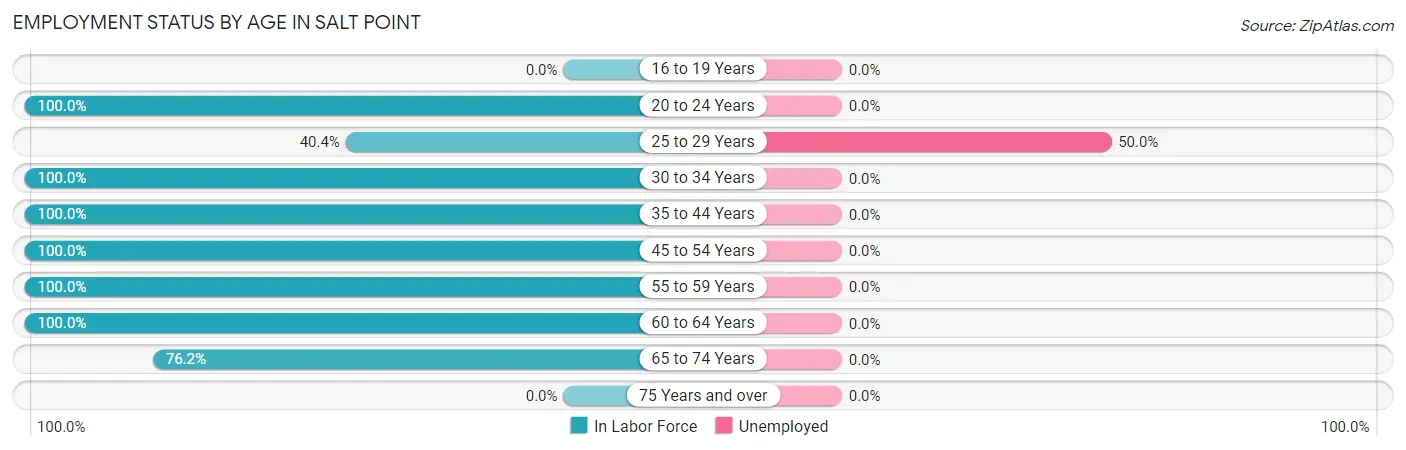
According to the labor force statistics for Salt Point, out of the total population over 16 years of age (301), 73.8% or 222 individuals are in the labor force, with 9.5% or 21 of them unemployed. The age group with the highest labor force participation rate is 20 to 24 years, with 100.0% or 26 individuals in the labor force. Within the labor force, the 25 to 29 years age range has the highest percentage of unemployed individuals, with 50.0% or 21 of them being unemployed.
| Age Bracket | In Labor Force | Unemployed |
| 16 to 19 Years | 0 (0.0%) | 0 (0.0%) |
| 20 to 24 Years | 26 (100.0%) | 0 (0.0%) |
| 25 to 29 Years | 42 (40.4%) | 21 (50.0%) |
| 30 to 34 Years | 15 (100.0%) | 0 (0.0%) |
| 35 to 44 Years | 34 (100.0%) | 0 (0.0%) |
| 45 to 54 Years | 28 (100.0%) | 0 (0.0%) |
| 55 to 59 Years | 7 (100.0%) | 0 (0.0%) |
| 60 to 64 Years | 54 (100.0%) | 0 (0.0%) |
| 65 to 74 Years | 16 (76.2%) | 0 (0.0%) |
| 75 Years and over | 0 (0.0%) | 0 (0.0%) |
| Total | 222 (73.8%) | 21 (9.5%) |
Employment Status by Educational Attainment in Salt Point
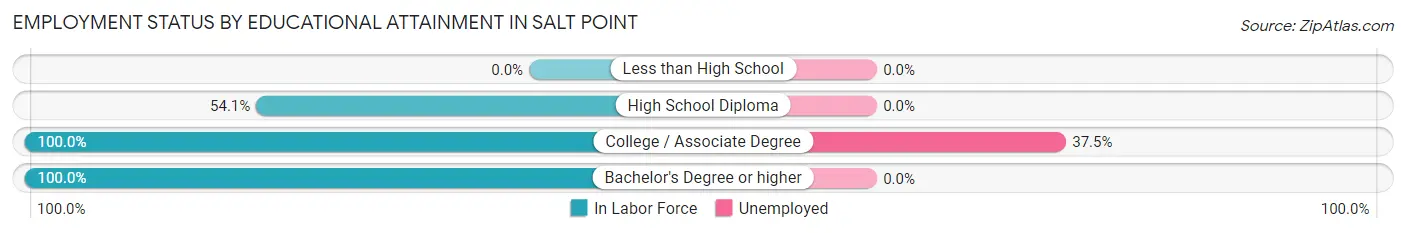
According to labor force statistics for Salt Point, 74.4% of individuals (180) out of the total population between 25 and 64 years of age (242) are in the labor force, with 11.7% or 21 of them being unemployed. The group with the highest labor force participation rate are those with the educational attainment of college / associate degree, with 100.0% or 56 individuals in the labor force. Within the labor force, individuals with college / associate degree education have the highest percentage of unemployment, with 37.5% or 21 of them being unemployed.
| Educational Attainment | In Labor Force | Unemployed |
| Less than High School | 0 (0.0%) | 0 (0.0%) |
| High School Diploma | 73 (54.1%) | 0 (0.0%) |
| College / Associate Degree | 56 (100.0%) | 21 (37.5%) |
| Bachelor's Degree or higher | 51 (100.0%) | 0 (0.0%) |
| Total | 180 (74.4%) | 28 (11.7%) |
Employment Occupations by Sex in Salt Point
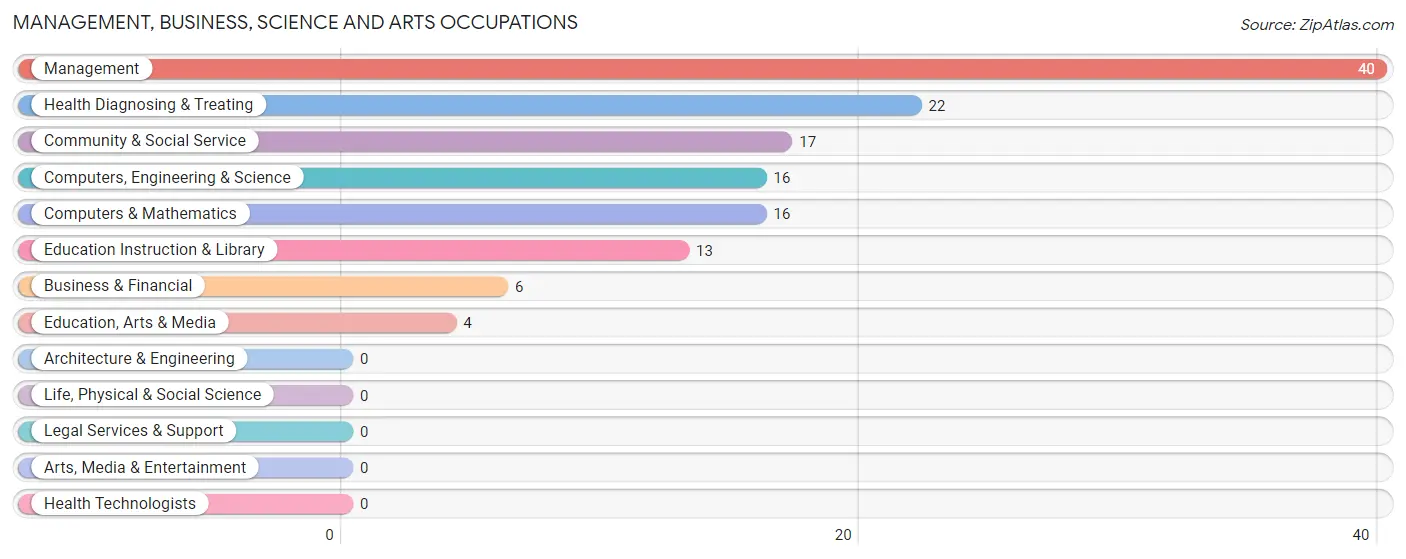
Management, Business, Science and Arts Occupations
The most common Management, Business, Science and Arts occupations in Salt Point are Management (40 | 19.9%), Health Diagnosing & Treating (22 | 11.0%), Community & Social Service (17 | 8.5%), Computers, Engineering & Science (16 | 8.0%), and Computers & Mathematics (16 | 8.0%).
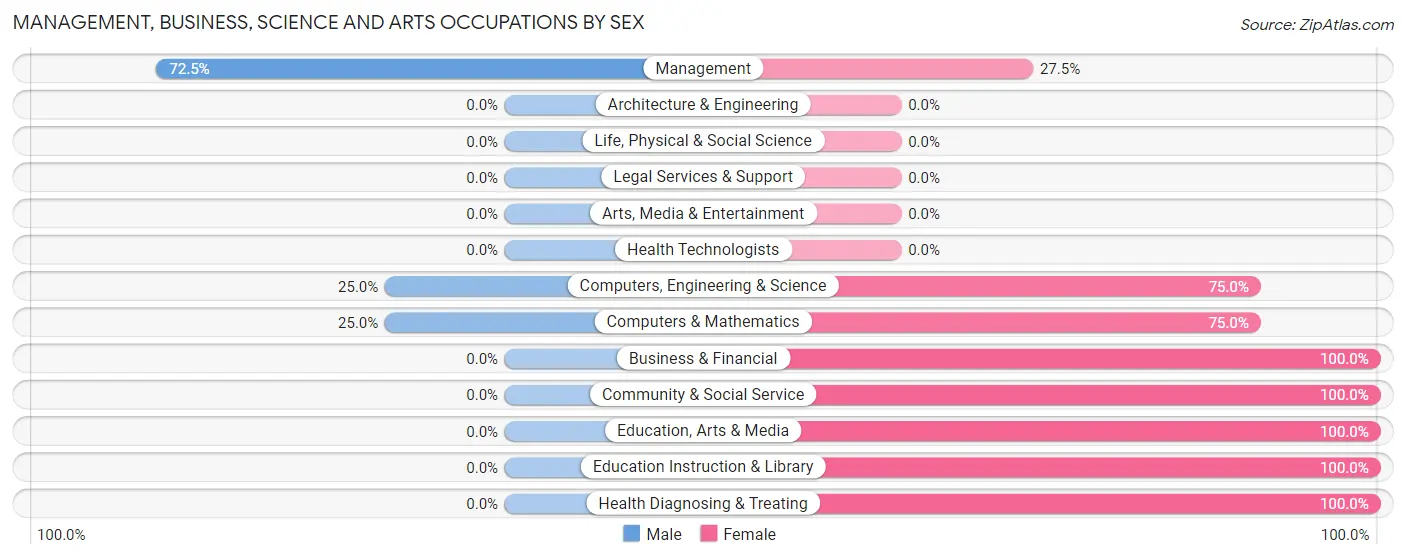
Management, Business, Science and Arts Occupations by Sex
Within the Management, Business, Science and Arts occupations in Salt Point, the most male-oriented occupations are Management (72.5%), Computers, Engineering & Science (25.0%), and Computers & Mathematics (25.0%), while the most female-oriented occupations are Business & Financial (100.0%), Community & Social Service (100.0%), and Education, Arts & Media (100.0%).
| Occupation | Male | Female |
| Management | 29 (72.5%) | 11 (27.5%) |
| Business & Financial | 0 (0.0%) | 6 (100.0%) |
| Computers, Engineering & Science | 4 (25.0%) | 12 (75.0%) |
| Computers & Mathematics | 4 (25.0%) | 12 (75.0%) |
| Architecture & Engineering | 0 (0.0%) | 0 (0.0%) |
| Life, Physical & Social Science | 0 (0.0%) | 0 (0.0%) |
| Community & Social Service | 0 (0.0%) | 17 (100.0%) |
| Education, Arts & Media | 0 (0.0%) | 4 (100.0%) |
| Legal Services & Support | 0 (0.0%) | 0 (0.0%) |
| Education Instruction & Library | 0 (0.0%) | 13 (100.0%) |
| Arts, Media & Entertainment | 0 (0.0%) | 0 (0.0%) |
| Health Diagnosing & Treating | 0 (0.0%) | 22 (100.0%) |
| Health Technologists | 0 (0.0%) | 0 (0.0%) |
| Total (Category) | 33 (32.7%) | 68 (67.3%) |
| Total (Overall) | 104 (51.7%) | 97 (48.3%) |
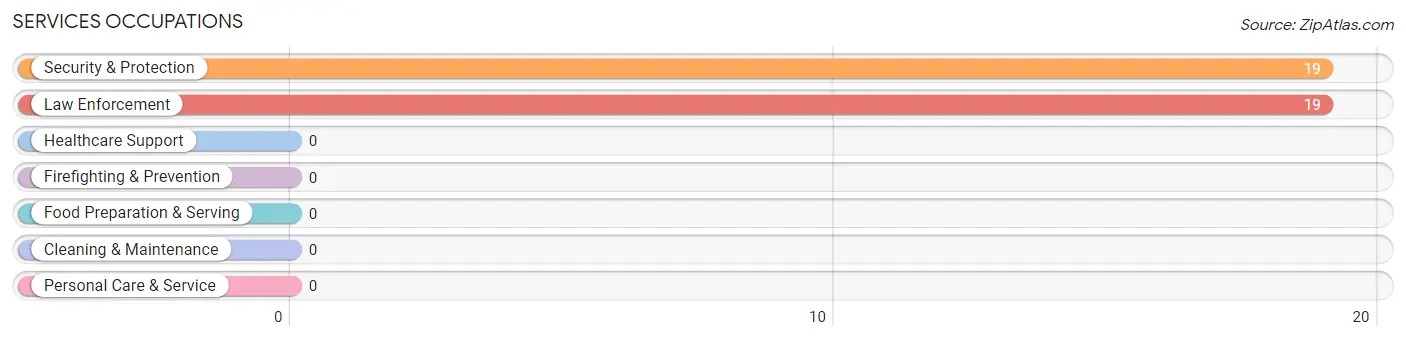
Services Occupations
The most common Services occupations in Salt Point are Security & Protection (19 | 9.5%), and Law Enforcement (19 | 9.5%).
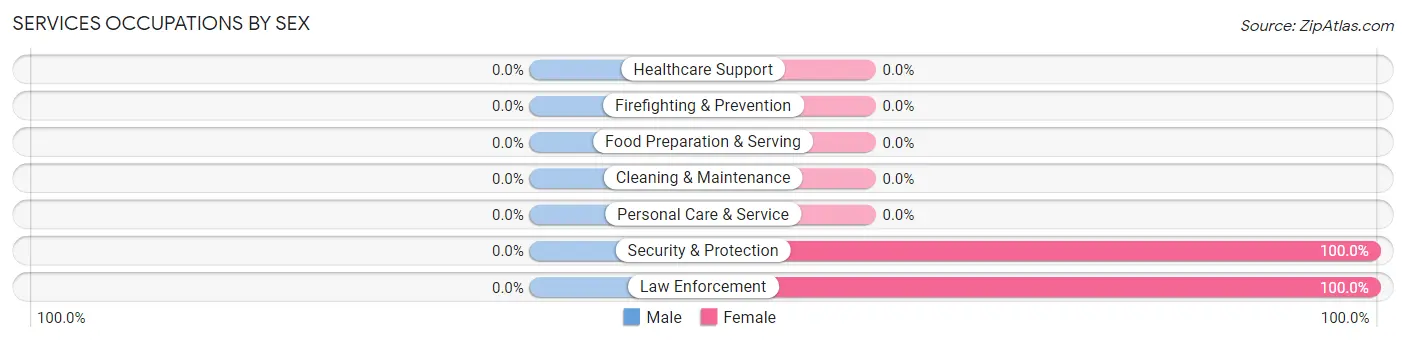
Services Occupations by Sex
| Occupation | Male | Female |
| Healthcare Support | 0 (0.0%) | 0 (0.0%) |
| Security & Protection | 0 (0.0%) | 19 (100.0%) |
| Firefighting & Prevention | 0 (0.0%) | 0 (0.0%) |
| Law Enforcement | 0 (0.0%) | 19 (100.0%) |
| Food Preparation & Serving | 0 (0.0%) | 0 (0.0%) |
| Cleaning & Maintenance | 0 (0.0%) | 0 (0.0%) |
| Personal Care & Service | 0 (0.0%) | 0 (0.0%) |
| Total (Category) | 0 (0.0%) | 19 (100.0%) |
| Total (Overall) | 104 (51.7%) | 97 (48.3%) |
Sales and Office Occupations
The most common Sales and Office occupations in Salt Point are , and Sales & Related (36 | 17.9%).
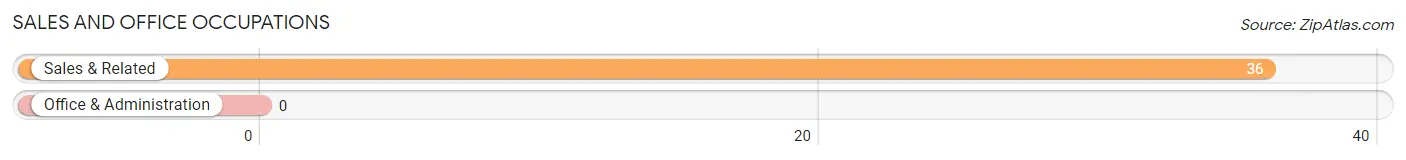
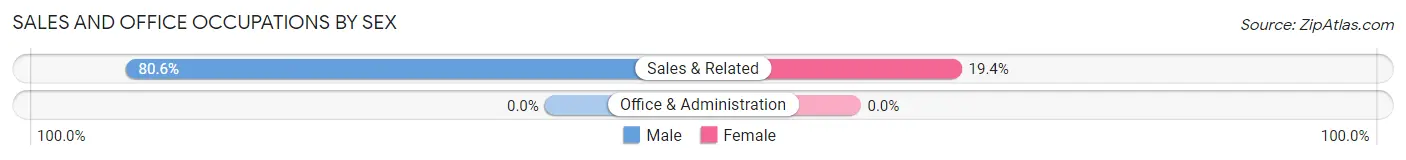
Sales and Office Occupations by Sex
| Occupation | Male | Female |
| Sales & Related | 29 (80.6%) | 7 (19.4%) |
| Office & Administration | 0 (0.0%) | 0 (0.0%) |
| Total (Category) | 29 (80.6%) | 7 (19.4%) |
| Total (Overall) | 104 (51.7%) | 97 (48.3%) |
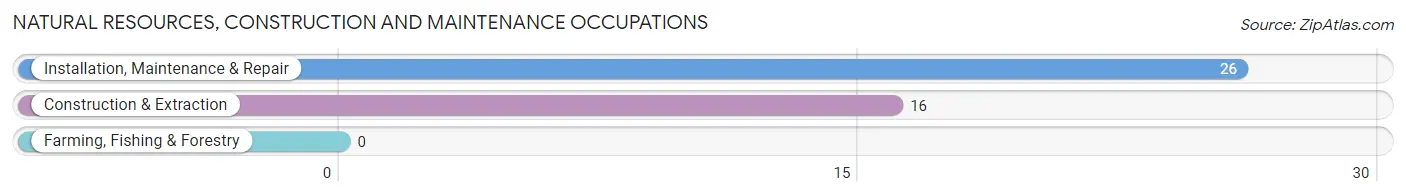
Natural Resources, Construction and Maintenance Occupations
The most common Natural Resources, Construction and Maintenance occupations in Salt Point are Installation, Maintenance & Repair (26 | 12.9%), and Construction & Extraction (16 | 8.0%).
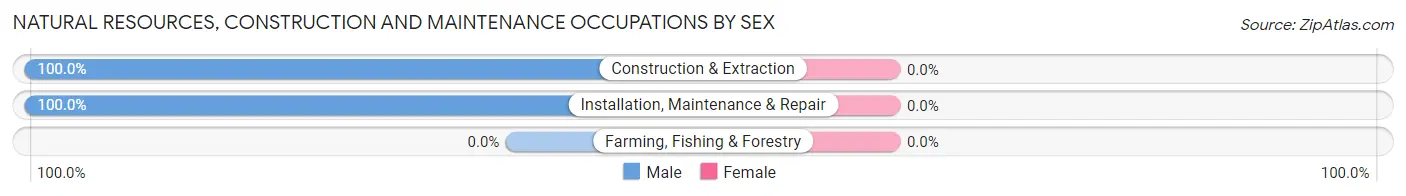
Natural Resources, Construction and Maintenance Occupations by Sex
| Occupation | Male | Female |
| Farming, Fishing & Forestry | 0 (0.0%) | 0 (0.0%) |
| Construction & Extraction | 16 (100.0%) | 0 (0.0%) |
| Installation, Maintenance & Repair | 26 (100.0%) | 0 (0.0%) |
| Total (Category) | 42 (100.0%) | 0 (0.0%) |
| Total (Overall) | 104 (51.7%) | 97 (48.3%) |
Production, Transportation and Moving Occupations
The most common Production, Transportation and Moving occupations in Salt Point are , and Material Moving (3 | 1.5%).
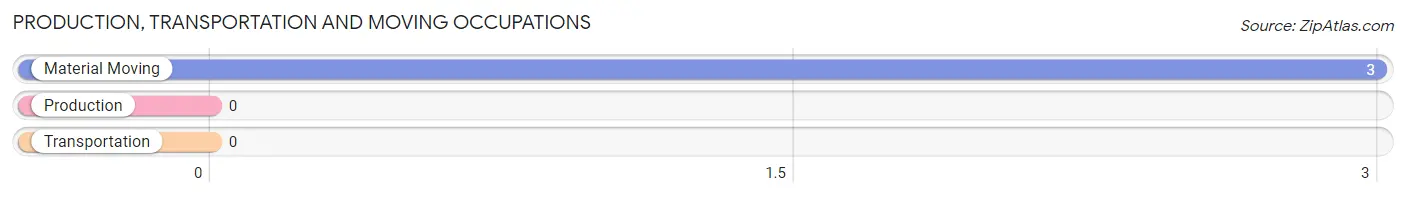
Production, Transportation and Moving Occupations by Sex
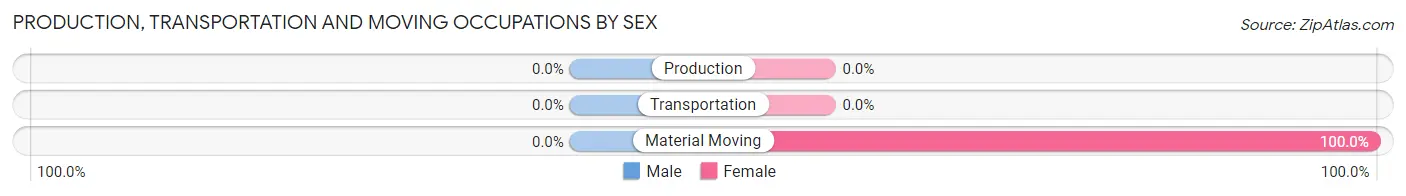
| Occupation | Male | Female |
| Production | 0 (0.0%) | 0 (0.0%) |
| Transportation | 0 (0.0%) | 0 (0.0%) |
| Material Moving | 0 (0.0%) | 3 (100.0%) |
| Total (Category) | 0 (0.0%) | 3 (100.0%) |
| Total (Overall) | 104 (51.7%) | 97 (48.3%) |
Employment Industries by Sex in Salt Point
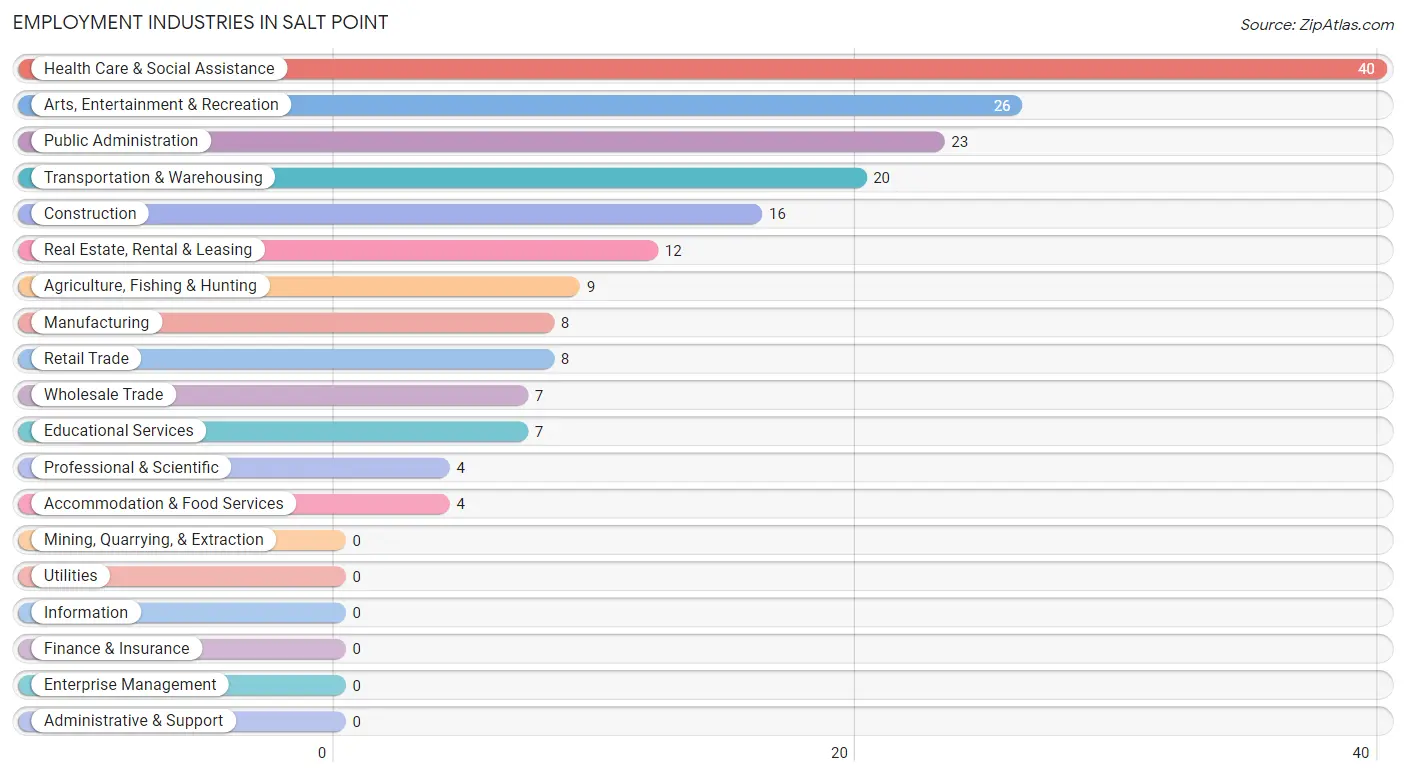
Employment Industries in Salt Point
The major employment industries in Salt Point include Health Care & Social Assistance (40 | 19.9%), Arts, Entertainment & Recreation (26 | 12.9%), Public Administration (23 | 11.4%), Transportation & Warehousing (20 | 10.0%), and Construction (16 | 8.0%).
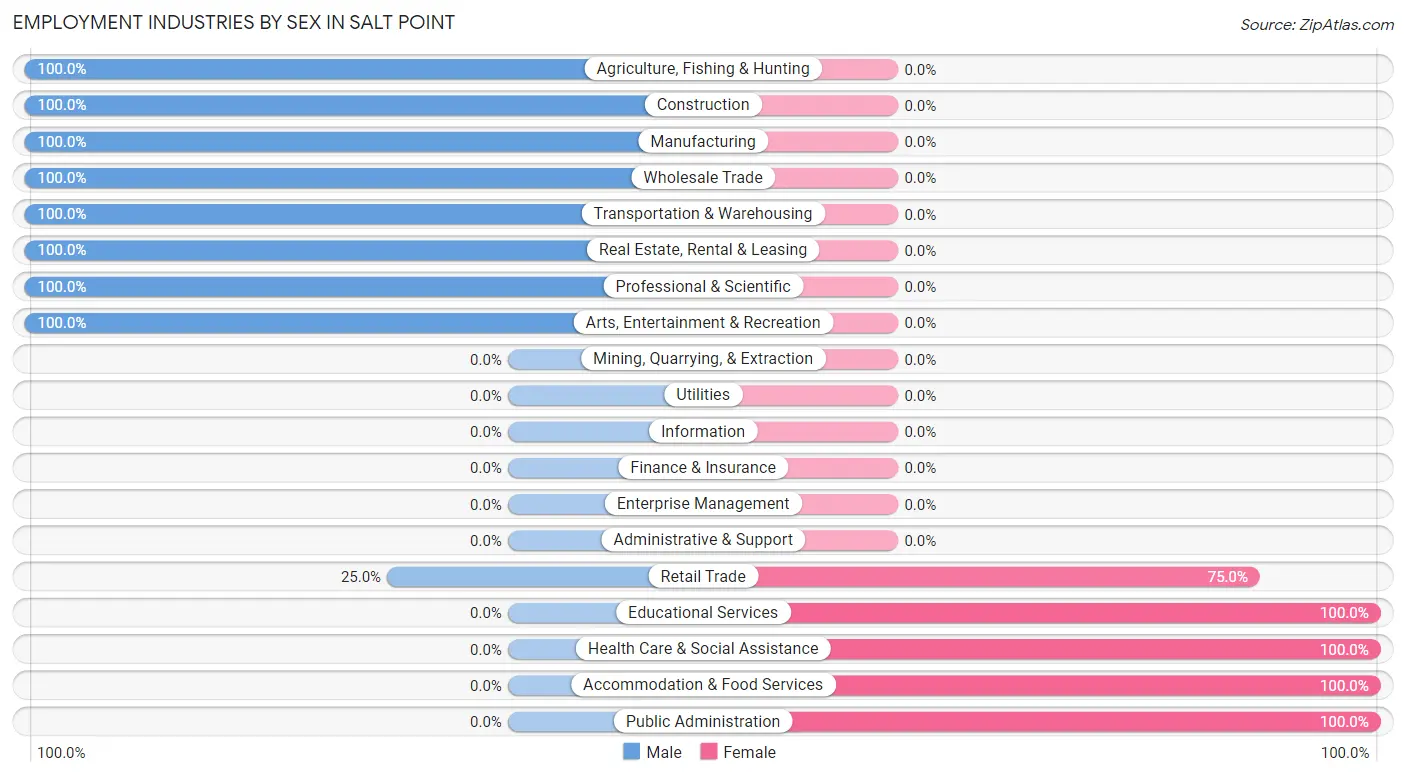
Employment Industries by Sex in Salt Point
The Salt Point industries that see more men than women are Agriculture, Fishing & Hunting (100.0%), Construction (100.0%), and Manufacturing (100.0%), whereas the industries that tend to have a higher number of women are Educational Services (100.0%), Health Care & Social Assistance (100.0%), and Accommodation & Food Services (100.0%).
| Industry | Male | Female |
| Agriculture, Fishing & Hunting | 9 (100.0%) | 0 (0.0%) |
| Mining, Quarrying, & Extraction | 0 (0.0%) | 0 (0.0%) |
| Construction | 16 (100.0%) | 0 (0.0%) |
| Manufacturing | 8 (100.0%) | 0 (0.0%) |
| Wholesale Trade | 7 (100.0%) | 0 (0.0%) |
| Retail Trade | 2 (25.0%) | 6 (75.0%) |
| Transportation & Warehousing | 20 (100.0%) | 0 (0.0%) |
| Utilities | 0 (0.0%) | 0 (0.0%) |
| Information | 0 (0.0%) | 0 (0.0%) |
| Finance & Insurance | 0 (0.0%) | 0 (0.0%) |
| Real Estate, Rental & Leasing | 12 (100.0%) | 0 (0.0%) |
| Professional & Scientific | 4 (100.0%) | 0 (0.0%) |
| Enterprise Management | 0 (0.0%) | 0 (0.0%) |
| Administrative & Support | 0 (0.0%) | 0 (0.0%) |
| Educational Services | 0 (0.0%) | 7 (100.0%) |
| Health Care & Social Assistance | 0 (0.0%) | 40 (100.0%) |
| Arts, Entertainment & Recreation | 26 (100.0%) | 0 (0.0%) |
| Accommodation & Food Services | 0 (0.0%) | 4 (100.0%) |
| Public Administration | 0 (0.0%) | 23 (100.0%) |
| Total | 104 (51.7%) | 97 (48.3%) |
Education in Salt Point
School Enrollment in Salt Point
The most common levels of schooling among the 12 students in Salt Point are college / undergraduate (6 | 50.0%), and graduate / professional (6 | 50.0%).
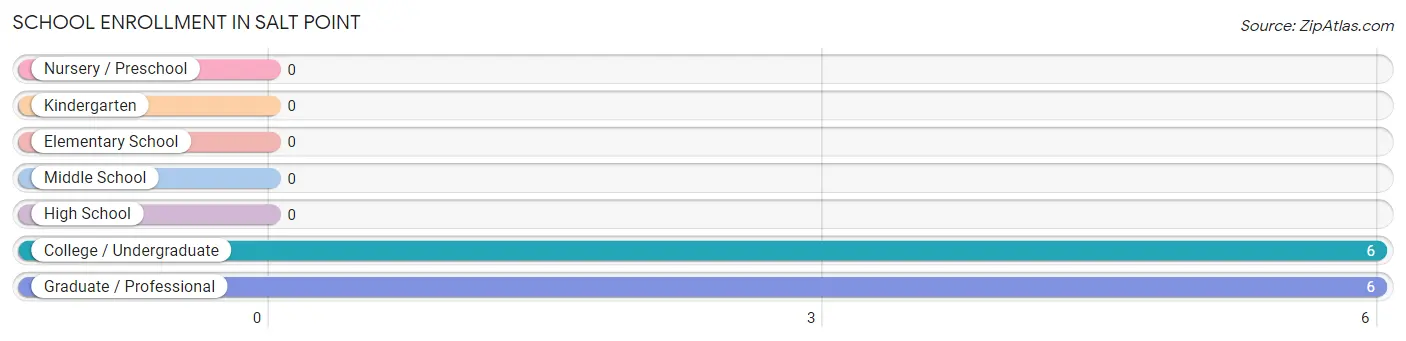
| School Level | # Students | % Students |
| Nursery / Preschool | 0 | 0.0% |
| Kindergarten | 0 | 0.0% |
| Elementary School | 0 | 0.0% |
| Middle School | 0 | 0.0% |
| High School | 0 | 0.0% |
| College / Undergraduate | 6 | 50.0% |
| Graduate / Professional | 6 | 50.0% |
| Total | 12 | 100.0% |
School Enrollment by Age by Funding Source in Salt Point
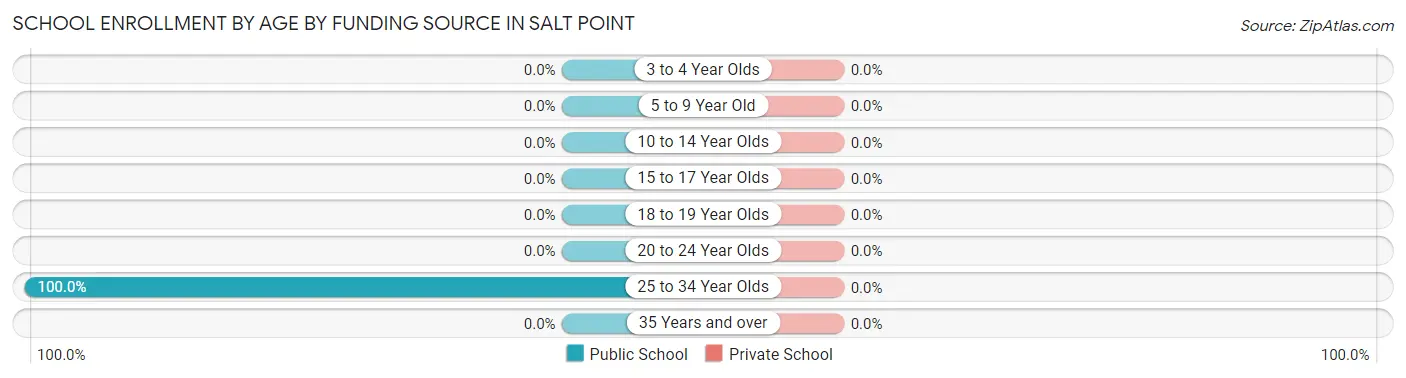
| Age Bracket | Public School | Private School |
| 3 to 4 Year Olds | 0 (0.0%) | 0 (0.0%) |
| 5 to 9 Year Old | 0 (0.0%) | 0 (0.0%) |
| 10 to 14 Year Olds | 0 (0.0%) | 0 (0.0%) |
| 15 to 17 Year Olds | 0 (0.0%) | 0 (0.0%) |
| 18 to 19 Year Olds | 0 (0.0%) | 0 (0.0%) |
| 20 to 24 Year Olds | 0 (0.0%) | 0 (0.0%) |
| 25 to 34 Year Olds | 12 (100.0%) | 0 (0.0%) |
| 35 Years and over | 0 (0.0%) | 0 (0.0%) |
| Total | 12 (100.0%) | 0 (0.0%) |
Educational Attainment by Field of Study in Salt Point
Bio, nature & agricultural (17 | 26.2%), business (15 | 23.1%), arts & humanities (7 | 10.8%), science & technology (6 | 9.2%), and education (6 | 9.2%) are the most common fields of study among 65 individuals in Salt Point who have obtained a bachelor's degree or higher.
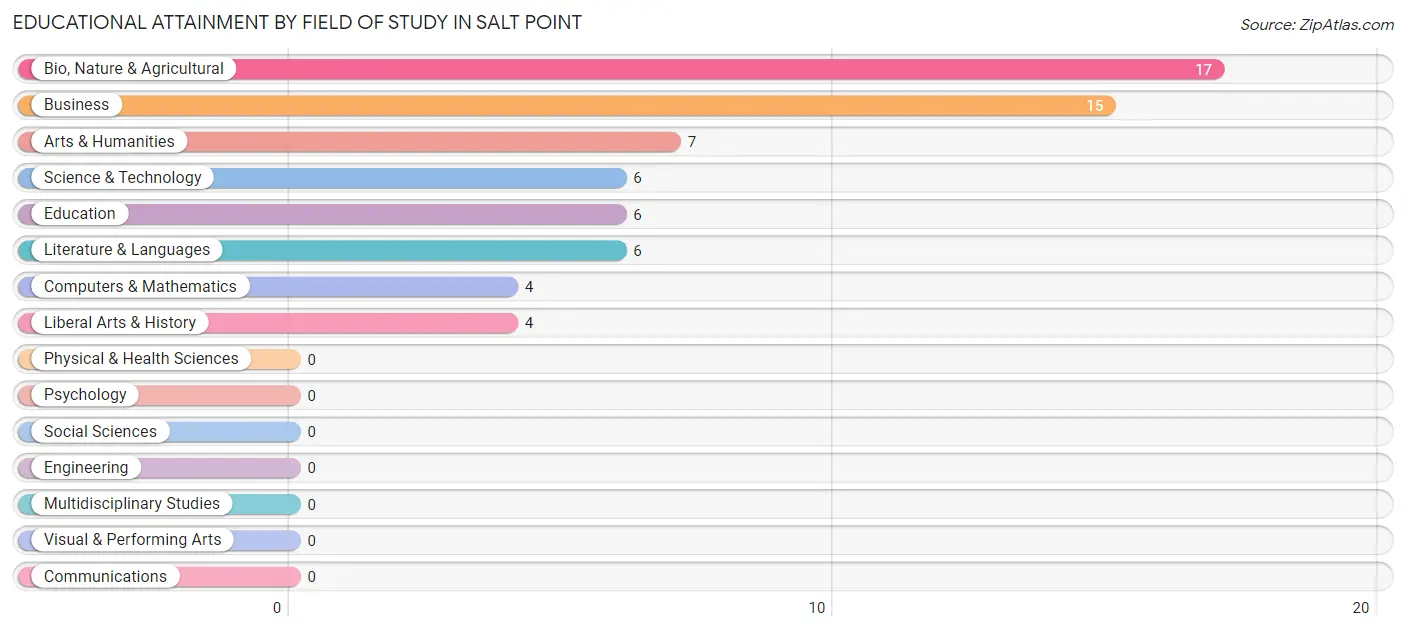
| Field of Study | # Graduates | % Graduates |
| Computers & Mathematics | 4 | 6.1% |
| Bio, Nature & Agricultural | 17 | 26.2% |
| Physical & Health Sciences | 0 | 0.0% |
| Psychology | 0 | 0.0% |
| Social Sciences | 0 | 0.0% |
| Engineering | 0 | 0.0% |
| Multidisciplinary Studies | 0 | 0.0% |
| Science & Technology | 6 | 9.2% |
| Business | 15 | 23.1% |
| Education | 6 | 9.2% |
| Literature & Languages | 6 | 9.2% |
| Liberal Arts & History | 4 | 6.1% |
| Visual & Performing Arts | 0 | 0.0% |
| Communications | 0 | 0.0% |
| Arts & Humanities | 7 | 10.8% |
| Total | 65 | 100.0% |
Transportation & Commute in Salt Point
Vehicle Availability by Sex in Salt Point
The most prevalent vehicle ownership categories in Salt Point are males with 3 vehicles (57, accounting for 54.8%) and females with 3 vehicles (55, making up 58.8%).
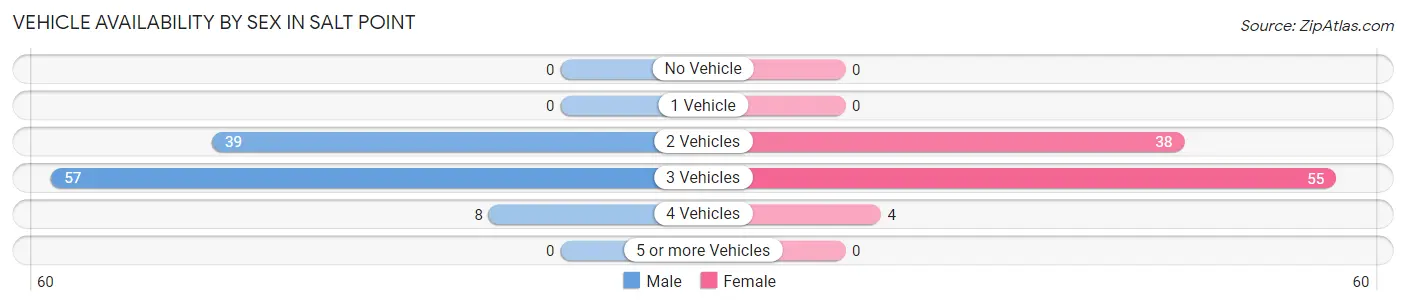
| Vehicles Available | Male | Female |
| No Vehicle | 0 (0.0%) | 0 (0.0%) |
| 1 Vehicle | 0 (0.0%) | 0 (0.0%) |
| 2 Vehicles | 39 (37.5%) | 38 (39.2%) |
| 3 Vehicles | 57 (54.8%) | 55 (56.7%) |
| 4 Vehicles | 8 (7.7%) | 4 (4.1%) |
| 5 or more Vehicles | 0 (0.0%) | 0 (0.0%) |
| Total | 104 (100.0%) | 97 (100.0%) |
Commute Time in Salt Point
The most frequently occuring commute durations in Salt Point are 45 to 59 minutes (44 commuters, 23.8%), 30 to 34 minutes (31 commuters, 16.8%), and 20 to 24 minutes (24 commuters, 13.0%).
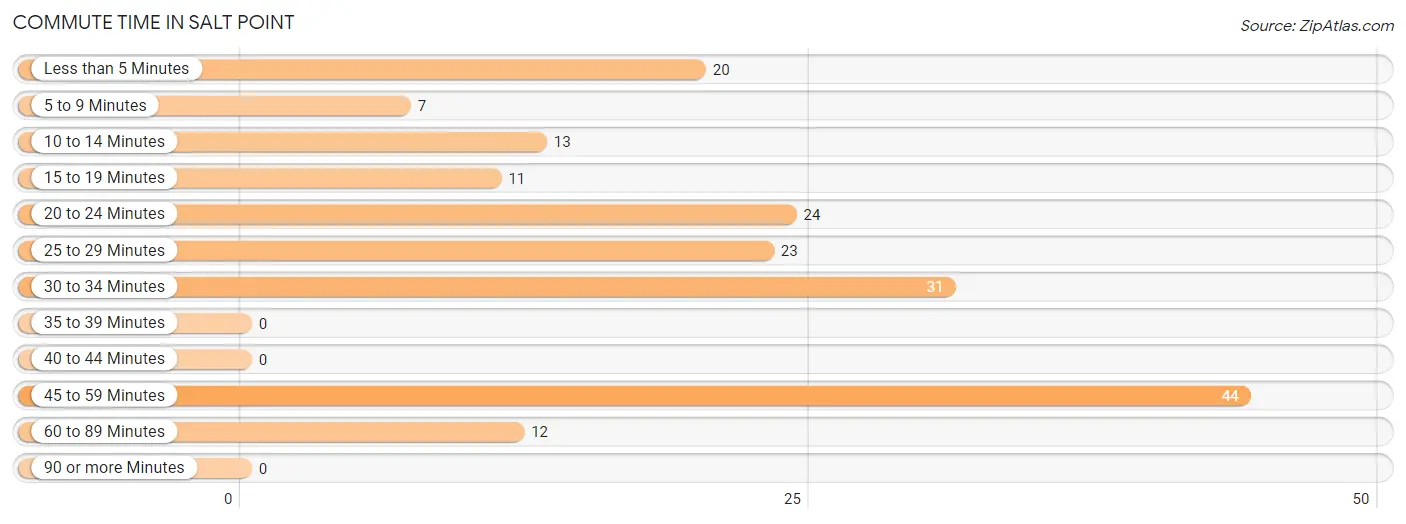
| Commute Time | # Commuters | % Commuters |
| Less than 5 Minutes | 20 | 10.8% |
| 5 to 9 Minutes | 7 | 3.8% |
| 10 to 14 Minutes | 13 | 7.0% |
| 15 to 19 Minutes | 11 | 5.9% |
| 20 to 24 Minutes | 24 | 13.0% |
| 25 to 29 Minutes | 23 | 12.4% |
| 30 to 34 Minutes | 31 | 16.8% |
| 35 to 39 Minutes | 0 | 0.0% |
| 40 to 44 Minutes | 0 | 0.0% |
| 45 to 59 Minutes | 44 | 23.8% |
| 60 to 89 Minutes | 12 | 6.5% |
| 90 or more Minutes | 0 | 0.0% |
Commute Time by Sex in Salt Point
The most common commute times in Salt Point are 45 to 59 minutes (26 commuters, 27.1%) for males and 30 to 34 minutes (31 commuters, 34.8%) for females.
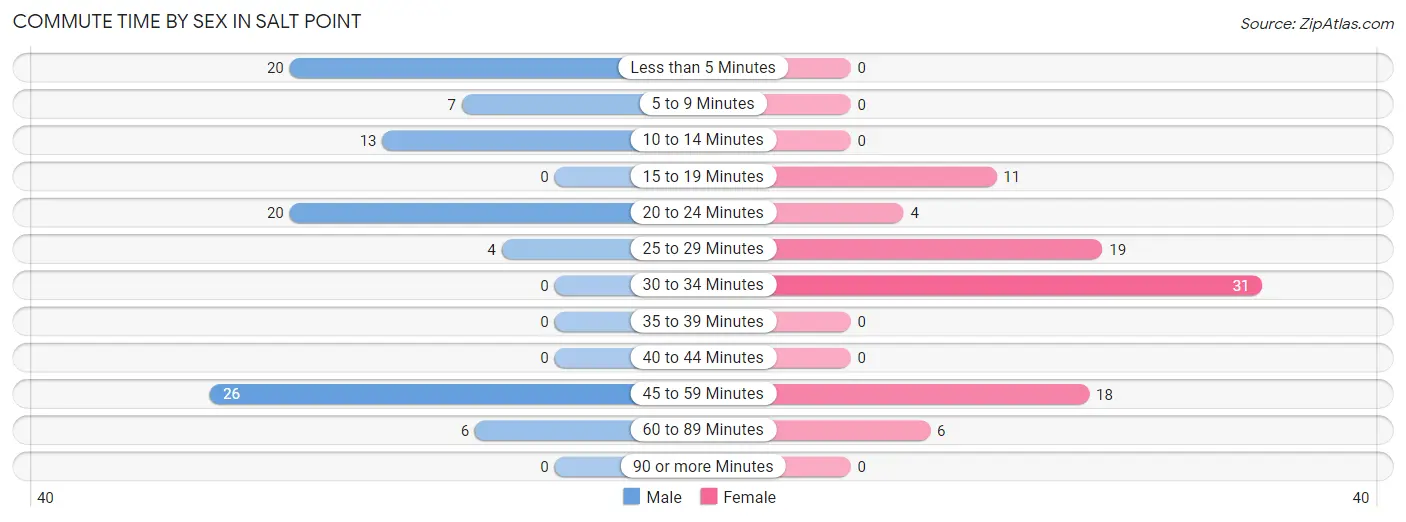
| Commute Time | Male | Female |
| Less than 5 Minutes | 20 (20.8%) | 0 (0.0%) |
| 5 to 9 Minutes | 7 (7.3%) | 0 (0.0%) |
| 10 to 14 Minutes | 13 (13.5%) | 0 (0.0%) |
| 15 to 19 Minutes | 0 (0.0%) | 11 (12.4%) |
| 20 to 24 Minutes | 20 (20.8%) | 4 (4.5%) |
| 25 to 29 Minutes | 4 (4.2%) | 19 (21.3%) |
| 30 to 34 Minutes | 0 (0.0%) | 31 (34.8%) |
| 35 to 39 Minutes | 0 (0.0%) | 0 (0.0%) |
| 40 to 44 Minutes | 0 (0.0%) | 0 (0.0%) |
| 45 to 59 Minutes | 26 (27.1%) | 18 (20.2%) |
| 60 to 89 Minutes | 6 (6.2%) | 6 (6.7%) |
| 90 or more Minutes | 0 (0.0%) | 0 (0.0%) |
Time of Departure to Work by Sex in Salt Point
The most frequent times of departure to work in Salt Point are 8:00 AM to 8:29 AM (34, 35.4%) for males and 7:00 AM to 7:29 AM (28, 31.5%) for females.
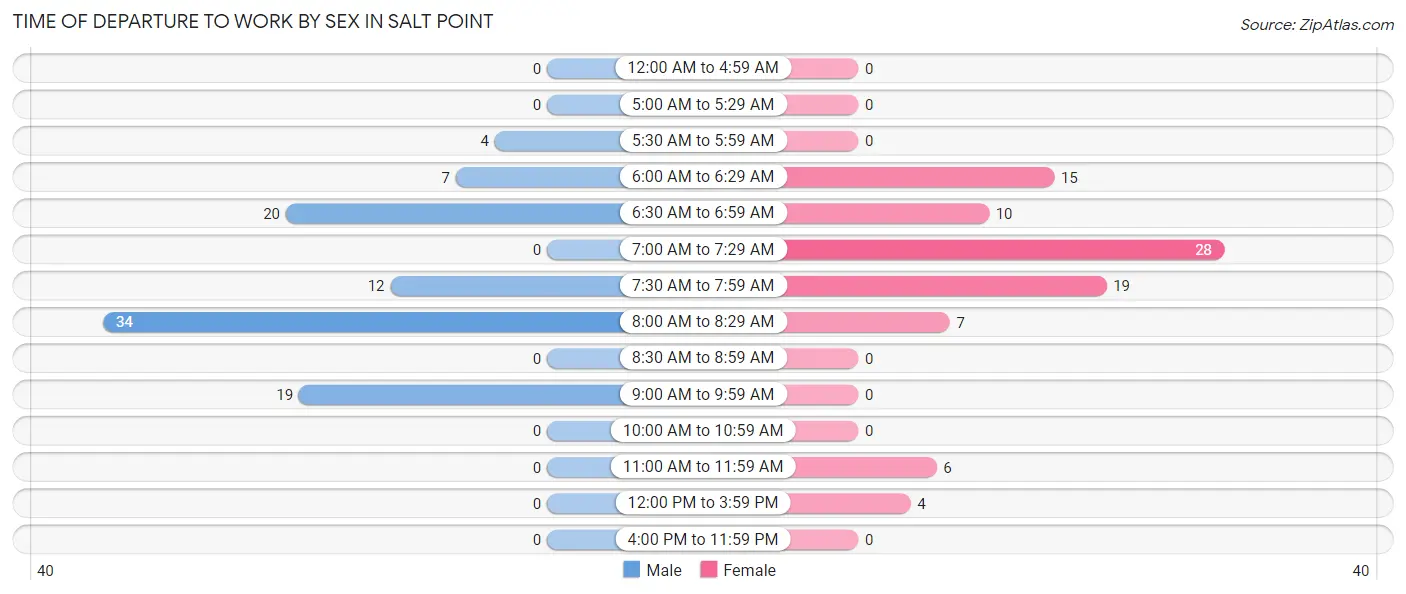
| Time of Departure | Male | Female |
| 12:00 AM to 4:59 AM | 0 (0.0%) | 0 (0.0%) |
| 5:00 AM to 5:29 AM | 0 (0.0%) | 0 (0.0%) |
| 5:30 AM to 5:59 AM | 4 (4.2%) | 0 (0.0%) |
| 6:00 AM to 6:29 AM | 7 (7.3%) | 15 (16.9%) |
| 6:30 AM to 6:59 AM | 20 (20.8%) | 10 (11.2%) |
| 7:00 AM to 7:29 AM | 0 (0.0%) | 28 (31.5%) |
| 7:30 AM to 7:59 AM | 12 (12.5%) | 19 (21.3%) |
| 8:00 AM to 8:29 AM | 34 (35.4%) | 7 (7.9%) |
| 8:30 AM to 8:59 AM | 0 (0.0%) | 0 (0.0%) |
| 9:00 AM to 9:59 AM | 19 (19.8%) | 0 (0.0%) |
| 10:00 AM to 10:59 AM | 0 (0.0%) | 0 (0.0%) |
| 11:00 AM to 11:59 AM | 0 (0.0%) | 6 (6.7%) |
| 12:00 PM to 3:59 PM | 0 (0.0%) | 4 (4.5%) |
| 4:00 PM to 11:59 PM | 0 (0.0%) | 0 (0.0%) |
| Total | 96 (100.0%) | 89 (100.0%) |
Housing Occupancy in Salt Point
Occupancy by Ownership in Salt Point
Of the total 91 dwellings in Salt Point, owner-occupied units account for 81 (89.0%), while renter-occupied units make up 10 (11.0%).
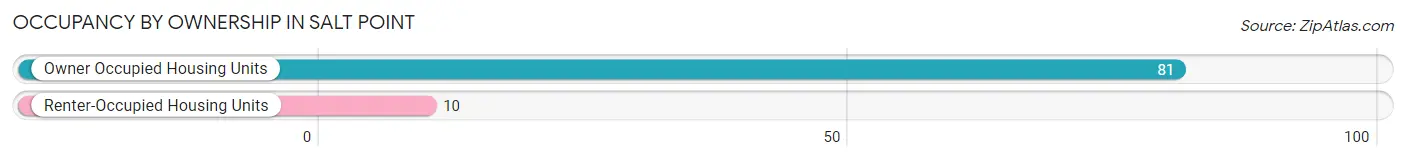
| Occupancy | # Housing Units | % Housing Units |
| Owner Occupied Housing Units | 81 | 89.0% |
| Renter-Occupied Housing Units | 10 | 11.0% |
| Total Occupied Housing Units | 91 | 100.0% |
Occupancy by Household Size in Salt Point
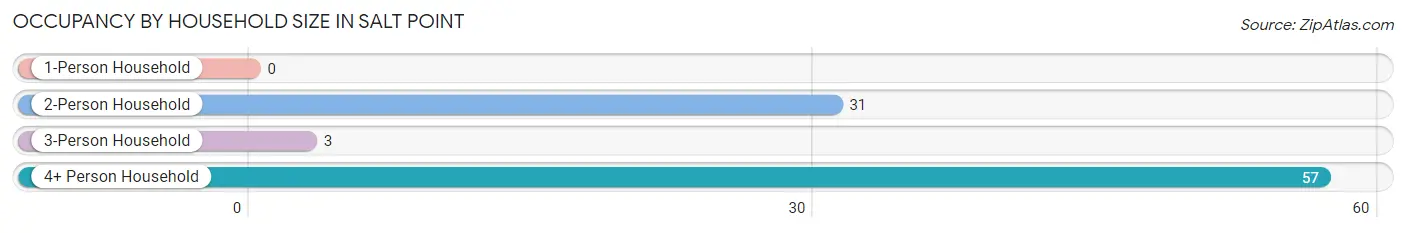
| Household Size | # Housing Units | % Housing Units |
| 1-Person Household | 0 | 0.0% |
| 2-Person Household | 31 | 34.1% |
| 3-Person Household | 3 | 3.3% |
| 4+ Person Household | 57 | 62.6% |
| Total Housing Units | 91 | 100.0% |
Occupancy by Ownership by Household Size in Salt Point
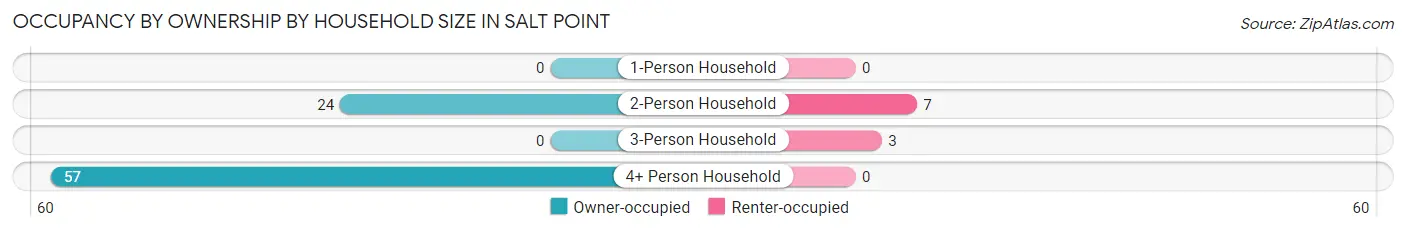
| Household Size | Owner-occupied | Renter-occupied |
| 1-Person Household | 0 (0.0%) | 0 (0.0%) |
| 2-Person Household | 24 (77.4%) | 7 (22.6%) |
| 3-Person Household | 0 (0.0%) | 3 (100.0%) |
| 4+ Person Household | 57 (100.0%) | 0 (0.0%) |
| Total Housing Units | 81 (89.0%) | 10 (11.0%) |
Occupancy by Educational Attainment in Salt Point
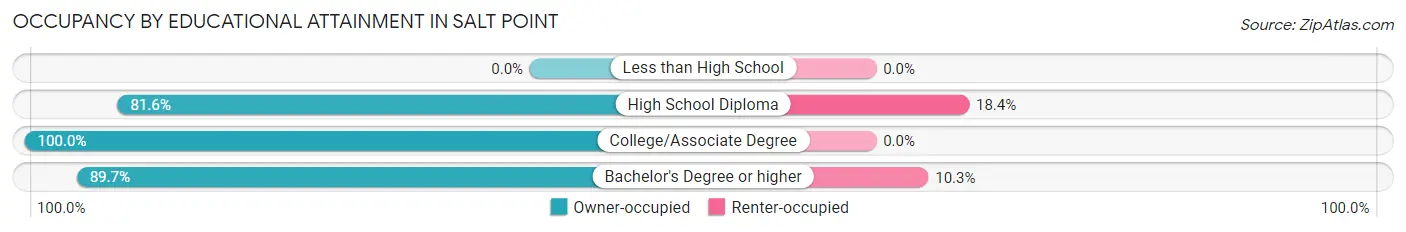
| Household Size | Owner-occupied | Renter-occupied |
| Less than High School | 0 (0.0%) | 0 (0.0%) |
| High School Diploma | 31 (81.6%) | 7 (18.4%) |
| College/Associate Degree | 24 (100.0%) | 0 (0.0%) |
| Bachelor's Degree or higher | 26 (89.7%) | 3 (10.3%) |
Occupancy by Age of Householder in Salt Point
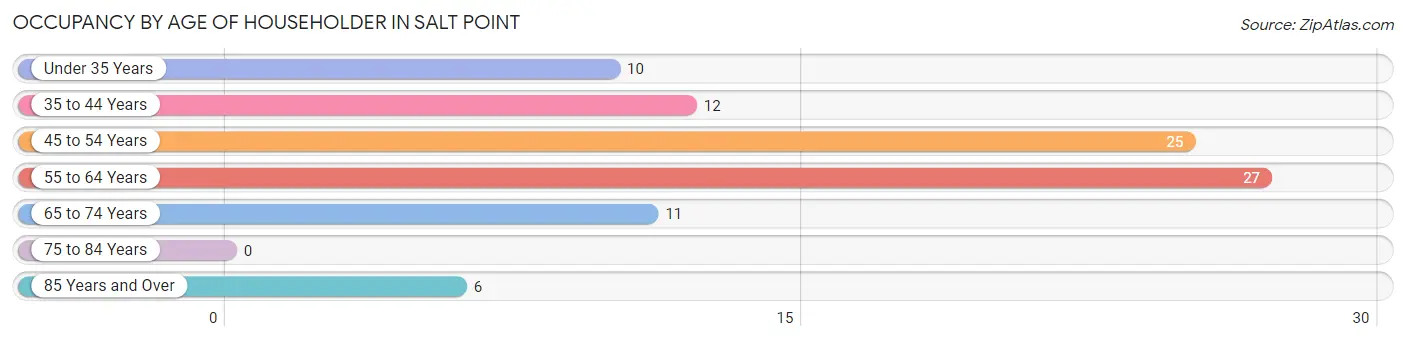
| Age Bracket | # Households | % Households |
| Under 35 Years | 10 | 11.0% |
| 35 to 44 Years | 12 | 13.2% |
| 45 to 54 Years | 25 | 27.5% |
| 55 to 64 Years | 27 | 29.7% |
| 65 to 74 Years | 11 | 12.1% |
| 75 to 84 Years | 0 | 0.0% |
| 85 Years and Over | 6 | 6.6% |
| Total | 91 | 100.0% |
Housing Finances in Salt Point
Median Income by Occupancy in Salt Point
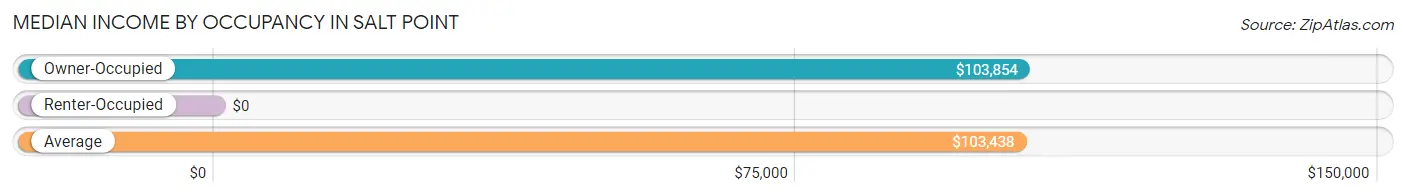
| Occupancy Type | # Households | Median Income |
| Owner-Occupied | 81 (89.0%) | $103,854 |
| Renter-Occupied | 10 (11.0%) | $0 |
| Average | 91 (100.0%) | $103,438 |
Occupancy by Householder Income Bracket in Salt Point
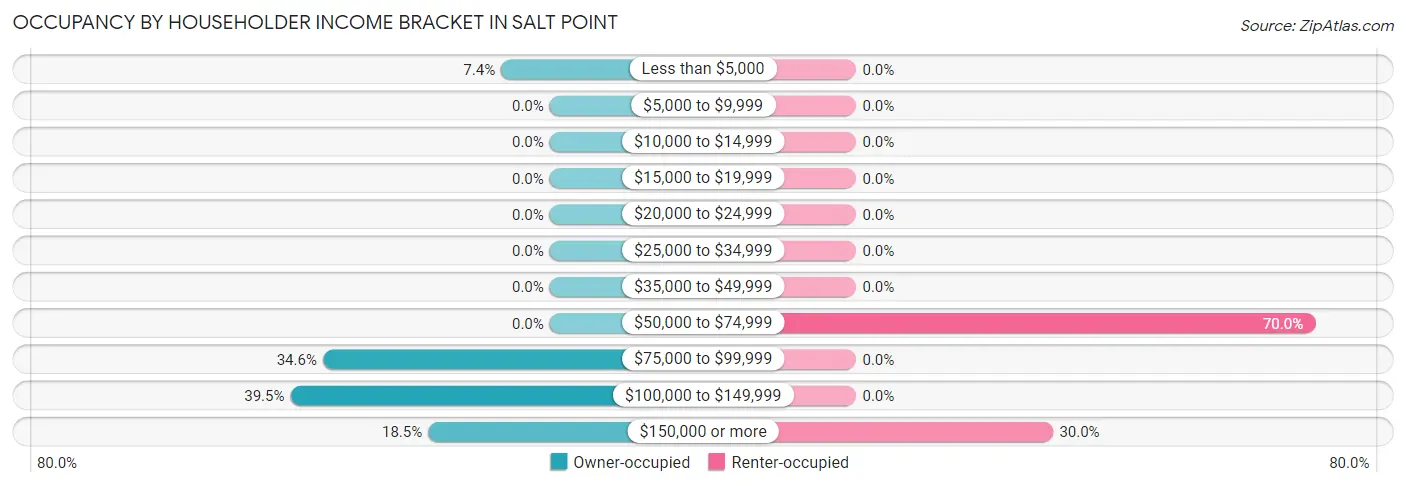
| Income Bracket | Owner-occupied | Renter-occupied |
| Less than $5,000 | 6 (7.4%) | 0 (0.0%) |
| $5,000 to $9,999 | 0 (0.0%) | 0 (0.0%) |
| $10,000 to $14,999 | 0 (0.0%) | 0 (0.0%) |
| $15,000 to $19,999 | 0 (0.0%) | 0 (0.0%) |
| $20,000 to $24,999 | 0 (0.0%) | 0 (0.0%) |
| $25,000 to $34,999 | 0 (0.0%) | 0 (0.0%) |
| $35,000 to $49,999 | 0 (0.0%) | 0 (0.0%) |
| $50,000 to $74,999 | 0 (0.0%) | 7 (70.0%) |
| $75,000 to $99,999 | 28 (34.6%) | 0 (0.0%) |
| $100,000 to $149,999 | 32 (39.5%) | 0 (0.0%) |
| $150,000 or more | 15 (18.5%) | 3 (30.0%) |
| Total | 81 (100.0%) | 10 (100.0%) |
Monthly Housing Cost Tiers in Salt Point
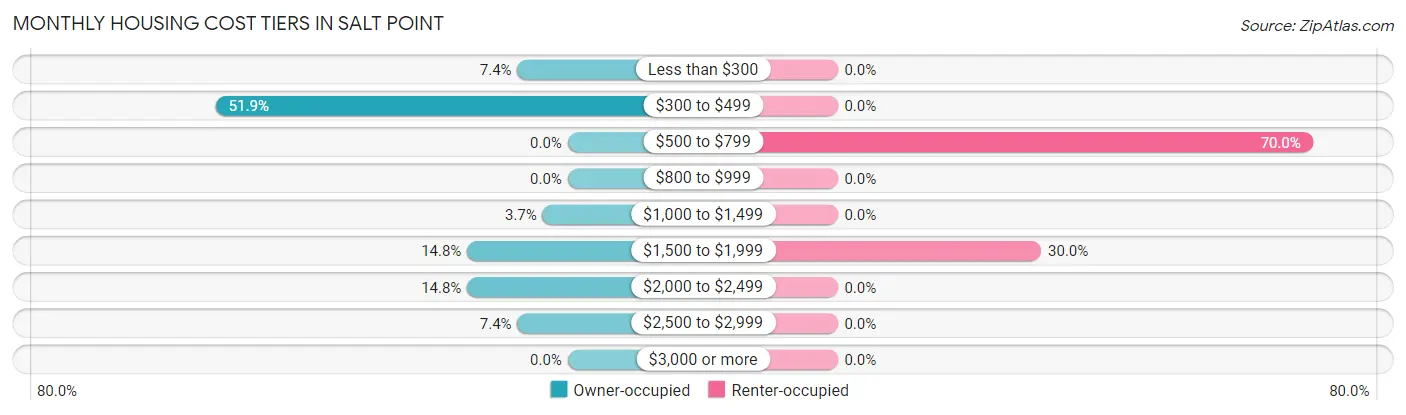
| Monthly Cost | Owner-occupied | Renter-occupied |
| Less than $300 | 6 (7.4%) | 0 (0.0%) |
| $300 to $499 | 42 (51.8%) | 0 (0.0%) |
| $500 to $799 | 0 (0.0%) | 7 (70.0%) |
| $800 to $999 | 0 (0.0%) | 0 (0.0%) |
| $1,000 to $1,499 | 3 (3.7%) | 0 (0.0%) |
| $1,500 to $1,999 | 12 (14.8%) | 3 (30.0%) |
| $2,000 to $2,499 | 12 (14.8%) | 0 (0.0%) |
| $2,500 to $2,999 | 6 (7.4%) | 0 (0.0%) |
| $3,000 or more | 0 (0.0%) | 0 (0.0%) |
| Total | 81 (100.0%) | 10 (100.0%) |
Physical Housing Characteristics in Salt Point
Housing Structures in Salt Point
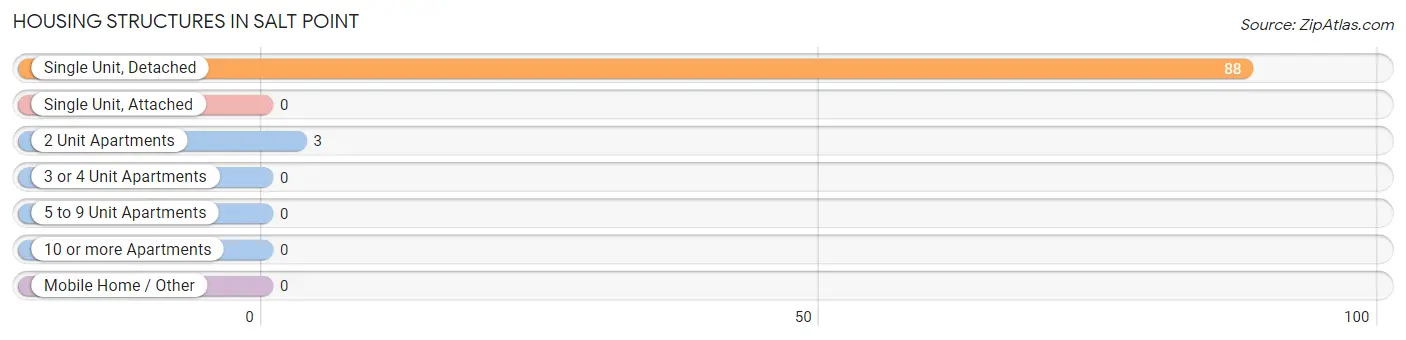
| Structure Type | # Housing Units | % Housing Units |
| Single Unit, Detached | 88 | 96.7% |
| Single Unit, Attached | 0 | 0.0% |
| 2 Unit Apartments | 3 | 3.3% |
| 3 or 4 Unit Apartments | 0 | 0.0% |
| 5 to 9 Unit Apartments | 0 | 0.0% |
| 10 or more Apartments | 0 | 0.0% |
| Mobile Home / Other | 0 | 0.0% |
| Total | 91 | 100.0% |
Housing Structures by Occupancy in Salt Point
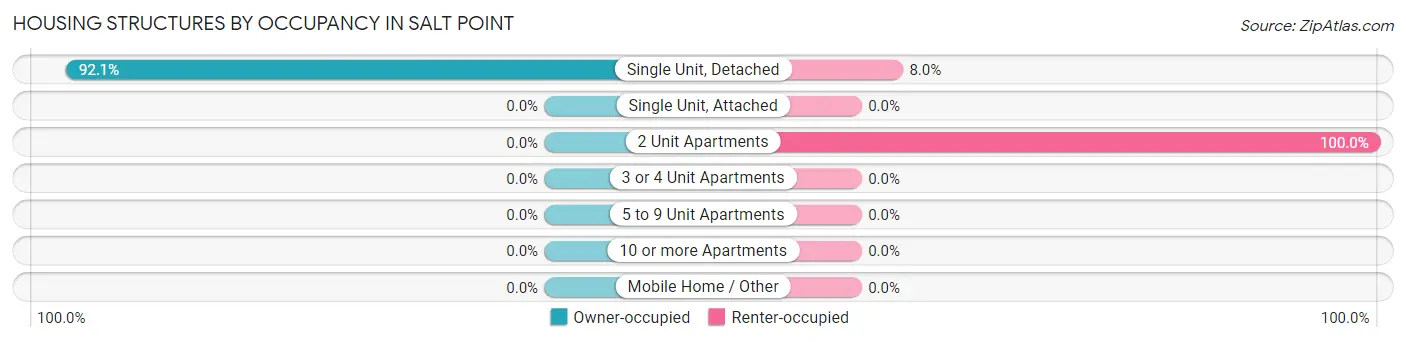
| Structure Type | Owner-occupied | Renter-occupied |
| Single Unit, Detached | 81 (92.0%) | 7 (8.0%) |
| Single Unit, Attached | 0 (0.0%) | 0 (0.0%) |
| 2 Unit Apartments | 0 (0.0%) | 3 (100.0%) |
| 3 or 4 Unit Apartments | 0 (0.0%) | 0 (0.0%) |
| 5 to 9 Unit Apartments | 0 (0.0%) | 0 (0.0%) |
| 10 or more Apartments | 0 (0.0%) | 0 (0.0%) |
| Mobile Home / Other | 0 (0.0%) | 0 (0.0%) |
| Total | 81 (89.0%) | 10 (11.0%) |
Housing Structures by Number of Rooms in Salt Point
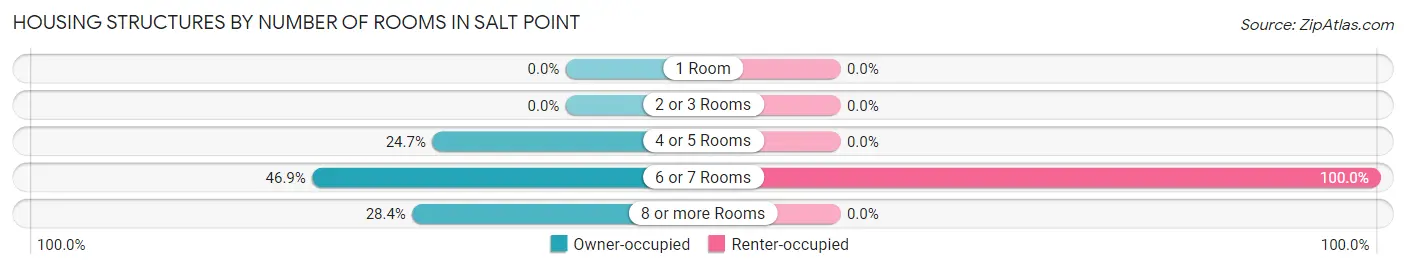
| Number of Rooms | Owner-occupied | Renter-occupied |
| 1 Room | 0 (0.0%) | 0 (0.0%) |
| 2 or 3 Rooms | 0 (0.0%) | 0 (0.0%) |
| 4 or 5 Rooms | 20 (24.7%) | 0 (0.0%) |
| 6 or 7 Rooms | 38 (46.9%) | 10 (100.0%) |
| 8 or more Rooms | 23 (28.4%) | 0 (0.0%) |
| Total | 81 (100.0%) | 10 (100.0%) |
Housing Structure by Heating Type in Salt Point
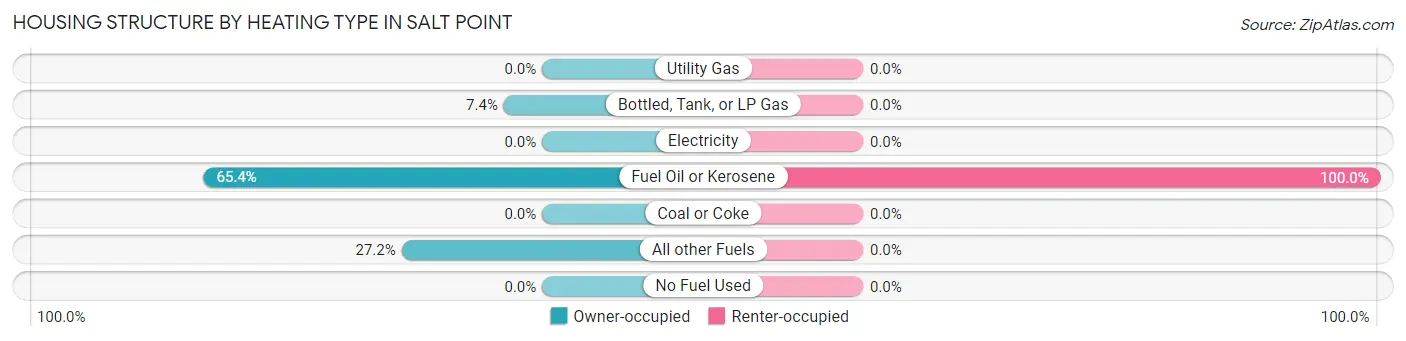
| Heating Type | Owner-occupied | Renter-occupied |
| Utility Gas | 0 (0.0%) | 0 (0.0%) |
| Bottled, Tank, or LP Gas | 6 (7.4%) | 0 (0.0%) |
| Electricity | 0 (0.0%) | 0 (0.0%) |
| Fuel Oil or Kerosene | 53 (65.4%) | 10 (100.0%) |
| Coal or Coke | 0 (0.0%) | 0 (0.0%) |
| All other Fuels | 22 (27.2%) | 0 (0.0%) |
| No Fuel Used | 0 (0.0%) | 0 (0.0%) |
| Total | 81 (100.0%) | 10 (100.0%) |
Household Vehicle Usage in Salt Point
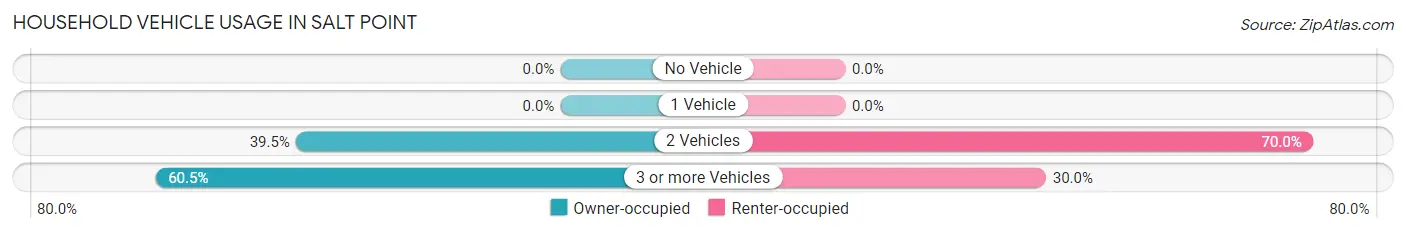
| Vehicles per Household | Owner-occupied | Renter-occupied |
| No Vehicle | 0 (0.0%) | 0 (0.0%) |
| 1 Vehicle | 0 (0.0%) | 0 (0.0%) |
| 2 Vehicles | 32 (39.5%) | 7 (70.0%) |
| 3 or more Vehicles | 49 (60.5%) | 3 (30.0%) |
| Total | 81 (100.0%) | 10 (100.0%) |
Real Estate & Mortgages in Salt Point
Real Estate and Mortgage Overview in Salt Point
| Characteristic | Without Mortgage | With Mortgage |
| Housing Units | 48 | 33 |
| Median Property Value | - | - |
| Median Household Income | $97,045 | $15 |
| Monthly Housing Costs | $395 | $0 |
| Real Estate Taxes | $1,286 | $0 |
Property Value by Mortgage Status in Salt Point
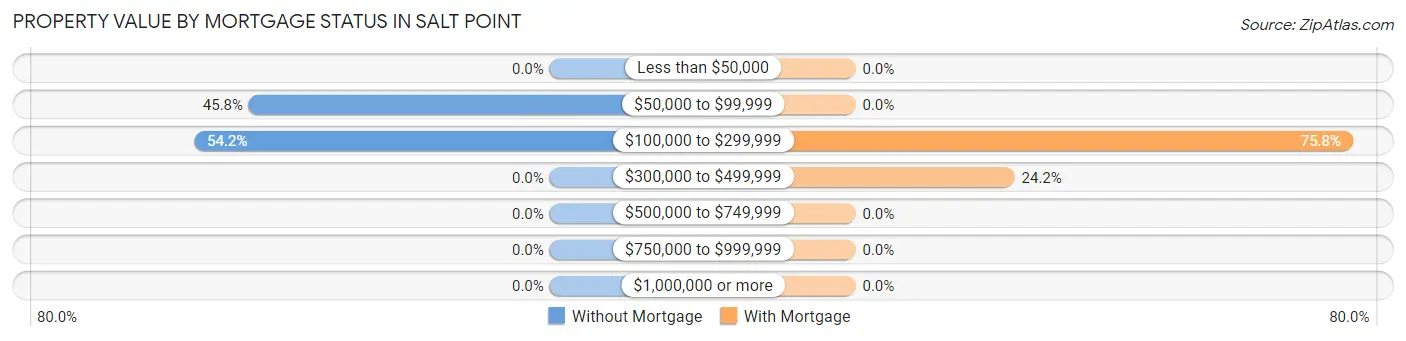
| Property Value | Without Mortgage | With Mortgage |
| Less than $50,000 | 0 (0.0%) | 0 (0.0%) |
| $50,000 to $99,999 | 22 (45.8%) | 0 (0.0%) |
| $100,000 to $299,999 | 26 (54.2%) | 25 (75.8%) |
| $300,000 to $499,999 | 0 (0.0%) | 8 (24.2%) |
| $500,000 to $749,999 | 0 (0.0%) | 0 (0.0%) |
| $750,000 to $999,999 | 0 (0.0%) | 0 (0.0%) |
| $1,000,000 or more | 0 (0.0%) | 0 (0.0%) |
| Total | 48 (100.0%) | 33 (100.0%) |
Household Income by Mortgage Status in Salt Point
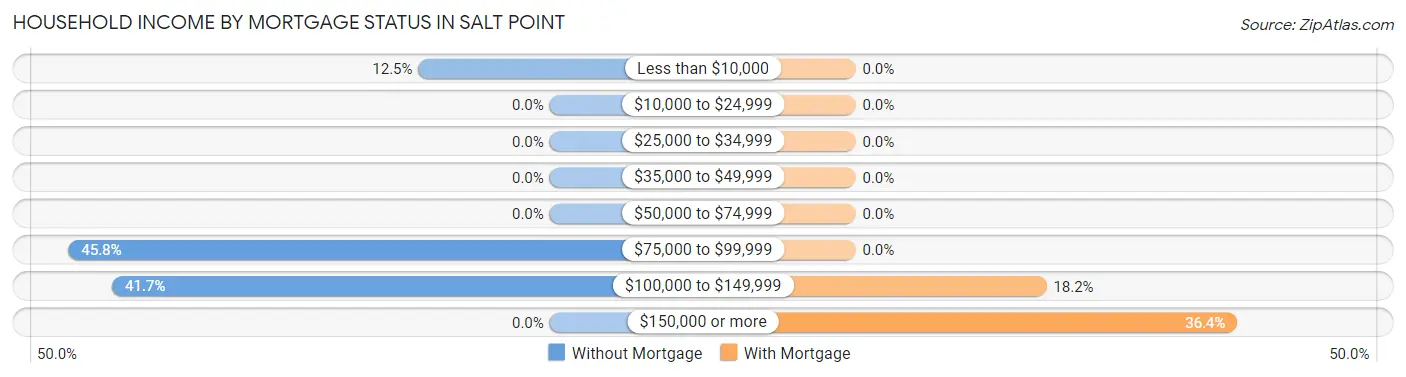
| Household Income | Without Mortgage | With Mortgage |
| Less than $10,000 | 6 (12.5%) | 0 (0.0%) |
| $10,000 to $24,999 | 0 (0.0%) | 0 (0.0%) |
| $25,000 to $34,999 | 0 (0.0%) | 0 (0.0%) |
| $35,000 to $49,999 | 0 (0.0%) | 0 (0.0%) |
| $50,000 to $74,999 | 0 (0.0%) | 0 (0.0%) |
| $75,000 to $99,999 | 22 (45.8%) | 0 (0.0%) |
| $100,000 to $149,999 | 20 (41.7%) | 6 (18.2%) |
| $150,000 or more | 0 (0.0%) | 12 (36.4%) |
| Total | 48 (100.0%) | 33 (100.0%) |
Property Value to Household Income Ratio in Salt Point
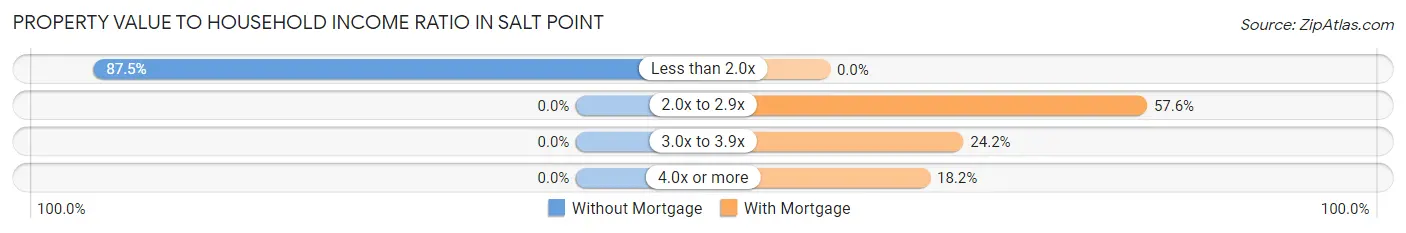
| Value-to-Income Ratio | Without Mortgage | With Mortgage |
| Less than 2.0x | 42 (87.5%) | 0 (0.0%) |
| 2.0x to 2.9x | 0 (0.0%) | 19 (57.6%) |
| 3.0x to 3.9x | 0 (0.0%) | 8 (24.2%) |
| 4.0x or more | 0 (0.0%) | 6 (18.2%) |
| Total | 48 (100.0%) | 33 (100.0%) |
Real Estate Taxes by Mortgage Status in Salt Point
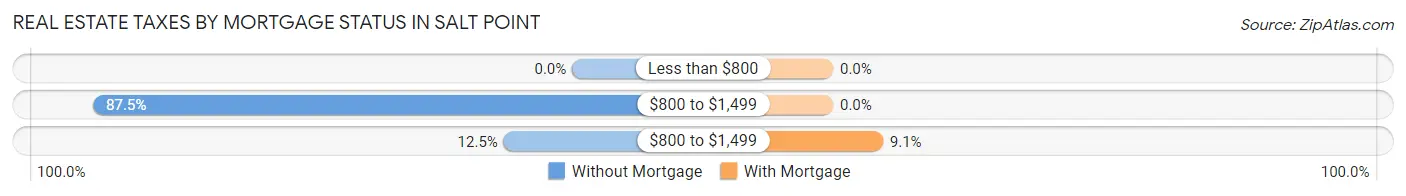
| Property Taxes | Without Mortgage | With Mortgage |
| Less than $800 | 0 (0.0%) | 0 (0.0%) |
| $800 to $1,499 | 42 (87.5%) | 0 (0.0%) |
| $800 to $1,499 | 6 (12.5%) | 3 (9.1%) |
| Total | 48 (100.0%) | 33 (100.0%) |
Health & Disability in Salt Point
Health Insurance Coverage by Age in Salt Point
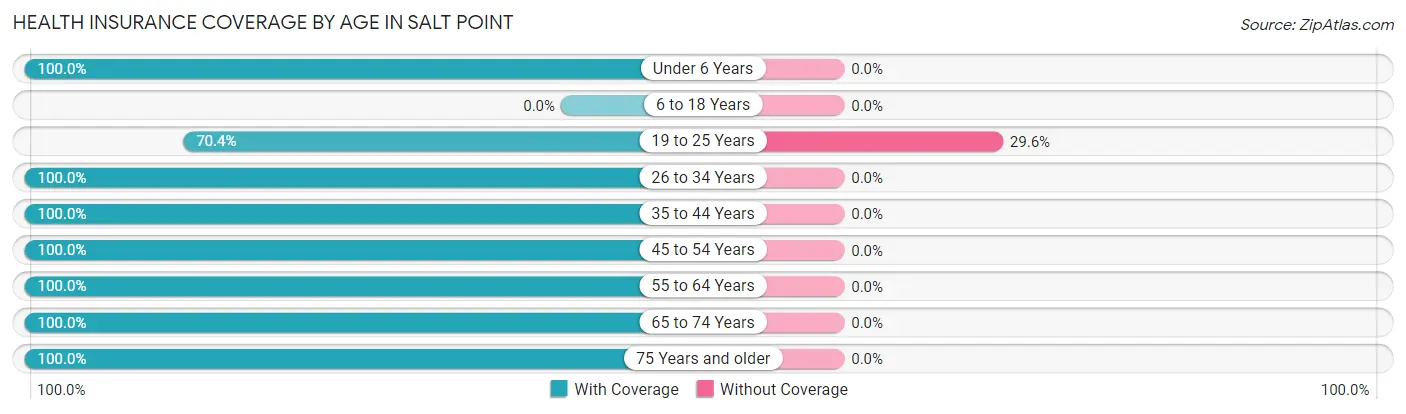
| Age Bracket | With Coverage | Without Coverage |
| Under 6 Years | 5 (100.0%) | 0 (0.0%) |
| 6 to 18 Years | 0 (0.0%) | 0 (0.0%) |
| 19 to 25 Years | 50 (70.4%) | 21 (29.6%) |
| 26 to 34 Years | 74 (100.0%) | 0 (0.0%) |
| 35 to 44 Years | 34 (100.0%) | 0 (0.0%) |
| 45 to 54 Years | 28 (100.0%) | 0 (0.0%) |
| 55 to 64 Years | 61 (100.0%) | 0 (0.0%) |
| 65 to 74 Years | 21 (100.0%) | 0 (0.0%) |
| 75 Years and older | 12 (100.0%) | 0 (0.0%) |
| Total | 285 (93.1%) | 21 (6.9%) |
Health Insurance Coverage by Citizenship Status in Salt Point
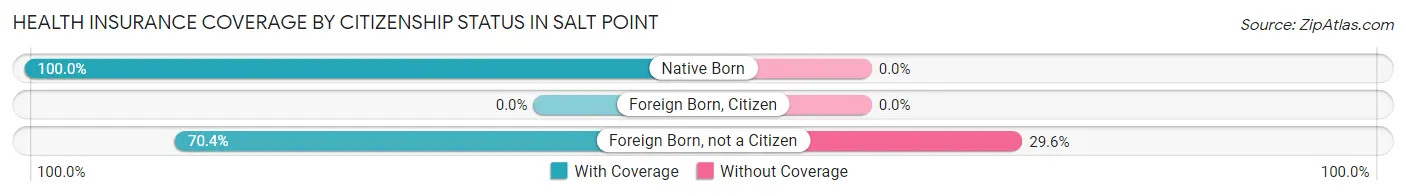
| Citizenship Status | With Coverage | Without Coverage |
| Native Born | 5 (100.0%) | 0 (0.0%) |
| Foreign Born, Citizen | 0 (0.0%) | 0 (0.0%) |
| Foreign Born, not a Citizen | 50 (70.4%) | 21 (29.6%) |
Health Insurance Coverage by Household Income in Salt Point
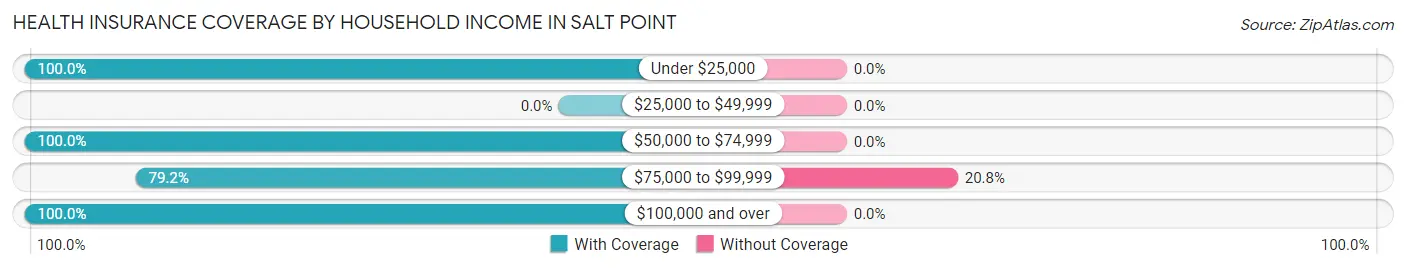
| Household Income | With Coverage | Without Coverage |
| Under $25,000 | 12 (100.0%) | 0 (0.0%) |
| $25,000 to $49,999 | 0 (0.0%) | 0 (0.0%) |
| $50,000 to $74,999 | 14 (100.0%) | 0 (0.0%) |
| $75,000 to $99,999 | 80 (79.2%) | 21 (20.8%) |
| $100,000 and over | 179 (100.0%) | 0 (0.0%) |
Public vs Private Health Insurance Coverage by Age in Salt Point
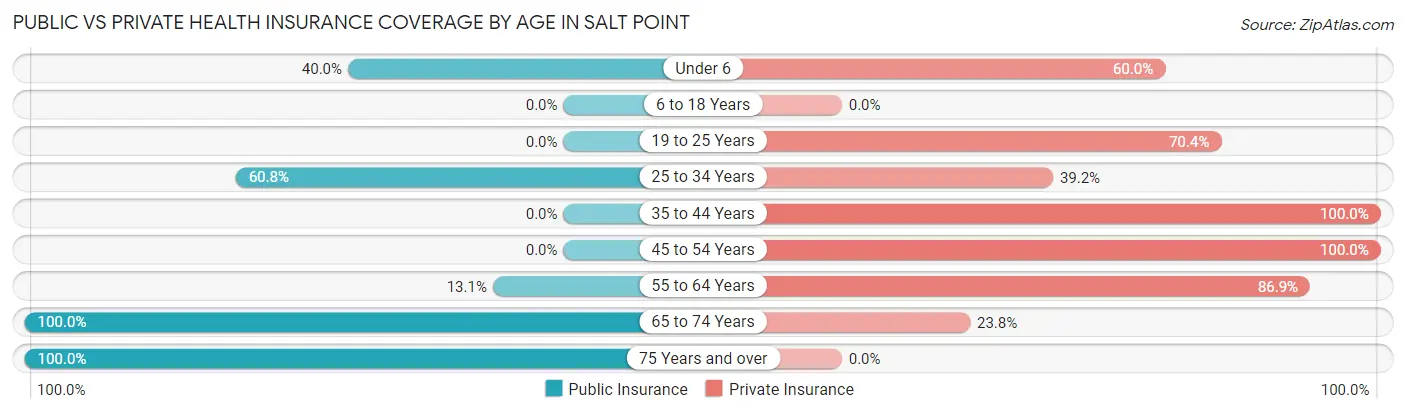
| Age Bracket | Public Insurance | Private Insurance |
| Under 6 | 2 (40.0%) | 3 (60.0%) |
| 6 to 18 Years | 0 (0.0%) | 0 (0.0%) |
| 19 to 25 Years | 0 (0.0%) | 50 (70.4%) |
| 25 to 34 Years | 45 (60.8%) | 29 (39.2%) |
| 35 to 44 Years | 0 (0.0%) | 34 (100.0%) |
| 45 to 54 Years | 0 (0.0%) | 28 (100.0%) |
| 55 to 64 Years | 8 (13.1%) | 53 (86.9%) |
| 65 to 74 Years | 21 (100.0%) | 5 (23.8%) |
| 75 Years and over | 12 (100.0%) | 0 (0.0%) |
| Total | 88 (28.8%) | 202 (66.0%) |
Disability Status by Sex by Age in Salt Point
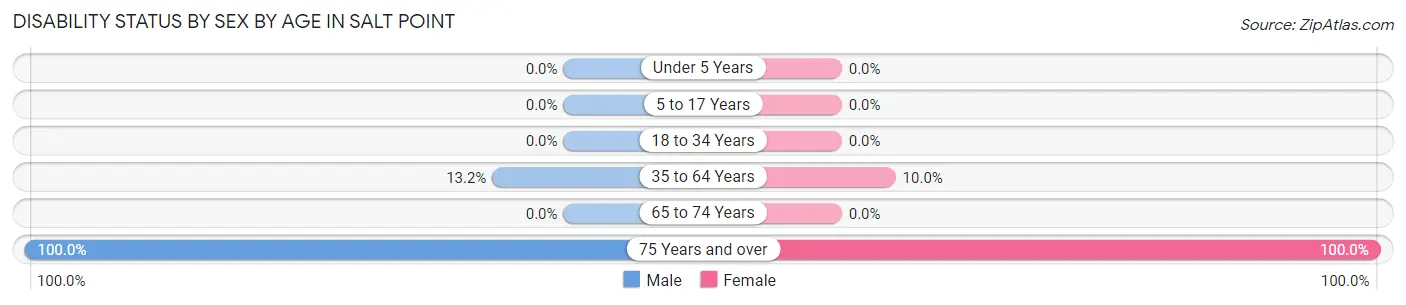
| Age Bracket | Male | Female |
| Under 5 Years | 0 (0.0%) | 0 (0.0%) |
| 5 to 17 Years | 0 (0.0%) | 0 (0.0%) |
| 18 to 34 Years | 0 (0.0%) | 0 (0.0%) |
| 35 to 64 Years | 7 (13.2%) | 7 (10.0%) |
| 65 to 74 Years | 0 (0.0%) | 0 (0.0%) |
| 75 Years and over | 6 (100.0%) | 6 (100.0%) |
Disability Class by Sex by Age in Salt Point
Disability Class: Hearing Difficulty
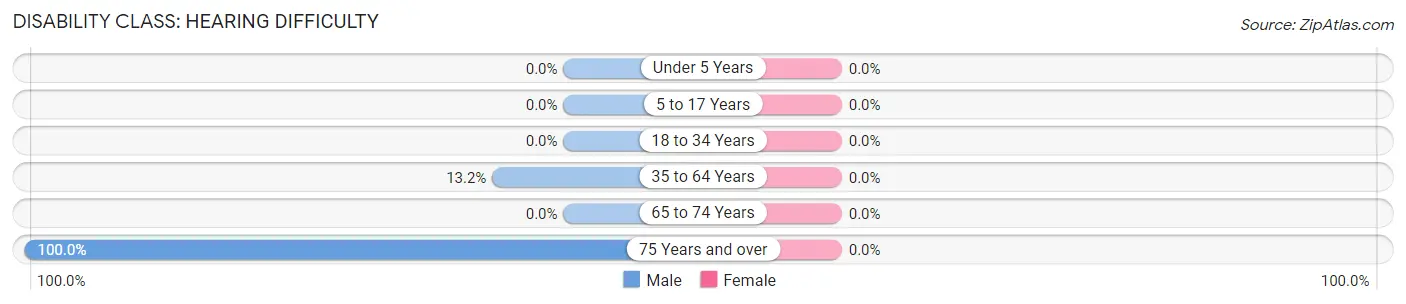
| Age Bracket | Male | Female |
| Under 5 Years | 0 (0.0%) | 0 (0.0%) |
| 5 to 17 Years | 0 (0.0%) | 0 (0.0%) |
| 18 to 34 Years | 0 (0.0%) | 0 (0.0%) |
| 35 to 64 Years | 7 (13.2%) | 0 (0.0%) |
| 65 to 74 Years | 0 (0.0%) | 0 (0.0%) |
| 75 Years and over | 6 (100.0%) | 0 (0.0%) |
Disability Class: Vision Difficulty
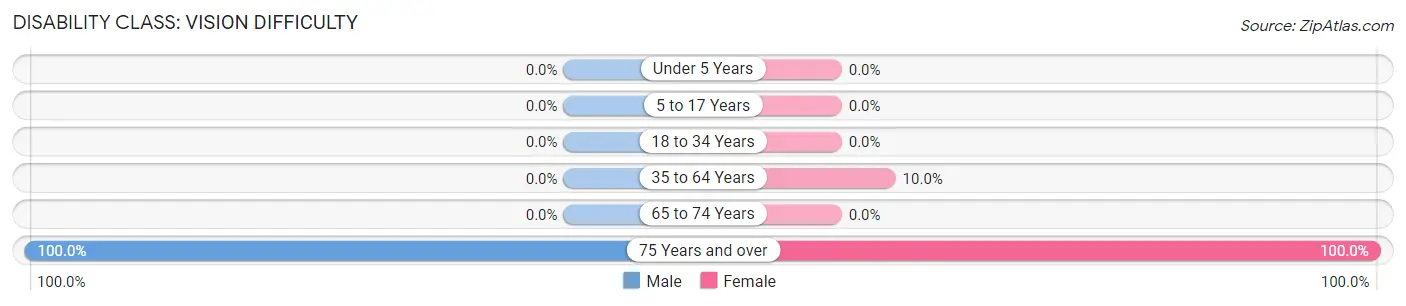
| Age Bracket | Male | Female |
| Under 5 Years | 0 (0.0%) | 0 (0.0%) |
| 5 to 17 Years | 0 (0.0%) | 0 (0.0%) |
| 18 to 34 Years | 0 (0.0%) | 0 (0.0%) |
| 35 to 64 Years | 0 (0.0%) | 7 (10.0%) |
| 65 to 74 Years | 0 (0.0%) | 0 (0.0%) |
| 75 Years and over | 6 (100.0%) | 6 (100.0%) |
Disability Class: Cognitive Difficulty
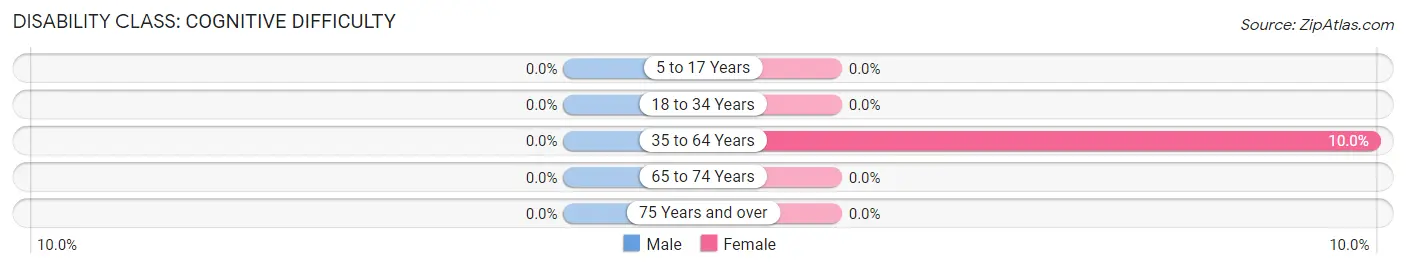
| Age Bracket | Male | Female |
| 5 to 17 Years | 0 (0.0%) | 0 (0.0%) |
| 18 to 34 Years | 0 (0.0%) | 0 (0.0%) |
| 35 to 64 Years | 0 (0.0%) | 7 (10.0%) |
| 65 to 74 Years | 0 (0.0%) | 0 (0.0%) |
| 75 Years and over | 0 (0.0%) | 0 (0.0%) |
Disability Class: Ambulatory Difficulty
| Age Bracket | Male | Female |
| 5 to 17 Years | 0 (0.0%) | 0 (0.0%) |
| 18 to 34 Years | 0 (0.0%) | 0 (0.0%) |
| 35 to 64 Years | 0 (0.0%) | 0 (0.0%) |
| 65 to 74 Years | 0 (0.0%) | 0 (0.0%) |
| 75 Years and over | 0 (0.0%) | 0 (0.0%) |
Disability Class: Self-Care Difficulty
| Age Bracket | Male | Female |
| 5 to 17 Years | 0 (0.0%) | 0 (0.0%) |
| 18 to 34 Years | 0 (0.0%) | 0 (0.0%) |
| 35 to 64 Years | 0 (0.0%) | 0 (0.0%) |
| 65 to 74 Years | 0 (0.0%) | 0 (0.0%) |
| 75 Years and over | 0 (0.0%) | 0 (0.0%) |
Technology Access in Salt Point
Computing Device Access in Salt Point
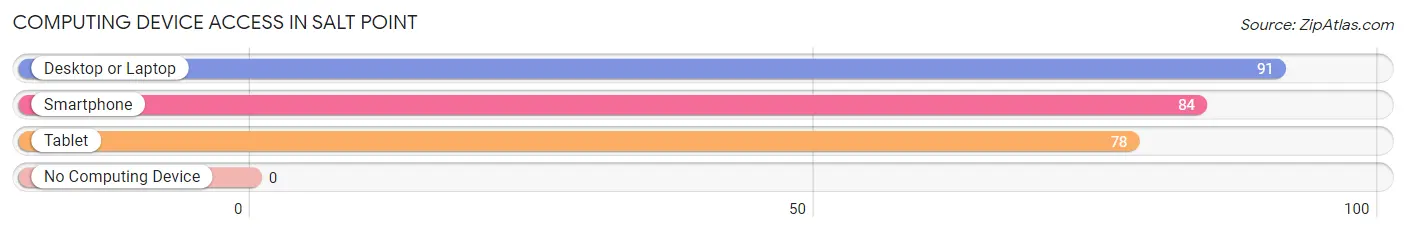
| Device Type | # Households | % Households |
| Desktop or Laptop | 91 | 100.0% |
| Smartphone | 84 | 92.3% |
| Tablet | 78 | 85.7% |
| No Computing Device | 0 | 0.0% |
| Total | 91 | 100.0% |
Internet Access in Salt Point
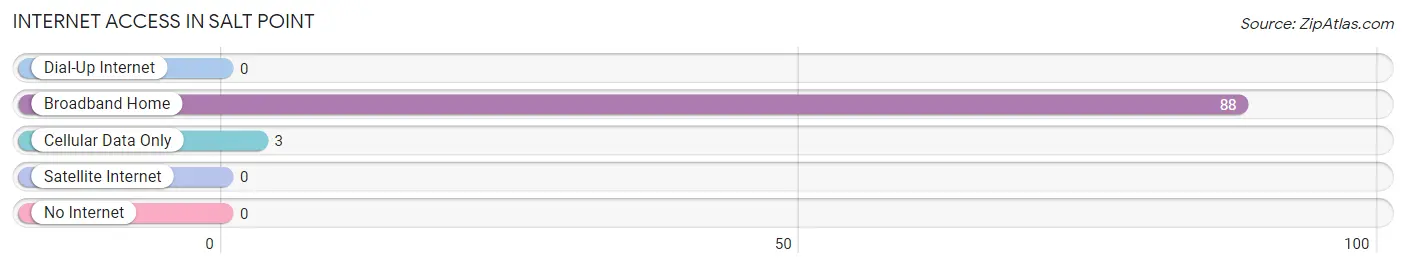
| Internet Type | # Households | % Households |
| Dial-Up Internet | 0 | 0.0% |
| Broadband Home | 88 | 96.7% |
| Cellular Data Only | 3 | 3.3% |
| Satellite Internet | 0 | 0.0% |
| No Internet | 0 | 0.0% |
| Total | 91 | 100.0% |
Salt Point Summary
History
Salt Point is a small hamlet located in the town of Clinton, Dutchess County, New York. It is situated on the east bank of the Hudson River, approximately 25 miles north of New York City. The hamlet was first settled in the late 1700s by Dutch and English settlers, who named it after the salt marshes that were abundant in the area. The hamlet was originally part of the town of Rhinebeck, but was annexed by the town of Clinton in 1845.
The hamlet of Salt Point has a long and varied history. During the Revolutionary War, the hamlet was the site of a major battle between the British and American forces. The British were defeated and the hamlet was left in ruins. In the late 1800s, the hamlet was home to a thriving fishing industry, with many of the local residents making their living from the Hudson River.
In the early 1900s, the hamlet began to experience a period of growth and development. The hamlet was home to a number of businesses, including a hotel, a general store, a post office, and a blacksmith shop. The hamlet also had a number of churches, including the First Presbyterian Church of Salt Point, which was founded in 1845.
In the mid-1900s, the hamlet experienced a period of decline. Many of the businesses closed and the population began to decline. In the late 1900s, the hamlet began to experience a period of revitalization. The hamlet is now home to a number of businesses, including a restaurant, a bakery, and a winery.
Geography
Salt Point is located in the town of Clinton, Dutchess County, New York. It is situated on the east bank of the Hudson River, approximately 25 miles north of New York City. The hamlet is bordered by the towns of Rhinebeck to the north, Hyde Park to the east, and Pleasant Valley to the south. The hamlet is located in the Hudson Valley region of New York State, which is known for its rolling hills, lush forests, and picturesque views of the Hudson River.
The hamlet of Salt Point is located in a rural area, with a population of approximately 1,000 people. The hamlet is home to a number of small businesses, including a restaurant, a bakery, and a winery. The hamlet is also home to a number of historic sites, including the First Presbyterian Church of Salt Point, which was founded in 1845.
Economy
The economy of Salt Point is largely based on tourism and agriculture. The hamlet is home to a number of small businesses, including a restaurant, a bakery, and a winery. The hamlet is also home to a number of historic sites, including the First Presbyterian Church of Salt Point, which was founded in 1845.
The hamlet is also home to a number of farms, which produce a variety of crops, including apples, peaches, and strawberries. The hamlet is also home to a number of wineries, which produce a variety of wines, including Riesling, Chardonnay, and Cabernet Sauvignon.
Demographics
As of the 2010 census, the population of Salt Point was 1,000 people. The racial makeup of the hamlet was 97.2% White, 0.7% African American, 0.2% Native American, 0.2% Asian, 0.2% from other races, and 1.7% from two or more races. Hispanic or Latino of any race were 1.7% of the population.
The median income for a household in the hamlet was $50,000, and the median income for a family was $60,000. The per capita income for the hamlet was $25,000. About 8.3% of families and 10.3% of the population were below the poverty line, including 14.3% of those under age 18 and 5.3% of those age 65 or over.
Common Questions
What is the Total Population of Salt Point?
Total Population of Salt Point is 306.
What is the Total Male Population of Salt Point?
Total Male Population of Salt Point is 155.
What is the Total Female Population of Salt Point?
Total Female Population of Salt Point is 151.
What is the Ratio of Males per 100 Females in Salt Point?
There are 102.65 Males per 100 Females in Salt Point.
What is the Ratio of Females per 100 Males in Salt Point?
There are 97.42 Females per 100 Males in Salt Point.
What is the Median Population Age in Salt Point?
Median Population Age in Salt Point is 35.4 Years.
What is the Average Family Size in Salt Point
Average Family Size in Salt Point is 2.8 People.
What is the Average Household Size in Salt Point
Average Household Size in Salt Point is 3.4 People.
What is Per Capita Income in Salt Point?
Per Capita income in Salt Point is $34,333.
What is the Median Family Income in Salt Point?
Median Family Income in Salt Point is $96,932.
What is the Median Household income in Salt Point?
Median Household Income in Salt Point is $103,438.
What is Income or Wage Gap in Salt Point?
Income or Wage Gap in Salt Point is 12.3%.
Women in Salt Point earn 87.7 cents for every dollar earned by a man.
What is Inequality or Gini Index in Salt Point?
Inequality or Gini Index in Salt Point is 0.22.
How Large is the Labor Force in Salt Point?
There are 222 People in the Labor Forcein in Salt Point.
What is the Percentage of People in the Labor Force in Salt Point?
73.8% of People are in the Labor Force in Salt Point.
What is the Unemployment Rate in Salt Point?
Unemployment Rate in Salt Point is 9.5%.