Salem, NY
Salem Map
Salem Overview
854
TOTAL POPULATION
378
MALE POPULATION
476
FEMALE POPULATION
79.41
MALES / 100 FEMALES
125.93
FEMALES / 100 MALES
47.5
MEDIAN AGE
3.2
AVG FAMILY SIZE
2.3
AVG HOUSEHOLD SIZE
$41,164
PER CAPITA INCOME
$76,750
AVG FAMILY INCOME
$75,250
AVG HOUSEHOLD INCOME
48.6%
WAGE / INCOME GAP [ % ]
51.4¢/ $1
WAGE / INCOME GAP [ $ ]
0.33
INEQUALITY / GINI INDEX
535
LABOR FORCE [ PEOPLE ]
71.0%
PERCENT IN LABOR FORCE
10.7%
UNEMPLOYMENT RATE
Salem Zip Codes
Salem Area Codes
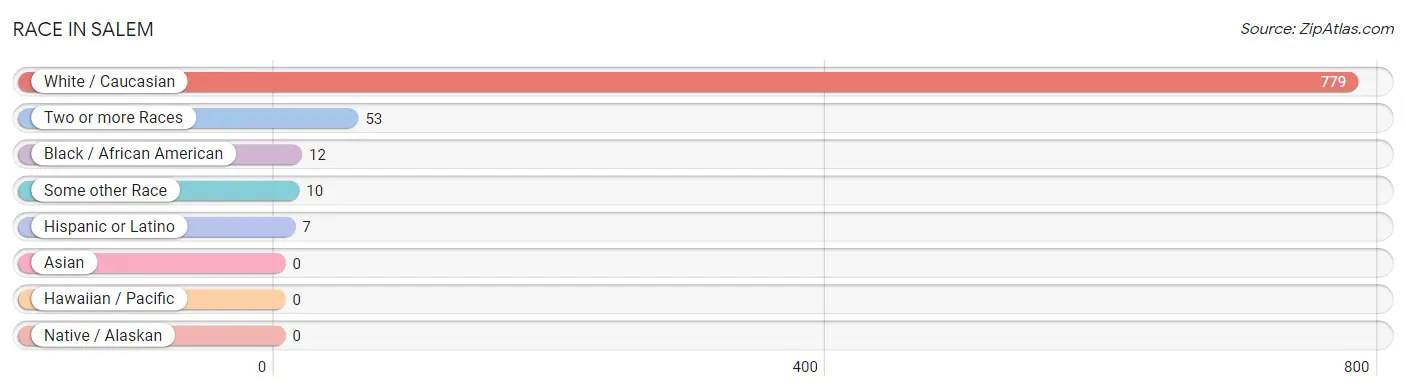
Race in Salem
The most populous races in Salem are White / Caucasian (779 | 91.2%), Two or more Races (53 | 6.2%), and Black / African American (12 | 1.4%).
| Race | # Population | % Population |
| Asian | 0 | 0.0% |
| Black / African American | 12 | 1.4% |
| Hawaiian / Pacific | 0 | 0.0% |
| Hispanic or Latino | 7 | 0.8% |
| Native / Alaskan | 0 | 0.0% |
| White / Caucasian | 779 | 91.2% |
| Two or more Races | 53 | 6.2% |
| Some other Race | 10 | 1.2% |
| Total | 854 | 100.0% |
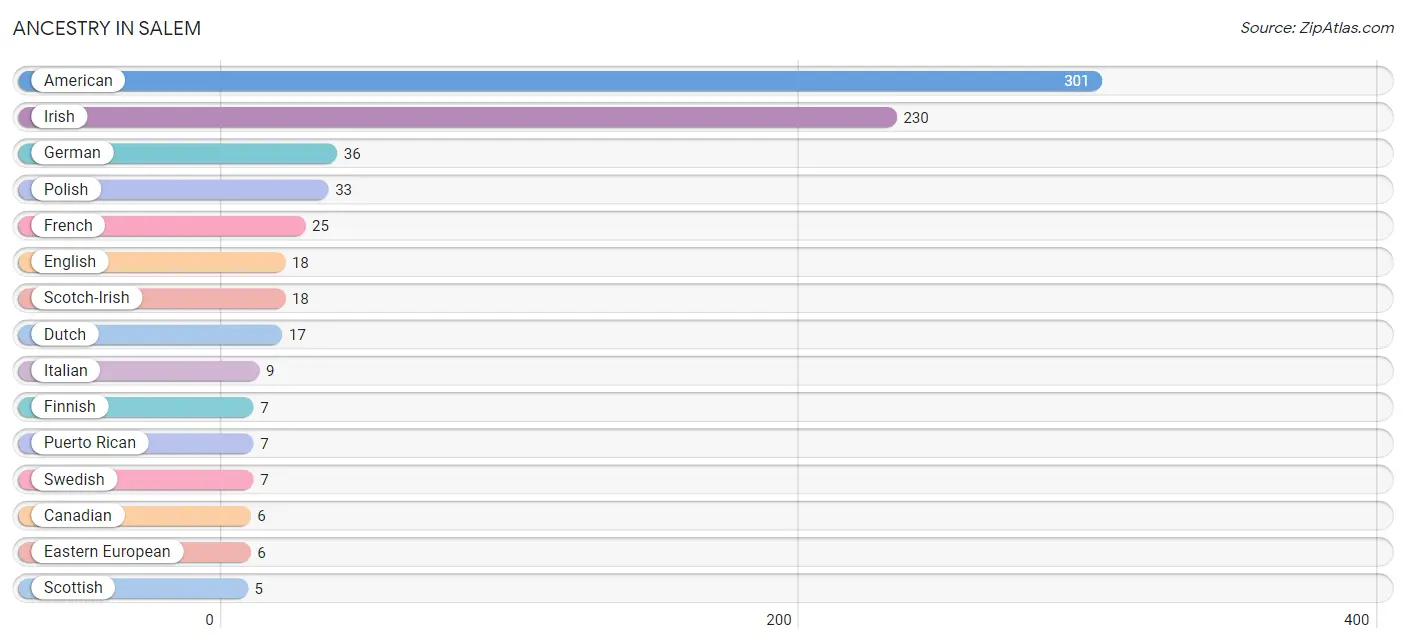
Ancestry in Salem
The most populous ancestries reported in Salem are American (301 | 35.2%), Irish (230 | 26.9%), German (36 | 4.2%), Polish (33 | 3.9%), and French (25 | 2.9%), together accounting for 73.2% of all Salem residents.
| Ancestry | # Population | % Population |
| American | 301 | 35.2% |
| Blackfeet | 1 | 0.1% |
| Canadian | 6 | 0.7% |
| Dutch | 17 | 2.0% |
| Eastern European | 6 | 0.7% |
| English | 18 | 2.1% |
| Finnish | 7 | 0.8% |
| French | 25 | 2.9% |
| French Canadian | 4 | 0.5% |
| German | 36 | 4.2% |
| Irish | 230 | 26.9% |
| Italian | 9 | 1.1% |
| Polish | 33 | 3.9% |
| Puerto Rican | 7 | 0.8% |
| Scotch-Irish | 18 | 2.1% |
| Scottish | 5 | 0.6% |
| Swedish | 7 | 0.8% |
| Welsh | 4 | 0.5% | View All 18 Rows |
Immigrants in Salem

| Immigration Origin | # Population | % Population | View All 0 Rows |
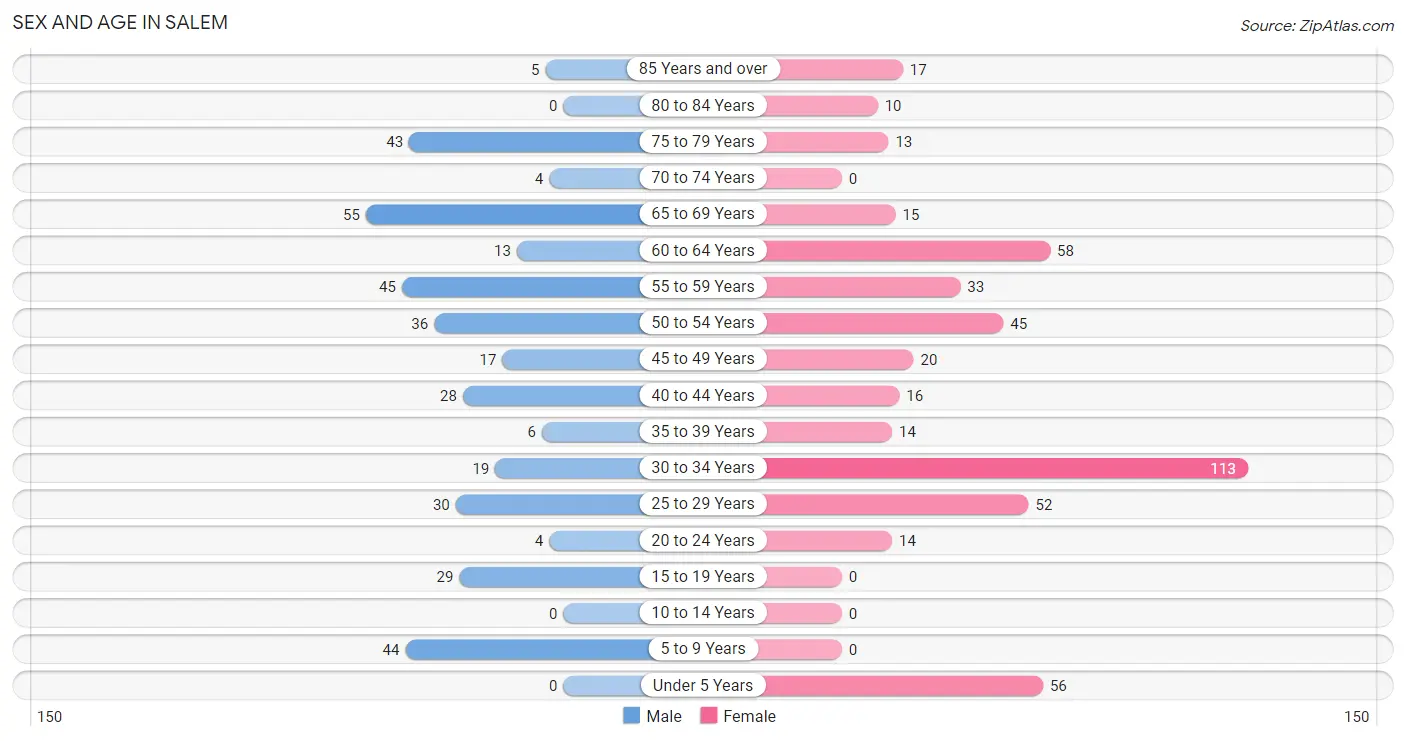
Sex and Age in Salem
Sex and Age in Salem
The most populous age groups in Salem are 65 to 69 Years (55 | 14.5%) for men and 30 to 34 Years (113 | 23.7%) for women.
| Age Bracket | Male | Female |
| Under 5 Years | 0 (0.0%) | 56 (11.8%) |
| 5 to 9 Years | 44 (11.6%) | 0 (0.0%) |
| 10 to 14 Years | 0 (0.0%) | 0 (0.0%) |
| 15 to 19 Years | 29 (7.7%) | 0 (0.0%) |
| 20 to 24 Years | 4 (1.1%) | 14 (2.9%) |
| 25 to 29 Years | 30 (7.9%) | 52 (10.9%) |
| 30 to 34 Years | 19 (5.0%) | 113 (23.7%) |
| 35 to 39 Years | 6 (1.6%) | 14 (2.9%) |
| 40 to 44 Years | 28 (7.4%) | 16 (3.4%) |
| 45 to 49 Years | 17 (4.5%) | 20 (4.2%) |
| 50 to 54 Years | 36 (9.5%) | 45 (9.5%) |
| 55 to 59 Years | 45 (11.9%) | 33 (6.9%) |
| 60 to 64 Years | 13 (3.4%) | 58 (12.2%) |
| 65 to 69 Years | 55 (14.5%) | 15 (3.2%) |
| 70 to 74 Years | 4 (1.1%) | 0 (0.0%) |
| 75 to 79 Years | 43 (11.4%) | 13 (2.7%) |
| 80 to 84 Years | 0 (0.0%) | 10 (2.1%) |
| 85 Years and over | 5 (1.3%) | 17 (3.6%) |
| Total | 378 (100.0%) | 476 (100.0%) |
Families and Households in Salem
Median Family Size in Salem
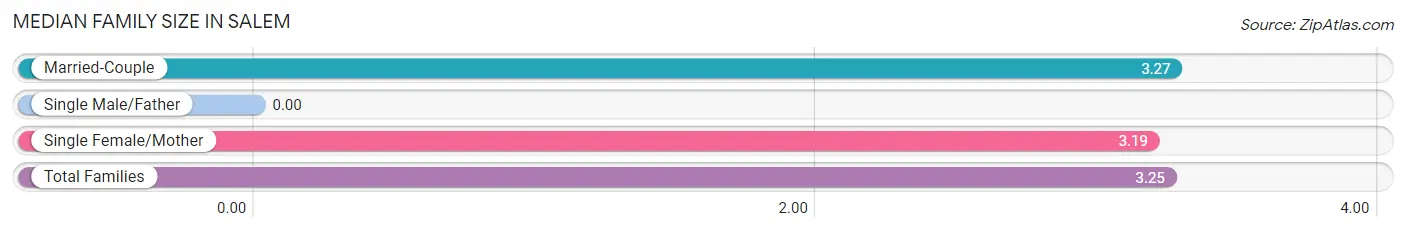
| Family Type | # Families | Family Size |
| Married-Couple | 161 (83.4%) | 3.27 |
| Single Male/Father | 0 (0.0%) | - |
| Single Female/Mother | 32 (16.6%) | 3.19 |
| Total Families | 193 (100.0%) | 3.25 |
Median Household Size in Salem
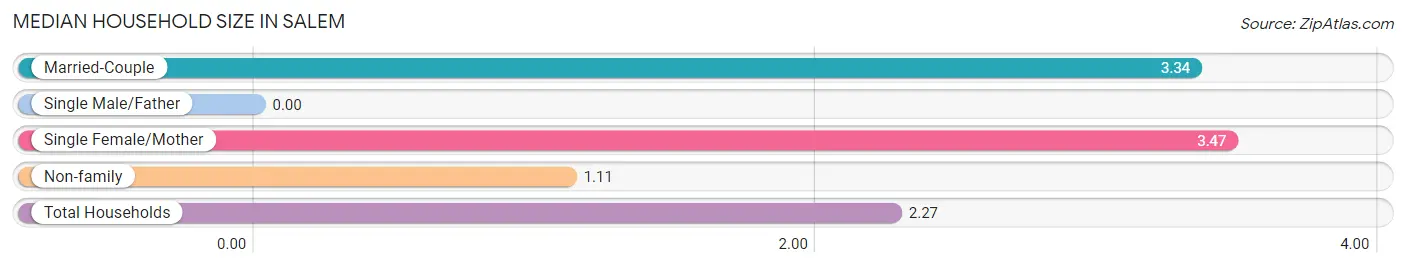
| Household Type | # Households | Household Size |
| Married-Couple | 161 (42.7%) | 3.34 |
| Single Male/Father | 0 (0.0%) | - |
| Single Female/Mother | 32 (8.5%) | 3.47 |
| Non-family | 184 (48.8%) | 1.11 |
| Total Households | 377 (100.0%) | 2.27 |
Household Size by Marriage Status in Salem
Out of a total of 377 households in Salem, 193 (51.2%) are family households, while 184 (48.8%) are nonfamily households. The most numerous type of family households are 2-person households, comprising 76, and the most common type of nonfamily households are 1-person households, comprising 166.
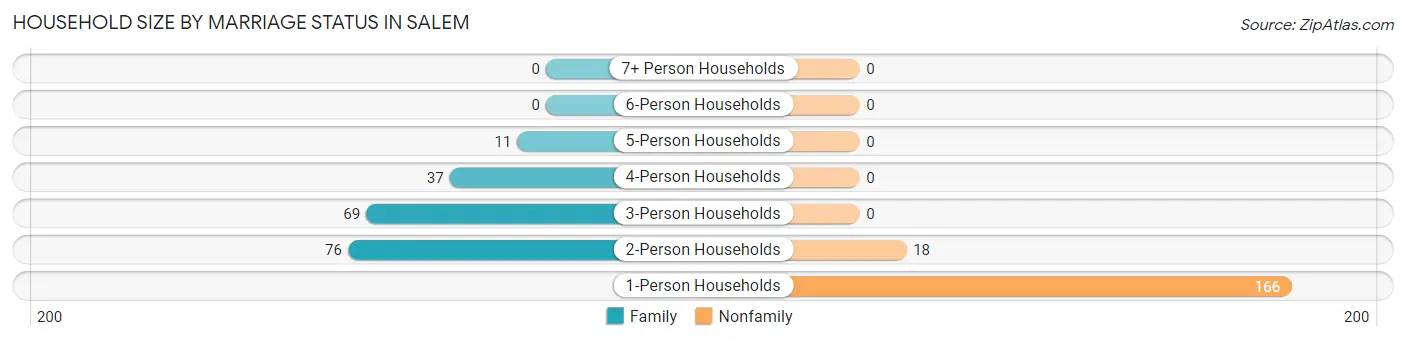
| Household Size | Family Households | Nonfamily Households |
| 1-Person Households | - | 166 (44.0%) |
| 2-Person Households | 76 (20.2%) | 18 (4.8%) |
| 3-Person Households | 69 (18.3%) | 0 (0.0%) |
| 4-Person Households | 37 (9.8%) | 0 (0.0%) |
| 5-Person Households | 11 (2.9%) | 0 (0.0%) |
| 6-Person Households | 0 (0.0%) | 0 (0.0%) |
| 7+ Person Households | 0 (0.0%) | 0 (0.0%) |
| Total | 193 (51.2%) | 184 (48.8%) |
Female Fertility in Salem
Fertility by Age in Salem
Average fertility rate in Salem is 60.0 births per 1,000 women. Women in the age bracket of 20 to 34 years have the highest fertility rate with 78.0 births per 1,000 women. Women in the age bracket of 20 to 34 years acount for 100.0% of all women with births.
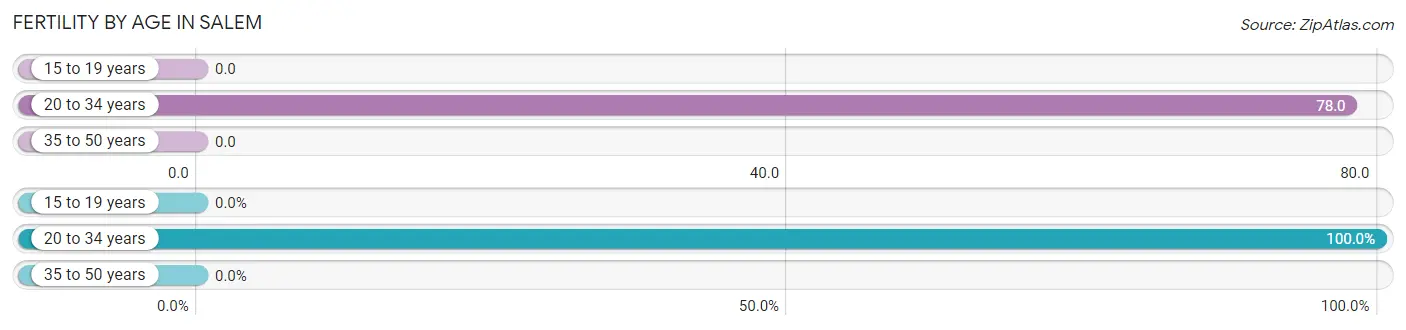
| Age Bracket | Women with Births | Births / 1,000 Women |
| 15 to 19 years | 0 (0.0%) | 0.0 |
| 20 to 34 years | 14 (100.0%) | 78.0 |
| 35 to 50 years | 0 (0.0%) | 0.0 |
| Total | 14 (100.0%) | 60.0 |
Fertility by Age by Marriage Status in Salem
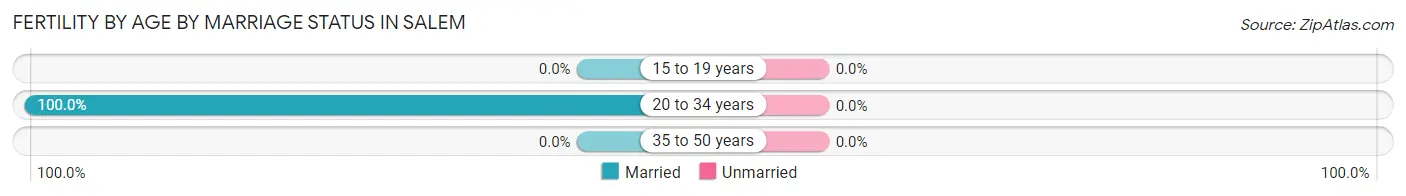
| Age Bracket | Married | Unmarried |
| 15 to 19 years | 0 (0.0%) | 0 (0.0%) |
| 20 to 34 years | 14 (100.0%) | 0 (0.0%) |
| 35 to 50 years | 0 (0.0%) | 0 (0.0%) |
| Total | 14 (100.0%) | 0 (0.0%) |
Fertility by Education in Salem
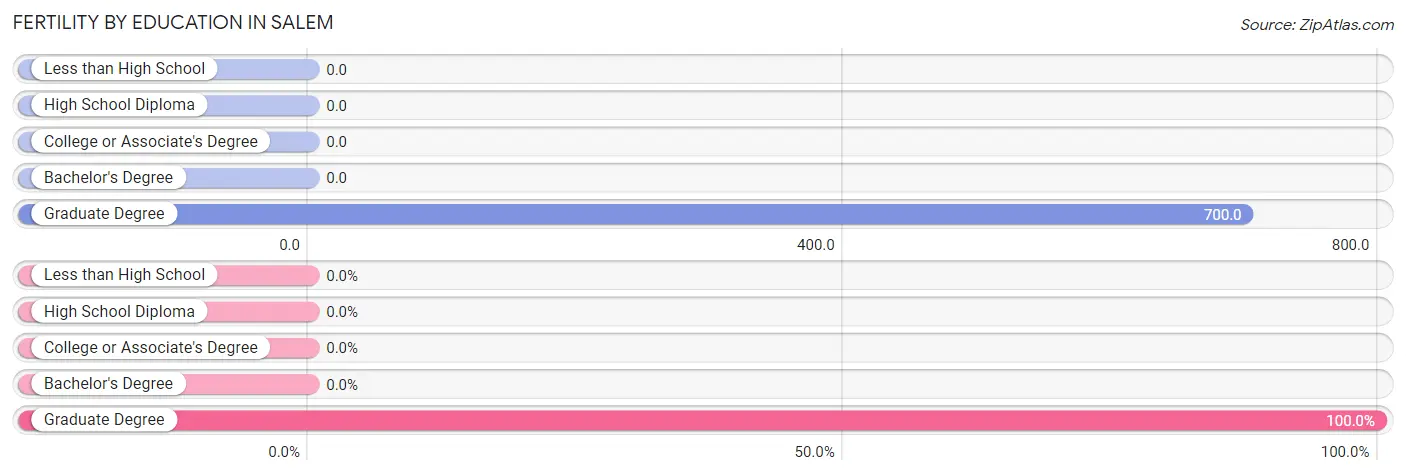
| Educational Attainment | Women with Births | Births / 1,000 Women |
| Less than High School | 0 (0.0%) | 0.0 |
| High School Diploma | 0 (0.0%) | 0.0 |
| College or Associate's Degree | 0 (0.0%) | 0.0 |
| Bachelor's Degree | 0 (0.0%) | 0.0 |
| Graduate Degree | 14 (100.0%) | 700.0 |
| Total | 14 (100.0%) | 60.0 |
Fertility by Education by Marriage Status in Salem
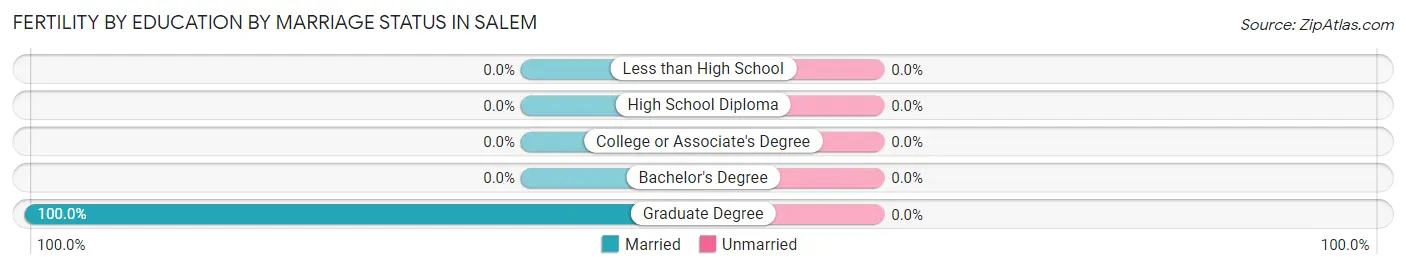
| Educational Attainment | Married | Unmarried |
| Less than High School | 0 (0.0%) | 0 (0.0%) |
| High School Diploma | 0 (0.0%) | 0 (0.0%) |
| College or Associate's Degree | 0 (0.0%) | 0 (0.0%) |
| Bachelor's Degree | 0 (0.0%) | 0 (0.0%) |
| Graduate Degree | 14 (100.0%) | 0 (0.0%) |
| Total | 14 (100.0%) | 0 (0.0%) |
Income in Salem
Income Overview in Salem
Per Capita Income in Salem is $41,164, while median incomes of families and households are $76,750 and $75,250 respectively.
| Characteristic | Number | Measure |
| Per Capita Income | 854 | $41,164 |
| Median Family Income | 193 | $76,750 |
| Mean Family Income | 193 | $96,608 |
| Median Household Income | 377 | $75,250 |
| Mean Household Income | 377 | $88,646 |
| Income Deficit | 193 | $0 |
| Wage / Income Gap (%) | 854 | 48.56% |
| Wage / Income Gap ($) | 854 | 51.44¢ per $1 |
| Gini / Inequality Index | 854 | 0.33 |
Earnings by Sex in Salem
Average Earnings in Salem are $34,621, $64,219 for men and $33,036 for women, a difference of 48.6%.
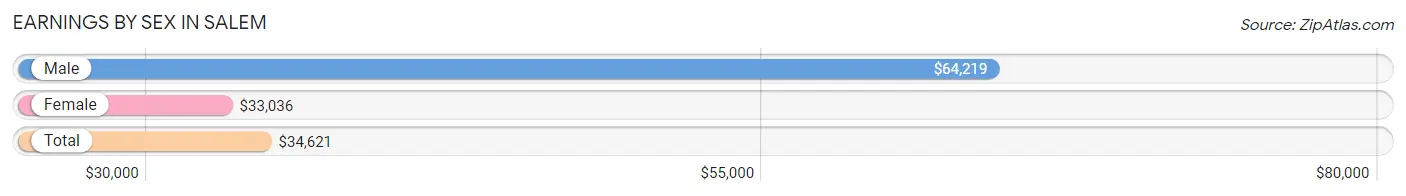
| Sex | Number | Average Earnings |
| Male | 179 (35.7%) | $64,219 |
| Female | 323 (64.3%) | $33,036 |
| Total | 502 (100.0%) | $34,621 |
Earnings by Sex by Income Bracket in Salem
The most common earnings brackets in Salem are $100,000+ for men (30 | 16.8%) and $25,000 to $29,999 for women (116 | 35.9%).
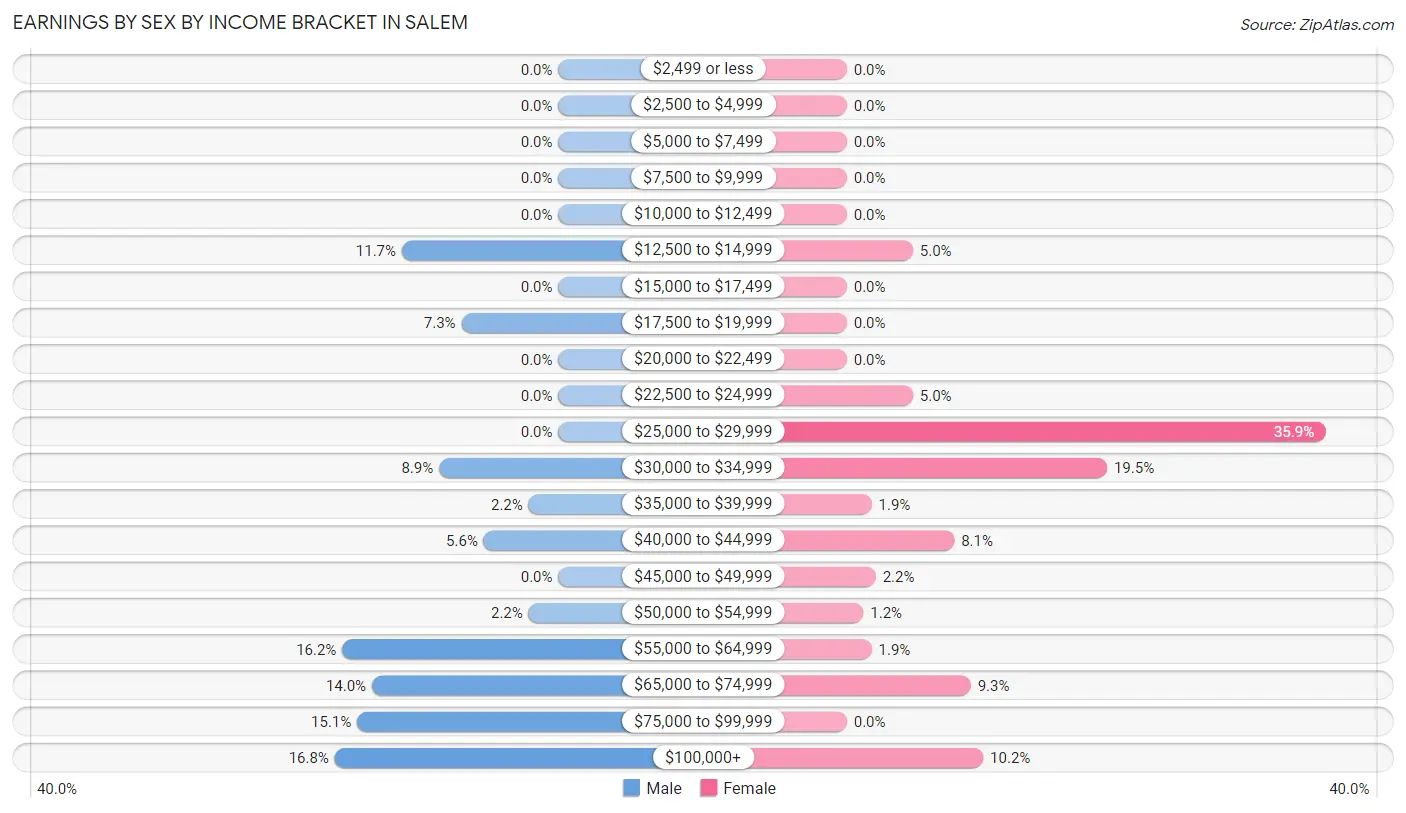
| Income | Male | Female |
| $2,499 or less | 0 (0.0%) | 0 (0.0%) |
| $2,500 to $4,999 | 0 (0.0%) | 0 (0.0%) |
| $5,000 to $7,499 | 0 (0.0%) | 0 (0.0%) |
| $7,500 to $9,999 | 0 (0.0%) | 0 (0.0%) |
| $10,000 to $12,499 | 0 (0.0%) | 0 (0.0%) |
| $12,500 to $14,999 | 21 (11.7%) | 16 (5.0%) |
| $15,000 to $17,499 | 0 (0.0%) | 0 (0.0%) |
| $17,500 to $19,999 | 13 (7.3%) | 0 (0.0%) |
| $20,000 to $22,499 | 0 (0.0%) | 0 (0.0%) |
| $22,500 to $24,999 | 0 (0.0%) | 16 (5.0%) |
| $25,000 to $29,999 | 0 (0.0%) | 116 (35.9%) |
| $30,000 to $34,999 | 16 (8.9%) | 63 (19.5%) |
| $35,000 to $39,999 | 4 (2.2%) | 6 (1.9%) |
| $40,000 to $44,999 | 10 (5.6%) | 26 (8.1%) |
| $45,000 to $49,999 | 0 (0.0%) | 7 (2.2%) |
| $50,000 to $54,999 | 4 (2.2%) | 4 (1.2%) |
| $55,000 to $64,999 | 29 (16.2%) | 6 (1.9%) |
| $65,000 to $74,999 | 25 (14.0%) | 30 (9.3%) |
| $75,000 to $99,999 | 27 (15.1%) | 0 (0.0%) |
| $100,000+ | 30 (16.8%) | 33 (10.2%) |
| Total | 179 (100.0%) | 323 (100.0%) |
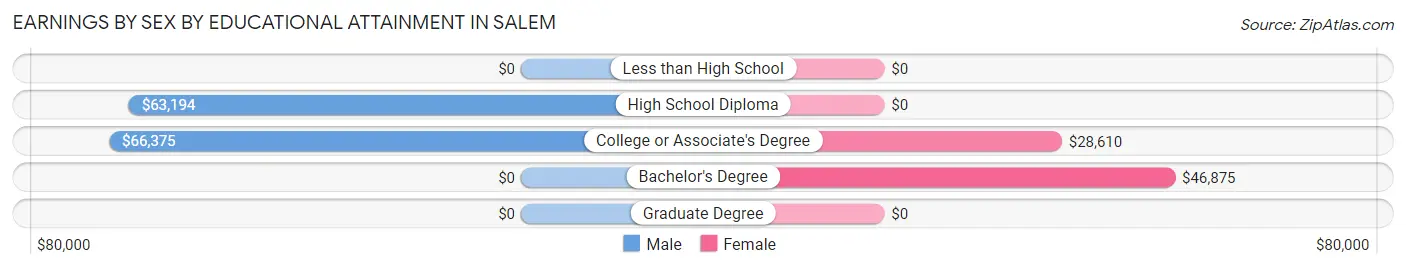
Earnings by Sex by Educational Attainment in Salem
Average earnings in Salem are $64,427 for men and $32,758 for women, a difference of 49.1%. Men with an educational attainment of college or associate's degree enjoy the highest average annual earnings of $66,375, while those with high school diploma education earn the least with $63,194. Women with an educational attainment of bachelor's degree earn the most with the average annual earnings of $46,875, while those with college or associate's degree education have the smallest earnings of $28,610.
| Educational Attainment | Male Income | Female Income |
| Less than High School | - | - |
| High School Diploma | $63,194 | $0 |
| College or Associate's Degree | $66,375 | $28,610 |
| Bachelor's Degree | - | - |
| Graduate Degree | - | - |
| Total | $64,427 | $32,758 |
Family Income in Salem
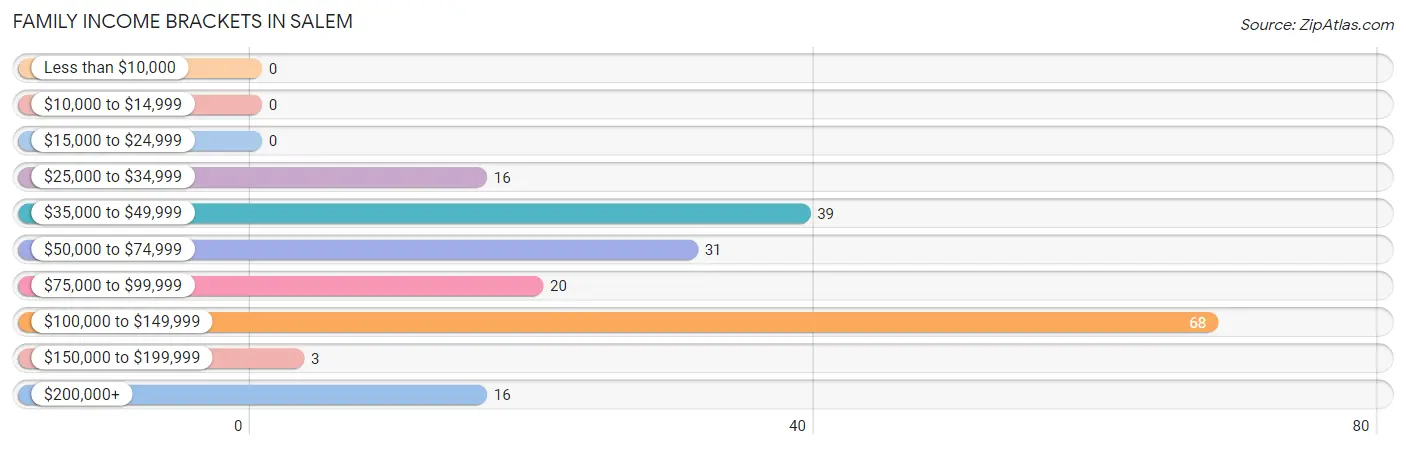
Family Income Brackets in Salem
According to the Salem family income data, there are 68 families falling into the $100,000 to $149,999 income range, which is the most common income bracket and makes up 35.2% of all families.
| Income Bracket | # Families | % Families |
| Less than $10,000 | 0 | 0.0% |
| $10,000 to $14,999 | 0 | 0.0% |
| $15,000 to $24,999 | 0 | 0.0% |
| $25,000 to $34,999 | 16 | 8.3% |
| $35,000 to $49,999 | 39 | 20.2% |
| $50,000 to $74,999 | 31 | 16.1% |
| $75,000 to $99,999 | 20 | 10.4% |
| $100,000 to $149,999 | 68 | 35.2% |
| $150,000 to $199,999 | 3 | 1.6% |
| $200,000+ | 16 | 8.3% |
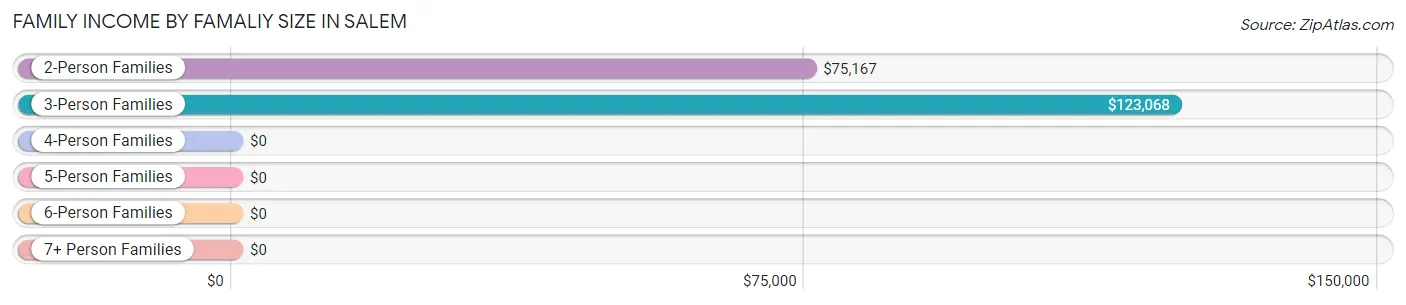
Family Income by Famaliy Size in Salem
3-person families (84 | 43.5%) account for the highest median family income in Salem with $123,068 per family, while 3-person families (84 | 43.5%) have the highest median income of $41,023 per family member.
| Income Bracket | # Families | Median Income |
| 2-Person Families | 76 (39.4%) | $75,167 |
| 3-Person Families | 84 (43.5%) | $123,068 |
| 4-Person Families | 27 (14.0%) | $0 |
| 5-Person Families | 6 (3.1%) | $0 |
| 6-Person Families | 0 (0.0%) | $0 |
| 7+ Person Families | 0 (0.0%) | $0 |
| Total | 193 (100.0%) | $76,750 |
Family Income by Number of Earners in Salem
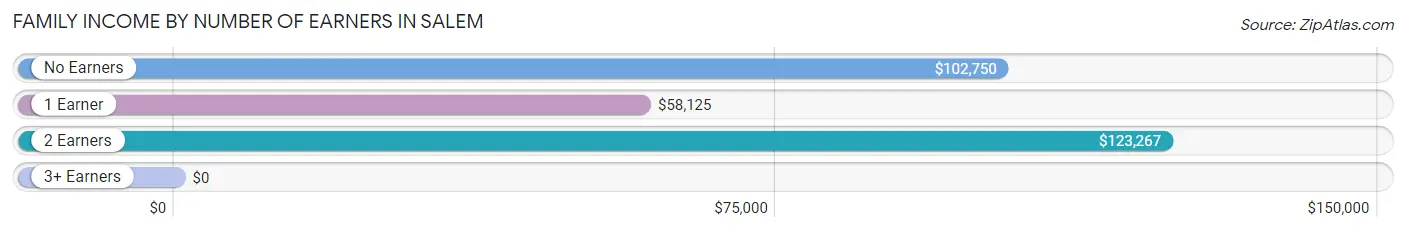
| Number of Earners | # Families | Median Income |
| No Earners | 21 (10.9%) | $102,750 |
| 1 Earner | 80 (41.4%) | $58,125 |
| 2 Earners | 79 (40.9%) | $123,267 |
| 3+ Earners | 13 (6.7%) | $0 |
| Total | 193 (100.0%) | $76,750 |
Household Income in Salem
Household Income Brackets in Salem
With 116 households falling in the category, the $100,000 to $149,999 income range is the most frequent in Salem, accounting for 30.8% of all households.
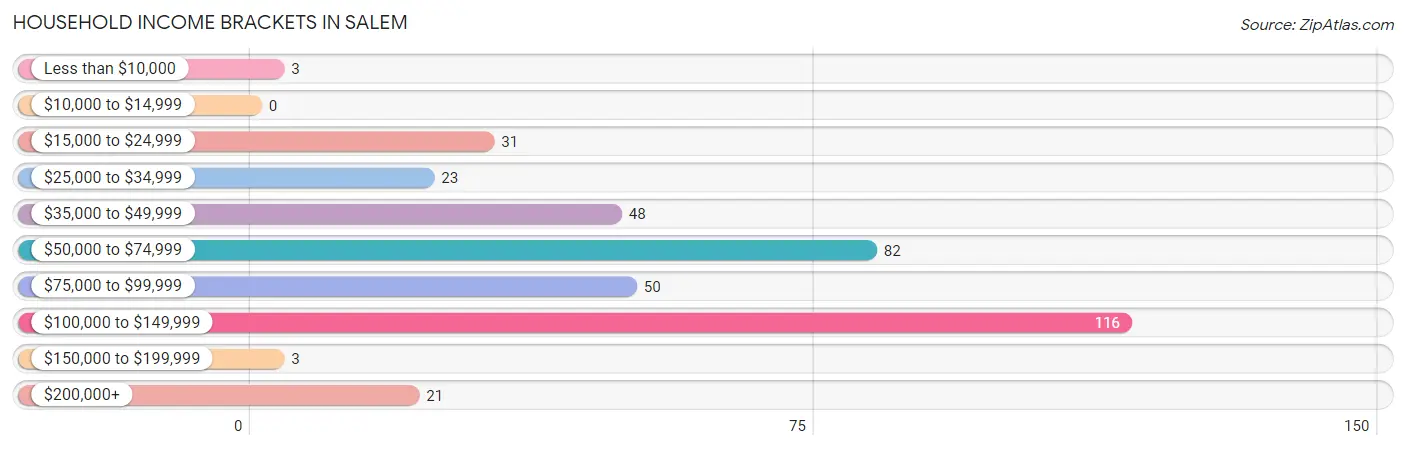
| Income Bracket | # Households | % Households |
| Less than $10,000 | 3 | 0.8% |
| $10,000 to $14,999 | 0 | 0.0% |
| $15,000 to $24,999 | 31 | 8.2% |
| $25,000 to $34,999 | 23 | 6.1% |
| $35,000 to $49,999 | 48 | 12.7% |
| $50,000 to $74,999 | 82 | 21.8% |
| $75,000 to $99,999 | 50 | 13.3% |
| $100,000 to $149,999 | 116 | 30.8% |
| $150,000 to $199,999 | 3 | 0.8% |
| $200,000+ | 21 | 5.6% |
Household Income by Householder Age in Salem
The median household income in Salem is $75,250, with the highest median household income of $81,316 found in the 45 to 64 years age bracket for the primary householder. A total of 152 households (40.3%) fall into this category.
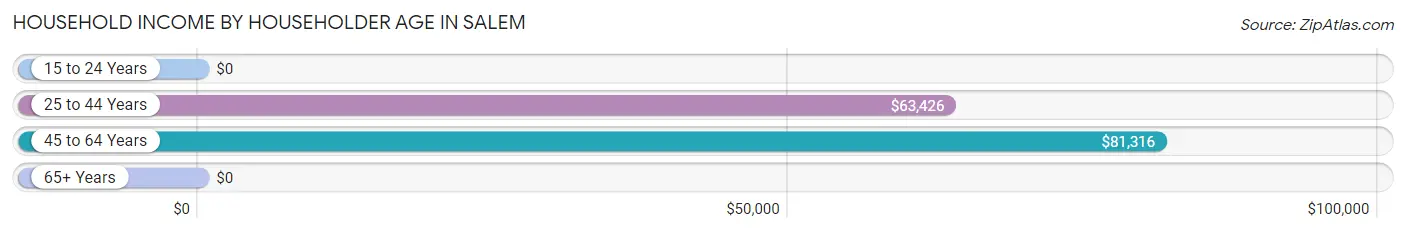
| Income Bracket | # Households | Median Income |
| 15 to 24 Years | 0 (0.0%) | $0 |
| 25 to 44 Years | 112 (29.7%) | $63,426 |
| 45 to 64 Years | 152 (40.3%) | $81,316 |
| 65+ Years | 113 (30.0%) | $0 |
| Total | 377 (100.0%) | $75,250 |
Poverty in Salem
Income Below Poverty by Sex and Age in Salem
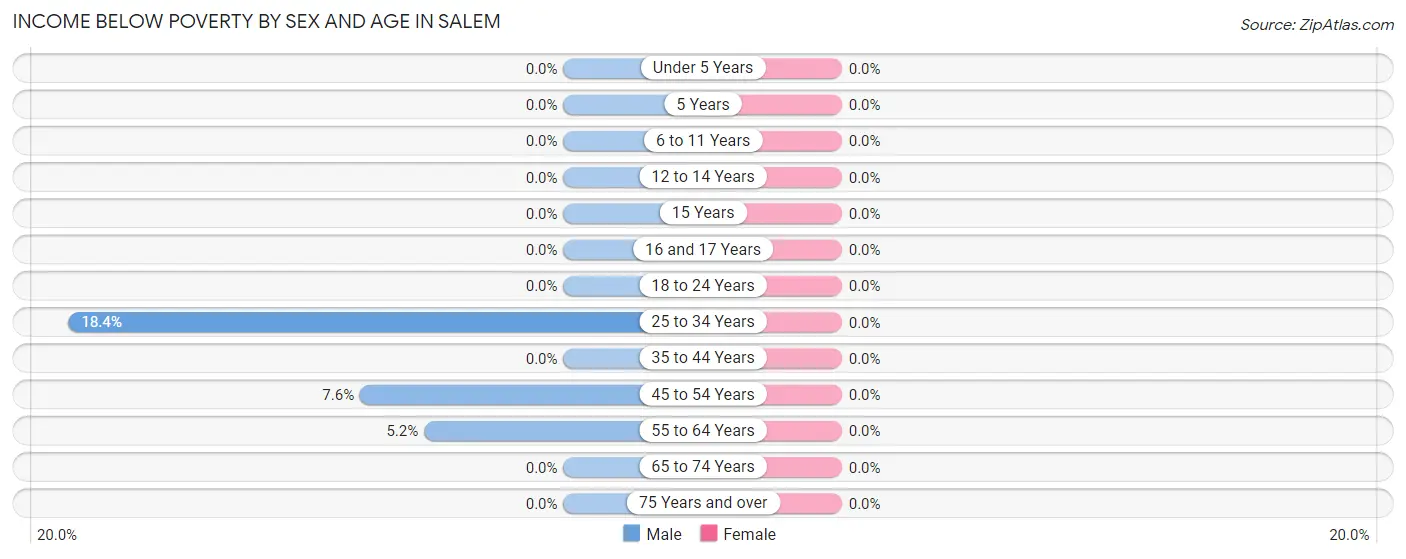
| Age Bracket | Male | Female |
| Under 5 Years | 0 (0.0%) | 0 (0.0%) |
| 5 Years | 0 (0.0%) | 0 (0.0%) |
| 6 to 11 Years | 0 (0.0%) | 0 (0.0%) |
| 12 to 14 Years | 0 (0.0%) | 0 (0.0%) |
| 15 Years | 0 (0.0%) | 0 (0.0%) |
| 16 and 17 Years | 0 (0.0%) | 0 (0.0%) |
| 18 to 24 Years | 0 (0.0%) | 0 (0.0%) |
| 25 to 34 Years | 9 (18.4%) | 0 (0.0%) |
| 35 to 44 Years | 0 (0.0%) | 0 (0.0%) |
| 45 to 54 Years | 4 (7.5%) | 0 (0.0%) |
| 55 to 64 Years | 3 (5.2%) | 0 (0.0%) |
| 65 to 74 Years | 0 (0.0%) | 0 (0.0%) |
| 75 Years and over | 0 (0.0%) | 0 (0.0%) |
| Total | 16 (4.2%) | 0 (0.0%) |
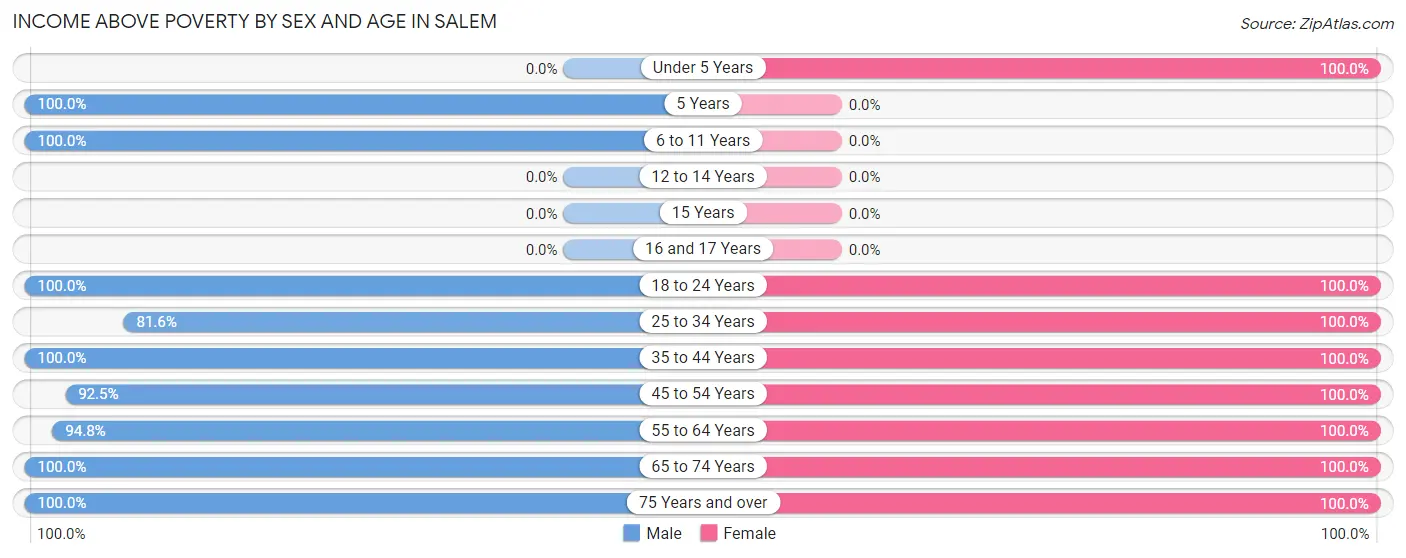
Income Above Poverty by Sex and Age in Salem
According to the poverty statistics in Salem, males aged 5 years and females aged under 5 years are the age groups that are most secure financially, with 100.0% of males and 100.0% of females in these age groups living above the poverty line.
| Age Bracket | Male | Female |
| Under 5 Years | 0 (0.0%) | 56 (100.0%) |
| 5 Years | 22 (100.0%) | 0 (0.0%) |
| 6 to 11 Years | 22 (100.0%) | 0 (0.0%) |
| 12 to 14 Years | 0 (0.0%) | 0 (0.0%) |
| 15 Years | 0 (0.0%) | 0 (0.0%) |
| 16 and 17 Years | 0 (0.0%) | 0 (0.0%) |
| 18 to 24 Years | 33 (100.0%) | 14 (100.0%) |
| 25 to 34 Years | 40 (81.6%) | 165 (100.0%) |
| 35 to 44 Years | 34 (100.0%) | 30 (100.0%) |
| 45 to 54 Years | 49 (92.4%) | 65 (100.0%) |
| 55 to 64 Years | 55 (94.8%) | 91 (100.0%) |
| 65 to 74 Years | 59 (100.0%) | 15 (100.0%) |
| 75 Years and over | 48 (100.0%) | 40 (100.0%) |
| Total | 362 (95.8%) | 476 (100.0%) |
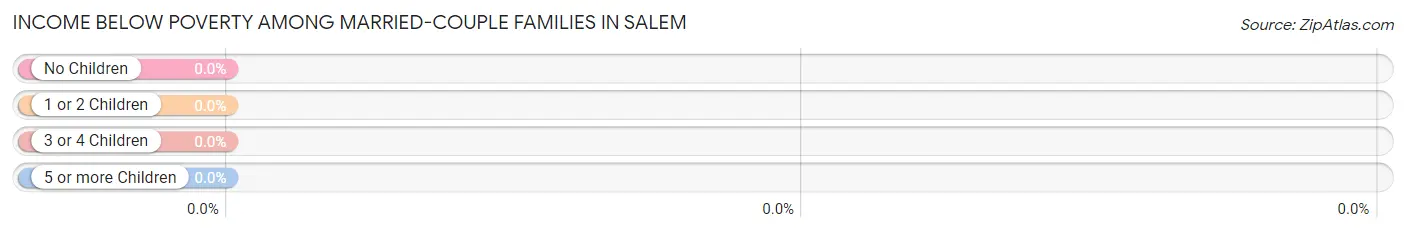
Income Below Poverty Among Married-Couple Families in Salem
| Children | Above Poverty | Below Poverty |
| No Children | 138 (100.0%) | 0 (0.0%) |
| 1 or 2 Children | 17 (100.0%) | 0 (0.0%) |
| 3 or 4 Children | 6 (100.0%) | 0 (0.0%) |
| 5 or more Children | 0 (0.0%) | 0 (0.0%) |
| Total | 161 (100.0%) | 0 (0.0%) |
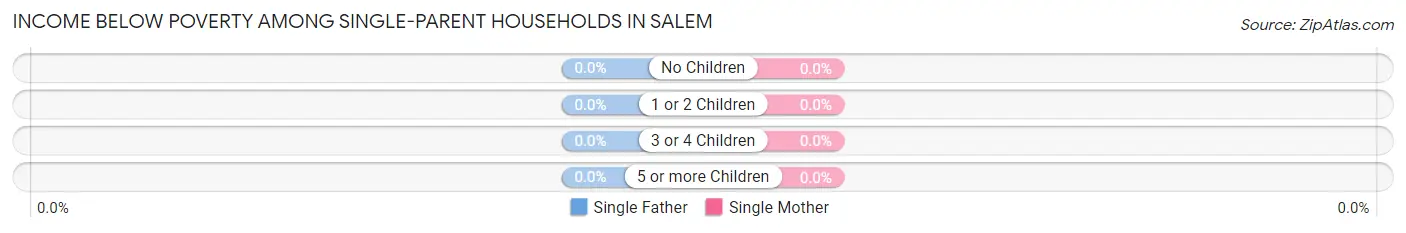
Income Below Poverty Among Single-Parent Households in Salem
| Children | Single Father | Single Mother |
| No Children | 0 (0.0%) | 0 (0.0%) |
| 1 or 2 Children | 0 (0.0%) | 0 (0.0%) |
| 3 or 4 Children | 0 (0.0%) | 0 (0.0%) |
| 5 or more Children | 0 (0.0%) | 0 (0.0%) |
| Total | 0 (0.0%) | 0 (0.0%) |
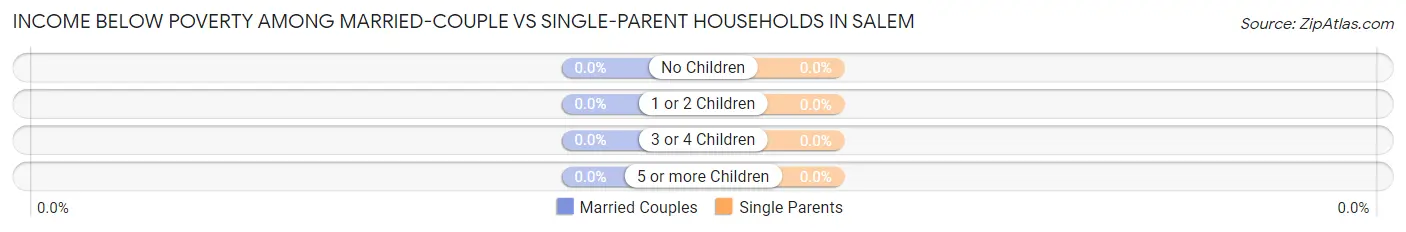
Income Below Poverty Among Married-Couple vs Single-Parent Households in Salem
| Children | Married-Couple Families | Single-Parent Households |
| No Children | 0 (0.0%) | 0 (0.0%) |
| 1 or 2 Children | 0 (0.0%) | 0 (0.0%) |
| 3 or 4 Children | 0 (0.0%) | 0 (0.0%) |
| 5 or more Children | 0 (0.0%) | 0 (0.0%) |
| Total | 0 (0.0%) | 0 (0.0%) |
Employment Characteristics in Salem
Employment by Class of Employer in Salem
Among the 423 employed individuals in Salem, private company employees (270 | 63.8%), not-for-profit organizations (55 | 13.0%), and self-employed (not incorporated) (35 | 8.3%) make up the most common classes of employment.
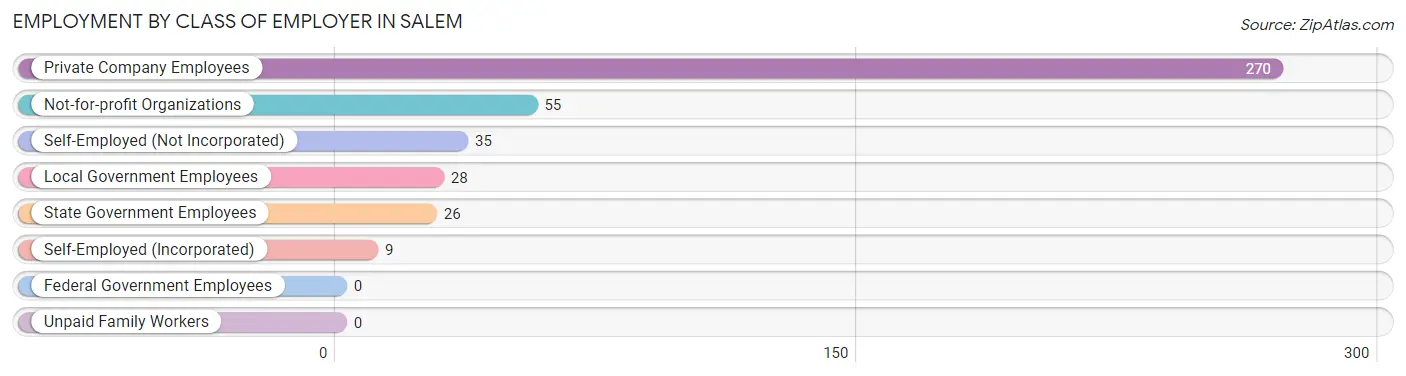
| Employer Class | # Employees | % Employees |
| Private Company Employees | 270 | 63.8% |
| Self-Employed (Incorporated) | 9 | 2.1% |
| Self-Employed (Not Incorporated) | 35 | 8.3% |
| Not-for-profit Organizations | 55 | 13.0% |
| Local Government Employees | 28 | 6.6% |
| State Government Employees | 26 | 6.1% |
| Federal Government Employees | 0 | 0.0% |
| Unpaid Family Workers | 0 | 0.0% |
| Total | 423 | 100.0% |
Employment Status by Age in Salem
According to the labor force statistics for Salem, out of the total population over 16 years of age (754), 71.0% or 535 individuals are in the labor force, with 10.7% or 57 of them unemployed. The age group with the highest labor force participation rate is 16 to 19 years, with 100.0% or 29 individuals in the labor force. Within the labor force, the 16 to 19 years age range has the highest percentage of unemployed individuals, with 100.0% or 29 of them being unemployed.
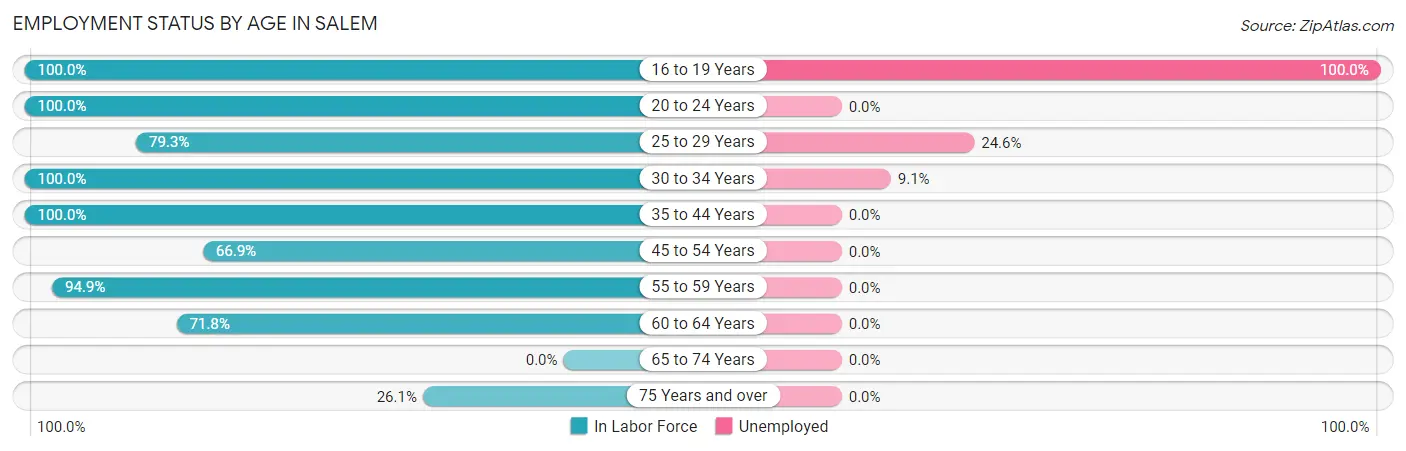
| Age Bracket | In Labor Force | Unemployed |
| 16 to 19 Years | 29 (100.0%) | 29 (100.0%) |
| 20 to 24 Years | 18 (100.0%) | 0 (0.0%) |
| 25 to 29 Years | 65 (79.3%) | 16 (24.6%) |
| 30 to 34 Years | 132 (100.0%) | 12 (9.1%) |
| 35 to 44 Years | 64 (100.0%) | 0 (0.0%) |
| 45 to 54 Years | 79 (66.9%) | 0 (0.0%) |
| 55 to 59 Years | 74 (94.9%) | 0 (0.0%) |
| 60 to 64 Years | 51 (71.8%) | 0 (0.0%) |
| 65 to 74 Years | 0 (0.0%) | 0 (0.0%) |
| 75 Years and over | 23 (26.1%) | 0 (0.0%) |
| Total | 535 (71.0%) | 57 (10.7%) |
Employment Status by Educational Attainment in Salem
According to labor force statistics for Salem, 85.3% of individuals (465) out of the total population between 25 and 64 years of age (545) are in the labor force, with 6.0% or 28 of them being unemployed. The group with the highest labor force participation rate are those with the educational attainment of college / associate degree, with 94.3% or 249 individuals in the labor force. Within the labor force, individuals with high school diploma education have the highest percentage of unemployment, with 11.0% or 12 of them being unemployed.
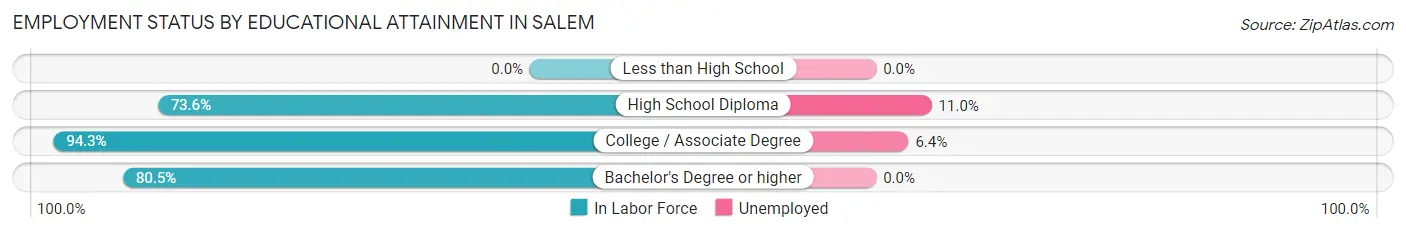
| Educational Attainment | In Labor Force | Unemployed |
| Less than High School | 0 (0.0%) | 0 (0.0%) |
| High School Diploma | 109 (73.6%) | 16 (11.0%) |
| College / Associate Degree | 249 (94.3%) | 17 (6.4%) |
| Bachelor's Degree or higher | 107 (80.5%) | 0 (0.0%) |
| Total | 465 (85.3%) | 33 (6.0%) |
Employment Occupations by Sex in Salem
Management, Business, Science and Arts Occupations
The most common Management, Business, Science and Arts occupations in Salem are Community & Social Service (72 | 15.1%), Education Instruction & Library (65 | 13.6%), Management (56 | 11.7%), Computers, Engineering & Science (9 | 1.9%), and Architecture & Engineering (9 | 1.9%).
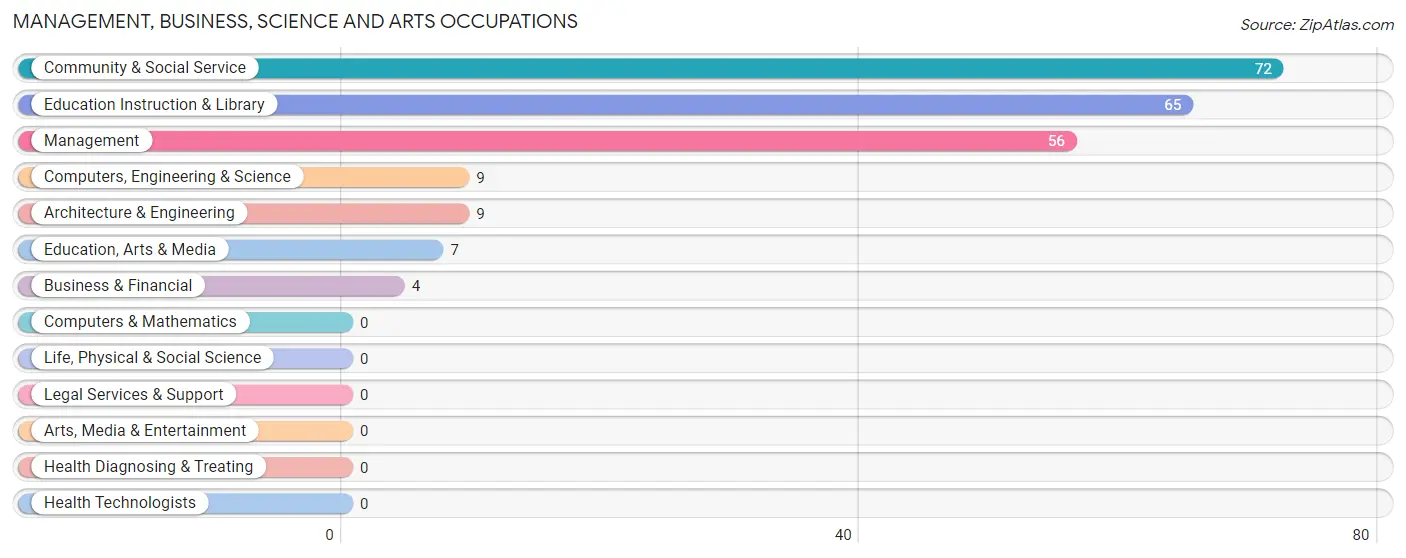
Management, Business, Science and Arts Occupations by Sex
Within the Management, Business, Science and Arts occupations in Salem, the most male-oriented occupations are Computers, Engineering & Science (100.0%), Architecture & Engineering (100.0%), and Management (19.6%), while the most female-oriented occupations are Business & Financial (100.0%), Community & Social Service (100.0%), and Education, Arts & Media (100.0%).
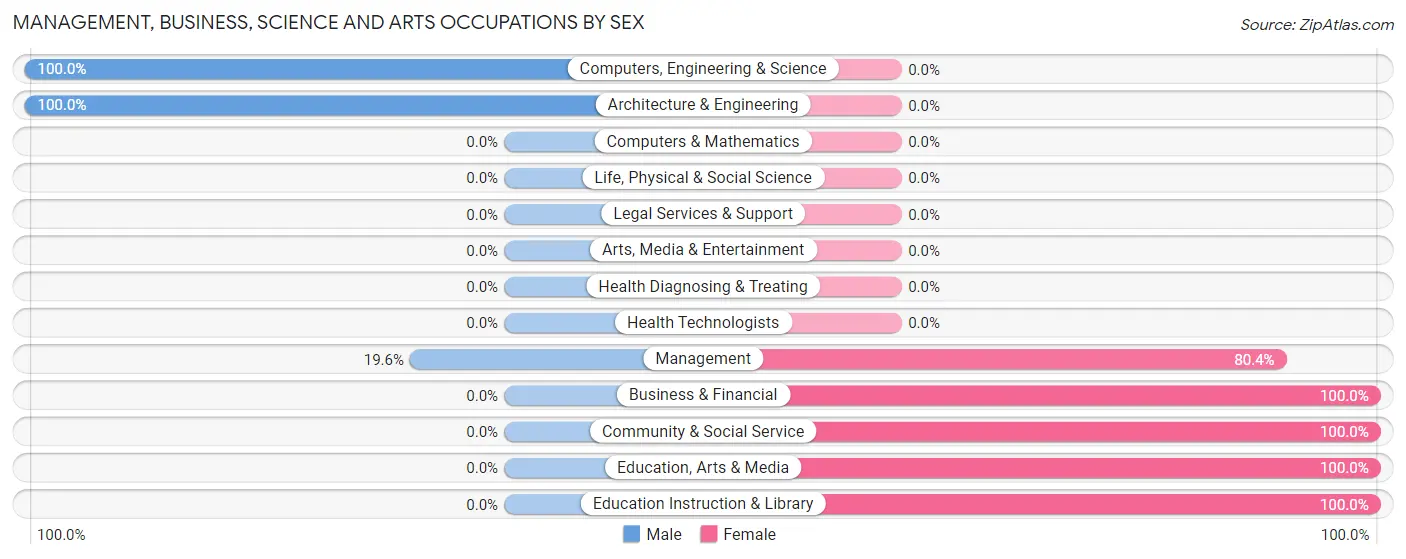
| Occupation | Male | Female |
| Management | 11 (19.6%) | 45 (80.4%) |
| Business & Financial | 0 (0.0%) | 4 (100.0%) |
| Computers, Engineering & Science | 9 (100.0%) | 0 (0.0%) |
| Computers & Mathematics | 0 (0.0%) | 0 (0.0%) |
| Architecture & Engineering | 9 (100.0%) | 0 (0.0%) |
| Life, Physical & Social Science | 0 (0.0%) | 0 (0.0%) |
| Community & Social Service | 0 (0.0%) | 72 (100.0%) |
| Education, Arts & Media | 0 (0.0%) | 7 (100.0%) |
| Legal Services & Support | 0 (0.0%) | 0 (0.0%) |
| Education Instruction & Library | 0 (0.0%) | 65 (100.0%) |
| Arts, Media & Entertainment | 0 (0.0%) | 0 (0.0%) |
| Health Diagnosing & Treating | 0 (0.0%) | 0 (0.0%) |
| Health Technologists | 0 (0.0%) | 0 (0.0%) |
| Total (Category) | 20 (14.2%) | 121 (85.8%) |
| Total (Overall) | 176 (36.8%) | 302 (63.2%) |
Services Occupations
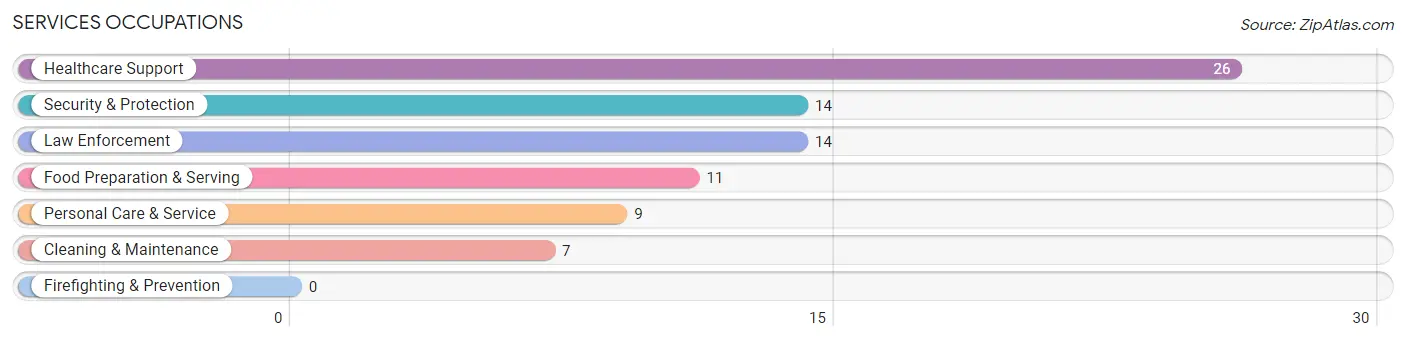
The most common Services occupations in Salem are Healthcare Support (26 | 5.4%), Security & Protection (14 | 2.9%), Law Enforcement (14 | 2.9%), Food Preparation & Serving (11 | 2.3%), and Personal Care & Service (9 | 1.9%).
Services Occupations by Sex
Within the Services occupations in Salem, the most male-oriented occupations are Security & Protection (100.0%), Law Enforcement (100.0%), and Cleaning & Maintenance (100.0%), while the most female-oriented occupations are Healthcare Support (100.0%), and Food Preparation & Serving (100.0%).
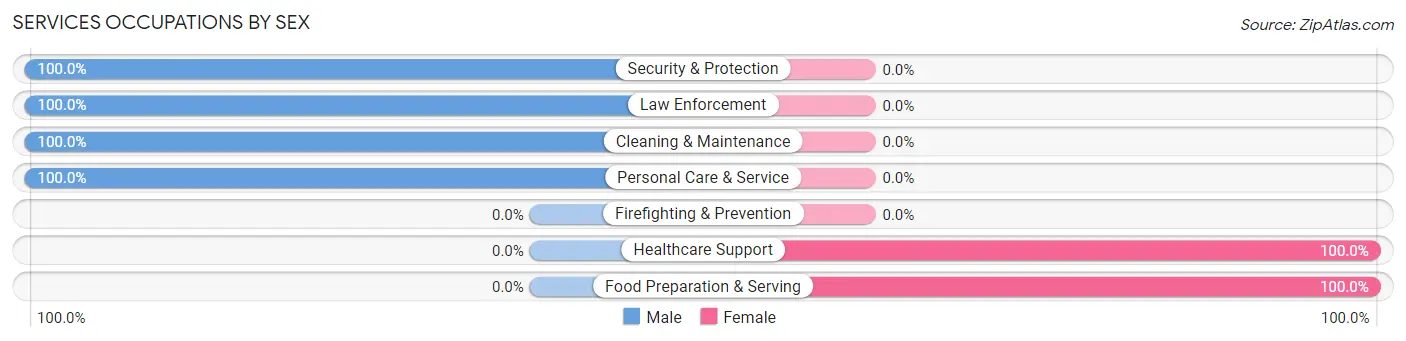
| Occupation | Male | Female |
| Healthcare Support | 0 (0.0%) | 26 (100.0%) |
| Security & Protection | 14 (100.0%) | 0 (0.0%) |
| Firefighting & Prevention | 0 (0.0%) | 0 (0.0%) |
| Law Enforcement | 14 (100.0%) | 0 (0.0%) |
| Food Preparation & Serving | 0 (0.0%) | 11 (100.0%) |
| Cleaning & Maintenance | 7 (100.0%) | 0 (0.0%) |
| Personal Care & Service | 9 (100.0%) | 0 (0.0%) |
| Total (Category) | 30 (44.8%) | 37 (55.2%) |
| Total (Overall) | 176 (36.8%) | 302 (63.2%) |
Sales and Office Occupations
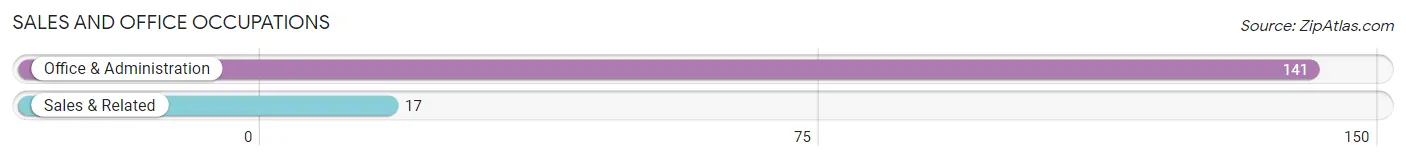
The most common Sales and Office occupations in Salem are Office & Administration (141 | 29.5%), and Sales & Related (17 | 3.6%).
Sales and Office Occupations by Sex
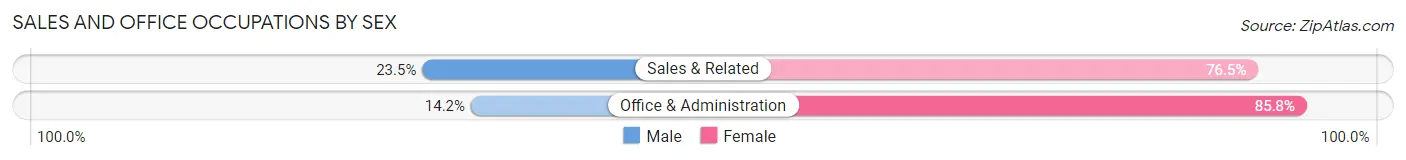
| Occupation | Male | Female |
| Sales & Related | 4 (23.5%) | 13 (76.5%) |
| Office & Administration | 20 (14.2%) | 121 (85.8%) |
| Total (Category) | 24 (15.2%) | 134 (84.8%) |
| Total (Overall) | 176 (36.8%) | 302 (63.2%) |
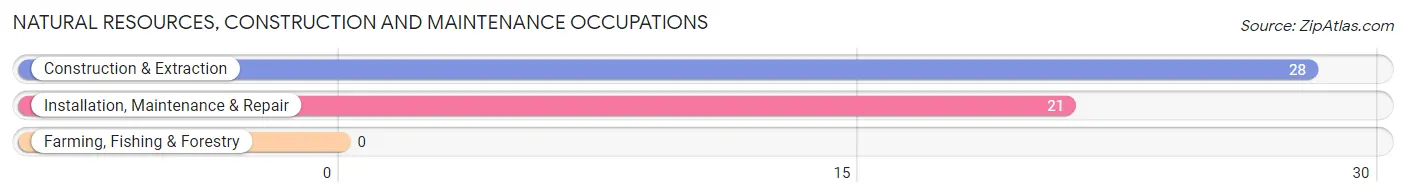
Natural Resources, Construction and Maintenance Occupations
The most common Natural Resources, Construction and Maintenance occupations in Salem are Construction & Extraction (28 | 5.9%), and Installation, Maintenance & Repair (21 | 4.4%).
Natural Resources, Construction and Maintenance Occupations by Sex
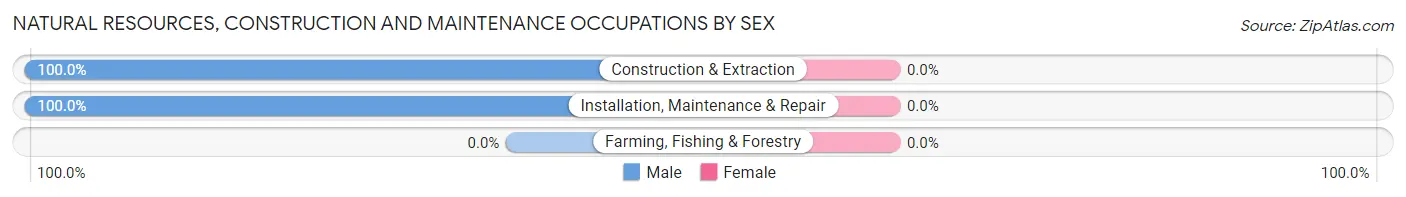
| Occupation | Male | Female |
| Farming, Fishing & Forestry | 0 (0.0%) | 0 (0.0%) |
| Construction & Extraction | 28 (100.0%) | 0 (0.0%) |
| Installation, Maintenance & Repair | 21 (100.0%) | 0 (0.0%) |
| Total (Category) | 49 (100.0%) | 0 (0.0%) |
| Total (Overall) | 176 (36.8%) | 302 (63.2%) |
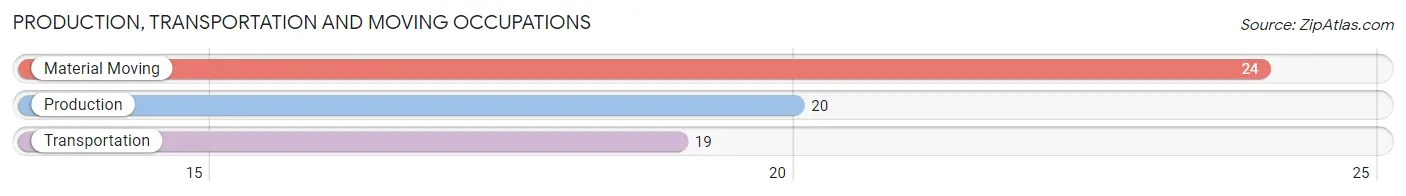
Production, Transportation and Moving Occupations
The most common Production, Transportation and Moving occupations in Salem are Material Moving (24 | 5.0%), Production (20 | 4.2%), and Transportation (19 | 4.0%).
Production, Transportation and Moving Occupations by Sex
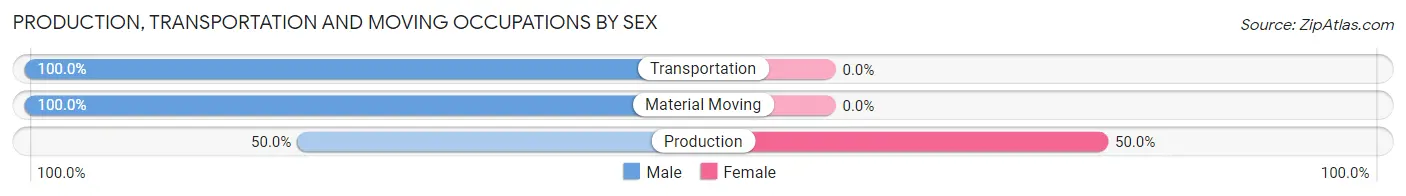
| Occupation | Male | Female |
| Production | 10 (50.0%) | 10 (50.0%) |
| Transportation | 19 (100.0%) | 0 (0.0%) |
| Material Moving | 24 (100.0%) | 0 (0.0%) |
| Total (Category) | 53 (84.1%) | 10 (15.9%) |
| Total (Overall) | 176 (36.8%) | 302 (63.2%) |
Employment Industries by Sex in Salem
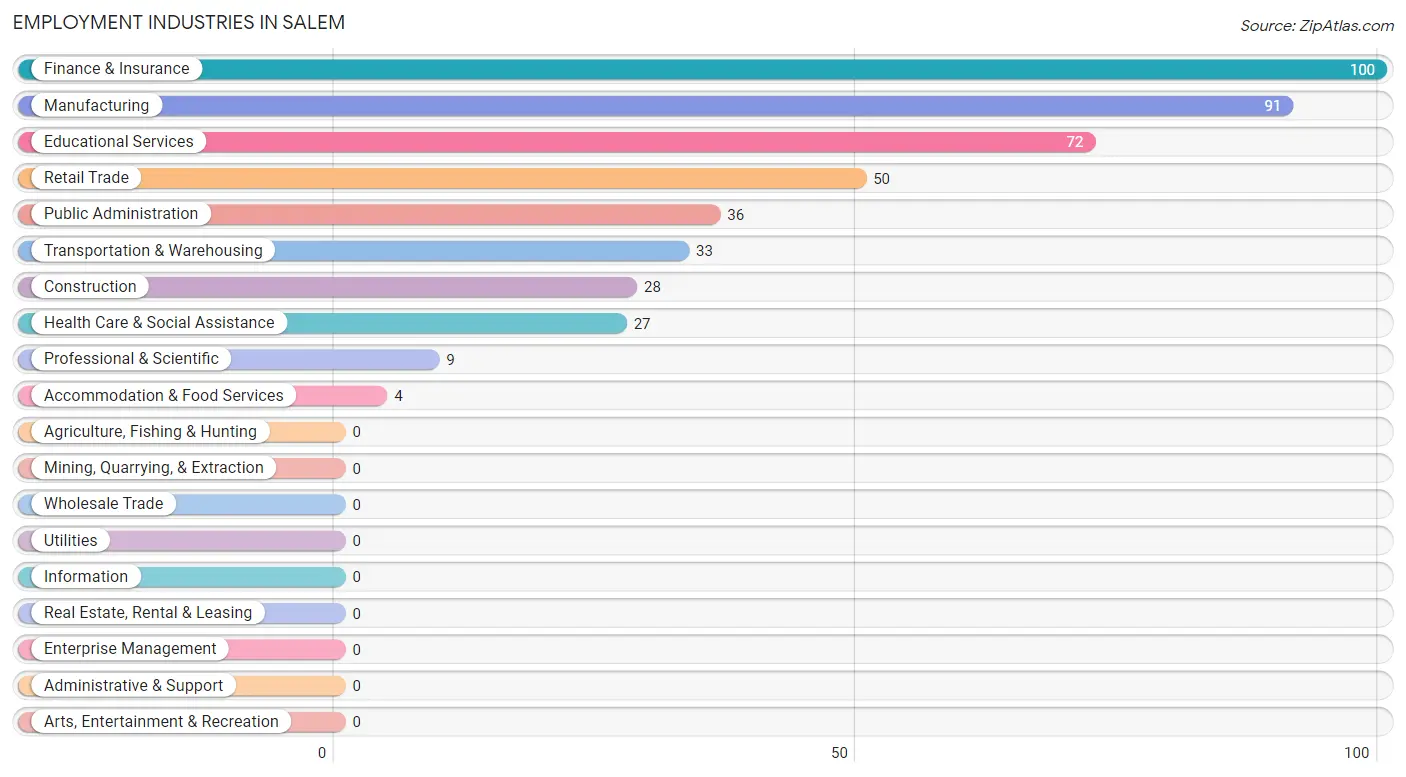
Employment Industries in Salem
The major employment industries in Salem include Finance & Insurance (100 | 20.9%), Manufacturing (91 | 19.0%), Educational Services (72 | 15.1%), Retail Trade (50 | 10.5%), and Public Administration (36 | 7.5%).
Employment Industries by Sex in Salem
The Salem industries that see more men than women are Construction (100.0%), Professional & Scientific (100.0%), and Retail Trade (74.0%), whereas the industries that tend to have a higher number of women are Finance & Insurance (100.0%), Educational Services (100.0%), and Accommodation & Food Services (100.0%).
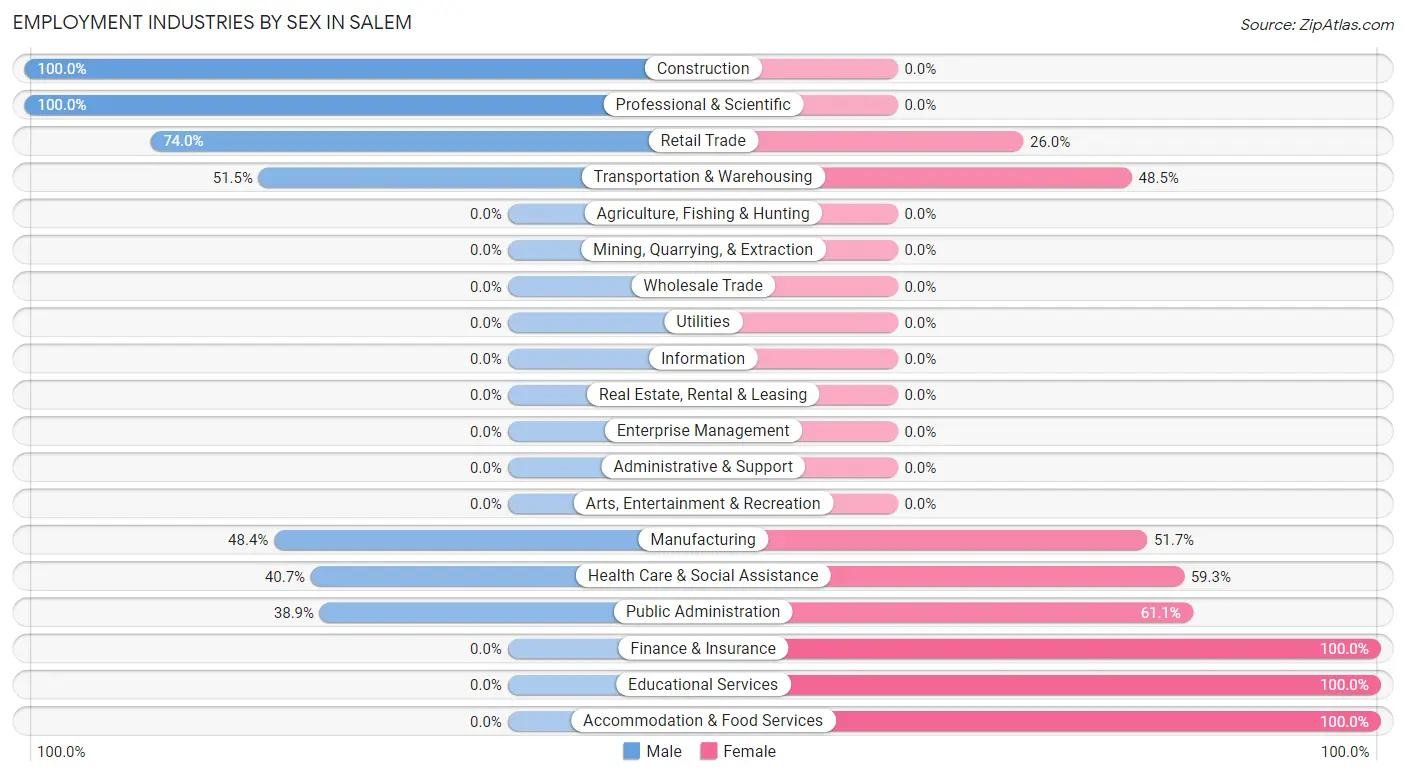
| Industry | Male | Female |
| Agriculture, Fishing & Hunting | 0 (0.0%) | 0 (0.0%) |
| Mining, Quarrying, & Extraction | 0 (0.0%) | 0 (0.0%) |
| Construction | 28 (100.0%) | 0 (0.0%) |
| Manufacturing | 44 (48.3%) | 47 (51.6%) |
| Wholesale Trade | 0 (0.0%) | 0 (0.0%) |
| Retail Trade | 37 (74.0%) | 13 (26.0%) |
| Transportation & Warehousing | 17 (51.5%) | 16 (48.5%) |
| Utilities | 0 (0.0%) | 0 (0.0%) |
| Information | 0 (0.0%) | 0 (0.0%) |
| Finance & Insurance | 0 (0.0%) | 100 (100.0%) |
| Real Estate, Rental & Leasing | 0 (0.0%) | 0 (0.0%) |
| Professional & Scientific | 9 (100.0%) | 0 (0.0%) |
| Enterprise Management | 0 (0.0%) | 0 (0.0%) |
| Administrative & Support | 0 (0.0%) | 0 (0.0%) |
| Educational Services | 0 (0.0%) | 72 (100.0%) |
| Health Care & Social Assistance | 11 (40.7%) | 16 (59.3%) |
| Arts, Entertainment & Recreation | 0 (0.0%) | 0 (0.0%) |
| Accommodation & Food Services | 0 (0.0%) | 4 (100.0%) |
| Public Administration | 14 (38.9%) | 22 (61.1%) |
| Total | 176 (36.8%) | 302 (63.2%) |
Education in Salem
School Enrollment in Salem
The most common levels of schooling among the 81 students in Salem are nursery / preschool (46 | 56.8%), elementary school (22 | 27.2%), and college / undergraduate (13 | 16.1%).
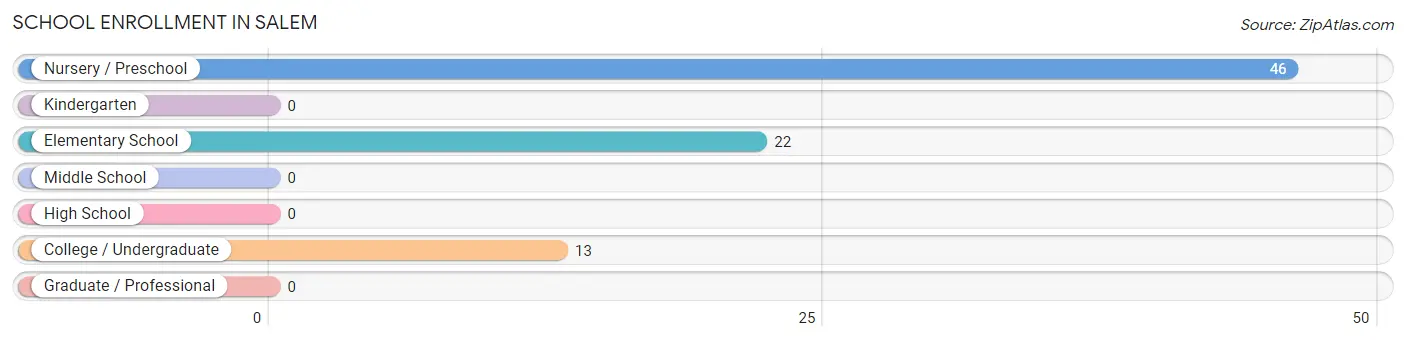
| School Level | # Students | % Students |
| Nursery / Preschool | 46 | 56.8% |
| Kindergarten | 0 | 0.0% |
| Elementary School | 22 | 27.2% |
| Middle School | 0 | 0.0% |
| High School | 0 | 0.0% |
| College / Undergraduate | 13 | 16.1% |
| Graduate / Professional | 0 | 0.0% |
| Total | 81 | 100.0% |
School Enrollment by Age by Funding Source in Salem
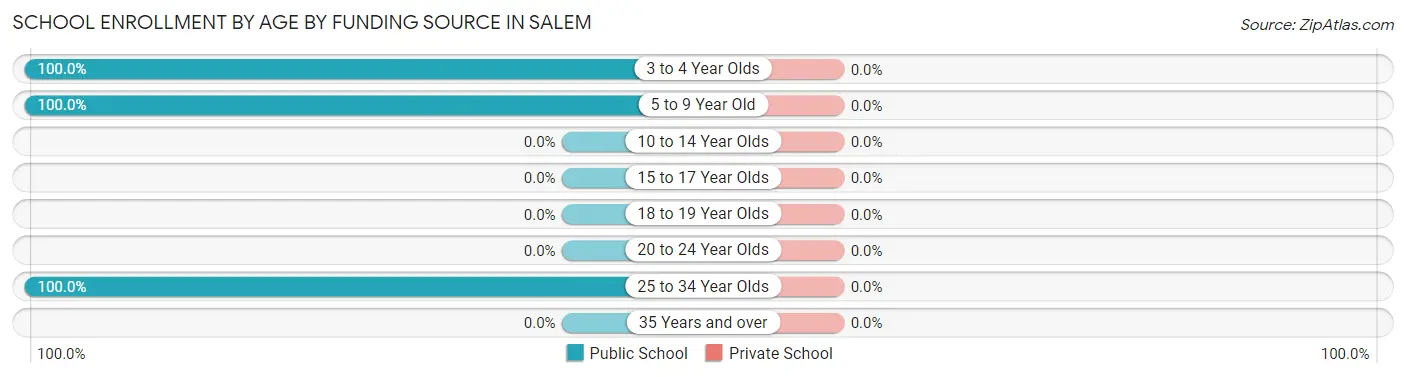
| Age Bracket | Public School | Private School |
| 3 to 4 Year Olds | 24 (100.0%) | 0 (0.0%) |
| 5 to 9 Year Old | 44 (100.0%) | 0 (0.0%) |
| 10 to 14 Year Olds | 0 (0.0%) | 0 (0.0%) |
| 15 to 17 Year Olds | 0 (0.0%) | 0 (0.0%) |
| 18 to 19 Year Olds | 0 (0.0%) | 0 (0.0%) |
| 20 to 24 Year Olds | 0 (0.0%) | 0 (0.0%) |
| 25 to 34 Year Olds | 13 (100.0%) | 0 (0.0%) |
| 35 Years and over | 0 (0.0%) | 0 (0.0%) |
| Total | 81 (100.0%) | 0 (0.0%) |
Educational Attainment by Field of Study in Salem
Education (72 | 31.3%), science & technology (55 | 23.9%), bio, nature & agricultural (33 | 14.3%), liberal arts & history (27 | 11.7%), and social sciences (20 | 8.7%) are the most common fields of study among 230 individuals in Salem who have obtained a bachelor's degree or higher.
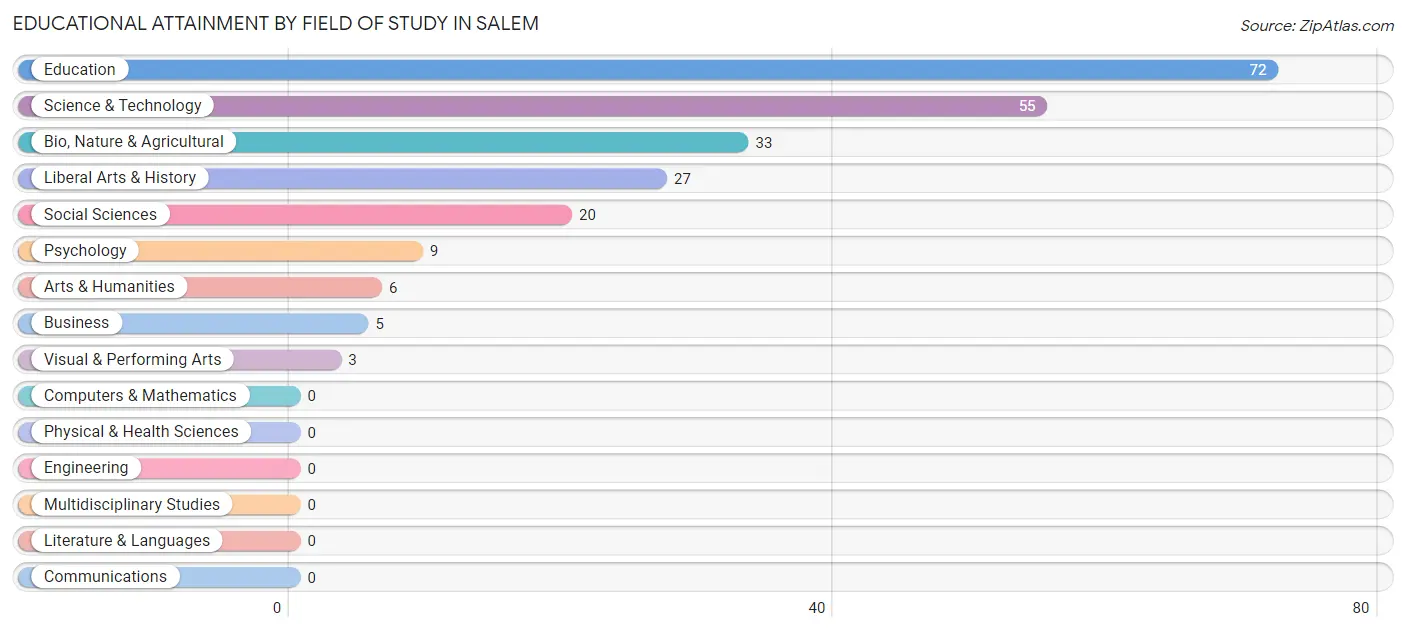
| Field of Study | # Graduates | % Graduates |
| Computers & Mathematics | 0 | 0.0% |
| Bio, Nature & Agricultural | 33 | 14.3% |
| Physical & Health Sciences | 0 | 0.0% |
| Psychology | 9 | 3.9% |
| Social Sciences | 20 | 8.7% |
| Engineering | 0 | 0.0% |
| Multidisciplinary Studies | 0 | 0.0% |
| Science & Technology | 55 | 23.9% |
| Business | 5 | 2.2% |
| Education | 72 | 31.3% |
| Literature & Languages | 0 | 0.0% |
| Liberal Arts & History | 27 | 11.7% |
| Visual & Performing Arts | 3 | 1.3% |
| Communications | 0 | 0.0% |
| Arts & Humanities | 6 | 2.6% |
| Total | 230 | 100.0% |
Transportation & Commute in Salem
Vehicle Availability by Sex in Salem
The most prevalent vehicle ownership categories in Salem are males with 2 vehicles (60, accounting for 34.1%) and females with 2 vehicles (26, making up 24.3%).
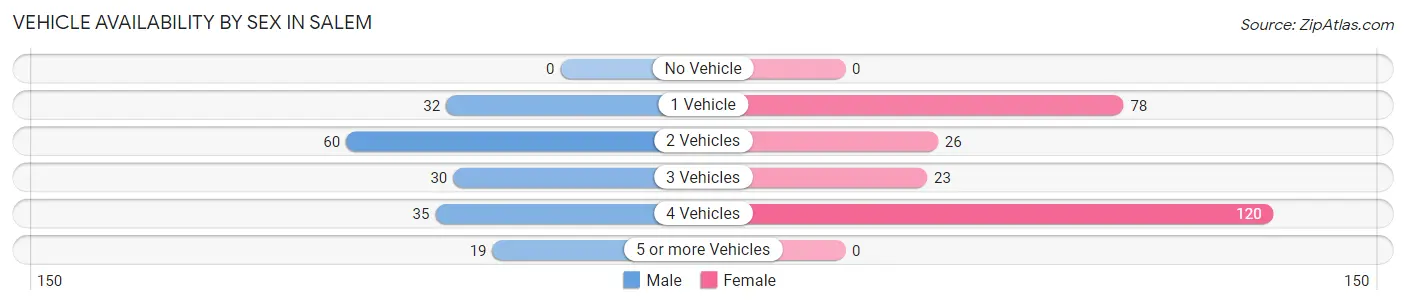
| Vehicles Available | Male | Female |
| No Vehicle | 0 (0.0%) | 0 (0.0%) |
| 1 Vehicle | 32 (18.2%) | 78 (31.6%) |
| 2 Vehicles | 60 (34.1%) | 26 (10.5%) |
| 3 Vehicles | 30 (17.1%) | 23 (9.3%) |
| 4 Vehicles | 35 (19.9%) | 120 (48.6%) |
| 5 or more Vehicles | 19 (10.8%) | 0 (0.0%) |
| Total | 176 (100.0%) | 247 (100.0%) |
Commute Time in Salem
The most frequently occuring commute durations in Salem are 15 to 19 minutes (144 commuters, 37.8%), less than 5 minutes (49 commuters, 12.9%), and 45 to 59 minutes (41 commuters, 10.8%).
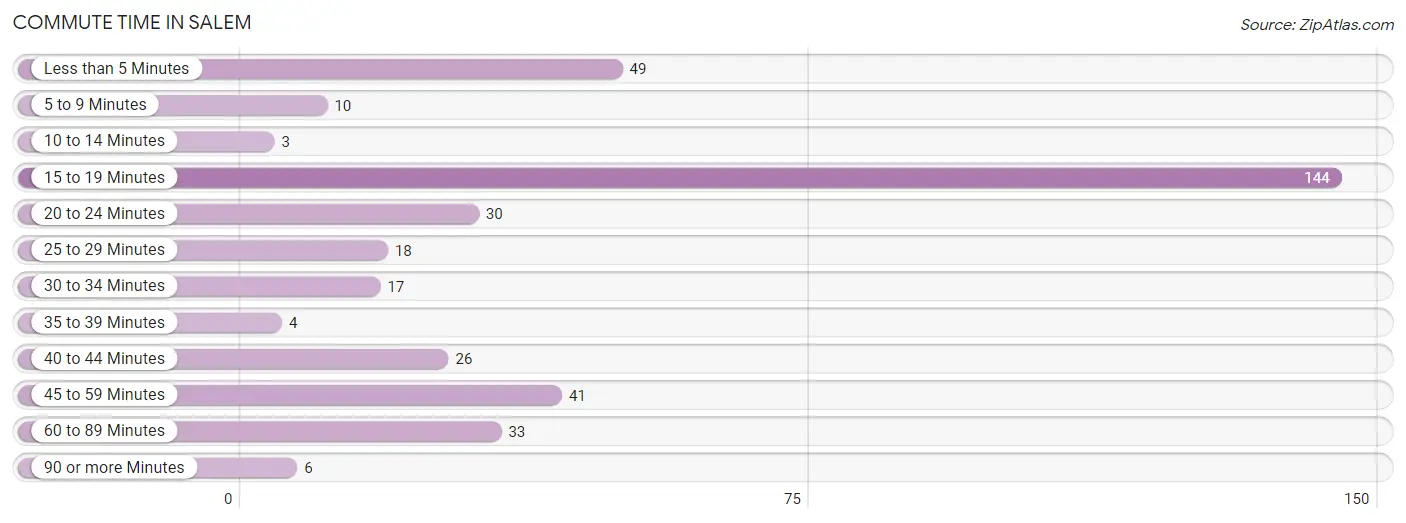
| Commute Time | # Commuters | % Commuters |
| Less than 5 Minutes | 49 | 12.9% |
| 5 to 9 Minutes | 10 | 2.6% |
| 10 to 14 Minutes | 3 | 0.8% |
| 15 to 19 Minutes | 144 | 37.8% |
| 20 to 24 Minutes | 30 | 7.9% |
| 25 to 29 Minutes | 18 | 4.7% |
| 30 to 34 Minutes | 17 | 4.5% |
| 35 to 39 Minutes | 4 | 1.1% |
| 40 to 44 Minutes | 26 | 6.8% |
| 45 to 59 Minutes | 41 | 10.8% |
| 60 to 89 Minutes | 33 | 8.7% |
| 90 or more Minutes | 6 | 1.6% |
Commute Time by Sex in Salem
The most common commute times in Salem are 45 to 59 minutes (38 commuters, 22.8%) for males and 15 to 19 minutes (131 commuters, 61.2%) for females.
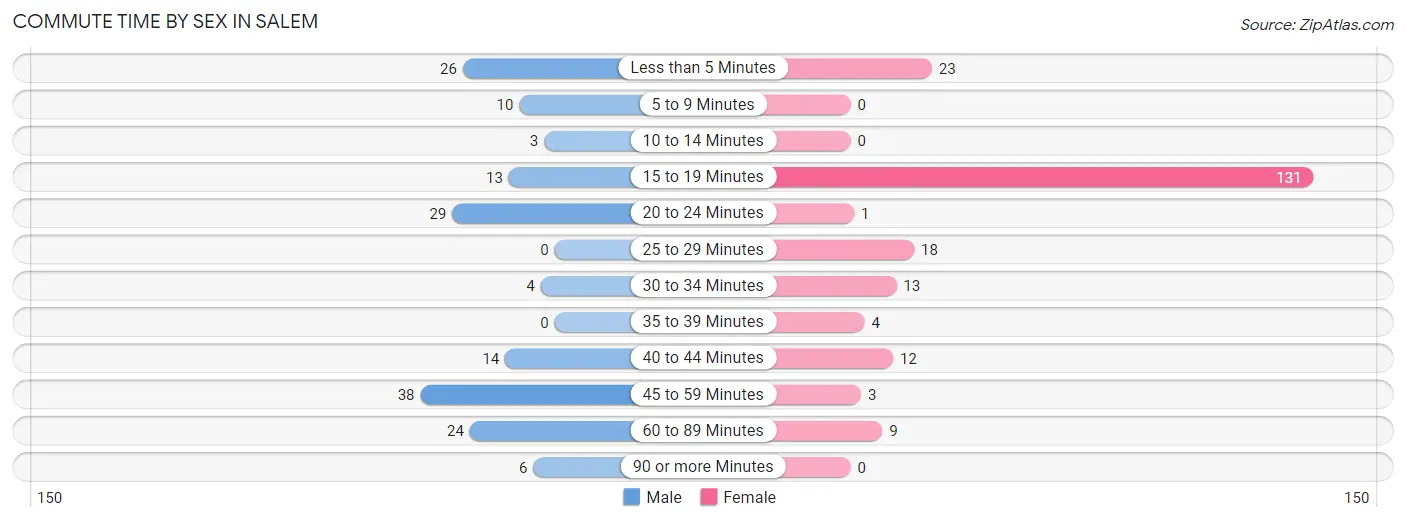
| Commute Time | Male | Female |
| Less than 5 Minutes | 26 (15.6%) | 23 (10.7%) |
| 5 to 9 Minutes | 10 (6.0%) | 0 (0.0%) |
| 10 to 14 Minutes | 3 (1.8%) | 0 (0.0%) |
| 15 to 19 Minutes | 13 (7.8%) | 131 (61.2%) |
| 20 to 24 Minutes | 29 (17.4%) | 1 (0.5%) |
| 25 to 29 Minutes | 0 (0.0%) | 18 (8.4%) |
| 30 to 34 Minutes | 4 (2.4%) | 13 (6.1%) |
| 35 to 39 Minutes | 0 (0.0%) | 4 (1.9%) |
| 40 to 44 Minutes | 14 (8.4%) | 12 (5.6%) |
| 45 to 59 Minutes | 38 (22.8%) | 3 (1.4%) |
| 60 to 89 Minutes | 24 (14.4%) | 9 (4.2%) |
| 90 or more Minutes | 6 (3.6%) | 0 (0.0%) |
Time of Departure to Work by Sex in Salem
The most frequent times of departure to work in Salem are 12:00 AM to 4:59 AM (39, 23.4%) for males and 8:00 AM to 8:29 AM (99, 46.3%) for females.
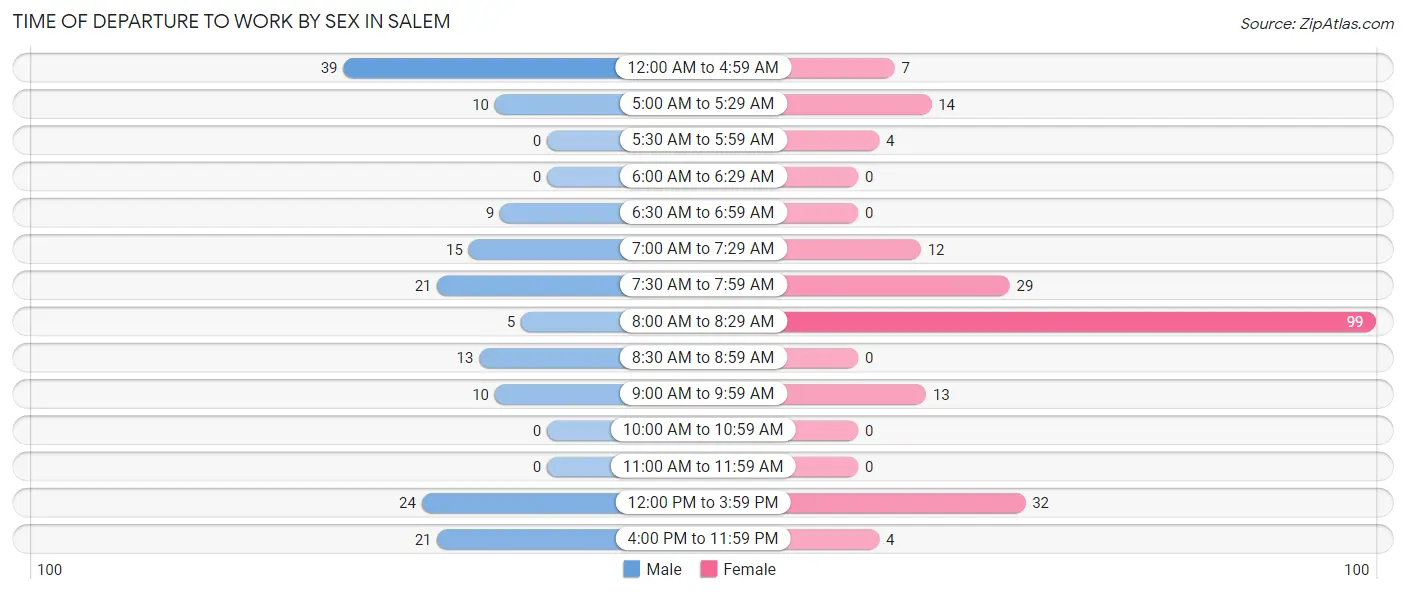
| Time of Departure | Male | Female |
| 12:00 AM to 4:59 AM | 39 (23.4%) | 7 (3.3%) |
| 5:00 AM to 5:29 AM | 10 (6.0%) | 14 (6.5%) |
| 5:30 AM to 5:59 AM | 0 (0.0%) | 4 (1.9%) |
| 6:00 AM to 6:29 AM | 0 (0.0%) | 0 (0.0%) |
| 6:30 AM to 6:59 AM | 9 (5.4%) | 0 (0.0%) |
| 7:00 AM to 7:29 AM | 15 (9.0%) | 12 (5.6%) |
| 7:30 AM to 7:59 AM | 21 (12.6%) | 29 (13.6%) |
| 8:00 AM to 8:29 AM | 5 (3.0%) | 99 (46.3%) |
| 8:30 AM to 8:59 AM | 13 (7.8%) | 0 (0.0%) |
| 9:00 AM to 9:59 AM | 10 (6.0%) | 13 (6.1%) |
| 10:00 AM to 10:59 AM | 0 (0.0%) | 0 (0.0%) |
| 11:00 AM to 11:59 AM | 0 (0.0%) | 0 (0.0%) |
| 12:00 PM to 3:59 PM | 24 (14.4%) | 32 (14.9%) |
| 4:00 PM to 11:59 PM | 21 (12.6%) | 4 (1.9%) |
| Total | 167 (100.0%) | 214 (100.0%) |
Housing Occupancy in Salem
Occupancy by Ownership in Salem
Of the total 377 dwellings in Salem, owner-occupied units account for 310 (82.2%), while renter-occupied units make up 67 (17.8%).
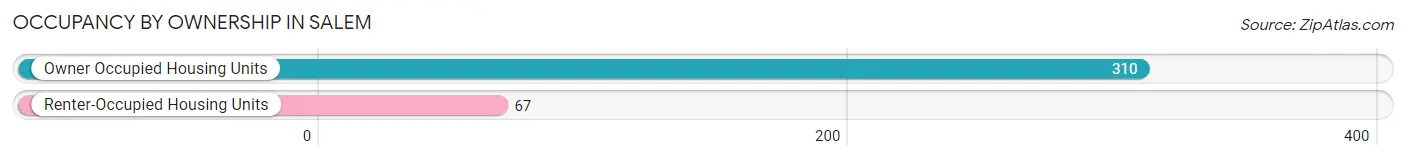
| Occupancy | # Housing Units | % Housing Units |
| Owner Occupied Housing Units | 310 | 82.2% |
| Renter-Occupied Housing Units | 67 | 17.8% |
| Total Occupied Housing Units | 377 | 100.0% |
Occupancy by Household Size in Salem
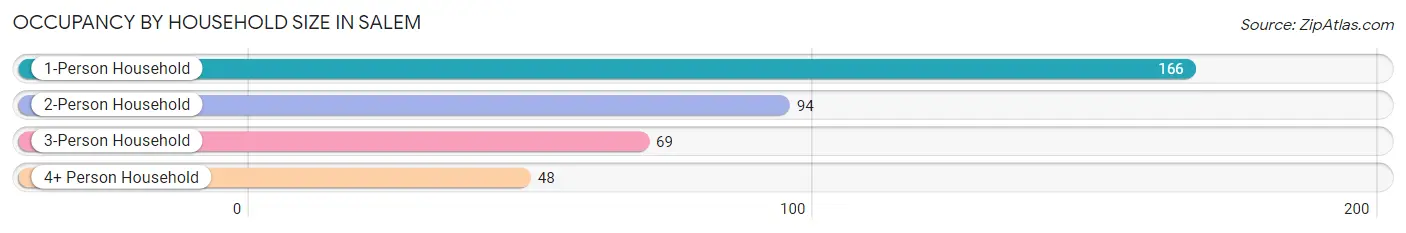
| Household Size | # Housing Units | % Housing Units |
| 1-Person Household | 166 | 44.0% |
| 2-Person Household | 94 | 24.9% |
| 3-Person Household | 69 | 18.3% |
| 4+ Person Household | 48 | 12.7% |
| Total Housing Units | 377 | 100.0% |
Occupancy by Ownership by Household Size in Salem
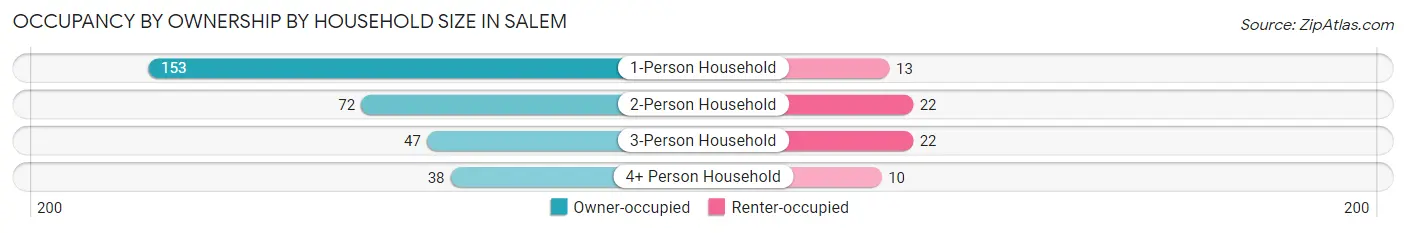
| Household Size | Owner-occupied | Renter-occupied |
| 1-Person Household | 153 (92.2%) | 13 (7.8%) |
| 2-Person Household | 72 (76.6%) | 22 (23.4%) |
| 3-Person Household | 47 (68.1%) | 22 (31.9%) |
| 4+ Person Household | 38 (79.2%) | 10 (20.8%) |
| Total Housing Units | 310 (82.2%) | 67 (17.8%) |
Occupancy by Educational Attainment in Salem
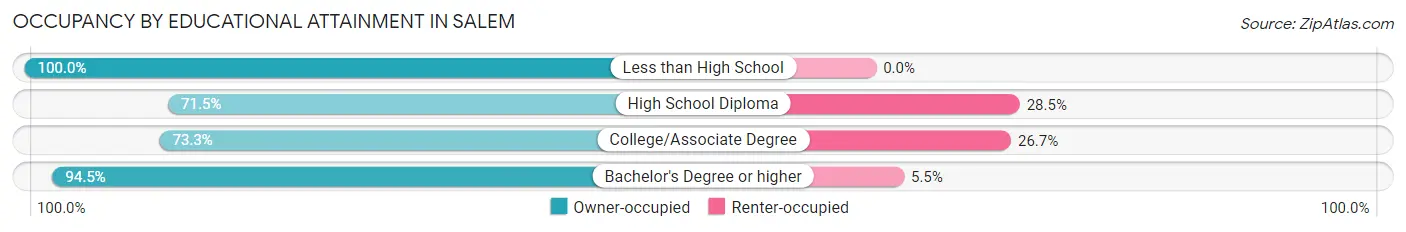
| Household Size | Owner-occupied | Renter-occupied |
| Less than High School | 5 (100.0%) | 0 (0.0%) |
| High School Diploma | 88 (71.5%) | 35 (28.5%) |
| College/Associate Degree | 63 (73.3%) | 23 (26.7%) |
| Bachelor's Degree or higher | 154 (94.5%) | 9 (5.5%) |
Occupancy by Age of Householder in Salem
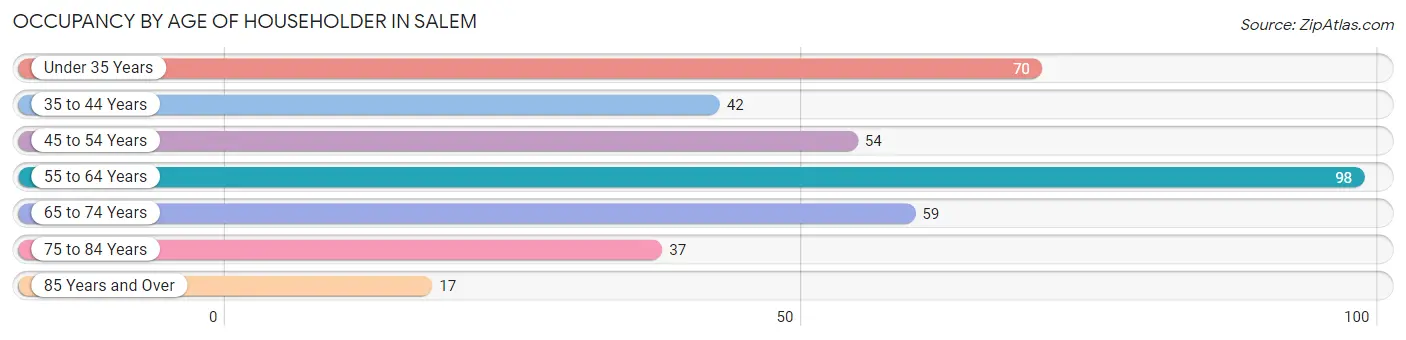
| Age Bracket | # Households | % Households |
| Under 35 Years | 70 | 18.6% |
| 35 to 44 Years | 42 | 11.1% |
| 45 to 54 Years | 54 | 14.3% |
| 55 to 64 Years | 98 | 26.0% |
| 65 to 74 Years | 59 | 15.7% |
| 75 to 84 Years | 37 | 9.8% |
| 85 Years and Over | 17 | 4.5% |
| Total | 377 | 100.0% |
Housing Finances in Salem
Median Income by Occupancy in Salem
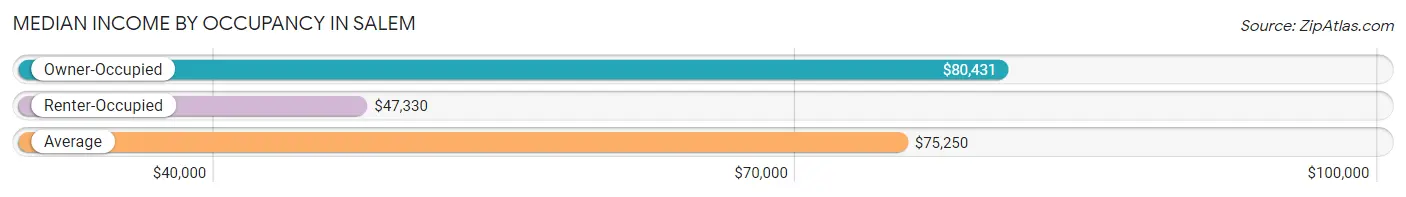
| Occupancy Type | # Households | Median Income |
| Owner-Occupied | 310 (82.2%) | $80,431 |
| Renter-Occupied | 67 (17.8%) | $47,330 |
| Average | 377 (100.0%) | $75,250 |
Occupancy by Householder Income Bracket in Salem
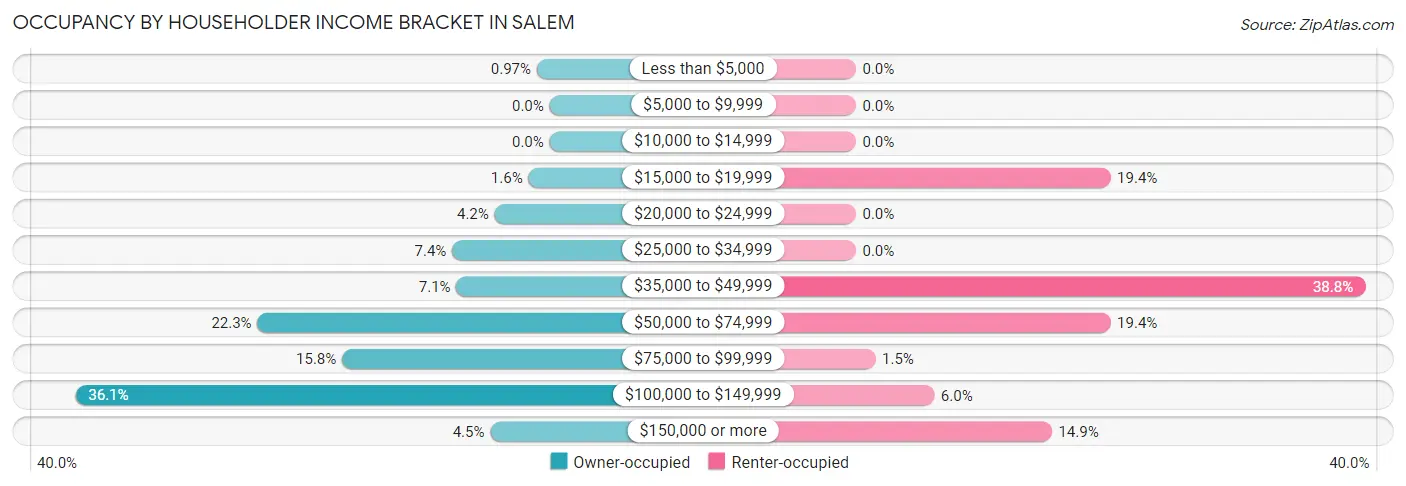
| Income Bracket | Owner-occupied | Renter-occupied |
| Less than $5,000 | 3 (1.0%) | 0 (0.0%) |
| $5,000 to $9,999 | 0 (0.0%) | 0 (0.0%) |
| $10,000 to $14,999 | 0 (0.0%) | 0 (0.0%) |
| $15,000 to $19,999 | 5 (1.6%) | 13 (19.4%) |
| $20,000 to $24,999 | 13 (4.2%) | 0 (0.0%) |
| $25,000 to $34,999 | 23 (7.4%) | 0 (0.0%) |
| $35,000 to $49,999 | 22 (7.1%) | 26 (38.8%) |
| $50,000 to $74,999 | 69 (22.3%) | 13 (19.4%) |
| $75,000 to $99,999 | 49 (15.8%) | 1 (1.5%) |
| $100,000 to $149,999 | 112 (36.1%) | 4 (6.0%) |
| $150,000 or more | 14 (4.5%) | 10 (14.9%) |
| Total | 310 (100.0%) | 67 (100.0%) |
Monthly Housing Cost Tiers in Salem
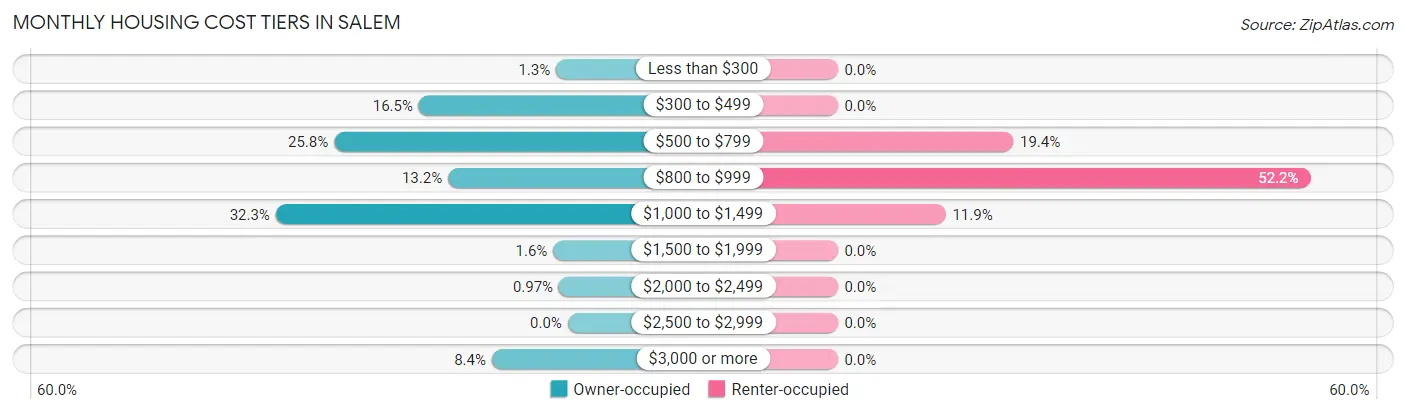
| Monthly Cost | Owner-occupied | Renter-occupied |
| Less than $300 | 4 (1.3%) | 0 (0.0%) |
| $300 to $499 | 51 (16.5%) | 0 (0.0%) |
| $500 to $799 | 80 (25.8%) | 13 (19.4%) |
| $800 to $999 | 41 (13.2%) | 35 (52.2%) |
| $1,000 to $1,499 | 100 (32.3%) | 8 (11.9%) |
| $1,500 to $1,999 | 5 (1.6%) | 0 (0.0%) |
| $2,000 to $2,499 | 3 (1.0%) | 0 (0.0%) |
| $2,500 to $2,999 | 0 (0.0%) | 0 (0.0%) |
| $3,000 or more | 26 (8.4%) | 0 (0.0%) |
| Total | 310 (100.0%) | 67 (100.0%) |
Physical Housing Characteristics in Salem
Housing Structures in Salem
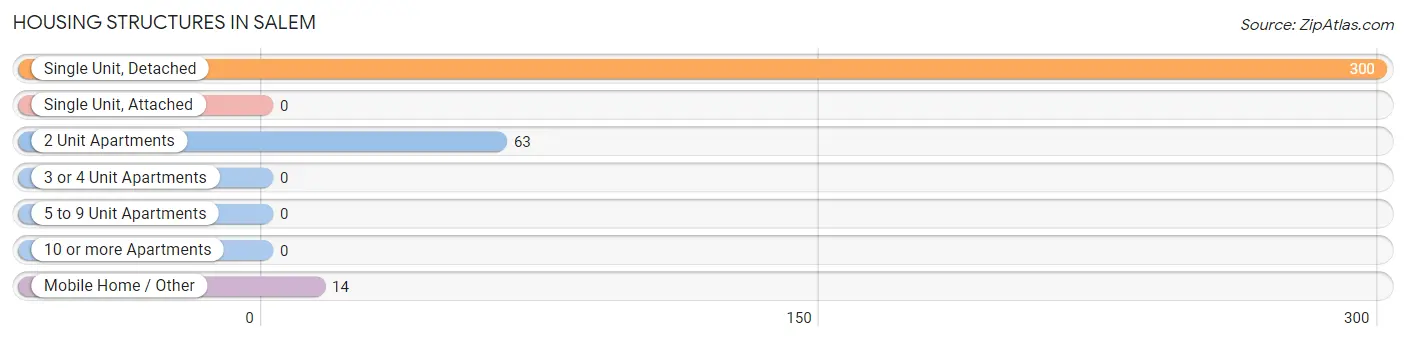
| Structure Type | # Housing Units | % Housing Units |
| Single Unit, Detached | 300 | 79.6% |
| Single Unit, Attached | 0 | 0.0% |
| 2 Unit Apartments | 63 | 16.7% |
| 3 or 4 Unit Apartments | 0 | 0.0% |
| 5 to 9 Unit Apartments | 0 | 0.0% |
| 10 or more Apartments | 0 | 0.0% |
| Mobile Home / Other | 14 | 3.7% |
| Total | 377 | 100.0% |
Housing Structures by Occupancy in Salem
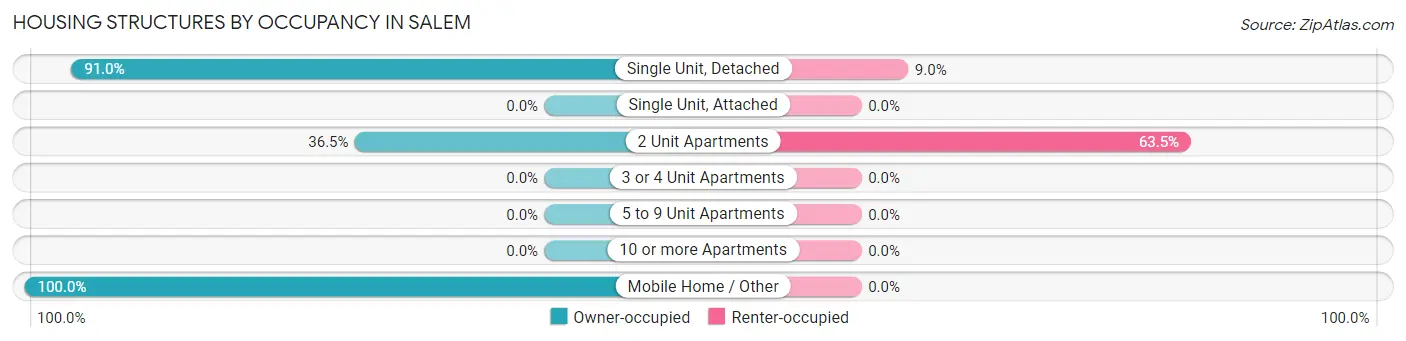
| Structure Type | Owner-occupied | Renter-occupied |
| Single Unit, Detached | 273 (91.0%) | 27 (9.0%) |
| Single Unit, Attached | 0 (0.0%) | 0 (0.0%) |
| 2 Unit Apartments | 23 (36.5%) | 40 (63.5%) |
| 3 or 4 Unit Apartments | 0 (0.0%) | 0 (0.0%) |
| 5 to 9 Unit Apartments | 0 (0.0%) | 0 (0.0%) |
| 10 or more Apartments | 0 (0.0%) | 0 (0.0%) |
| Mobile Home / Other | 14 (100.0%) | 0 (0.0%) |
| Total | 310 (82.2%) | 67 (17.8%) |
Housing Structures by Number of Rooms in Salem
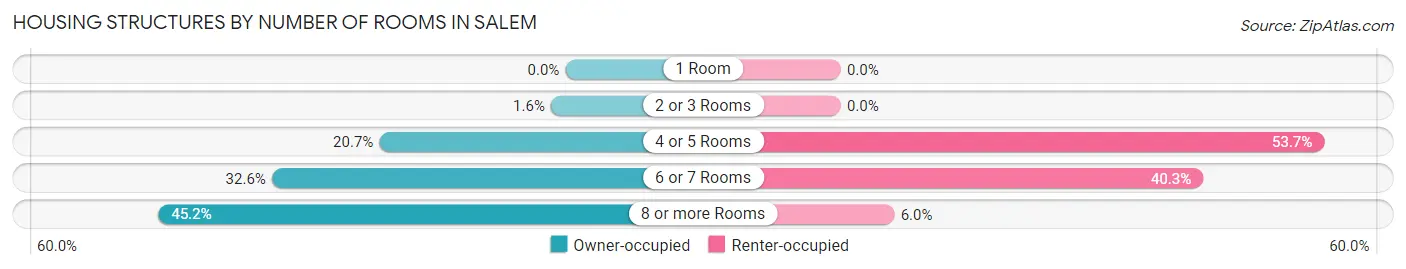
| Number of Rooms | Owner-occupied | Renter-occupied |
| 1 Room | 0 (0.0%) | 0 (0.0%) |
| 2 or 3 Rooms | 5 (1.6%) | 0 (0.0%) |
| 4 or 5 Rooms | 64 (20.6%) | 36 (53.7%) |
| 6 or 7 Rooms | 101 (32.6%) | 27 (40.3%) |
| 8 or more Rooms | 140 (45.2%) | 4 (6.0%) |
| Total | 310 (100.0%) | 67 (100.0%) |
Housing Structure by Heating Type in Salem
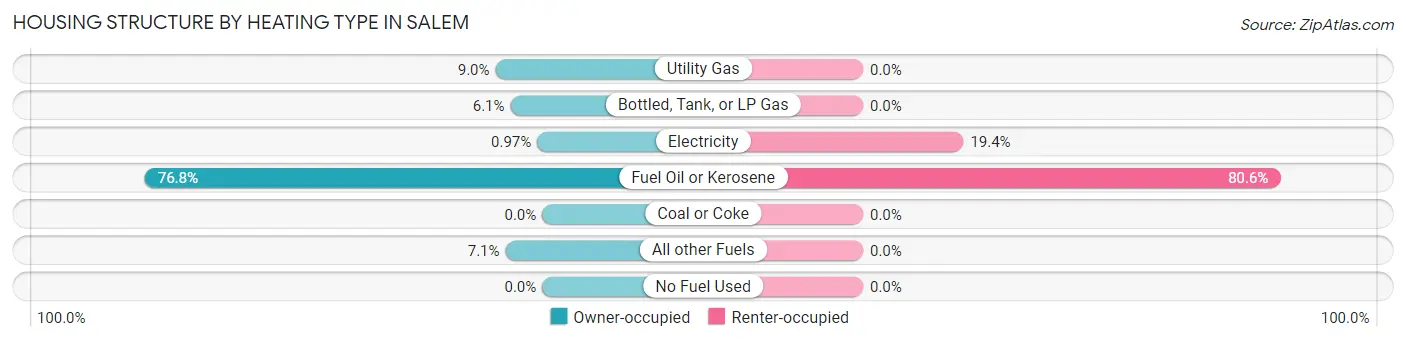
| Heating Type | Owner-occupied | Renter-occupied |
| Utility Gas | 28 (9.0%) | 0 (0.0%) |
| Bottled, Tank, or LP Gas | 19 (6.1%) | 0 (0.0%) |
| Electricity | 3 (1.0%) | 13 (19.4%) |
| Fuel Oil or Kerosene | 238 (76.8%) | 54 (80.6%) |
| Coal or Coke | 0 (0.0%) | 0 (0.0%) |
| All other Fuels | 22 (7.1%) | 0 (0.0%) |
| No Fuel Used | 0 (0.0%) | 0 (0.0%) |
| Total | 310 (100.0%) | 67 (100.0%) |
Household Vehicle Usage in Salem
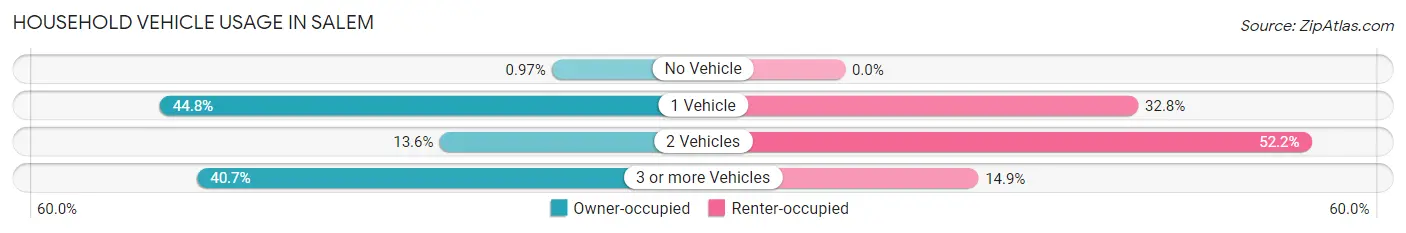
| Vehicles per Household | Owner-occupied | Renter-occupied |
| No Vehicle | 3 (1.0%) | 0 (0.0%) |
| 1 Vehicle | 139 (44.8%) | 22 (32.8%) |
| 2 Vehicles | 42 (13.6%) | 35 (52.2%) |
| 3 or more Vehicles | 126 (40.6%) | 10 (14.9%) |
| Total | 310 (100.0%) | 67 (100.0%) |
Real Estate & Mortgages in Salem
Real Estate and Mortgage Overview in Salem
| Characteristic | Without Mortgage | With Mortgage |
| Housing Units | 166 | 144 |
| Median Property Value | $140,600 | $136,200 |
| Median Household Income | $80,263 | $8 |
| Monthly Housing Costs | $720 | $26 |
| Real Estate Taxes | $2,882 | $0 |
Property Value by Mortgage Status in Salem
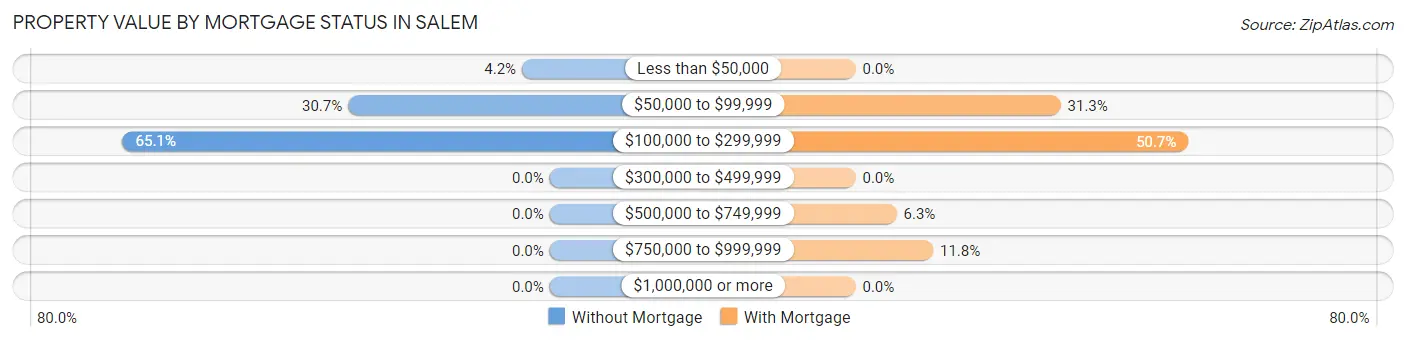
| Property Value | Without Mortgage | With Mortgage |
| Less than $50,000 | 7 (4.2%) | 0 (0.0%) |
| $50,000 to $99,999 | 51 (30.7%) | 45 (31.2%) |
| $100,000 to $299,999 | 108 (65.1%) | 73 (50.7%) |
| $300,000 to $499,999 | 0 (0.0%) | 0 (0.0%) |
| $500,000 to $749,999 | 0 (0.0%) | 9 (6.2%) |
| $750,000 to $999,999 | 0 (0.0%) | 17 (11.8%) |
| $1,000,000 or more | 0 (0.0%) | 0 (0.0%) |
| Total | 166 (100.0%) | 144 (100.0%) |
Household Income by Mortgage Status in Salem
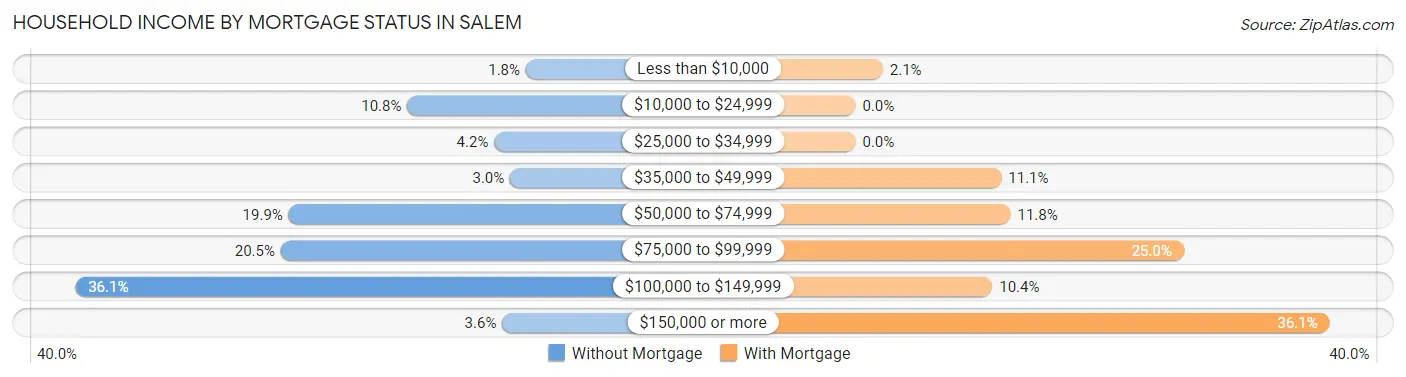
| Household Income | Without Mortgage | With Mortgage |
| Less than $10,000 | 3 (1.8%) | 3 (2.1%) |
| $10,000 to $24,999 | 18 (10.8%) | 0 (0.0%) |
| $25,000 to $34,999 | 7 (4.2%) | 0 (0.0%) |
| $35,000 to $49,999 | 5 (3.0%) | 16 (11.1%) |
| $50,000 to $74,999 | 33 (19.9%) | 17 (11.8%) |
| $75,000 to $99,999 | 34 (20.5%) | 36 (25.0%) |
| $100,000 to $149,999 | 60 (36.1%) | 15 (10.4%) |
| $150,000 or more | 6 (3.6%) | 52 (36.1%) |
| Total | 166 (100.0%) | 144 (100.0%) |
Property Value to Household Income Ratio in Salem
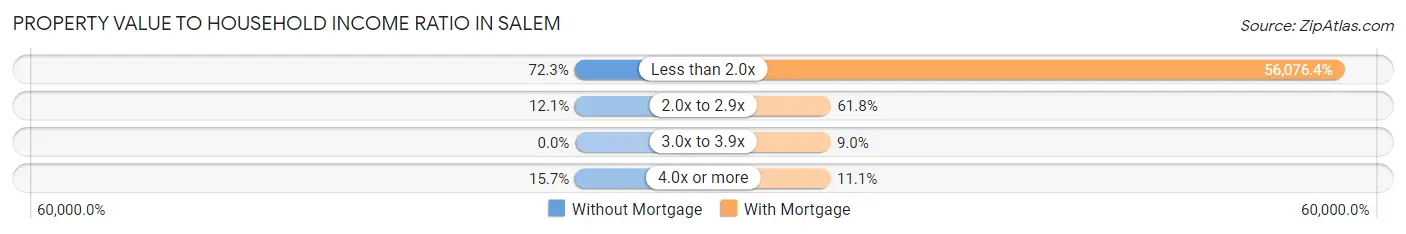
| Value-to-Income Ratio | Without Mortgage | With Mortgage |
| Less than 2.0x | 120 (72.3%) | 80,750 (56,076.4%) |
| 2.0x to 2.9x | 20 (12.0%) | 89 (61.8%) |
| 3.0x to 3.9x | 0 (0.0%) | 13 (9.0%) |
| 4.0x or more | 26 (15.7%) | 16 (11.1%) |
| Total | 166 (100.0%) | 144 (100.0%) |
Real Estate Taxes by Mortgage Status in Salem
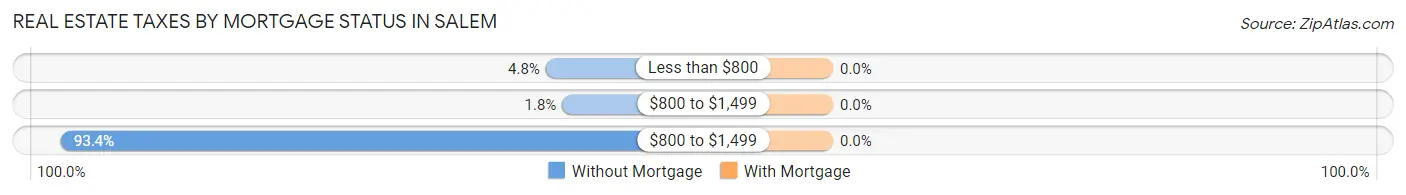
| Property Taxes | Without Mortgage | With Mortgage |
| Less than $800 | 8 (4.8%) | 0 (0.0%) |
| $800 to $1,499 | 3 (1.8%) | 0 (0.0%) |
| $800 to $1,499 | 155 (93.4%) | 0 (0.0%) |
| Total | 166 (100.0%) | 144 (100.0%) |
Health & Disability in Salem
Health Insurance Coverage by Age in Salem
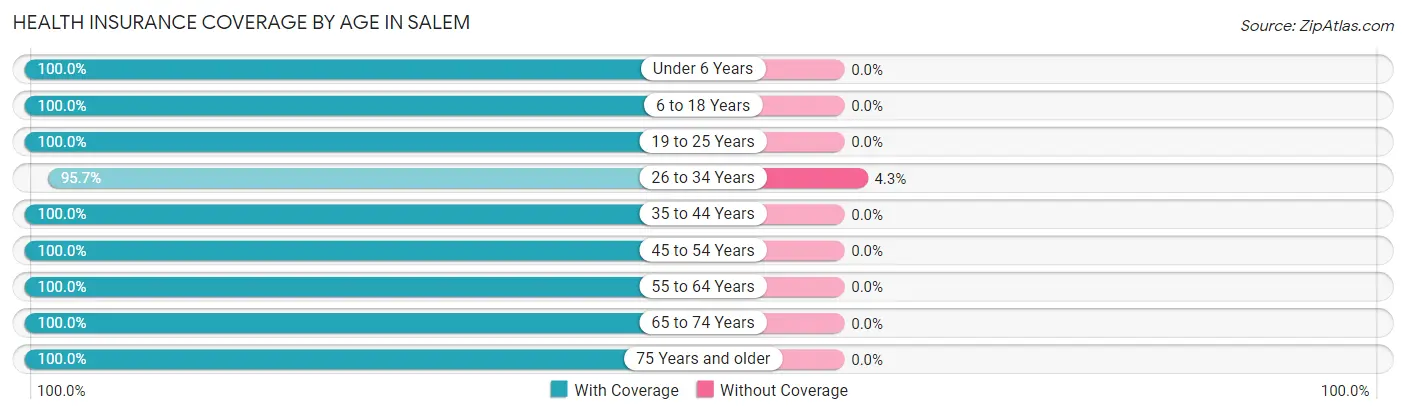
| Age Bracket | With Coverage | Without Coverage |
| Under 6 Years | 78 (100.0%) | 0 (0.0%) |
| 6 to 18 Years | 22 (100.0%) | 0 (0.0%) |
| 19 to 25 Years | 76 (100.0%) | 0 (0.0%) |
| 26 to 34 Years | 177 (95.7%) | 8 (4.3%) |
| 35 to 44 Years | 64 (100.0%) | 0 (0.0%) |
| 45 to 54 Years | 118 (100.0%) | 0 (0.0%) |
| 55 to 64 Years | 149 (100.0%) | 0 (0.0%) |
| 65 to 74 Years | 74 (100.0%) | 0 (0.0%) |
| 75 Years and older | 88 (100.0%) | 0 (0.0%) |
| Total | 846 (99.1%) | 8 (0.9%) |
Health Insurance Coverage by Citizenship Status in Salem
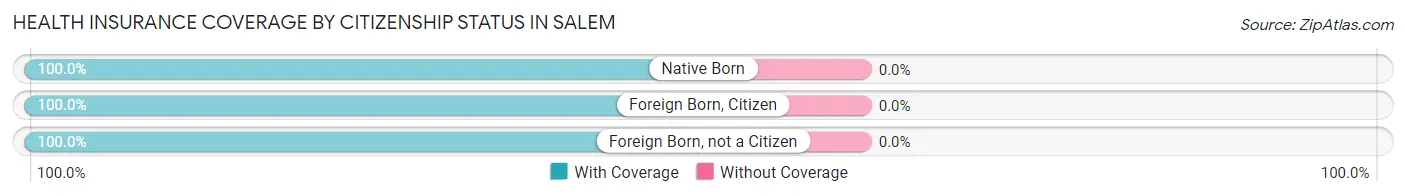
| Citizenship Status | With Coverage | Without Coverage |
| Native Born | 78 (100.0%) | 0 (0.0%) |
| Foreign Born, Citizen | 22 (100.0%) | 0 (0.0%) |
| Foreign Born, not a Citizen | 76 (100.0%) | 0 (0.0%) |
Health Insurance Coverage by Household Income in Salem
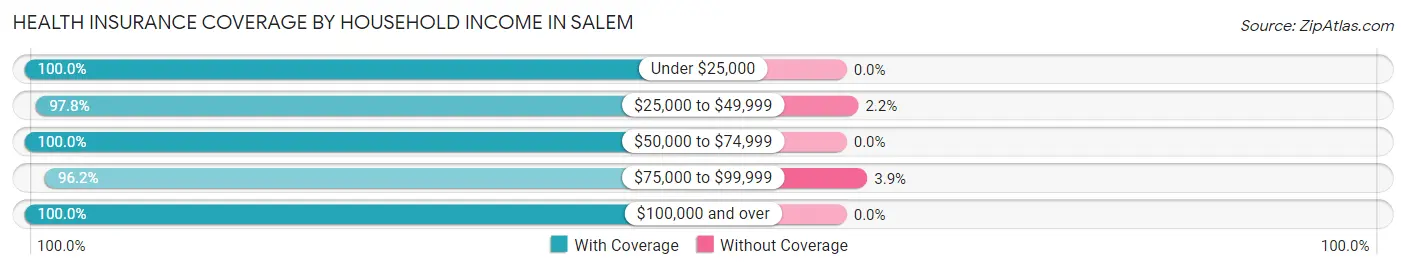
| Household Income | With Coverage | Without Coverage |
| Under $25,000 | 34 (100.0%) | 0 (0.0%) |
| $25,000 to $49,999 | 179 (97.8%) | 4 (2.2%) |
| $50,000 to $74,999 | 119 (100.0%) | 0 (0.0%) |
| $75,000 to $99,999 | 100 (96.2%) | 4 (3.8%) |
| $100,000 and over | 414 (100.0%) | 0 (0.0%) |
Public vs Private Health Insurance Coverage by Age in Salem
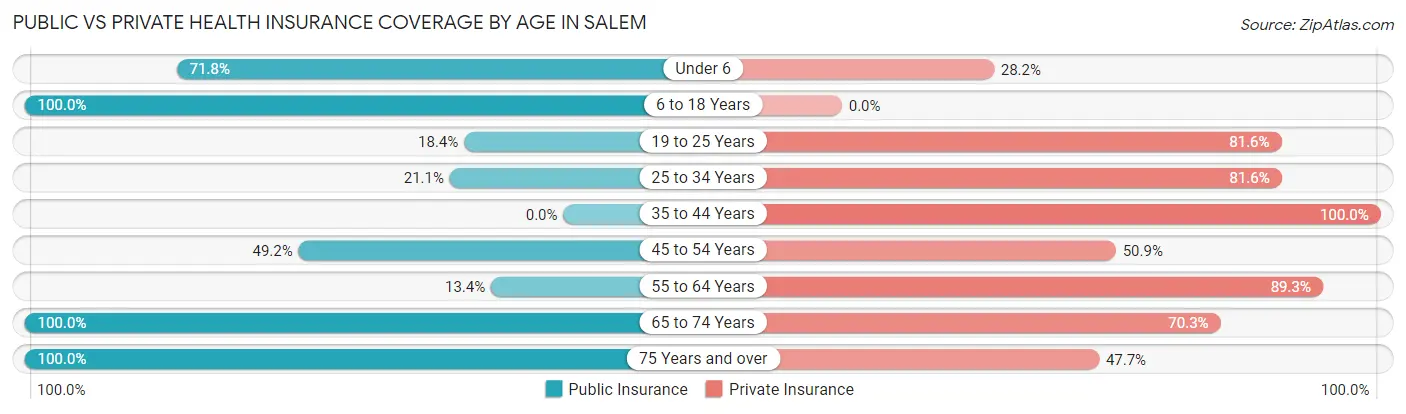
| Age Bracket | Public Insurance | Private Insurance |
| Under 6 | 56 (71.8%) | 22 (28.2%) |
| 6 to 18 Years | 22 (100.0%) | 0 (0.0%) |
| 19 to 25 Years | 14 (18.4%) | 62 (81.6%) |
| 25 to 34 Years | 39 (21.1%) | 151 (81.6%) |
| 35 to 44 Years | 0 (0.0%) | 64 (100.0%) |
| 45 to 54 Years | 58 (49.1%) | 60 (50.8%) |
| 55 to 64 Years | 20 (13.4%) | 133 (89.3%) |
| 65 to 74 Years | 74 (100.0%) | 52 (70.3%) |
| 75 Years and over | 88 (100.0%) | 42 (47.7%) |
| Total | 371 (43.4%) | 586 (68.6%) |
Disability Status by Sex by Age in Salem
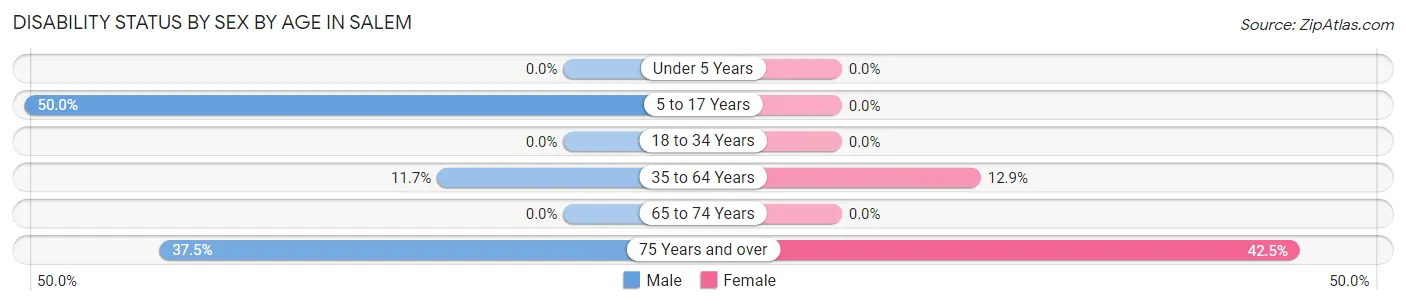
| Age Bracket | Male | Female |
| Under 5 Years | 0 (0.0%) | 0 (0.0%) |
| 5 to 17 Years | 22 (50.0%) | 0 (0.0%) |
| 18 to 34 Years | 0 (0.0%) | 0 (0.0%) |
| 35 to 64 Years | 17 (11.7%) | 24 (12.9%) |
| 65 to 74 Years | 0 (0.0%) | 0 (0.0%) |
| 75 Years and over | 18 (37.5%) | 17 (42.5%) |
Disability Class by Sex by Age in Salem
Disability Class: Hearing Difficulty
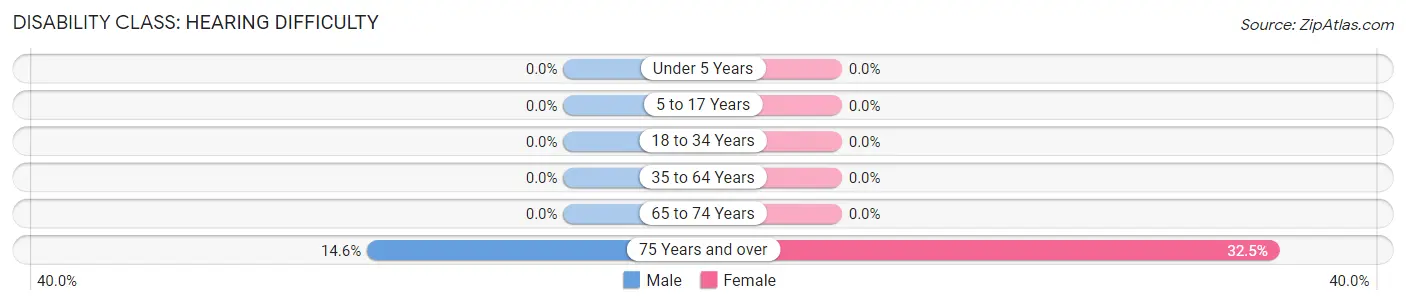
| Age Bracket | Male | Female |
| Under 5 Years | 0 (0.0%) | 0 (0.0%) |
| 5 to 17 Years | 0 (0.0%) | 0 (0.0%) |
| 18 to 34 Years | 0 (0.0%) | 0 (0.0%) |
| 35 to 64 Years | 0 (0.0%) | 0 (0.0%) |
| 65 to 74 Years | 0 (0.0%) | 0 (0.0%) |
| 75 Years and over | 7 (14.6%) | 13 (32.5%) |
Disability Class: Vision Difficulty
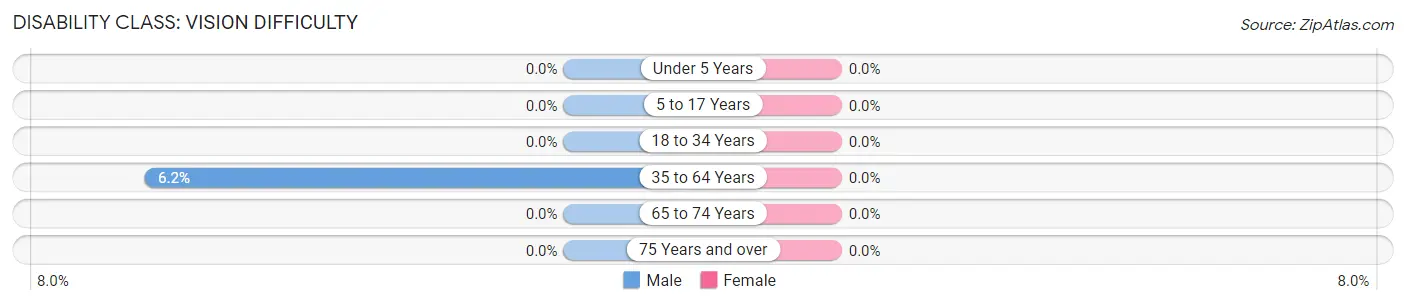
| Age Bracket | Male | Female |
| Under 5 Years | 0 (0.0%) | 0 (0.0%) |
| 5 to 17 Years | 0 (0.0%) | 0 (0.0%) |
| 18 to 34 Years | 0 (0.0%) | 0 (0.0%) |
| 35 to 64 Years | 9 (6.2%) | 0 (0.0%) |
| 65 to 74 Years | 0 (0.0%) | 0 (0.0%) |
| 75 Years and over | 0 (0.0%) | 0 (0.0%) |
Disability Class: Cognitive Difficulty
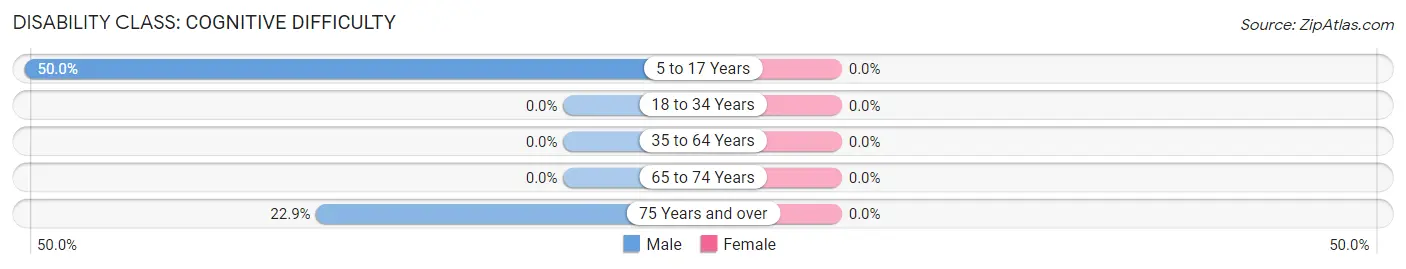
| Age Bracket | Male | Female |
| 5 to 17 Years | 22 (50.0%) | 0 (0.0%) |
| 18 to 34 Years | 0 (0.0%) | 0 (0.0%) |
| 35 to 64 Years | 0 (0.0%) | 0 (0.0%) |
| 65 to 74 Years | 0 (0.0%) | 0 (0.0%) |
| 75 Years and over | 11 (22.9%) | 0 (0.0%) |
Disability Class: Ambulatory Difficulty
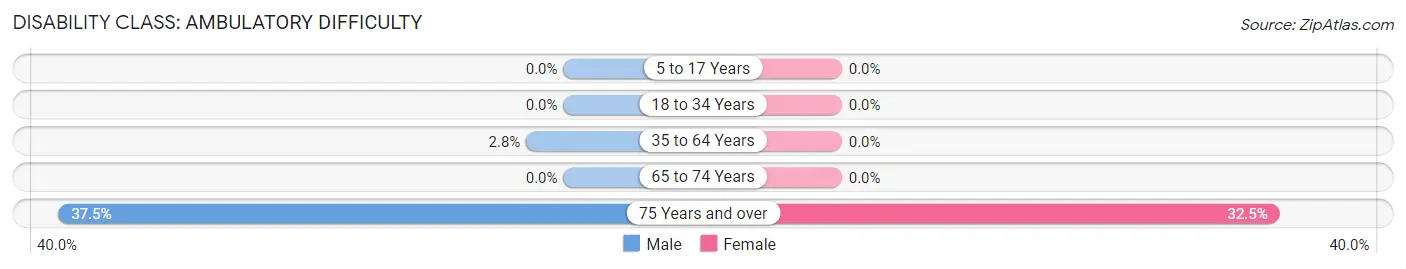
| Age Bracket | Male | Female |
| 5 to 17 Years | 0 (0.0%) | 0 (0.0%) |
| 18 to 34 Years | 0 (0.0%) | 0 (0.0%) |
| 35 to 64 Years | 4 (2.8%) | 0 (0.0%) |
| 65 to 74 Years | 0 (0.0%) | 0 (0.0%) |
| 75 Years and over | 18 (37.5%) | 13 (32.5%) |
Disability Class: Self-Care Difficulty
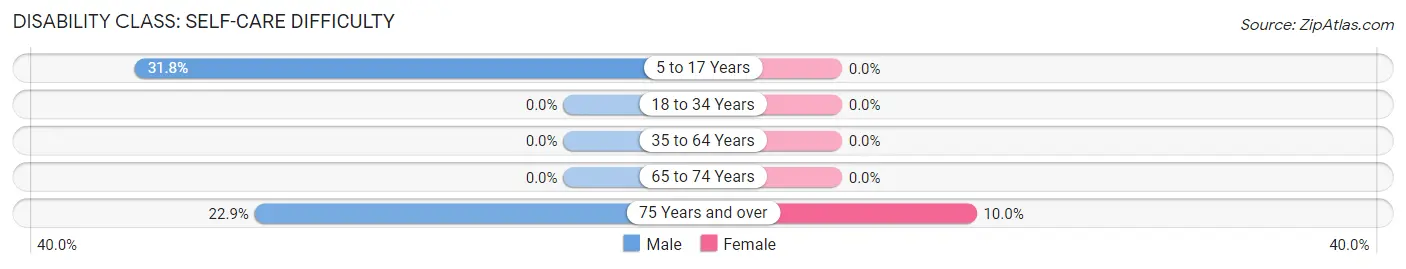
| Age Bracket | Male | Female |
| 5 to 17 Years | 14 (31.8%) | 0 (0.0%) |
| 18 to 34 Years | 0 (0.0%) | 0 (0.0%) |
| 35 to 64 Years | 0 (0.0%) | 0 (0.0%) |
| 65 to 74 Years | 0 (0.0%) | 0 (0.0%) |
| 75 Years and over | 11 (22.9%) | 4 (10.0%) |
Technology Access in Salem
Computing Device Access in Salem
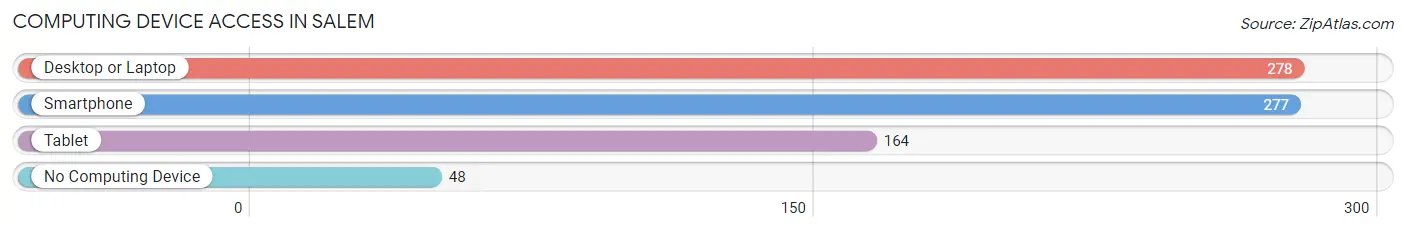
| Device Type | # Households | % Households |
| Desktop or Laptop | 278 | 73.7% |
| Smartphone | 277 | 73.5% |
| Tablet | 164 | 43.5% |
| No Computing Device | 48 | 12.7% |
| Total | 377 | 100.0% |
Internet Access in Salem
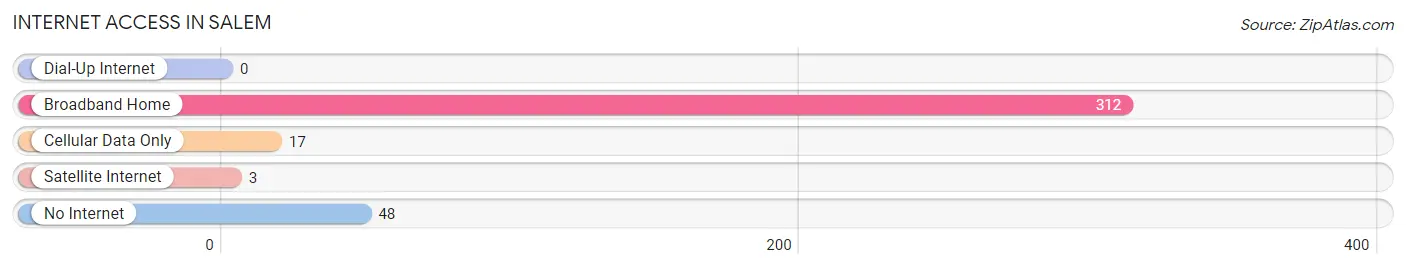
| Internet Type | # Households | % Households |
| Dial-Up Internet | 0 | 0.0% |
| Broadband Home | 312 | 82.8% |
| Cellular Data Only | 17 | 4.5% |
| Satellite Internet | 3 | 0.8% |
| No Internet | 48 | 12.7% |
| Total | 377 | 100.0% |
Salem Summary
Salem, New York is a small town located in Washington County, in the state of New York. It is situated in the foothills of the Adirondack Mountains, and is part of the Glens Falls Metropolitan Statistical Area. The town has a population of approximately 2,500 people, and is known for its rural charm and small-town atmosphere.
Geography
Salem is located in the foothills of the Adirondack Mountains, and is situated in the southeastern corner of Washington County. The town is bordered by the towns of Hebron, White Creek, and Argyle. The town is located approximately 25 miles south of Glens Falls, and is situated along the banks of the Batten Kill River. The town has a total area of 24.2 square miles, of which 24.1 square miles is land and 0.1 square miles is water.
History
The town of Salem was first settled in 1763 by a group of settlers from Connecticut. The town was originally known as “Salem Corners”, and was later renamed to Salem in 1808. The town was officially incorporated in 1815.
In the early 19th century, Salem was a thriving agricultural community, and was known for its production of apples, potatoes, and other crops. The town was also home to several mills, which were powered by the Batten Kill River.
In the late 19th century, the town began to experience a decline in its agricultural industry, and many of the mills began to close. The town’s economy shifted to focus on tourism, and the town began to attract visitors from all over the country.
Economy
Today, Salem’s economy is largely based on tourism. The town is home to several bed and breakfasts, as well as a variety of restaurants and shops. The town is also home to several wineries, and is a popular destination for wine tasting.
The town is also home to several small businesses, including a variety of antique stores, art galleries, and craft stores. The town is also home to several farms, which produce a variety of fruits and vegetables.
Demographics
As of the 2010 census, the town of Salem had a population of 2,500 people. The racial makeup of the town was 97.2% White, 0.8% African American, 0.4% Native American, 0.4% Asian, and 0.8% from other races. Hispanic or Latino of any race were 1.2% of the population.
The median income for a household in the town was $45,000, and the median income for a family was $50,000. The per capita income for the town was $20,000. About 10.2% of families and 12.2% of the population were below the poverty line, including 16.2% of those under age 18 and 8.2% of those age 65 or over.
Conclusion
Salem, New York is a small town located in Washington County, in the state of New York. It is situated in the foothills of the Adirondack Mountains, and is part of the Glens Falls Metropolitan Statistical Area. The town has a population of approximately 2,500 people, and is known for its rural charm and small-town atmosphere. The town’s economy is largely based on tourism, and the town is home to several bed and breakfasts, restaurants, wineries, and small businesses. The town has a diverse population, with a median income of $45,000 for a household and $50,000 for a family. Salem is a charming town with a rich history and a bright future.
Common Questions
What is the Total Population of Salem?
Total Population of Salem is 854.
What is the Total Male Population of Salem?
Total Male Population of Salem is 378.
What is the Total Female Population of Salem?
Total Female Population of Salem is 476.
What is the Ratio of Males per 100 Females in Salem?
There are 79.41 Males per 100 Females in Salem.
What is the Ratio of Females per 100 Males in Salem?
There are 125.93 Females per 100 Males in Salem.
What is the Median Population Age in Salem?
Median Population Age in Salem is 47.5 Years.
What is the Average Family Size in Salem
Average Family Size in Salem is 3.2 People.
What is the Average Household Size in Salem
Average Household Size in Salem is 2.3 People.
What is Per Capita Income in Salem?
Per Capita income in Salem is $41,164.
What is the Median Family Income in Salem?
Median Family Income in Salem is $76,750.
What is the Median Household income in Salem?
Median Household Income in Salem is $75,250.
What is Income or Wage Gap in Salem?
Income or Wage Gap in Salem is 48.6%.
Women in Salem earn 51.4 cents for every dollar earned by a man.
What is Inequality or Gini Index in Salem?
Inequality or Gini Index in Salem is 0.33.
How Large is the Labor Force in Salem?
There are 535 People in the Labor Forcein in Salem.
What is the Percentage of People in the Labor Force in Salem?
71.0% of People are in the Labor Force in Salem.
What is the Unemployment Rate in Salem?
Unemployment Rate in Salem is 10.7%.