Zip Codes with the Highest Percentage of Population Employed in Agriculture, Fishing & Hunting in Poughkeepsie, NY

RELATED REPORTS & OPTIONS

Agriculture, Fishing & Hunting
Population
Families and Households
Female Fertility
Female Fertility (Unmarried)
Race (Community Size)
Race (Percentage)
Ancestry (Community Size)
AfghanAfricanAlbanianAmericanArabArgentineanArmenianAustrianBarbadianBhutaneseBlackfeetBrazilianBritishBritish West IndianBurmeseCanadianCentral AmericanCentral American IndianCherokeeChileanColombianCosta RicanCroatianCubanCzechCzechoslovakianDanishDominicanDutchEastern EuropeanEcuadorianEgyptianEnglishEstonianEuropeanFilipinoFrenchFrench CanadianGermanGreekGuatemalanGuyaneseHaitianHonduranHungarianIndian (Asian)IrishIsraeliItalianJamaicanJordanianKenyanKoreanLebaneseLithuanianMexicanMexican American IndianMoroccanNigerianNorthern EuropeanNorwegianPanamanianPeruvianPolishPortuguesePuerto RicanRomanianRussianSalvadoranScandinavianScotch-IrishScottishSlavicSlovakSouth AmericanSpaniardSpanishSri LankanSubsaharan AfricanSwedishSwissThaiTrinidadian and TobagonianTurkishUkrainianWelshWest IndianYugoslavian
Ancestry (Percentage)
AfghanAfricanAlbanianAmericanArabArgentineanArmenianAustrianBarbadianBhutaneseBlackfeetBrazilianBritishBritish West IndianBurmeseCanadianCentral AmericanCentral American IndianCherokeeChileanColombianCosta RicanCroatianCubanCzechCzechoslovakianDanishDominicanDutchEastern EuropeanEcuadorianEgyptianEnglishEstonianEuropeanFilipinoFrenchFrench CanadianGermanGreekGuatemalanGuyaneseHaitianHonduranHungarianIndian (Asian)IrishIsraeliItalianJamaicanJordanianKenyanKoreanLebaneseLithuanianMexicanMexican American IndianMoroccanNigerianNorthern EuropeanNorwegianPanamanianPeruvianPolishPortuguesePuerto RicanRomanianRussianSalvadoranScandinavianScotch-IrishScottishSlavicSlovakSouth AmericanSpaniardSpanishSri LankanSubsaharan AfricanSwedishSwissThaiTrinidadian and TobagonianTurkishUkrainianWelshWest IndianYugoslavian
Immigrant Origin (Total)
Immigrant Origin (Percentage)
Income
Income (Families)
Income (Households)
Poverty
Poverty (Families)
Unemployment
Employment Occupations
Employment Industries
Employer Class
Commute Time
Commute Means
School Enrollment
Education by Degree Field
Occupancy
Finances
Physical Characteristics
Poughkeepsie
Compare Zip Codes
Comparison Subject

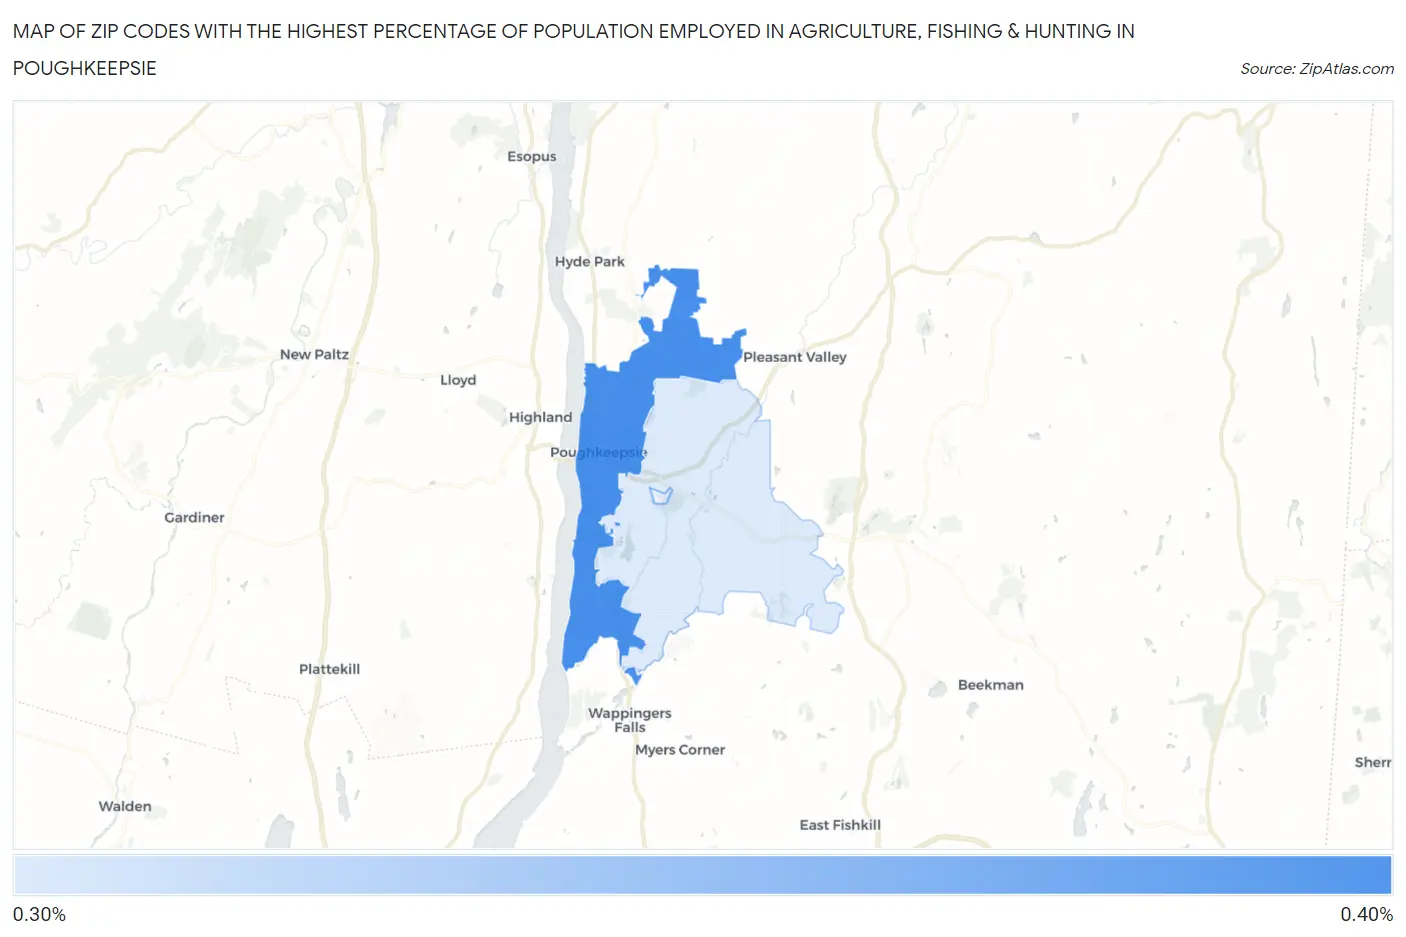
Map of Zip Codes with the Highest Percentage of Population Employed in Agriculture, Fishing & Hunting in Poughkeepsie

0.0%
0.40%
Zip Codes with the Highest Percentage of Population Employed in Agriculture, Fishing & Hunting in Poughkeepsie Map

Zip Codes with the Highest Percentage of Population Employed in Agriculture, Fishing & Hunting in Poughkeepsie, NY

Zip Code % Employed vs State vs National
1.126010.37%0.50%(-0.129)#8201.2%(-0.829)#20,428
2.126030.36%0.50%(-0.140)#8281.2%(-0.839)#20,549

Common Questions

What are the Top Zip Codes with the Highest Percentage of Population Employed in Agriculture, Fishing & Hunting in Poughkeepsie, NY?
Top Zip Codes with the Highest Percentage of Population Employed in Agriculture, Fishing & Hunting in Poughkeepsie, NY are:
#1
0.37%
#2
0.36%
#3
0.0%
What zip code has the Highest Percentage of Population Employed in Agriculture, Fishing & Hunting in Poughkeepsie, NY?
12601 has the Highest Percentage of Population Employed in Agriculture, Fishing & Hunting in Poughkeepsie, NY with 0.37%.
What is the Percentage of Population Employed in Agriculture, Fishing & Hunting in Poughkeepsie, NY?
Percentage of Population Employed in Agriculture, Fishing & Hunting in Poughkeepsie is 0.36%.
What is the Percentage of Population Employed in Agriculture, Fishing & Hunting in New York?
Percentage of Population Employed in Agriculture, Fishing & Hunting in New York is 0.50%.
What is the Percentage of Population Employed in Agriculture, Fishing & Hunting in the United States?
Percentage of Population Employed in Agriculture, Fishing & Hunting in the United States is 1.2%.