Pottersville, NY
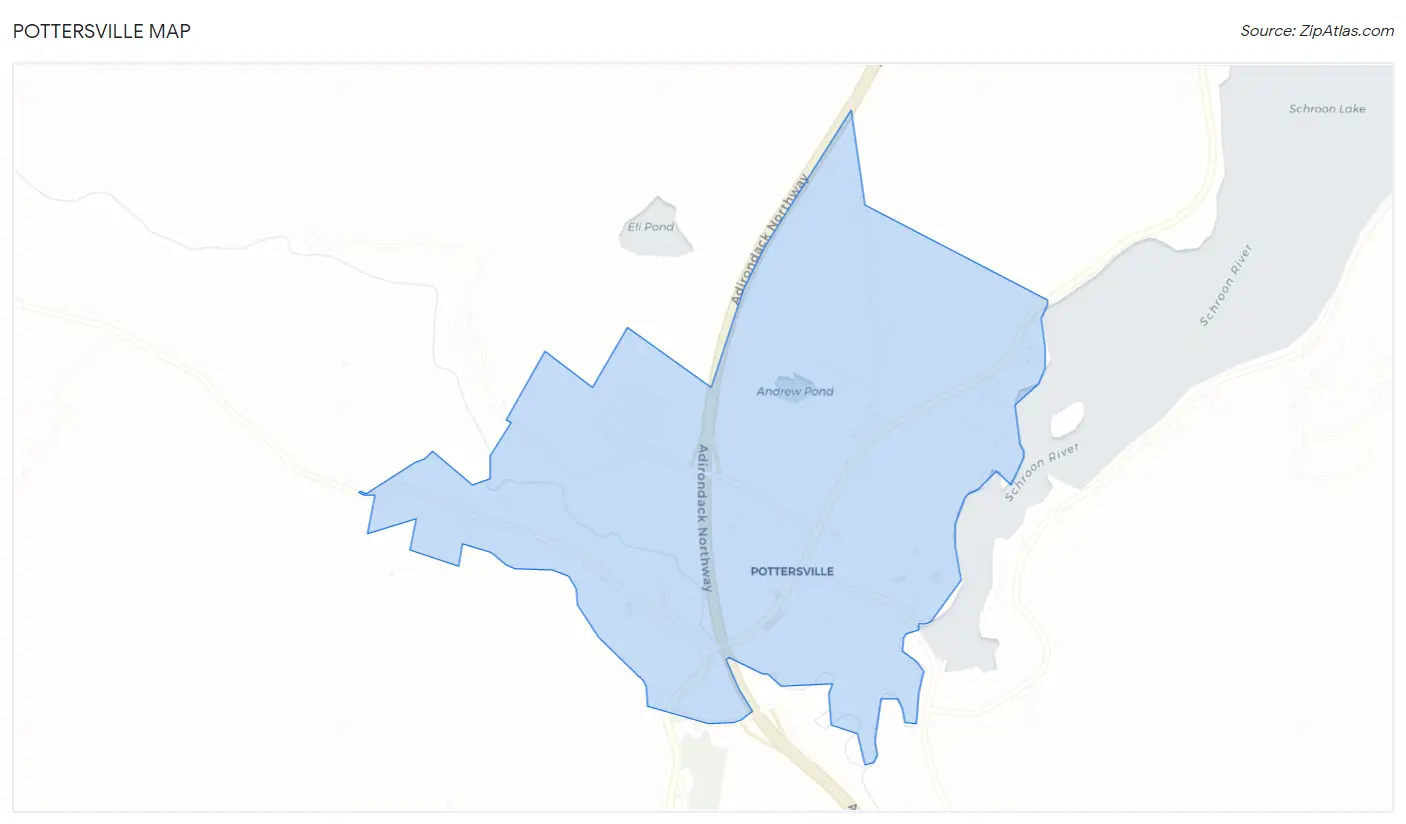
Pottersville Map
Pottersville Overview
149
TOTAL POPULATION
89
MALE POPULATION
60
FEMALE POPULATION
148.33
MALES / 100 FEMALES
67.42
FEMALES / 100 MALES
34.7
MEDIAN AGE
2.3
AVG FAMILY SIZE
2.4
AVG HOUSEHOLD SIZE
$23,821
PER CAPITA INCOME
$58,854
AVG FAMILY INCOME
$57,708
AVG HOUSEHOLD INCOME
0.18
INEQUALITY / GINI INDEX
79
LABOR FORCE [ PEOPLE ]
65.3%
PERCENT IN LABOR FORCE
Pottersville Zip Codes
Pottersville Area Codes
Race in Pottersville
The most populous races in Pottersville are White / Caucasian (92 | 61.7%), Two or more Races (49 | 32.9%), and Asian (5 | 3.4%).
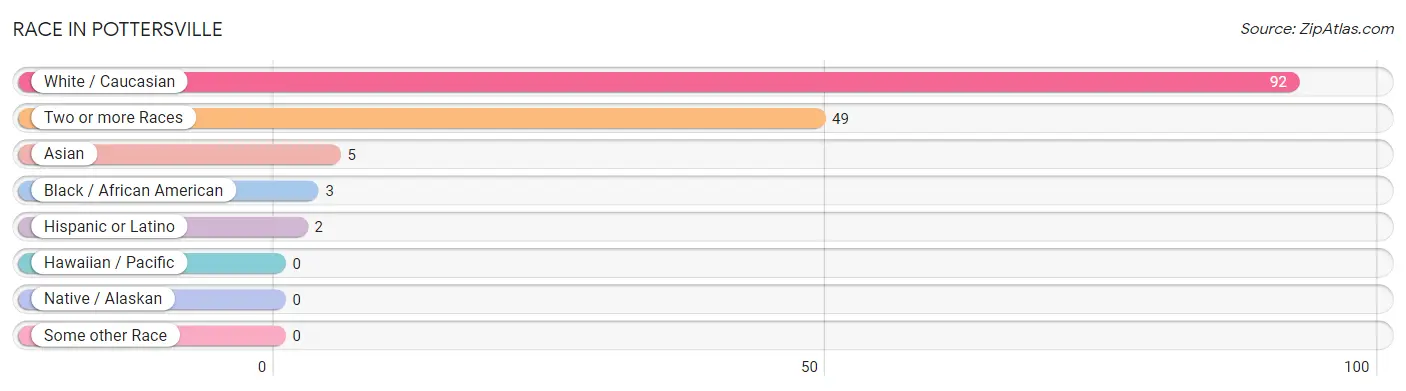
| Race | # Population | % Population |
| Asian | 5 | 3.4% |
| Black / African American | 3 | 2.0% |
| Hawaiian / Pacific | 0 | 0.0% |
| Hispanic or Latino | 2 | 1.3% |
| Native / Alaskan | 0 | 0.0% |
| White / Caucasian | 92 | 61.7% |
| Two or more Races | 49 | 32.9% |
| Some other Race | 0 | 0.0% |
| Total | 149 | 100.0% |
Ancestry in Pottersville
The most populous ancestries reported in Pottersville are Irish (60 | 40.3%), Italian (51 | 34.2%), English (21 | 14.1%), French (9 | 6.0%), and German (7 | 4.7%), together accounting for 99.3% of all Pottersville residents.
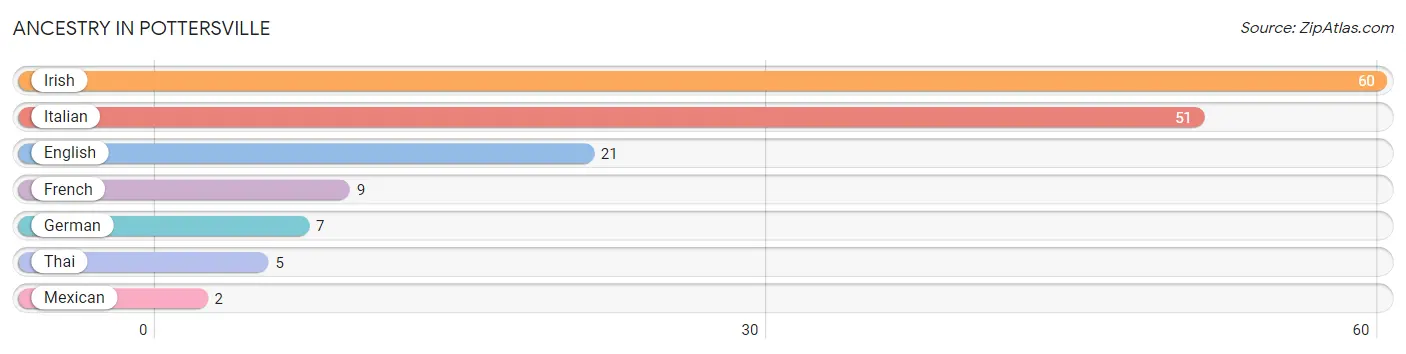
| Ancestry | # Population | % Population |
| English | 21 | 14.1% |
| French | 9 | 6.0% |
| German | 7 | 4.7% |
| Irish | 60 | 40.3% |
| Italian | 51 | 34.2% |
| Mexican | 2 | 1.3% |
| Thai | 5 | 3.4% | View All 7 Rows |
Immigrants in Pottersville

| Immigration Origin | # Population | % Population | View All 0 Rows |
Sex and Age in Pottersville
Sex and Age in Pottersville
The most populous age groups in Pottersville are 20 to 24 Years (22 | 24.7%) for men and 50 to 54 Years (28 | 46.7%) for women.
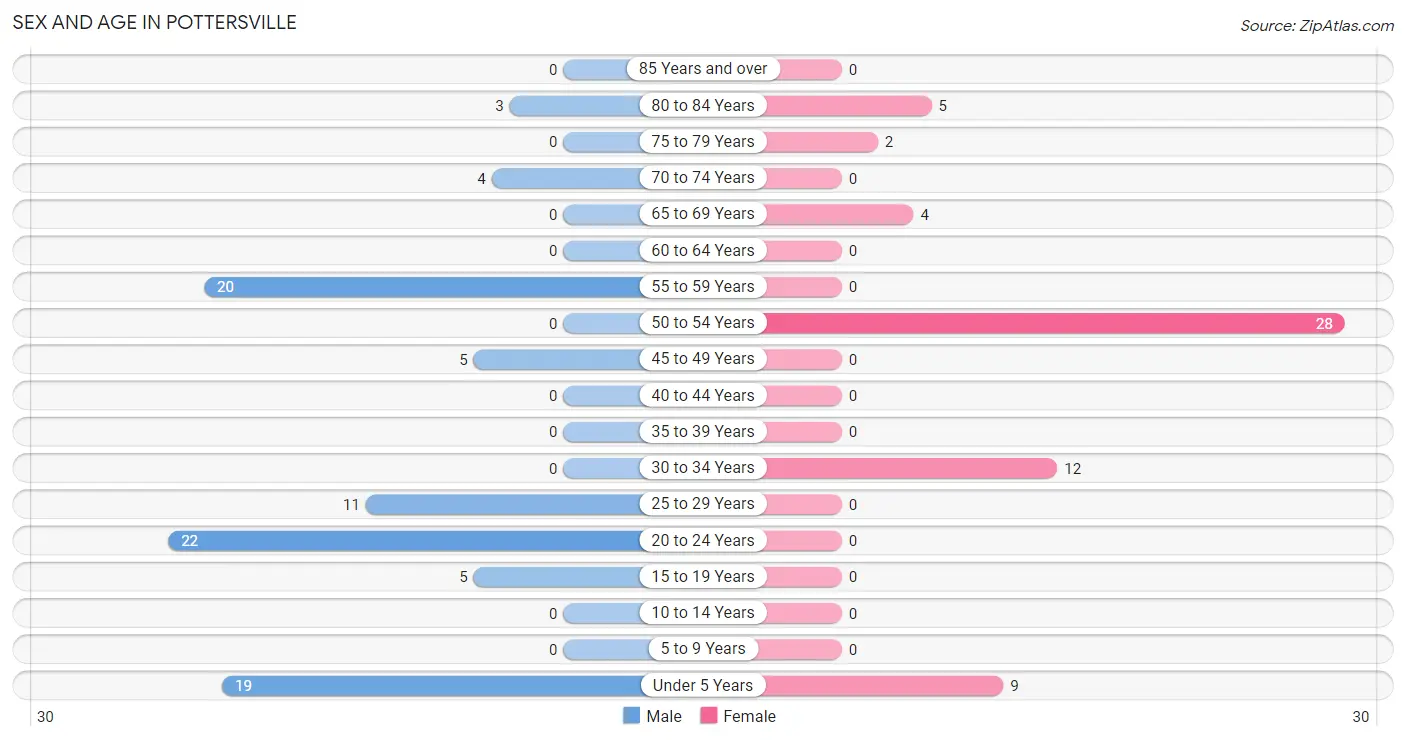
| Age Bracket | Male | Female |
| Under 5 Years | 19 (21.3%) | 9 (15.0%) |
| 5 to 9 Years | 0 (0.0%) | 0 (0.0%) |
| 10 to 14 Years | 0 (0.0%) | 0 (0.0%) |
| 15 to 19 Years | 5 (5.6%) | 0 (0.0%) |
| 20 to 24 Years | 22 (24.7%) | 0 (0.0%) |
| 25 to 29 Years | 11 (12.4%) | 0 (0.0%) |
| 30 to 34 Years | 0 (0.0%) | 12 (20.0%) |
| 35 to 39 Years | 0 (0.0%) | 0 (0.0%) |
| 40 to 44 Years | 0 (0.0%) | 0 (0.0%) |
| 45 to 49 Years | 5 (5.6%) | 0 (0.0%) |
| 50 to 54 Years | 0 (0.0%) | 28 (46.7%) |
| 55 to 59 Years | 20 (22.5%) | 0 (0.0%) |
| 60 to 64 Years | 0 (0.0%) | 0 (0.0%) |
| 65 to 69 Years | 0 (0.0%) | 4 (6.7%) |
| 70 to 74 Years | 4 (4.5%) | 0 (0.0%) |
| 75 to 79 Years | 0 (0.0%) | 2 (3.3%) |
| 80 to 84 Years | 3 (3.4%) | 5 (8.3%) |
| 85 Years and over | 0 (0.0%) | 0 (0.0%) |
| Total | 89 (100.0%) | 60 (100.0%) |
Families and Households in Pottersville
Median Family Size in Pottersville
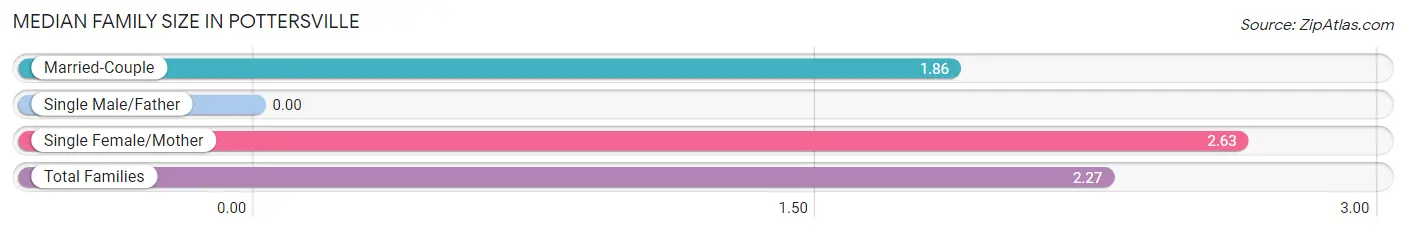
| Family Type | # Families | Family Size |
| Married-Couple | 21 (46.7%) | 1.86 |
| Single Male/Father | 0 (0.0%) | - |
| Single Female/Mother | 24 (53.3%) | 2.63 |
| Total Families | 45 (100.0%) | 2.27 |
Median Household Size in Pottersville
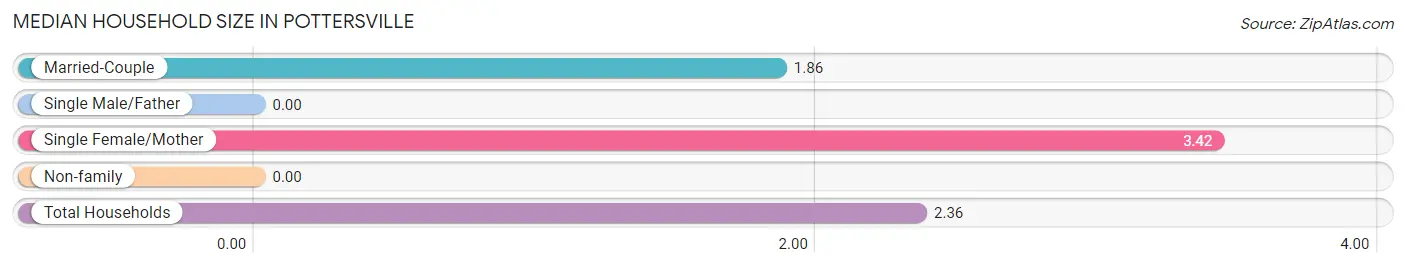
| Household Type | # Households | Household Size |
| Married-Couple | 21 (37.5%) | 1.86 |
| Single Male/Father | 0 (0.0%) | - |
| Single Female/Mother | 24 (42.9%) | 3.42 |
| Non-family | 11 (19.6%) | - |
| Total Households | 56 (100.0%) | 2.36 |
Household Size by Marriage Status in Pottersville
Out of a total of 56 households in Pottersville, 45 (80.4%) are family households, while 11 (19.6%) are nonfamily households. The most numerous type of family households are 2-person households, comprising 30, and the most common type of nonfamily households are 1-person households, comprising 11.
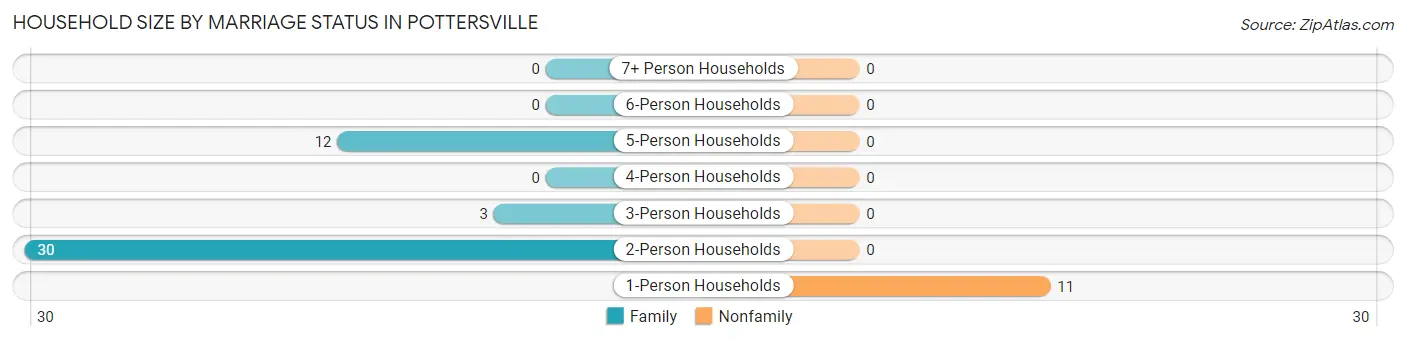
| Household Size | Family Households | Nonfamily Households |
| 1-Person Households | - | 11 (19.6%) |
| 2-Person Households | 30 (53.6%) | 0 (0.0%) |
| 3-Person Households | 3 (5.4%) | 0 (0.0%) |
| 4-Person Households | 0 (0.0%) | 0 (0.0%) |
| 5-Person Households | 12 (21.4%) | 0 (0.0%) |
| 6-Person Households | 0 (0.0%) | 0 (0.0%) |
| 7+ Person Households | 0 (0.0%) | 0 (0.0%) |
| Total | 45 (80.4%) | 11 (19.6%) |
Female Fertility in Pottersville
Fertility by Age in Pottersville
| Age Bracket | Women with Births | Births / 1,000 Women |
| 15 to 19 years | 0 (0.0%) | 0.0 |
| 20 to 34 years | 0 (0.0%) | 0.0 |
| 35 to 50 years | 0 (0.0%) | 0.0 |
| Total | 0 (0.0%) | 0.0 |
Fertility by Age by Marriage Status in Pottersville
| Age Bracket | Married | Unmarried |
| 15 to 19 years | 0 (0.0%) | 0 (0.0%) |
| 20 to 34 years | 0 (0.0%) | 0 (0.0%) |
| 35 to 50 years | 0 (0.0%) | 0 (0.0%) |
| Total | 0 (0.0%) | 0 (0.0%) |
Fertility by Education in Pottersville
| Educational Attainment | Women with Births | Births / 1,000 Women |
| Less than High School | 0 (0.0%) | 0.0 |
| High School Diploma | 0 (0.0%) | 0.0 |
| College or Associate's Degree | 0 (0.0%) | 0.0 |
| Bachelor's Degree | 0 (0.0%) | 0.0 |
| Graduate Degree | 0 (0.0%) | 0.0 |
| Total | 0 (0.0%) | 0.0 |
Fertility by Education by Marriage Status in Pottersville
| Educational Attainment | Married | Unmarried |
| Less than High School | 0 (0.0%) | 0 (0.0%) |
| High School Diploma | 0 (0.0%) | 0 (0.0%) |
| College or Associate's Degree | 0 (0.0%) | 0 (0.0%) |
| Bachelor's Degree | 0 (0.0%) | 0 (0.0%) |
| Graduate Degree | 0 (0.0%) | 0 (0.0%) |
| Total | 0 (0.0%) | 0 (0.0%) |
Income in Pottersville
Income Overview in Pottersville
Per Capita Income in Pottersville is $23,821, while median incomes of families and households are $58,854 and $57,708 respectively.
| Characteristic | Number | Measure |
| Per Capita Income | 149 | $23,821 |
| Median Family Income | 45 | $58,854 |
| Mean Family Income | 45 | $57,218 |
| Median Household Income | 56 | $57,708 |
| Mean Household Income | 56 | $65,086 |
| Income Deficit | 45 | $0 |
| Wage / Income Gap (%) | 149 | 0.00% |
| Wage / Income Gap ($) | 149 | 100.00¢ per $1 |
| Gini / Inequality Index | 149 | 0.18 |
Earnings by Sex in Pottersville
| Sex | Number | Average Earnings |
| Male | 44 (52.4%) | $0 |
| Female | 40 (47.6%) | $0 |
| Total | 84 (100.0%) | $0 |
Earnings by Sex by Income Bracket in Pottersville
The most common earnings brackets in Pottersville are $40,000 to $44,999 for men (19 | 43.2%) and $15,000 to $17,499 for women (14 | 35.0%).
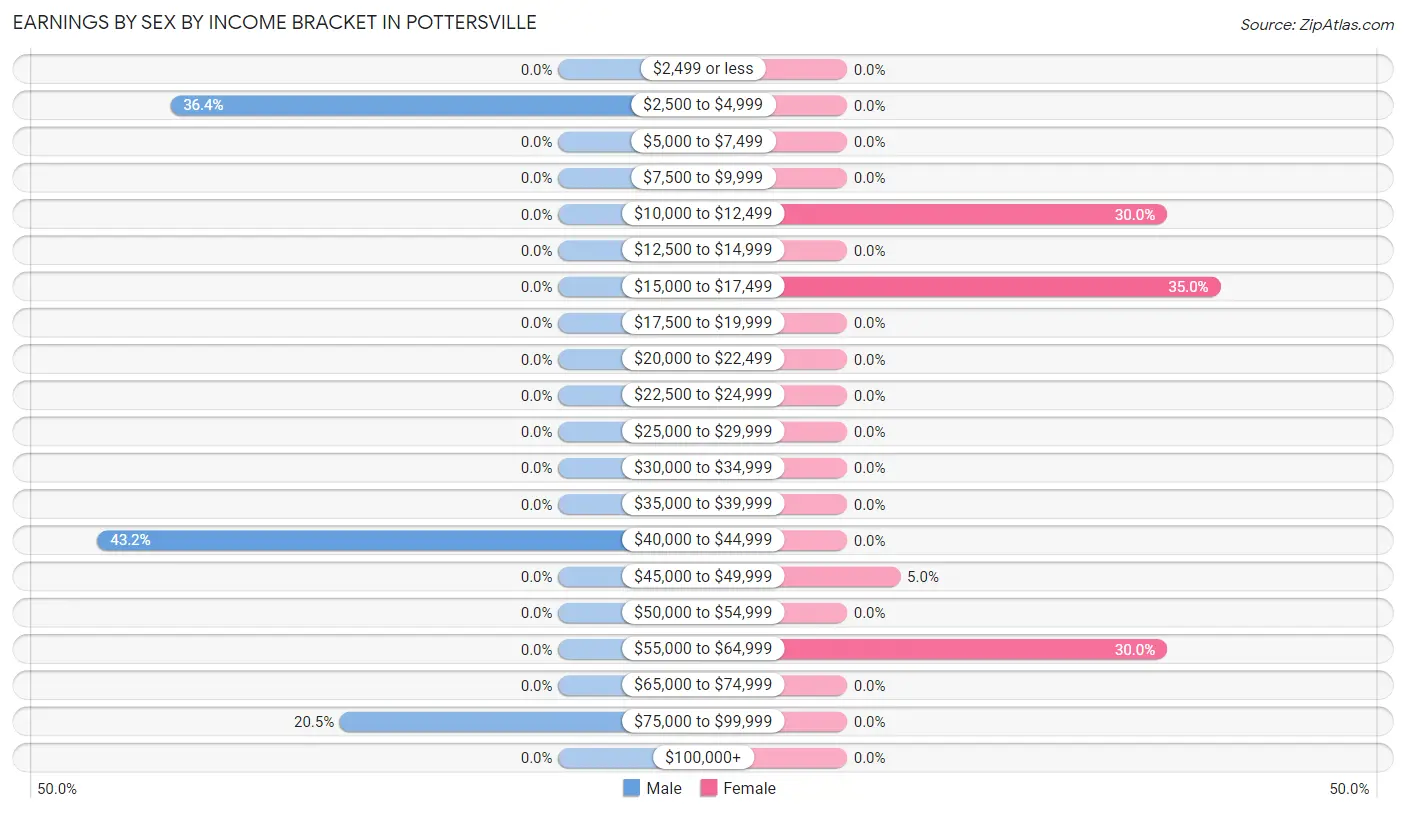
| Income | Male | Female |
| $2,499 or less | 0 (0.0%) | 0 (0.0%) |
| $2,500 to $4,999 | 16 (36.4%) | 0 (0.0%) |
| $5,000 to $7,499 | 0 (0.0%) | 0 (0.0%) |
| $7,500 to $9,999 | 0 (0.0%) | 0 (0.0%) |
| $10,000 to $12,499 | 0 (0.0%) | 12 (30.0%) |
| $12,500 to $14,999 | 0 (0.0%) | 0 (0.0%) |
| $15,000 to $17,499 | 0 (0.0%) | 14 (35.0%) |
| $17,500 to $19,999 | 0 (0.0%) | 0 (0.0%) |
| $20,000 to $22,499 | 0 (0.0%) | 0 (0.0%) |
| $22,500 to $24,999 | 0 (0.0%) | 0 (0.0%) |
| $25,000 to $29,999 | 0 (0.0%) | 0 (0.0%) |
| $30,000 to $34,999 | 0 (0.0%) | 0 (0.0%) |
| $35,000 to $39,999 | 0 (0.0%) | 0 (0.0%) |
| $40,000 to $44,999 | 19 (43.2%) | 0 (0.0%) |
| $45,000 to $49,999 | 0 (0.0%) | 2 (5.0%) |
| $50,000 to $54,999 | 0 (0.0%) | 0 (0.0%) |
| $55,000 to $64,999 | 0 (0.0%) | 12 (30.0%) |
| $65,000 to $74,999 | 0 (0.0%) | 0 (0.0%) |
| $75,000 to $99,999 | 9 (20.4%) | 0 (0.0%) |
| $100,000+ | 0 (0.0%) | 0 (0.0%) |
| Total | 44 (100.0%) | 40 (100.0%) |
Earnings by Sex by Educational Attainment in Pottersville
| Educational Attainment | Male Income | Female Income |
| Less than High School | - | - |
| High School Diploma | - | - |
| College or Associate's Degree | - | - |
| Bachelor's Degree | - | - |
| Graduate Degree | - | - |
| Total | - | - |
Family Income in Pottersville
Family Income Brackets in Pottersville
According to the Pottersville family income data, there are 14 families falling into the $75,000 to $99,999 income range, which is the most common income bracket and makes up 31.1% of all families.
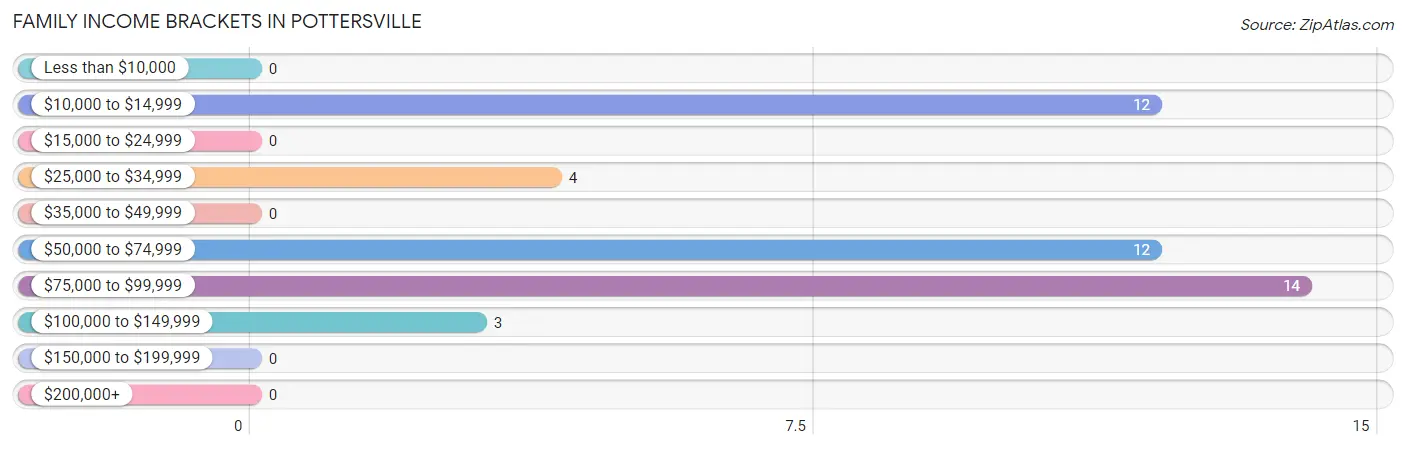
| Income Bracket | # Families | % Families |
| Less than $10,000 | 0 | 0.0% |
| $10,000 to $14,999 | 12 | 26.7% |
| $15,000 to $24,999 | 0 | 0.0% |
| $25,000 to $34,999 | 4 | 8.9% |
| $35,000 to $49,999 | 0 | 0.0% |
| $50,000 to $74,999 | 12 | 26.7% |
| $75,000 to $99,999 | 14 | 31.1% |
| $100,000 to $149,999 | 3 | 6.7% |
| $150,000 to $199,999 | 0 | 0.0% |
| $200,000+ | 0 | 0.0% |
Family Income by Famaliy Size in Pottersville
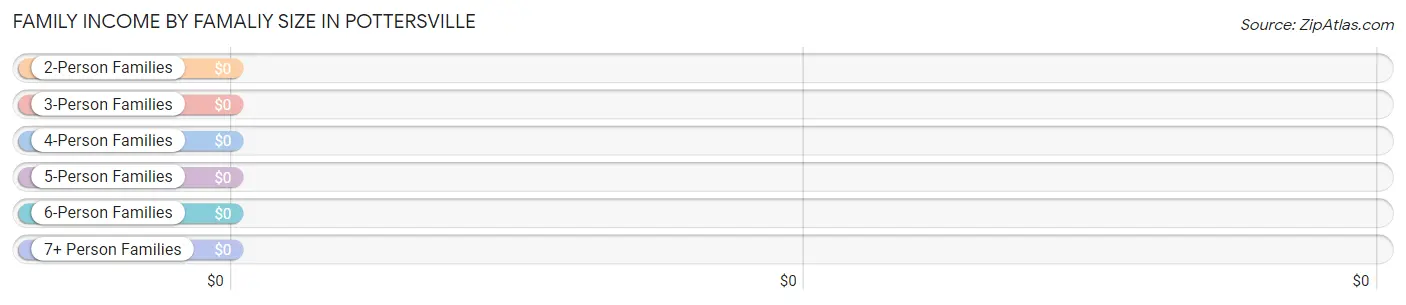
| Income Bracket | # Families | Median Income |
| 2-Person Families | 30 (66.7%) | $0 |
| 3-Person Families | 3 (6.7%) | $0 |
| 4-Person Families | 12 (26.7%) | $0 |
| 5-Person Families | 0 (0.0%) | $0 |
| 6-Person Families | 0 (0.0%) | $0 |
| 7+ Person Families | 0 (0.0%) | $0 |
| Total | 45 (100.0%) | $58,854 |
Family Income by Number of Earners in Pottersville
| Number of Earners | # Families | Median Income |
| No Earners | 4 (8.9%) | $0 |
| 1 Earner | 15 (33.3%) | $0 |
| 2 Earners | 26 (57.8%) | $0 |
| 3+ Earners | 0 (0.0%) | $0 |
| Total | 45 (100.0%) | $58,854 |
Household Income in Pottersville
Household Income Brackets in Pottersville
With 35 households falling in the category, the $50,000 to $74,999 income range is the most frequent in Pottersville, accounting for 62.5% of all households.
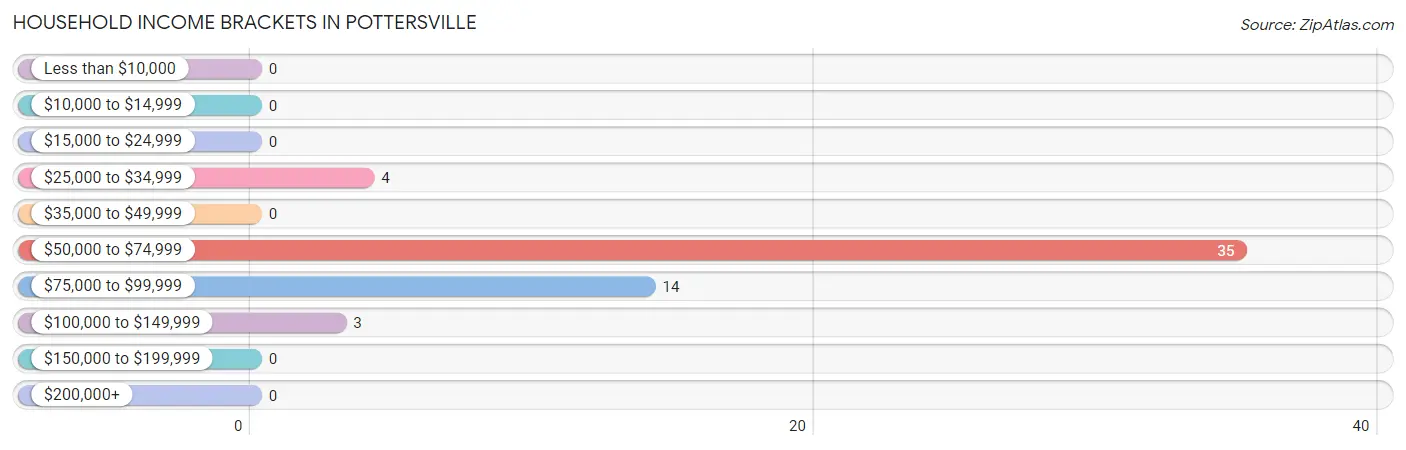
| Income Bracket | # Households | % Households |
| Less than $10,000 | 0 | 0.0% |
| $10,000 to $14,999 | 0 | 0.0% |
| $15,000 to $24,999 | 0 | 0.0% |
| $25,000 to $34,999 | 4 | 7.1% |
| $35,000 to $49,999 | 0 | 0.0% |
| $50,000 to $74,999 | 35 | 62.5% |
| $75,000 to $99,999 | 14 | 25.0% |
| $100,000 to $149,999 | 3 | 5.4% |
| $150,000 to $199,999 | 0 | 0.0% |
| $200,000+ | 0 | 0.0% |
Household Income by Householder Age in Pottersville
The median household income in Pottersville is $57,708, with the highest median household income of $59,063 found in the 45 to 64 years age bracket for the primary householder. A total of 37 households (66.1%) fall into this category.
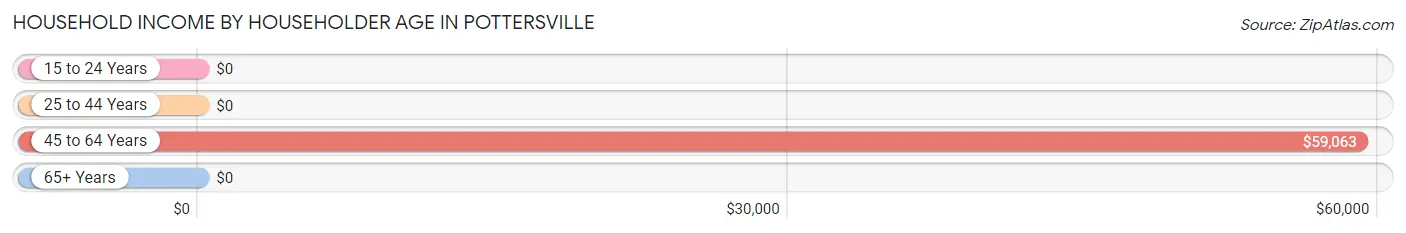
| Income Bracket | # Households | Median Income |
| 15 to 24 Years | 0 (0.0%) | $0 |
| 25 to 44 Years | 12 (21.4%) | $0 |
| 45 to 64 Years | 37 (66.1%) | $59,063 |
| 65+ Years | 7 (12.5%) | $0 |
| Total | 56 (100.0%) | $57,708 |
Poverty in Pottersville
Income Below Poverty by Sex and Age in Pottersville
With 30.9% poverty level for males and 43.3% for females among the residents of Pottersville, under 5 year old males and under 5 year old females are the most vulnerable to poverty, with 19 males (100.0%) and 9 females (100.0%) in their respective age groups living below the poverty level.
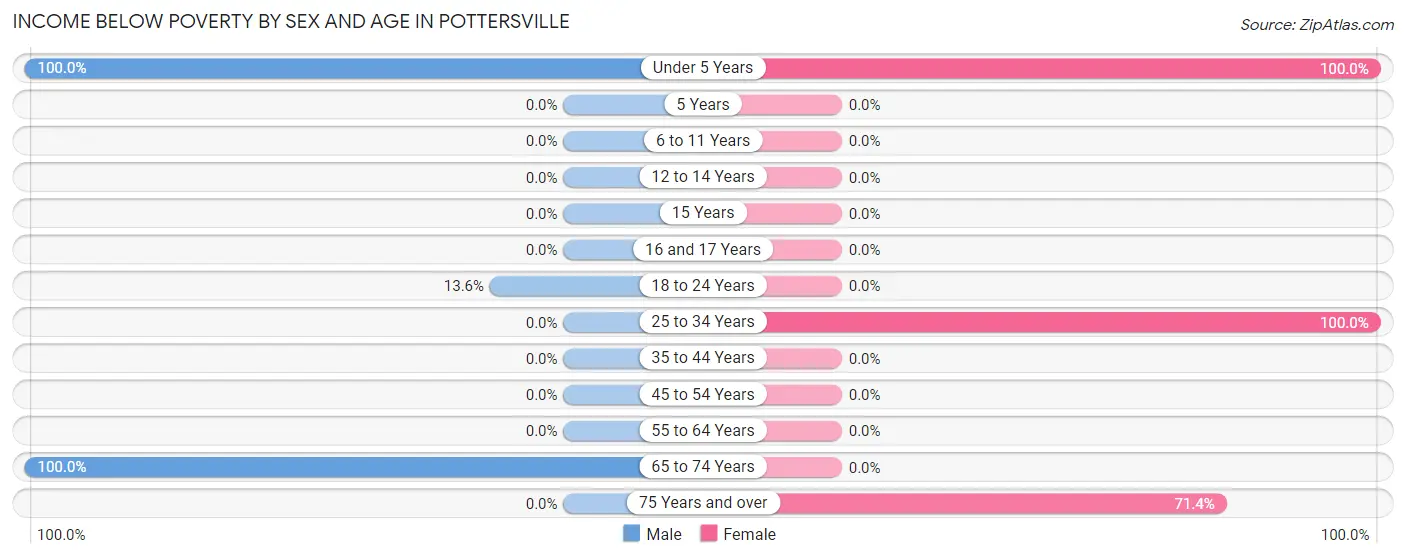
| Age Bracket | Male | Female |
| Under 5 Years | 19 (100.0%) | 9 (100.0%) |
| 5 Years | 0 (0.0%) | 0 (0.0%) |
| 6 to 11 Years | 0 (0.0%) | 0 (0.0%) |
| 12 to 14 Years | 0 (0.0%) | 0 (0.0%) |
| 15 Years | 0 (0.0%) | 0 (0.0%) |
| 16 and 17 Years | 0 (0.0%) | 0 (0.0%) |
| 18 to 24 Years | 3 (13.6%) | 0 (0.0%) |
| 25 to 34 Years | 0 (0.0%) | 12 (100.0%) |
| 35 to 44 Years | 0 (0.0%) | 0 (0.0%) |
| 45 to 54 Years | 0 (0.0%) | 0 (0.0%) |
| 55 to 64 Years | 0 (0.0%) | 0 (0.0%) |
| 65 to 74 Years | 4 (100.0%) | 0 (0.0%) |
| 75 Years and over | 0 (0.0%) | 5 (71.4%) |
| Total | 26 (30.9%) | 26 (43.3%) |
Income Above Poverty by Sex and Age in Pottersville
According to the poverty statistics in Pottersville, males aged 25 to 34 years and females aged 45 to 54 years are the age groups that are most secure financially, with 100.0% of males and 100.0% of females in these age groups living above the poverty line.
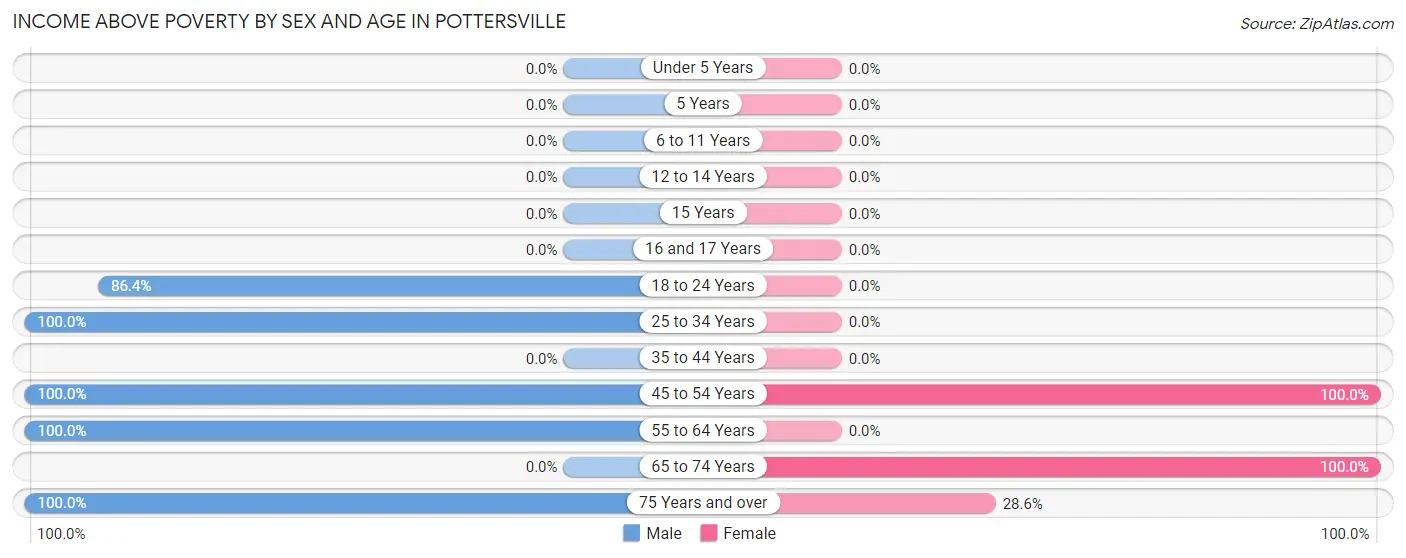
| Age Bracket | Male | Female |
| Under 5 Years | 0 (0.0%) | 0 (0.0%) |
| 5 Years | 0 (0.0%) | 0 (0.0%) |
| 6 to 11 Years | 0 (0.0%) | 0 (0.0%) |
| 12 to 14 Years | 0 (0.0%) | 0 (0.0%) |
| 15 Years | 0 (0.0%) | 0 (0.0%) |
| 16 and 17 Years | 0 (0.0%) | 0 (0.0%) |
| 18 to 24 Years | 19 (86.4%) | 0 (0.0%) |
| 25 to 34 Years | 11 (100.0%) | 0 (0.0%) |
| 35 to 44 Years | 0 (0.0%) | 0 (0.0%) |
| 45 to 54 Years | 5 (100.0%) | 28 (100.0%) |
| 55 to 64 Years | 20 (100.0%) | 0 (0.0%) |
| 65 to 74 Years | 0 (0.0%) | 4 (100.0%) |
| 75 Years and over | 3 (100.0%) | 2 (28.6%) |
| Total | 58 (69.1%) | 34 (56.7%) |
Income Below Poverty Among Married-Couple Families in Pottersville
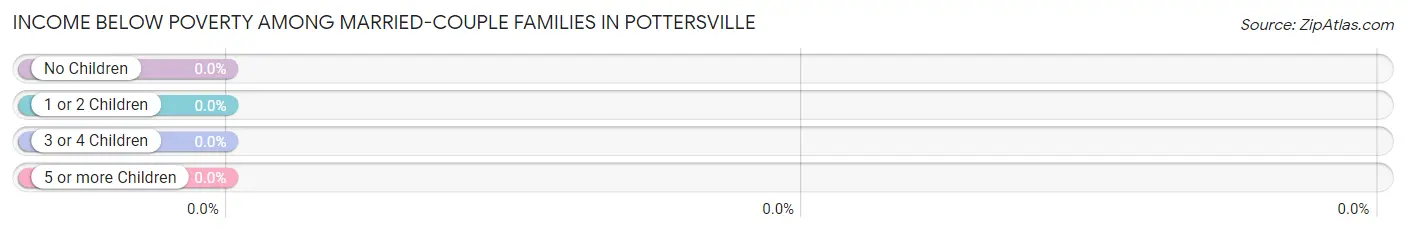
| Children | Above Poverty | Below Poverty |
| No Children | 21 (100.0%) | 0 (0.0%) |
| 1 or 2 Children | 0 (0.0%) | 0 (0.0%) |
| 3 or 4 Children | 0 (0.0%) | 0 (0.0%) |
| 5 or more Children | 0 (0.0%) | 0 (0.0%) |
| Total | 21 (100.0%) | 0 (0.0%) |
Income Below Poverty Among Single-Parent Households in Pottersville
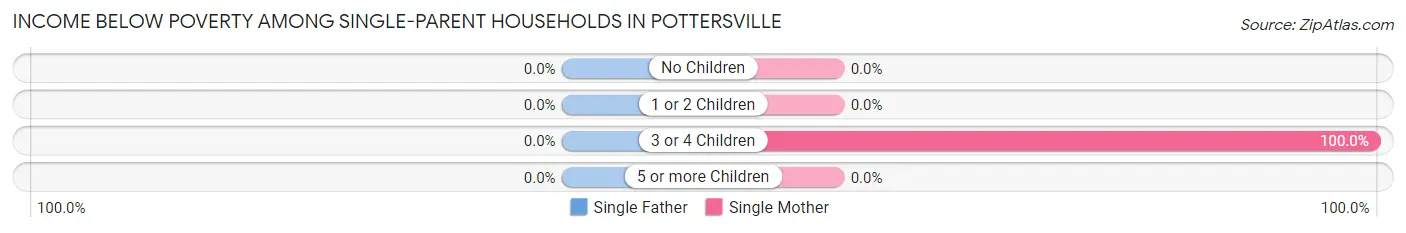
| Children | Single Father | Single Mother |
| No Children | 0 (0.0%) | 0 (0.0%) |
| 1 or 2 Children | 0 (0.0%) | 0 (0.0%) |
| 3 or 4 Children | 0 (0.0%) | 12 (100.0%) |
| 5 or more Children | 0 (0.0%) | 0 (0.0%) |
| Total | 0 (0.0%) | 12 (50.0%) |
Income Below Poverty Among Married-Couple vs Single-Parent Households in Pottersville
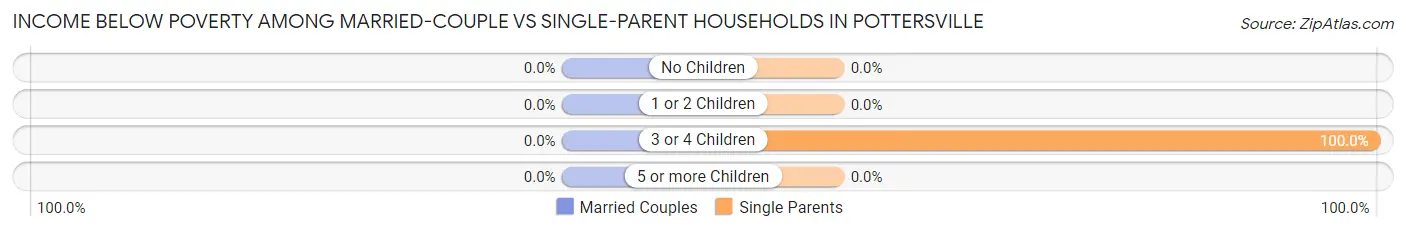
| Children | Married-Couple Families | Single-Parent Households |
| No Children | 0 (0.0%) | 0 (0.0%) |
| 1 or 2 Children | 0 (0.0%) | 0 (0.0%) |
| 3 or 4 Children | 0 (0.0%) | 12 (100.0%) |
| 5 or more Children | 0 (0.0%) | 0 (0.0%) |
| Total | 0 (0.0%) | 12 (50.0%) |
Employment Characteristics in Pottersville
Employment by Class of Employer in Pottersville
Among the 79 employed individuals in Pottersville, private company employees (65 | 82.3%), local government employees (12 | 15.2%), and not-for-profit organizations (2 | 2.5%) make up the most common classes of employment.
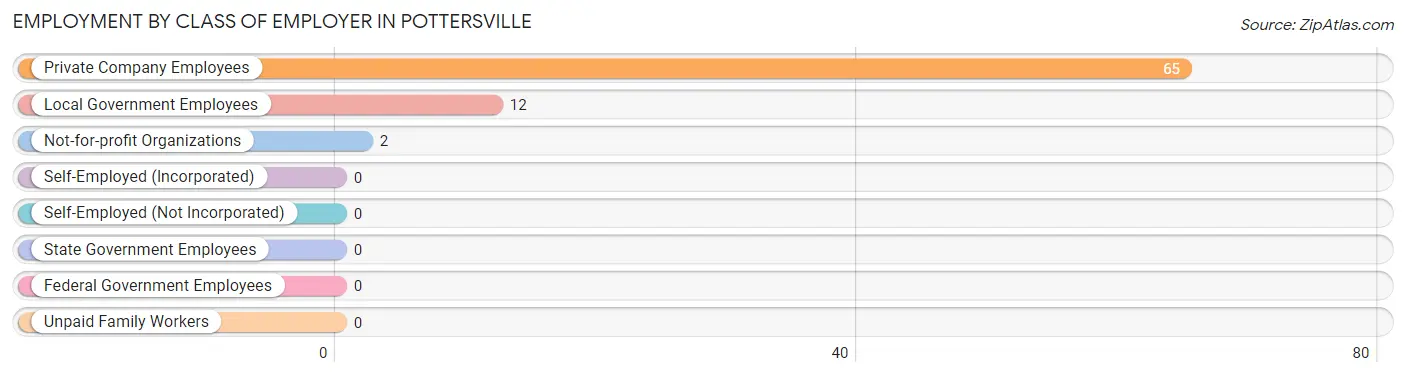
| Employer Class | # Employees | % Employees |
| Private Company Employees | 65 | 82.3% |
| Self-Employed (Incorporated) | 0 | 0.0% |
| Self-Employed (Not Incorporated) | 0 | 0.0% |
| Not-for-profit Organizations | 2 | 2.5% |
| Local Government Employees | 12 | 15.2% |
| State Government Employees | 0 | 0.0% |
| Federal Government Employees | 0 | 0.0% |
| Unpaid Family Workers | 0 | 0.0% |
| Total | 79 | 100.0% |
Employment Status by Age in Pottersville
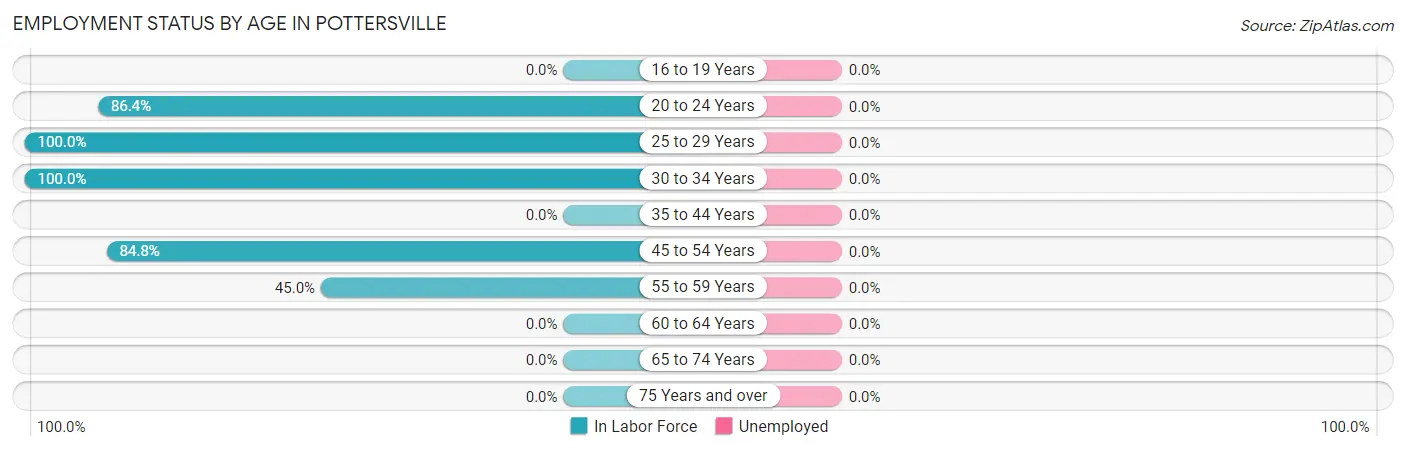
| Age Bracket | In Labor Force | Unemployed |
| 16 to 19 Years | 0 (0.0%) | 0 (0.0%) |
| 20 to 24 Years | 19 (86.4%) | 0 (0.0%) |
| 25 to 29 Years | 11 (100.0%) | 0 (0.0%) |
| 30 to 34 Years | 12 (100.0%) | 0 (0.0%) |
| 35 to 44 Years | 0 (0.0%) | 0 (0.0%) |
| 45 to 54 Years | 28 (84.8%) | 0 (0.0%) |
| 55 to 59 Years | 9 (45.0%) | 0 (0.0%) |
| 60 to 64 Years | 0 (0.0%) | 0 (0.0%) |
| 65 to 74 Years | 0 (0.0%) | 0 (0.0%) |
| 75 Years and over | 0 (0.0%) | 0 (0.0%) |
| Total | 79 (65.3%) | 0 (0.0%) |
Employment Status by Educational Attainment in Pottersville
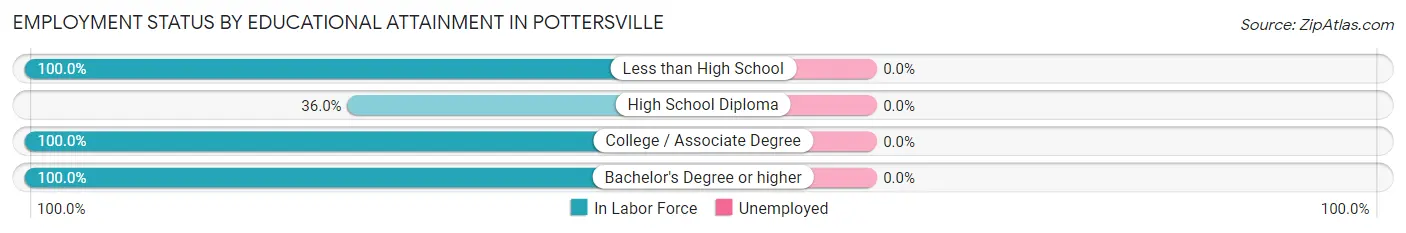
| Educational Attainment | In Labor Force | Unemployed |
| Less than High School | 12 (100.0%) | 0 (0.0%) |
| High School Diploma | 9 (36.0%) | 0 (0.0%) |
| College / Associate Degree | 23 (100.0%) | 0 (0.0%) |
| Bachelor's Degree or higher | 16 (100.0%) | 0 (0.0%) |
| Total | 60 (78.9%) | 0 (0.0%) |
Employment Occupations by Sex in Pottersville
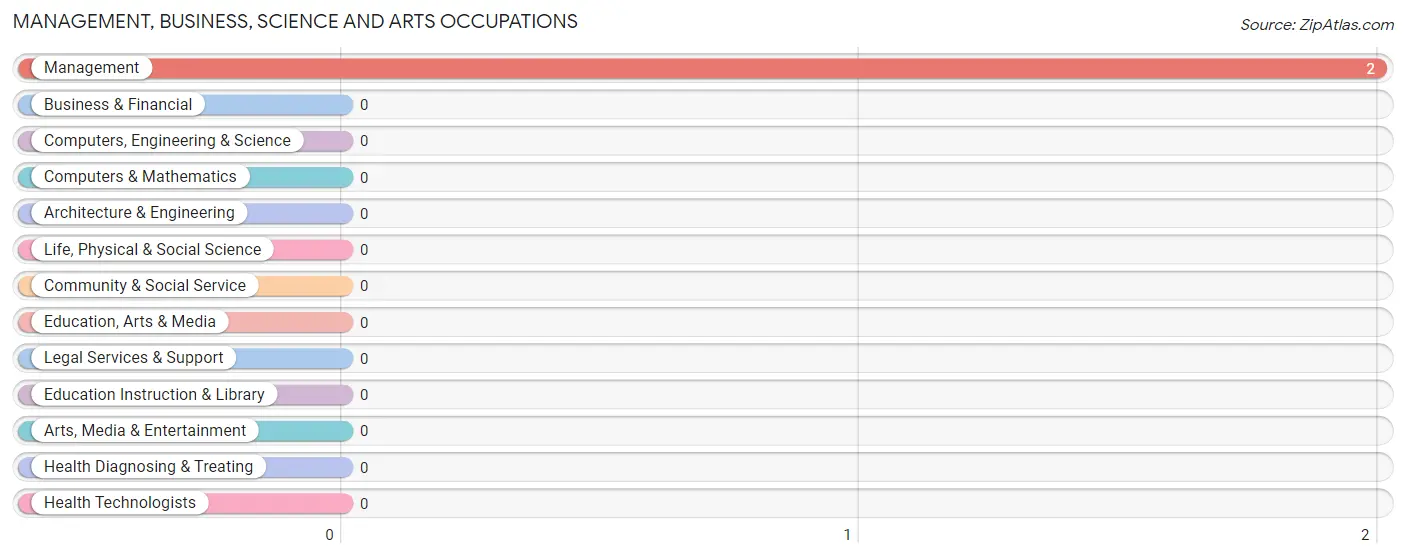
Management, Business, Science and Arts Occupations
The most common Management, Business, Science and Arts occupations in Pottersville are , and Management (2 | 2.5%).
Management, Business, Science and Arts Occupations by Sex
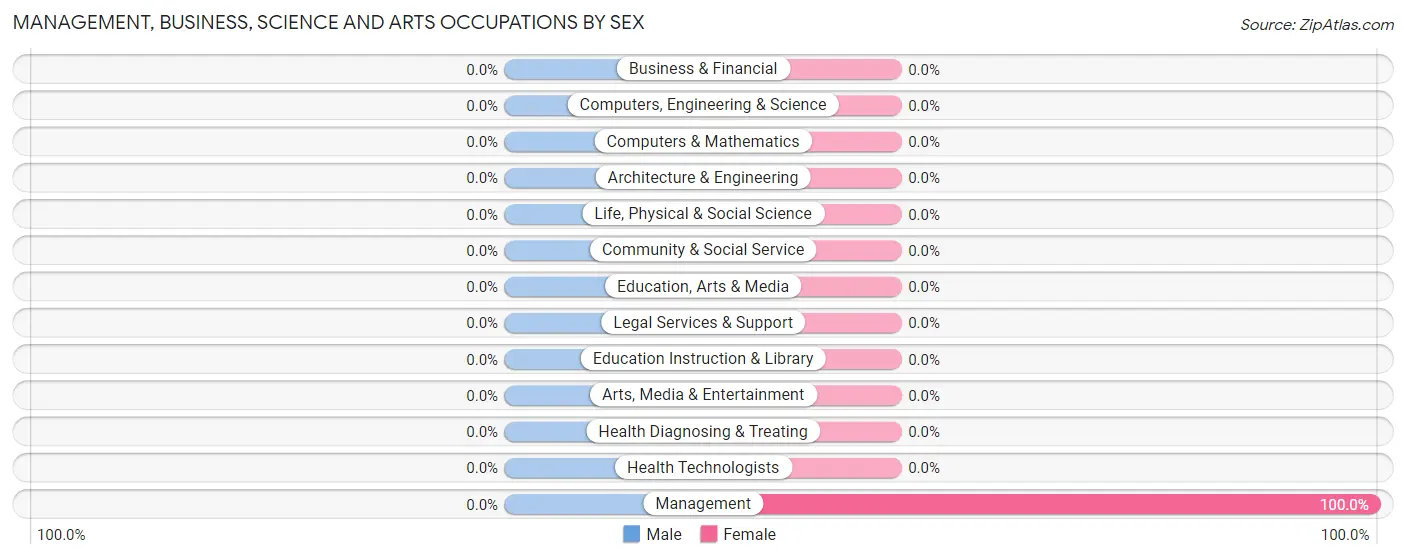
| Occupation | Male | Female |
| Management | 0 (0.0%) | 2 (100.0%) |
| Business & Financial | 0 (0.0%) | 0 (0.0%) |
| Computers, Engineering & Science | 0 (0.0%) | 0 (0.0%) |
| Computers & Mathematics | 0 (0.0%) | 0 (0.0%) |
| Architecture & Engineering | 0 (0.0%) | 0 (0.0%) |
| Life, Physical & Social Science | 0 (0.0%) | 0 (0.0%) |
| Community & Social Service | 0 (0.0%) | 0 (0.0%) |
| Education, Arts & Media | 0 (0.0%) | 0 (0.0%) |
| Legal Services & Support | 0 (0.0%) | 0 (0.0%) |
| Education Instruction & Library | 0 (0.0%) | 0 (0.0%) |
| Arts, Media & Entertainment | 0 (0.0%) | 0 (0.0%) |
| Health Diagnosing & Treating | 0 (0.0%) | 0 (0.0%) |
| Health Technologists | 0 (0.0%) | 0 (0.0%) |
| Total (Category) | 0 (0.0%) | 2 (100.0%) |
| Total (Overall) | 39 (49.4%) | 40 (50.6%) |
Services Occupations
The most common Services occupations in Pottersville are Cleaning & Maintenance (12 | 15.2%), and Personal Care & Service (12 | 15.2%).
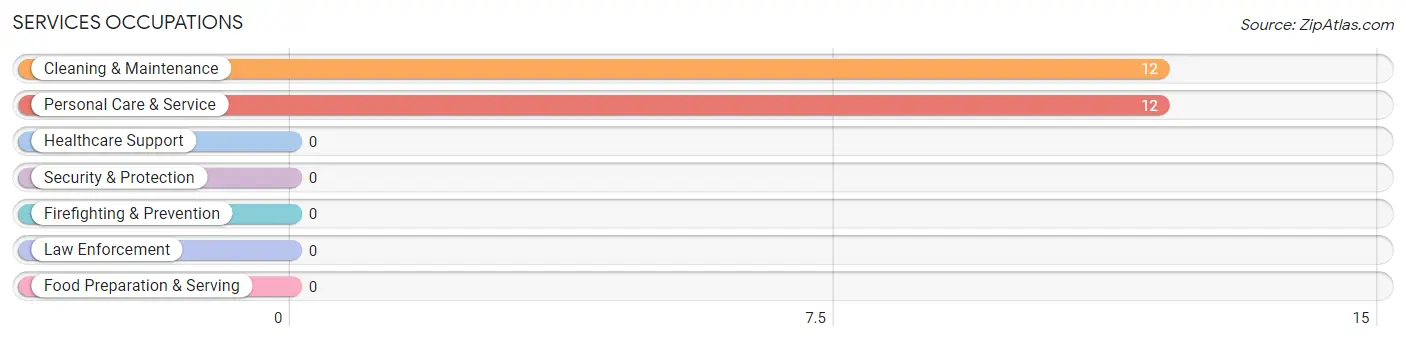
Services Occupations by Sex
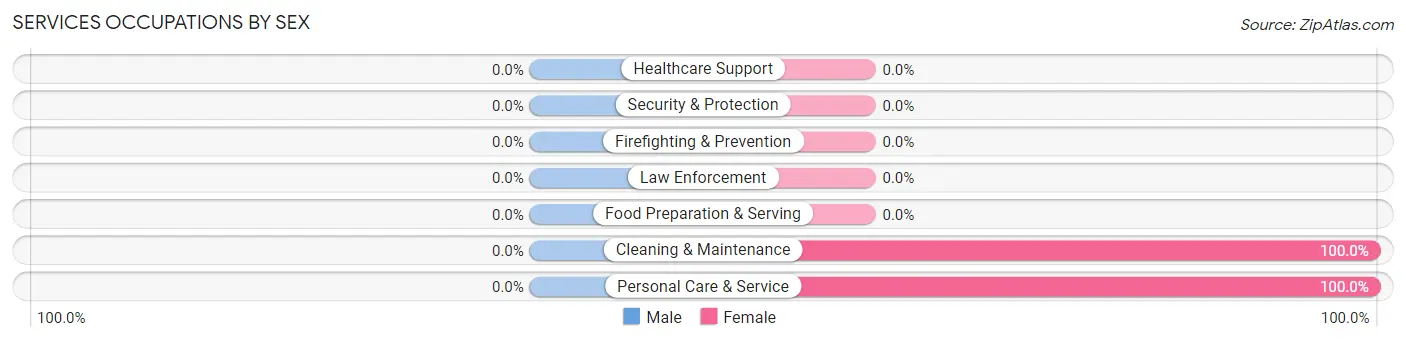
| Occupation | Male | Female |
| Healthcare Support | 0 (0.0%) | 0 (0.0%) |
| Security & Protection | 0 (0.0%) | 0 (0.0%) |
| Firefighting & Prevention | 0 (0.0%) | 0 (0.0%) |
| Law Enforcement | 0 (0.0%) | 0 (0.0%) |
| Food Preparation & Serving | 0 (0.0%) | 0 (0.0%) |
| Cleaning & Maintenance | 0 (0.0%) | 12 (100.0%) |
| Personal Care & Service | 0 (0.0%) | 12 (100.0%) |
| Total (Category) | 0 (0.0%) | 24 (100.0%) |
| Total (Overall) | 39 (49.4%) | 40 (50.6%) |
Sales and Office Occupations
The most common Sales and Office occupations in Pottersville are , and Sales & Related (25 | 31.7%).
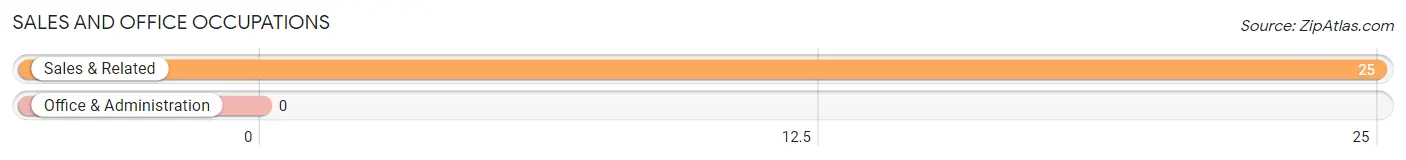
Sales and Office Occupations by Sex
| Occupation | Male | Female |
| Sales & Related | 11 (44.0%) | 14 (56.0%) |
| Office & Administration | 0 (0.0%) | 0 (0.0%) |
| Total (Category) | 11 (44.0%) | 14 (56.0%) |
| Total (Overall) | 39 (49.4%) | 40 (50.6%) |
Natural Resources, Construction and Maintenance Occupations
The most common Natural Resources, Construction and Maintenance occupations in Pottersville are , and Construction & Extraction (28 | 35.4%).
Natural Resources, Construction and Maintenance Occupations by Sex
| Occupation | Male | Female |
| Farming, Fishing & Forestry | 0 (0.0%) | 0 (0.0%) |
| Construction & Extraction | 28 (100.0%) | 0 (0.0%) |
| Installation, Maintenance & Repair | 0 (0.0%) | 0 (0.0%) |
| Total (Category) | 28 (100.0%) | 0 (0.0%) |
| Total (Overall) | 39 (49.4%) | 40 (50.6%) |
Production, Transportation and Moving Occupations
Production, Transportation and Moving Occupations by Sex
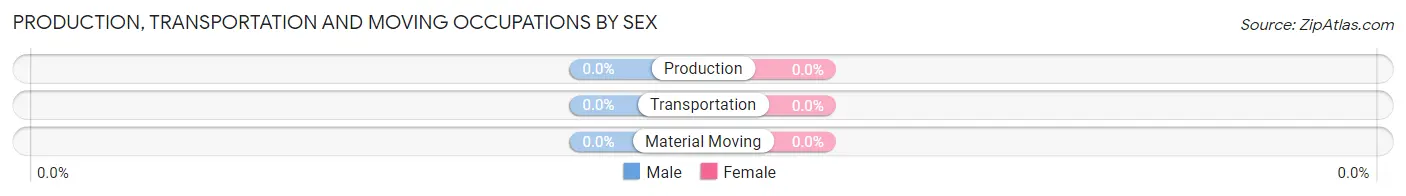
| Occupation | Male | Female |
| Production | 0 (0.0%) | 0 (0.0%) |
| Transportation | 0 (0.0%) | 0 (0.0%) |
| Material Moving | 0 (0.0%) | 0 (0.0%) |
| Total (Category) | 0 (0.0%) | 0 (0.0%) |
| Total (Overall) | 39 (49.4%) | 40 (50.6%) |
Employment Industries by Sex in Pottersville
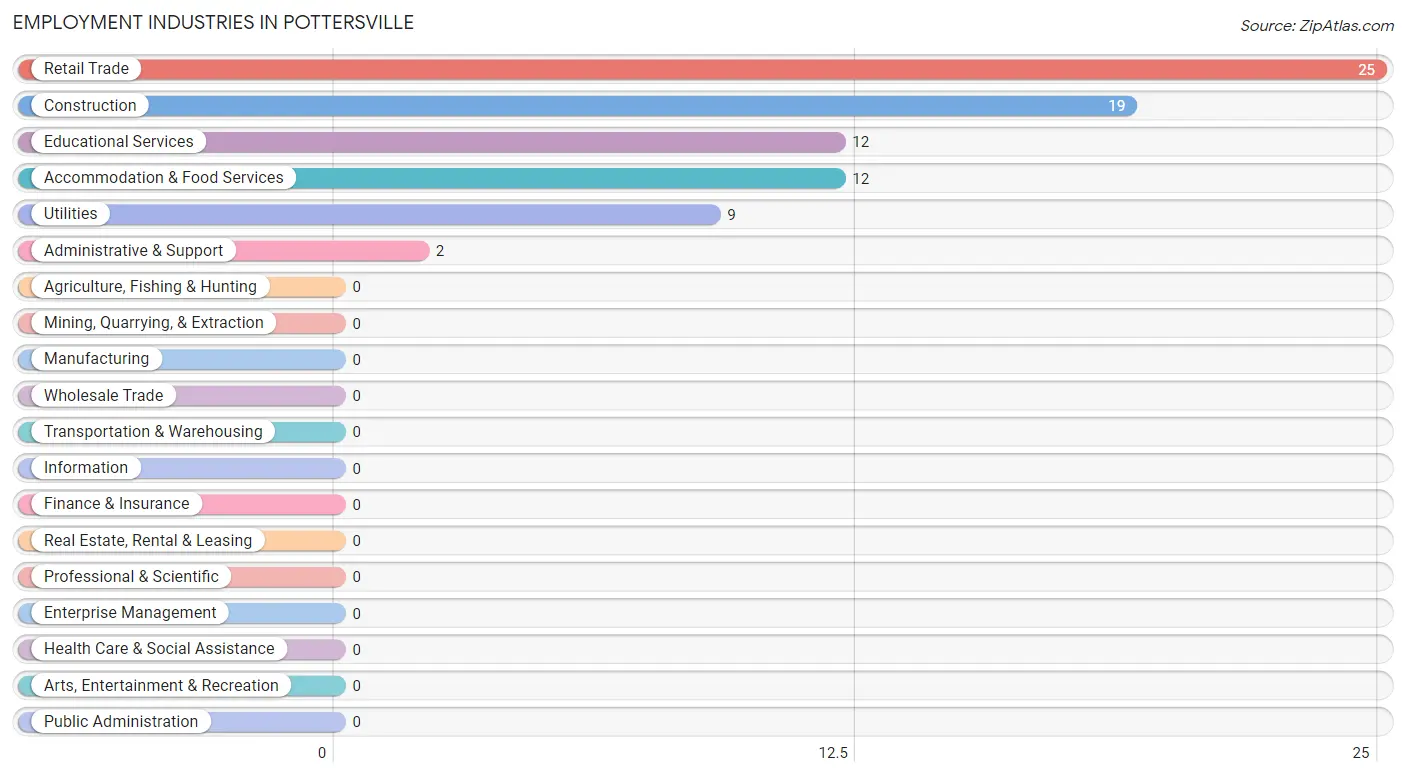
Employment Industries in Pottersville
The major employment industries in Pottersville include Retail Trade (25 | 31.7%), Construction (19 | 24.0%), Educational Services (12 | 15.2%), Accommodation & Food Services (12 | 15.2%), and Utilities (9 | 11.4%).
Employment Industries by Sex in Pottersville
The Pottersville industries that see more men than women are Construction (100.0%), Utilities (100.0%), and Retail Trade (44.0%), whereas the industries that tend to have a higher number of women are Administrative & Support (100.0%), Educational Services (100.0%), and Accommodation & Food Services (100.0%).
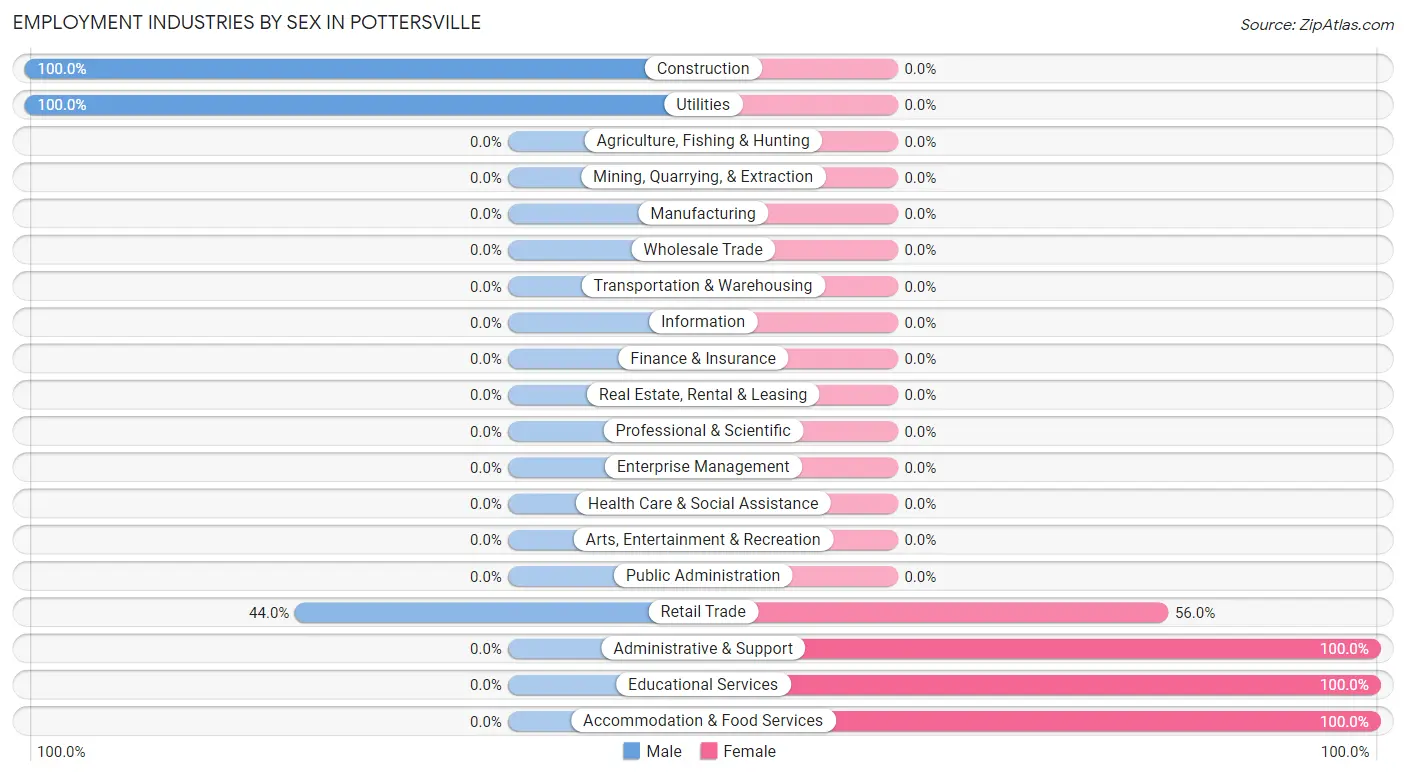
| Industry | Male | Female |
| Agriculture, Fishing & Hunting | 0 (0.0%) | 0 (0.0%) |
| Mining, Quarrying, & Extraction | 0 (0.0%) | 0 (0.0%) |
| Construction | 19 (100.0%) | 0 (0.0%) |
| Manufacturing | 0 (0.0%) | 0 (0.0%) |
| Wholesale Trade | 0 (0.0%) | 0 (0.0%) |
| Retail Trade | 11 (44.0%) | 14 (56.0%) |
| Transportation & Warehousing | 0 (0.0%) | 0 (0.0%) |
| Utilities | 9 (100.0%) | 0 (0.0%) |
| Information | 0 (0.0%) | 0 (0.0%) |
| Finance & Insurance | 0 (0.0%) | 0 (0.0%) |
| Real Estate, Rental & Leasing | 0 (0.0%) | 0 (0.0%) |
| Professional & Scientific | 0 (0.0%) | 0 (0.0%) |
| Enterprise Management | 0 (0.0%) | 0 (0.0%) |
| Administrative & Support | 0 (0.0%) | 2 (100.0%) |
| Educational Services | 0 (0.0%) | 12 (100.0%) |
| Health Care & Social Assistance | 0 (0.0%) | 0 (0.0%) |
| Arts, Entertainment & Recreation | 0 (0.0%) | 0 (0.0%) |
| Accommodation & Food Services | 0 (0.0%) | 12 (100.0%) |
| Public Administration | 0 (0.0%) | 0 (0.0%) |
| Total | 39 (49.4%) | 40 (50.6%) |
Education in Pottersville
School Enrollment in Pottersville
The most common levels of schooling among the 15 students in Pottersville are nursery / preschool (10 | 66.7%), and college / undergraduate (5 | 33.3%).
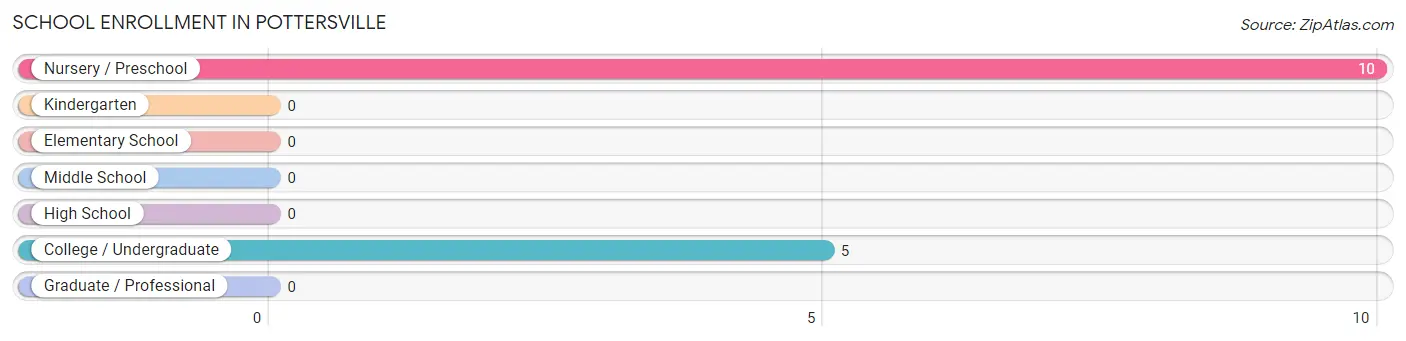
| School Level | # Students | % Students |
| Nursery / Preschool | 10 | 66.7% |
| Kindergarten | 0 | 0.0% |
| Elementary School | 0 | 0.0% |
| Middle School | 0 | 0.0% |
| High School | 0 | 0.0% |
| College / Undergraduate | 5 | 33.3% |
| Graduate / Professional | 0 | 0.0% |
| Total | 15 | 100.0% |
School Enrollment by Age by Funding Source in Pottersville
Out of a total of 15 students who are enrolled in schools in Pottersville, 5 (33.3%) attend a private institution, while the remaining 10 (66.7%) are enrolled in public schools. The age group of 18 to 19 year olds has the highest likelihood of being enrolled in private schools, with 5 (100.0% in the age bracket) enrolled. Conversely, the age group of 3 to 4 year olds has the lowest likelihood of being enrolled in a private school, with 10 (100.0% in the age bracket) attending a public institution.
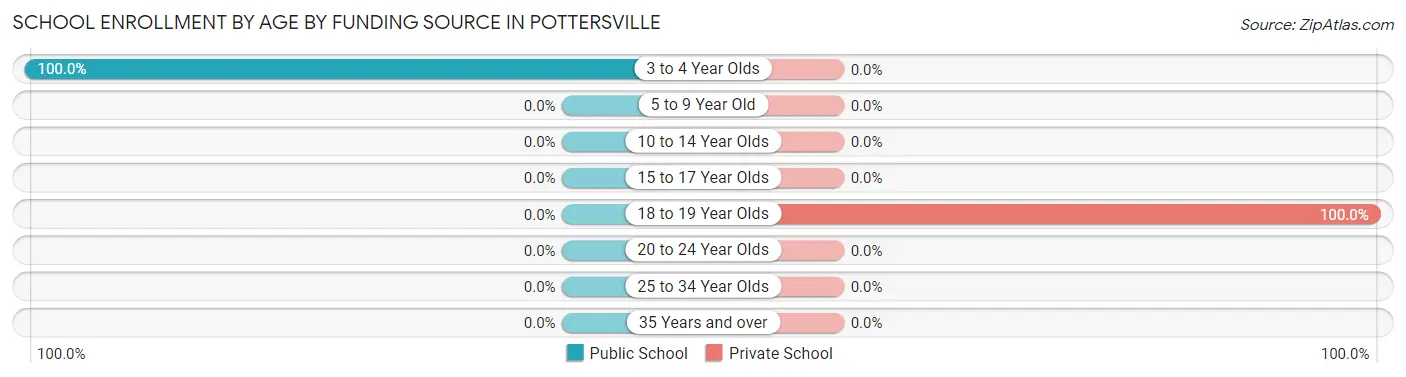
| Age Bracket | Public School | Private School |
| 3 to 4 Year Olds | 10 (100.0%) | 0 (0.0%) |
| 5 to 9 Year Old | 0 (0.0%) | 0 (0.0%) |
| 10 to 14 Year Olds | 0 (0.0%) | 0 (0.0%) |
| 15 to 17 Year Olds | 0 (0.0%) | 0 (0.0%) |
| 18 to 19 Year Olds | 0 (0.0%) | 5 (100.0%) |
| 20 to 24 Year Olds | 0 (0.0%) | 0 (0.0%) |
| 25 to 34 Year Olds | 0 (0.0%) | 0 (0.0%) |
| 35 Years and over | 0 (0.0%) | 0 (0.0%) |
| Total | 10 (66.7%) | 5 (33.3%) |
Educational Attainment by Field of Study in Pottersville
Psychology (14 | 60.9%), liberal arts & history (4 | 17.4%), education (3 | 13.0%), and business (2 | 8.7%) are the most common fields of study among 23 individuals in Pottersville who have obtained a bachelor's degree or higher.
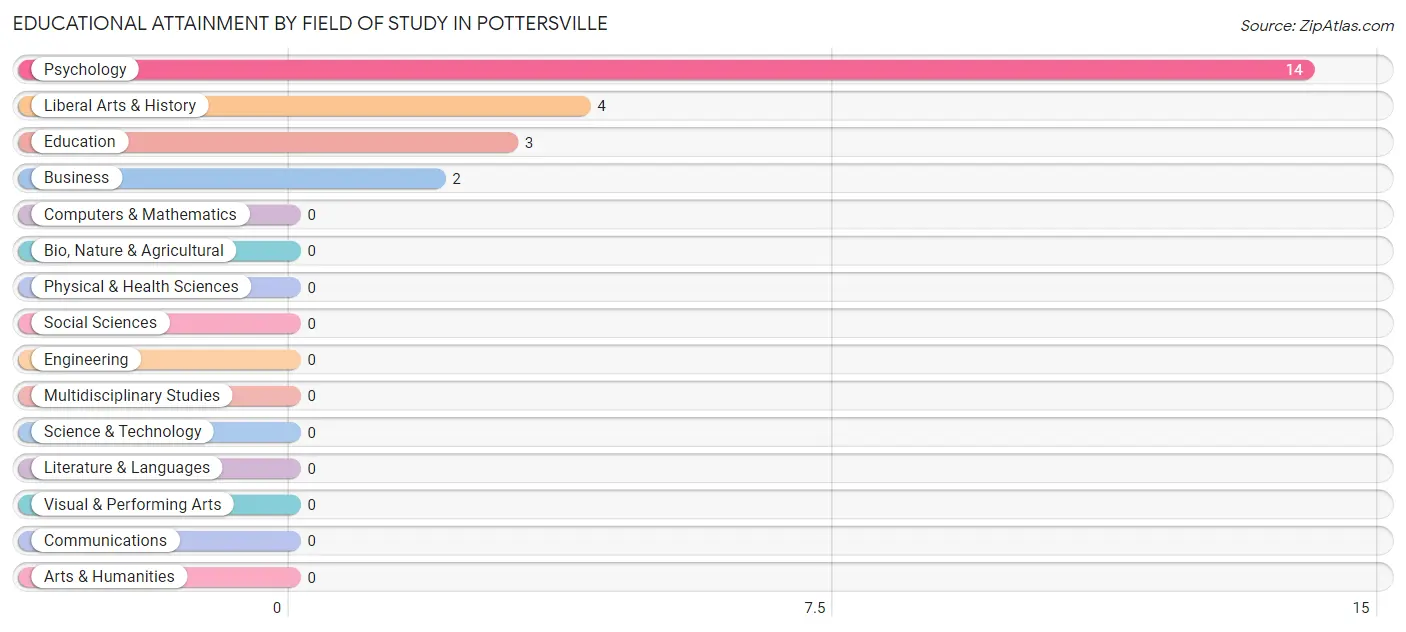
| Field of Study | # Graduates | % Graduates |
| Computers & Mathematics | 0 | 0.0% |
| Bio, Nature & Agricultural | 0 | 0.0% |
| Physical & Health Sciences | 0 | 0.0% |
| Psychology | 14 | 60.9% |
| Social Sciences | 0 | 0.0% |
| Engineering | 0 | 0.0% |
| Multidisciplinary Studies | 0 | 0.0% |
| Science & Technology | 0 | 0.0% |
| Business | 2 | 8.7% |
| Education | 3 | 13.0% |
| Literature & Languages | 0 | 0.0% |
| Liberal Arts & History | 4 | 17.4% |
| Visual & Performing Arts | 0 | 0.0% |
| Communications | 0 | 0.0% |
| Arts & Humanities | 0 | 0.0% |
| Total | 23 | 100.0% |
Transportation & Commute in Pottersville
Vehicle Availability by Sex in Pottersville
The most prevalent vehicle ownership categories in Pottersville are males with 2 vehicles (28, accounting for 71.8%) and females with 2 vehicles (26, making up 70.0%).
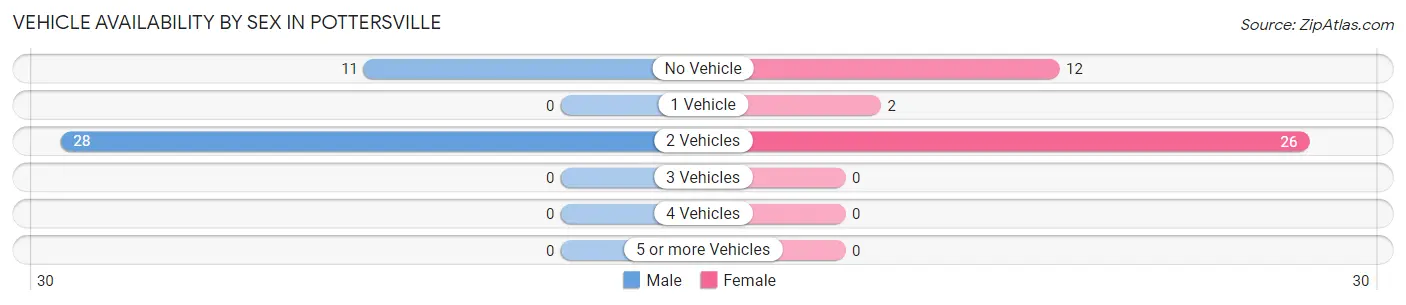
| Vehicles Available | Male | Female |
| No Vehicle | 11 (28.2%) | 12 (30.0%) |
| 1 Vehicle | 0 (0.0%) | 2 (5.0%) |
| 2 Vehicles | 28 (71.8%) | 26 (65.0%) |
| 3 Vehicles | 0 (0.0%) | 0 (0.0%) |
| 4 Vehicles | 0 (0.0%) | 0 (0.0%) |
| 5 or more Vehicles | 0 (0.0%) | 0 (0.0%) |
| Total | 39 (100.0%) | 40 (100.0%) |
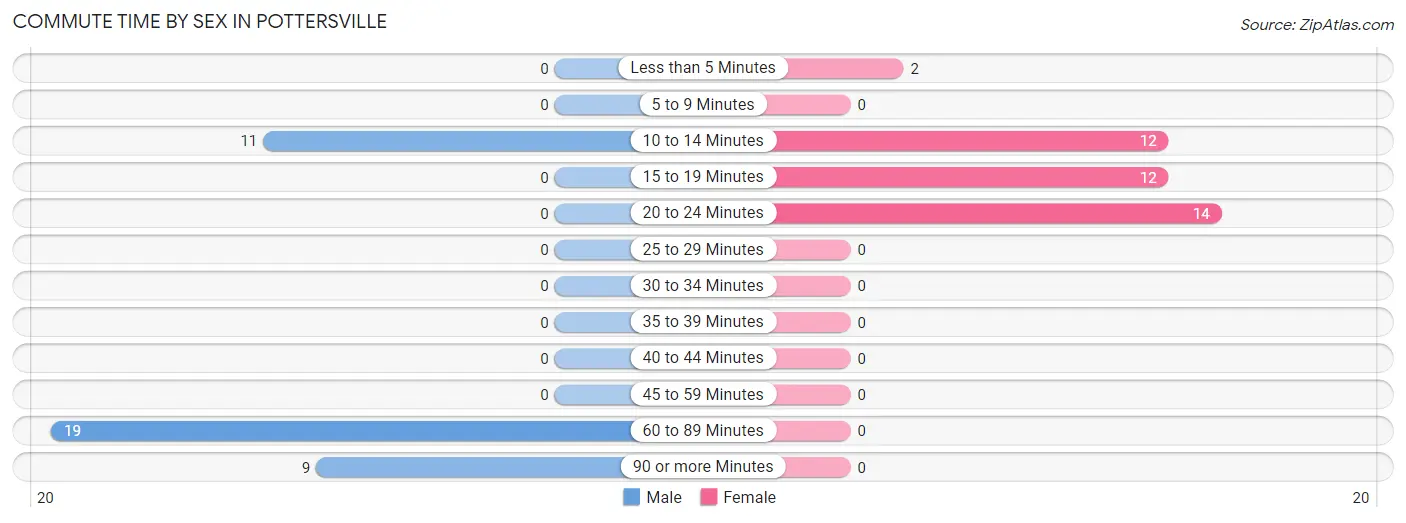
Commute Time in Pottersville
The most frequently occuring commute durations in Pottersville are 10 to 14 minutes (23 commuters, 29.1%), 60 to 89 minutes (19 commuters, 24.0%), and 20 to 24 minutes (14 commuters, 17.7%).
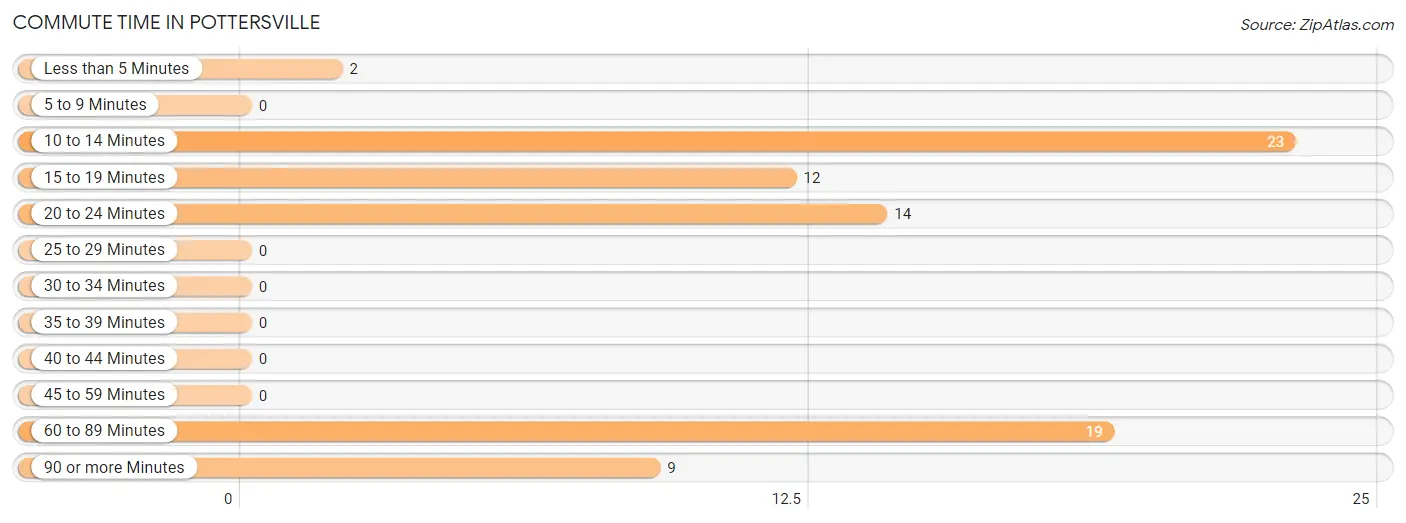
| Commute Time | # Commuters | % Commuters |
| Less than 5 Minutes | 2 | 2.5% |
| 5 to 9 Minutes | 0 | 0.0% |
| 10 to 14 Minutes | 23 | 29.1% |
| 15 to 19 Minutes | 12 | 15.2% |
| 20 to 24 Minutes | 14 | 17.7% |
| 25 to 29 Minutes | 0 | 0.0% |
| 30 to 34 Minutes | 0 | 0.0% |
| 35 to 39 Minutes | 0 | 0.0% |
| 40 to 44 Minutes | 0 | 0.0% |
| 45 to 59 Minutes | 0 | 0.0% |
| 60 to 89 Minutes | 19 | 24.0% |
| 90 or more Minutes | 9 | 11.4% |
Commute Time by Sex in Pottersville
The most common commute times in Pottersville are 60 to 89 minutes (19 commuters, 48.7%) for males and 20 to 24 minutes (14 commuters, 35.0%) for females.
| Commute Time | Male | Female |
| Less than 5 Minutes | 0 (0.0%) | 2 (5.0%) |
| 5 to 9 Minutes | 0 (0.0%) | 0 (0.0%) |
| 10 to 14 Minutes | 11 (28.2%) | 12 (30.0%) |
| 15 to 19 Minutes | 0 (0.0%) | 12 (30.0%) |
| 20 to 24 Minutes | 0 (0.0%) | 14 (35.0%) |
| 25 to 29 Minutes | 0 (0.0%) | 0 (0.0%) |
| 30 to 34 Minutes | 0 (0.0%) | 0 (0.0%) |
| 35 to 39 Minutes | 0 (0.0%) | 0 (0.0%) |
| 40 to 44 Minutes | 0 (0.0%) | 0 (0.0%) |
| 45 to 59 Minutes | 0 (0.0%) | 0 (0.0%) |
| 60 to 89 Minutes | 19 (48.7%) | 0 (0.0%) |
| 90 or more Minutes | 9 (23.1%) | 0 (0.0%) |
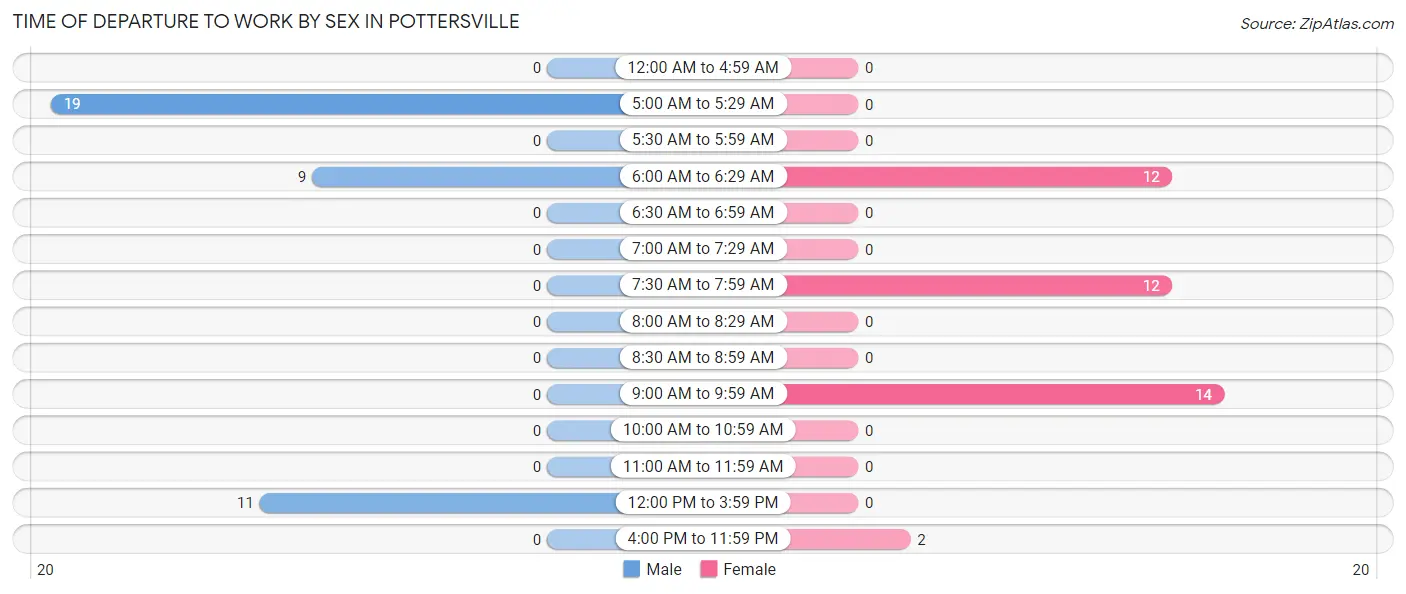
Time of Departure to Work by Sex in Pottersville
The most frequent times of departure to work in Pottersville are 5:00 AM to 5:29 AM (19, 48.7%) for males and 9:00 AM to 9:59 AM (14, 35.0%) for females.
| Time of Departure | Male | Female |
| 12:00 AM to 4:59 AM | 0 (0.0%) | 0 (0.0%) |
| 5:00 AM to 5:29 AM | 19 (48.7%) | 0 (0.0%) |
| 5:30 AM to 5:59 AM | 0 (0.0%) | 0 (0.0%) |
| 6:00 AM to 6:29 AM | 9 (23.1%) | 12 (30.0%) |
| 6:30 AM to 6:59 AM | 0 (0.0%) | 0 (0.0%) |
| 7:00 AM to 7:29 AM | 0 (0.0%) | 0 (0.0%) |
| 7:30 AM to 7:59 AM | 0 (0.0%) | 12 (30.0%) |
| 8:00 AM to 8:29 AM | 0 (0.0%) | 0 (0.0%) |
| 8:30 AM to 8:59 AM | 0 (0.0%) | 0 (0.0%) |
| 9:00 AM to 9:59 AM | 0 (0.0%) | 14 (35.0%) |
| 10:00 AM to 10:59 AM | 0 (0.0%) | 0 (0.0%) |
| 11:00 AM to 11:59 AM | 0 (0.0%) | 0 (0.0%) |
| 12:00 PM to 3:59 PM | 11 (28.2%) | 0 (0.0%) |
| 4:00 PM to 11:59 PM | 0 (0.0%) | 2 (5.0%) |
| Total | 39 (100.0%) | 40 (100.0%) |
Housing Occupancy in Pottersville
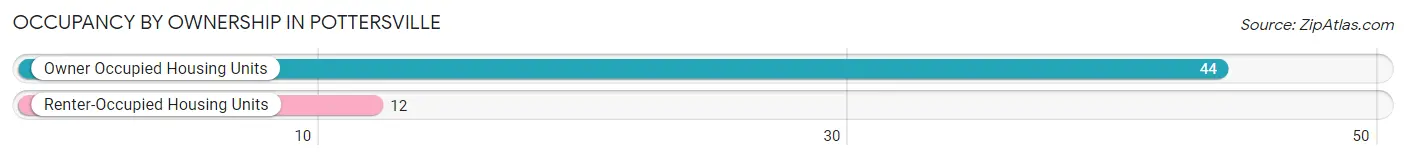
Occupancy by Ownership in Pottersville
Of the total 56 dwellings in Pottersville, owner-occupied units account for 44 (78.6%), while renter-occupied units make up 12 (21.4%).
| Occupancy | # Housing Units | % Housing Units |
| Owner Occupied Housing Units | 44 | 78.6% |
| Renter-Occupied Housing Units | 12 | 21.4% |
| Total Occupied Housing Units | 56 | 100.0% |
Occupancy by Household Size in Pottersville
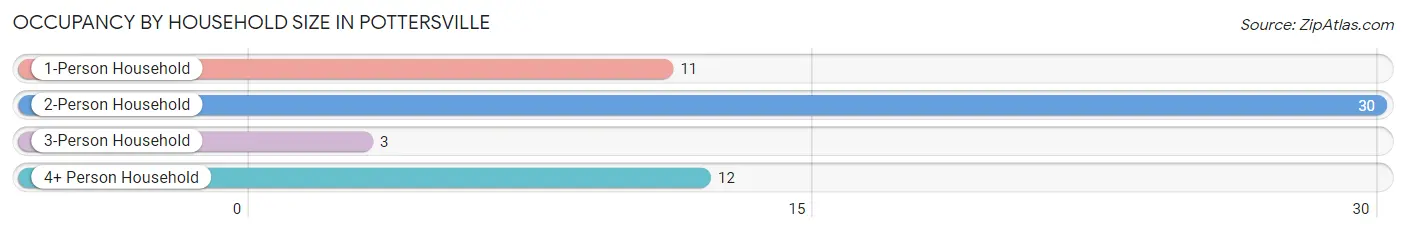
| Household Size | # Housing Units | % Housing Units |
| 1-Person Household | 11 | 19.6% |
| 2-Person Household | 30 | 53.6% |
| 3-Person Household | 3 | 5.4% |
| 4+ Person Household | 12 | 21.4% |
| Total Housing Units | 56 | 100.0% |
Occupancy by Ownership by Household Size in Pottersville
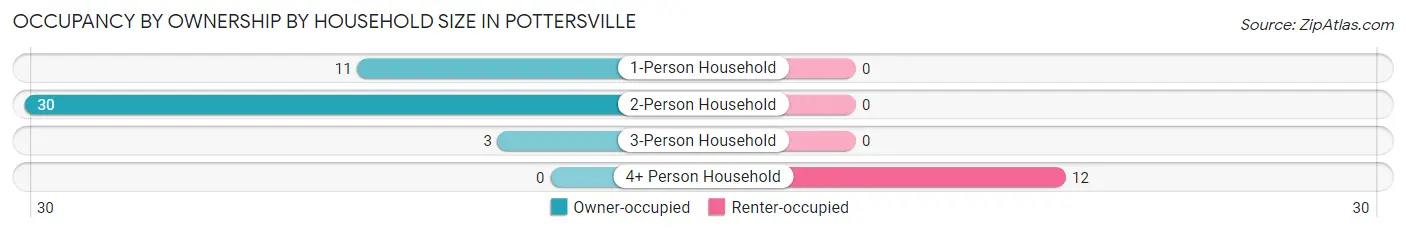
| Household Size | Owner-occupied | Renter-occupied |
| 1-Person Household | 11 (100.0%) | 0 (0.0%) |
| 2-Person Household | 30 (100.0%) | 0 (0.0%) |
| 3-Person Household | 3 (100.0%) | 0 (0.0%) |
| 4+ Person Household | 0 (0.0%) | 12 (100.0%) |
| Total Housing Units | 44 (78.6%) | 12 (21.4%) |
Occupancy by Educational Attainment in Pottersville
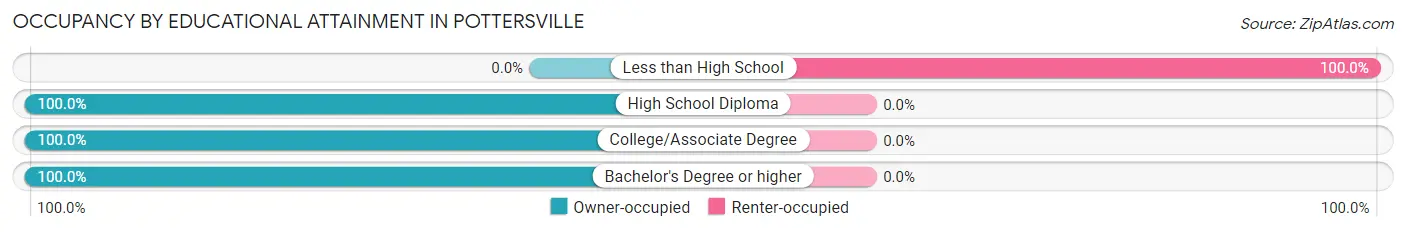
| Household Size | Owner-occupied | Renter-occupied |
| Less than High School | 0 (0.0%) | 12 (100.0%) |
| High School Diploma | 15 (100.0%) | 0 (0.0%) |
| College/Associate Degree | 15 (100.0%) | 0 (0.0%) |
| Bachelor's Degree or higher | 14 (100.0%) | 0 (0.0%) |
Occupancy by Age of Householder in Pottersville
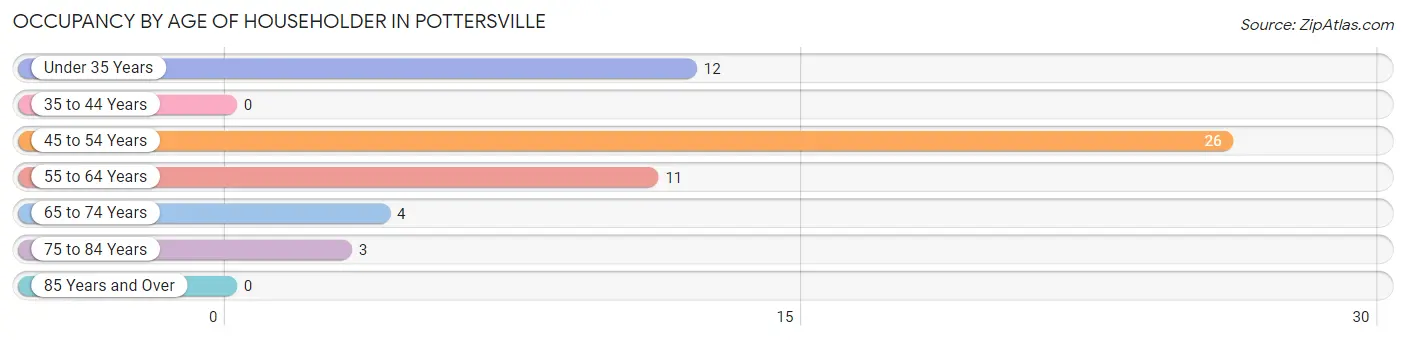
| Age Bracket | # Households | % Households |
| Under 35 Years | 12 | 21.4% |
| 35 to 44 Years | 0 | 0.0% |
| 45 to 54 Years | 26 | 46.4% |
| 55 to 64 Years | 11 | 19.6% |
| 65 to 74 Years | 4 | 7.1% |
| 75 to 84 Years | 3 | 5.4% |
| 85 Years and Over | 0 | 0.0% |
| Total | 56 | 100.0% |
Housing Finances in Pottersville
Median Income by Occupancy in Pottersville
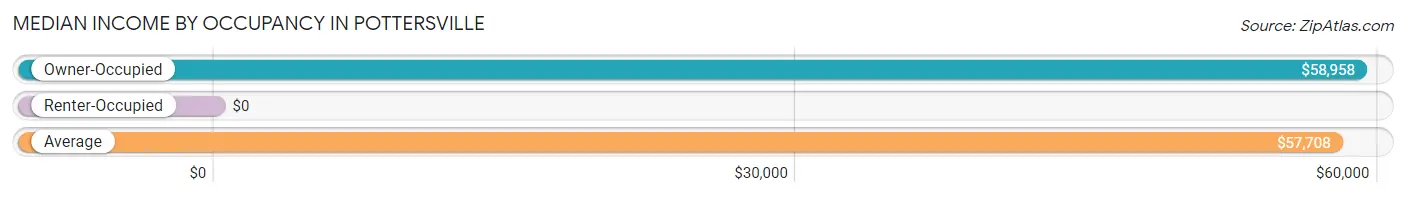
| Occupancy Type | # Households | Median Income |
| Owner-Occupied | 44 (78.6%) | $58,958 |
| Renter-Occupied | 12 (21.4%) | $0 |
| Average | 56 (100.0%) | $57,708 |
Occupancy by Householder Income Bracket in Pottersville
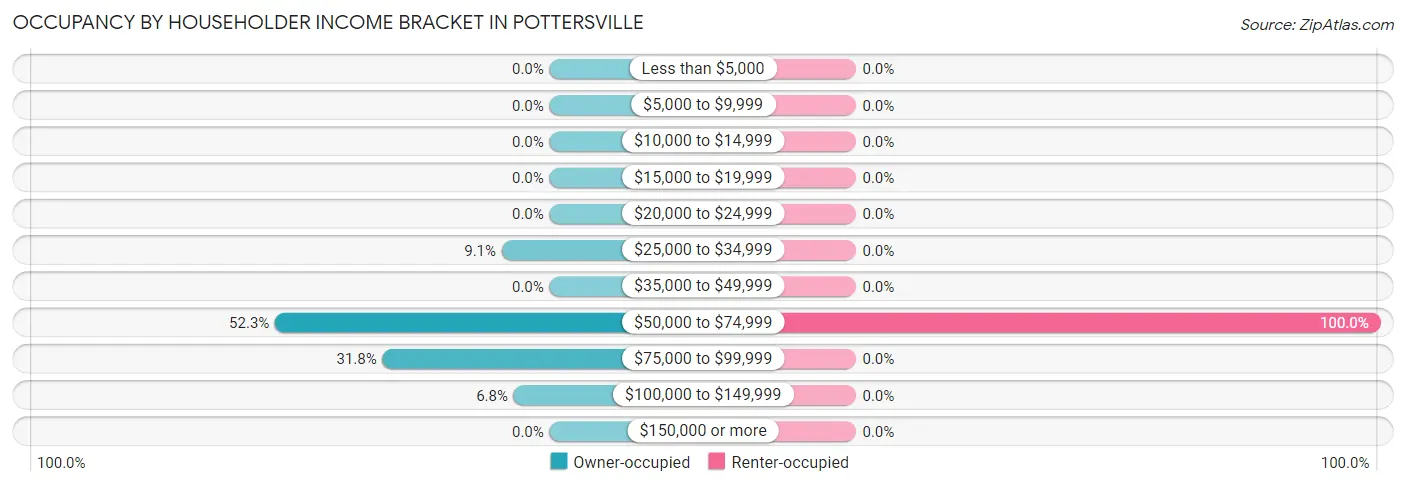
| Income Bracket | Owner-occupied | Renter-occupied |
| Less than $5,000 | 0 (0.0%) | 0 (0.0%) |
| $5,000 to $9,999 | 0 (0.0%) | 0 (0.0%) |
| $10,000 to $14,999 | 0 (0.0%) | 0 (0.0%) |
| $15,000 to $19,999 | 0 (0.0%) | 0 (0.0%) |
| $20,000 to $24,999 | 0 (0.0%) | 0 (0.0%) |
| $25,000 to $34,999 | 4 (9.1%) | 0 (0.0%) |
| $35,000 to $49,999 | 0 (0.0%) | 0 (0.0%) |
| $50,000 to $74,999 | 23 (52.3%) | 12 (100.0%) |
| $75,000 to $99,999 | 14 (31.8%) | 0 (0.0%) |
| $100,000 to $149,999 | 3 (6.8%) | 0 (0.0%) |
| $150,000 or more | 0 (0.0%) | 0 (0.0%) |
| Total | 44 (100.0%) | 12 (100.0%) |
Monthly Housing Cost Tiers in Pottersville
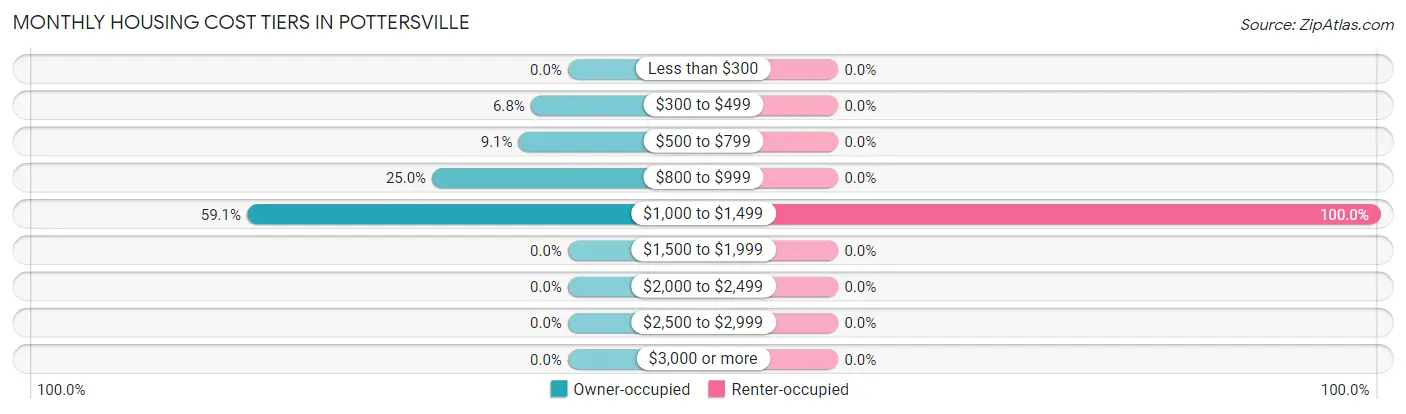
| Monthly Cost | Owner-occupied | Renter-occupied |
| Less than $300 | 0 (0.0%) | 0 (0.0%) |
| $300 to $499 | 3 (6.8%) | 0 (0.0%) |
| $500 to $799 | 4 (9.1%) | 0 (0.0%) |
| $800 to $999 | 11 (25.0%) | 0 (0.0%) |
| $1,000 to $1,499 | 26 (59.1%) | 12 (100.0%) |
| $1,500 to $1,999 | 0 (0.0%) | 0 (0.0%) |
| $2,000 to $2,499 | 0 (0.0%) | 0 (0.0%) |
| $2,500 to $2,999 | 0 (0.0%) | 0 (0.0%) |
| $3,000 or more | 0 (0.0%) | 0 (0.0%) |
| Total | 44 (100.0%) | 12 (100.0%) |
Physical Housing Characteristics in Pottersville
Housing Structures in Pottersville
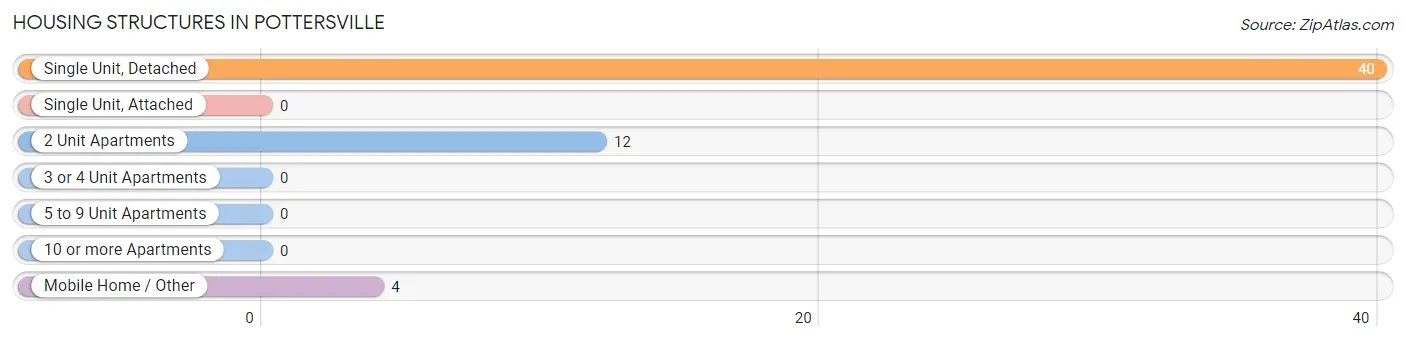
| Structure Type | # Housing Units | % Housing Units |
| Single Unit, Detached | 40 | 71.4% |
| Single Unit, Attached | 0 | 0.0% |
| 2 Unit Apartments | 12 | 21.4% |
| 3 or 4 Unit Apartments | 0 | 0.0% |
| 5 to 9 Unit Apartments | 0 | 0.0% |
| 10 or more Apartments | 0 | 0.0% |
| Mobile Home / Other | 4 | 7.1% |
| Total | 56 | 100.0% |
Housing Structures by Occupancy in Pottersville
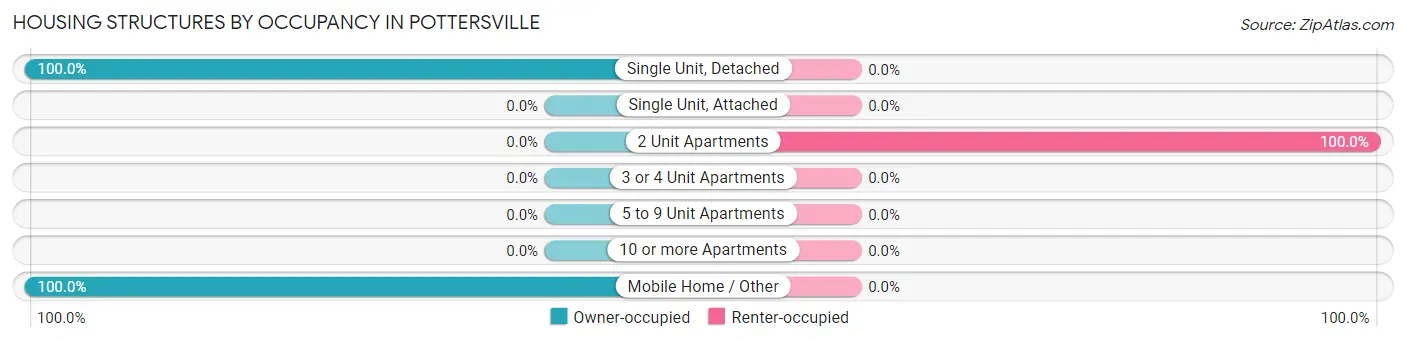
| Structure Type | Owner-occupied | Renter-occupied |
| Single Unit, Detached | 40 (100.0%) | 0 (0.0%) |
| Single Unit, Attached | 0 (0.0%) | 0 (0.0%) |
| 2 Unit Apartments | 0 (0.0%) | 12 (100.0%) |
| 3 or 4 Unit Apartments | 0 (0.0%) | 0 (0.0%) |
| 5 to 9 Unit Apartments | 0 (0.0%) | 0 (0.0%) |
| 10 or more Apartments | 0 (0.0%) | 0 (0.0%) |
| Mobile Home / Other | 4 (100.0%) | 0 (0.0%) |
| Total | 44 (78.6%) | 12 (21.4%) |
Housing Structures by Number of Rooms in Pottersville
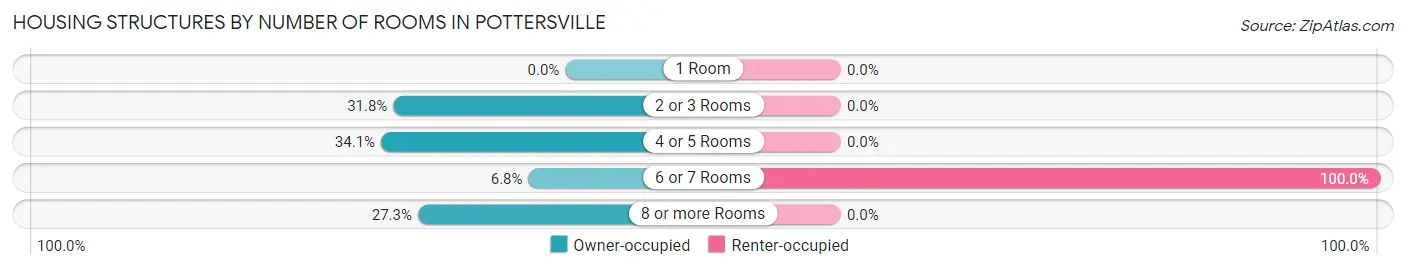
| Number of Rooms | Owner-occupied | Renter-occupied |
| 1 Room | 0 (0.0%) | 0 (0.0%) |
| 2 or 3 Rooms | 14 (31.8%) | 0 (0.0%) |
| 4 or 5 Rooms | 15 (34.1%) | 0 (0.0%) |
| 6 or 7 Rooms | 3 (6.8%) | 12 (100.0%) |
| 8 or more Rooms | 12 (27.3%) | 0 (0.0%) |
| Total | 44 (100.0%) | 12 (100.0%) |
Housing Structure by Heating Type in Pottersville
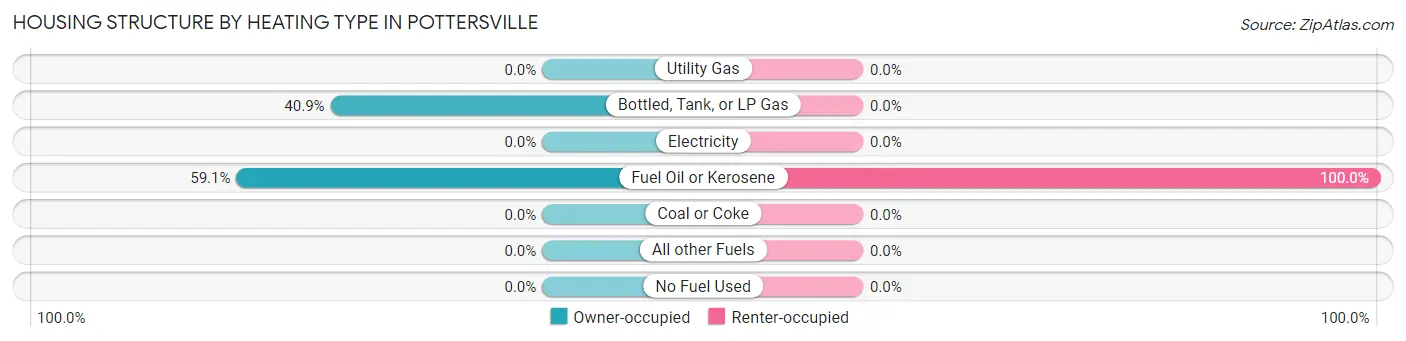
| Heating Type | Owner-occupied | Renter-occupied |
| Utility Gas | 0 (0.0%) | 0 (0.0%) |
| Bottled, Tank, or LP Gas | 18 (40.9%) | 0 (0.0%) |
| Electricity | 0 (0.0%) | 0 (0.0%) |
| Fuel Oil or Kerosene | 26 (59.1%) | 12 (100.0%) |
| Coal or Coke | 0 (0.0%) | 0 (0.0%) |
| All other Fuels | 0 (0.0%) | 0 (0.0%) |
| No Fuel Used | 0 (0.0%) | 0 (0.0%) |
| Total | 44 (100.0%) | 12 (100.0%) |
Household Vehicle Usage in Pottersville
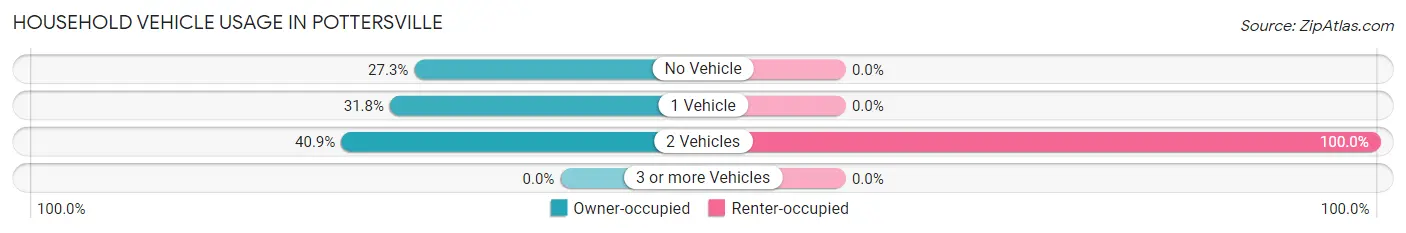
| Vehicles per Household | Owner-occupied | Renter-occupied |
| No Vehicle | 12 (27.3%) | 0 (0.0%) |
| 1 Vehicle | 14 (31.8%) | 0 (0.0%) |
| 2 Vehicles | 18 (40.9%) | 12 (100.0%) |
| 3 or more Vehicles | 0 (0.0%) | 0 (0.0%) |
| Total | 44 (100.0%) | 12 (100.0%) |
Real Estate & Mortgages in Pottersville
Real Estate and Mortgage Overview in Pottersville
| Characteristic | Without Mortgage | With Mortgage |
| Housing Units | 14 | 30 |
| Median Property Value | - | - |
| Median Household Income | - | - |
| Monthly Housing Costs | - | - |
| Real Estate Taxes | - | - |
Property Value by Mortgage Status in Pottersville
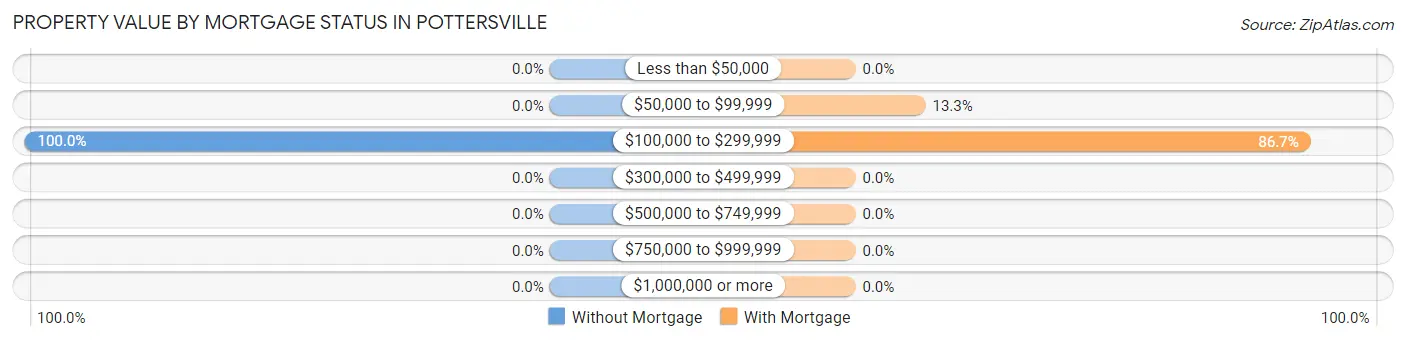
| Property Value | Without Mortgage | With Mortgage |
| Less than $50,000 | 0 (0.0%) | 0 (0.0%) |
| $50,000 to $99,999 | 0 (0.0%) | 4 (13.3%) |
| $100,000 to $299,999 | 14 (100.0%) | 26 (86.7%) |
| $300,000 to $499,999 | 0 (0.0%) | 0 (0.0%) |
| $500,000 to $749,999 | 0 (0.0%) | 0 (0.0%) |
| $750,000 to $999,999 | 0 (0.0%) | 0 (0.0%) |
| $1,000,000 or more | 0 (0.0%) | 0 (0.0%) |
| Total | 14 (100.0%) | 30 (100.0%) |
Household Income by Mortgage Status in Pottersville
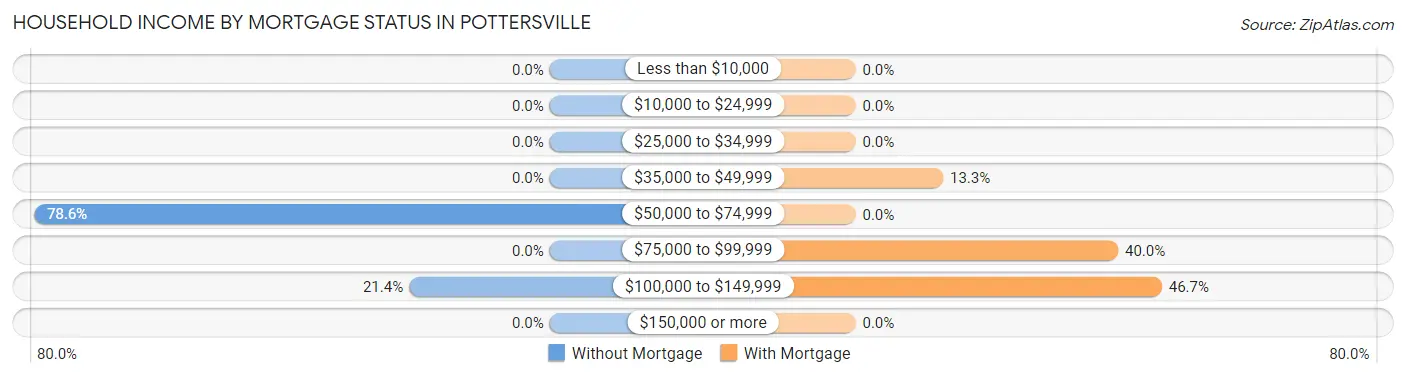
| Household Income | Without Mortgage | With Mortgage |
| Less than $10,000 | 0 (0.0%) | 0 (0.0%) |
| $10,000 to $24,999 | 0 (0.0%) | 0 (0.0%) |
| $25,000 to $34,999 | 0 (0.0%) | 0 (0.0%) |
| $35,000 to $49,999 | 0 (0.0%) | 4 (13.3%) |
| $50,000 to $74,999 | 11 (78.6%) | 0 (0.0%) |
| $75,000 to $99,999 | 0 (0.0%) | 12 (40.0%) |
| $100,000 to $149,999 | 3 (21.4%) | 14 (46.7%) |
| $150,000 or more | 0 (0.0%) | 0 (0.0%) |
| Total | 14 (100.0%) | 30 (100.0%) |
Property Value to Household Income Ratio in Pottersville
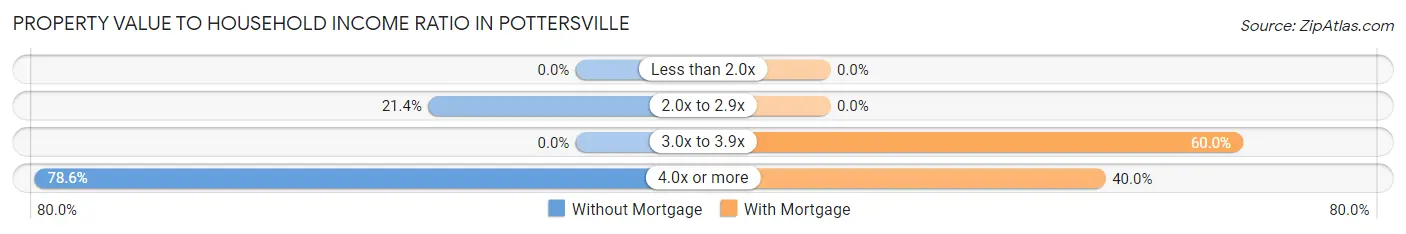
| Value-to-Income Ratio | Without Mortgage | With Mortgage |
| Less than 2.0x | 0 (0.0%) | 0 (0.0%) |
| 2.0x to 2.9x | 3 (21.4%) | 0 (0.0%) |
| 3.0x to 3.9x | 0 (0.0%) | 18 (60.0%) |
| 4.0x or more | 11 (78.6%) | 12 (40.0%) |
| Total | 14 (100.0%) | 30 (100.0%) |
Real Estate Taxes by Mortgage Status in Pottersville
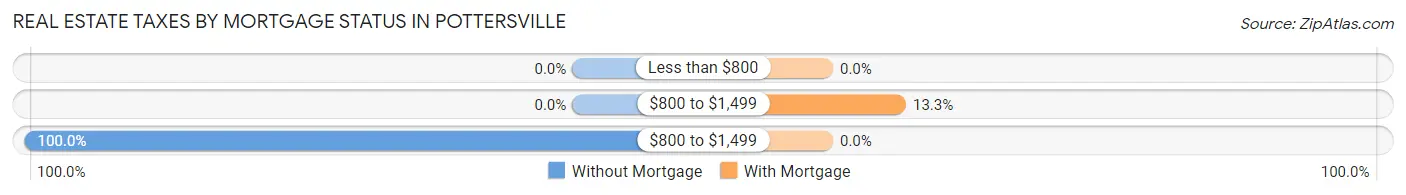
| Property Taxes | Without Mortgage | With Mortgage |
| Less than $800 | 0 (0.0%) | 0 (0.0%) |
| $800 to $1,499 | 0 (0.0%) | 4 (13.3%) |
| $800 to $1,499 | 14 (100.0%) | 0 (0.0%) |
| Total | 14 (100.0%) | 30 (100.0%) |
Health & Disability in Pottersville
Health Insurance Coverage by Age in Pottersville
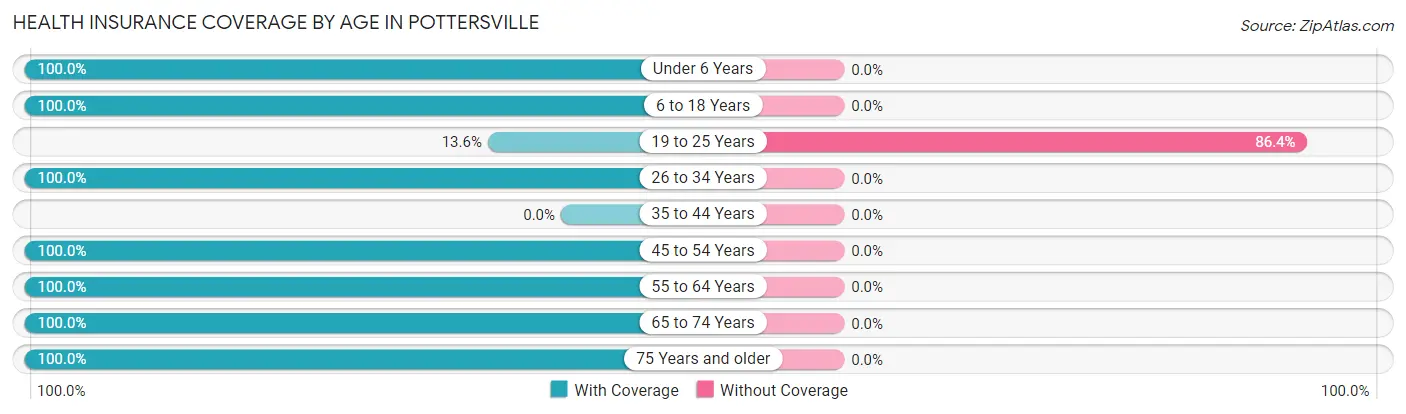
| Age Bracket | With Coverage | Without Coverage |
| Under 6 Years | 28 (100.0%) | 0 (0.0%) |
| 6 to 18 Years | 5 (100.0%) | 0 (0.0%) |
| 19 to 25 Years | 3 (13.6%) | 19 (86.4%) |
| 26 to 34 Years | 23 (100.0%) | 0 (0.0%) |
| 35 to 44 Years | 0 (0.0%) | 0 (0.0%) |
| 45 to 54 Years | 33 (100.0%) | 0 (0.0%) |
| 55 to 64 Years | 20 (100.0%) | 0 (0.0%) |
| 65 to 74 Years | 8 (100.0%) | 0 (0.0%) |
| 75 Years and older | 10 (100.0%) | 0 (0.0%) |
| Total | 130 (87.3%) | 19 (12.8%) |
Health Insurance Coverage by Citizenship Status in Pottersville
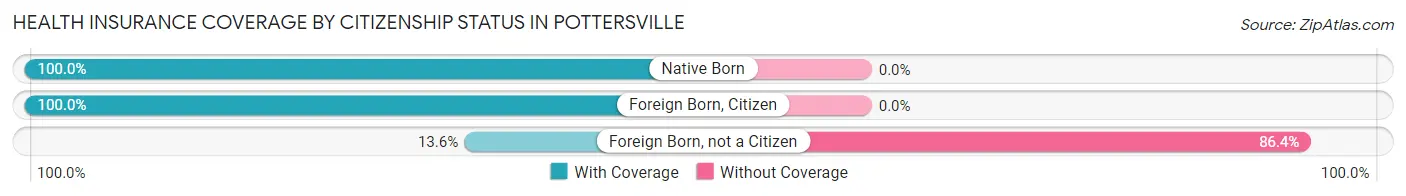
| Citizenship Status | With Coverage | Without Coverage |
| Native Born | 28 (100.0%) | 0 (0.0%) |
| Foreign Born, Citizen | 5 (100.0%) | 0 (0.0%) |
| Foreign Born, not a Citizen | 3 (13.6%) | 19 (86.4%) |
Health Insurance Coverage by Household Income in Pottersville
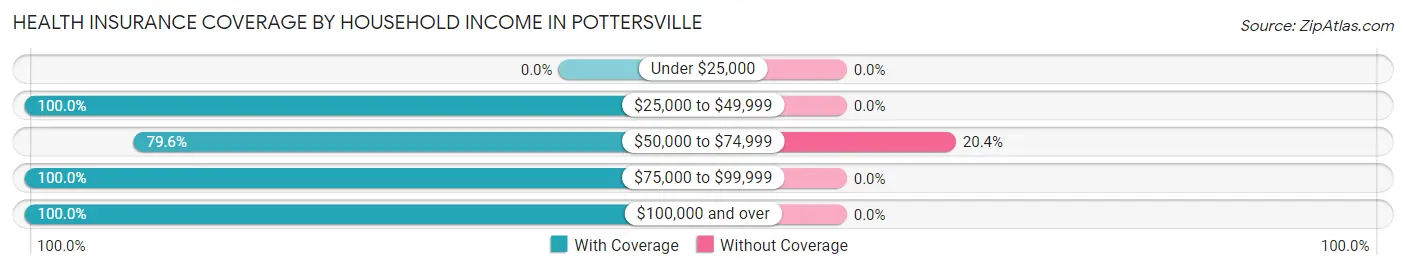
| Household Income | With Coverage | Without Coverage |
| Under $25,000 | 0 (0.0%) | 0 (0.0%) |
| $25,000 to $49,999 | 9 (100.0%) | 0 (0.0%) |
| $50,000 to $74,999 | 74 (79.6%) | 19 (20.4%) |
| $75,000 to $99,999 | 23 (100.0%) | 0 (0.0%) |
| $100,000 and over | 7 (100.0%) | 0 (0.0%) |
Public vs Private Health Insurance Coverage by Age in Pottersville
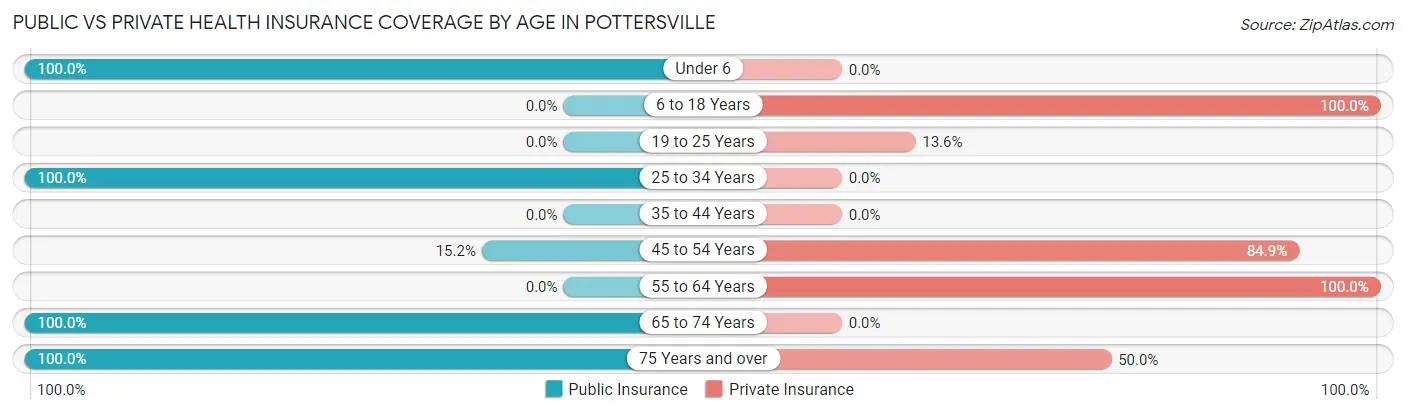
| Age Bracket | Public Insurance | Private Insurance |
| Under 6 | 28 (100.0%) | 0 (0.0%) |
| 6 to 18 Years | 0 (0.0%) | 5 (100.0%) |
| 19 to 25 Years | 0 (0.0%) | 3 (13.6%) |
| 25 to 34 Years | 23 (100.0%) | 0 (0.0%) |
| 35 to 44 Years | 0 (0.0%) | 0 (0.0%) |
| 45 to 54 Years | 5 (15.1%) | 28 (84.9%) |
| 55 to 64 Years | 0 (0.0%) | 20 (100.0%) |
| 65 to 74 Years | 8 (100.0%) | 0 (0.0%) |
| 75 Years and over | 10 (100.0%) | 5 (50.0%) |
| Total | 74 (49.7%) | 61 (40.9%) |
Disability Status by Sex by Age in Pottersville
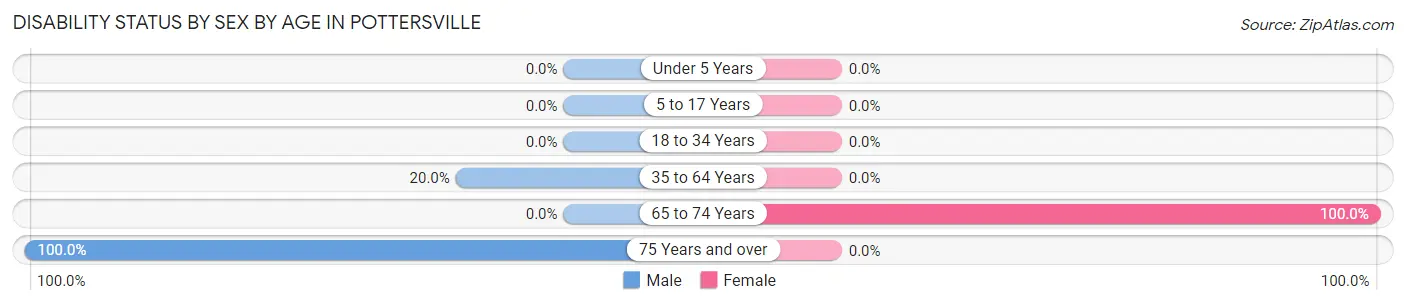
| Age Bracket | Male | Female |
| Under 5 Years | 0 (0.0%) | 0 (0.0%) |
| 5 to 17 Years | 0 (0.0%) | 0 (0.0%) |
| 18 to 34 Years | 0 (0.0%) | 0 (0.0%) |
| 35 to 64 Years | 5 (20.0%) | 0 (0.0%) |
| 65 to 74 Years | 0 (0.0%) | 4 (100.0%) |
| 75 Years and over | 3 (100.0%) | 0 (0.0%) |
Disability Class by Sex by Age in Pottersville
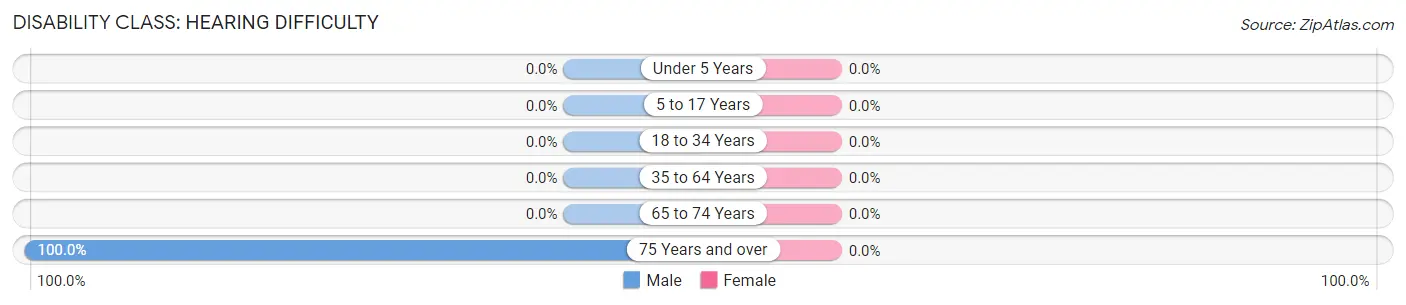
Disability Class: Hearing Difficulty
| Age Bracket | Male | Female |
| Under 5 Years | 0 (0.0%) | 0 (0.0%) |
| 5 to 17 Years | 0 (0.0%) | 0 (0.0%) |
| 18 to 34 Years | 0 (0.0%) | 0 (0.0%) |
| 35 to 64 Years | 0 (0.0%) | 0 (0.0%) |
| 65 to 74 Years | 0 (0.0%) | 0 (0.0%) |
| 75 Years and over | 3 (100.0%) | 0 (0.0%) |
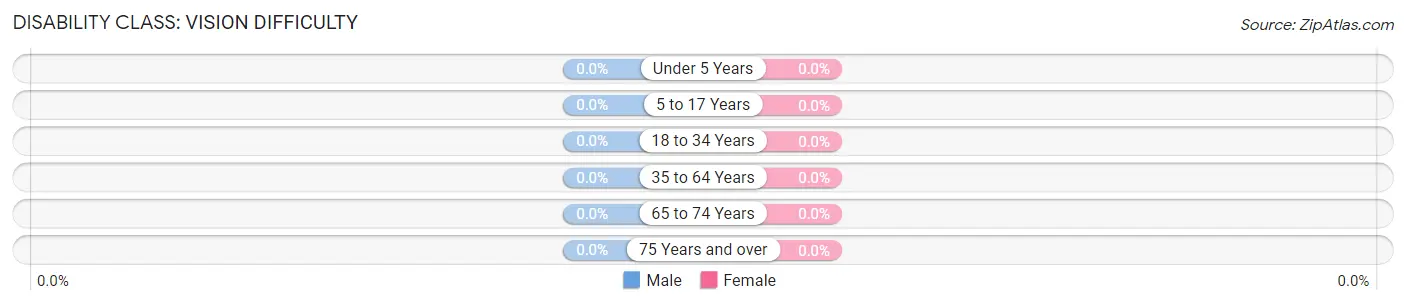
Disability Class: Vision Difficulty
| Age Bracket | Male | Female |
| Under 5 Years | 0 (0.0%) | 0 (0.0%) |
| 5 to 17 Years | 0 (0.0%) | 0 (0.0%) |
| 18 to 34 Years | 0 (0.0%) | 0 (0.0%) |
| 35 to 64 Years | 0 (0.0%) | 0 (0.0%) |
| 65 to 74 Years | 0 (0.0%) | 0 (0.0%) |
| 75 Years and over | 0 (0.0%) | 0 (0.0%) |
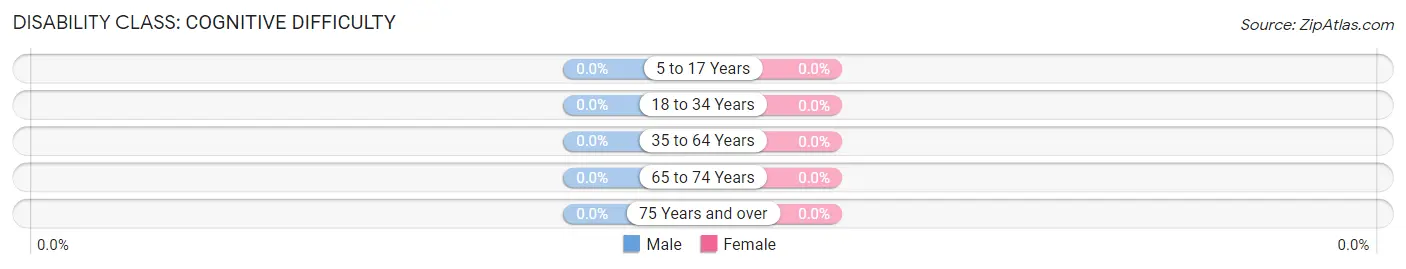
Disability Class: Cognitive Difficulty
| Age Bracket | Male | Female |
| 5 to 17 Years | 0 (0.0%) | 0 (0.0%) |
| 18 to 34 Years | 0 (0.0%) | 0 (0.0%) |
| 35 to 64 Years | 0 (0.0%) | 0 (0.0%) |
| 65 to 74 Years | 0 (0.0%) | 0 (0.0%) |
| 75 Years and over | 0 (0.0%) | 0 (0.0%) |
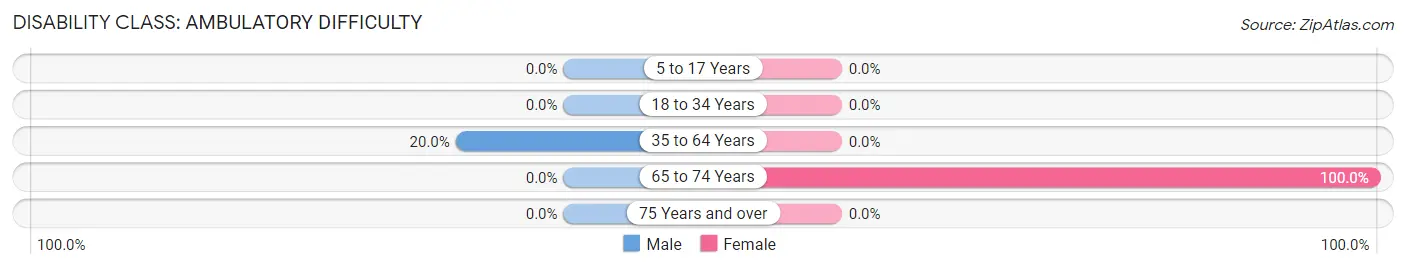
Disability Class: Ambulatory Difficulty
| Age Bracket | Male | Female |
| 5 to 17 Years | 0 (0.0%) | 0 (0.0%) |
| 18 to 34 Years | 0 (0.0%) | 0 (0.0%) |
| 35 to 64 Years | 5 (20.0%) | 0 (0.0%) |
| 65 to 74 Years | 0 (0.0%) | 4 (100.0%) |
| 75 Years and over | 0 (0.0%) | 0 (0.0%) |
Disability Class: Self-Care Difficulty
| Age Bracket | Male | Female |
| 5 to 17 Years | 0 (0.0%) | 0 (0.0%) |
| 18 to 34 Years | 0 (0.0%) | 0 (0.0%) |
| 35 to 64 Years | 0 (0.0%) | 0 (0.0%) |
| 65 to 74 Years | 0 (0.0%) | 0 (0.0%) |
| 75 Years and over | 0 (0.0%) | 0 (0.0%) |
Technology Access in Pottersville
Computing Device Access in Pottersville
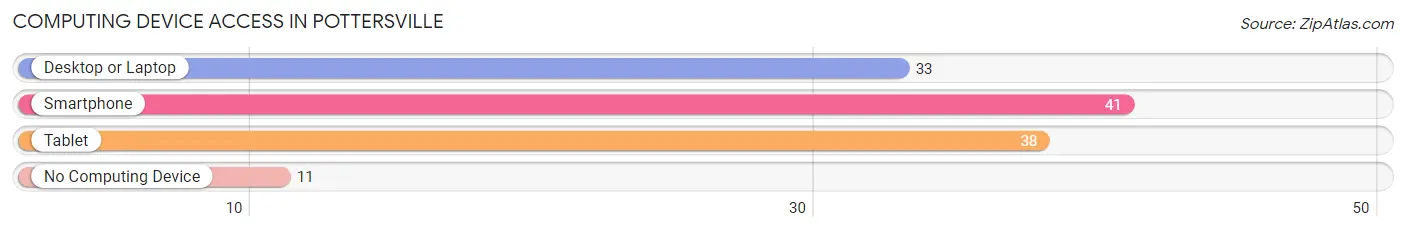
| Device Type | # Households | % Households |
| Desktop or Laptop | 33 | 58.9% |
| Smartphone | 41 | 73.2% |
| Tablet | 38 | 67.9% |
| No Computing Device | 11 | 19.6% |
| Total | 56 | 100.0% |
Internet Access in Pottersville
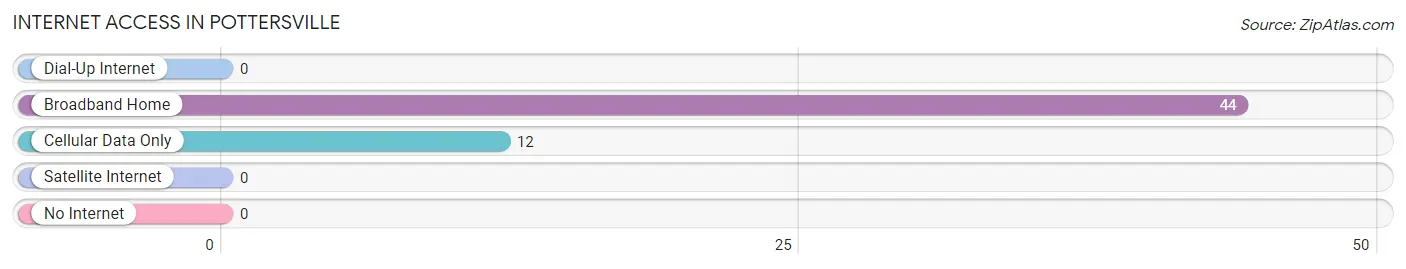
| Internet Type | # Households | % Households |
| Dial-Up Internet | 0 | 0.0% |
| Broadband Home | 44 | 78.6% |
| Cellular Data Only | 12 | 21.4% |
| Satellite Internet | 0 | 0.0% |
| No Internet | 0 | 0.0% |
| Total | 56 | 100.0% |
Pottersville Summary
Pottersville, NY is a small hamlet located in the town of Chester in Orange County, New York. It is situated in the foothills of the Shawangunk Mountains, about 50 miles northwest of New York City. The hamlet is home to about 1,000 people and is known for its rural charm and scenic beauty.
History
Pottersville was first settled in the late 1700s by a group of Dutch settlers. The hamlet was named after the Potters, a family of Dutch immigrants who were among the first settlers. The Potters were farmers and craftsmen who built the first homes and businesses in the area.
In the early 1800s, Pottersville became a popular destination for tourists and vacationers. The hamlet was known for its picturesque views of the Shawangunk Mountains and its many natural attractions, such as the nearby Minnewaska State Park.
In the late 1800s, Pottersville became a popular destination for artists and writers. The hamlet was home to several prominent artists, including the renowned landscape painter George Inness.
Geography
Pottersville is located in the foothills of the Shawangunk Mountains, about 50 miles northwest of New York City. The hamlet is situated in a rural area, surrounded by rolling hills and forests. The nearby Minnewaska State Park offers a variety of outdoor activities, including hiking, camping, and fishing.
The hamlet is located near several major highways, including Interstate 84 and the New York State Thruway. The nearest major airport is Stewart International Airport, located about 30 miles away in Newburgh, New York.
Economy
Pottersville is a small, rural community with a limited economy. The hamlet is home to several small businesses, including a few restaurants, a grocery store, and a few shops. The hamlet is also home to a few small farms, which produce a variety of fruits and vegetables.
The hamlet is also home to several artists and writers, who often use the area as a source of inspiration for their work. The hamlet is also home to several bed and breakfasts, which attract tourists and vacationers from all over the world.
Demographics
As of the 2010 census, the population of Pottersville was 1,000. The population is predominantly white (94.2%), with a small percentage of African Americans (2.2%) and Hispanics (2.2%). The median household income is $50,000, and the median age is 44.
The hamlet is home to several churches, including the Pottersville United Methodist Church and the Pottersville Presbyterian Church. The hamlet is also home to a few schools, including the Pottersville Elementary School and the Pottersville High School.
Common Questions
What is the Total Population of Pottersville?
Total Population of Pottersville is 149.
What is the Total Male Population of Pottersville?
Total Male Population of Pottersville is 89.
What is the Total Female Population of Pottersville?
Total Female Population of Pottersville is 60.
What is the Ratio of Males per 100 Females in Pottersville?
There are 148.33 Males per 100 Females in Pottersville.
What is the Ratio of Females per 100 Males in Pottersville?
There are 67.42 Females per 100 Males in Pottersville.
What is the Median Population Age in Pottersville?
Median Population Age in Pottersville is 34.7 Years.
What is the Average Family Size in Pottersville
Average Family Size in Pottersville is 2.3 People.
What is the Average Household Size in Pottersville
Average Household Size in Pottersville is 2.4 People.
What is Per Capita Income in Pottersville?
Per Capita income in Pottersville is $23,821.
What is the Median Family Income in Pottersville?
Median Family Income in Pottersville is $58,854.
What is the Median Household income in Pottersville?
Median Household Income in Pottersville is $57,708.
What is Inequality or Gini Index in Pottersville?
Inequality or Gini Index in Pottersville is 0.18.
How Large is the Labor Force in Pottersville?
There are 79 People in the Labor Forcein in Pottersville.
What is the Percentage of People in the Labor Force in Pottersville?
65.3% of People are in the Labor Force in Pottersville.