Point Lookout, NY
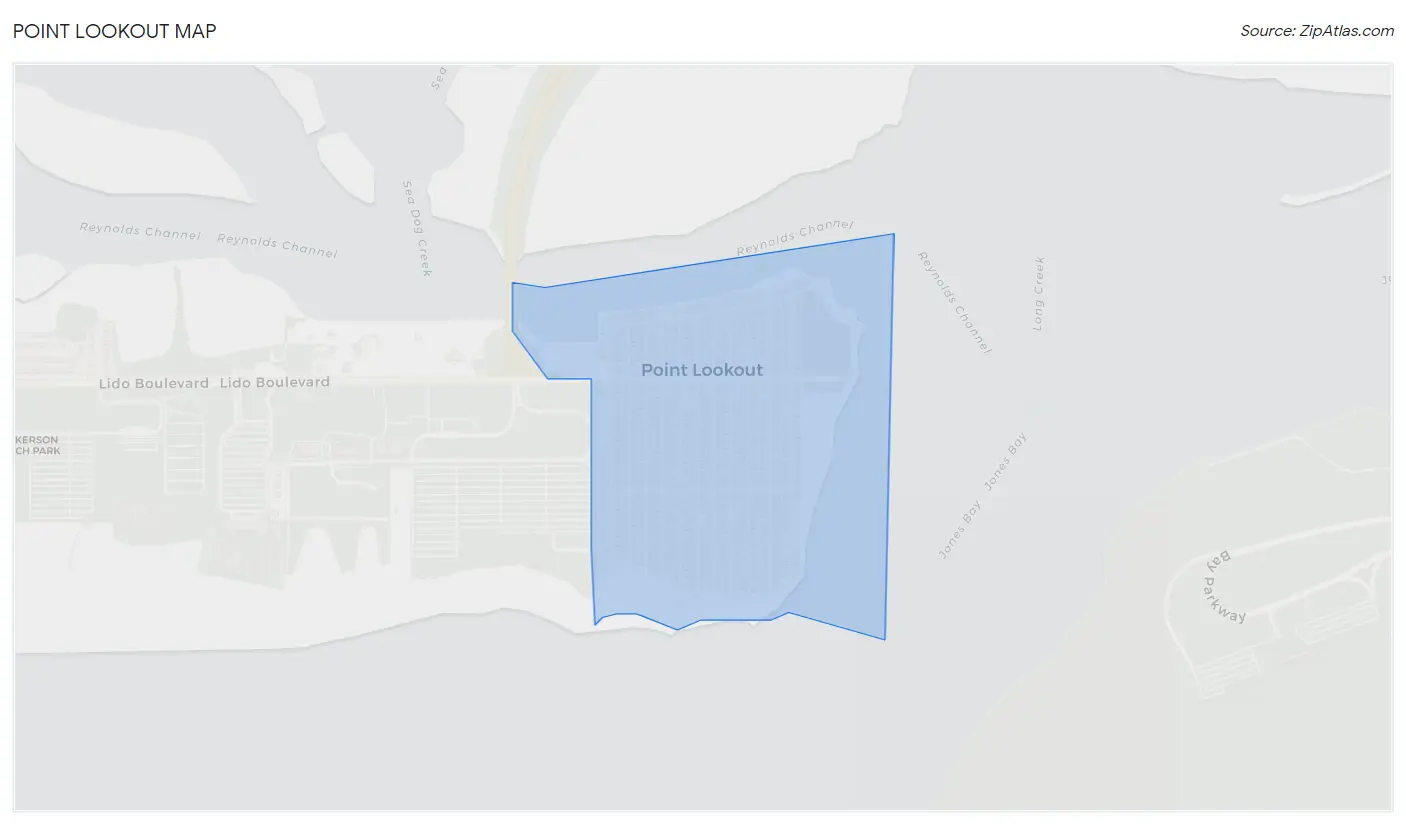
Point Lookout Map
Point Lookout Overview
1,110
TOTAL POPULATION
556
MALE POPULATION
554
FEMALE POPULATION
100.36
MALES / 100 FEMALES
99.64
FEMALES / 100 MALES
58.4
MEDIAN AGE
2.6
AVG FAMILY SIZE
2.0
AVG HOUSEHOLD SIZE
$85,551
PER CAPITA INCOME
$203,889
AVG FAMILY INCOME
$104,386
AVG HOUSEHOLD INCOME
67.3%
WAGE / INCOME GAP [ % ]
32.7¢/ $1
WAGE / INCOME GAP [ $ ]
0.51
INEQUALITY / GINI INDEX
554
LABOR FORCE [ PEOPLE ]
53.4%
PERCENT IN LABOR FORCE
2.9%
UNEMPLOYMENT RATE
Point Lookout Zip Codes
Point Lookout Area Codes
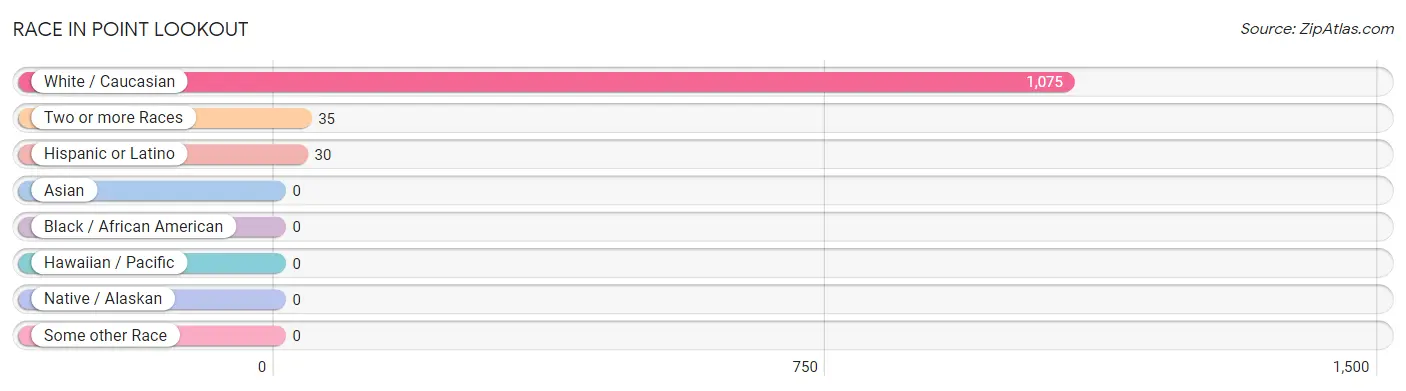
Race in Point Lookout
The most populous races in Point Lookout are White / Caucasian (1,075 | 96.9%), Two or more Races (35 | 3.2%), and Hispanic or Latino (30 | 2.7%).
| Race | # Population | % Population |
| Asian | 0 | 0.0% |
| Black / African American | 0 | 0.0% |
| Hawaiian / Pacific | 0 | 0.0% |
| Hispanic or Latino | 30 | 2.7% |
| Native / Alaskan | 0 | 0.0% |
| White / Caucasian | 1,075 | 96.9% |
| Two or more Races | 35 | 3.2% |
| Some other Race | 0 | 0.0% |
| Total | 1,110 | 100.0% |
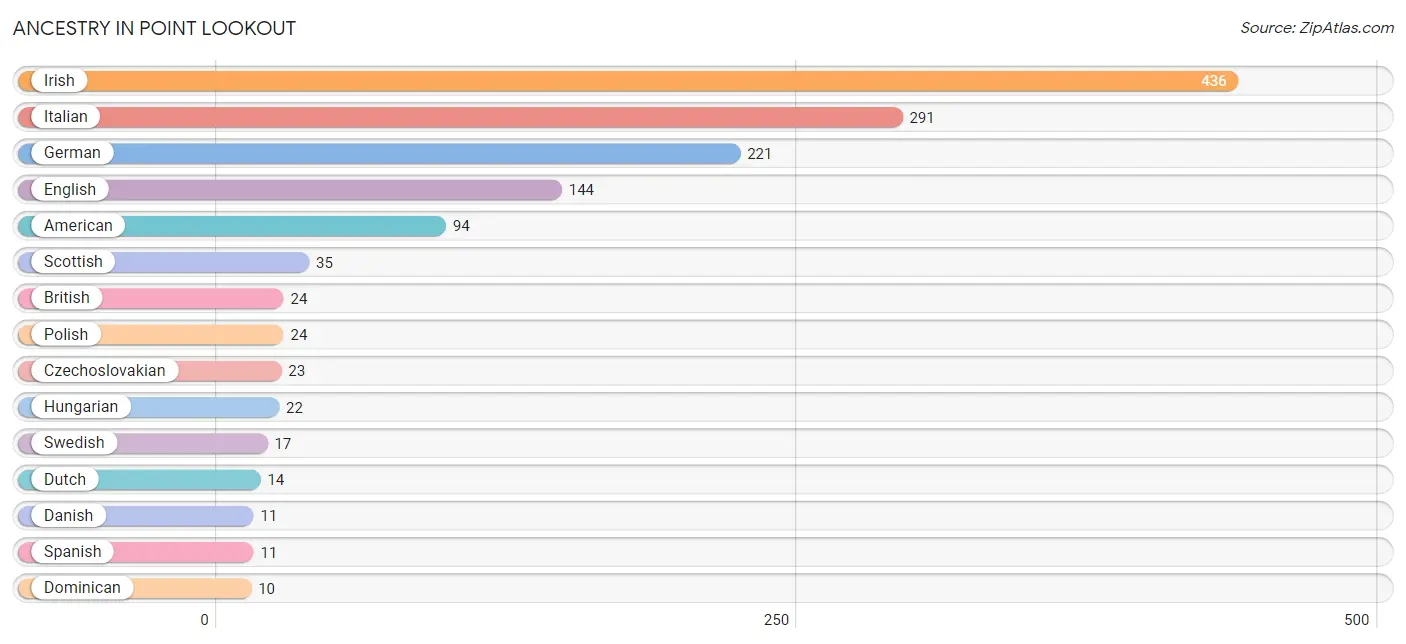
Ancestry in Point Lookout
The most populous ancestries reported in Point Lookout are Irish (436 | 39.3%), Italian (291 | 26.2%), German (221 | 19.9%), English (144 | 13.0%), and American (94 | 8.5%), together accounting for 106.9% of all Point Lookout residents.
| Ancestry | # Population | % Population |
| Albanian | 7 | 0.6% |
| American | 94 | 8.5% |
| Bhutanese | 5 | 0.4% |
| British | 24 | 2.2% |
| Cuban | 9 | 0.8% |
| Czechoslovakian | 23 | 2.1% |
| Danish | 11 | 1.0% |
| Dominican | 10 | 0.9% |
| Dutch | 14 | 1.3% |
| Eastern European | 7 | 0.6% |
| English | 144 | 13.0% |
| French | 3 | 0.3% |
| French Canadian | 6 | 0.5% |
| German | 221 | 19.9% |
| Hungarian | 22 | 2.0% |
| Irish | 436 | 39.3% |
| Italian | 291 | 26.2% |
| Norwegian | 9 | 0.8% |
| Polish | 24 | 2.2% |
| Russian | 4 | 0.4% |
| Scottish | 35 | 3.2% |
| Spanish | 11 | 1.0% |
| Swedish | 17 | 1.5% |
| Welsh | 6 | 0.5% |
| Yugoslavian | 4 | 0.4% | View All 25 Rows |
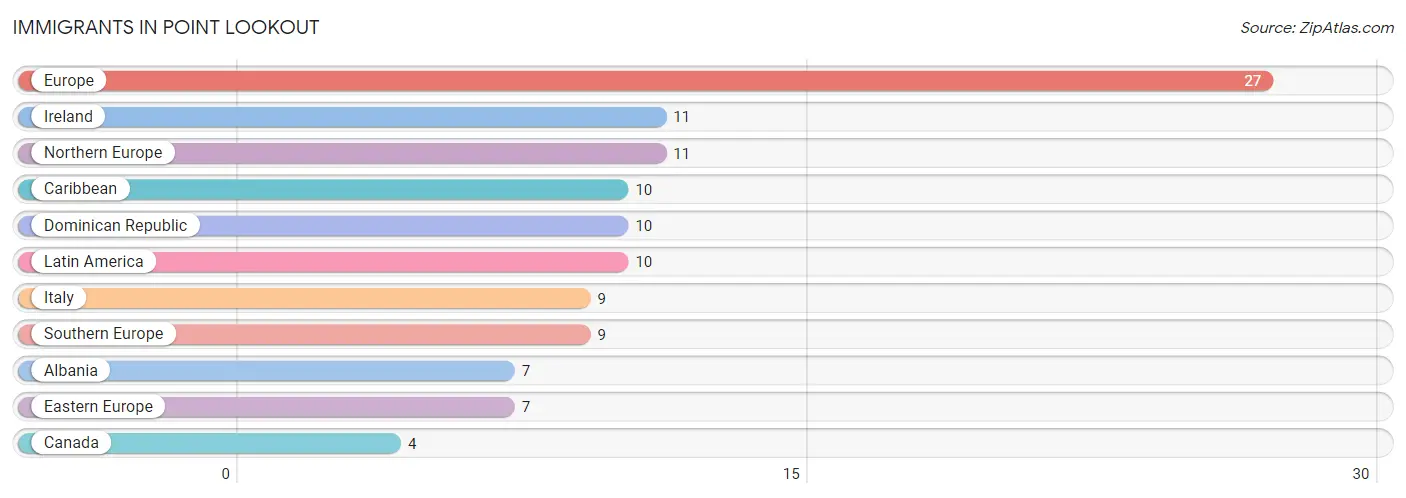
Immigrants in Point Lookout
The most numerous immigrant groups reported in Point Lookout came from Europe (27 | 2.4%), Ireland (11 | 1.0%), Northern Europe (11 | 1.0%), Caribbean (10 | 0.9%), and Dominican Republic (10 | 0.9%), together accounting for 6.2% of all Point Lookout residents.
| Immigration Origin | # Population | % Population |
| Albania | 7 | 0.6% |
| Canada | 4 | 0.4% |
| Caribbean | 10 | 0.9% |
| Dominican Republic | 10 | 0.9% |
| Eastern Europe | 7 | 0.6% |
| Europe | 27 | 2.4% |
| Ireland | 11 | 1.0% |
| Italy | 9 | 0.8% |
| Latin America | 10 | 0.9% |
| Northern Europe | 11 | 1.0% |
| Southern Europe | 9 | 0.8% | View All 11 Rows |
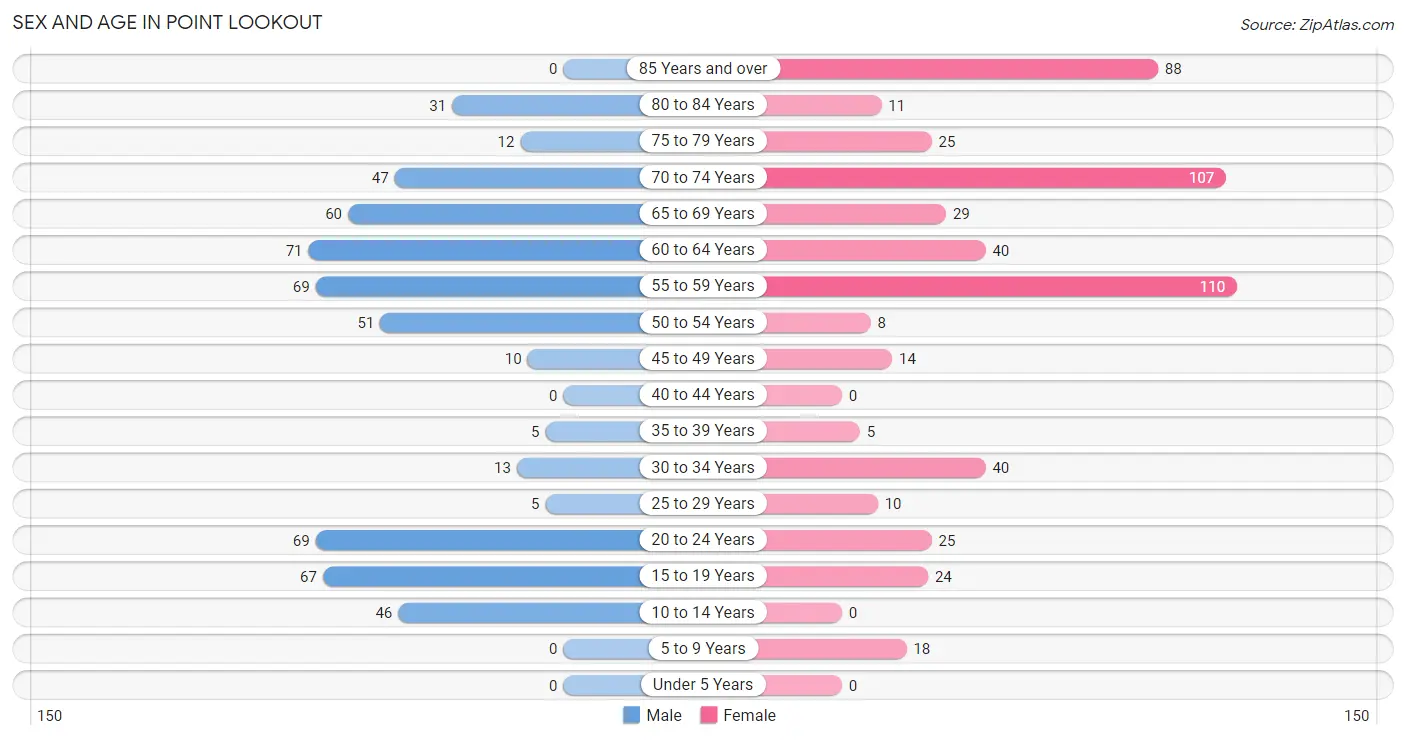
Sex and Age in Point Lookout
Sex and Age in Point Lookout
The most populous age groups in Point Lookout are 60 to 64 Years (71 | 12.8%) for men and 55 to 59 Years (110 | 19.9%) for women.
| Age Bracket | Male | Female |
| Under 5 Years | 0 (0.0%) | 0 (0.0%) |
| 5 to 9 Years | 0 (0.0%) | 18 (3.3%) |
| 10 to 14 Years | 46 (8.3%) | 0 (0.0%) |
| 15 to 19 Years | 67 (12.0%) | 24 (4.3%) |
| 20 to 24 Years | 69 (12.4%) | 25 (4.5%) |
| 25 to 29 Years | 5 (0.9%) | 10 (1.8%) |
| 30 to 34 Years | 13 (2.3%) | 40 (7.2%) |
| 35 to 39 Years | 5 (0.9%) | 5 (0.9%) |
| 40 to 44 Years | 0 (0.0%) | 0 (0.0%) |
| 45 to 49 Years | 10 (1.8%) | 14 (2.5%) |
| 50 to 54 Years | 51 (9.2%) | 8 (1.4%) |
| 55 to 59 Years | 69 (12.4%) | 110 (19.9%) |
| 60 to 64 Years | 71 (12.8%) | 40 (7.2%) |
| 65 to 69 Years | 60 (10.8%) | 29 (5.2%) |
| 70 to 74 Years | 47 (8.5%) | 107 (19.3%) |
| 75 to 79 Years | 12 (2.2%) | 25 (4.5%) |
| 80 to 84 Years | 31 (5.6%) | 11 (2.0%) |
| 85 Years and over | 0 (0.0%) | 88 (15.9%) |
| Total | 556 (100.0%) | 554 (100.0%) |
Families and Households in Point Lookout
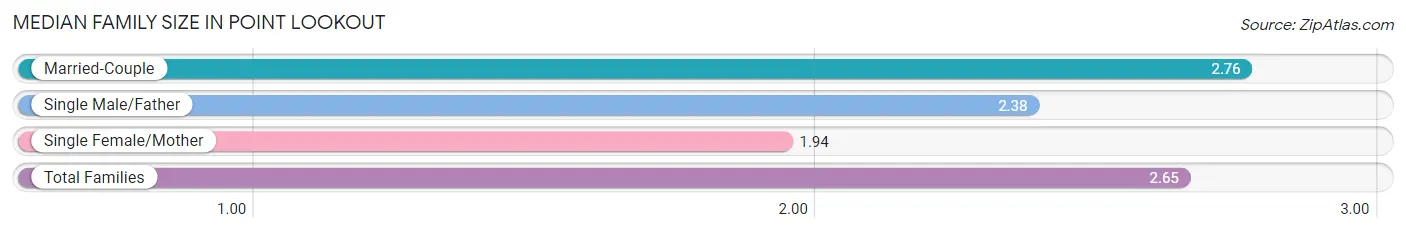
Median Family Size in Point Lookout
The median family size in Point Lookout is 2.65 persons per family, with married-couple families (214 | 75.9%) accounting for the largest median family size of 2.76 persons per family. On the other hand, single female/mother families (16 | 5.7%) represent the smallest median family size with 1.94 persons per family.
| Family Type | # Families | Family Size |
| Married-Couple | 214 (75.9%) | 2.76 |
| Single Male/Father | 52 (18.4%) | 2.38 |
| Single Female/Mother | 16 (5.7%) | 1.94 |
| Total Families | 282 (100.0%) | 2.65 |
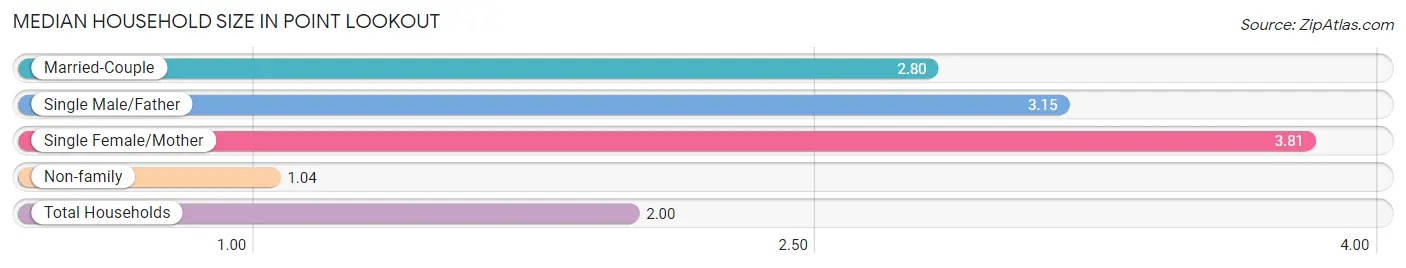
Median Household Size in Point Lookout
The median household size in Point Lookout is 2.00 persons per household, with single female/mother households (16 | 2.9%) accounting for the largest median household size of 3.81 persons per household. non-family households (274 | 49.3%) represent the smallest median household size with 1.04 persons per household.
| Household Type | # Households | Household Size |
| Married-Couple | 214 (38.5%) | 2.80 |
| Single Male/Father | 52 (9.3%) | 3.15 |
| Single Female/Mother | 16 (2.9%) | 3.81 |
| Non-family | 274 (49.3%) | 1.04 |
| Total Households | 556 (100.0%) | 2.00 |
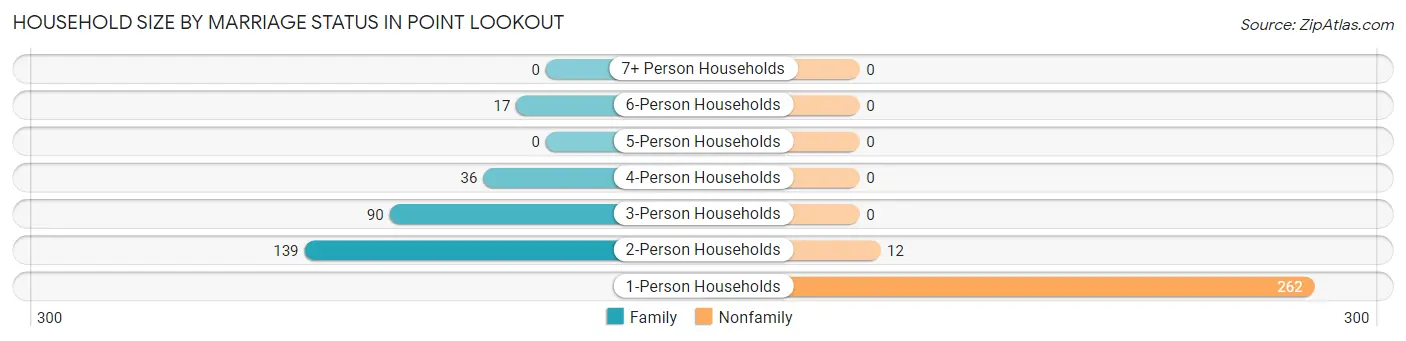
Household Size by Marriage Status in Point Lookout
Out of a total of 556 households in Point Lookout, 282 (50.7%) are family households, while 274 (49.3%) are nonfamily households. The most numerous type of family households are 2-person households, comprising 139, and the most common type of nonfamily households are 1-person households, comprising 262.
| Household Size | Family Households | Nonfamily Households |
| 1-Person Households | - | 262 (47.1%) |
| 2-Person Households | 139 (25.0%) | 12 (2.2%) |
| 3-Person Households | 90 (16.2%) | 0 (0.0%) |
| 4-Person Households | 36 (6.5%) | 0 (0.0%) |
| 5-Person Households | 0 (0.0%) | 0 (0.0%) |
| 6-Person Households | 17 (3.1%) | 0 (0.0%) |
| 7+ Person Households | 0 (0.0%) | 0 (0.0%) |
| Total | 282 (50.7%) | 274 (49.3%) |
Female Fertility in Point Lookout
Fertility by Age in Point Lookout
| Age Bracket | Women with Births | Births / 1,000 Women |
| 15 to 19 years | 0 (0.0%) | 0.0 |
| 20 to 34 years | 0 (0.0%) | 0.0 |
| 35 to 50 years | 0 (0.0%) | 0.0 |
| Total | 0 (0.0%) | 0.0 |
Fertility by Age by Marriage Status in Point Lookout
| Age Bracket | Married | Unmarried |
| 15 to 19 years | 0 (0.0%) | 0 (0.0%) |
| 20 to 34 years | 0 (0.0%) | 0 (0.0%) |
| 35 to 50 years | 0 (0.0%) | 0 (0.0%) |
| Total | 0 (0.0%) | 0 (0.0%) |
Fertility by Education in Point Lookout
| Educational Attainment | Women with Births | Births / 1,000 Women |
| Less than High School | 0 (0.0%) | 0.0 |
| High School Diploma | 0 (0.0%) | 0.0 |
| College or Associate's Degree | 0 (0.0%) | 0.0 |
| Bachelor's Degree | 0 (0.0%) | 0.0 |
| Graduate Degree | 0 (0.0%) | 0.0 |
| Total | 0 (0.0%) | 0.0 |
Fertility by Education by Marriage Status in Point Lookout
| Educational Attainment | Married | Unmarried |
| Less than High School | 0 (0.0%) | 0 (0.0%) |
| High School Diploma | 0 (0.0%) | 0 (0.0%) |
| College or Associate's Degree | 0 (0.0%) | 0 (0.0%) |
| Bachelor's Degree | 0 (0.0%) | 0 (0.0%) |
| Graduate Degree | 0 (0.0%) | 0 (0.0%) |
| Total | 0 (0.0%) | 0 (0.0%) |
Income in Point Lookout
Income Overview in Point Lookout
Per Capita Income in Point Lookout is $85,551, while median incomes of families and households are $203,889 and $104,386 respectively.
| Characteristic | Number | Measure |
| Per Capita Income | 1,110 | $85,551 |
| Median Family Income | 282 | $203,889 |
| Mean Family Income | 282 | $204,955 |
| Median Household Income | 556 | $104,386 |
| Mean Household Income | 556 | $169,585 |
| Income Deficit | 282 | $0 |
| Wage / Income Gap (%) | 1,110 | 67.27% |
| Wage / Income Gap ($) | 1,110 | 32.73¢ per $1 |
| Gini / Inequality Index | 1,110 | 0.51 |
Earnings by Sex in Point Lookout
Average Earnings in Point Lookout are $79,375, $134,659 for men and $44,076 for women, a difference of 67.3%.
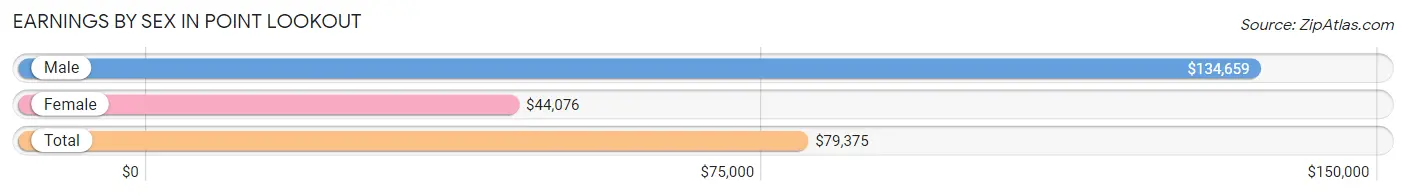
| Sex | Number | Average Earnings |
| Male | 347 (60.5%) | $134,659 |
| Female | 227 (39.6%) | $44,076 |
| Total | 574 (100.0%) | $79,375 |
Earnings by Sex by Income Bracket in Point Lookout
The most common earnings brackets in Point Lookout are $100,000+ for men (199 | 57.4%) and $40,000 to $44,999 for women (63 | 27.8%).
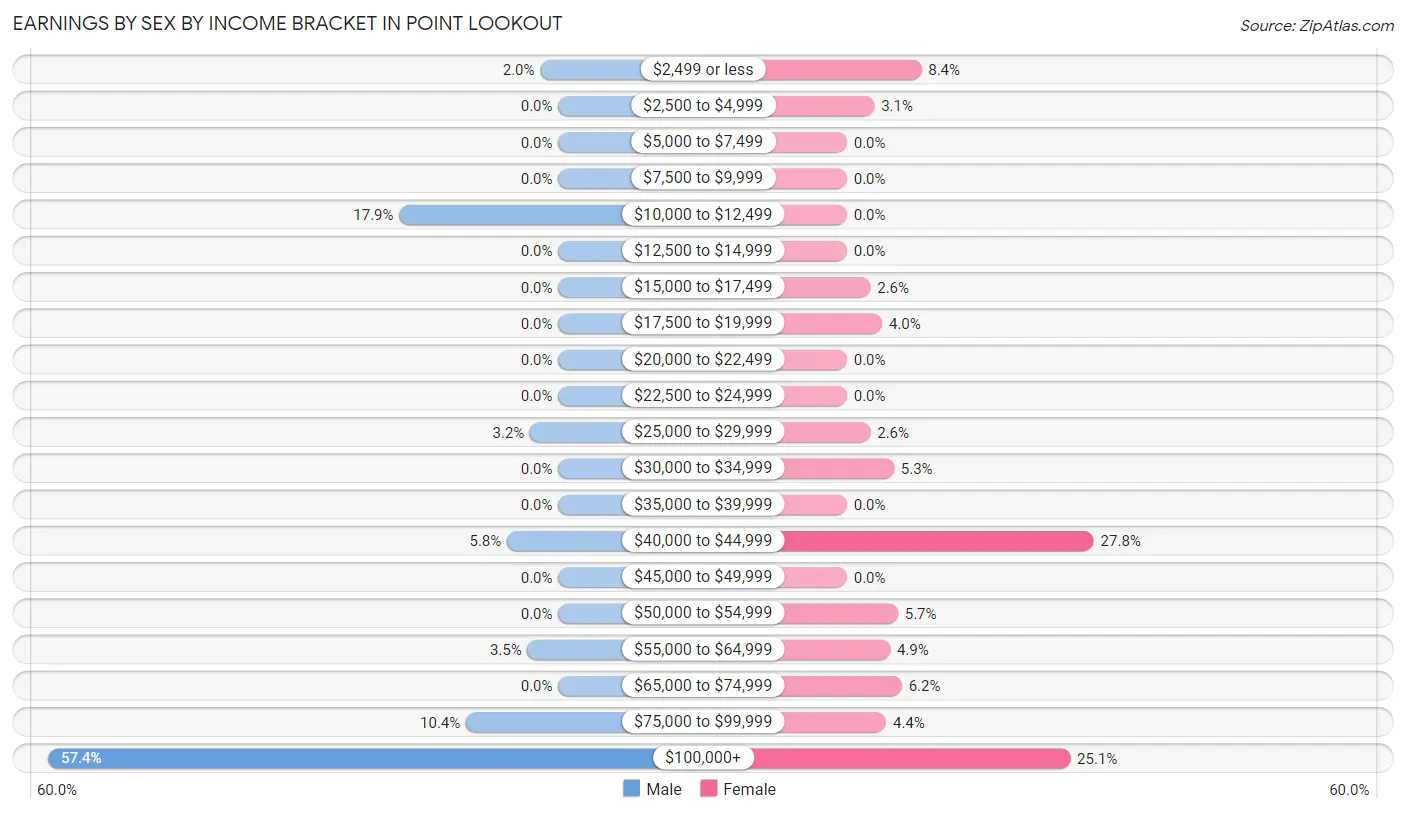
| Income | Male | Female |
| $2,499 or less | 7 (2.0%) | 19 (8.4%) |
| $2,500 to $4,999 | 0 (0.0%) | 7 (3.1%) |
| $5,000 to $7,499 | 0 (0.0%) | 0 (0.0%) |
| $7,500 to $9,999 | 0 (0.0%) | 0 (0.0%) |
| $10,000 to $12,499 | 62 (17.9%) | 0 (0.0%) |
| $12,500 to $14,999 | 0 (0.0%) | 0 (0.0%) |
| $15,000 to $17,499 | 0 (0.0%) | 6 (2.6%) |
| $17,500 to $19,999 | 0 (0.0%) | 9 (4.0%) |
| $20,000 to $22,499 | 0 (0.0%) | 0 (0.0%) |
| $22,500 to $24,999 | 0 (0.0%) | 0 (0.0%) |
| $25,000 to $29,999 | 11 (3.2%) | 6 (2.6%) |
| $30,000 to $34,999 | 0 (0.0%) | 12 (5.3%) |
| $35,000 to $39,999 | 0 (0.0%) | 0 (0.0%) |
| $40,000 to $44,999 | 20 (5.8%) | 63 (27.8%) |
| $45,000 to $49,999 | 0 (0.0%) | 0 (0.0%) |
| $50,000 to $54,999 | 0 (0.0%) | 13 (5.7%) |
| $55,000 to $64,999 | 12 (3.5%) | 11 (4.9%) |
| $65,000 to $74,999 | 0 (0.0%) | 14 (6.2%) |
| $75,000 to $99,999 | 36 (10.4%) | 10 (4.4%) |
| $100,000+ | 199 (57.4%) | 57 (25.1%) |
| Total | 347 (100.0%) | 227 (100.0%) |
Earnings by Sex by Educational Attainment in Point Lookout
Average earnings in Point Lookout are $136,964 for men and $44,022 for women, a difference of 67.9%. Men with an educational attainment of graduate degree enjoy the highest average annual earnings of $230,375, while those with college or associate's degree education earn the least with $135,536. Women with an educational attainment of college or associate's degree earn the most with the average annual earnings of $43,594, while those with college or associate's degree education have the smallest earnings of $43,594.
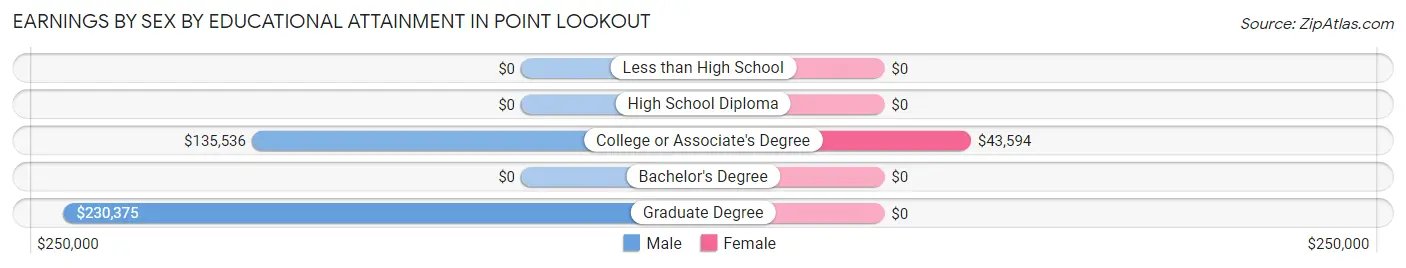
| Educational Attainment | Male Income | Female Income |
| Less than High School | - | - |
| High School Diploma | - | - |
| College or Associate's Degree | $135,536 | $43,594 |
| Bachelor's Degree | - | - |
| Graduate Degree | $230,375 | $0 |
| Total | $136,964 | $44,022 |
Family Income in Point Lookout
Family Income Brackets in Point Lookout
According to the Point Lookout family income data, there are 150 families falling into the $200,000+ income range, which is the most common income bracket and makes up 53.2% of all families.
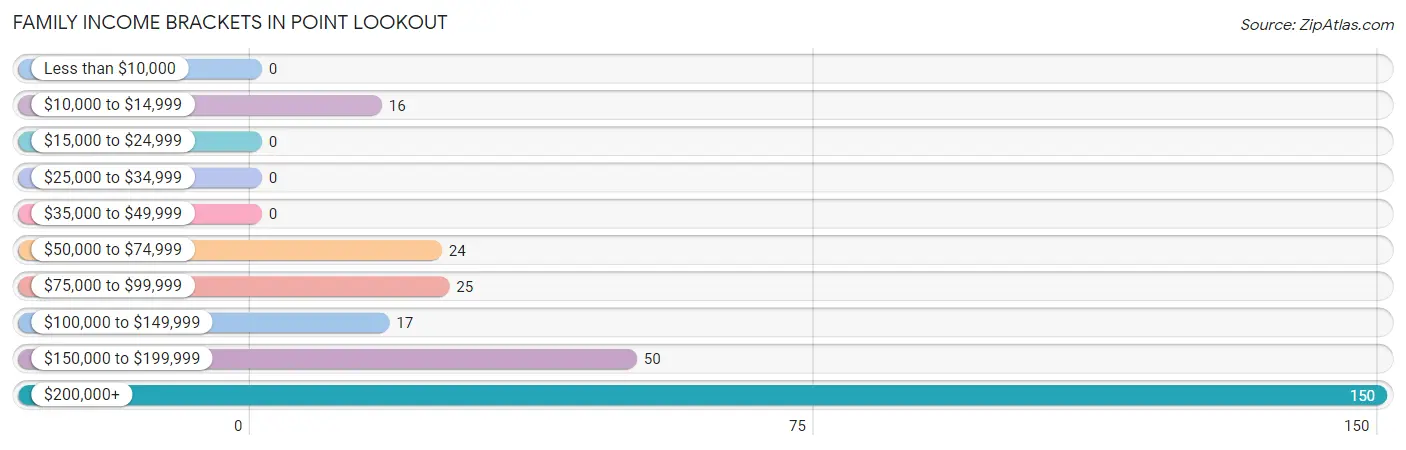
| Income Bracket | # Families | % Families |
| Less than $10,000 | 0 | 0.0% |
| $10,000 to $14,999 | 16 | 5.7% |
| $15,000 to $24,999 | 0 | 0.0% |
| $25,000 to $34,999 | 0 | 0.0% |
| $35,000 to $49,999 | 0 | 0.0% |
| $50,000 to $74,999 | 24 | 8.5% |
| $75,000 to $99,999 | 25 | 8.9% |
| $100,000 to $149,999 | 17 | 6.0% |
| $150,000 to $199,999 | 50 | 17.7% |
| $200,000+ | 150 | 53.2% |
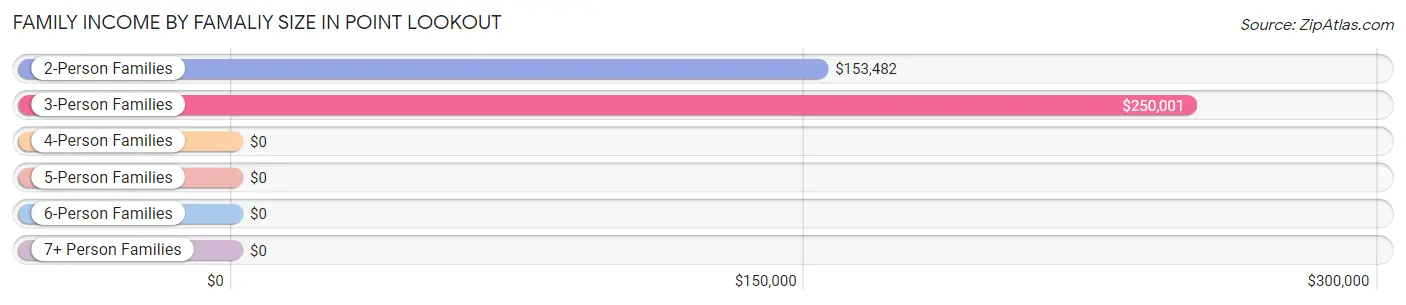
Family Income by Famaliy Size in Point Lookout
3-person families (56 | 19.9%) account for the highest median family income in Point Lookout with $250,001 per family, while 3-person families (56 | 19.9%) have the highest median income of $83,334 per family member.
| Income Bracket | # Families | Median Income |
| 2-Person Families | 197 (69.9%) | $153,482 |
| 3-Person Families | 56 (19.9%) | $250,001 |
| 4-Person Families | 12 (4.3%) | $0 |
| 5-Person Families | 0 (0.0%) | $0 |
| 6-Person Families | 17 (6.0%) | $0 |
| 7+ Person Families | 0 (0.0%) | $0 |
| Total | 282 (100.0%) | $203,889 |
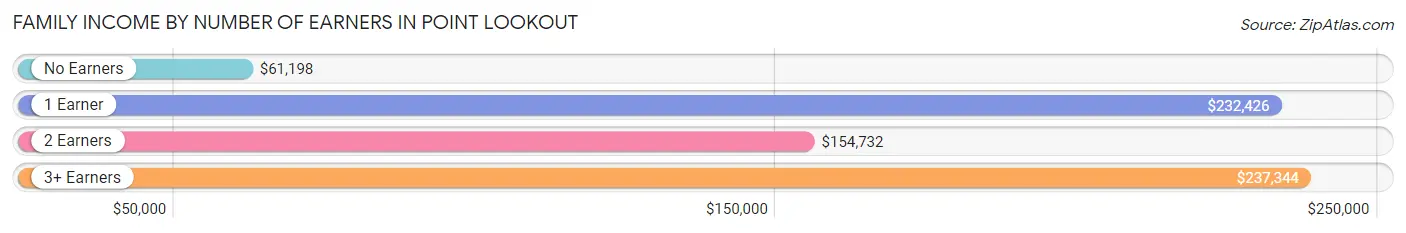
Family Income by Number of Earners in Point Lookout
The median family income in Point Lookout is $203,889, with families comprising 3+ earners (33) having the highest median family income of $237,344, while families with no earners (55) have the lowest median family income of $61,198, accounting for 11.7% and 19.5% of families, respectively.
| Number of Earners | # Families | Median Income |
| No Earners | 55 (19.5%) | $61,198 |
| 1 Earner | 107 (37.9%) | $232,426 |
| 2 Earners | 87 (30.8%) | $154,732 |
| 3+ Earners | 33 (11.7%) | $237,344 |
| Total | 282 (100.0%) | $203,889 |
Household Income in Point Lookout
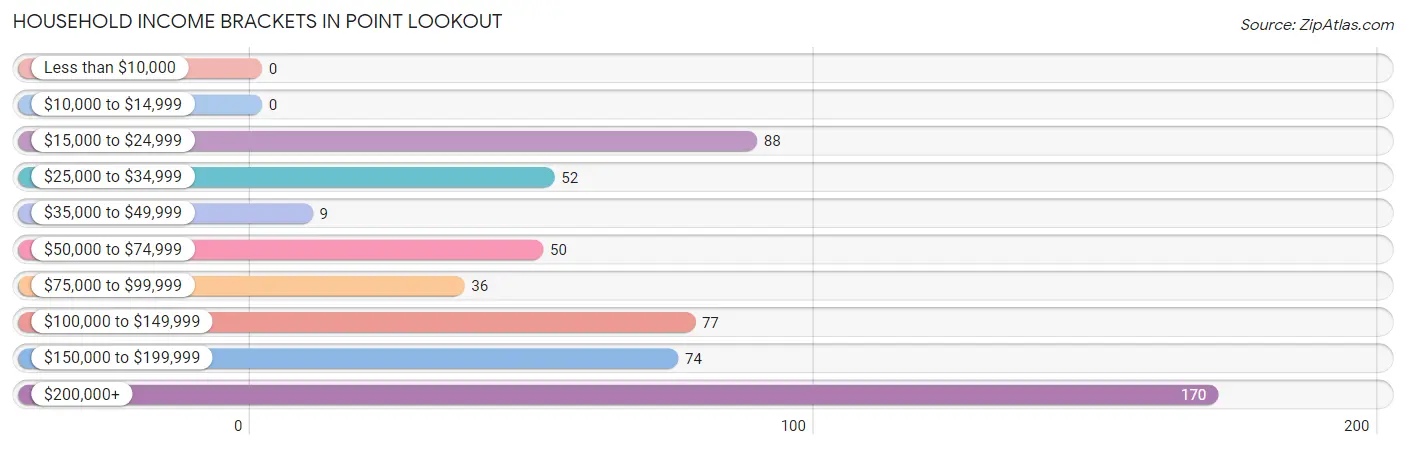
Household Income Brackets in Point Lookout
With 170 households falling in the category, the $200,000+ income range is the most frequent in Point Lookout, accounting for 30.6% of all households.
| Income Bracket | # Households | % Households |
| Less than $10,000 | 0 | 0.0% |
| $10,000 to $14,999 | 0 | 0.0% |
| $15,000 to $24,999 | 88 | 15.8% |
| $25,000 to $34,999 | 52 | 9.4% |
| $35,000 to $49,999 | 9 | 1.6% |
| $50,000 to $74,999 | 50 | 9.0% |
| $75,000 to $99,999 | 36 | 6.5% |
| $100,000 to $149,999 | 77 | 13.8% |
| $150,000 to $199,999 | 74 | 13.3% |
| $200,000+ | 170 | 30.6% |
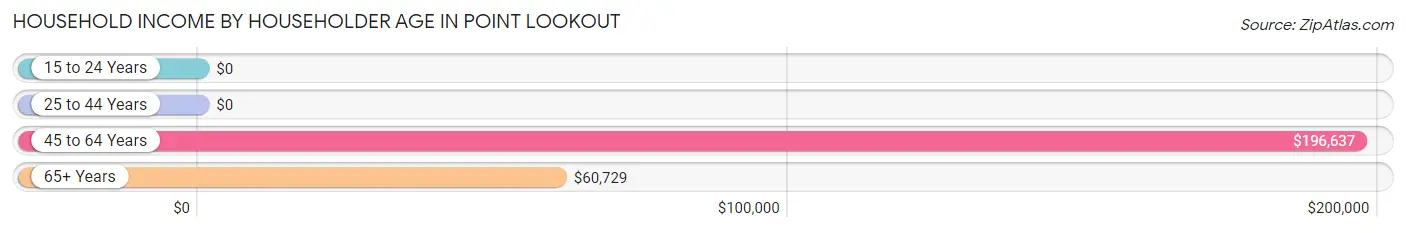
Household Income by Householder Age in Point Lookout
The median household income in Point Lookout is $104,386, with the highest median household income of $196,637 found in the 45 to 64 years age bracket for the primary householder. A total of 251 households (45.1%) fall into this category.
| Income Bracket | # Households | Median Income |
| 15 to 24 Years | 0 (0.0%) | $0 |
| 25 to 44 Years | 5 (0.9%) | $0 |
| 45 to 64 Years | 251 (45.1%) | $196,637 |
| 65+ Years | 300 (54.0%) | $60,729 |
| Total | 556 (100.0%) | $104,386 |
Poverty in Point Lookout
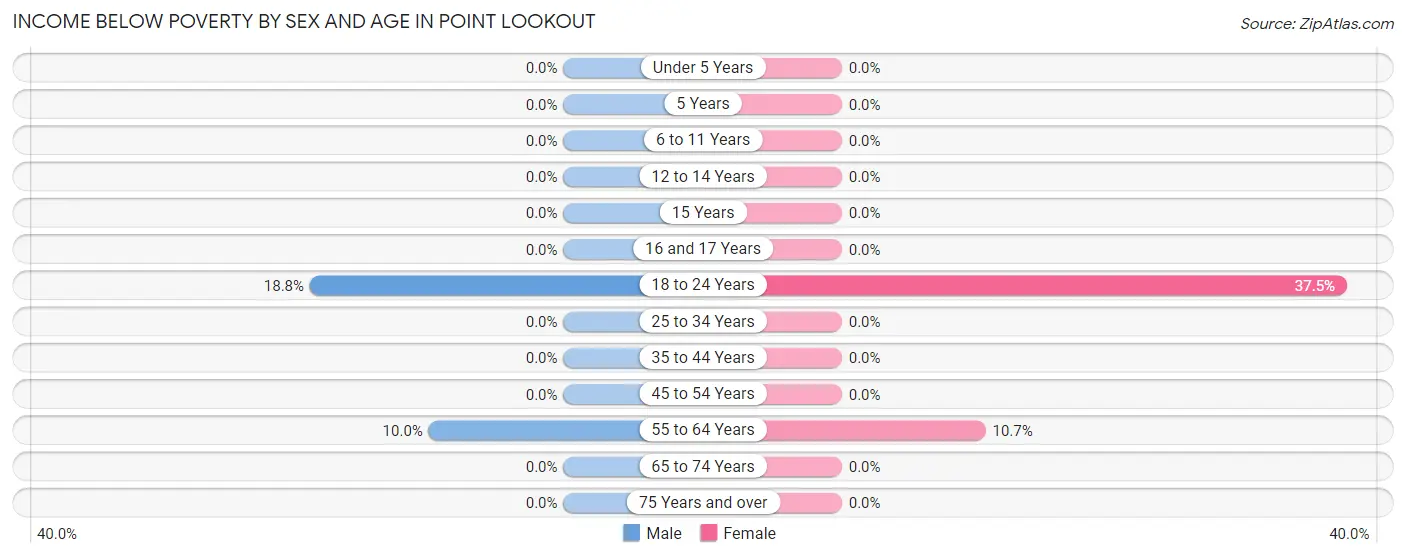
Income Below Poverty by Sex and Age in Point Lookout
With 5.4% poverty level for males and 5.6% for females among the residents of Point Lookout, 18 to 24 year old males and 18 to 24 year old females are the most vulnerable to poverty, with 16 males (18.8%) and 15 females (37.5%) in their respective age groups living below the poverty level.
| Age Bracket | Male | Female |
| Under 5 Years | 0 (0.0%) | 0 (0.0%) |
| 5 Years | 0 (0.0%) | 0 (0.0%) |
| 6 to 11 Years | 0 (0.0%) | 0 (0.0%) |
| 12 to 14 Years | 0 (0.0%) | 0 (0.0%) |
| 15 Years | 0 (0.0%) | 0 (0.0%) |
| 16 and 17 Years | 0 (0.0%) | 0 (0.0%) |
| 18 to 24 Years | 16 (18.8%) | 15 (37.5%) |
| 25 to 34 Years | 0 (0.0%) | 0 (0.0%) |
| 35 to 44 Years | 0 (0.0%) | 0 (0.0%) |
| 45 to 54 Years | 0 (0.0%) | 0 (0.0%) |
| 55 to 64 Years | 14 (10.0%) | 16 (10.7%) |
| 65 to 74 Years | 0 (0.0%) | 0 (0.0%) |
| 75 Years and over | 0 (0.0%) | 0 (0.0%) |
| Total | 30 (5.4%) | 31 (5.6%) |
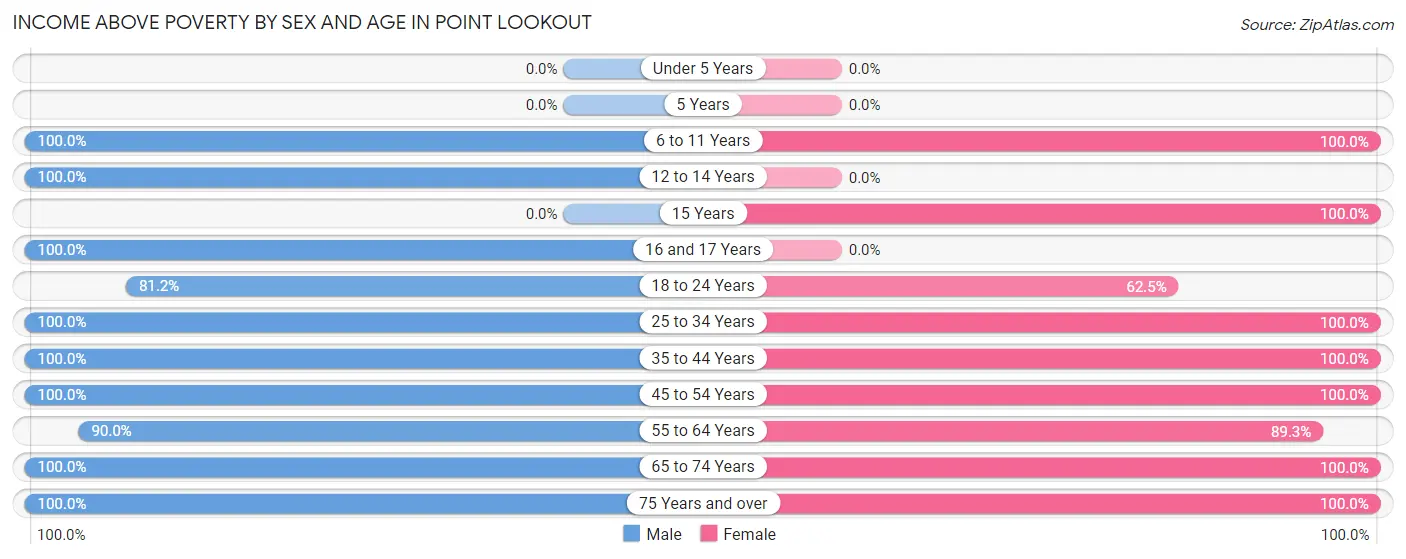
Income Above Poverty by Sex and Age in Point Lookout
According to the poverty statistics in Point Lookout, males aged 6 to 11 years and females aged 6 to 11 years are the age groups that are most secure financially, with 100.0% of males and 100.0% of females in these age groups living above the poverty line.
| Age Bracket | Male | Female |
| Under 5 Years | 0 (0.0%) | 0 (0.0%) |
| 5 Years | 0 (0.0%) | 0 (0.0%) |
| 6 to 11 Years | 27 (100.0%) | 18 (100.0%) |
| 12 to 14 Years | 19 (100.0%) | 0 (0.0%) |
| 15 Years | 0 (0.0%) | 9 (100.0%) |
| 16 and 17 Years | 51 (100.0%) | 0 (0.0%) |
| 18 to 24 Years | 69 (81.2%) | 25 (62.5%) |
| 25 to 34 Years | 18 (100.0%) | 50 (100.0%) |
| 35 to 44 Years | 5 (100.0%) | 5 (100.0%) |
| 45 to 54 Years | 61 (100.0%) | 22 (100.0%) |
| 55 to 64 Years | 126 (90.0%) | 134 (89.3%) |
| 65 to 74 Years | 107 (100.0%) | 136 (100.0%) |
| 75 Years and over | 43 (100.0%) | 124 (100.0%) |
| Total | 526 (94.6%) | 523 (94.4%) |
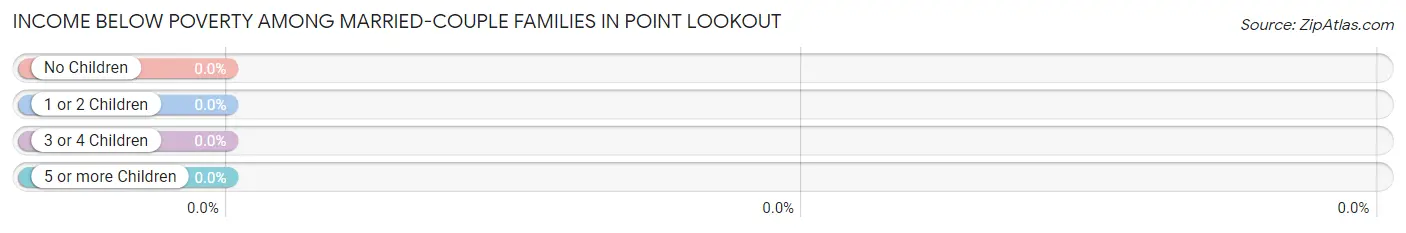
Income Below Poverty Among Married-Couple Families in Point Lookout
| Children | Above Poverty | Below Poverty |
| No Children | 172 (100.0%) | 0 (0.0%) |
| 1 or 2 Children | 25 (100.0%) | 0 (0.0%) |
| 3 or 4 Children | 17 (100.0%) | 0 (0.0%) |
| 5 or more Children | 0 (0.0%) | 0 (0.0%) |
| Total | 214 (100.0%) | 0 (0.0%) |
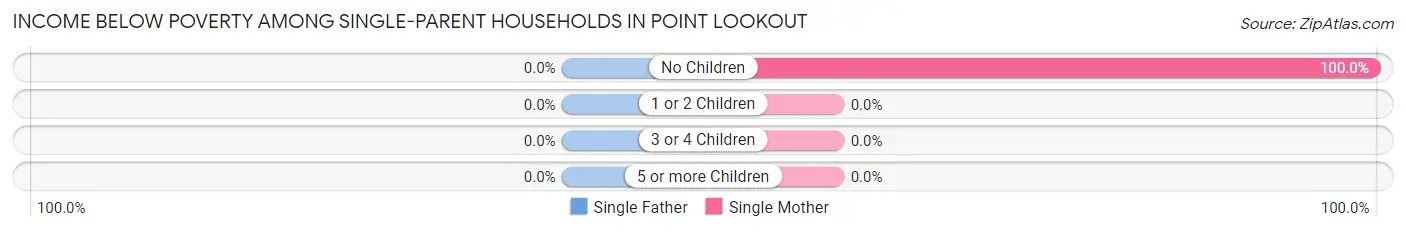
Income Below Poverty Among Single-Parent Households in Point Lookout
| Children | Single Father | Single Mother |
| No Children | 0 (0.0%) | 16 (100.0%) |
| 1 or 2 Children | 0 (0.0%) | 0 (0.0%) |
| 3 or 4 Children | 0 (0.0%) | 0 (0.0%) |
| 5 or more Children | 0 (0.0%) | 0 (0.0%) |
| Total | 0 (0.0%) | 16 (100.0%) |
Income Below Poverty Among Married-Couple vs Single-Parent Households in Point Lookout
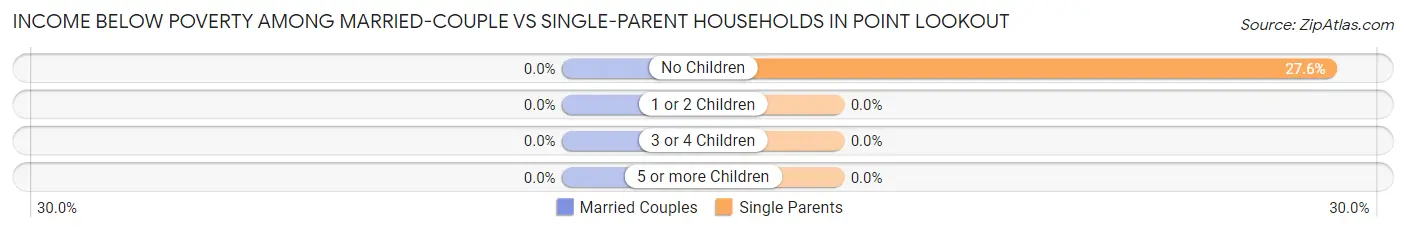
| Children | Married-Couple Families | Single-Parent Households |
| No Children | 0 (0.0%) | 16 (27.6%) |
| 1 or 2 Children | 0 (0.0%) | 0 (0.0%) |
| 3 or 4 Children | 0 (0.0%) | 0 (0.0%) |
| 5 or more Children | 0 (0.0%) | 0 (0.0%) |
| Total | 0 (0.0%) | 16 (23.5%) |
Employment Characteristics in Point Lookout
Employment by Class of Employer in Point Lookout
Among the 534 employed individuals in Point Lookout, private company employees (390 | 73.0%), local government employees (60 | 11.2%), and self-employed (incorporated) (45 | 8.4%) make up the most common classes of employment.
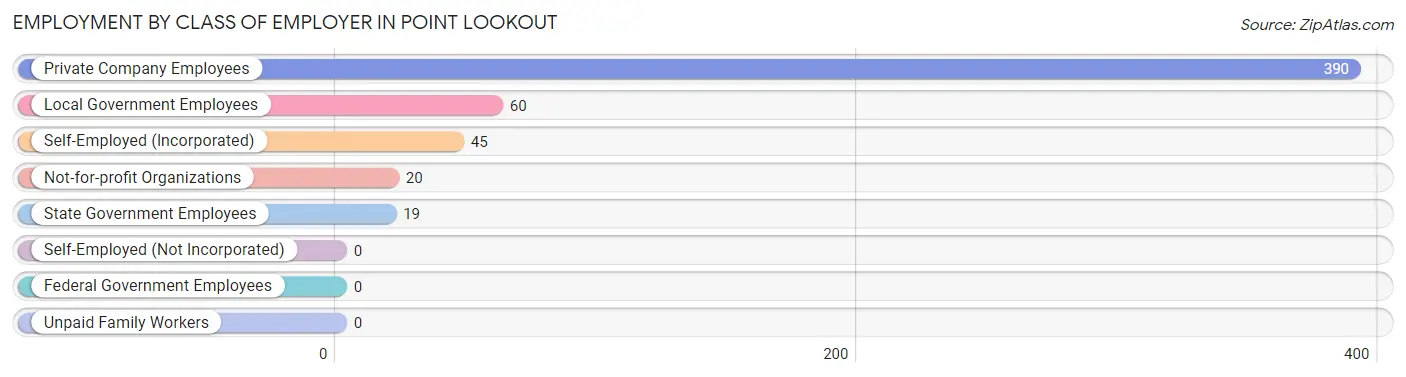
| Employer Class | # Employees | % Employees |
| Private Company Employees | 390 | 73.0% |
| Self-Employed (Incorporated) | 45 | 8.4% |
| Self-Employed (Not Incorporated) | 0 | 0.0% |
| Not-for-profit Organizations | 20 | 3.7% |
| Local Government Employees | 60 | 11.2% |
| State Government Employees | 19 | 3.6% |
| Federal Government Employees | 0 | 0.0% |
| Unpaid Family Workers | 0 | 0.0% |
| Total | 534 | 100.0% |
Employment Status by Age in Point Lookout
According to the labor force statistics for Point Lookout, out of the total population over 16 years of age (1,037), 53.4% or 554 individuals are in the labor force, with 2.9% or 16 of them unemployed. The age group with the highest labor force participation rate is 20 to 24 years, with 100.0% or 94 individuals in the labor force. Within the labor force, the 20 to 24 years age range has the highest percentage of unemployed individuals, with 12.8% or 12 of them being unemployed.
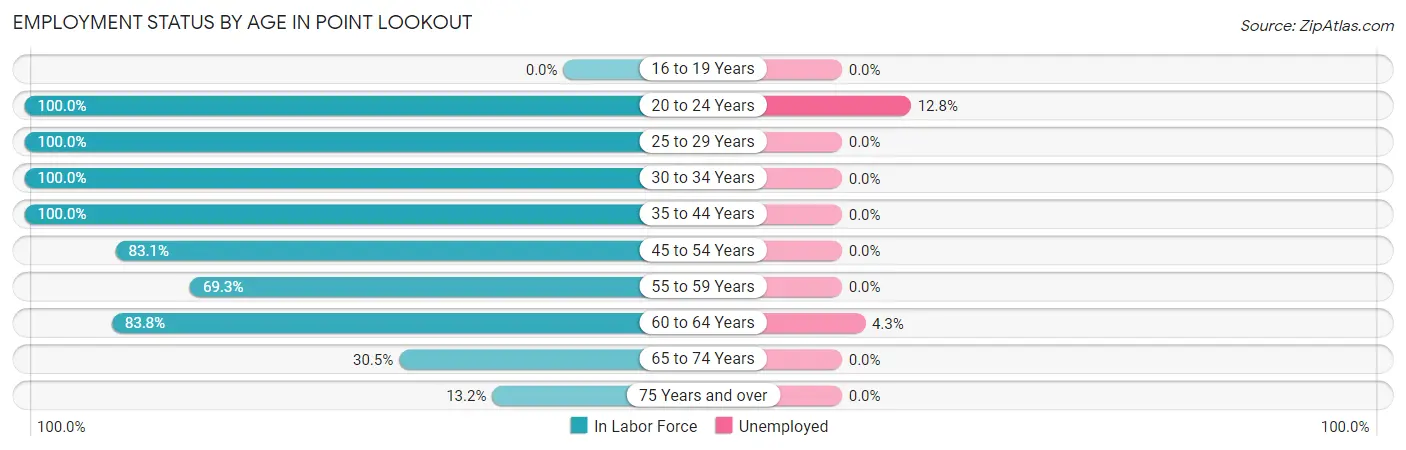
| Age Bracket | In Labor Force | Unemployed |
| 16 to 19 Years | 0 (0.0%) | 0 (0.0%) |
| 20 to 24 Years | 94 (100.0%) | 12 (12.8%) |
| 25 to 29 Years | 15 (100.0%) | 0 (0.0%) |
| 30 to 34 Years | 53 (100.0%) | 0 (0.0%) |
| 35 to 44 Years | 10 (100.0%) | 0 (0.0%) |
| 45 to 54 Years | 69 (83.1%) | 0 (0.0%) |
| 55 to 59 Years | 124 (69.3%) | 0 (0.0%) |
| 60 to 64 Years | 93 (83.8%) | 4 (4.3%) |
| 65 to 74 Years | 74 (30.5%) | 0 (0.0%) |
| 75 Years and over | 22 (13.2%) | 0 (0.0%) |
| Total | 554 (53.4%) | 16 (2.9%) |
Employment Status by Educational Attainment in Point Lookout
According to labor force statistics for Point Lookout, 80.7% of individuals (364) out of the total population between 25 and 64 years of age (451) are in the labor force, with 1.1% or 4 of them being unemployed. The group with the highest labor force participation rate are those with the educational attainment of high school diploma, with 86.1% or 87 individuals in the labor force. Within the labor force, individuals with bachelor's degree or higher education have the highest percentage of unemployment, with 2.2% or 4 of them being unemployed.
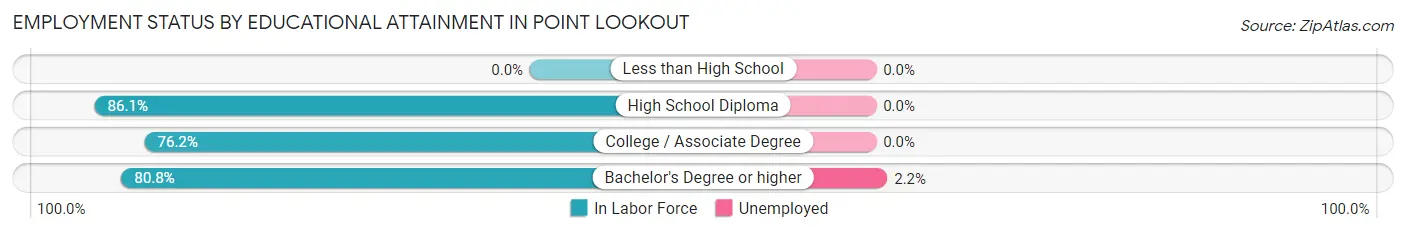
| Educational Attainment | In Labor Force | Unemployed |
| Less than High School | 0 (0.0%) | 0 (0.0%) |
| High School Diploma | 87 (86.1%) | 0 (0.0%) |
| College / Associate Degree | 96 (76.2%) | 0 (0.0%) |
| Bachelor's Degree or higher | 181 (80.8%) | 5 (2.2%) |
| Total | 364 (80.7%) | 5 (1.1%) |
Employment Occupations by Sex in Point Lookout
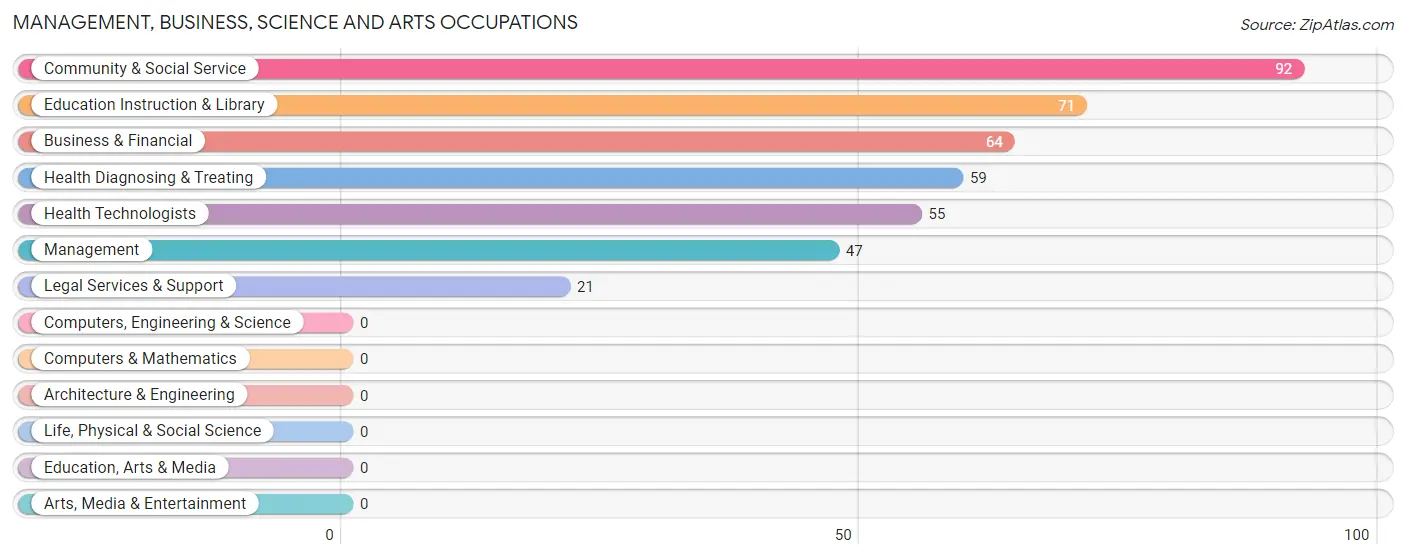
Management, Business, Science and Arts Occupations
The most common Management, Business, Science and Arts occupations in Point Lookout are Community & Social Service (92 | 17.1%), Education Instruction & Library (71 | 13.2%), Business & Financial (64 | 11.9%), Health Diagnosing & Treating (59 | 11.0%), and Health Technologists (55 | 10.2%).
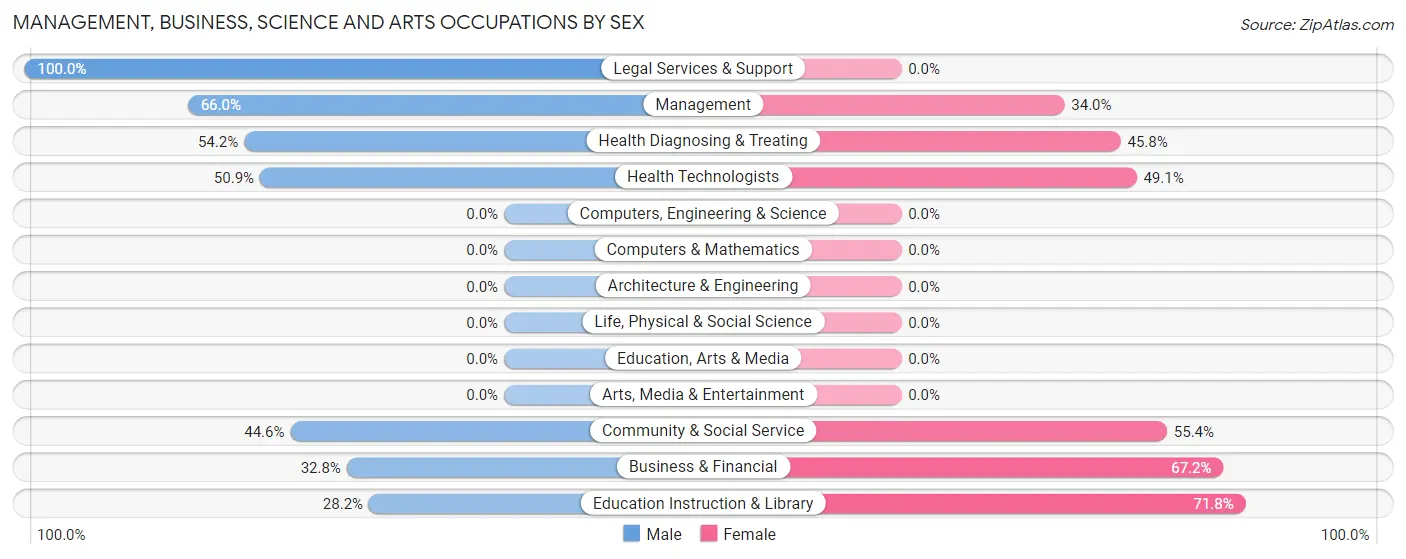
Management, Business, Science and Arts Occupations by Sex
Within the Management, Business, Science and Arts occupations in Point Lookout, the most male-oriented occupations are Legal Services & Support (100.0%), Management (66.0%), and Health Diagnosing & Treating (54.2%), while the most female-oriented occupations are Education Instruction & Library (71.8%), Business & Financial (67.2%), and Community & Social Service (55.4%).
| Occupation | Male | Female |
| Management | 31 (66.0%) | 16 (34.0%) |
| Business & Financial | 21 (32.8%) | 43 (67.2%) |
| Computers, Engineering & Science | 0 (0.0%) | 0 (0.0%) |
| Computers & Mathematics | 0 (0.0%) | 0 (0.0%) |
| Architecture & Engineering | 0 (0.0%) | 0 (0.0%) |
| Life, Physical & Social Science | 0 (0.0%) | 0 (0.0%) |
| Community & Social Service | 41 (44.6%) | 51 (55.4%) |
| Education, Arts & Media | 0 (0.0%) | 0 (0.0%) |
| Legal Services & Support | 21 (100.0%) | 0 (0.0%) |
| Education Instruction & Library | 20 (28.2%) | 51 (71.8%) |
| Arts, Media & Entertainment | 0 (0.0%) | 0 (0.0%) |
| Health Diagnosing & Treating | 32 (54.2%) | 27 (45.8%) |
| Health Technologists | 28 (50.9%) | 27 (49.1%) |
| Total (Category) | 125 (47.7%) | 137 (52.3%) |
| Total (Overall) | 334 (62.1%) | 204 (37.9%) |
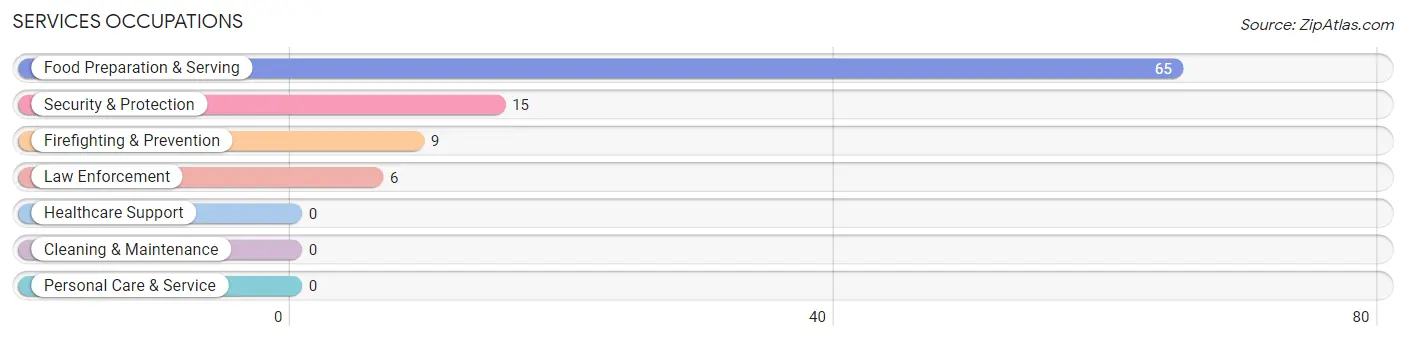
Services Occupations
The most common Services occupations in Point Lookout are Food Preparation & Serving (65 | 12.1%), Security & Protection (15 | 2.8%), Firefighting & Prevention (9 | 1.7%), and Law Enforcement (6 | 1.1%).
Services Occupations by Sex
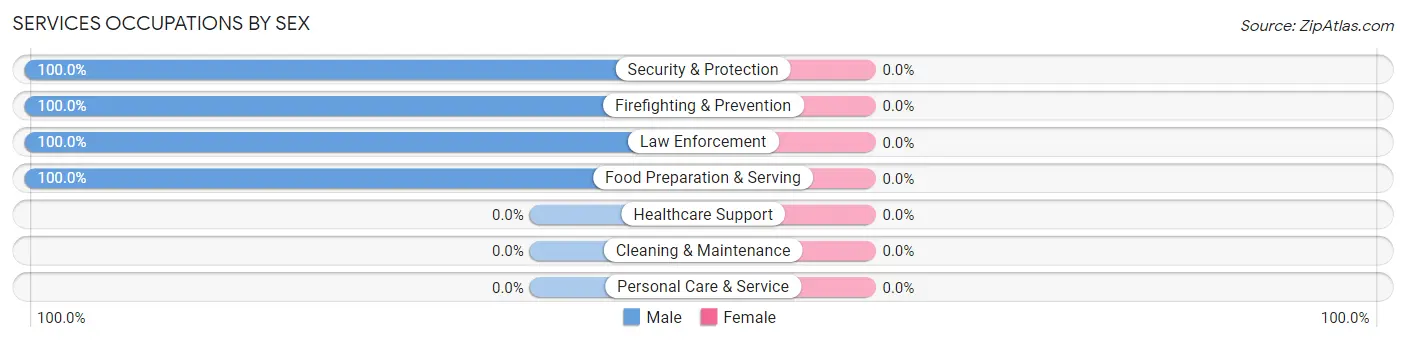
| Occupation | Male | Female |
| Healthcare Support | 0 (0.0%) | 0 (0.0%) |
| Security & Protection | 15 (100.0%) | 0 (0.0%) |
| Firefighting & Prevention | 9 (100.0%) | 0 (0.0%) |
| Law Enforcement | 6 (100.0%) | 0 (0.0%) |
| Food Preparation & Serving | 65 (100.0%) | 0 (0.0%) |
| Cleaning & Maintenance | 0 (0.0%) | 0 (0.0%) |
| Personal Care & Service | 0 (0.0%) | 0 (0.0%) |
| Total (Category) | 80 (100.0%) | 0 (0.0%) |
| Total (Overall) | 334 (62.1%) | 204 (37.9%) |
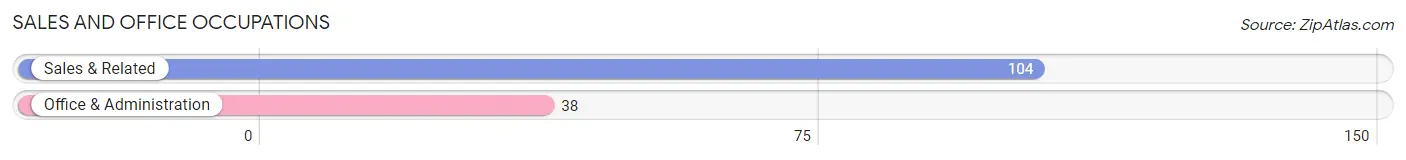
Sales and Office Occupations
The most common Sales and Office occupations in Point Lookout are Sales & Related (104 | 19.3%), and Office & Administration (38 | 7.1%).
Sales and Office Occupations by Sex
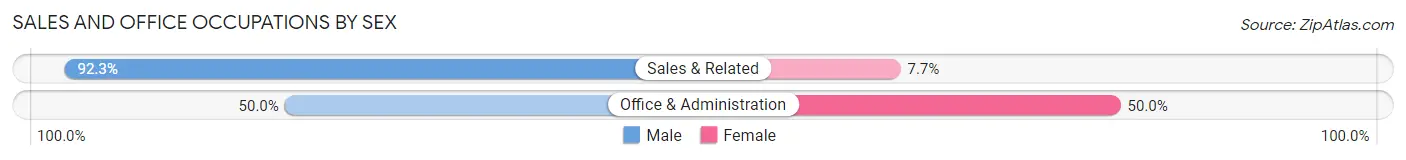
| Occupation | Male | Female |
| Sales & Related | 96 (92.3%) | 8 (7.7%) |
| Office & Administration | 19 (50.0%) | 19 (50.0%) |
| Total (Category) | 115 (81.0%) | 27 (19.0%) |
| Total (Overall) | 334 (62.1%) | 204 (37.9%) |
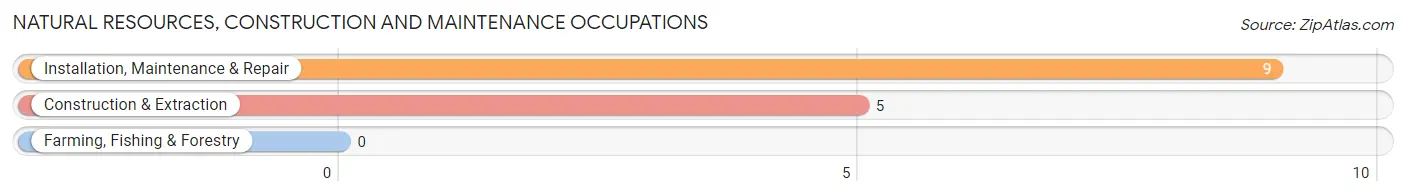
Natural Resources, Construction and Maintenance Occupations
The most common Natural Resources, Construction and Maintenance occupations in Point Lookout are Installation, Maintenance & Repair (9 | 1.7%), and Construction & Extraction (5 | 0.9%).
Natural Resources, Construction and Maintenance Occupations by Sex
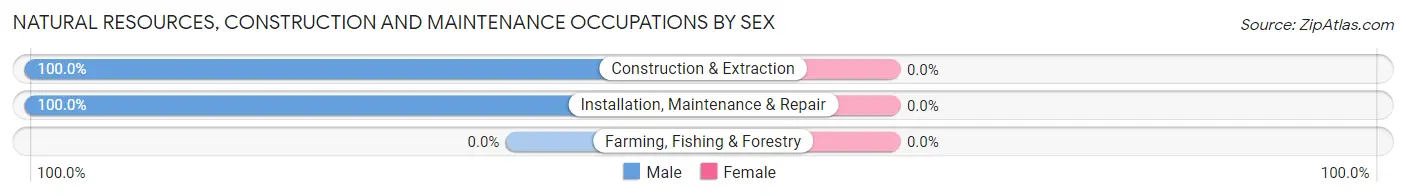
| Occupation | Male | Female |
| Farming, Fishing & Forestry | 0 (0.0%) | 0 (0.0%) |
| Construction & Extraction | 5 (100.0%) | 0 (0.0%) |
| Installation, Maintenance & Repair | 9 (100.0%) | 0 (0.0%) |
| Total (Category) | 14 (100.0%) | 0 (0.0%) |
| Total (Overall) | 334 (62.1%) | 204 (37.9%) |
Production, Transportation and Moving Occupations
The most common Production, Transportation and Moving occupations in Point Lookout are , and Material Moving (40 | 7.4%).
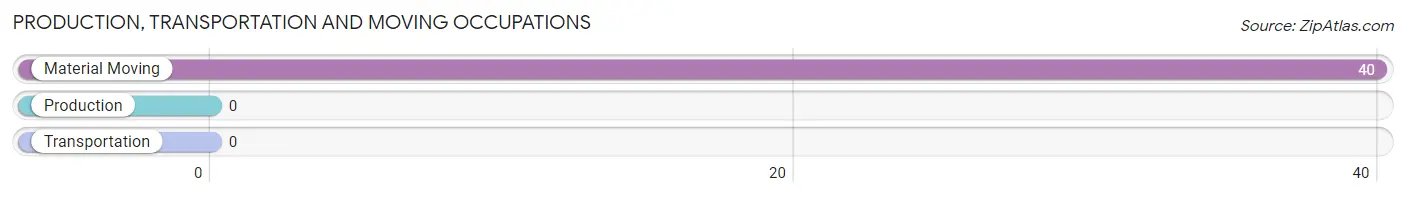
Production, Transportation and Moving Occupations by Sex
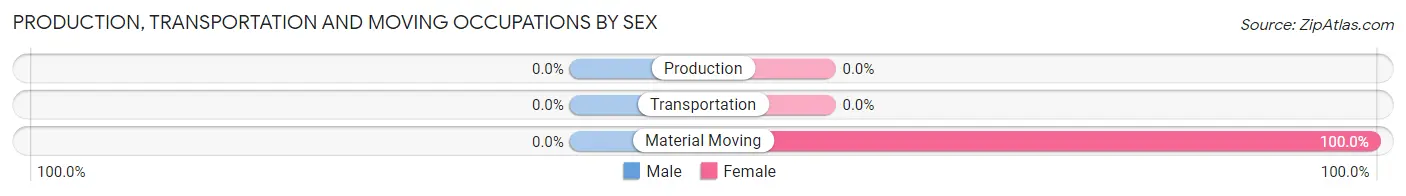
| Occupation | Male | Female |
| Production | 0 (0.0%) | 0 (0.0%) |
| Transportation | 0 (0.0%) | 0 (0.0%) |
| Material Moving | 0 (0.0%) | 40 (100.0%) |
| Total (Category) | 0 (0.0%) | 40 (100.0%) |
| Total (Overall) | 334 (62.1%) | 204 (37.9%) |
Employment Industries by Sex in Point Lookout
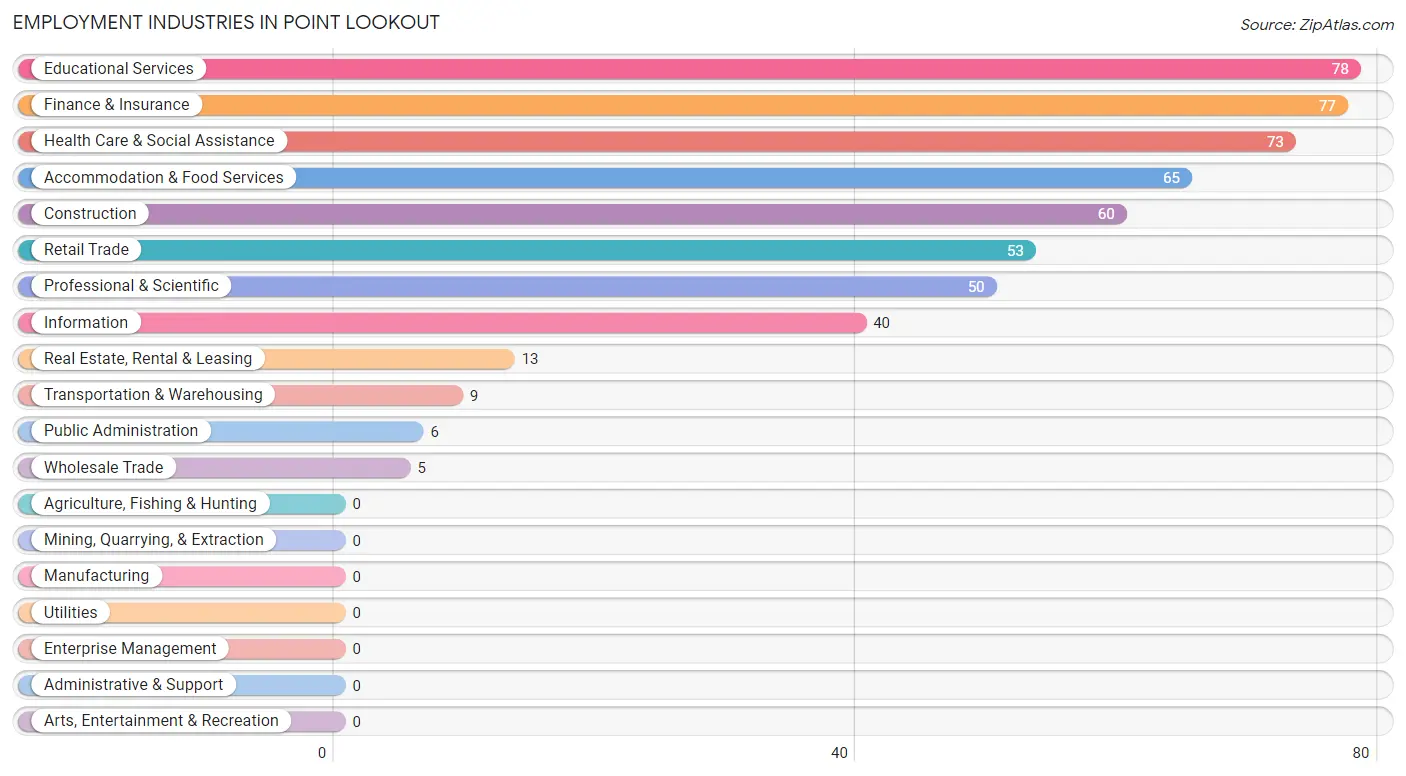
Employment Industries in Point Lookout
The major employment industries in Point Lookout include Educational Services (78 | 14.5%), Finance & Insurance (77 | 14.3%), Health Care & Social Assistance (73 | 13.6%), Accommodation & Food Services (65 | 12.1%), and Construction (60 | 11.2%).
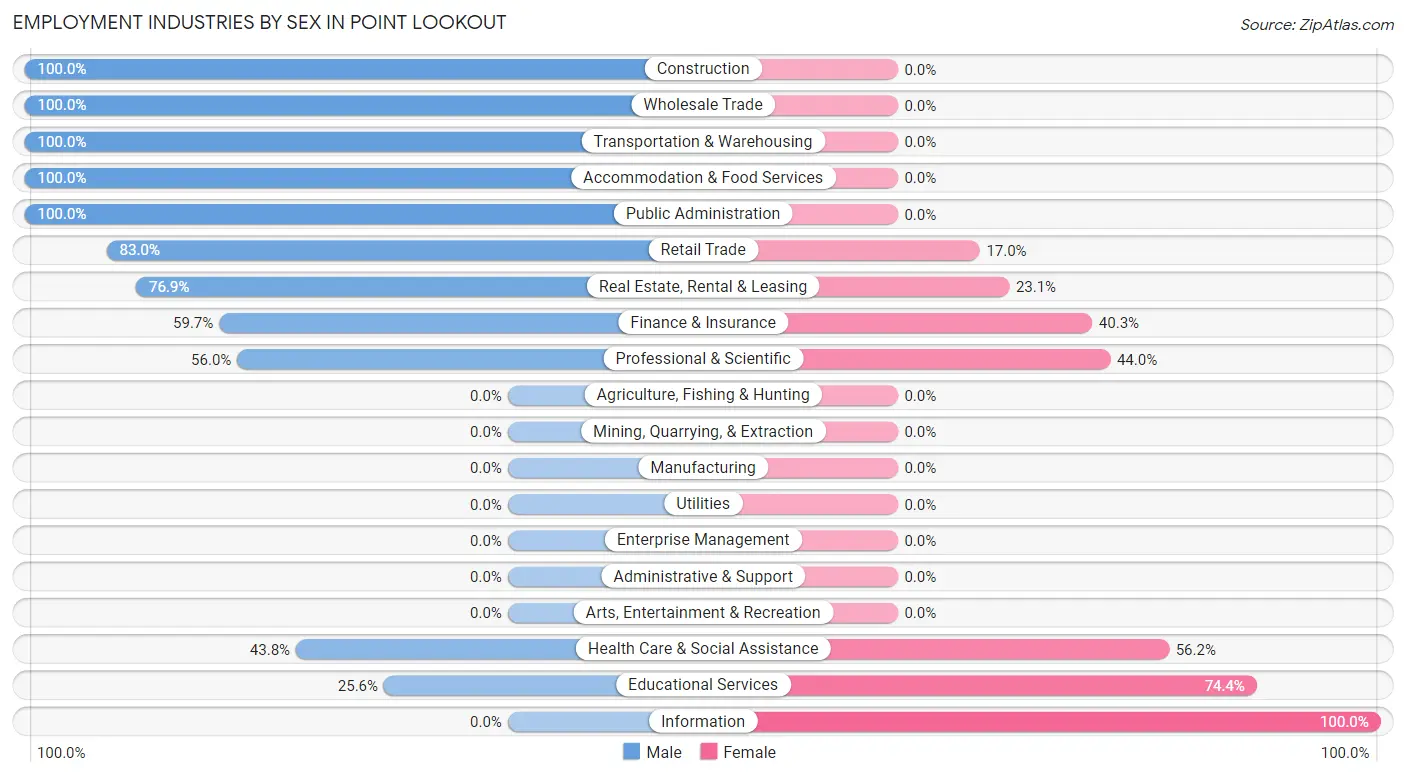
Employment Industries by Sex in Point Lookout
The Point Lookout industries that see more men than women are Construction (100.0%), Wholesale Trade (100.0%), and Transportation & Warehousing (100.0%), whereas the industries that tend to have a higher number of women are Information (100.0%), Educational Services (74.4%), and Health Care & Social Assistance (56.2%).
| Industry | Male | Female |
| Agriculture, Fishing & Hunting | 0 (0.0%) | 0 (0.0%) |
| Mining, Quarrying, & Extraction | 0 (0.0%) | 0 (0.0%) |
| Construction | 60 (100.0%) | 0 (0.0%) |
| Manufacturing | 0 (0.0%) | 0 (0.0%) |
| Wholesale Trade | 5 (100.0%) | 0 (0.0%) |
| Retail Trade | 44 (83.0%) | 9 (17.0%) |
| Transportation & Warehousing | 9 (100.0%) | 0 (0.0%) |
| Utilities | 0 (0.0%) | 0 (0.0%) |
| Information | 0 (0.0%) | 40 (100.0%) |
| Finance & Insurance | 46 (59.7%) | 31 (40.3%) |
| Real Estate, Rental & Leasing | 10 (76.9%) | 3 (23.1%) |
| Professional & Scientific | 28 (56.0%) | 22 (44.0%) |
| Enterprise Management | 0 (0.0%) | 0 (0.0%) |
| Administrative & Support | 0 (0.0%) | 0 (0.0%) |
| Educational Services | 20 (25.6%) | 58 (74.4%) |
| Health Care & Social Assistance | 32 (43.8%) | 41 (56.2%) |
| Arts, Entertainment & Recreation | 0 (0.0%) | 0 (0.0%) |
| Accommodation & Food Services | 65 (100.0%) | 0 (0.0%) |
| Public Administration | 6 (100.0%) | 0 (0.0%) |
| Total | 334 (62.1%) | 204 (37.9%) |
Education in Point Lookout
School Enrollment in Point Lookout
The most common levels of schooling among the 218 students in Point Lookout are college / undergraduate (74 | 33.9%), high school (67 | 30.7%), and middle school (55 | 25.2%).
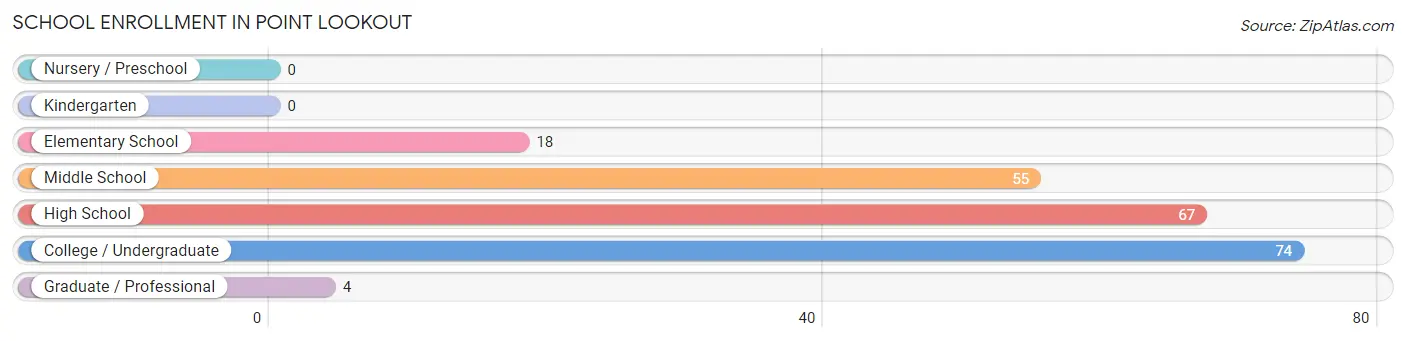
| School Level | # Students | % Students |
| Nursery / Preschool | 0 | 0.0% |
| Kindergarten | 0 | 0.0% |
| Elementary School | 18 | 8.3% |
| Middle School | 55 | 25.2% |
| High School | 67 | 30.7% |
| College / Undergraduate | 74 | 33.9% |
| Graduate / Professional | 4 | 1.8% |
| Total | 218 | 100.0% |
School Enrollment by Age by Funding Source in Point Lookout
Out of a total of 218 students who are enrolled in schools in Point Lookout, 58 (26.6%) attend a private institution, while the remaining 160 (73.4%) are enrolled in public schools. The age group of 20 to 24 year olds has the highest likelihood of being enrolled in private schools, with 54 (100.0% in the age bracket) enrolled. Conversely, the age group of 5 to 9 year old has the lowest likelihood of being enrolled in a private school, with 18 (100.0% in the age bracket) attending a public institution.
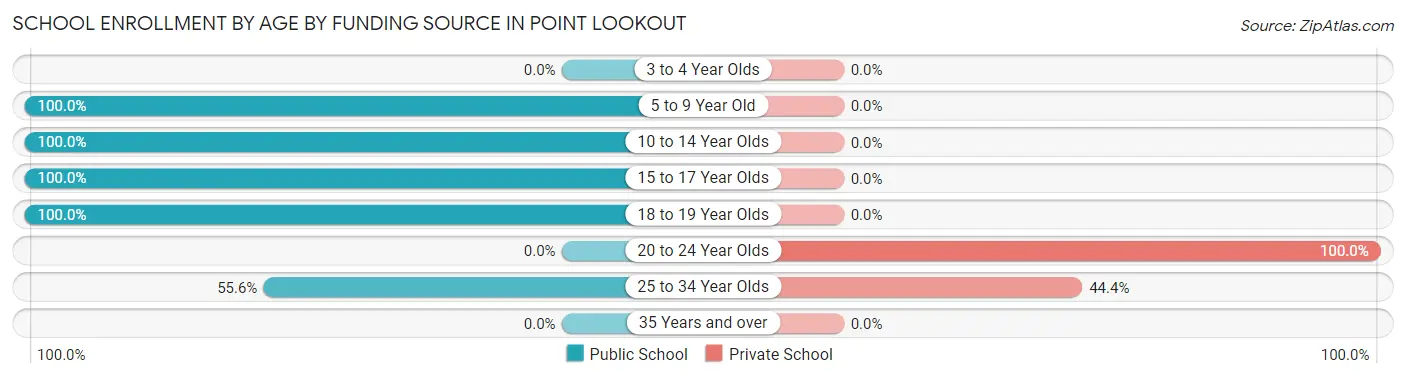
| Age Bracket | Public School | Private School |
| 3 to 4 Year Olds | 0 (0.0%) | 0 (0.0%) |
| 5 to 9 Year Old | 18 (100.0%) | 0 (0.0%) |
| 10 to 14 Year Olds | 46 (100.0%) | 0 (0.0%) |
| 15 to 17 Year Olds | 60 (100.0%) | 0 (0.0%) |
| 18 to 19 Year Olds | 31 (100.0%) | 0 (0.0%) |
| 20 to 24 Year Olds | 0 (0.0%) | 54 (100.0%) |
| 25 to 34 Year Olds | 5 (55.6%) | 4 (44.4%) |
| 35 Years and over | 0 (0.0%) | 0 (0.0%) |
| Total | 160 (73.4%) | 58 (26.6%) |
Educational Attainment by Field of Study in Point Lookout
Liberal arts & history (158 | 30.0%), science & technology (75 | 14.2%), education (69 | 13.1%), business (62 | 11.8%), and literature & languages (50 | 9.5%) are the most common fields of study among 527 individuals in Point Lookout who have obtained a bachelor's degree or higher.
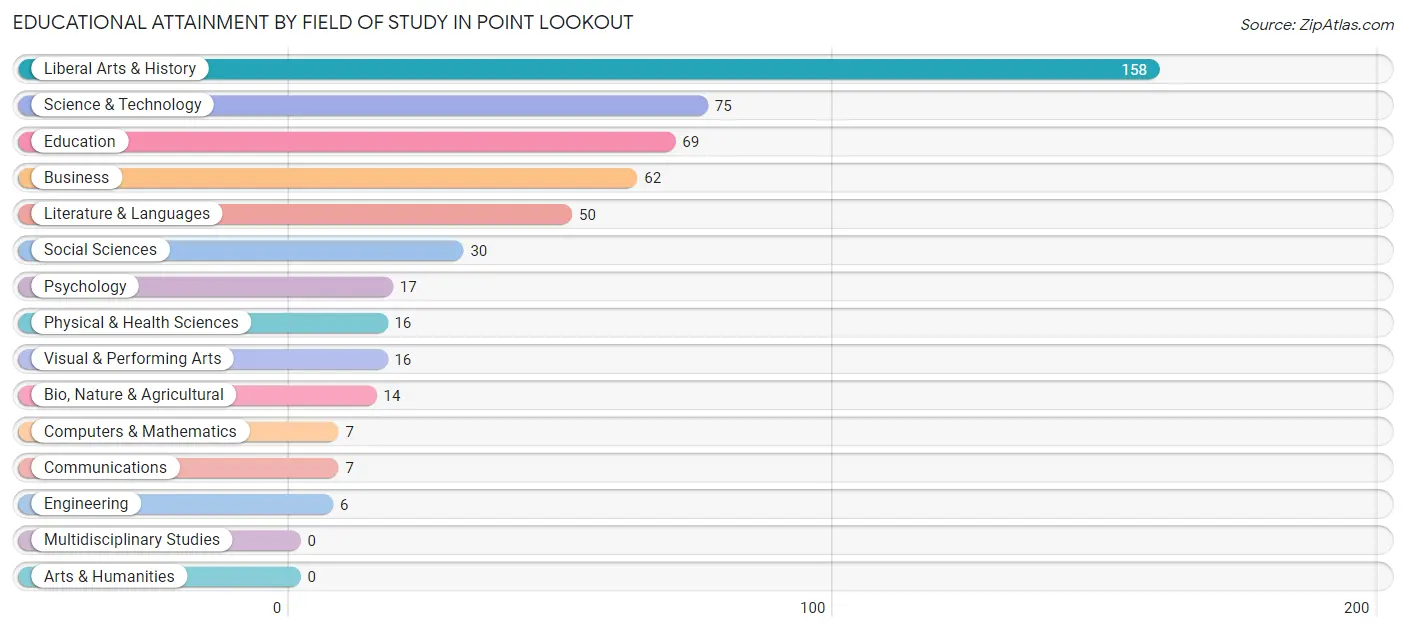
| Field of Study | # Graduates | % Graduates |
| Computers & Mathematics | 7 | 1.3% |
| Bio, Nature & Agricultural | 14 | 2.7% |
| Physical & Health Sciences | 16 | 3.0% |
| Psychology | 17 | 3.2% |
| Social Sciences | 30 | 5.7% |
| Engineering | 6 | 1.1% |
| Multidisciplinary Studies | 0 | 0.0% |
| Science & Technology | 75 | 14.2% |
| Business | 62 | 11.8% |
| Education | 69 | 13.1% |
| Literature & Languages | 50 | 9.5% |
| Liberal Arts & History | 158 | 30.0% |
| Visual & Performing Arts | 16 | 3.0% |
| Communications | 7 | 1.3% |
| Arts & Humanities | 0 | 0.0% |
| Total | 527 | 100.0% |
Transportation & Commute in Point Lookout
Vehicle Availability by Sex in Point Lookout
The most prevalent vehicle ownership categories in Point Lookout are males with 3 vehicles (152, accounting for 46.1%) and females with 3 vehicles (72, making up 74.5%).
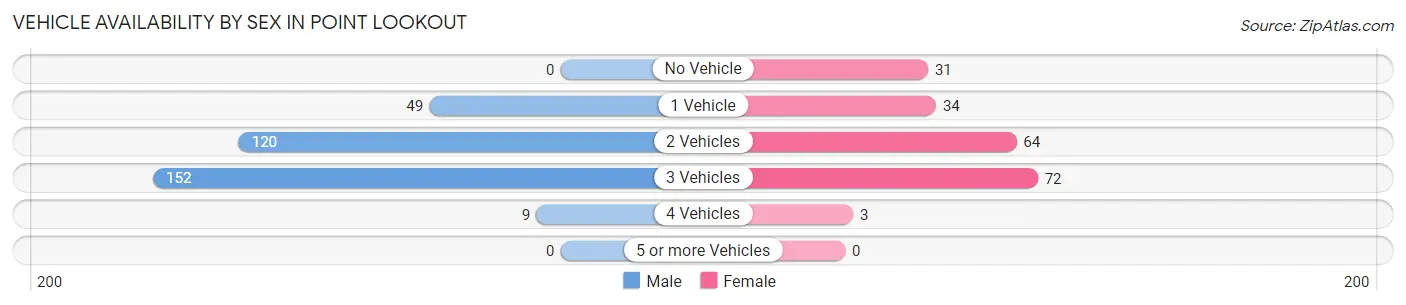
| Vehicles Available | Male | Female |
| No Vehicle | 0 (0.0%) | 31 (15.2%) |
| 1 Vehicle | 49 (14.8%) | 34 (16.7%) |
| 2 Vehicles | 120 (36.4%) | 64 (31.4%) |
| 3 Vehicles | 152 (46.1%) | 72 (35.3%) |
| 4 Vehicles | 9 (2.7%) | 3 (1.5%) |
| 5 or more Vehicles | 0 (0.0%) | 0 (0.0%) |
| Total | 330 (100.0%) | 204 (100.0%) |
Commute Time in Point Lookout
The most frequently occuring commute durations in Point Lookout are 60 to 89 minutes (124 commuters, 26.8%), 10 to 14 minutes (91 commuters, 19.7%), and 20 to 24 minutes (69 commuters, 14.9%).
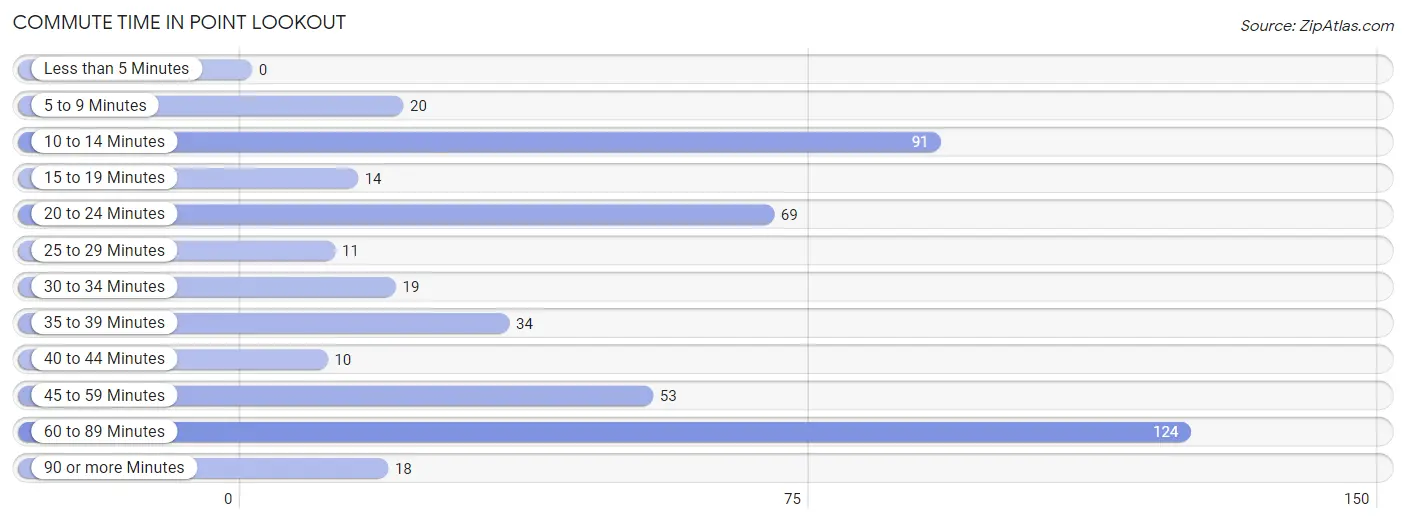
| Commute Time | # Commuters | % Commuters |
| Less than 5 Minutes | 0 | 0.0% |
| 5 to 9 Minutes | 20 | 4.3% |
| 10 to 14 Minutes | 91 | 19.7% |
| 15 to 19 Minutes | 14 | 3.0% |
| 20 to 24 Minutes | 69 | 14.9% |
| 25 to 29 Minutes | 11 | 2.4% |
| 30 to 34 Minutes | 19 | 4.1% |
| 35 to 39 Minutes | 34 | 7.3% |
| 40 to 44 Minutes | 10 | 2.2% |
| 45 to 59 Minutes | 53 | 11.5% |
| 60 to 89 Minutes | 124 | 26.8% |
| 90 or more Minutes | 18 | 3.9% |
Commute Time by Sex in Point Lookout
The most common commute times in Point Lookout are 60 to 89 minutes (77 commuters, 25.6%) for males and 60 to 89 minutes (47 commuters, 29.0%) for females.
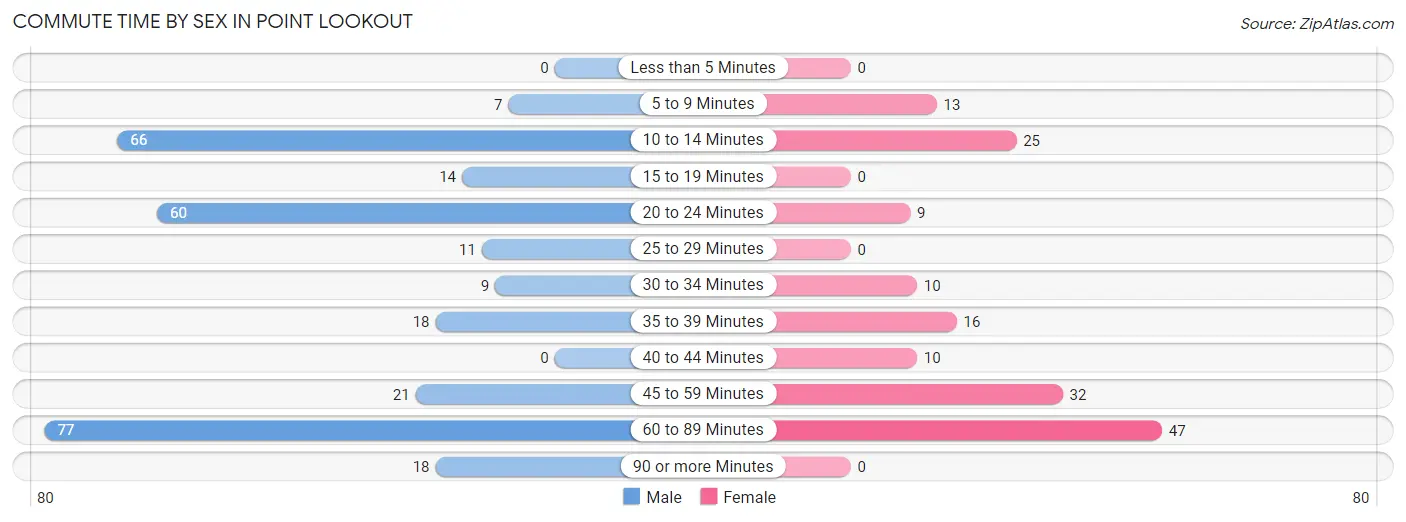
| Commute Time | Male | Female |
| Less than 5 Minutes | 0 (0.0%) | 0 (0.0%) |
| 5 to 9 Minutes | 7 (2.3%) | 13 (8.0%) |
| 10 to 14 Minutes | 66 (21.9%) | 25 (15.4%) |
| 15 to 19 Minutes | 14 (4.6%) | 0 (0.0%) |
| 20 to 24 Minutes | 60 (19.9%) | 9 (5.6%) |
| 25 to 29 Minutes | 11 (3.6%) | 0 (0.0%) |
| 30 to 34 Minutes | 9 (3.0%) | 10 (6.2%) |
| 35 to 39 Minutes | 18 (6.0%) | 16 (9.9%) |
| 40 to 44 Minutes | 0 (0.0%) | 10 (6.2%) |
| 45 to 59 Minutes | 21 (7.0%) | 32 (19.8%) |
| 60 to 89 Minutes | 77 (25.6%) | 47 (29.0%) |
| 90 or more Minutes | 18 (6.0%) | 0 (0.0%) |
Time of Departure to Work by Sex in Point Lookout
The most frequent times of departure to work in Point Lookout are 7:00 AM to 7:29 AM (65, 21.6%) for males and 12:00 AM to 4:59 AM (40, 24.7%) for females.
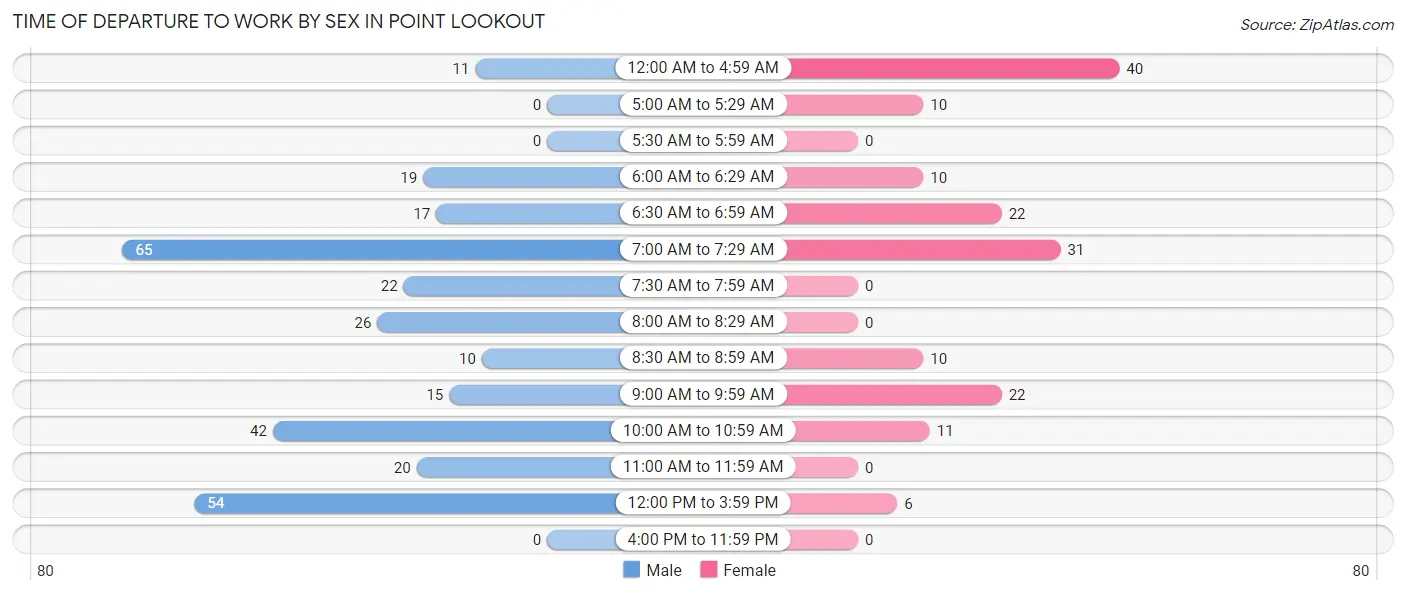
| Time of Departure | Male | Female |
| 12:00 AM to 4:59 AM | 11 (3.6%) | 40 (24.7%) |
| 5:00 AM to 5:29 AM | 0 (0.0%) | 10 (6.2%) |
| 5:30 AM to 5:59 AM | 0 (0.0%) | 0 (0.0%) |
| 6:00 AM to 6:29 AM | 19 (6.3%) | 10 (6.2%) |
| 6:30 AM to 6:59 AM | 17 (5.7%) | 22 (13.6%) |
| 7:00 AM to 7:29 AM | 65 (21.6%) | 31 (19.1%) |
| 7:30 AM to 7:59 AM | 22 (7.3%) | 0 (0.0%) |
| 8:00 AM to 8:29 AM | 26 (8.6%) | 0 (0.0%) |
| 8:30 AM to 8:59 AM | 10 (3.3%) | 10 (6.2%) |
| 9:00 AM to 9:59 AM | 15 (5.0%) | 22 (13.6%) |
| 10:00 AM to 10:59 AM | 42 (14.0%) | 11 (6.8%) |
| 11:00 AM to 11:59 AM | 20 (6.6%) | 0 (0.0%) |
| 12:00 PM to 3:59 PM | 54 (17.9%) | 6 (3.7%) |
| 4:00 PM to 11:59 PM | 0 (0.0%) | 0 (0.0%) |
| Total | 301 (100.0%) | 162 (100.0%) |
Housing Occupancy in Point Lookout
Occupancy by Ownership in Point Lookout
Of the total 556 dwellings in Point Lookout, owner-occupied units account for 455 (81.8%), while renter-occupied units make up 101 (18.2%).
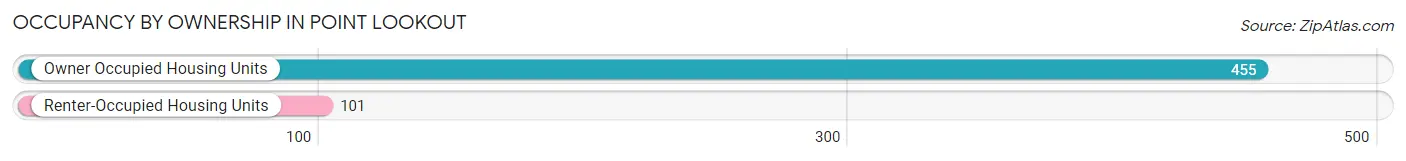
| Occupancy | # Housing Units | % Housing Units |
| Owner Occupied Housing Units | 455 | 81.8% |
| Renter-Occupied Housing Units | 101 | 18.2% |
| Total Occupied Housing Units | 556 | 100.0% |
Occupancy by Household Size in Point Lookout
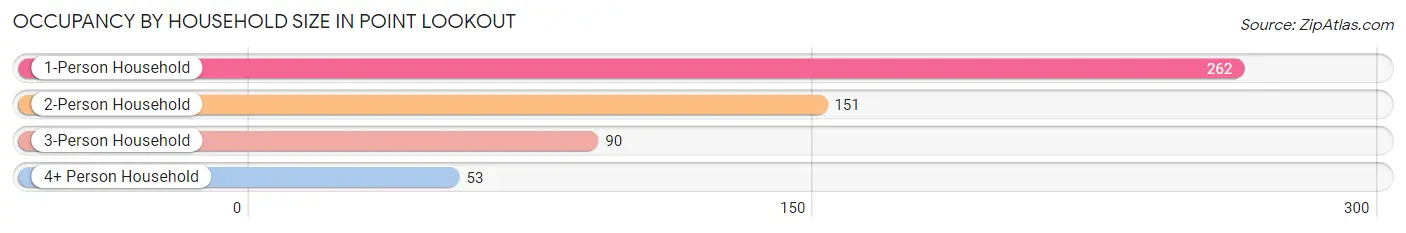
| Household Size | # Housing Units | % Housing Units |
| 1-Person Household | 262 | 47.1% |
| 2-Person Household | 151 | 27.2% |
| 3-Person Household | 90 | 16.2% |
| 4+ Person Household | 53 | 9.5% |
| Total Housing Units | 556 | 100.0% |
Occupancy by Ownership by Household Size in Point Lookout
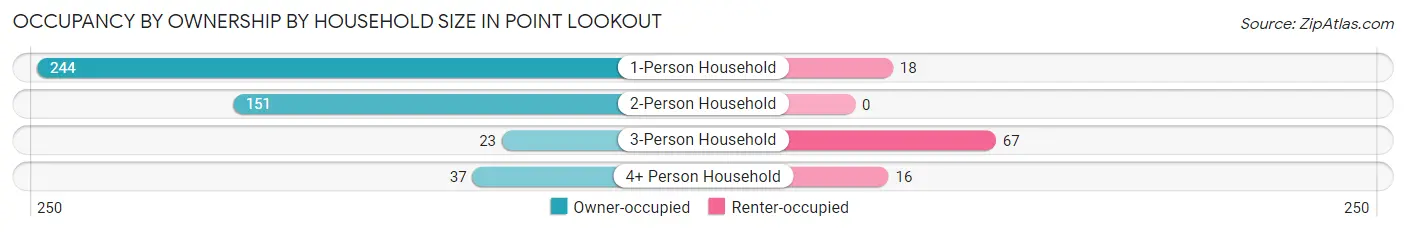
| Household Size | Owner-occupied | Renter-occupied |
| 1-Person Household | 244 (93.1%) | 18 (6.9%) |
| 2-Person Household | 151 (100.0%) | 0 (0.0%) |
| 3-Person Household | 23 (25.6%) | 67 (74.4%) |
| 4+ Person Household | 37 (69.8%) | 16 (30.2%) |
| Total Housing Units | 455 (81.8%) | 101 (18.2%) |
Occupancy by Educational Attainment in Point Lookout
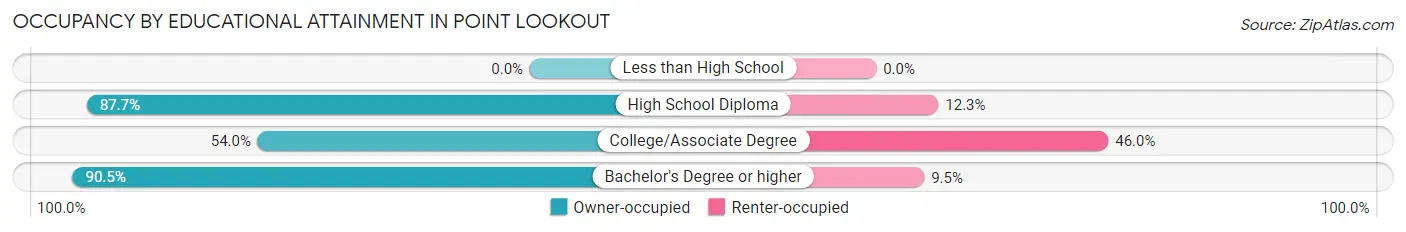
| Household Size | Owner-occupied | Renter-occupied |
| Less than High School | 0 (0.0%) | 0 (0.0%) |
| High School Diploma | 64 (87.7%) | 9 (12.3%) |
| College/Associate Degree | 68 (54.0%) | 58 (46.0%) |
| Bachelor's Degree or higher | 323 (90.5%) | 34 (9.5%) |
Occupancy by Age of Householder in Point Lookout
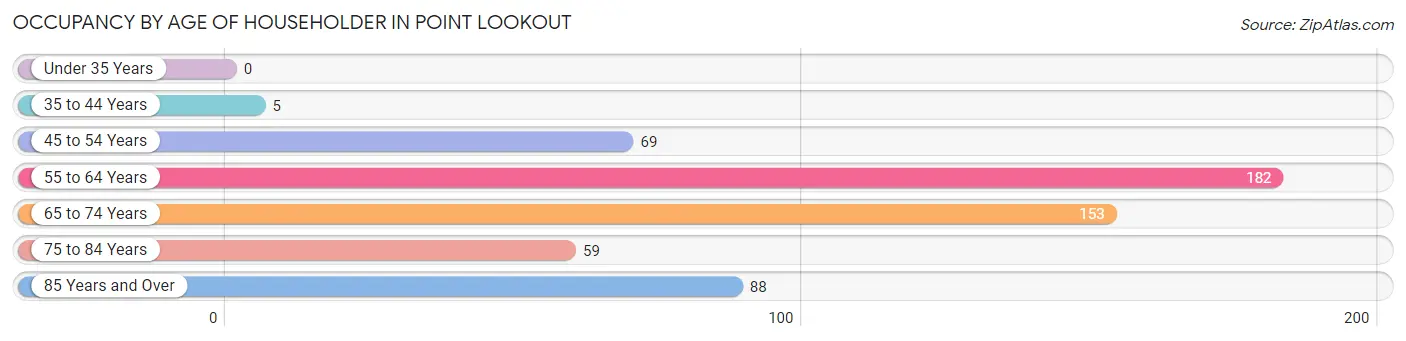
| Age Bracket | # Households | % Households |
| Under 35 Years | 0 | 0.0% |
| 35 to 44 Years | 5 | 0.9% |
| 45 to 54 Years | 69 | 12.4% |
| 55 to 64 Years | 182 | 32.7% |
| 65 to 74 Years | 153 | 27.5% |
| 75 to 84 Years | 59 | 10.6% |
| 85 Years and Over | 88 | 15.8% |
| Total | 556 | 100.0% |
Housing Finances in Point Lookout
Median Income by Occupancy in Point Lookout
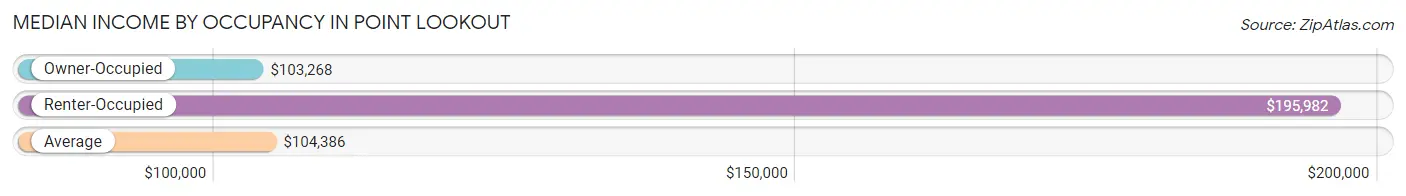
| Occupancy Type | # Households | Median Income |
| Owner-Occupied | 455 (81.8%) | $103,268 |
| Renter-Occupied | 101 (18.2%) | $195,982 |
| Average | 556 (100.0%) | $104,386 |
Occupancy by Householder Income Bracket in Point Lookout
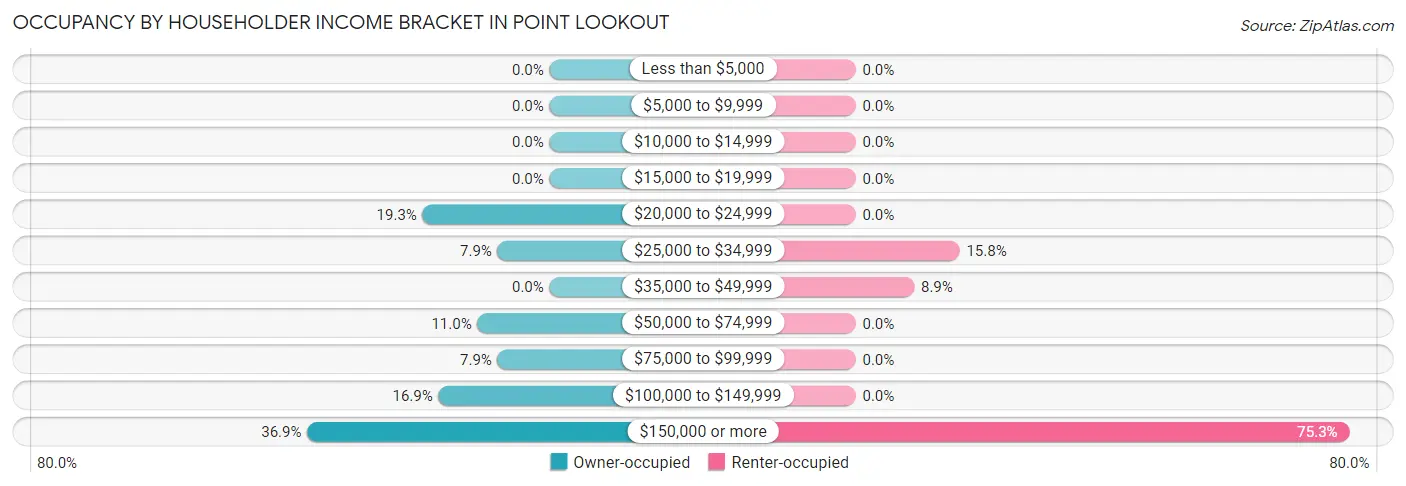
| Income Bracket | Owner-occupied | Renter-occupied |
| Less than $5,000 | 0 (0.0%) | 0 (0.0%) |
| $5,000 to $9,999 | 0 (0.0%) | 0 (0.0%) |
| $10,000 to $14,999 | 0 (0.0%) | 0 (0.0%) |
| $15,000 to $19,999 | 0 (0.0%) | 0 (0.0%) |
| $20,000 to $24,999 | 88 (19.3%) | 0 (0.0%) |
| $25,000 to $34,999 | 36 (7.9%) | 16 (15.8%) |
| $35,000 to $49,999 | 0 (0.0%) | 9 (8.9%) |
| $50,000 to $74,999 | 50 (11.0%) | 0 (0.0%) |
| $75,000 to $99,999 | 36 (7.9%) | 0 (0.0%) |
| $100,000 to $149,999 | 77 (16.9%) | 0 (0.0%) |
| $150,000 or more | 168 (36.9%) | 76 (75.2%) |
| Total | 455 (100.0%) | 101 (100.0%) |
Monthly Housing Cost Tiers in Point Lookout
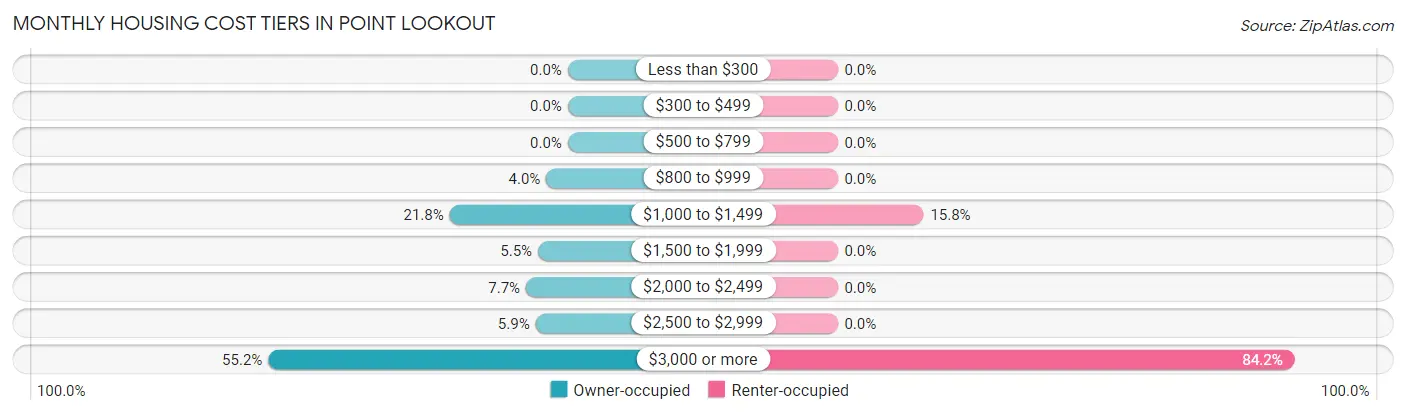
| Monthly Cost | Owner-occupied | Renter-occupied |
| Less than $300 | 0 (0.0%) | 0 (0.0%) |
| $300 to $499 | 0 (0.0%) | 0 (0.0%) |
| $500 to $799 | 0 (0.0%) | 0 (0.0%) |
| $800 to $999 | 18 (4.0%) | 0 (0.0%) |
| $1,000 to $1,499 | 99 (21.8%) | 16 (15.8%) |
| $1,500 to $1,999 | 25 (5.5%) | 0 (0.0%) |
| $2,000 to $2,499 | 35 (7.7%) | 0 (0.0%) |
| $2,500 to $2,999 | 27 (5.9%) | 0 (0.0%) |
| $3,000 or more | 251 (55.2%) | 85 (84.2%) |
| Total | 455 (100.0%) | 101 (100.0%) |
Physical Housing Characteristics in Point Lookout
Housing Structures in Point Lookout
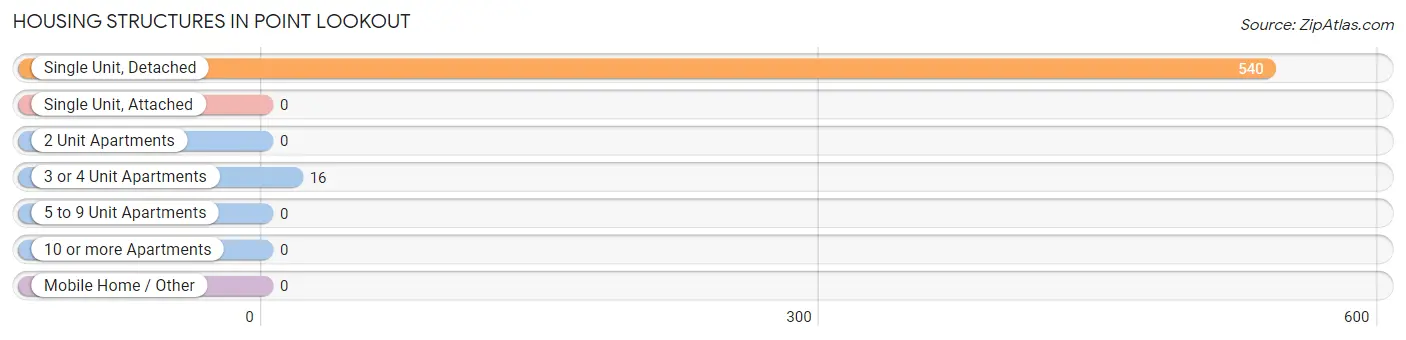
| Structure Type | # Housing Units | % Housing Units |
| Single Unit, Detached | 540 | 97.1% |
| Single Unit, Attached | 0 | 0.0% |
| 2 Unit Apartments | 0 | 0.0% |
| 3 or 4 Unit Apartments | 16 | 2.9% |
| 5 to 9 Unit Apartments | 0 | 0.0% |
| 10 or more Apartments | 0 | 0.0% |
| Mobile Home / Other | 0 | 0.0% |
| Total | 556 | 100.0% |
Housing Structures by Occupancy in Point Lookout
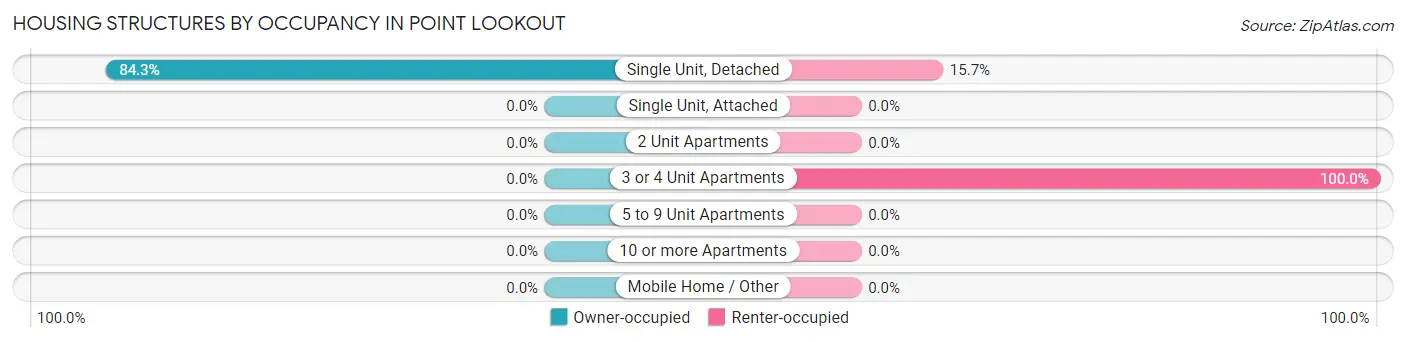
| Structure Type | Owner-occupied | Renter-occupied |
| Single Unit, Detached | 455 (84.3%) | 85 (15.7%) |
| Single Unit, Attached | 0 (0.0%) | 0 (0.0%) |
| 2 Unit Apartments | 0 (0.0%) | 0 (0.0%) |
| 3 or 4 Unit Apartments | 0 (0.0%) | 16 (100.0%) |
| 5 to 9 Unit Apartments | 0 (0.0%) | 0 (0.0%) |
| 10 or more Apartments | 0 (0.0%) | 0 (0.0%) |
| Mobile Home / Other | 0 (0.0%) | 0 (0.0%) |
| Total | 455 (81.8%) | 101 (18.2%) |
Housing Structures by Number of Rooms in Point Lookout
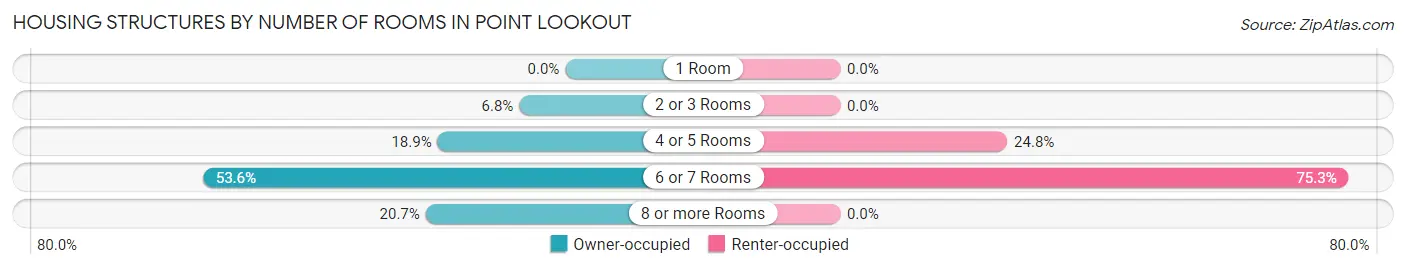
| Number of Rooms | Owner-occupied | Renter-occupied |
| 1 Room | 0 (0.0%) | 0 (0.0%) |
| 2 or 3 Rooms | 31 (6.8%) | 0 (0.0%) |
| 4 or 5 Rooms | 86 (18.9%) | 25 (24.7%) |
| 6 or 7 Rooms | 244 (53.6%) | 76 (75.2%) |
| 8 or more Rooms | 94 (20.7%) | 0 (0.0%) |
| Total | 455 (100.0%) | 101 (100.0%) |
Housing Structure by Heating Type in Point Lookout
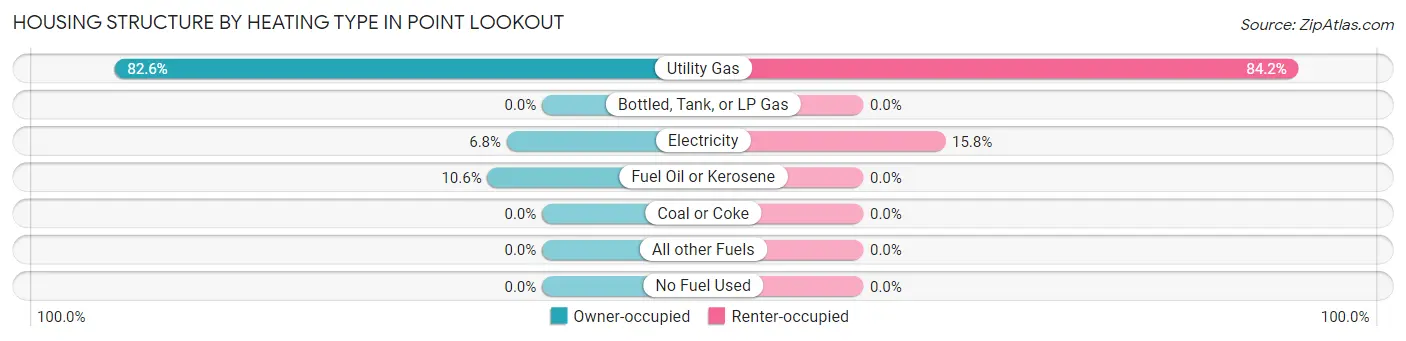
| Heating Type | Owner-occupied | Renter-occupied |
| Utility Gas | 376 (82.6%) | 85 (84.2%) |
| Bottled, Tank, or LP Gas | 0 (0.0%) | 0 (0.0%) |
| Electricity | 31 (6.8%) | 16 (15.8%) |
| Fuel Oil or Kerosene | 48 (10.5%) | 0 (0.0%) |
| Coal or Coke | 0 (0.0%) | 0 (0.0%) |
| All other Fuels | 0 (0.0%) | 0 (0.0%) |
| No Fuel Used | 0 (0.0%) | 0 (0.0%) |
| Total | 455 (100.0%) | 101 (100.0%) |
Household Vehicle Usage in Point Lookout
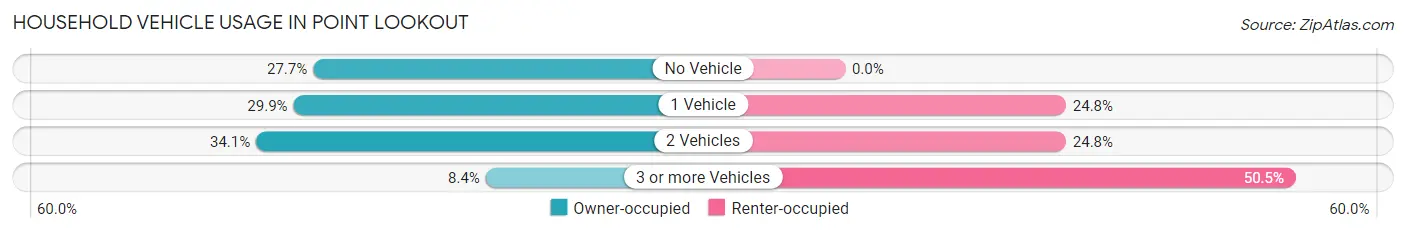
| Vehicles per Household | Owner-occupied | Renter-occupied |
| No Vehicle | 126 (27.7%) | 0 (0.0%) |
| 1 Vehicle | 136 (29.9%) | 25 (24.7%) |
| 2 Vehicles | 155 (34.1%) | 25 (24.7%) |
| 3 or more Vehicles | 38 (8.4%) | 51 (50.5%) |
| Total | 455 (100.0%) | 101 (100.0%) |
Real Estate & Mortgages in Point Lookout
Real Estate and Mortgage Overview in Point Lookout
| Characteristic | Without Mortgage | With Mortgage |
| Housing Units | 142 | 313 |
| Median Property Value | $877,800 | $875,800 |
| Median Household Income | $87,273 | $138 |
| Monthly Housing Costs | $1,369 | $243 |
| Real Estate Taxes | $10,001 | $0 |
Property Value by Mortgage Status in Point Lookout
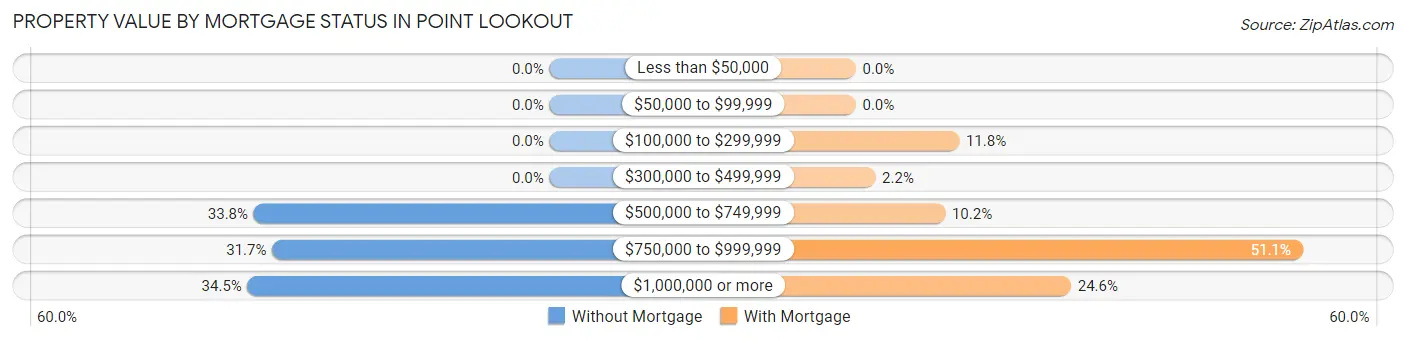
| Property Value | Without Mortgage | With Mortgage |
| Less than $50,000 | 0 (0.0%) | 0 (0.0%) |
| $50,000 to $99,999 | 0 (0.0%) | 0 (0.0%) |
| $100,000 to $299,999 | 0 (0.0%) | 37 (11.8%) |
| $300,000 to $499,999 | 0 (0.0%) | 7 (2.2%) |
| $500,000 to $749,999 | 48 (33.8%) | 32 (10.2%) |
| $750,000 to $999,999 | 45 (31.7%) | 160 (51.1%) |
| $1,000,000 or more | 49 (34.5%) | 77 (24.6%) |
| Total | 142 (100.0%) | 313 (100.0%) |
Household Income by Mortgage Status in Point Lookout
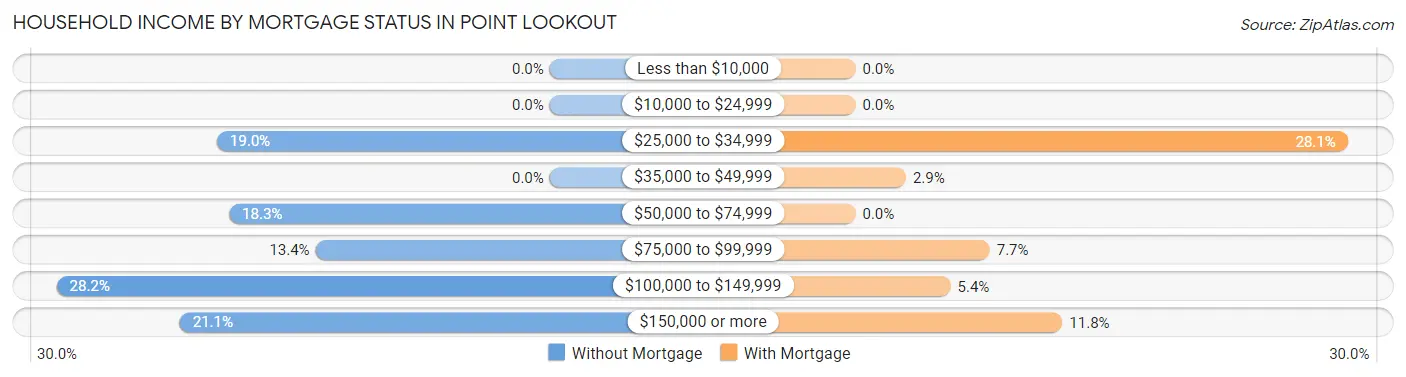
| Household Income | Without Mortgage | With Mortgage |
| Less than $10,000 | 0 (0.0%) | 0 (0.0%) |
| $10,000 to $24,999 | 0 (0.0%) | 0 (0.0%) |
| $25,000 to $34,999 | 27 (19.0%) | 88 (28.1%) |
| $35,000 to $49,999 | 0 (0.0%) | 9 (2.9%) |
| $50,000 to $74,999 | 26 (18.3%) | 0 (0.0%) |
| $75,000 to $99,999 | 19 (13.4%) | 24 (7.7%) |
| $100,000 to $149,999 | 40 (28.2%) | 17 (5.4%) |
| $150,000 or more | 30 (21.1%) | 37 (11.8%) |
| Total | 142 (100.0%) | 313 (100.0%) |
Property Value to Household Income Ratio in Point Lookout
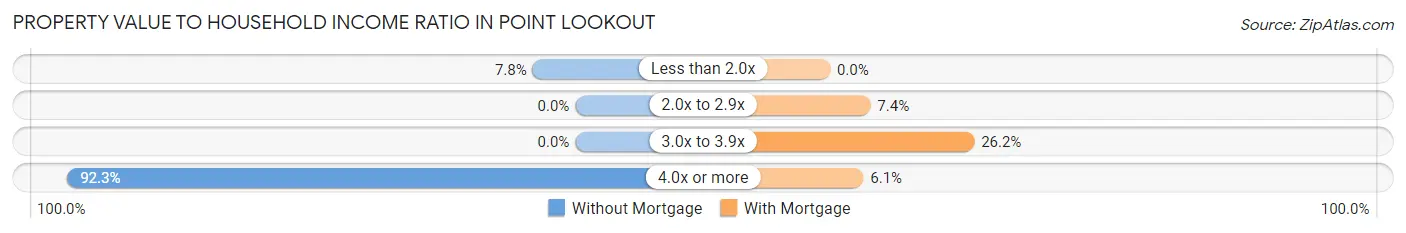
| Value-to-Income Ratio | Without Mortgage | With Mortgage |
| Less than 2.0x | 11 (7.7%) | 0 (0.0%) |
| 2.0x to 2.9x | 0 (0.0%) | 23 (7.3%) |
| 3.0x to 3.9x | 0 (0.0%) | 82 (26.2%) |
| 4.0x or more | 131 (92.2%) | 19 (6.1%) |
| Total | 142 (100.0%) | 313 (100.0%) |
Real Estate Taxes by Mortgage Status in Point Lookout
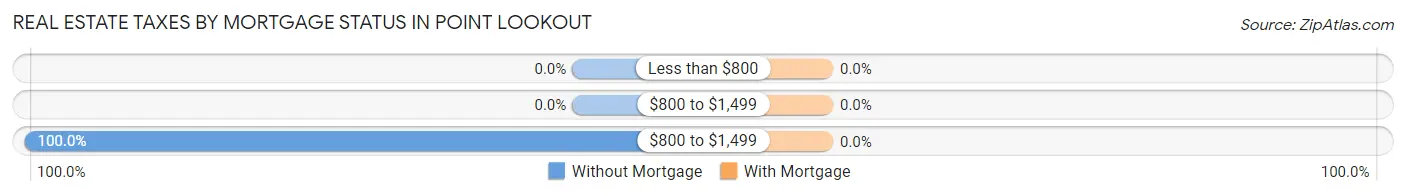
| Property Taxes | Without Mortgage | With Mortgage |
| Less than $800 | 0 (0.0%) | 0 (0.0%) |
| $800 to $1,499 | 0 (0.0%) | 0 (0.0%) |
| $800 to $1,499 | 142 (100.0%) | 0 (0.0%) |
| Total | 142 (100.0%) | 313 (100.0%) |
Health & Disability in Point Lookout
Health Insurance Coverage by Age in Point Lookout
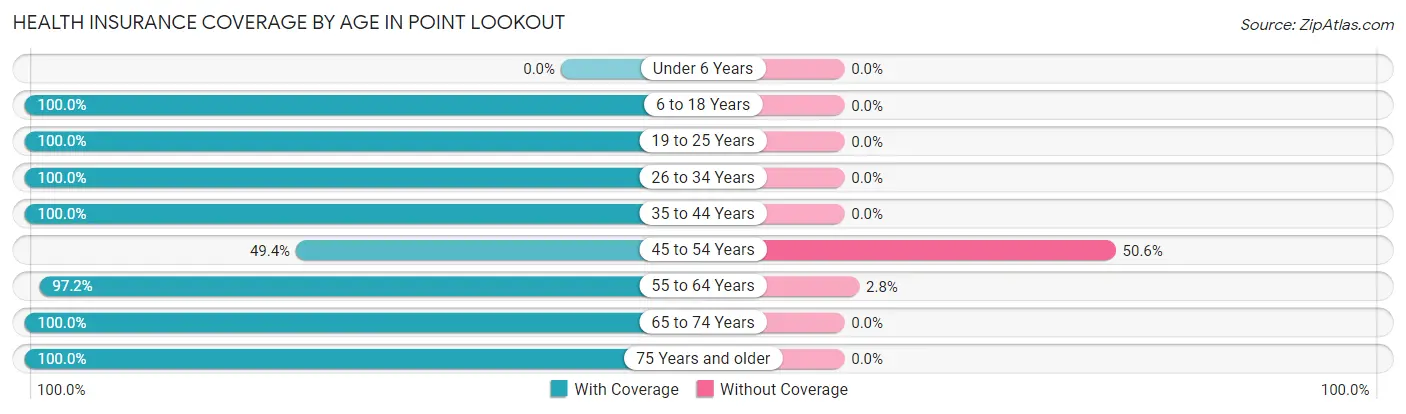
| Age Bracket | With Coverage | Without Coverage |
| Under 6 Years | 0 (0.0%) | 0 (0.0%) |
| 6 to 18 Years | 140 (100.0%) | 0 (0.0%) |
| 19 to 25 Years | 114 (100.0%) | 0 (0.0%) |
| 26 to 34 Years | 63 (100.0%) | 0 (0.0%) |
| 35 to 44 Years | 10 (100.0%) | 0 (0.0%) |
| 45 to 54 Years | 41 (49.4%) | 42 (50.6%) |
| 55 to 64 Years | 282 (97.2%) | 8 (2.8%) |
| 65 to 74 Years | 243 (100.0%) | 0 (0.0%) |
| 75 Years and older | 167 (100.0%) | 0 (0.0%) |
| Total | 1,060 (95.5%) | 50 (4.5%) |
Health Insurance Coverage by Citizenship Status in Point Lookout
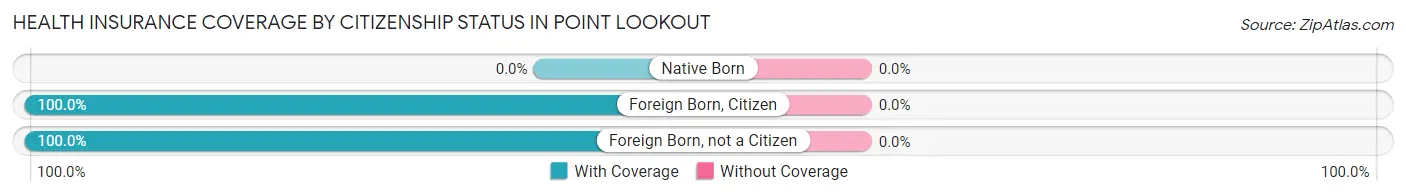
| Citizenship Status | With Coverage | Without Coverage |
| Native Born | 0 (0.0%) | 0 (0.0%) |
| Foreign Born, Citizen | 140 (100.0%) | 0 (0.0%) |
| Foreign Born, not a Citizen | 114 (100.0%) | 0 (0.0%) |
Health Insurance Coverage by Household Income in Point Lookout
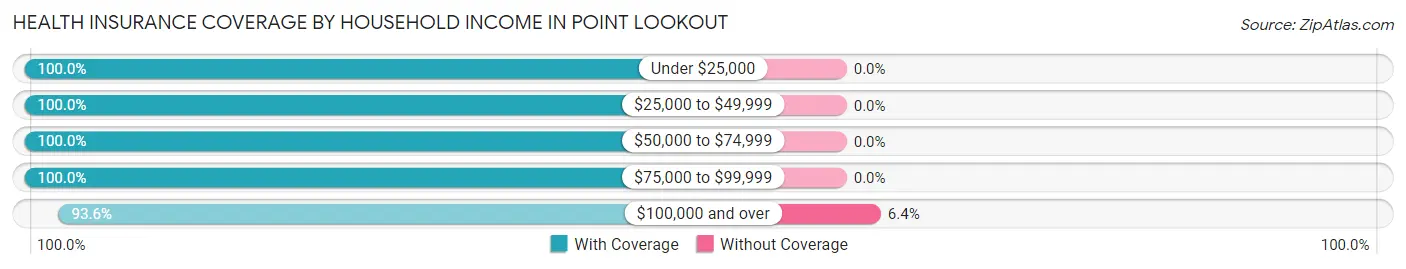
| Household Income | With Coverage | Without Coverage |
| Under $25,000 | 88 (100.0%) | 0 (0.0%) |
| $25,000 to $49,999 | 106 (100.0%) | 0 (0.0%) |
| $50,000 to $74,999 | 73 (100.0%) | 0 (0.0%) |
| $75,000 to $99,999 | 61 (100.0%) | 0 (0.0%) |
| $100,000 and over | 732 (93.6%) | 50 (6.4%) |
Public vs Private Health Insurance Coverage by Age in Point Lookout
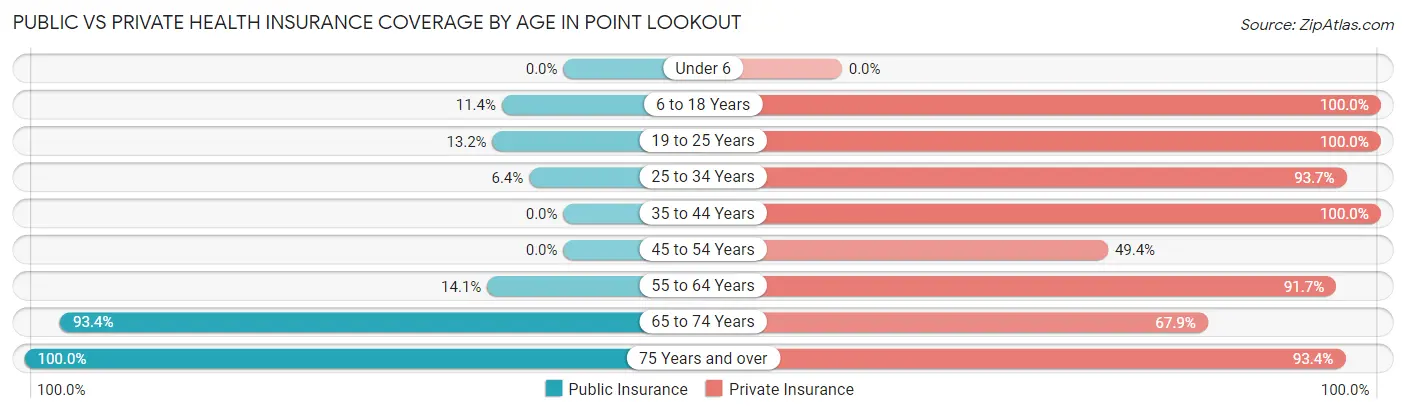
| Age Bracket | Public Insurance | Private Insurance |
| Under 6 | 0 (0.0%) | 0 (0.0%) |
| 6 to 18 Years | 16 (11.4%) | 140 (100.0%) |
| 19 to 25 Years | 15 (13.2%) | 114 (100.0%) |
| 25 to 34 Years | 4 (6.4%) | 59 (93.6%) |
| 35 to 44 Years | 0 (0.0%) | 10 (100.0%) |
| 45 to 54 Years | 0 (0.0%) | 41 (49.4%) |
| 55 to 64 Years | 41 (14.1%) | 266 (91.7%) |
| 65 to 74 Years | 227 (93.4%) | 165 (67.9%) |
| 75 Years and over | 167 (100.0%) | 156 (93.4%) |
| Total | 470 (42.3%) | 951 (85.7%) |
Disability Status by Sex by Age in Point Lookout
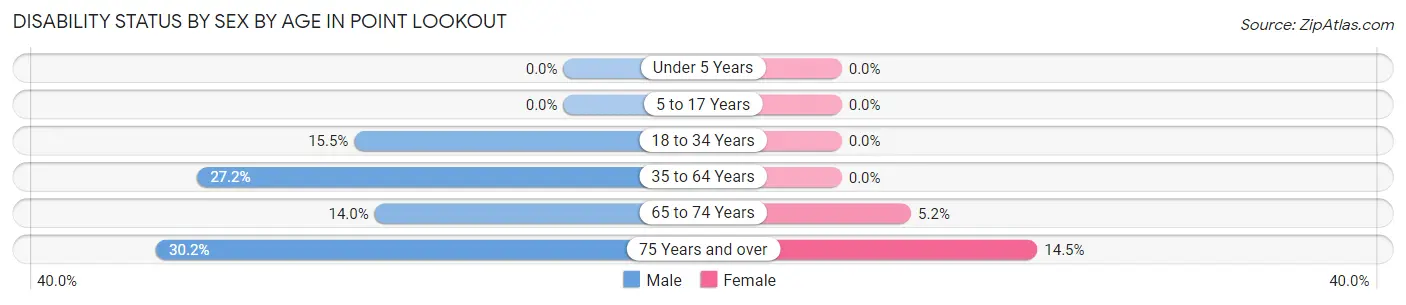
| Age Bracket | Male | Female |
| Under 5 Years | 0 (0.0%) | 0 (0.0%) |
| 5 to 17 Years | 0 (0.0%) | 0 (0.0%) |
| 18 to 34 Years | 16 (15.5%) | 0 (0.0%) |
| 35 to 64 Years | 56 (27.2%) | 0 (0.0%) |
| 65 to 74 Years | 15 (14.0%) | 7 (5.1%) |
| 75 Years and over | 13 (30.2%) | 18 (14.5%) |
Disability Class by Sex by Age in Point Lookout
Disability Class: Hearing Difficulty
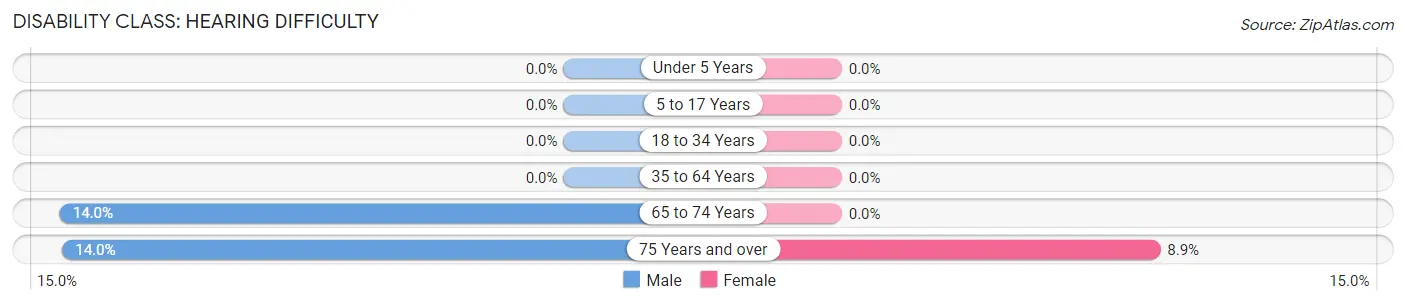
| Age Bracket | Male | Female |
| Under 5 Years | 0 (0.0%) | 0 (0.0%) |
| 5 to 17 Years | 0 (0.0%) | 0 (0.0%) |
| 18 to 34 Years | 0 (0.0%) | 0 (0.0%) |
| 35 to 64 Years | 0 (0.0%) | 0 (0.0%) |
| 65 to 74 Years | 15 (14.0%) | 0 (0.0%) |
| 75 Years and over | 6 (14.0%) | 11 (8.9%) |
Disability Class: Vision Difficulty
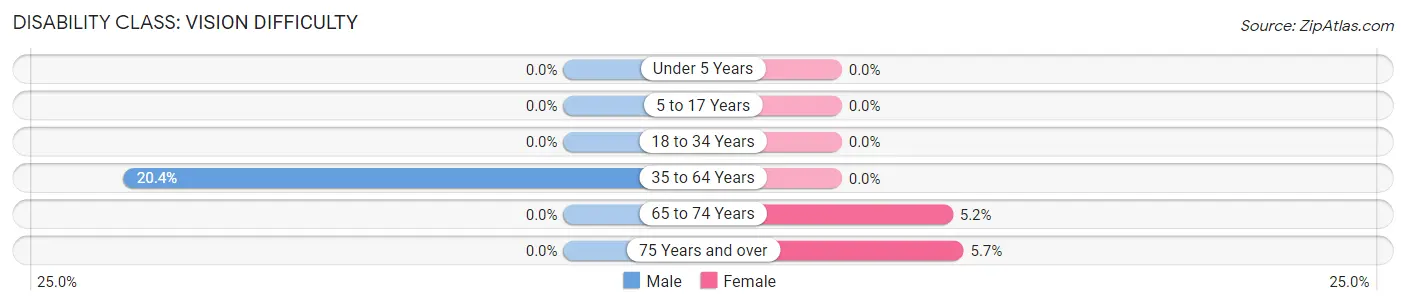
| Age Bracket | Male | Female |
| Under 5 Years | 0 (0.0%) | 0 (0.0%) |
| 5 to 17 Years | 0 (0.0%) | 0 (0.0%) |
| 18 to 34 Years | 0 (0.0%) | 0 (0.0%) |
| 35 to 64 Years | 42 (20.4%) | 0 (0.0%) |
| 65 to 74 Years | 0 (0.0%) | 7 (5.1%) |
| 75 Years and over | 0 (0.0%) | 7 (5.7%) |
Disability Class: Cognitive Difficulty
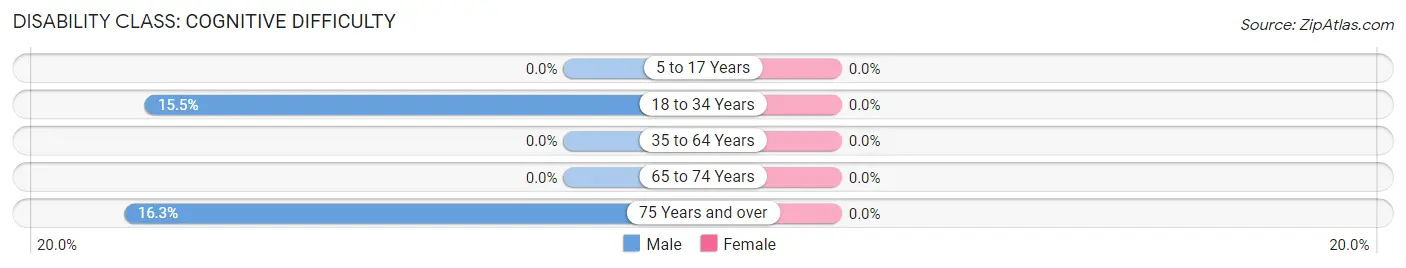
| Age Bracket | Male | Female |
| 5 to 17 Years | 0 (0.0%) | 0 (0.0%) |
| 18 to 34 Years | 16 (15.5%) | 0 (0.0%) |
| 35 to 64 Years | 0 (0.0%) | 0 (0.0%) |
| 65 to 74 Years | 0 (0.0%) | 0 (0.0%) |
| 75 Years and over | 7 (16.3%) | 0 (0.0%) |
Disability Class: Ambulatory Difficulty
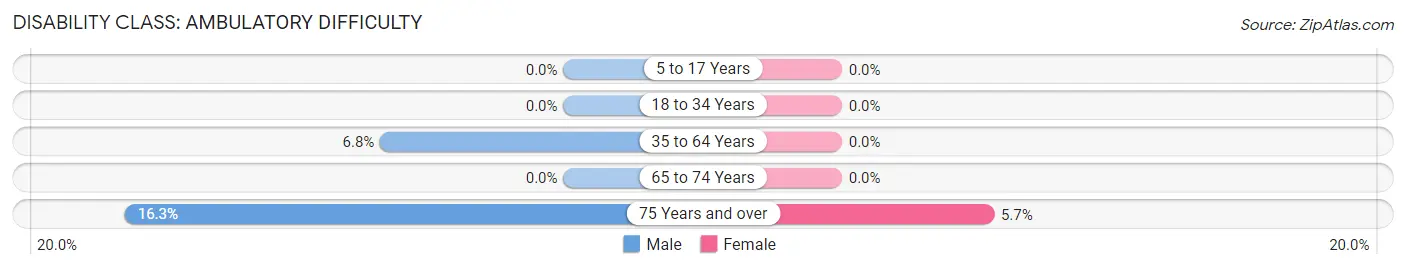
| Age Bracket | Male | Female |
| 5 to 17 Years | 0 (0.0%) | 0 (0.0%) |
| 18 to 34 Years | 0 (0.0%) | 0 (0.0%) |
| 35 to 64 Years | 14 (6.8%) | 0 (0.0%) |
| 65 to 74 Years | 0 (0.0%) | 0 (0.0%) |
| 75 Years and over | 7 (16.3%) | 7 (5.7%) |
Disability Class: Self-Care Difficulty
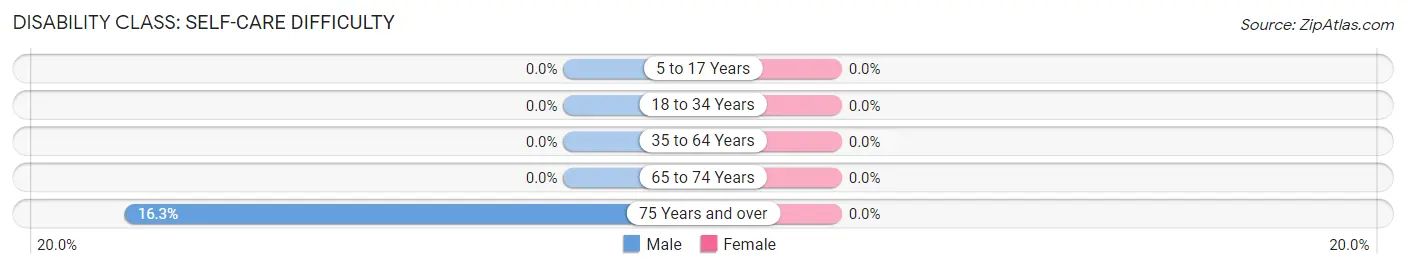
| Age Bracket | Male | Female |
| 5 to 17 Years | 0 (0.0%) | 0 (0.0%) |
| 18 to 34 Years | 0 (0.0%) | 0 (0.0%) |
| 35 to 64 Years | 0 (0.0%) | 0 (0.0%) |
| 65 to 74 Years | 0 (0.0%) | 0 (0.0%) |
| 75 Years and over | 7 (16.3%) | 0 (0.0%) |
Technology Access in Point Lookout
Computing Device Access in Point Lookout
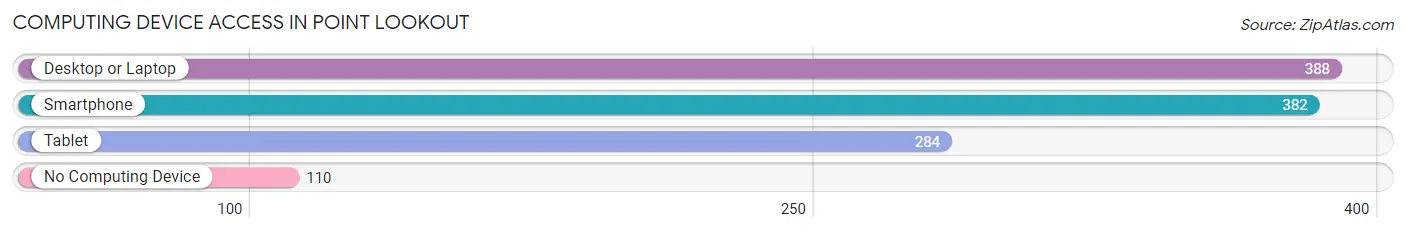
| Device Type | # Households | % Households |
| Desktop or Laptop | 388 | 69.8% |
| Smartphone | 382 | 68.7% |
| Tablet | 284 | 51.1% |
| No Computing Device | 110 | 19.8% |
| Total | 556 | 100.0% |
Internet Access in Point Lookout
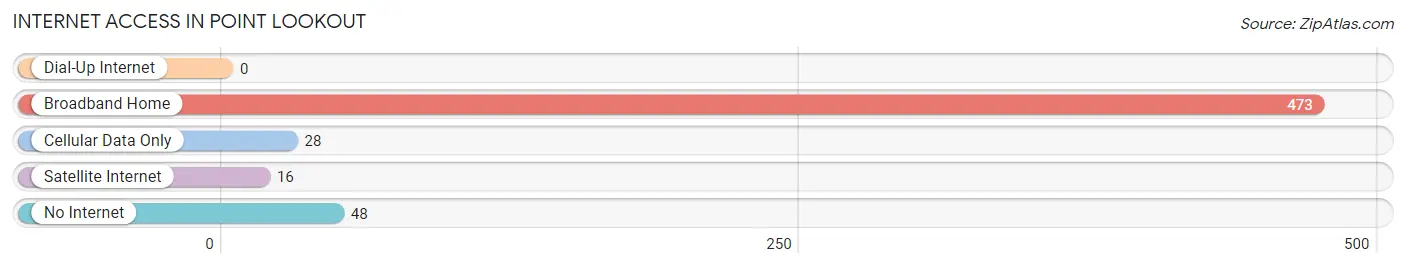
| Internet Type | # Households | % Households |
| Dial-Up Internet | 0 | 0.0% |
| Broadband Home | 473 | 85.1% |
| Cellular Data Only | 28 | 5.0% |
| Satellite Internet | 16 | 2.9% |
| No Internet | 48 | 8.6% |
| Total | 556 | 100.0% |
Point Lookout Summary
Point Lookout is a hamlet located in the Town of Hempstead in Nassau County, New York. It is situated on the south shore of Long Island, approximately 25 miles east of Manhattan. The hamlet is bordered by the Atlantic Ocean to the south, Jones Inlet to the east, Reynolds Channel to the west, and Lido Beach to the north.
History
The area that is now Point Lookout was originally inhabited by the Rockaway Indians, a sub-tribe of the Lenape people. The first European settlers arrived in the area in the late 1600s, and the hamlet was officially established in 1873. The name “Point Lookout” was derived from the fact that the area was a popular lookout point for ships entering and leaving New York Harbor.
In the late 1800s, Point Lookout became a popular summer resort destination for wealthy New Yorkers. The area was home to several large hotels, including the Point Lookout Hotel, which was built in 1891 and was the largest hotel on Long Island at the time. The hotel was destroyed by a fire in 1911, but the area continued to be a popular summer destination.
In the early 1900s, Point Lookout became a popular destination for the Jewish community. The area was home to several Jewish resorts, including the Point Lookout Beach Club, which was founded in 1921. The club was a popular destination for Jewish families, and it was the site of many weddings and bar mitzvahs.
During World War II, Point Lookout was the site of a U.S. Navy base. The base was used to train Navy personnel and to house German prisoners of war. After the war, the base was closed and the area returned to its original purpose as a summer resort destination.
Geography
Point Lookout is located on the south shore of Long Island, approximately 25 miles east of Manhattan. The hamlet is bordered by the Atlantic Ocean to the south, Jones Inlet to the east, Reynolds Channel to the west, and Lido Beach to the north. The area is mostly flat, with some low hills in the northern part of the hamlet.
The climate in Point Lookout is temperate, with hot summers and mild winters. The average temperature in the summer is around 75°F, and the average temperature in the winter is around 40°F. The area receives an average of 45 inches of precipitation per year.
Economy
The economy of Point Lookout is largely based on tourism. The area is home to several hotels and resorts, as well as restaurants, bars, and other businesses catering to tourists. The hamlet is also home to several marinas, which provide services to boaters.
The area is also home to several businesses that provide services to the local community, such as grocery stores, banks, and medical offices. The hamlet is also home to several small manufacturing companies.
Demographics
As of the 2010 census, the population of Point Lookout was 4,867. The population is predominantly white (90.3%), with small percentages of African Americans (3.2%), Asians (2.2%), and other races (4.3%). The median household income in the hamlet is $90,945, and the median home value is $637,400.
The majority of the population (77.3%) is over the age of 18, and the median age is 44. The population is evenly split between males and females. The hamlet is home to several religious institutions, including churches, synagogues, and mosques.
Conclusion
Point Lookout is a hamlet located in the Town of Hempstead in Nassau County, New York. It is situated on the south shore of Long Island, approximately 25 miles east of Manhattan. The hamlet is bordered by the Atlantic Ocean to the south, Jones Inlet to the east, Reynolds Channel to the west, and Lido Beach to the north. The area was originally inhabited by the Rockaway Indians, and was later established as a summer resort destination for wealthy New Yorkers. The economy of Point Lookout is largely based on tourism, and the population is predominantly white. The hamlet is home to several religious institutions, and is a popular destination for boaters and tourists alike.
Common Questions
What is the Total Population of Point Lookout?
Total Population of Point Lookout is 1,110.
What is the Total Male Population of Point Lookout?
Total Male Population of Point Lookout is 556.
What is the Total Female Population of Point Lookout?
Total Female Population of Point Lookout is 554.
What is the Ratio of Males per 100 Females in Point Lookout?
There are 100.36 Males per 100 Females in Point Lookout.
What is the Ratio of Females per 100 Males in Point Lookout?
There are 99.64 Females per 100 Males in Point Lookout.
What is the Median Population Age in Point Lookout?
Median Population Age in Point Lookout is 58.4 Years.
What is the Average Family Size in Point Lookout
Average Family Size in Point Lookout is 2.6 People.
What is the Average Household Size in Point Lookout
Average Household Size in Point Lookout is 2.0 People.
What is Per Capita Income in Point Lookout?
Per Capita income in Point Lookout is $85,551.
What is the Median Family Income in Point Lookout?
Median Family Income in Point Lookout is $203,889.
What is the Median Household income in Point Lookout?
Median Household Income in Point Lookout is $104,386.
What is Income or Wage Gap in Point Lookout?
Income or Wage Gap in Point Lookout is 67.3%.
Women in Point Lookout earn 32.7 cents for every dollar earned by a man.
What is Inequality or Gini Index in Point Lookout?
Inequality or Gini Index in Point Lookout is 0.51.
How Large is the Labor Force in Point Lookout?
There are 554 People in the Labor Forcein in Point Lookout.
What is the Percentage of People in the Labor Force in Point Lookout?
53.4% of People are in the Labor Force in Point Lookout.
What is the Unemployment Rate in Point Lookout?
Unemployment Rate in Point Lookout is 2.9%.