Zip Codes with the Highest Percentage of Households Residing in Detached Homes in Plattsburgh, NY
RELATED REPORTS & OPTIONS
Detached Home Residency
Plattsburgh
Compare Zip Codes
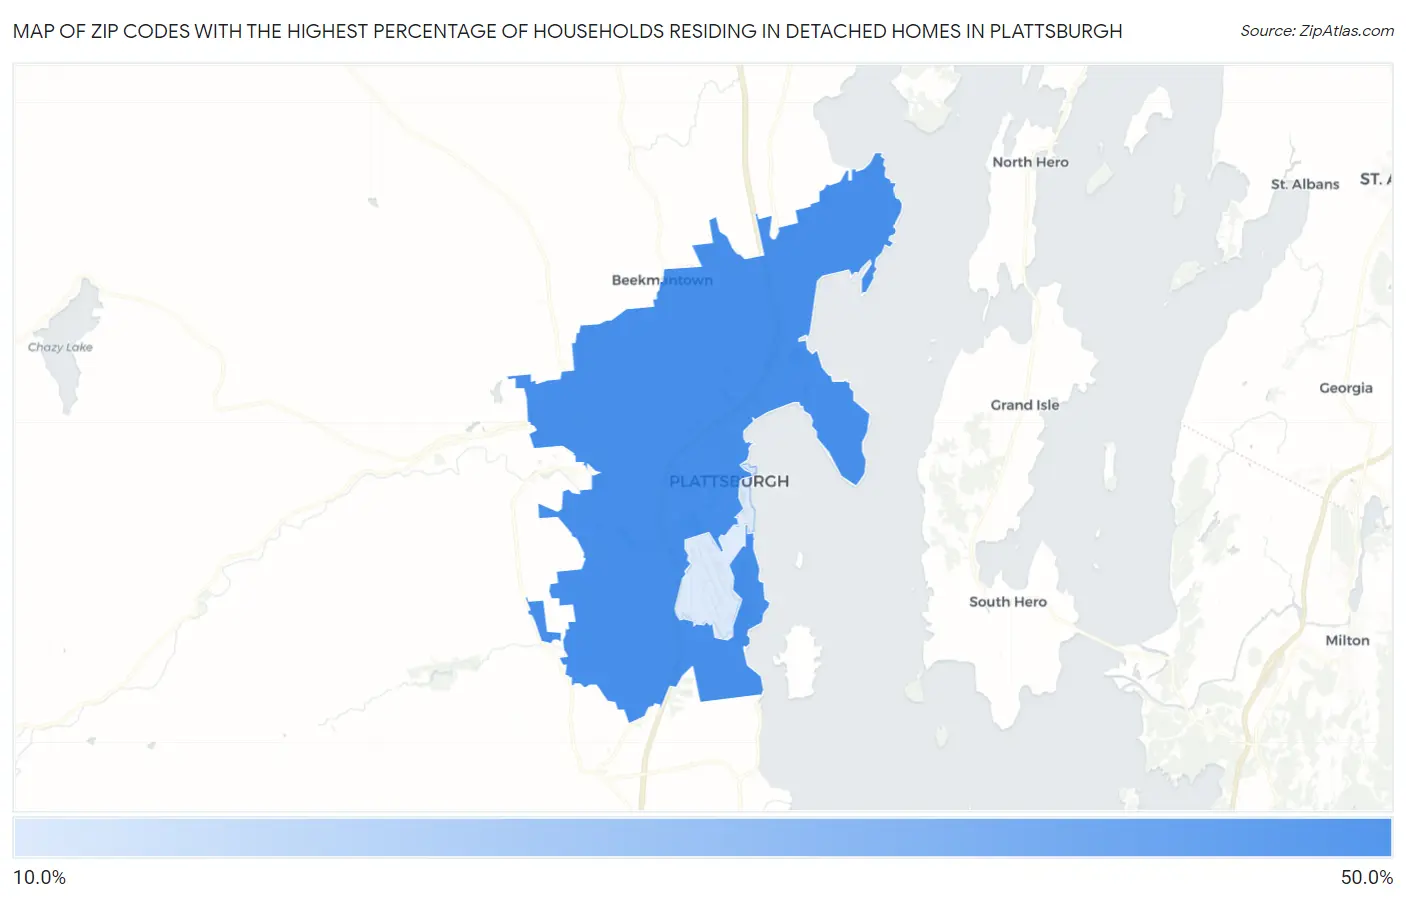
Map of Zip Codes with the Highest Percentage of Households Residing in Detached Homes in Plattsburgh
0.0%
50.0%
Zip Codes with the Highest Percentage of Households Residing in Detached Homes in Plattsburgh, NY
| Zip Code | Detached Home Residency | vs State | vs National | |
| 1. | 12901 | 46.8% | 41.6%(+5.20)#1,449 | 62.5%(-15.7)#29,683 |
| 2. | 12903 | 11.1% | 41.6%(-30.5)#1,613 | 62.5%(-51.4)#32,082 |
1
Common Questions
What are the Top Zip Codes with the Highest Percentage of Households Residing in Detached Homes in Plattsburgh, NY?
Top Zip Codes with the Highest Percentage of Households Residing in Detached Homes in Plattsburgh, NY are:
What zip code has the Highest Percentage of Households Residing in Detached Homes in Plattsburgh, NY?
12901 has the Highest Percentage of Households Residing in Detached Homes in Plattsburgh, NY with 46.8%.
What is the Percentage of Households Residing in Detached Homes in Plattsburgh, NY?
Percentage of Households Residing in Detached Homes in Plattsburgh is 31.1%.
What is the Percentage of Households Residing in Detached Homes in New York?
Percentage of Households Residing in Detached Homes in New York is 41.6%.
What is the Percentage of Households Residing in Detached Homes in the United States?
Percentage of Households Residing in Detached Homes in the United States is 62.5%.