Perrysburg, NY
Perrysburg Map
Perrysburg Overview
431
TOTAL POPULATION
209
MALE POPULATION
222
FEMALE POPULATION
94.14
MALES / 100 FEMALES
106.22
FEMALES / 100 MALES
52.1
MEDIAN AGE
3.4
AVG FAMILY SIZE
3.0
AVG HOUSEHOLD SIZE
$17,095
PER CAPITA INCOME
$71,250
AVG FAMILY INCOME
$54,671
AVG HOUSEHOLD INCOME
0.26
INEQUALITY / GINI INDEX
86
LABOR FORCE [ PEOPLE ]
23.9%
PERCENT IN LABOR FORCE
Perrysburg Zip Codes
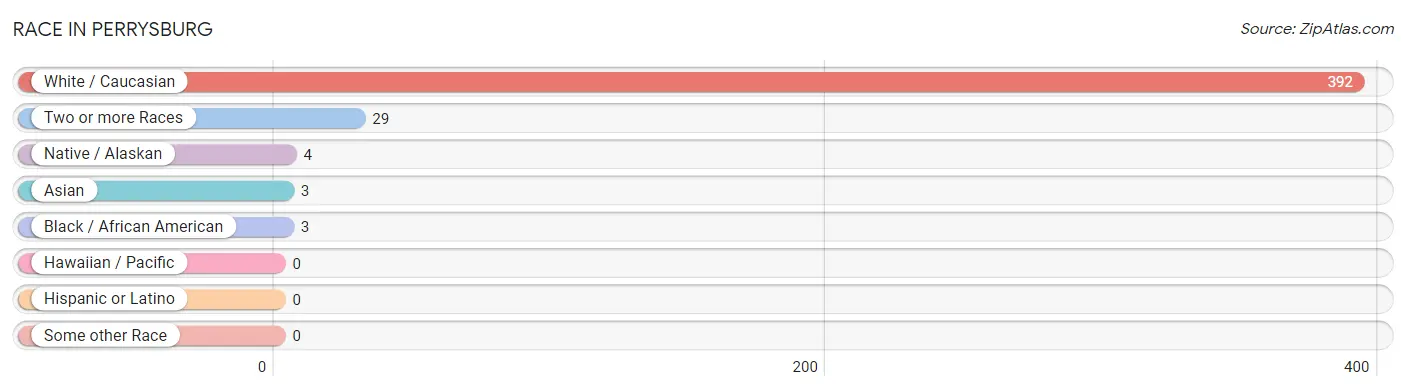
Race in Perrysburg
The most populous races in Perrysburg are White / Caucasian (392 | 90.9%), Two or more Races (29 | 6.7%), and Native / Alaskan (4 | 0.9%).
| Race | # Population | % Population |
| Asian | 3 | 0.7% |
| Black / African American | 3 | 0.7% |
| Hawaiian / Pacific | 0 | 0.0% |
| Hispanic or Latino | 0 | 0.0% |
| Native / Alaskan | 4 | 0.9% |
| White / Caucasian | 392 | 90.9% |
| Two or more Races | 29 | 6.7% |
| Some other Race | 0 | 0.0% |
| Total | 431 | 100.0% |
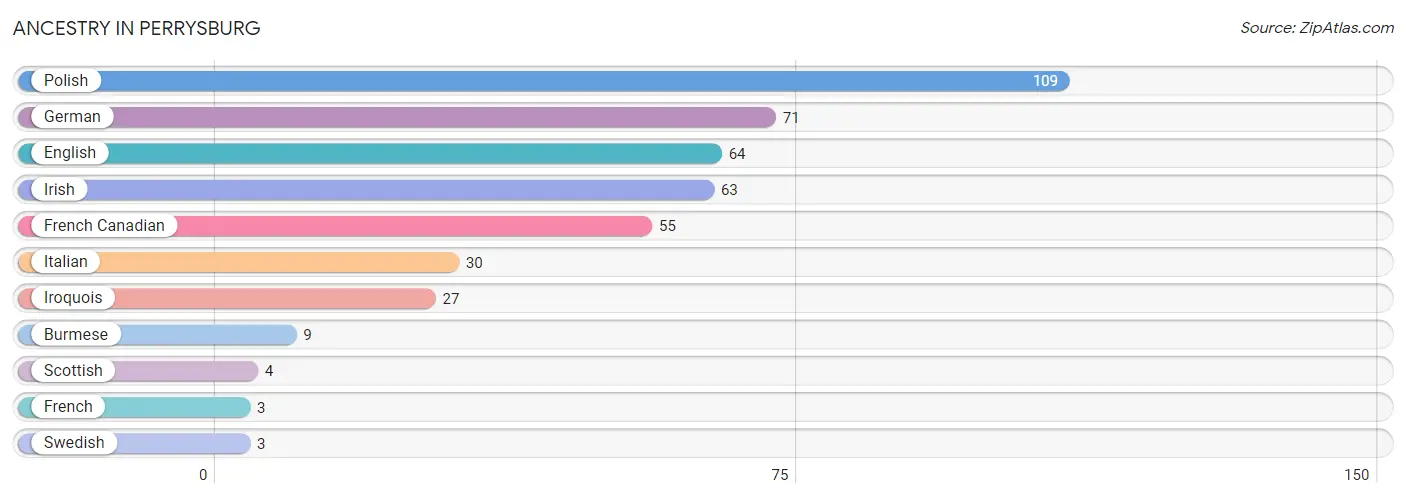
Ancestry in Perrysburg
The most populous ancestries reported in Perrysburg are Polish (109 | 25.3%), German (71 | 16.5%), English (64 | 14.8%), Irish (63 | 14.6%), and French Canadian (55 | 12.8%), together accounting for 84.0% of all Perrysburg residents.
| Ancestry | # Population | % Population |
| Burmese | 9 | 2.1% |
| English | 64 | 14.8% |
| French | 3 | 0.7% |
| French Canadian | 55 | 12.8% |
| German | 71 | 16.5% |
| Irish | 63 | 14.6% |
| Iroquois | 27 | 6.3% |
| Italian | 30 | 7.0% |
| Polish | 109 | 25.3% |
| Scottish | 4 | 0.9% |
| Swedish | 3 | 0.7% | View All 11 Rows |
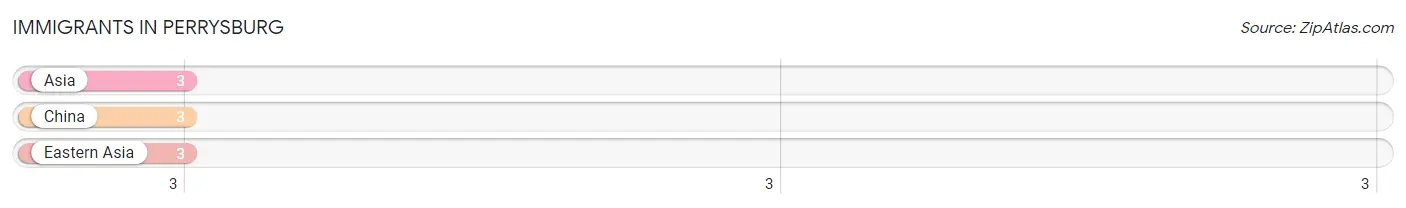
Immigrants in Perrysburg
The most numerous immigrant groups reported in Perrysburg came from Asia (3 | 0.7%), China (3 | 0.7%), and Eastern Asia (3 | 0.7%), together accounting for 2.1% of all Perrysburg residents.
| Immigration Origin | # Population | % Population |
| Asia | 3 | 0.7% |
| China | 3 | 0.7% |
| Eastern Asia | 3 | 0.7% | View All 3 Rows |
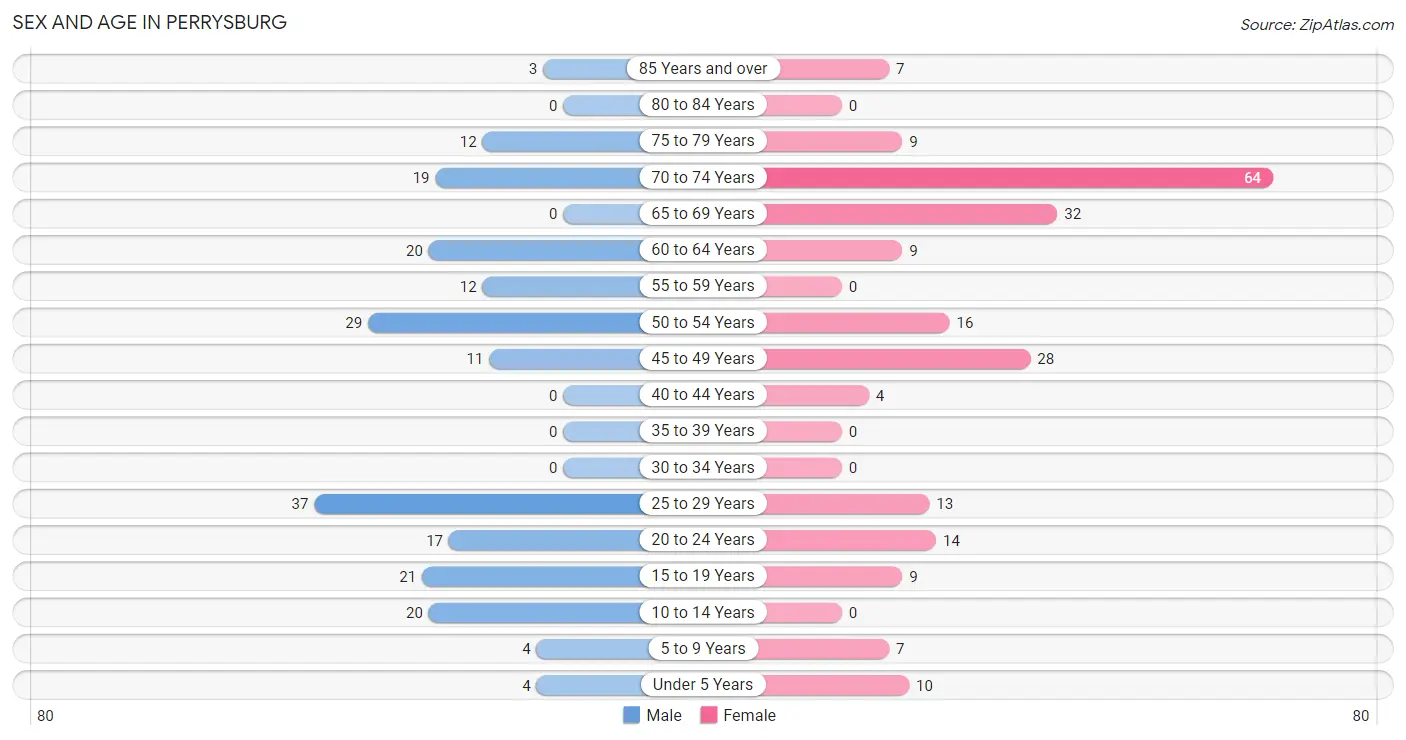
Sex and Age in Perrysburg
Sex and Age in Perrysburg
The most populous age groups in Perrysburg are 25 to 29 Years (37 | 17.7%) for men and 70 to 74 Years (64 | 28.8%) for women.
| Age Bracket | Male | Female |
| Under 5 Years | 4 (1.9%) | 10 (4.5%) |
| 5 to 9 Years | 4 (1.9%) | 7 (3.2%) |
| 10 to 14 Years | 20 (9.6%) | 0 (0.0%) |
| 15 to 19 Years | 21 (10.1%) | 9 (4.1%) |
| 20 to 24 Years | 17 (8.1%) | 14 (6.3%) |
| 25 to 29 Years | 37 (17.7%) | 13 (5.9%) |
| 30 to 34 Years | 0 (0.0%) | 0 (0.0%) |
| 35 to 39 Years | 0 (0.0%) | 0 (0.0%) |
| 40 to 44 Years | 0 (0.0%) | 4 (1.8%) |
| 45 to 49 Years | 11 (5.3%) | 28 (12.6%) |
| 50 to 54 Years | 29 (13.9%) | 16 (7.2%) |
| 55 to 59 Years | 12 (5.7%) | 0 (0.0%) |
| 60 to 64 Years | 20 (9.6%) | 9 (4.1%) |
| 65 to 69 Years | 0 (0.0%) | 32 (14.4%) |
| 70 to 74 Years | 19 (9.1%) | 64 (28.8%) |
| 75 to 79 Years | 12 (5.7%) | 9 (4.1%) |
| 80 to 84 Years | 0 (0.0%) | 0 (0.0%) |
| 85 Years and over | 3 (1.4%) | 7 (3.2%) |
| Total | 209 (100.0%) | 222 (100.0%) |
Families and Households in Perrysburg
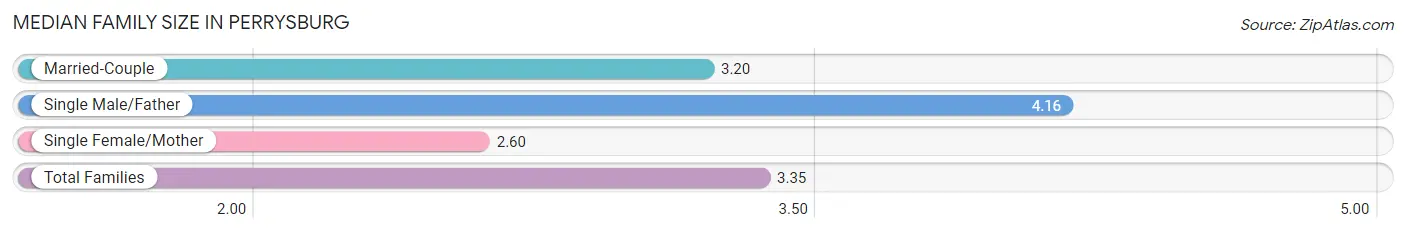
Median Family Size in Perrysburg
The median family size in Perrysburg is 3.35 persons per family, with single male/father families (19 | 23.7%) accounting for the largest median family size of 4.16 persons per family. On the other hand, single female/mother families (10 | 12.5%) represent the smallest median family size with 2.60 persons per family.
| Family Type | # Families | Family Size |
| Married-Couple | 51 (63.7%) | 3.20 |
| Single Male/Father | 19 (23.7%) | 4.16 |
| Single Female/Mother | 10 (12.5%) | 2.60 |
| Total Families | 80 (100.0%) | 3.35 |
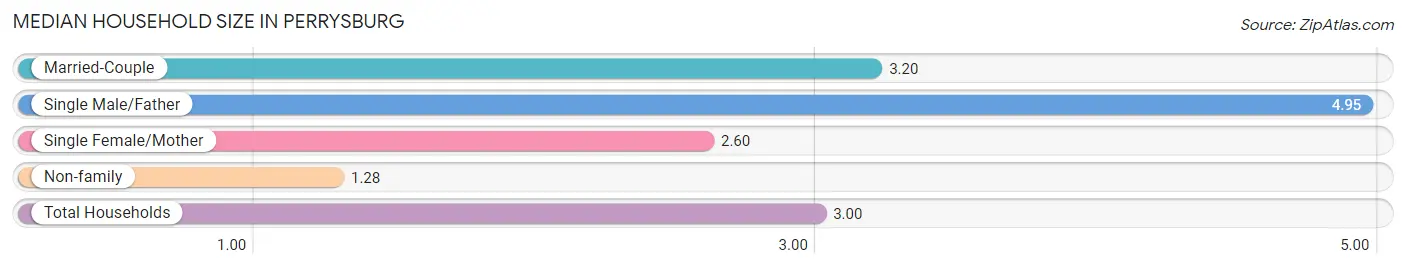
Median Household Size in Perrysburg
The median household size in Perrysburg is 3.00 persons per household, with single male/father households (19 | 18.1%) accounting for the largest median household size of 4.95 persons per household. non-family households (25 | 23.8%) represent the smallest median household size with 1.28 persons per household.
| Household Type | # Households | Household Size |
| Married-Couple | 51 (48.6%) | 3.20 |
| Single Male/Father | 19 (18.1%) | 4.95 |
| Single Female/Mother | 10 (9.5%) | 2.60 |
| Non-family | 25 (23.8%) | 1.28 |
| Total Households | 105 (100.0%) | 3.00 |
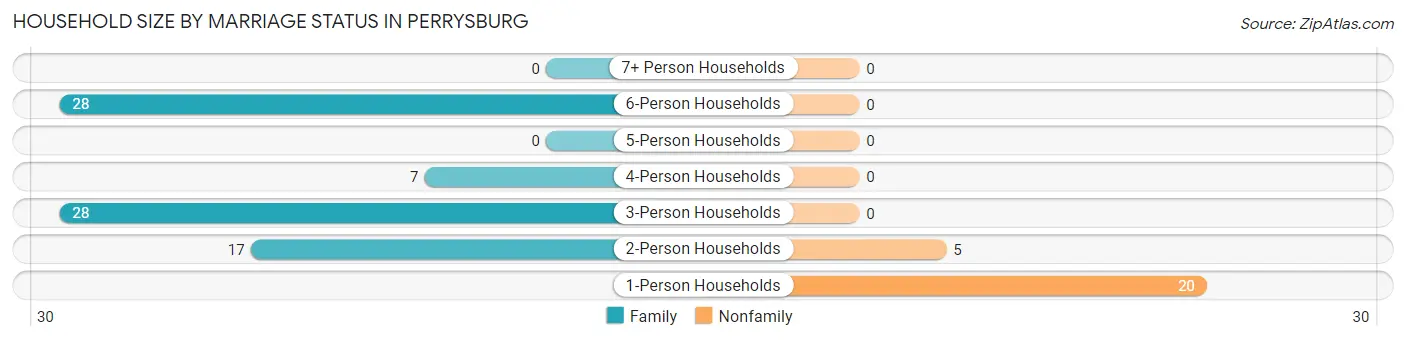
Household Size by Marriage Status in Perrysburg
Out of a total of 105 households in Perrysburg, 80 (76.2%) are family households, while 25 (23.8%) are nonfamily households. The most numerous type of family households are 3-person households, comprising 28, and the most common type of nonfamily households are 1-person households, comprising 20.
| Household Size | Family Households | Nonfamily Households |
| 1-Person Households | - | 20 (19.1%) |
| 2-Person Households | 17 (16.2%) | 5 (4.8%) |
| 3-Person Households | 28 (26.7%) | 0 (0.0%) |
| 4-Person Households | 7 (6.7%) | 0 (0.0%) |
| 5-Person Households | 0 (0.0%) | 0 (0.0%) |
| 6-Person Households | 28 (26.7%) | 0 (0.0%) |
| 7+ Person Households | 0 (0.0%) | 0 (0.0%) |
| Total | 80 (76.2%) | 25 (23.8%) |
Female Fertility in Perrysburg
Fertility by Age in Perrysburg
| Age Bracket | Women with Births | Births / 1,000 Women |
| 15 to 19 years | 0 (0.0%) | 0.0 |
| 20 to 34 years | 0 (0.0%) | 0.0 |
| 35 to 50 years | 0 (0.0%) | 0.0 |
| Total | 0 (0.0%) | 0.0 |
Fertility by Age by Marriage Status in Perrysburg
| Age Bracket | Married | Unmarried |
| 15 to 19 years | 0 (0.0%) | 0 (0.0%) |
| 20 to 34 years | 0 (0.0%) | 0 (0.0%) |
| 35 to 50 years | 0 (0.0%) | 0 (0.0%) |
| Total | 0 (0.0%) | 0 (0.0%) |
Fertility by Education in Perrysburg
| Educational Attainment | Women with Births | Births / 1,000 Women |
| Less than High School | 0 (0.0%) | 0.0 |
| High School Diploma | 0 (0.0%) | 0.0 |
| College or Associate's Degree | 0 (0.0%) | 0.0 |
| Bachelor's Degree | 0 (0.0%) | 0.0 |
| Graduate Degree | 0 (0.0%) | 0.0 |
| Total | 0 (0.0%) | 0.0 |
Fertility by Education by Marriage Status in Perrysburg
| Educational Attainment | Married | Unmarried |
| Less than High School | 0 (0.0%) | 0 (0.0%) |
| High School Diploma | 0 (0.0%) | 0 (0.0%) |
| College or Associate's Degree | 0 (0.0%) | 0 (0.0%) |
| Bachelor's Degree | 0 (0.0%) | 0 (0.0%) |
| Graduate Degree | 0 (0.0%) | 0 (0.0%) |
| Total | 0 (0.0%) | 0 (0.0%) |
Income in Perrysburg
Income Overview in Perrysburg
Per Capita Income in Perrysburg is $17,095, while median incomes of families and households are $71,250 and $54,671 respectively.
| Characteristic | Number | Measure |
| Per Capita Income | 431 | $17,095 |
| Median Family Income | 80 | $71,250 |
| Mean Family Income | 80 | $67,249 |
| Median Household Income | 105 | $54,671 |
| Mean Household Income | 105 | $60,602 |
| Income Deficit | 80 | $0 |
| Wage / Income Gap (%) | 431 | 0.00% |
| Wage / Income Gap ($) | 431 | 100.00¢ per $1 |
| Gini / Inequality Index | 431 | 0.26 |
Earnings by Sex in Perrysburg
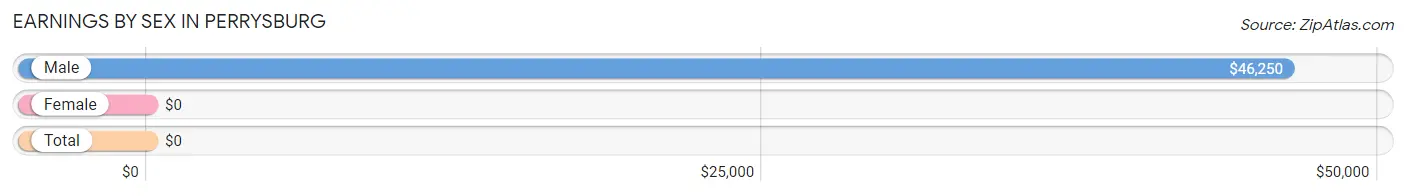
| Sex | Number | Average Earnings |
| Male | 47 (54.6%) | $46,250 |
| Female | 39 (45.4%) | $0 |
| Total | 86 (100.0%) | $0 |
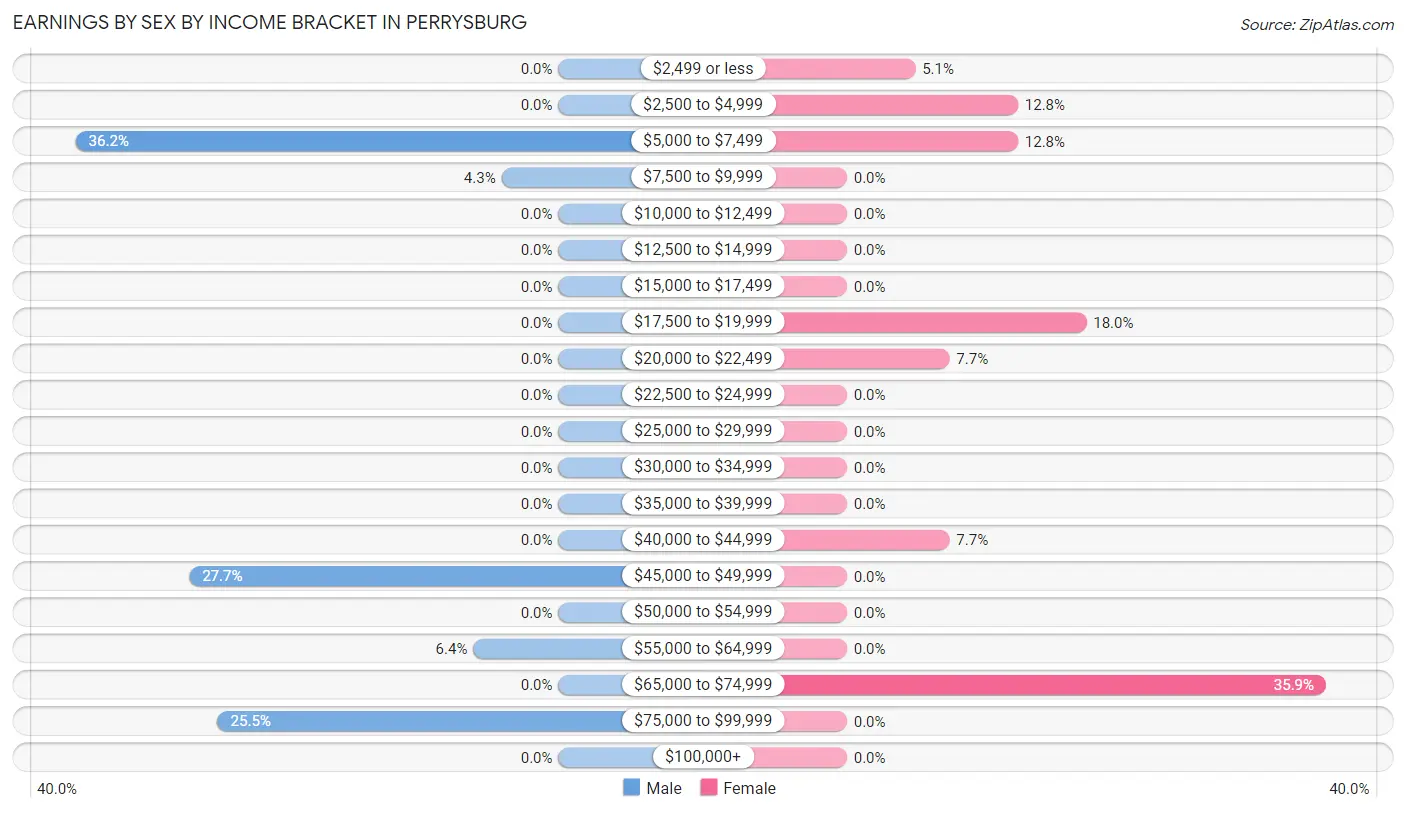
Earnings by Sex by Income Bracket in Perrysburg
The most common earnings brackets in Perrysburg are $5,000 to $7,499 for men (17 | 36.2%) and $65,000 to $74,999 for women (14 | 35.9%).
| Income | Male | Female |
| $2,499 or less | 0 (0.0%) | 2 (5.1%) |
| $2,500 to $4,999 | 0 (0.0%) | 5 (12.8%) |
| $5,000 to $7,499 | 17 (36.2%) | 5 (12.8%) |
| $7,500 to $9,999 | 2 (4.3%) | 0 (0.0%) |
| $10,000 to $12,499 | 0 (0.0%) | 0 (0.0%) |
| $12,500 to $14,999 | 0 (0.0%) | 0 (0.0%) |
| $15,000 to $17,499 | 0 (0.0%) | 0 (0.0%) |
| $17,500 to $19,999 | 0 (0.0%) | 7 (17.9%) |
| $20,000 to $22,499 | 0 (0.0%) | 3 (7.7%) |
| $22,500 to $24,999 | 0 (0.0%) | 0 (0.0%) |
| $25,000 to $29,999 | 0 (0.0%) | 0 (0.0%) |
| $30,000 to $34,999 | 0 (0.0%) | 0 (0.0%) |
| $35,000 to $39,999 | 0 (0.0%) | 0 (0.0%) |
| $40,000 to $44,999 | 0 (0.0%) | 3 (7.7%) |
| $45,000 to $49,999 | 13 (27.7%) | 0 (0.0%) |
| $50,000 to $54,999 | 0 (0.0%) | 0 (0.0%) |
| $55,000 to $64,999 | 3 (6.4%) | 0 (0.0%) |
| $65,000 to $74,999 | 0 (0.0%) | 14 (35.9%) |
| $75,000 to $99,999 | 12 (25.5%) | 0 (0.0%) |
| $100,000+ | 0 (0.0%) | 0 (0.0%) |
| Total | 47 (100.0%) | 39 (100.0%) |
Earnings by Sex by Educational Attainment in Perrysburg
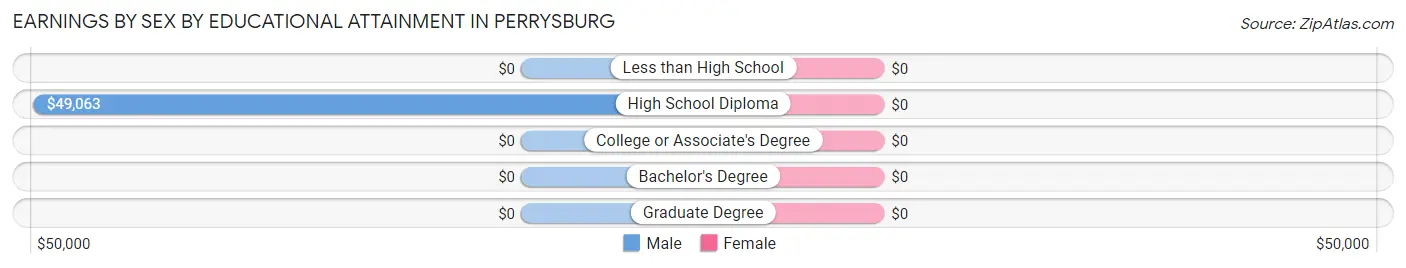
| Educational Attainment | Male Income | Female Income |
| Less than High School | - | - |
| High School Diploma | $49,063 | $0 |
| College or Associate's Degree | - | - |
| Bachelor's Degree | - | - |
| Graduate Degree | - | - |
| Total | $52,500 | $0 |
Family Income in Perrysburg
Family Income Brackets in Perrysburg
According to the Perrysburg family income data, there are 35 families falling into the $75,000 to $99,999 income range, which is the most common income bracket and makes up 43.8% of all families.
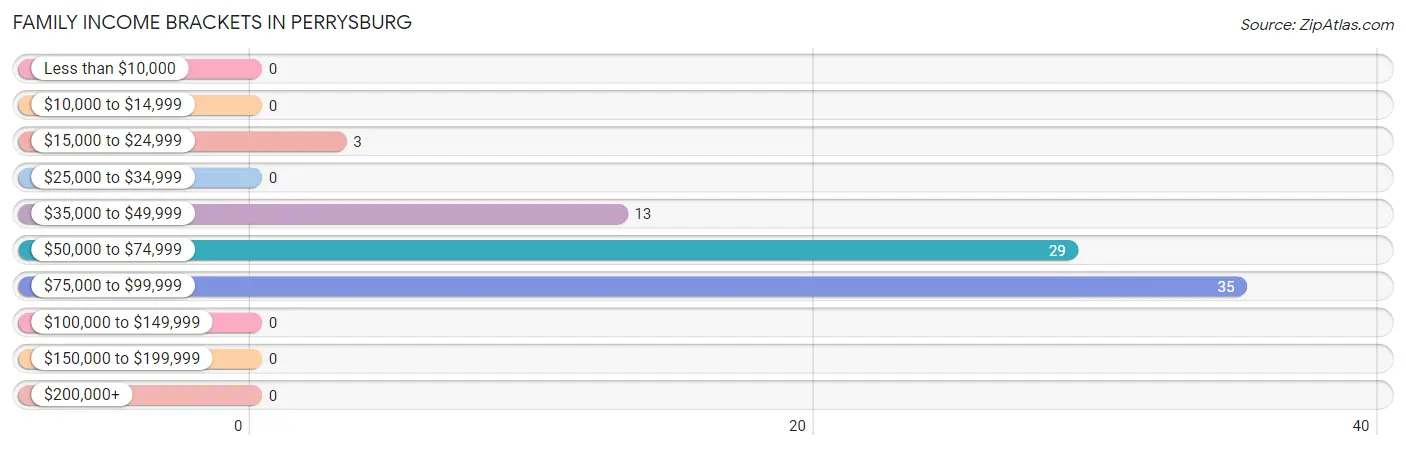
| Income Bracket | # Families | % Families |
| Less than $10,000 | 0 | 0.0% |
| $10,000 to $14,999 | 0 | 0.0% |
| $15,000 to $24,999 | 3 | 3.8% |
| $25,000 to $34,999 | 0 | 0.0% |
| $35,000 to $49,999 | 13 | 16.3% |
| $50,000 to $74,999 | 29 | 36.3% |
| $75,000 to $99,999 | 35 | 43.8% |
| $100,000 to $149,999 | 0 | 0.0% |
| $150,000 to $199,999 | 0 | 0.0% |
| $200,000+ | 0 | 0.0% |
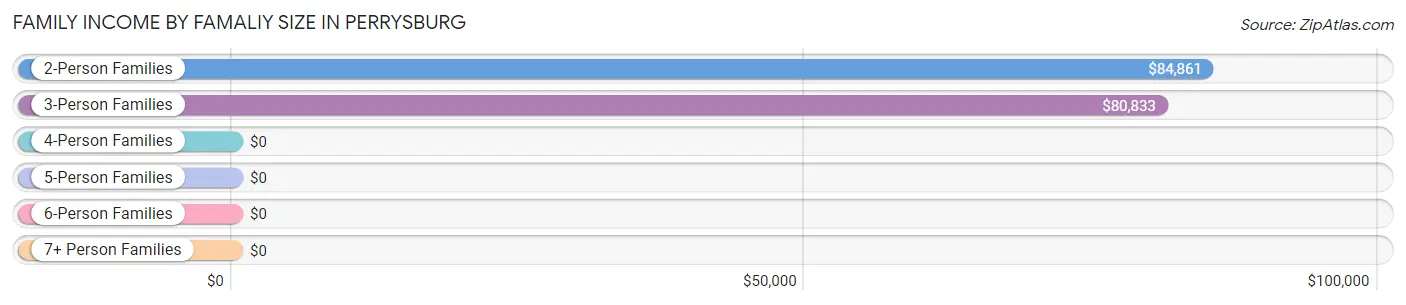
Family Income by Famaliy Size in Perrysburg
2-person families (17 | 21.2%) account for the highest median family income in Perrysburg with $84,861 per family, while 2-person families (17 | 21.2%) have the highest median income of $42,430 per family member.
| Income Bracket | # Families | Median Income |
| 2-Person Families | 17 (21.2%) | $84,861 |
| 3-Person Families | 28 (35.0%) | $80,833 |
| 4-Person Families | 7 (8.7%) | $0 |
| 5-Person Families | 19 (23.7%) | $0 |
| 6-Person Families | 9 (11.3%) | $0 |
| 7+ Person Families | 0 (0.0%) | $0 |
| Total | 80 (100.0%) | $71,250 |
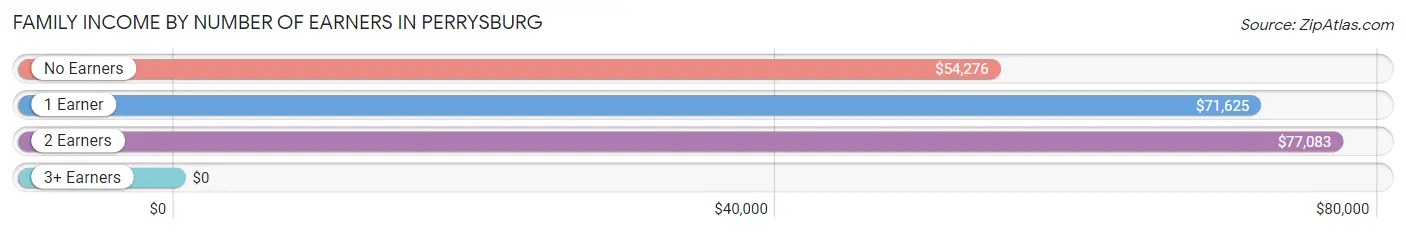
Family Income by Number of Earners in Perrysburg
| Number of Earners | # Families | Median Income |
| No Earners | 27 (33.8%) | $54,276 |
| 1 Earner | 39 (48.7%) | $71,625 |
| 2 Earners | 11 (13.8%) | $77,083 |
| 3+ Earners | 3 (3.7%) | $0 |
| Total | 80 (100.0%) | $71,250 |
Household Income in Perrysburg
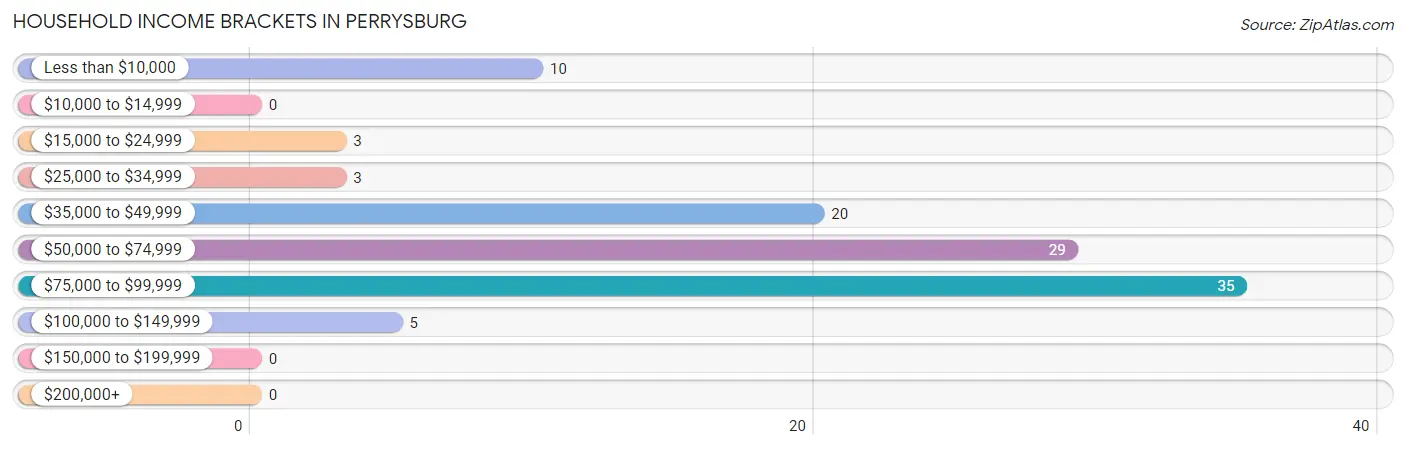
Household Income Brackets in Perrysburg
With 35 households falling in the category, the $75,000 to $99,999 income range is the most frequent in Perrysburg, accounting for 33.3% of all households.
| Income Bracket | # Households | % Households |
| Less than $10,000 | 10 | 9.5% |
| $10,000 to $14,999 | 0 | 0.0% |
| $15,000 to $24,999 | 3 | 2.9% |
| $25,000 to $34,999 | 3 | 2.9% |
| $35,000 to $49,999 | 20 | 19.0% |
| $50,000 to $74,999 | 29 | 27.6% |
| $75,000 to $99,999 | 35 | 33.3% |
| $100,000 to $149,999 | 5 | 4.8% |
| $150,000 to $199,999 | 0 | 0.0% |
| $200,000+ | 0 | 0.0% |
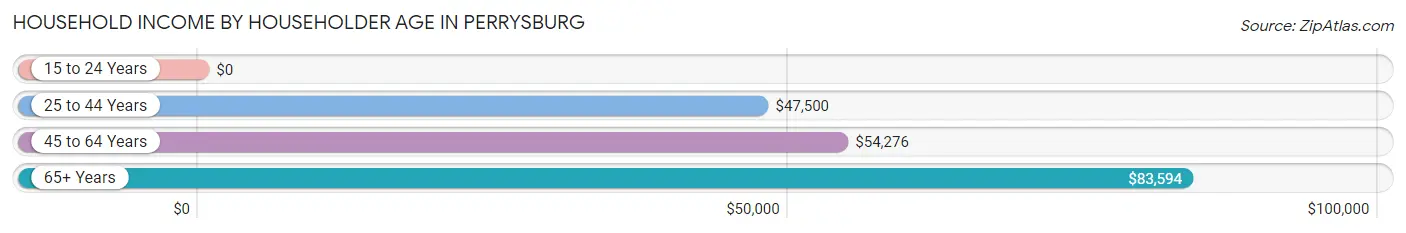
Household Income by Householder Age in Perrysburg
The median household income in Perrysburg is $54,671, with the highest median household income of $83,594 found in the 65+ years age bracket for the primary householder. A total of 26 households (24.8%) fall into this category.
| Income Bracket | # Households | Median Income |
| 15 to 24 Years | 0 (0.0%) | $0 |
| 25 to 44 Years | 26 (24.8%) | $47,500 |
| 45 to 64 Years | 53 (50.5%) | $54,276 |
| 65+ Years | 26 (24.8%) | $83,594 |
| Total | 105 (100.0%) | $54,671 |
Poverty in Perrysburg
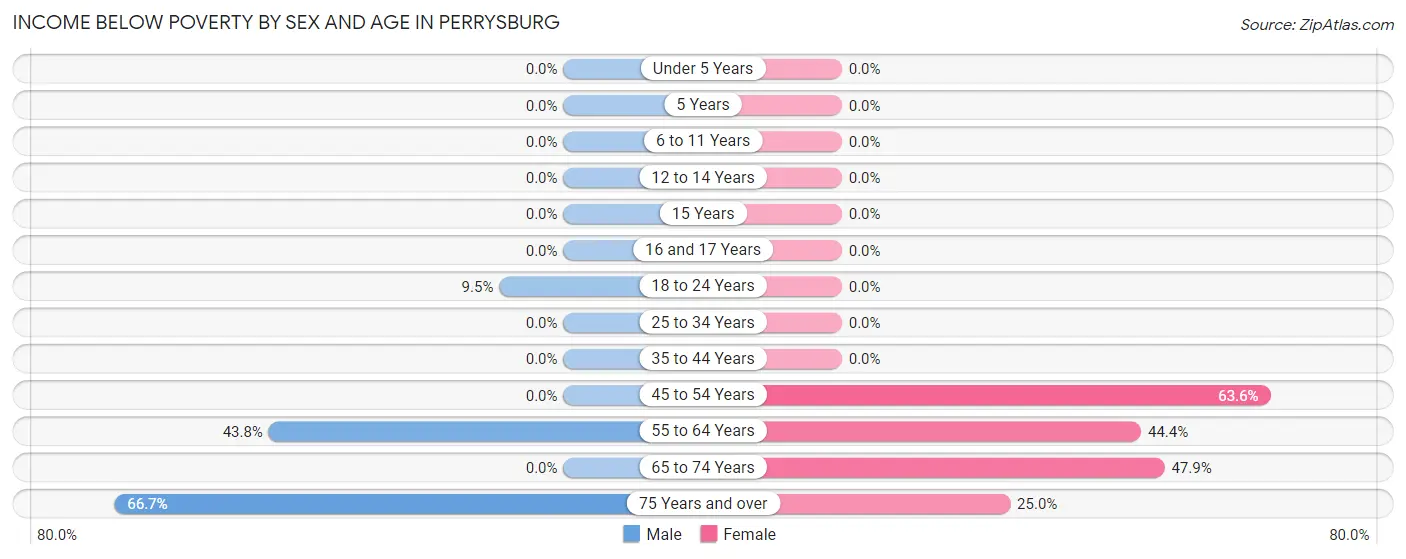
Income Below Poverty by Sex and Age in Perrysburg
With 12.4% poverty level for males and 36.9% for females among the residents of Perrysburg, 75 year old and over males and 45 to 54 year old females are the most vulnerable to poverty, with 10 males (66.7%) and 28 females (63.6%) in their respective age groups living below the poverty level.
| Age Bracket | Male | Female |
| Under 5 Years | 0 (0.0%) | 0 (0.0%) |
| 5 Years | 0 (0.0%) | 0 (0.0%) |
| 6 to 11 Years | 0 (0.0%) | 0 (0.0%) |
| 12 to 14 Years | 0 (0.0%) | 0 (0.0%) |
| 15 Years | 0 (0.0%) | 0 (0.0%) |
| 16 and 17 Years | 0 (0.0%) | 0 (0.0%) |
| 18 to 24 Years | 2 (9.5%) | 0 (0.0%) |
| 25 to 34 Years | 0 (0.0%) | 0 (0.0%) |
| 35 to 44 Years | 0 (0.0%) | 0 (0.0%) |
| 45 to 54 Years | 0 (0.0%) | 28 (63.6%) |
| 55 to 64 Years | 14 (43.8%) | 4 (44.4%) |
| 65 to 74 Years | 0 (0.0%) | 46 (47.9%) |
| 75 Years and over | 10 (66.7%) | 4 (25.0%) |
| Total | 26 (12.4%) | 82 (36.9%) |
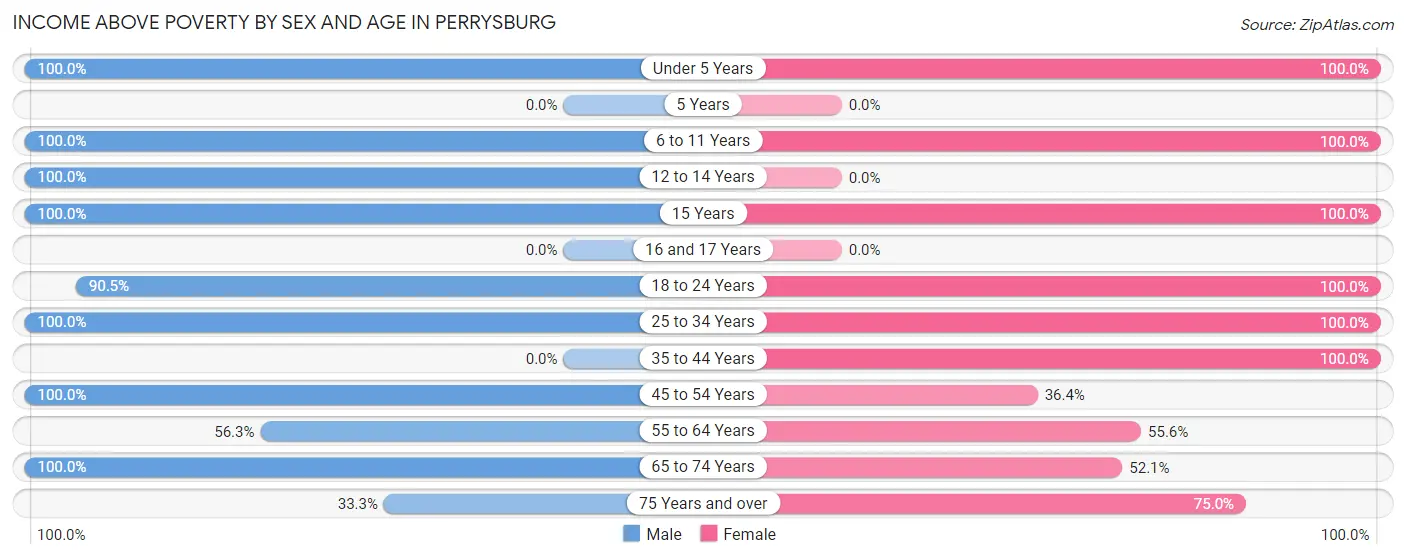
Income Above Poverty by Sex and Age in Perrysburg
According to the poverty statistics in Perrysburg, males aged under 5 years and females aged under 5 years are the age groups that are most secure financially, with 100.0% of males and 100.0% of females in these age groups living above the poverty line.
| Age Bracket | Male | Female |
| Under 5 Years | 4 (100.0%) | 10 (100.0%) |
| 5 Years | 0 (0.0%) | 0 (0.0%) |
| 6 to 11 Years | 17 (100.0%) | 7 (100.0%) |
| 12 to 14 Years | 7 (100.0%) | 0 (0.0%) |
| 15 Years | 17 (100.0%) | 9 (100.0%) |
| 16 and 17 Years | 0 (0.0%) | 0 (0.0%) |
| 18 to 24 Years | 19 (90.5%) | 14 (100.0%) |
| 25 to 34 Years | 37 (100.0%) | 13 (100.0%) |
| 35 to 44 Years | 0 (0.0%) | 4 (100.0%) |
| 45 to 54 Years | 40 (100.0%) | 16 (36.4%) |
| 55 to 64 Years | 18 (56.2%) | 5 (55.6%) |
| 65 to 74 Years | 19 (100.0%) | 50 (52.1%) |
| 75 Years and over | 5 (33.3%) | 12 (75.0%) |
| Total | 183 (87.6%) | 140 (63.1%) |
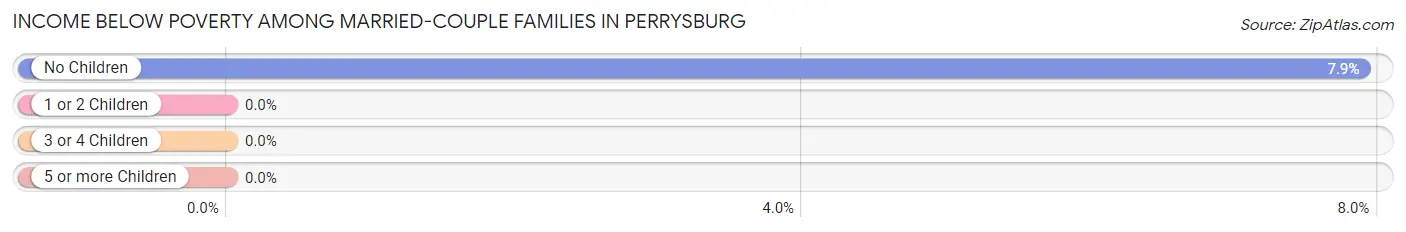
Income Below Poverty Among Married-Couple Families in Perrysburg
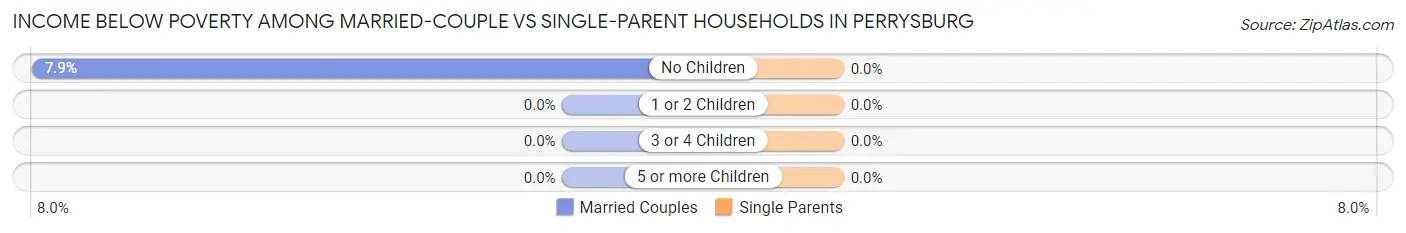
The poverty statistics for married-couple families in Perrysburg show that 5.9% or 3 of the total 51 families live below the poverty line. Families with no children have the highest poverty rate of 7.9%, comprising of 3 families. On the other hand, families with 1 or 2 children have the lowest poverty rate of 0.0%, which includes 0 families.
| Children | Above Poverty | Below Poverty |
| No Children | 35 (92.1%) | 3 (7.9%) |
| 1 or 2 Children | 4 (100.0%) | 0 (0.0%) |
| 3 or 4 Children | 9 (100.0%) | 0 (0.0%) |
| 5 or more Children | 0 (0.0%) | 0 (0.0%) |
| Total | 48 (94.1%) | 3 (5.9%) |
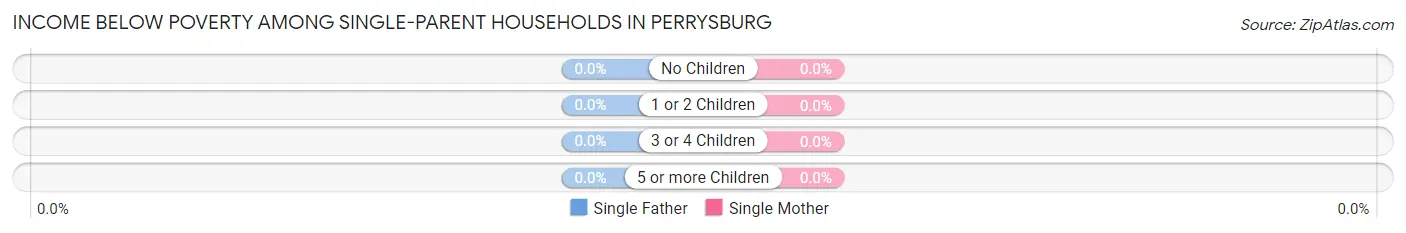
Income Below Poverty Among Single-Parent Households in Perrysburg
| Children | Single Father | Single Mother |
| No Children | 0 (0.0%) | 0 (0.0%) |
| 1 or 2 Children | 0 (0.0%) | 0 (0.0%) |
| 3 or 4 Children | 0 (0.0%) | 0 (0.0%) |
| 5 or more Children | 0 (0.0%) | 0 (0.0%) |
| Total | 0 (0.0%) | 0 (0.0%) |
Income Below Poverty Among Married-Couple vs Single-Parent Households in Perrysburg
| Children | Married-Couple Families | Single-Parent Households |
| No Children | 3 (7.9%) | 0 (0.0%) |
| 1 or 2 Children | 0 (0.0%) | 0 (0.0%) |
| 3 or 4 Children | 0 (0.0%) | 0 (0.0%) |
| 5 or more Children | 0 (0.0%) | 0 (0.0%) |
| Total | 3 (5.9%) | 0 (0.0%) |
Employment Characteristics in Perrysburg
Employment by Class of Employer in Perrysburg
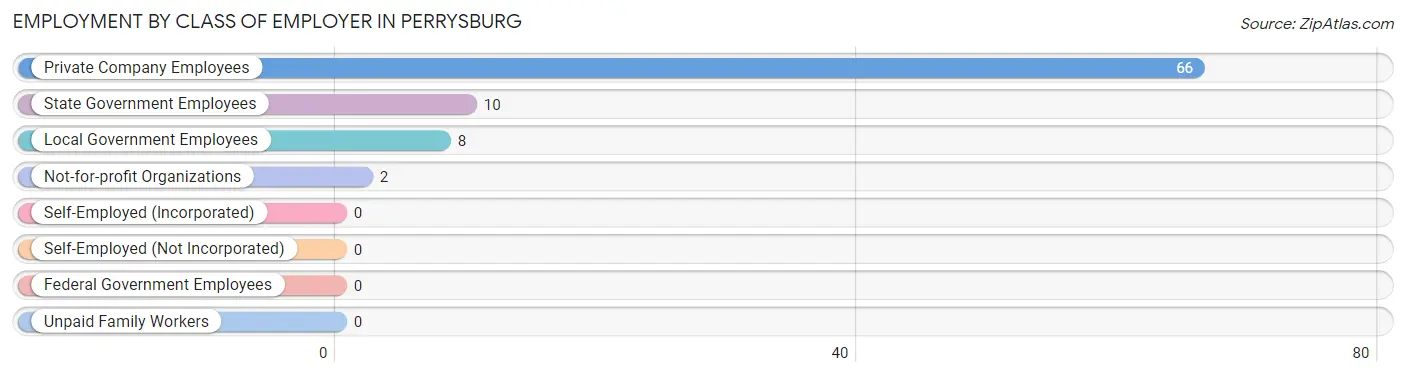
Among the 86 employed individuals in Perrysburg, private company employees (66 | 76.7%), state government employees (10 | 11.6%), and local government employees (8 | 9.3%) make up the most common classes of employment.
| Employer Class | # Employees | % Employees |
| Private Company Employees | 66 | 76.7% |
| Self-Employed (Incorporated) | 0 | 0.0% |
| Self-Employed (Not Incorporated) | 0 | 0.0% |
| Not-for-profit Organizations | 2 | 2.3% |
| Local Government Employees | 8 | 9.3% |
| State Government Employees | 10 | 11.6% |
| Federal Government Employees | 0 | 0.0% |
| Unpaid Family Workers | 0 | 0.0% |
| Total | 86 | 100.0% |
Employment Status by Age in Perrysburg
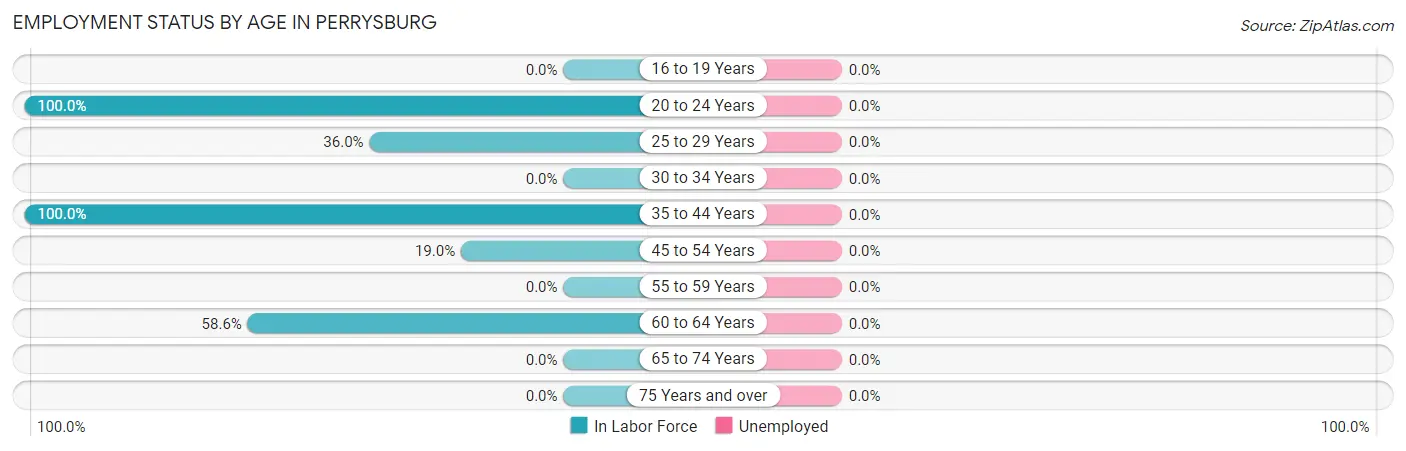
| Age Bracket | In Labor Force | Unemployed |
| 16 to 19 Years | 0 (0.0%) | 0 (0.0%) |
| 20 to 24 Years | 31 (100.0%) | 0 (0.0%) |
| 25 to 29 Years | 18 (36.0%) | 0 (0.0%) |
| 30 to 34 Years | 0 (0.0%) | 0 (0.0%) |
| 35 to 44 Years | 4 (100.0%) | 0 (0.0%) |
| 45 to 54 Years | 16 (19.0%) | 0 (0.0%) |
| 55 to 59 Years | 0 (0.0%) | 0 (0.0%) |
| 60 to 64 Years | 17 (58.6%) | 0 (0.0%) |
| 65 to 74 Years | 0 (0.0%) | 0 (0.0%) |
| 75 Years and over | 0 (0.0%) | 0 (0.0%) |
| Total | 86 (23.9%) | 0 (0.0%) |
Employment Status by Educational Attainment in Perrysburg
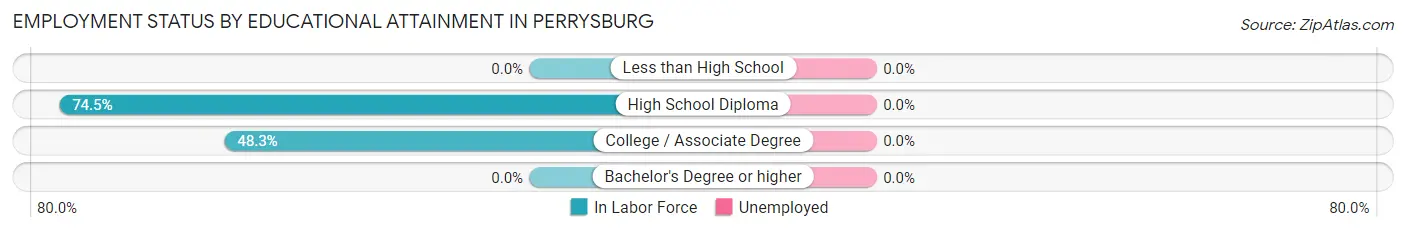
| Educational Attainment | In Labor Force | Unemployed |
| Less than High School | 0 (0.0%) | 0 (0.0%) |
| High School Diploma | 41 (74.5%) | 0 (0.0%) |
| College / Associate Degree | 14 (48.3%) | 0 (0.0%) |
| Bachelor's Degree or higher | 0 (0.0%) | 0 (0.0%) |
| Total | 55 (30.7%) | 0 (0.0%) |
Employment Occupations by Sex in Perrysburg
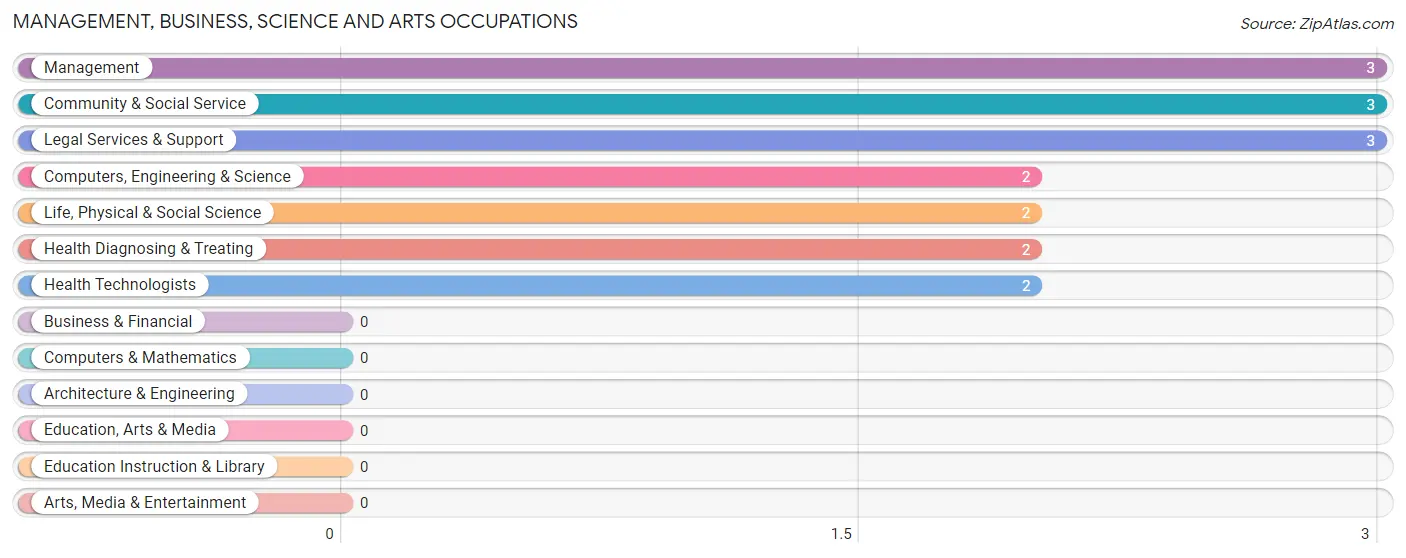
Management, Business, Science and Arts Occupations
The most common Management, Business, Science and Arts occupations in Perrysburg are Management (3 | 3.5%), Community & Social Service (3 | 3.5%), Legal Services & Support (3 | 3.5%), Computers, Engineering & Science (2 | 2.3%), and Life, Physical & Social Science (2 | 2.3%).
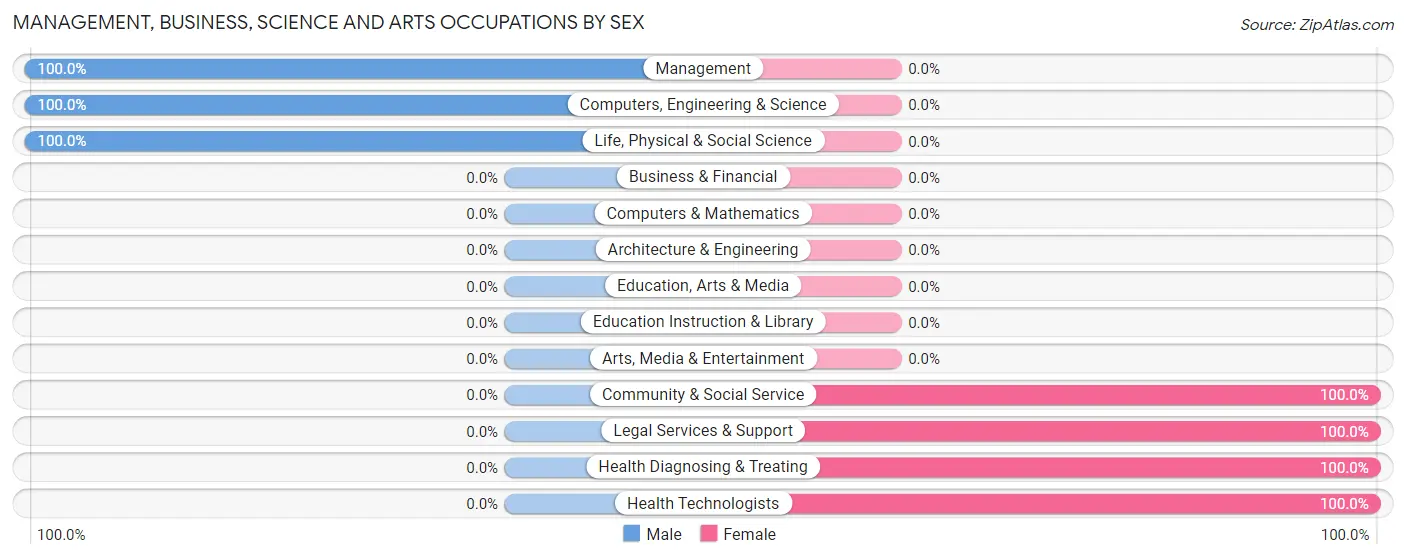
Management, Business, Science and Arts Occupations by Sex
Within the Management, Business, Science and Arts occupations in Perrysburg, the most male-oriented occupations are Management (100.0%), Computers, Engineering & Science (100.0%), and Life, Physical & Social Science (100.0%), while the most female-oriented occupations are Community & Social Service (100.0%), Legal Services & Support (100.0%), and Health Diagnosing & Treating (100.0%).
| Occupation | Male | Female |
| Management | 3 (100.0%) | 0 (0.0%) |
| Business & Financial | 0 (0.0%) | 0 (0.0%) |
| Computers, Engineering & Science | 2 (100.0%) | 0 (0.0%) |
| Computers & Mathematics | 0 (0.0%) | 0 (0.0%) |
| Architecture & Engineering | 0 (0.0%) | 0 (0.0%) |
| Life, Physical & Social Science | 2 (100.0%) | 0 (0.0%) |
| Community & Social Service | 0 (0.0%) | 3 (100.0%) |
| Education, Arts & Media | 0 (0.0%) | 0 (0.0%) |
| Legal Services & Support | 0 (0.0%) | 3 (100.0%) |
| Education Instruction & Library | 0 (0.0%) | 0 (0.0%) |
| Arts, Media & Entertainment | 0 (0.0%) | 0 (0.0%) |
| Health Diagnosing & Treating | 0 (0.0%) | 2 (100.0%) |
| Health Technologists | 0 (0.0%) | 2 (100.0%) |
| Total (Category) | 5 (50.0%) | 5 (50.0%) |
| Total (Overall) | 47 (54.6%) | 39 (45.4%) |
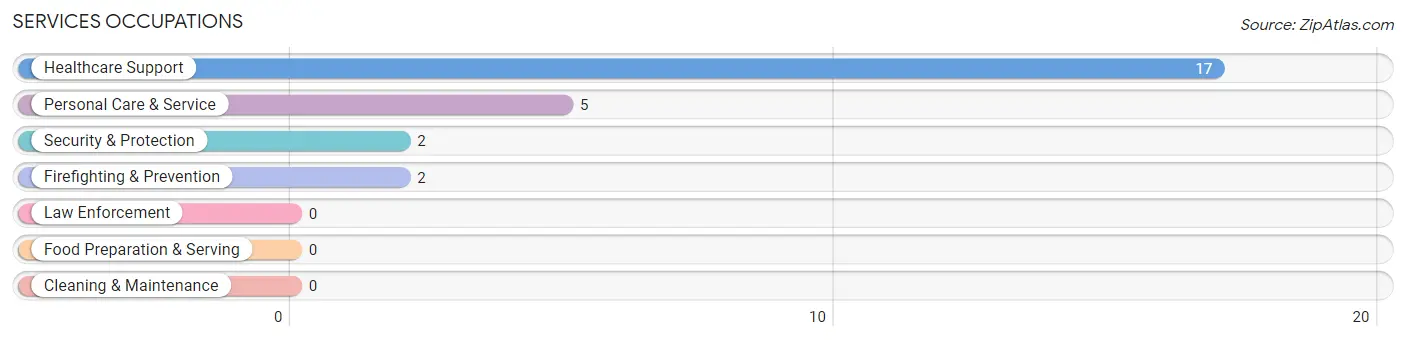
Services Occupations
The most common Services occupations in Perrysburg are Healthcare Support (17 | 19.8%), Personal Care & Service (5 | 5.8%), Security & Protection (2 | 2.3%), and Firefighting & Prevention (2 | 2.3%).
Services Occupations by Sex
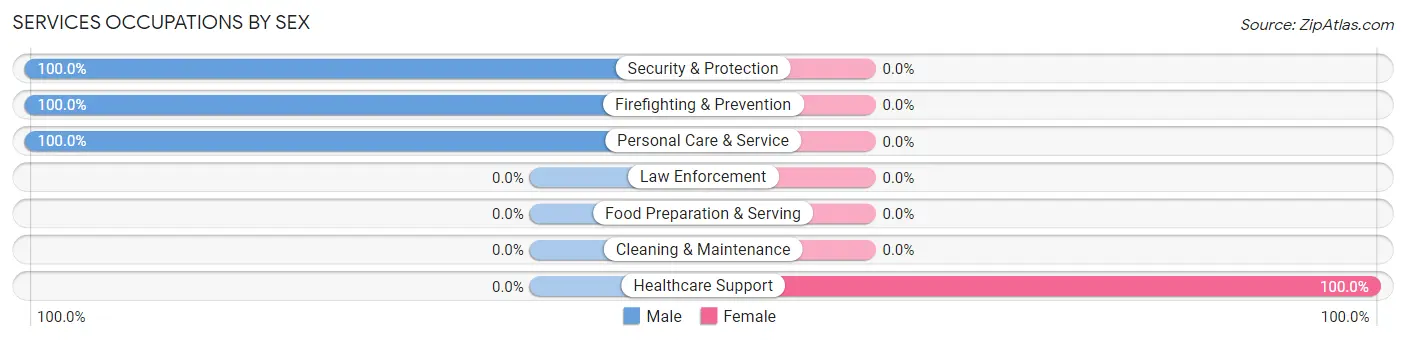
| Occupation | Male | Female |
| Healthcare Support | 0 (0.0%) | 17 (100.0%) |
| Security & Protection | 2 (100.0%) | 0 (0.0%) |
| Firefighting & Prevention | 2 (100.0%) | 0 (0.0%) |
| Law Enforcement | 0 (0.0%) | 0 (0.0%) |
| Food Preparation & Serving | 0 (0.0%) | 0 (0.0%) |
| Cleaning & Maintenance | 0 (0.0%) | 0 (0.0%) |
| Personal Care & Service | 5 (100.0%) | 0 (0.0%) |
| Total (Category) | 7 (29.2%) | 17 (70.8%) |
| Total (Overall) | 47 (54.6%) | 39 (45.4%) |
Sales and Office Occupations
The most common Sales and Office occupations in Perrysburg are , and Sales & Related (12 | 14.0%).
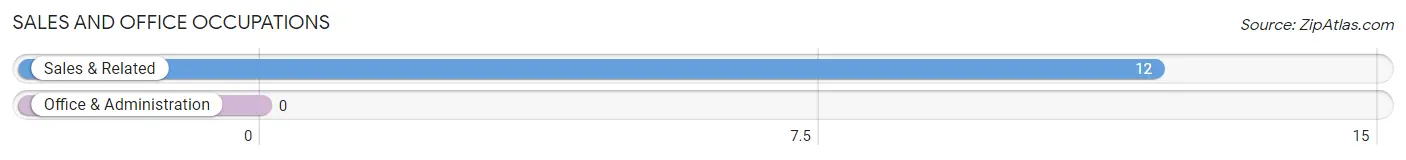
Sales and Office Occupations by Sex
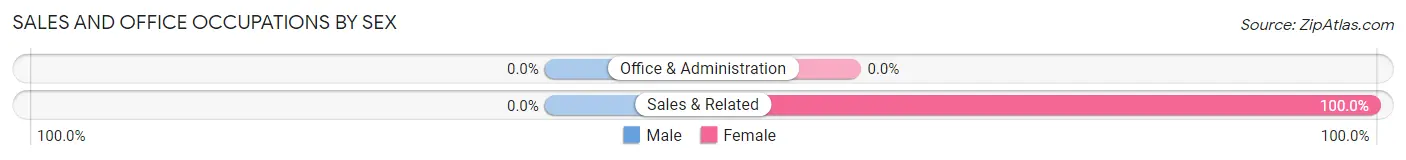
| Occupation | Male | Female |
| Sales & Related | 0 (0.0%) | 12 (100.0%) |
| Office & Administration | 0 (0.0%) | 0 (0.0%) |
| Total (Category) | 0 (0.0%) | 12 (100.0%) |
| Total (Overall) | 47 (54.6%) | 39 (45.4%) |
Natural Resources, Construction and Maintenance Occupations
The most common Natural Resources, Construction and Maintenance occupations in Perrysburg are Construction & Extraction (8 | 9.3%), and Installation, Maintenance & Repair (7 | 8.1%).
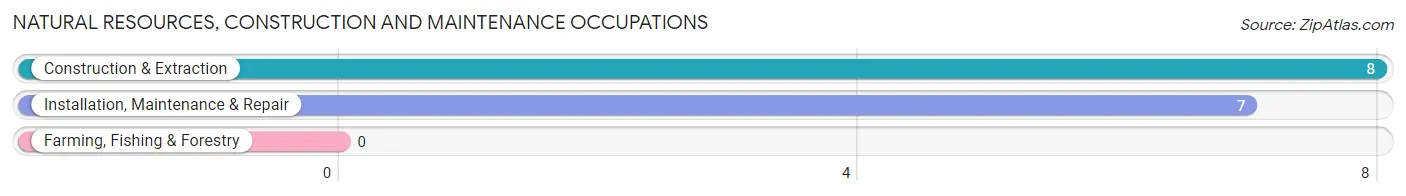
Natural Resources, Construction and Maintenance Occupations by Sex
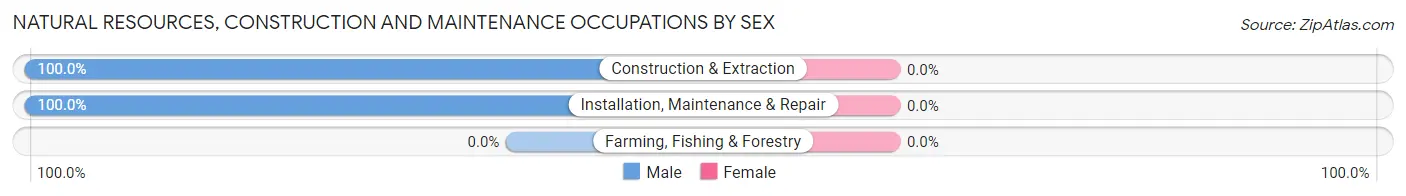
| Occupation | Male | Female |
| Farming, Fishing & Forestry | 0 (0.0%) | 0 (0.0%) |
| Construction & Extraction | 8 (100.0%) | 0 (0.0%) |
| Installation, Maintenance & Repair | 7 (100.0%) | 0 (0.0%) |
| Total (Category) | 15 (100.0%) | 0 (0.0%) |
| Total (Overall) | 47 (54.6%) | 39 (45.4%) |
Production, Transportation and Moving Occupations
The most common Production, Transportation and Moving occupations in Perrysburg are Material Moving (20 | 23.3%), and Transportation (5 | 5.8%).
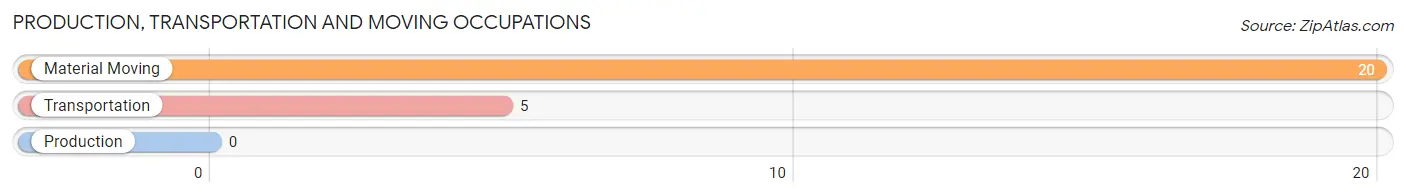
Production, Transportation and Moving Occupations by Sex
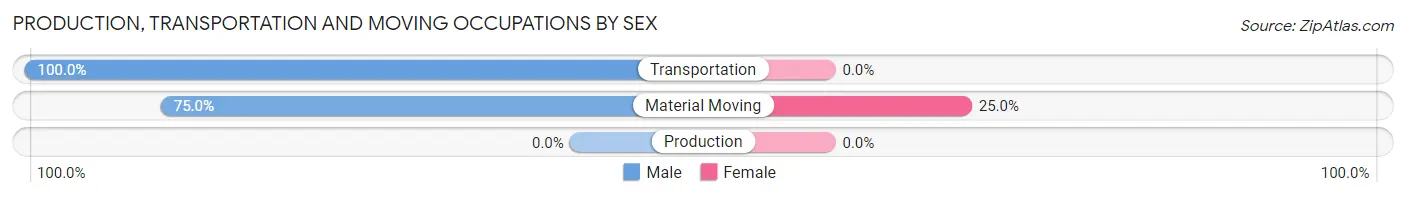
| Occupation | Male | Female |
| Production | 0 (0.0%) | 0 (0.0%) |
| Transportation | 5 (100.0%) | 0 (0.0%) |
| Material Moving | 15 (75.0%) | 5 (25.0%) |
| Total (Category) | 20 (80.0%) | 5 (20.0%) |
| Total (Overall) | 47 (54.6%) | 39 (45.4%) |
Employment Industries by Sex in Perrysburg
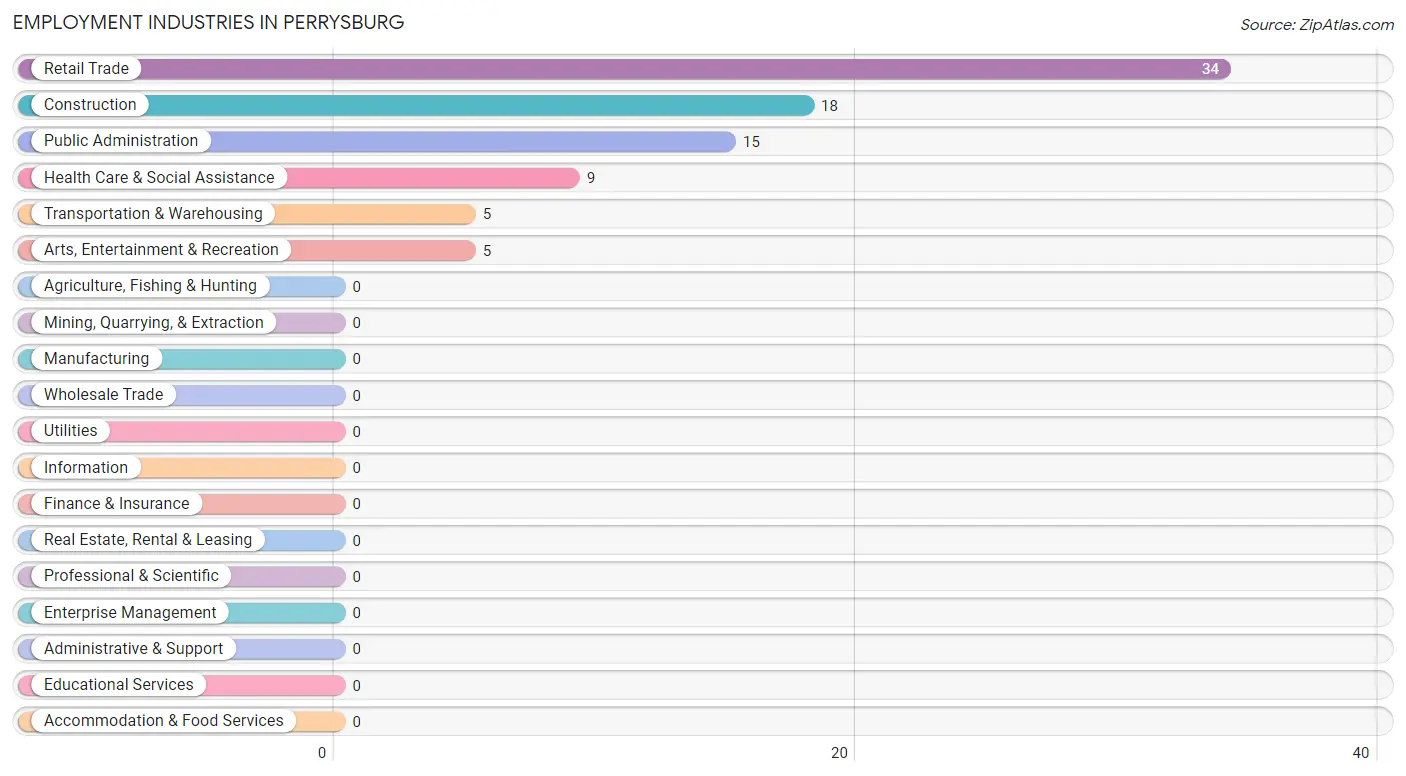
Employment Industries in Perrysburg
The major employment industries in Perrysburg include Retail Trade (34 | 39.5%), Construction (18 | 20.9%), Public Administration (15 | 17.4%), Health Care & Social Assistance (9 | 10.5%), and Transportation & Warehousing (5 | 5.8%).
Employment Industries by Sex in Perrysburg
The Perrysburg industries that see more men than women are Construction (100.0%), Transportation & Warehousing (100.0%), and Arts, Entertainment & Recreation (100.0%), whereas the industries that tend to have a higher number of women are Health Care & Social Assistance (100.0%), Public Administration (86.7%), and Retail Trade (50.0%).
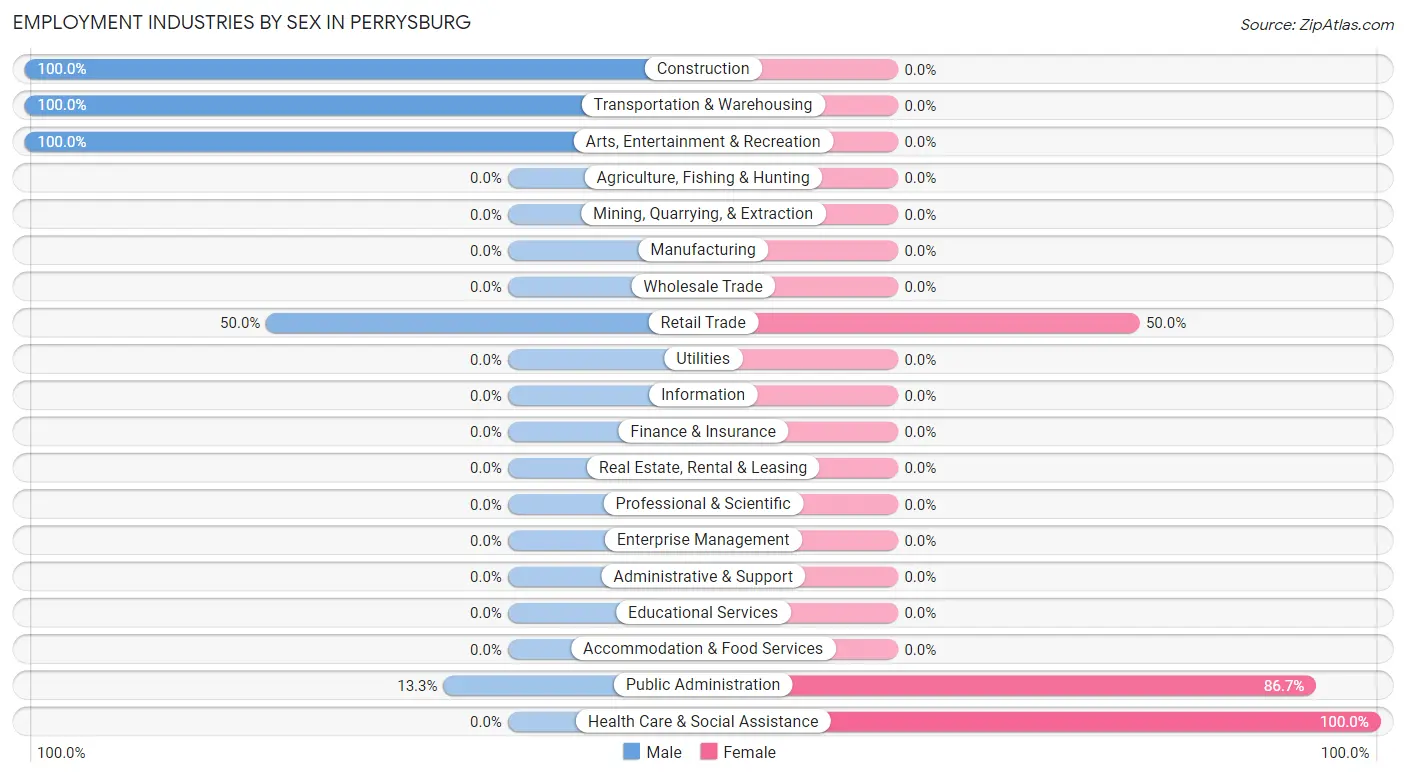
| Industry | Male | Female |
| Agriculture, Fishing & Hunting | 0 (0.0%) | 0 (0.0%) |
| Mining, Quarrying, & Extraction | 0 (0.0%) | 0 (0.0%) |
| Construction | 18 (100.0%) | 0 (0.0%) |
| Manufacturing | 0 (0.0%) | 0 (0.0%) |
| Wholesale Trade | 0 (0.0%) | 0 (0.0%) |
| Retail Trade | 17 (50.0%) | 17 (50.0%) |
| Transportation & Warehousing | 5 (100.0%) | 0 (0.0%) |
| Utilities | 0 (0.0%) | 0 (0.0%) |
| Information | 0 (0.0%) | 0 (0.0%) |
| Finance & Insurance | 0 (0.0%) | 0 (0.0%) |
| Real Estate, Rental & Leasing | 0 (0.0%) | 0 (0.0%) |
| Professional & Scientific | 0 (0.0%) | 0 (0.0%) |
| Enterprise Management | 0 (0.0%) | 0 (0.0%) |
| Administrative & Support | 0 (0.0%) | 0 (0.0%) |
| Educational Services | 0 (0.0%) | 0 (0.0%) |
| Health Care & Social Assistance | 0 (0.0%) | 9 (100.0%) |
| Arts, Entertainment & Recreation | 5 (100.0%) | 0 (0.0%) |
| Accommodation & Food Services | 0 (0.0%) | 0 (0.0%) |
| Public Administration | 2 (13.3%) | 13 (86.7%) |
| Total | 47 (54.6%) | 39 (45.4%) |
Education in Perrysburg
School Enrollment in Perrysburg
The most common levels of schooling among the 73 students in Perrysburg are high school (33 | 45.2%), elementary school (24 | 32.9%), and college / undergraduate (16 | 21.9%).
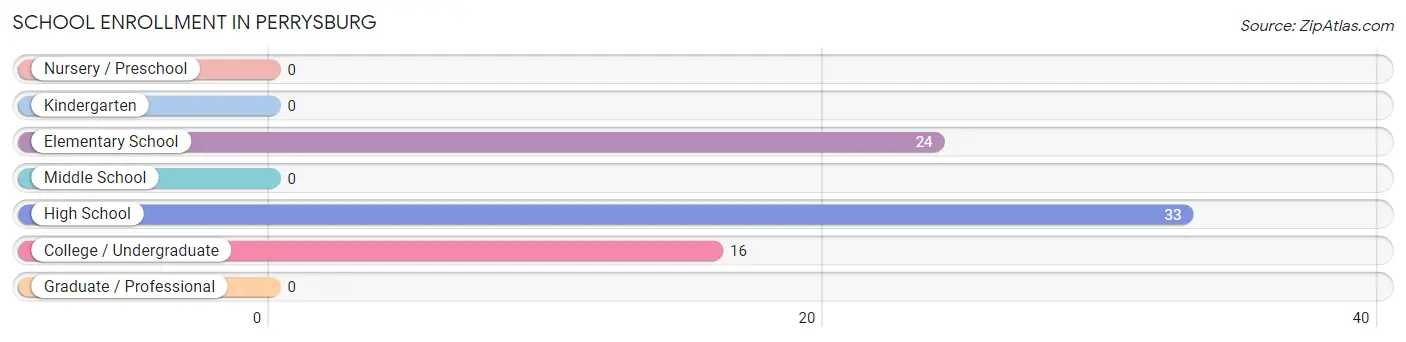
| School Level | # Students | % Students |
| Nursery / Preschool | 0 | 0.0% |
| Kindergarten | 0 | 0.0% |
| Elementary School | 24 | 32.9% |
| Middle School | 0 | 0.0% |
| High School | 33 | 45.2% |
| College / Undergraduate | 16 | 21.9% |
| Graduate / Professional | 0 | 0.0% |
| Total | 73 | 100.0% |
School Enrollment by Age by Funding Source in Perrysburg
Out of a total of 73 students who are enrolled in schools in Perrysburg, 5 (6.8%) attend a private institution, while the remaining 68 (93.2%) are enrolled in public schools. The age group of 20 to 24 year olds has the highest likelihood of being enrolled in private schools, with 5 (71.4% in the age bracket) enrolled. Conversely, the age group of 5 to 9 year old has the lowest likelihood of being enrolled in a private school, with 11 (100.0% in the age bracket) attending a public institution.
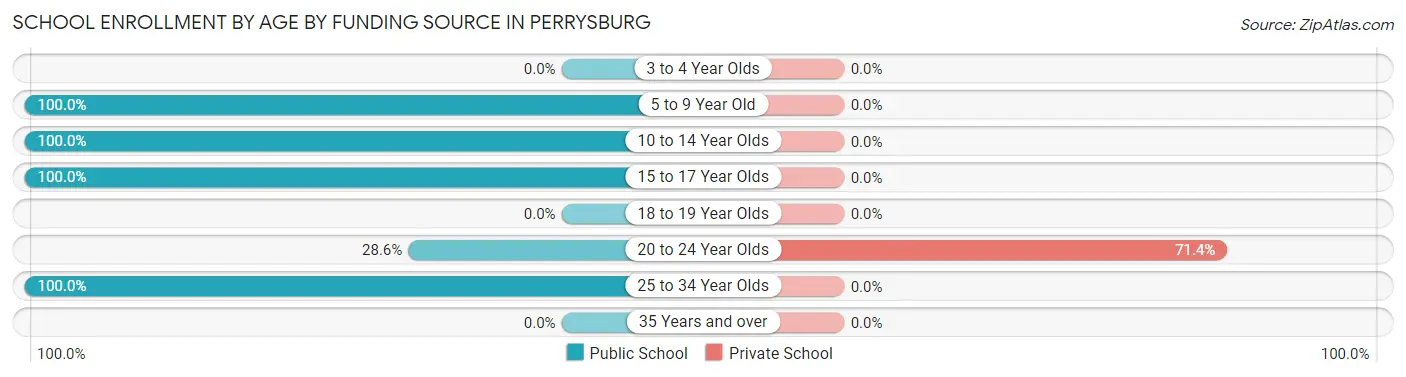
| Age Bracket | Public School | Private School |
| 3 to 4 Year Olds | 0 (0.0%) | 0 (0.0%) |
| 5 to 9 Year Old | 11 (100.0%) | 0 (0.0%) |
| 10 to 14 Year Olds | 20 (100.0%) | 0 (0.0%) |
| 15 to 17 Year Olds | 26 (100.0%) | 0 (0.0%) |
| 18 to 19 Year Olds | 0 (0.0%) | 0 (0.0%) |
| 20 to 24 Year Olds | 2 (28.6%) | 5 (71.4%) |
| 25 to 34 Year Olds | 9 (100.0%) | 0 (0.0%) |
| 35 Years and over | 0 (0.0%) | 0 (0.0%) |
| Total | 68 (93.2%) | 5 (6.8%) |
Educational Attainment by Field of Study in Perrysburg
Arts & humanities (42 | 64.6%), business (19 | 29.2%), and literature & languages (4 | 6.1%) are the most common fields of study among 65 individuals in Perrysburg who have obtained a bachelor's degree or higher.
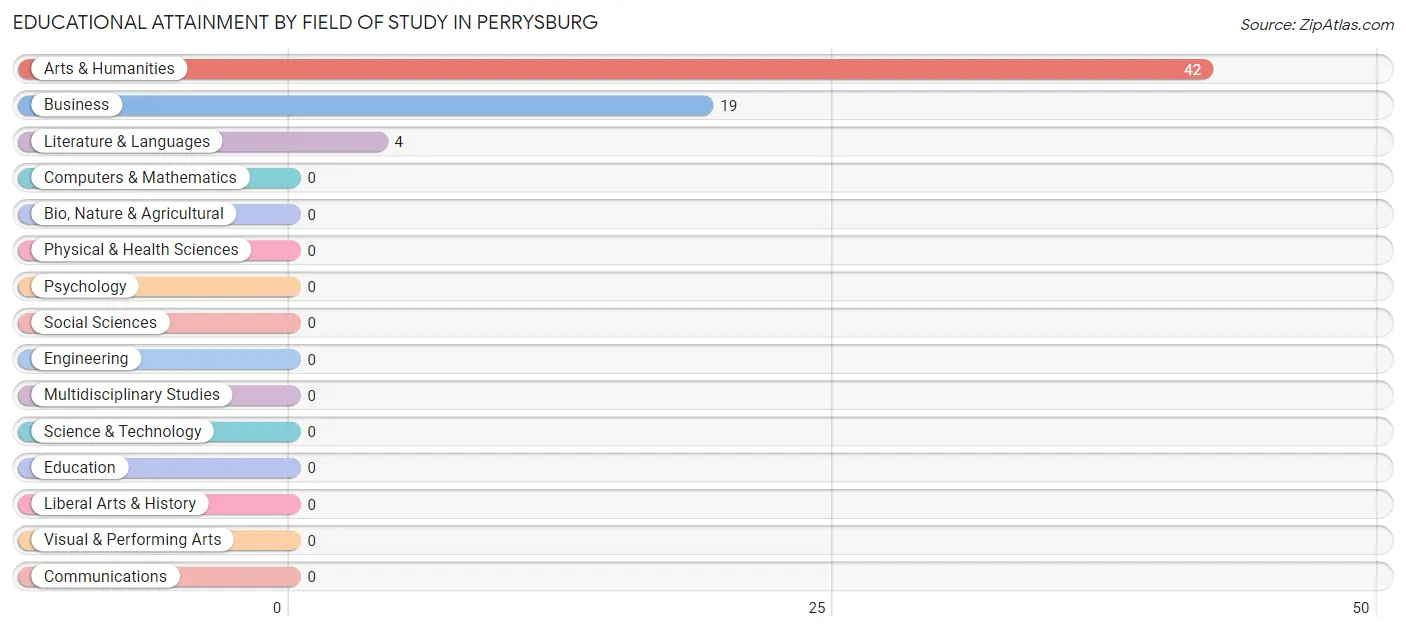
| Field of Study | # Graduates | % Graduates |
| Computers & Mathematics | 0 | 0.0% |
| Bio, Nature & Agricultural | 0 | 0.0% |
| Physical & Health Sciences | 0 | 0.0% |
| Psychology | 0 | 0.0% |
| Social Sciences | 0 | 0.0% |
| Engineering | 0 | 0.0% |
| Multidisciplinary Studies | 0 | 0.0% |
| Science & Technology | 0 | 0.0% |
| Business | 19 | 29.2% |
| Education | 0 | 0.0% |
| Literature & Languages | 4 | 6.1% |
| Liberal Arts & History | 0 | 0.0% |
| Visual & Performing Arts | 0 | 0.0% |
| Communications | 0 | 0.0% |
| Arts & Humanities | 42 | 64.6% |
| Total | 65 | 100.0% |
Transportation & Commute in Perrysburg
Vehicle Availability by Sex in Perrysburg
The most prevalent vehicle ownership categories in Perrysburg are males with 2 vehicles (29, accounting for 61.7%) and females with 2 vehicles (16, making up 74.4%).
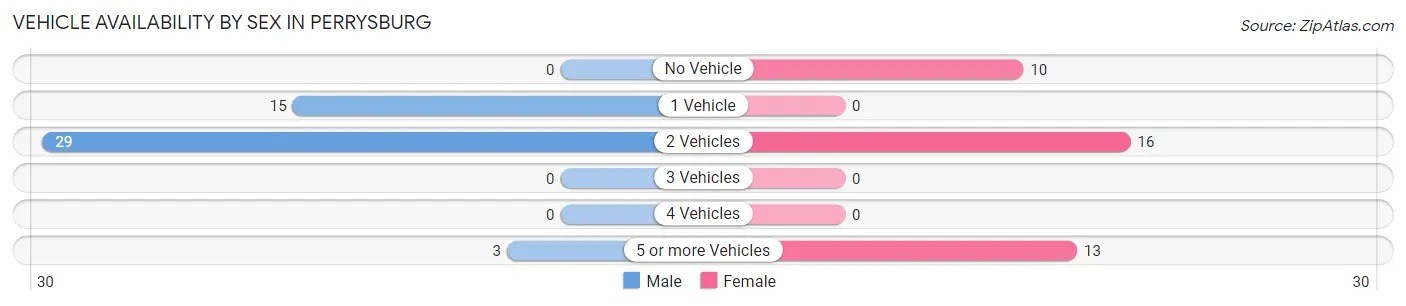
| Vehicles Available | Male | Female |
| No Vehicle | 0 (0.0%) | 10 (25.6%) |
| 1 Vehicle | 15 (31.9%) | 0 (0.0%) |
| 2 Vehicles | 29 (61.7%) | 16 (41.0%) |
| 3 Vehicles | 0 (0.0%) | 0 (0.0%) |
| 4 Vehicles | 0 (0.0%) | 0 (0.0%) |
| 5 or more Vehicles | 3 (6.4%) | 13 (33.3%) |
| Total | 47 (100.0%) | 39 (100.0%) |
Commute Time in Perrysburg
The most frequently occuring commute durations in Perrysburg are 5 to 9 minutes (29 commuters, 33.7%), 45 to 59 minutes (15 commuters, 17.4%), and 15 to 19 minutes (12 commuters, 14.0%).
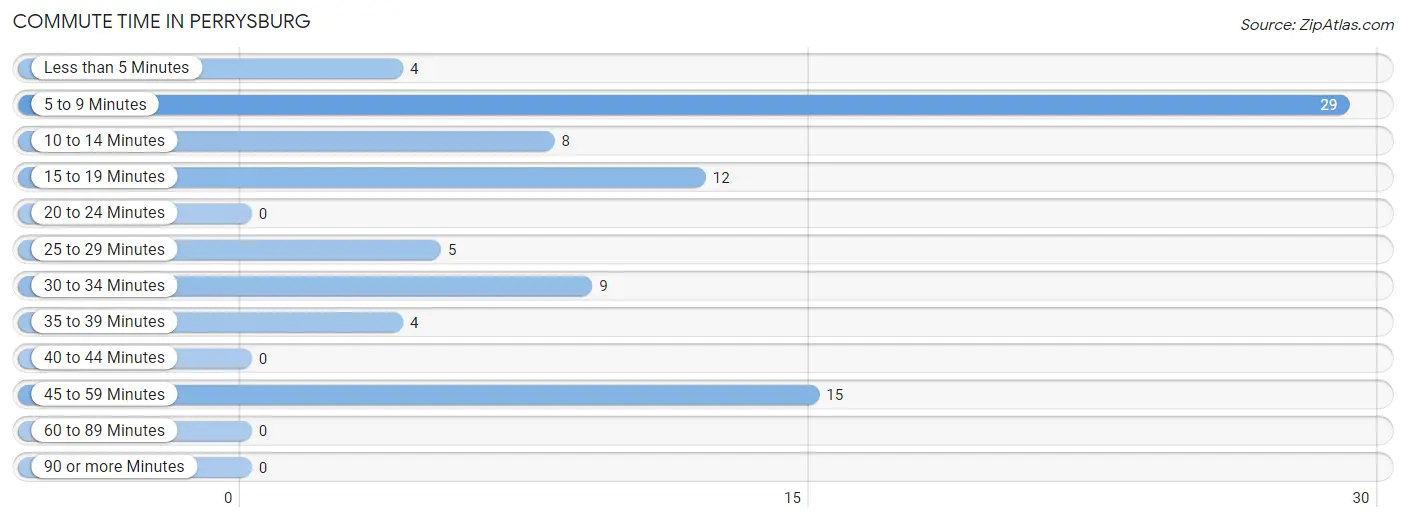
| Commute Time | # Commuters | % Commuters |
| Less than 5 Minutes | 4 | 4.6% |
| 5 to 9 Minutes | 29 | 33.7% |
| 10 to 14 Minutes | 8 | 9.3% |
| 15 to 19 Minutes | 12 | 14.0% |
| 20 to 24 Minutes | 0 | 0.0% |
| 25 to 29 Minutes | 5 | 5.8% |
| 30 to 34 Minutes | 9 | 10.5% |
| 35 to 39 Minutes | 4 | 4.6% |
| 40 to 44 Minutes | 0 | 0.0% |
| 45 to 59 Minutes | 15 | 17.4% |
| 60 to 89 Minutes | 0 | 0.0% |
| 90 or more Minutes | 0 | 0.0% |
Commute Time by Sex in Perrysburg
The most common commute times in Perrysburg are 5 to 9 minutes (19 commuters, 40.4%) for males and 5 to 9 minutes (10 commuters, 25.6%) for females.
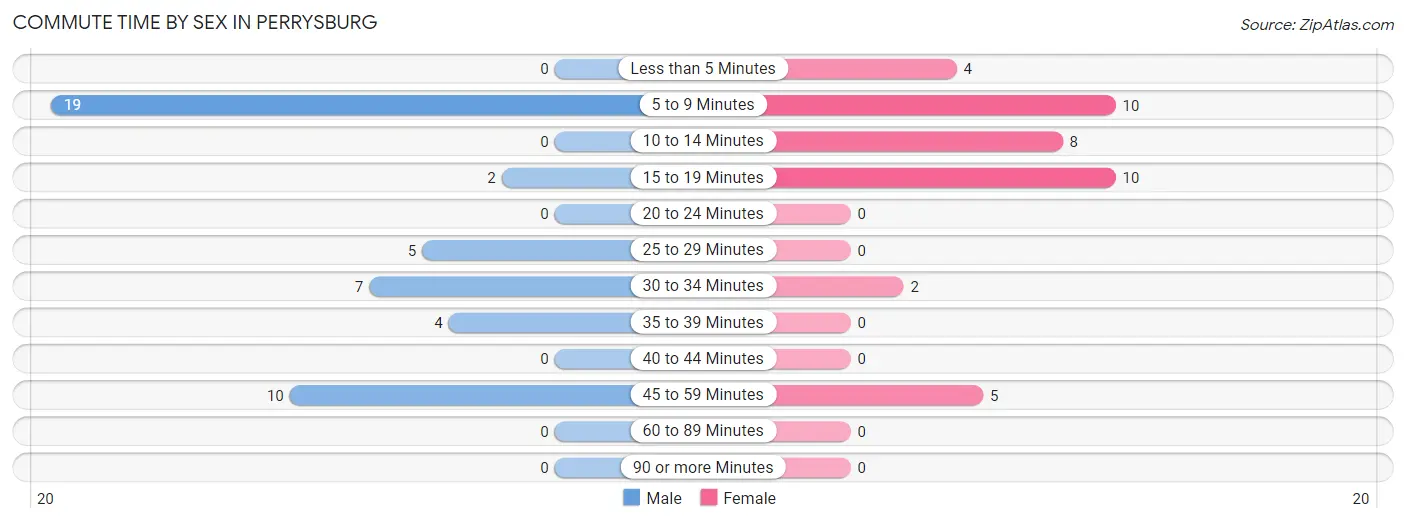
| Commute Time | Male | Female |
| Less than 5 Minutes | 0 (0.0%) | 4 (10.3%) |
| 5 to 9 Minutes | 19 (40.4%) | 10 (25.6%) |
| 10 to 14 Minutes | 0 (0.0%) | 8 (20.5%) |
| 15 to 19 Minutes | 2 (4.3%) | 10 (25.6%) |
| 20 to 24 Minutes | 0 (0.0%) | 0 (0.0%) |
| 25 to 29 Minutes | 5 (10.6%) | 0 (0.0%) |
| 30 to 34 Minutes | 7 (14.9%) | 2 (5.1%) |
| 35 to 39 Minutes | 4 (8.5%) | 0 (0.0%) |
| 40 to 44 Minutes | 0 (0.0%) | 0 (0.0%) |
| 45 to 59 Minutes | 10 (21.3%) | 5 (12.8%) |
| 60 to 89 Minutes | 0 (0.0%) | 0 (0.0%) |
| 90 or more Minutes | 0 (0.0%) | 0 (0.0%) |
Time of Departure to Work by Sex in Perrysburg
The most frequent times of departure to work in Perrysburg are 6:30 AM to 6:59 AM (21, 44.7%) for males and 9:00 AM to 9:59 AM (10, 25.6%) for females.
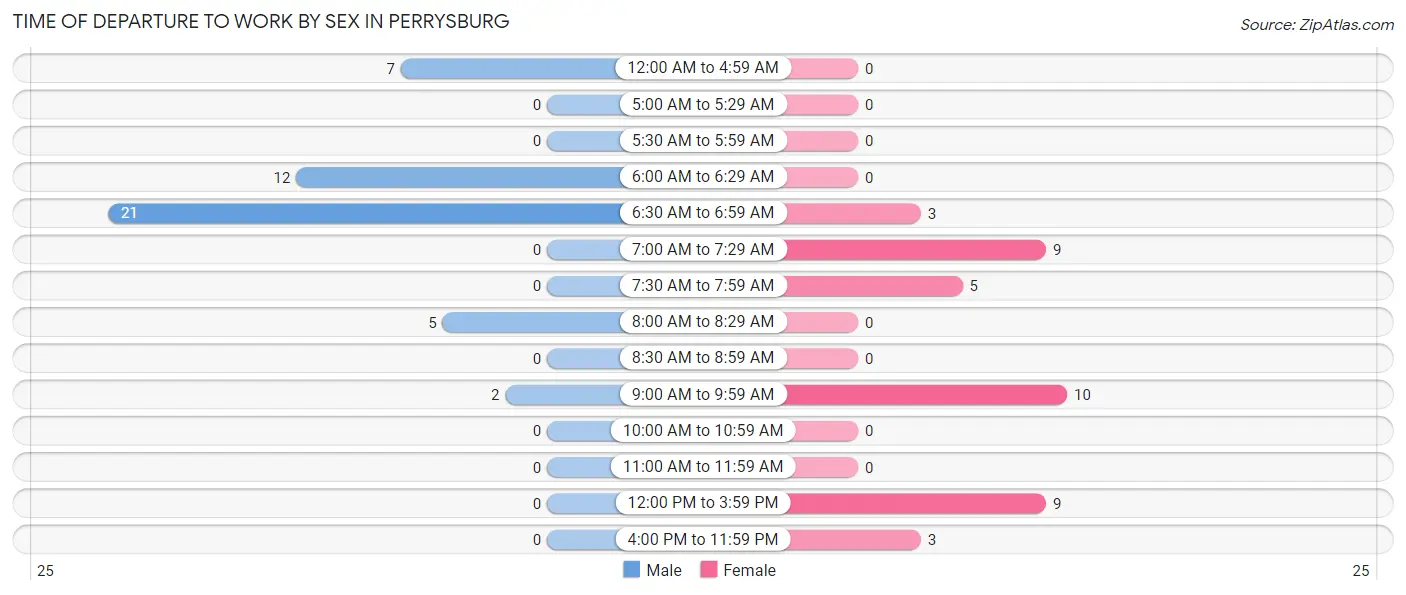
| Time of Departure | Male | Female |
| 12:00 AM to 4:59 AM | 7 (14.9%) | 0 (0.0%) |
| 5:00 AM to 5:29 AM | 0 (0.0%) | 0 (0.0%) |
| 5:30 AM to 5:59 AM | 0 (0.0%) | 0 (0.0%) |
| 6:00 AM to 6:29 AM | 12 (25.5%) | 0 (0.0%) |
| 6:30 AM to 6:59 AM | 21 (44.7%) | 3 (7.7%) |
| 7:00 AM to 7:29 AM | 0 (0.0%) | 9 (23.1%) |
| 7:30 AM to 7:59 AM | 0 (0.0%) | 5 (12.8%) |
| 8:00 AM to 8:29 AM | 5 (10.6%) | 0 (0.0%) |
| 8:30 AM to 8:59 AM | 0 (0.0%) | 0 (0.0%) |
| 9:00 AM to 9:59 AM | 2 (4.3%) | 10 (25.6%) |
| 10:00 AM to 10:59 AM | 0 (0.0%) | 0 (0.0%) |
| 11:00 AM to 11:59 AM | 0 (0.0%) | 0 (0.0%) |
| 12:00 PM to 3:59 PM | 0 (0.0%) | 9 (23.1%) |
| 4:00 PM to 11:59 PM | 0 (0.0%) | 3 (7.7%) |
| Total | 47 (100.0%) | 39 (100.0%) |
Housing Occupancy in Perrysburg
Occupancy by Ownership in Perrysburg
Of the total 105 dwellings in Perrysburg, owner-occupied units account for 77 (73.3%), while renter-occupied units make up 28 (26.7%).
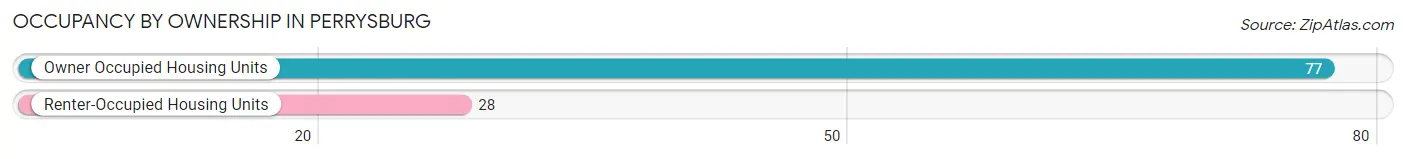
| Occupancy | # Housing Units | % Housing Units |
| Owner Occupied Housing Units | 77 | 73.3% |
| Renter-Occupied Housing Units | 28 | 26.7% |
| Total Occupied Housing Units | 105 | 100.0% |
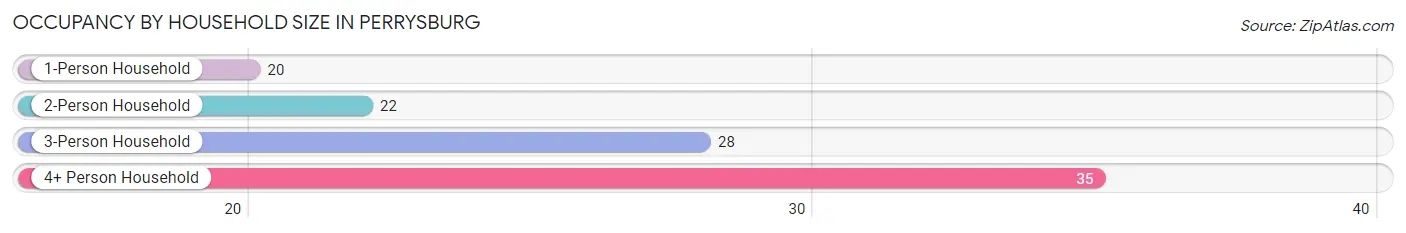
Occupancy by Household Size in Perrysburg
| Household Size | # Housing Units | % Housing Units |
| 1-Person Household | 20 | 19.1% |
| 2-Person Household | 22 | 20.9% |
| 3-Person Household | 28 | 26.7% |
| 4+ Person Household | 35 | 33.3% |
| Total Housing Units | 105 | 100.0% |
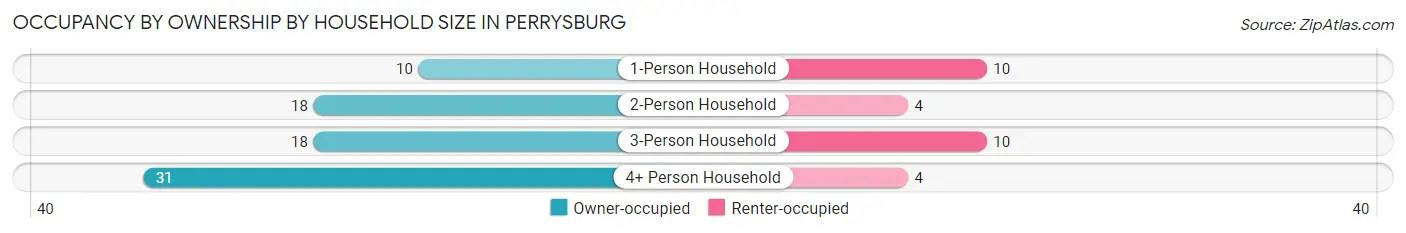
Occupancy by Ownership by Household Size in Perrysburg
| Household Size | Owner-occupied | Renter-occupied |
| 1-Person Household | 10 (50.0%) | 10 (50.0%) |
| 2-Person Household | 18 (81.8%) | 4 (18.2%) |
| 3-Person Household | 18 (64.3%) | 10 (35.7%) |
| 4+ Person Household | 31 (88.6%) | 4 (11.4%) |
| Total Housing Units | 77 (73.3%) | 28 (26.7%) |
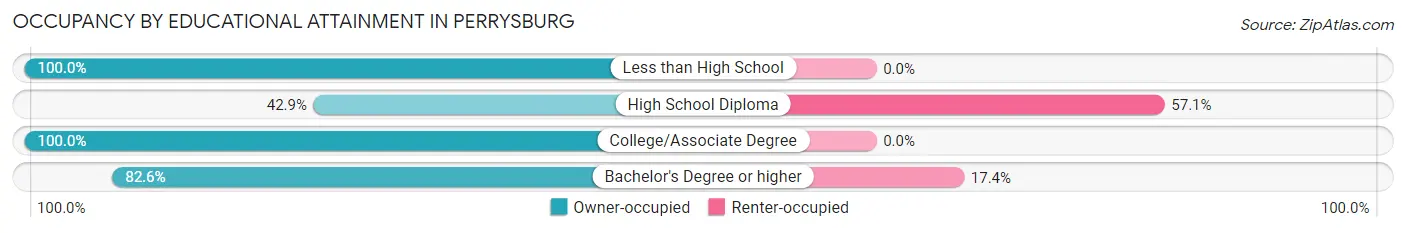
Occupancy by Educational Attainment in Perrysburg
| Household Size | Owner-occupied | Renter-occupied |
| Less than High School | 4 (100.0%) | 0 (0.0%) |
| High School Diploma | 18 (42.9%) | 24 (57.1%) |
| College/Associate Degree | 36 (100.0%) | 0 (0.0%) |
| Bachelor's Degree or higher | 19 (82.6%) | 4 (17.4%) |
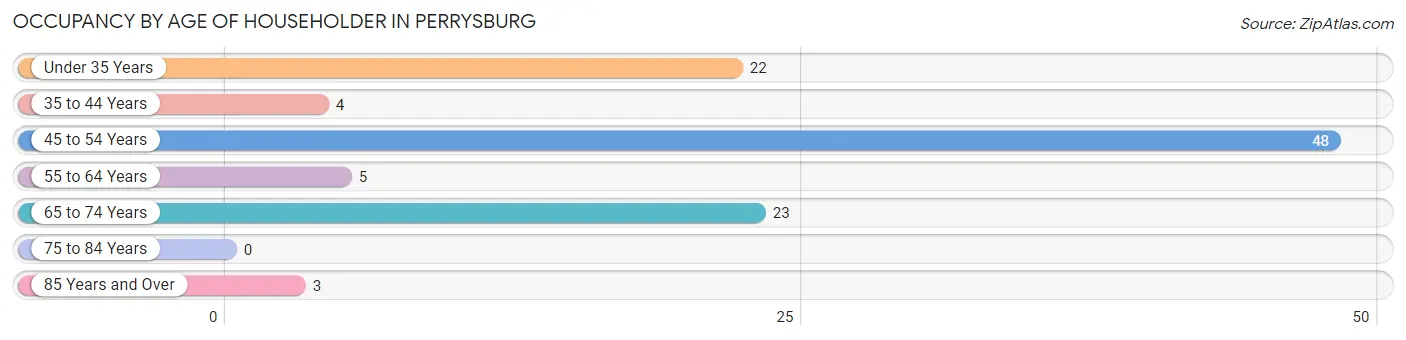
Occupancy by Age of Householder in Perrysburg
| Age Bracket | # Households | % Households |
| Under 35 Years | 22 | 20.9% |
| 35 to 44 Years | 4 | 3.8% |
| 45 to 54 Years | 48 | 45.7% |
| 55 to 64 Years | 5 | 4.8% |
| 65 to 74 Years | 23 | 21.9% |
| 75 to 84 Years | 0 | 0.0% |
| 85 Years and Over | 3 | 2.9% |
| Total | 105 | 100.0% |
Housing Finances in Perrysburg
Median Income by Occupancy in Perrysburg
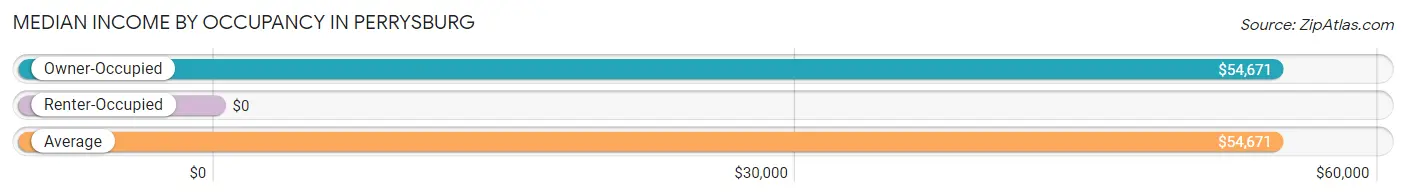
| Occupancy Type | # Households | Median Income |
| Owner-Occupied | 77 (73.3%) | $54,671 |
| Renter-Occupied | 28 (26.7%) | $0 |
| Average | 105 (100.0%) | $54,671 |
Occupancy by Householder Income Bracket in Perrysburg
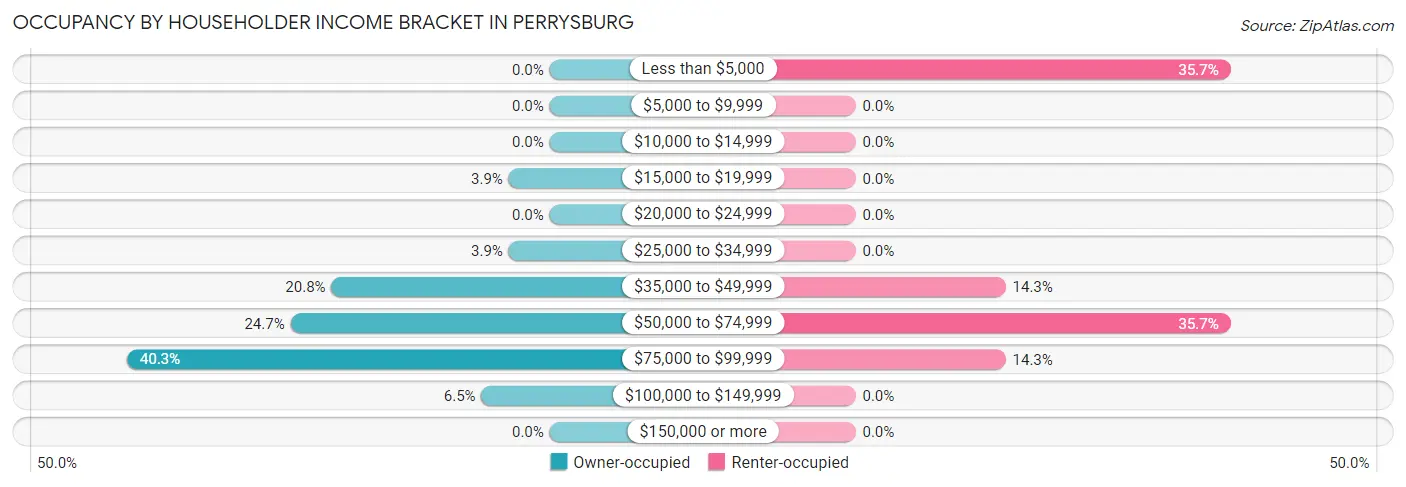
| Income Bracket | Owner-occupied | Renter-occupied |
| Less than $5,000 | 0 (0.0%) | 10 (35.7%) |
| $5,000 to $9,999 | 0 (0.0%) | 0 (0.0%) |
| $10,000 to $14,999 | 0 (0.0%) | 0 (0.0%) |
| $15,000 to $19,999 | 3 (3.9%) | 0 (0.0%) |
| $20,000 to $24,999 | 0 (0.0%) | 0 (0.0%) |
| $25,000 to $34,999 | 3 (3.9%) | 0 (0.0%) |
| $35,000 to $49,999 | 16 (20.8%) | 4 (14.3%) |
| $50,000 to $74,999 | 19 (24.7%) | 10 (35.7%) |
| $75,000 to $99,999 | 31 (40.3%) | 4 (14.3%) |
| $100,000 to $149,999 | 5 (6.5%) | 0 (0.0%) |
| $150,000 or more | 0 (0.0%) | 0 (0.0%) |
| Total | 77 (100.0%) | 28 (100.0%) |
Monthly Housing Cost Tiers in Perrysburg
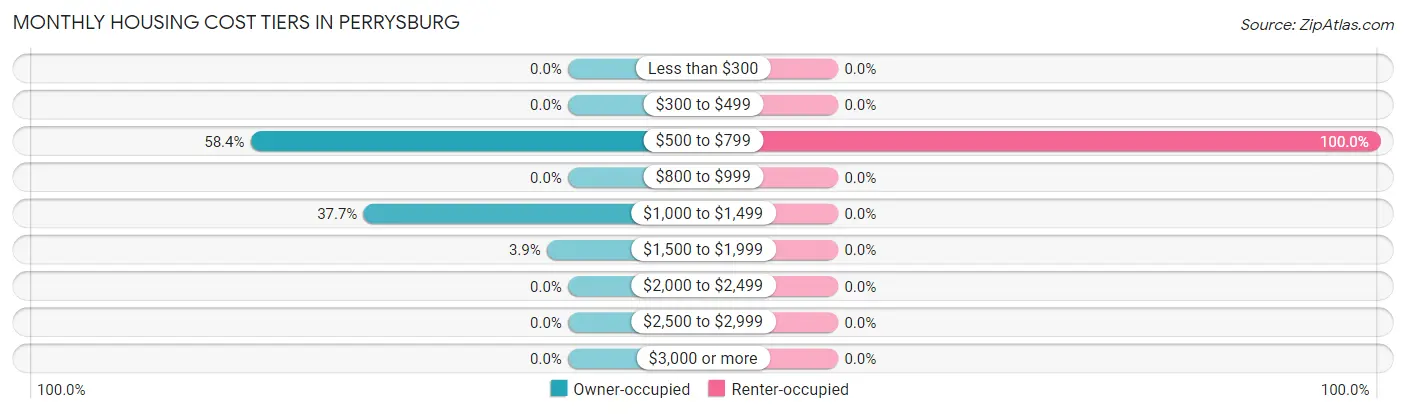
| Monthly Cost | Owner-occupied | Renter-occupied |
| Less than $300 | 0 (0.0%) | 0 (0.0%) |
| $300 to $499 | 0 (0.0%) | 0 (0.0%) |
| $500 to $799 | 45 (58.4%) | 28 (100.0%) |
| $800 to $999 | 0 (0.0%) | 0 (0.0%) |
| $1,000 to $1,499 | 29 (37.7%) | 0 (0.0%) |
| $1,500 to $1,999 | 3 (3.9%) | 0 (0.0%) |
| $2,000 to $2,499 | 0 (0.0%) | 0 (0.0%) |
| $2,500 to $2,999 | 0 (0.0%) | 0 (0.0%) |
| $3,000 or more | 0 (0.0%) | 0 (0.0%) |
| Total | 77 (100.0%) | 28 (100.0%) |
Physical Housing Characteristics in Perrysburg
Housing Structures in Perrysburg
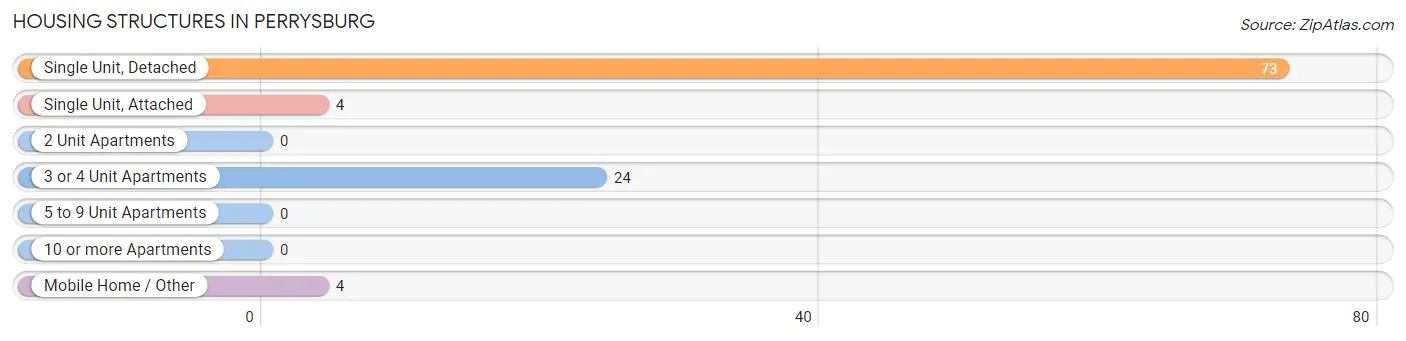
| Structure Type | # Housing Units | % Housing Units |
| Single Unit, Detached | 73 | 69.5% |
| Single Unit, Attached | 4 | 3.8% |
| 2 Unit Apartments | 0 | 0.0% |
| 3 or 4 Unit Apartments | 24 | 22.9% |
| 5 to 9 Unit Apartments | 0 | 0.0% |
| 10 or more Apartments | 0 | 0.0% |
| Mobile Home / Other | 4 | 3.8% |
| Total | 105 | 100.0% |
Housing Structures by Occupancy in Perrysburg
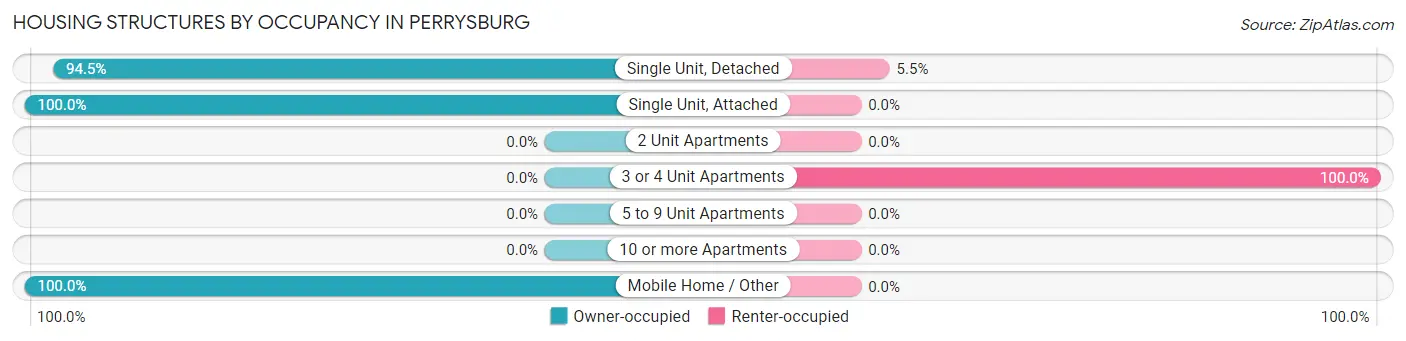
| Structure Type | Owner-occupied | Renter-occupied |
| Single Unit, Detached | 69 (94.5%) | 4 (5.5%) |
| Single Unit, Attached | 4 (100.0%) | 0 (0.0%) |
| 2 Unit Apartments | 0 (0.0%) | 0 (0.0%) |
| 3 or 4 Unit Apartments | 0 (0.0%) | 24 (100.0%) |
| 5 to 9 Unit Apartments | 0 (0.0%) | 0 (0.0%) |
| 10 or more Apartments | 0 (0.0%) | 0 (0.0%) |
| Mobile Home / Other | 4 (100.0%) | 0 (0.0%) |
| Total | 77 (73.3%) | 28 (26.7%) |
Housing Structures by Number of Rooms in Perrysburg
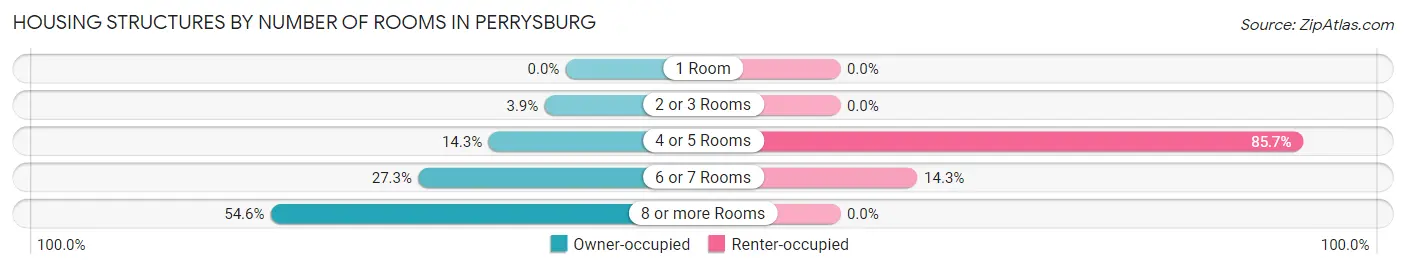
| Number of Rooms | Owner-occupied | Renter-occupied |
| 1 Room | 0 (0.0%) | 0 (0.0%) |
| 2 or 3 Rooms | 3 (3.9%) | 0 (0.0%) |
| 4 or 5 Rooms | 11 (14.3%) | 24 (85.7%) |
| 6 or 7 Rooms | 21 (27.3%) | 4 (14.3%) |
| 8 or more Rooms | 42 (54.5%) | 0 (0.0%) |
| Total | 77 (100.0%) | 28 (100.0%) |
Housing Structure by Heating Type in Perrysburg
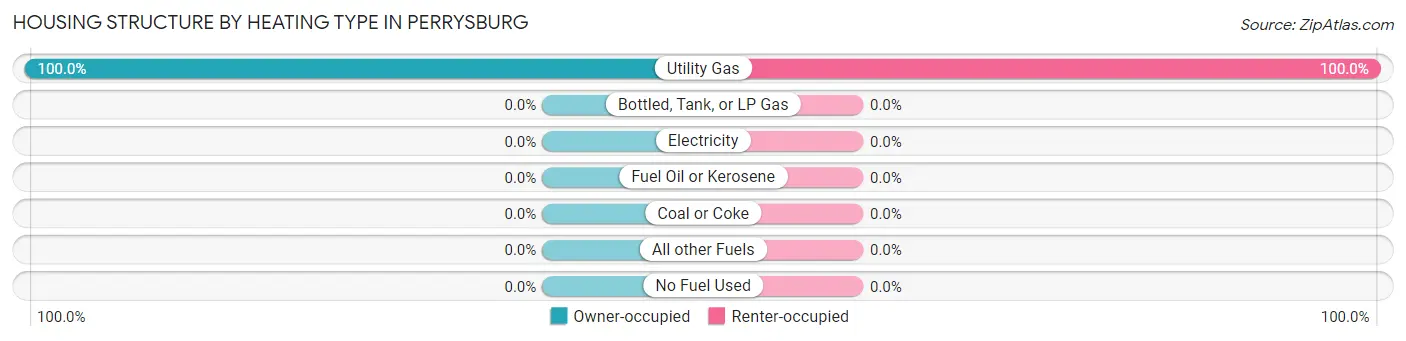
| Heating Type | Owner-occupied | Renter-occupied |
| Utility Gas | 77 (100.0%) | 28 (100.0%) |
| Bottled, Tank, or LP Gas | 0 (0.0%) | 0 (0.0%) |
| Electricity | 0 (0.0%) | 0 (0.0%) |
| Fuel Oil or Kerosene | 0 (0.0%) | 0 (0.0%) |
| Coal or Coke | 0 (0.0%) | 0 (0.0%) |
| All other Fuels | 0 (0.0%) | 0 (0.0%) |
| No Fuel Used | 0 (0.0%) | 0 (0.0%) |
| Total | 77 (100.0%) | 28 (100.0%) |
Household Vehicle Usage in Perrysburg
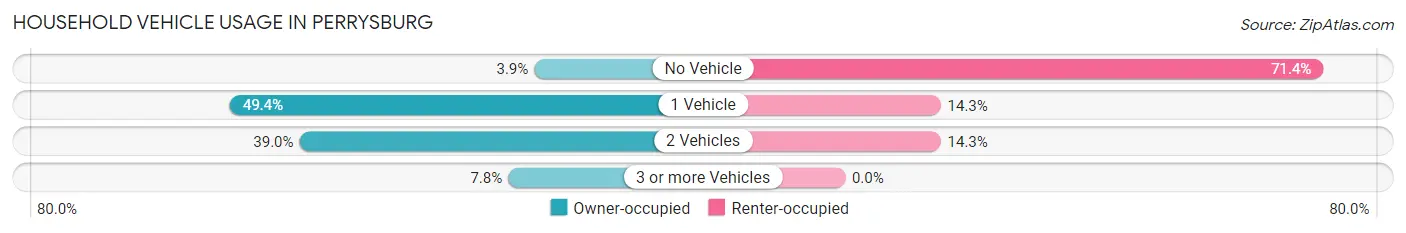
| Vehicles per Household | Owner-occupied | Renter-occupied |
| No Vehicle | 3 (3.9%) | 20 (71.4%) |
| 1 Vehicle | 38 (49.3%) | 4 (14.3%) |
| 2 Vehicles | 30 (39.0%) | 4 (14.3%) |
| 3 or more Vehicles | 6 (7.8%) | 0 (0.0%) |
| Total | 77 (100.0%) | 28 (100.0%) |
Real Estate & Mortgages in Perrysburg
Real Estate and Mortgage Overview in Perrysburg
| Characteristic | Without Mortgage | With Mortgage |
| Housing Units | 45 | 32 |
| Median Property Value | $89,600 | $110,900 |
| Median Household Income | $54,276 | $0 |
| Monthly Housing Costs | $561 | $0 |
| Real Estate Taxes | $3,100 | $0 |
Property Value by Mortgage Status in Perrysburg
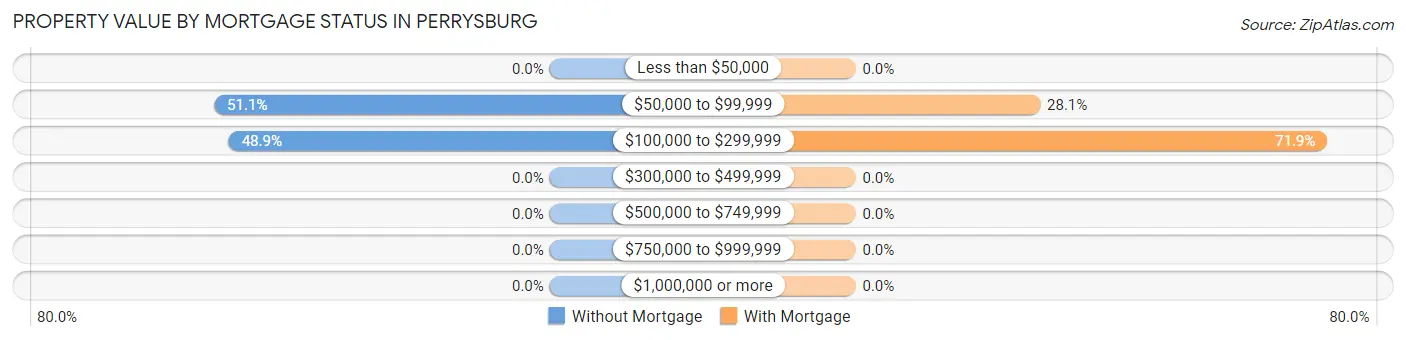
| Property Value | Without Mortgage | With Mortgage |
| Less than $50,000 | 0 (0.0%) | 0 (0.0%) |
| $50,000 to $99,999 | 23 (51.1%) | 9 (28.1%) |
| $100,000 to $299,999 | 22 (48.9%) | 23 (71.9%) |
| $300,000 to $499,999 | 0 (0.0%) | 0 (0.0%) |
| $500,000 to $749,999 | 0 (0.0%) | 0 (0.0%) |
| $750,000 to $999,999 | 0 (0.0%) | 0 (0.0%) |
| $1,000,000 or more | 0 (0.0%) | 0 (0.0%) |
| Total | 45 (100.0%) | 32 (100.0%) |
Household Income by Mortgage Status in Perrysburg
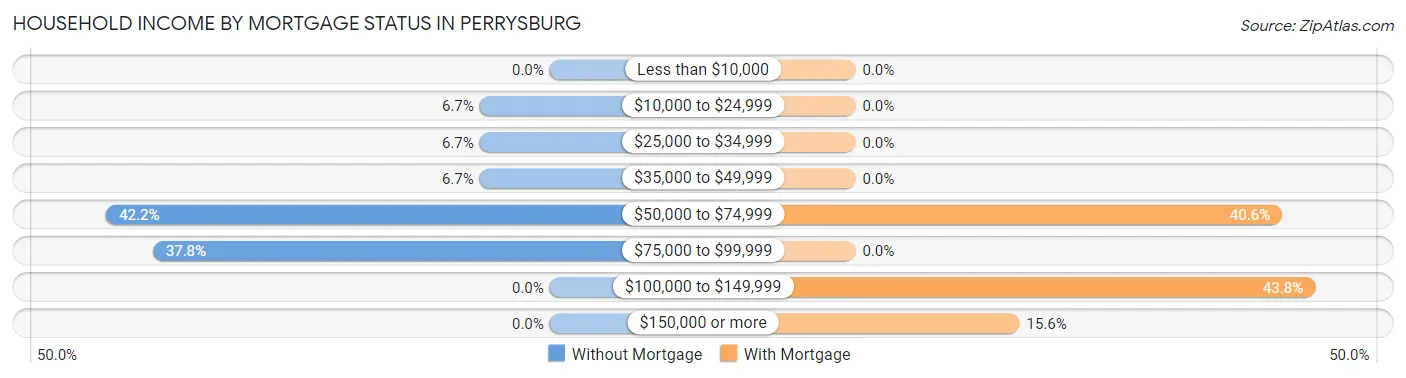
| Household Income | Without Mortgage | With Mortgage |
| Less than $10,000 | 0 (0.0%) | 0 (0.0%) |
| $10,000 to $24,999 | 3 (6.7%) | 0 (0.0%) |
| $25,000 to $34,999 | 3 (6.7%) | 0 (0.0%) |
| $35,000 to $49,999 | 3 (6.7%) | 0 (0.0%) |
| $50,000 to $74,999 | 19 (42.2%) | 13 (40.6%) |
| $75,000 to $99,999 | 17 (37.8%) | 0 (0.0%) |
| $100,000 to $149,999 | 0 (0.0%) | 14 (43.8%) |
| $150,000 or more | 0 (0.0%) | 5 (15.6%) |
| Total | 45 (100.0%) | 32 (100.0%) |
Property Value to Household Income Ratio in Perrysburg
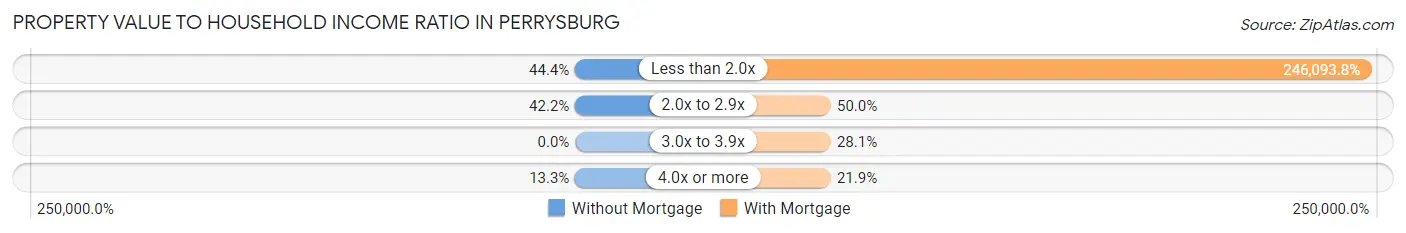
| Value-to-Income Ratio | Without Mortgage | With Mortgage |
| Less than 2.0x | 20 (44.4%) | 78,750 (246,093.8%) |
| 2.0x to 2.9x | 19 (42.2%) | 16 (50.0%) |
| 3.0x to 3.9x | 0 (0.0%) | 9 (28.1%) |
| 4.0x or more | 6 (13.3%) | 7 (21.9%) |
| Total | 45 (100.0%) | 32 (100.0%) |
Real Estate Taxes by Mortgage Status in Perrysburg
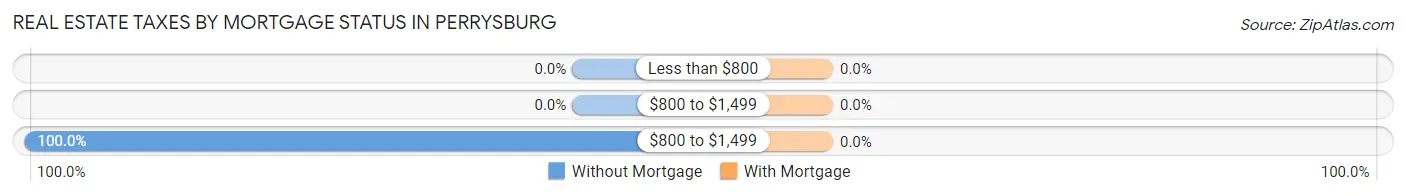
| Property Taxes | Without Mortgage | With Mortgage |
| Less than $800 | 0 (0.0%) | 0 (0.0%) |
| $800 to $1,499 | 0 (0.0%) | 0 (0.0%) |
| $800 to $1,499 | 45 (100.0%) | 0 (0.0%) |
| Total | 45 (100.0%) | 32 (100.0%) |
Health & Disability in Perrysburg
Health Insurance Coverage by Age in Perrysburg
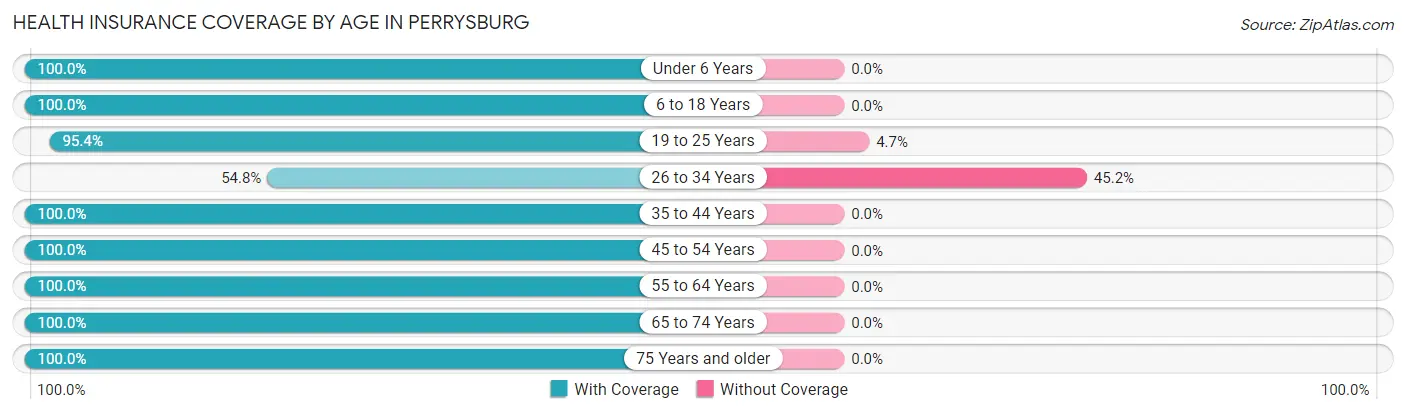
| Age Bracket | With Coverage | Without Coverage |
| Under 6 Years | 14 (100.0%) | 0 (0.0%) |
| 6 to 18 Years | 57 (100.0%) | 0 (0.0%) |
| 19 to 25 Years | 41 (95.4%) | 2 (4.6%) |
| 26 to 34 Years | 23 (54.8%) | 19 (45.2%) |
| 35 to 44 Years | 4 (100.0%) | 0 (0.0%) |
| 45 to 54 Years | 84 (100.0%) | 0 (0.0%) |
| 55 to 64 Years | 41 (100.0%) | 0 (0.0%) |
| 65 to 74 Years | 115 (100.0%) | 0 (0.0%) |
| 75 Years and older | 31 (100.0%) | 0 (0.0%) |
| Total | 410 (95.1%) | 21 (4.9%) |
Health Insurance Coverage by Citizenship Status in Perrysburg
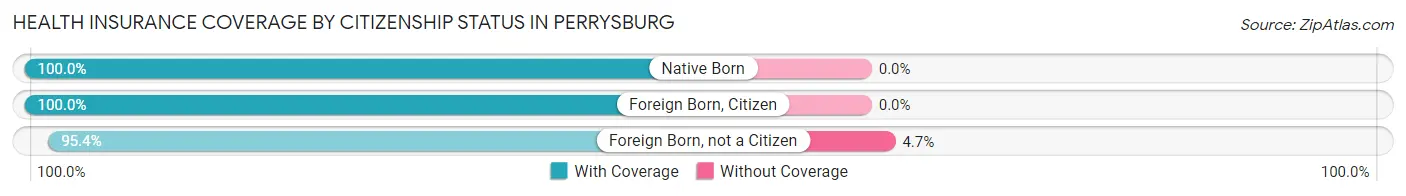
| Citizenship Status | With Coverage | Without Coverage |
| Native Born | 14 (100.0%) | 0 (0.0%) |
| Foreign Born, Citizen | 57 (100.0%) | 0 (0.0%) |
| Foreign Born, not a Citizen | 41 (95.4%) | 2 (4.6%) |
Health Insurance Coverage by Household Income in Perrysburg
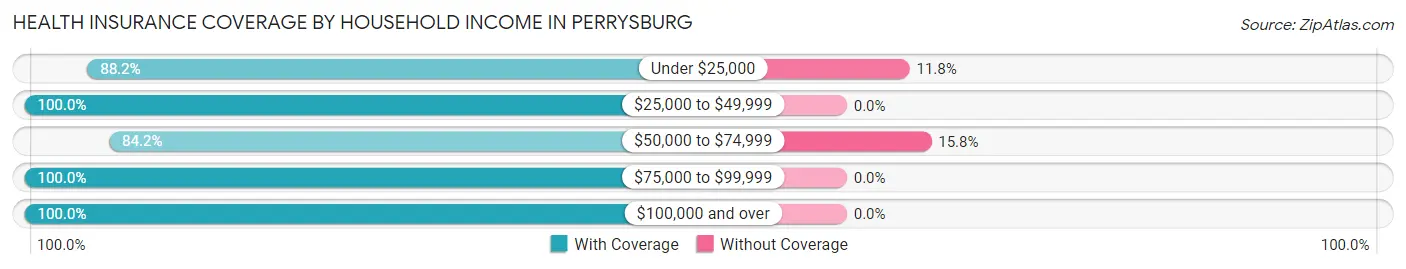
| Household Income | With Coverage | Without Coverage |
| Under $25,000 | 15 (88.2%) | 2 (11.8%) |
| $25,000 to $49,999 | 68 (100.0%) | 0 (0.0%) |
| $50,000 to $74,999 | 101 (84.2%) | 19 (15.8%) |
| $75,000 to $99,999 | 98 (100.0%) | 0 (0.0%) |
| $100,000 and over | 12 (100.0%) | 0 (0.0%) |
Public vs Private Health Insurance Coverage by Age in Perrysburg
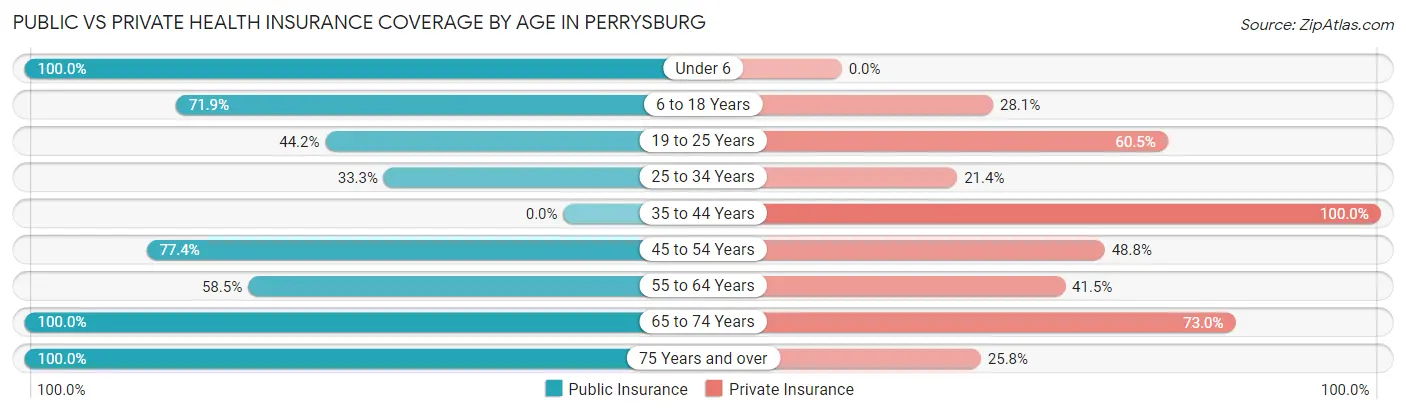
| Age Bracket | Public Insurance | Private Insurance |
| Under 6 | 14 (100.0%) | 0 (0.0%) |
| 6 to 18 Years | 41 (71.9%) | 16 (28.1%) |
| 19 to 25 Years | 19 (44.2%) | 26 (60.5%) |
| 25 to 34 Years | 14 (33.3%) | 9 (21.4%) |
| 35 to 44 Years | 0 (0.0%) | 4 (100.0%) |
| 45 to 54 Years | 65 (77.4%) | 41 (48.8%) |
| 55 to 64 Years | 24 (58.5%) | 17 (41.5%) |
| 65 to 74 Years | 115 (100.0%) | 84 (73.0%) |
| 75 Years and over | 31 (100.0%) | 8 (25.8%) |
| Total | 323 (74.9%) | 205 (47.6%) |
Disability Status by Sex by Age in Perrysburg
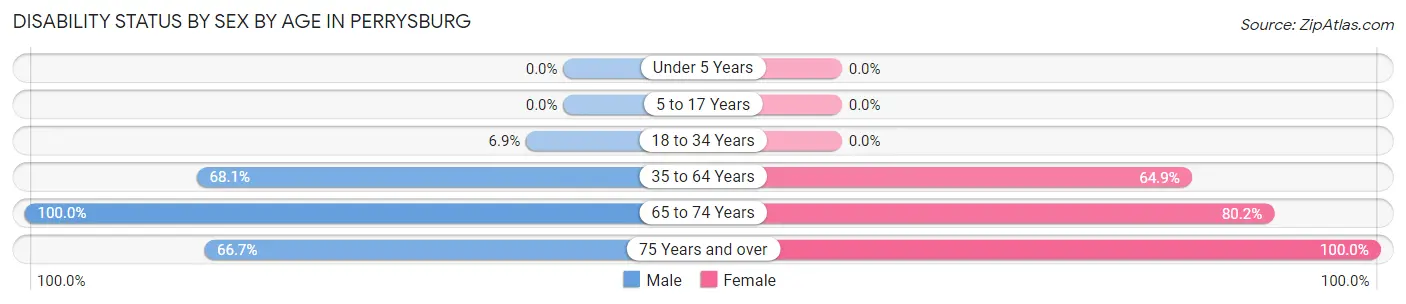
| Age Bracket | Male | Female |
| Under 5 Years | 0 (0.0%) | 0 (0.0%) |
| 5 to 17 Years | 0 (0.0%) | 0 (0.0%) |
| 18 to 34 Years | 4 (6.9%) | 0 (0.0%) |
| 35 to 64 Years | 49 (68.1%) | 37 (64.9%) |
| 65 to 74 Years | 19 (100.0%) | 77 (80.2%) |
| 75 Years and over | 10 (66.7%) | 16 (100.0%) |
Disability Class by Sex by Age in Perrysburg
Disability Class: Hearing Difficulty
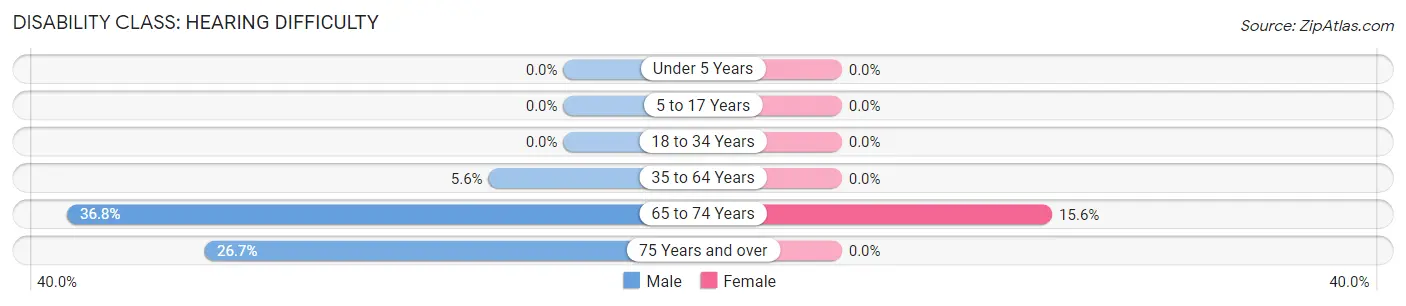
| Age Bracket | Male | Female |
| Under 5 Years | 0 (0.0%) | 0 (0.0%) |
| 5 to 17 Years | 0 (0.0%) | 0 (0.0%) |
| 18 to 34 Years | 0 (0.0%) | 0 (0.0%) |
| 35 to 64 Years | 4 (5.6%) | 0 (0.0%) |
| 65 to 74 Years | 7 (36.8%) | 15 (15.6%) |
| 75 Years and over | 4 (26.7%) | 0 (0.0%) |
Disability Class: Vision Difficulty
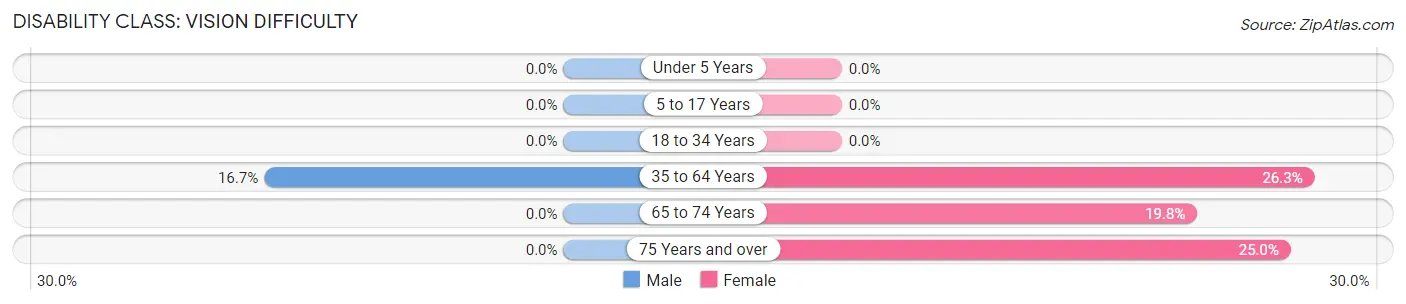
| Age Bracket | Male | Female |
| Under 5 Years | 0 (0.0%) | 0 (0.0%) |
| 5 to 17 Years | 0 (0.0%) | 0 (0.0%) |
| 18 to 34 Years | 0 (0.0%) | 0 (0.0%) |
| 35 to 64 Years | 12 (16.7%) | 15 (26.3%) |
| 65 to 74 Years | 0 (0.0%) | 19 (19.8%) |
| 75 Years and over | 0 (0.0%) | 4 (25.0%) |
Disability Class: Cognitive Difficulty
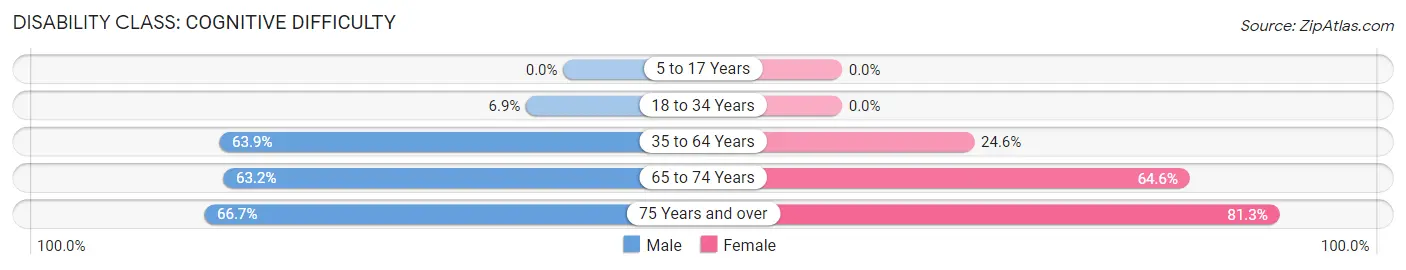
| Age Bracket | Male | Female |
| 5 to 17 Years | 0 (0.0%) | 0 (0.0%) |
| 18 to 34 Years | 4 (6.9%) | 0 (0.0%) |
| 35 to 64 Years | 46 (63.9%) | 14 (24.6%) |
| 65 to 74 Years | 12 (63.2%) | 62 (64.6%) |
| 75 Years and over | 10 (66.7%) | 13 (81.2%) |
Disability Class: Ambulatory Difficulty
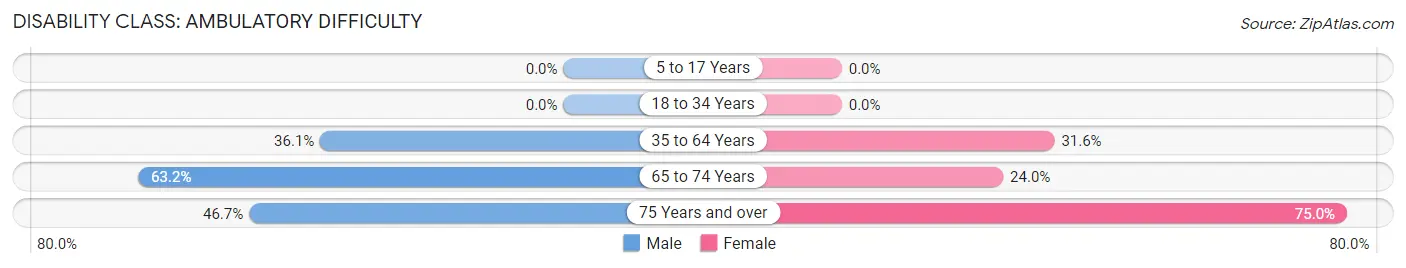
| Age Bracket | Male | Female |
| 5 to 17 Years | 0 (0.0%) | 0 (0.0%) |
| 18 to 34 Years | 0 (0.0%) | 0 (0.0%) |
| 35 to 64 Years | 26 (36.1%) | 18 (31.6%) |
| 65 to 74 Years | 12 (63.2%) | 23 (24.0%) |
| 75 Years and over | 7 (46.7%) | 12 (75.0%) |
Disability Class: Self-Care Difficulty
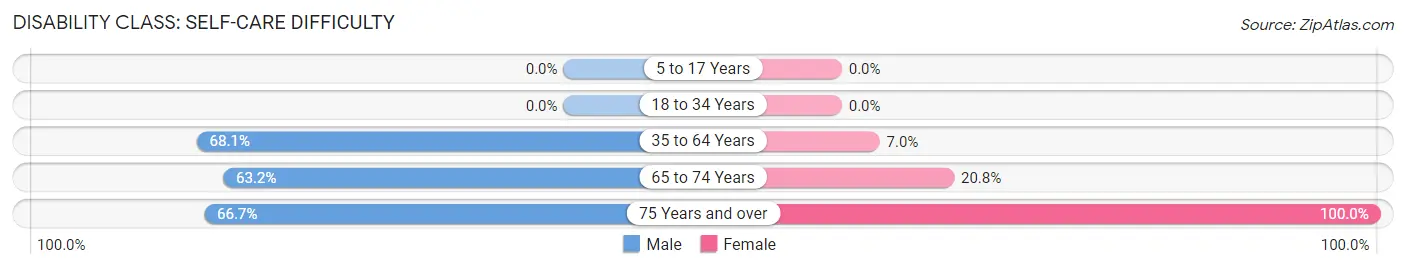
| Age Bracket | Male | Female |
| 5 to 17 Years | 0 (0.0%) | 0 (0.0%) |
| 18 to 34 Years | 0 (0.0%) | 0 (0.0%) |
| 35 to 64 Years | 49 (68.1%) | 4 (7.0%) |
| 65 to 74 Years | 12 (63.2%) | 20 (20.8%) |
| 75 Years and over | 10 (66.7%) | 16 (100.0%) |
Technology Access in Perrysburg
Computing Device Access in Perrysburg
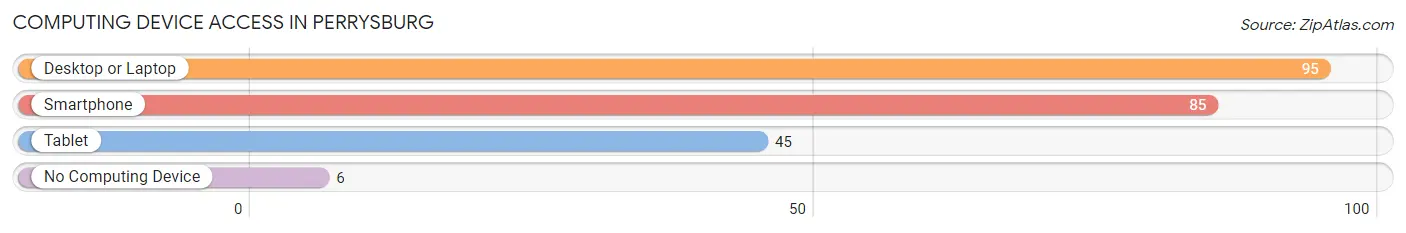
| Device Type | # Households | % Households |
| Desktop or Laptop | 95 | 90.5% |
| Smartphone | 85 | 80.9% |
| Tablet | 45 | 42.9% |
| No Computing Device | 6 | 5.7% |
| Total | 105 | 100.0% |
Internet Access in Perrysburg
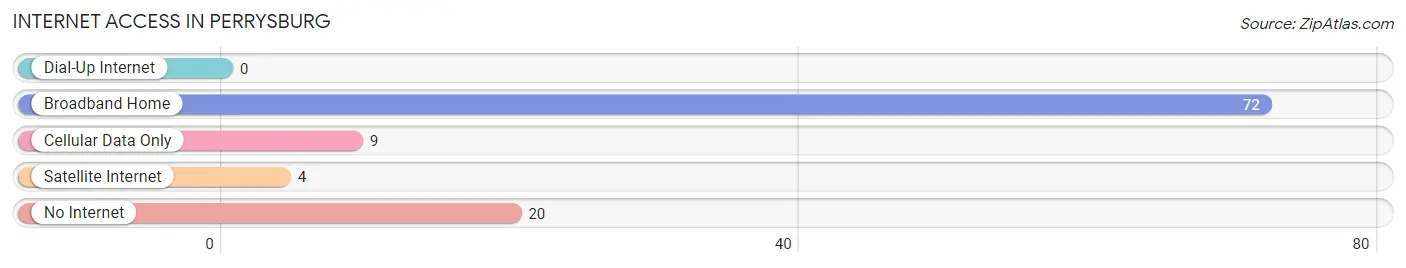
| Internet Type | # Households | % Households |
| Dial-Up Internet | 0 | 0.0% |
| Broadband Home | 72 | 68.6% |
| Cellular Data Only | 9 | 8.6% |
| Satellite Internet | 4 | 3.8% |
| No Internet | 20 | 19.1% |
| Total | 105 | 100.0% |
Perrysburg Summary
Perrysburg, New York is a small town located in the northern part of the state, in the county of St. Lawrence. It is situated on the banks of the St. Lawrence River, and is home to a population of just over 1,000 people. The town is known for its rich history, beautiful scenery, and vibrant economy.
History
Perrysburg was first settled in 1796 by a group of settlers from Massachusetts. The town was named after the Perry family, who were among the first settlers. The town was originally part of the town of Oswegatchie, but was later incorporated as its own town in 1817.
The town was an important stop on the Underground Railroad, and was home to several prominent abolitionists. During the Civil War, the town was a major supplier of food and supplies to the Union Army.
Geography
Perrysburg is located in the northern part of the state, in the county of St. Lawrence. It is situated on the banks of the St. Lawrence River, and is surrounded by rolling hills and forests. The town is located about 25 miles from the Canadian border, and is about an hour and a half drive from the state capital of Albany.
The town is home to several parks and recreational areas, including the Perrysburg State Park, which offers camping, fishing, and hiking opportunities. The town is also home to several lakes, including Lake Ontario, which is the largest lake in the state.
Economy
Perrysburg is home to a vibrant economy, with a variety of businesses and industries. The town is home to several manufacturing companies, including a paper mill, a furniture factory, and a metal fabrication plant. The town is also home to several retail stores, restaurants, and other businesses.
The town is also home to several farms, which produce a variety of crops, including corn, soybeans, and hay. The town is also home to several wineries, which produce a variety of wines.
Demographics
As of the 2010 census, the population of Perrysburg was 1,072. The town is predominantly white, with a small minority population. The median household income in the town is $45,000, and the median home value is $125,000.
Conclusion
Perrysburg, New York is a small town with a rich history, beautiful scenery, and vibrant economy. The town is home to a variety of businesses and industries, and is a popular destination for tourists and outdoor enthusiasts. The town is predominantly white, with a small minority population, and has a median household income of $45,000. The town is a great place to live, work, and play, and is a great example of small-town life in the state of New York.
Common Questions
What is the Total Population of Perrysburg?
Total Population of Perrysburg is 431.
What is the Total Male Population of Perrysburg?
Total Male Population of Perrysburg is 209.
What is the Total Female Population of Perrysburg?
Total Female Population of Perrysburg is 222.
What is the Ratio of Males per 100 Females in Perrysburg?
There are 94.14 Males per 100 Females in Perrysburg.
What is the Ratio of Females per 100 Males in Perrysburg?
There are 106.22 Females per 100 Males in Perrysburg.
What is the Median Population Age in Perrysburg?
Median Population Age in Perrysburg is 52.1 Years.
What is the Average Family Size in Perrysburg
Average Family Size in Perrysburg is 3.4 People.
What is the Average Household Size in Perrysburg
Average Household Size in Perrysburg is 3.0 People.
What is Per Capita Income in Perrysburg?
Per Capita income in Perrysburg is $17,095.
What is the Median Family Income in Perrysburg?
Median Family Income in Perrysburg is $71,250.
What is the Median Household income in Perrysburg?
Median Household Income in Perrysburg is $54,671.
What is Inequality or Gini Index in Perrysburg?
Inequality or Gini Index in Perrysburg is 0.26.
How Large is the Labor Force in Perrysburg?
There are 86 People in the Labor Forcein in Perrysburg.
What is the Percentage of People in the Labor Force in Perrysburg?
23.9% of People are in the Labor Force in Perrysburg.