Ovid, NY
Ovid Map
Ovid Overview
464
TOTAL POPULATION
203
MALE POPULATION
261
FEMALE POPULATION
77.78
MALES / 100 FEMALES
128.57
FEMALES / 100 MALES
42.0
MEDIAN AGE
2.8
AVG FAMILY SIZE
2.1
AVG HOUSEHOLD SIZE
$37,475
PER CAPITA INCOME
$125,132
AVG FAMILY INCOME
$62,361
AVG HOUSEHOLD INCOME
14.1%
WAGE / INCOME GAP [ % ]
85.9¢/ $1
WAGE / INCOME GAP [ $ ]
0.41
INEQUALITY / GINI INDEX
269
LABOR FORCE [ PEOPLE ]
67.6%
PERCENT IN LABOR FORCE
4.5%
UNEMPLOYMENT RATE
Ovid Zip Codes
Ovid Area Codes
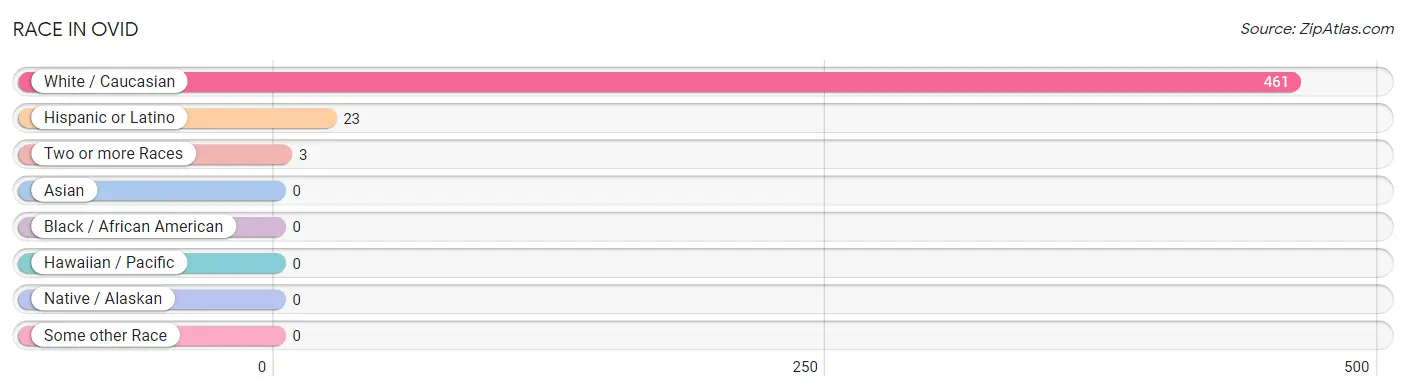
Race in Ovid
The most populous races in Ovid are White / Caucasian (461 | 99.4%), Hispanic or Latino (23 | 5.0%), and Two or more Races (3 | 0.6%).
| Race | # Population | % Population |
| Asian | 0 | 0.0% |
| Black / African American | 0 | 0.0% |
| Hawaiian / Pacific | 0 | 0.0% |
| Hispanic or Latino | 23 | 5.0% |
| Native / Alaskan | 0 | 0.0% |
| White / Caucasian | 461 | 99.4% |
| Two or more Races | 3 | 0.6% |
| Some other Race | 0 | 0.0% |
| Total | 464 | 100.0% |
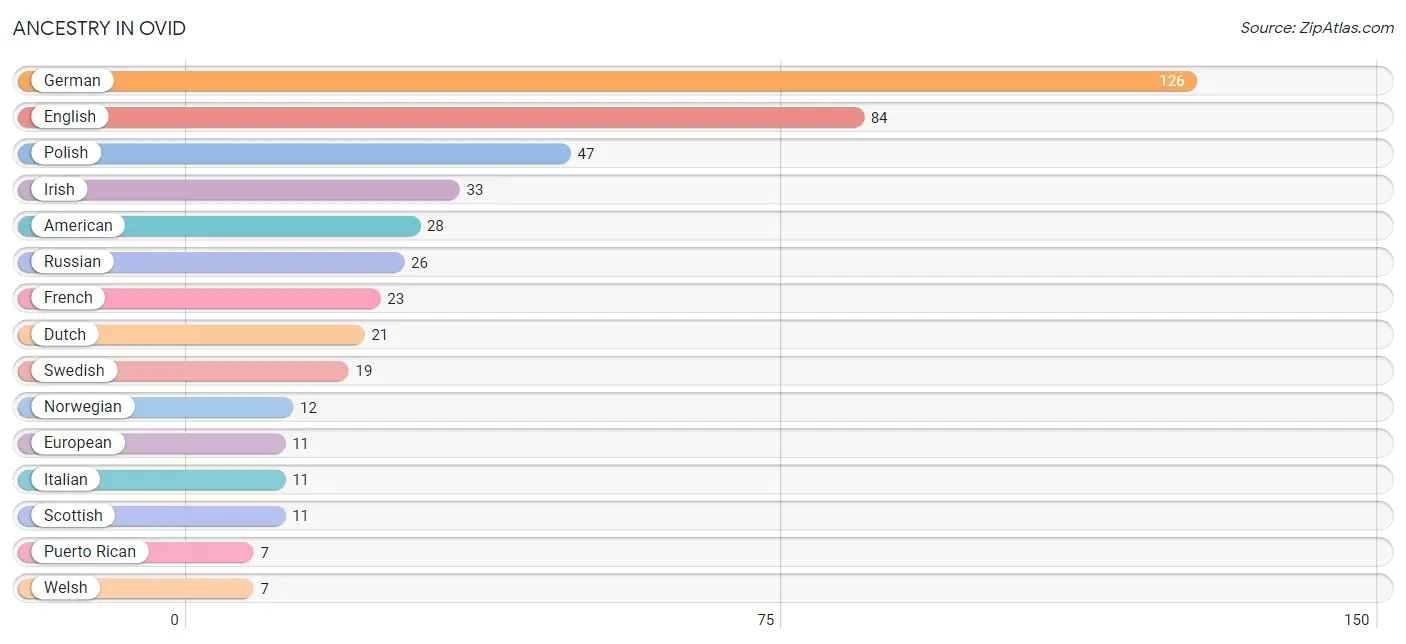
Ancestry in Ovid
The most populous ancestries reported in Ovid are German (126 | 27.2%), English (84 | 18.1%), Polish (47 | 10.1%), Irish (33 | 7.1%), and American (28 | 6.0%), together accounting for 68.5% of all Ovid residents.
| Ancestry | # Population | % Population |
| American | 28 | 6.0% |
| Austrian | 2 | 0.4% |
| British | 6 | 1.3% |
| Canadian | 3 | 0.6% |
| Danish | 3 | 0.6% |
| Dutch | 21 | 4.5% |
| English | 84 | 18.1% |
| European | 11 | 2.4% |
| French | 23 | 5.0% |
| German | 126 | 27.2% |
| Irish | 33 | 7.1% |
| Italian | 11 | 2.4% |
| Norwegian | 12 | 2.6% |
| Polish | 47 | 10.1% |
| Puerto Rican | 7 | 1.5% |
| Russian | 26 | 5.6% |
| Scottish | 11 | 2.4% |
| Swedish | 19 | 4.1% |
| Welsh | 7 | 1.5% | View All 19 Rows |
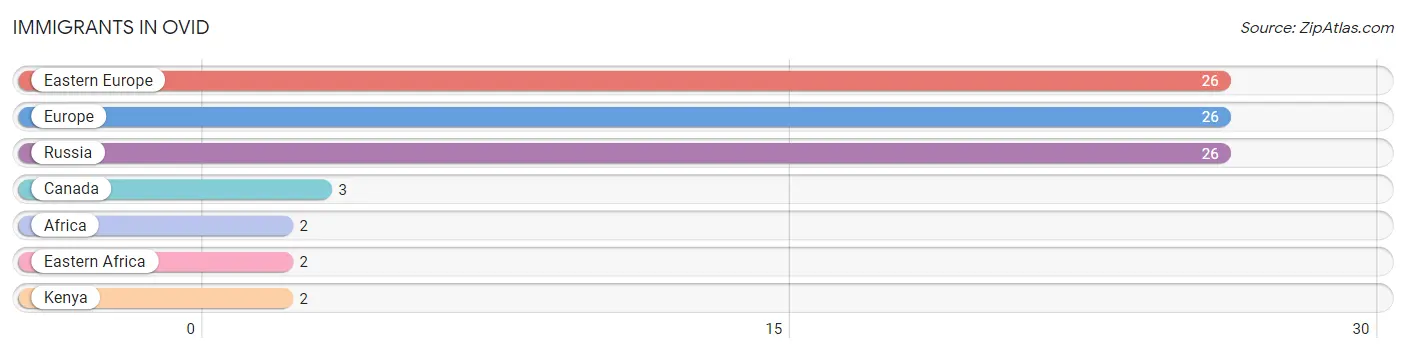
Immigrants in Ovid
The most numerous immigrant groups reported in Ovid came from Eastern Europe (26 | 5.6%), Europe (26 | 5.6%), Russia (26 | 5.6%), Canada (3 | 0.6%), and Africa (2 | 0.4%), together accounting for 17.9% of all Ovid residents.
| Immigration Origin | # Population | % Population |
| Africa | 2 | 0.4% |
| Canada | 3 | 0.6% |
| Eastern Africa | 2 | 0.4% |
| Eastern Europe | 26 | 5.6% |
| Europe | 26 | 5.6% |
| Kenya | 2 | 0.4% |
| Russia | 26 | 5.6% | View All 7 Rows |
Sex and Age in Ovid
Sex and Age in Ovid
The most populous age groups in Ovid are 65 to 69 Years (44 | 21.7%) for men and 55 to 59 Years (37 | 14.2%) for women.
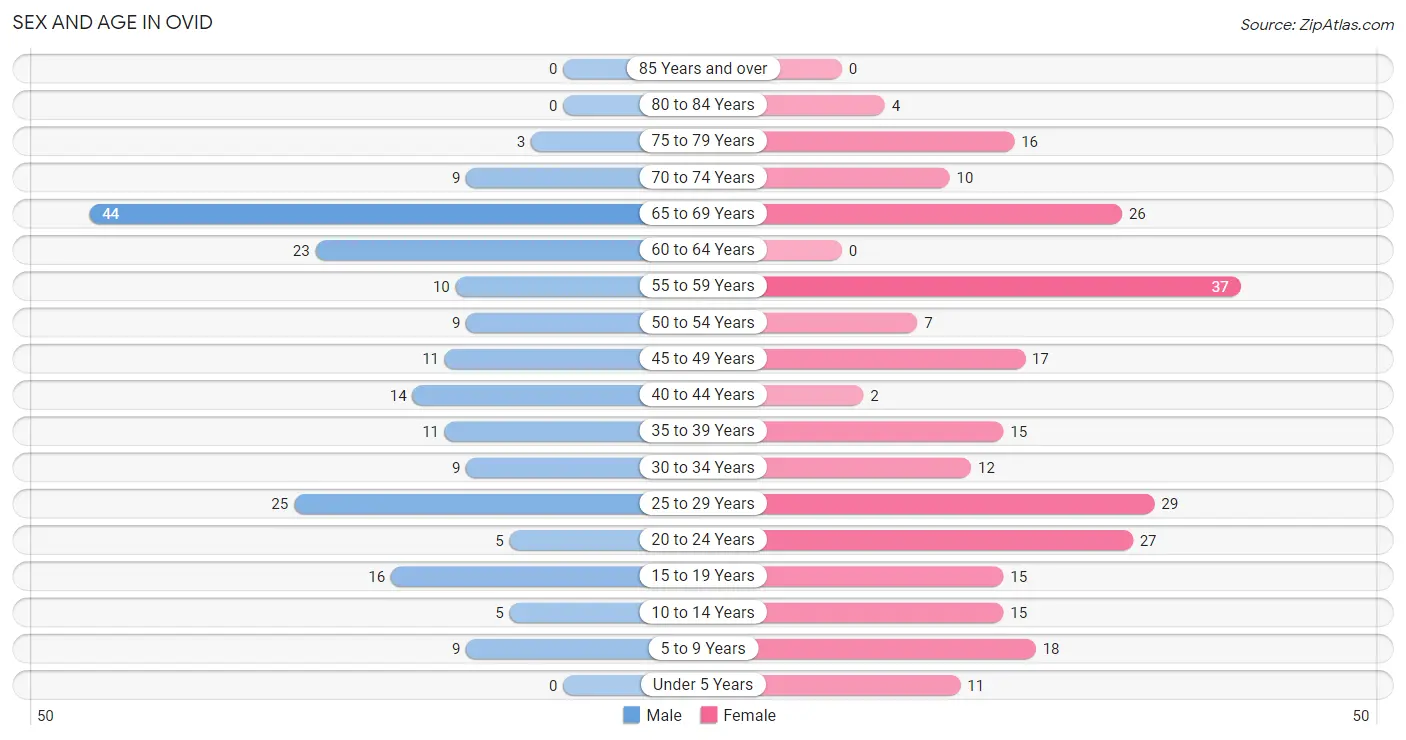
| Age Bracket | Male | Female |
| Under 5 Years | 0 (0.0%) | 11 (4.2%) |
| 5 to 9 Years | 9 (4.4%) | 18 (6.9%) |
| 10 to 14 Years | 5 (2.5%) | 15 (5.8%) |
| 15 to 19 Years | 16 (7.9%) | 15 (5.8%) |
| 20 to 24 Years | 5 (2.5%) | 27 (10.3%) |
| 25 to 29 Years | 25 (12.3%) | 29 (11.1%) |
| 30 to 34 Years | 9 (4.4%) | 12 (4.6%) |
| 35 to 39 Years | 11 (5.4%) | 15 (5.8%) |
| 40 to 44 Years | 14 (6.9%) | 2 (0.8%) |
| 45 to 49 Years | 11 (5.4%) | 17 (6.5%) |
| 50 to 54 Years | 9 (4.4%) | 7 (2.7%) |
| 55 to 59 Years | 10 (4.9%) | 37 (14.2%) |
| 60 to 64 Years | 23 (11.3%) | 0 (0.0%) |
| 65 to 69 Years | 44 (21.7%) | 26 (10.0%) |
| 70 to 74 Years | 9 (4.4%) | 10 (3.8%) |
| 75 to 79 Years | 3 (1.5%) | 16 (6.1%) |
| 80 to 84 Years | 0 (0.0%) | 4 (1.5%) |
| 85 Years and over | 0 (0.0%) | 0 (0.0%) |
| Total | 203 (100.0%) | 261 (100.0%) |
Families and Households in Ovid
Median Family Size in Ovid
The median family size in Ovid is 2.78 persons per family, with single female/mother families (10 | 8.8%) accounting for the largest median family size of 3.5 persons per family. On the other hand, married-couple families (84 | 73.7%) represent the smallest median family size with 2.70 persons per family.
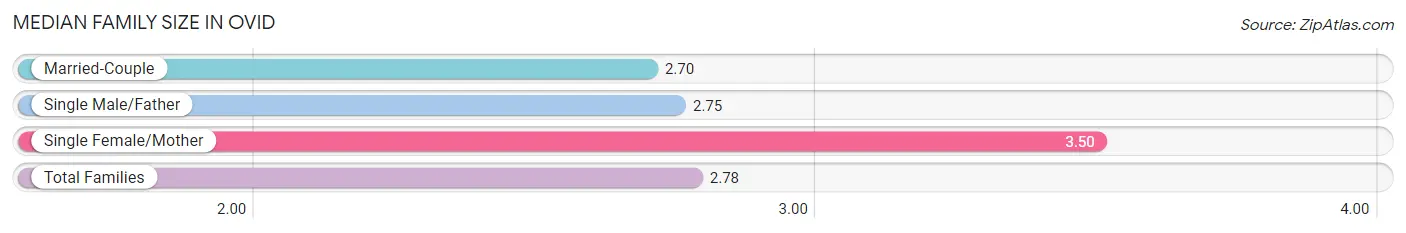
| Family Type | # Families | Family Size |
| Married-Couple | 84 (73.7%) | 2.70 |
| Single Male/Father | 20 (17.5%) | 2.75 |
| Single Female/Mother | 10 (8.8%) | 3.50 |
| Total Families | 114 (100.0%) | 2.78 |
Median Household Size in Ovid
The median household size in Ovid is 2.15 persons per household, with single female/mother households (10 | 4.6%) accounting for the largest median household size of 3.8 persons per household. non-family households (102 | 47.2%) represent the smallest median household size with 1.31 persons per household.
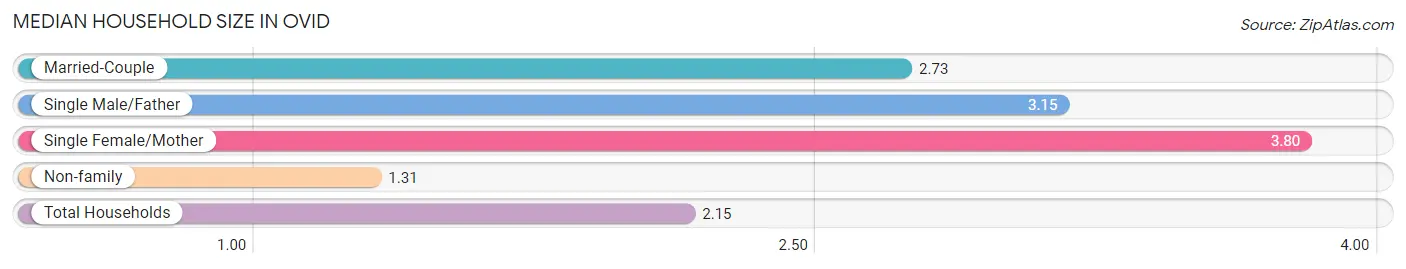
| Household Type | # Households | Household Size |
| Married-Couple | 84 (38.9%) | 2.73 |
| Single Male/Father | 20 (9.3%) | 3.15 |
| Single Female/Mother | 10 (4.6%) | 3.80 |
| Non-family | 102 (47.2%) | 1.31 |
| Total Households | 216 (100.0%) | 2.15 |
Household Size by Marriage Status in Ovid
Out of a total of 216 households in Ovid, 114 (52.8%) are family households, while 102 (47.2%) are nonfamily households. The most numerous type of family households are 2-person households, comprising 56, and the most common type of nonfamily households are 1-person households, comprising 76.
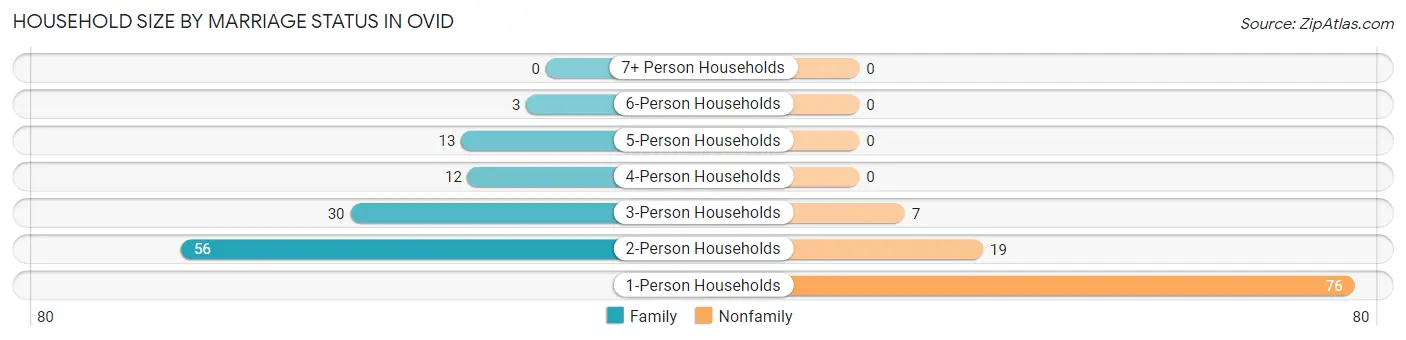
| Household Size | Family Households | Nonfamily Households |
| 1-Person Households | - | 76 (35.2%) |
| 2-Person Households | 56 (25.9%) | 19 (8.8%) |
| 3-Person Households | 30 (13.9%) | 7 (3.2%) |
| 4-Person Households | 12 (5.6%) | 0 (0.0%) |
| 5-Person Households | 13 (6.0%) | 0 (0.0%) |
| 6-Person Households | 3 (1.4%) | 0 (0.0%) |
| 7+ Person Households | 0 (0.0%) | 0 (0.0%) |
| Total | 114 (52.8%) | 102 (47.2%) |
Female Fertility in Ovid
Fertility by Age in Ovid
| Age Bracket | Women with Births | Births / 1,000 Women |
| 15 to 19 years | 0 (0.0%) | 0.0 |
| 20 to 34 years | 0 (0.0%) | 0.0 |
| 35 to 50 years | 0 (0.0%) | 0.0 |
| Total | 0 (0.0%) | 0.0 |
Fertility by Age by Marriage Status in Ovid
| Age Bracket | Married | Unmarried |
| 15 to 19 years | 0 (0.0%) | 0 (0.0%) |
| 20 to 34 years | 0 (0.0%) | 0 (0.0%) |
| 35 to 50 years | 0 (0.0%) | 0 (0.0%) |
| Total | 0 (0.0%) | 0 (0.0%) |
Fertility by Education in Ovid
| Educational Attainment | Women with Births | Births / 1,000 Women |
| Less than High School | 0 (0.0%) | 0.0 |
| High School Diploma | 0 (0.0%) | 0.0 |
| College or Associate's Degree | 0 (0.0%) | 0.0 |
| Bachelor's Degree | 0 (0.0%) | 0.0 |
| Graduate Degree | 0 (0.0%) | 0.0 |
| Total | 0 (0.0%) | 0.0 |
Fertility by Education by Marriage Status in Ovid
| Educational Attainment | Married | Unmarried |
| Less than High School | 0 (0.0%) | 0 (0.0%) |
| High School Diploma | 0 (0.0%) | 0 (0.0%) |
| College or Associate's Degree | 0 (0.0%) | 0 (0.0%) |
| Bachelor's Degree | 0 (0.0%) | 0 (0.0%) |
| Graduate Degree | 0 (0.0%) | 0 (0.0%) |
| Total | 0 (0.0%) | 0 (0.0%) |
Income in Ovid
Income Overview in Ovid
Per Capita Income in Ovid is $37,475, while median incomes of families and households are $125,132 and $62,361 respectively.
| Characteristic | Number | Measure |
| Per Capita Income | 464 | $37,475 |
| Median Family Income | 114 | $125,132 |
| Mean Family Income | 114 | $111,957 |
| Median Household Income | 216 | $62,361 |
| Mean Household Income | 216 | $81,241 |
| Income Deficit | 114 | $0 |
| Wage / Income Gap (%) | 464 | 14.11% |
| Wage / Income Gap ($) | 464 | 85.89¢ per $1 |
| Gini / Inequality Index | 464 | 0.41 |
Earnings by Sex in Ovid
Average Earnings in Ovid are $42,250, $44,632 for men and $38,333 for women, a difference of 14.1%.
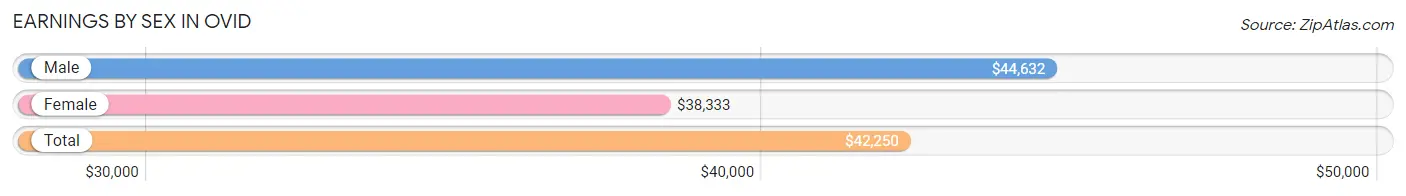
| Sex | Number | Average Earnings |
| Male | 131 (48.0%) | $44,632 |
| Female | 142 (52.0%) | $38,333 |
| Total | 273 (100.0%) | $42,250 |
Earnings by Sex by Income Bracket in Ovid
The most common earnings brackets in Ovid are $25,000 to $29,999 for men (23 | 17.6%) and $40,000 to $44,999 for women (24 | 16.9%).
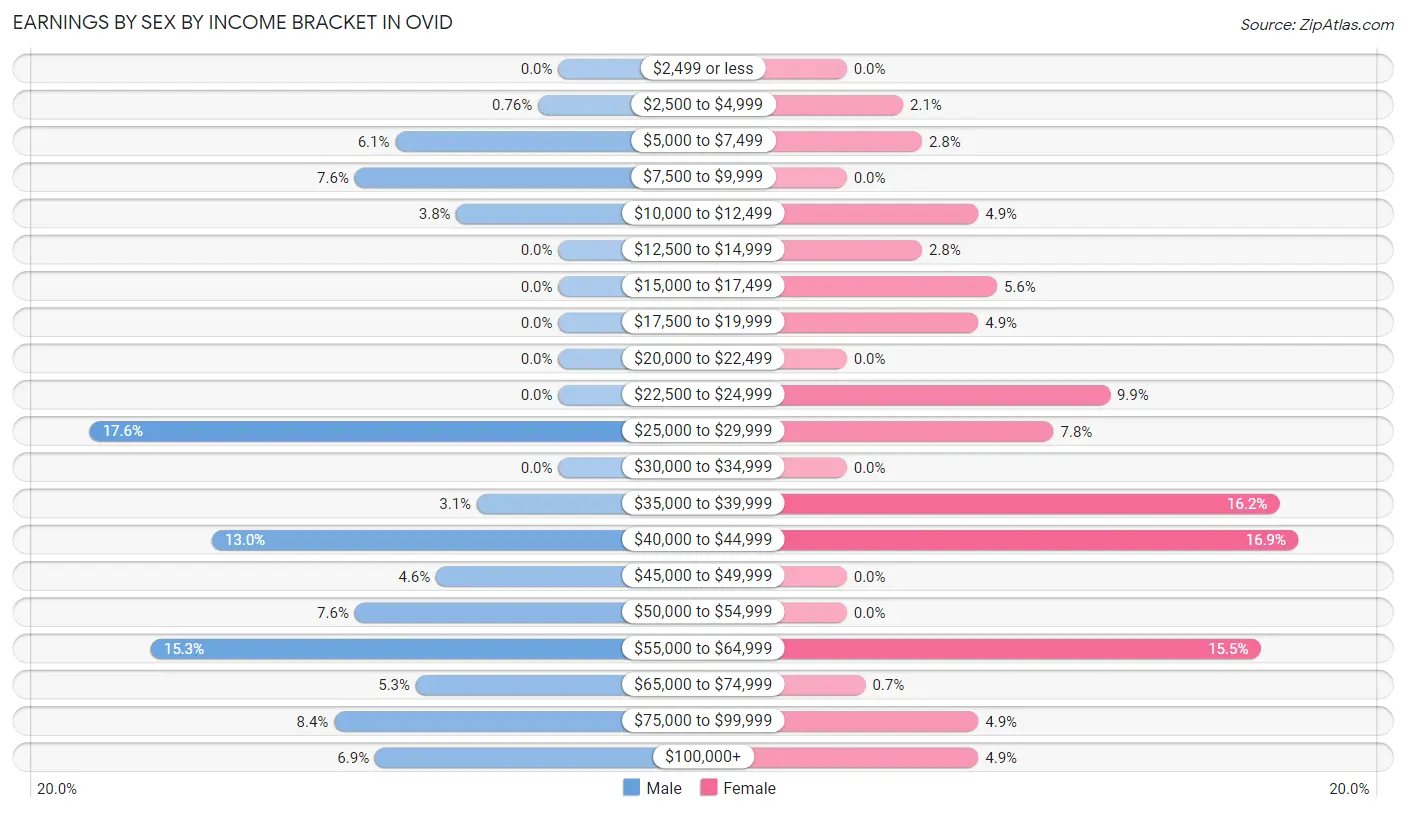
| Income | Male | Female |
| $2,499 or less | 0 (0.0%) | 0 (0.0%) |
| $2,500 to $4,999 | 1 (0.8%) | 3 (2.1%) |
| $5,000 to $7,499 | 8 (6.1%) | 4 (2.8%) |
| $7,500 to $9,999 | 10 (7.6%) | 0 (0.0%) |
| $10,000 to $12,499 | 5 (3.8%) | 7 (4.9%) |
| $12,500 to $14,999 | 0 (0.0%) | 4 (2.8%) |
| $15,000 to $17,499 | 0 (0.0%) | 8 (5.6%) |
| $17,500 to $19,999 | 0 (0.0%) | 7 (4.9%) |
| $20,000 to $22,499 | 0 (0.0%) | 0 (0.0%) |
| $22,500 to $24,999 | 0 (0.0%) | 14 (9.9%) |
| $25,000 to $29,999 | 23 (17.6%) | 11 (7.7%) |
| $30,000 to $34,999 | 0 (0.0%) | 0 (0.0%) |
| $35,000 to $39,999 | 4 (3.0%) | 23 (16.2%) |
| $40,000 to $44,999 | 17 (13.0%) | 24 (16.9%) |
| $45,000 to $49,999 | 6 (4.6%) | 0 (0.0%) |
| $50,000 to $54,999 | 10 (7.6%) | 0 (0.0%) |
| $55,000 to $64,999 | 20 (15.3%) | 22 (15.5%) |
| $65,000 to $74,999 | 7 (5.3%) | 1 (0.7%) |
| $75,000 to $99,999 | 11 (8.4%) | 7 (4.9%) |
| $100,000+ | 9 (6.9%) | 7 (4.9%) |
| Total | 131 (100.0%) | 142 (100.0%) |
Earnings by Sex by Educational Attainment in Ovid
Average earnings in Ovid are $46,250 for men and $41,500 for women, a difference of 10.3%. Men with an educational attainment of college or associate's degree enjoy the highest average annual earnings of $70,357, while those with high school diploma education earn the least with $43,603. Women with an educational attainment of bachelor's degree earn the most with the average annual earnings of $59,091, while those with college or associate's degree education have the smallest earnings of $37,857.
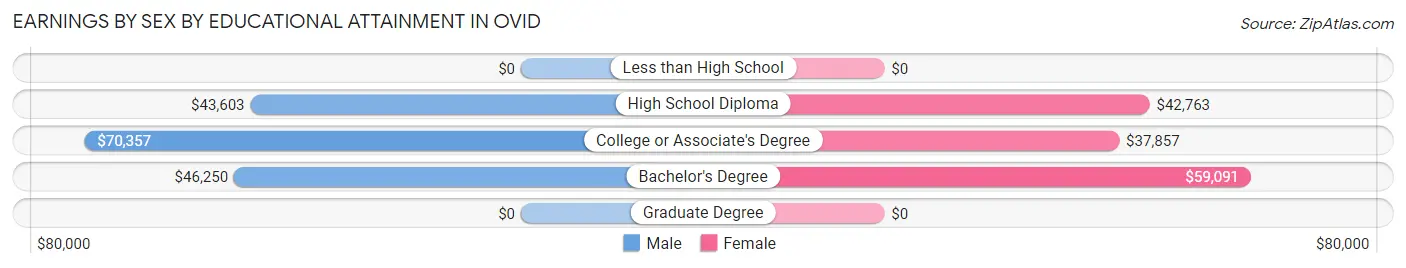
| Educational Attainment | Male Income | Female Income |
| Less than High School | - | - |
| High School Diploma | $43,603 | $42,763 |
| College or Associate's Degree | $70,357 | $37,857 |
| Bachelor's Degree | $46,250 | $59,091 |
| Graduate Degree | - | - |
| Total | $46,250 | $41,500 |
Family Income in Ovid
Family Income Brackets in Ovid
According to the Ovid family income data, there are 43 families falling into the $100,000 to $149,999 income range, which is the most common income bracket and makes up 37.7% of all families.
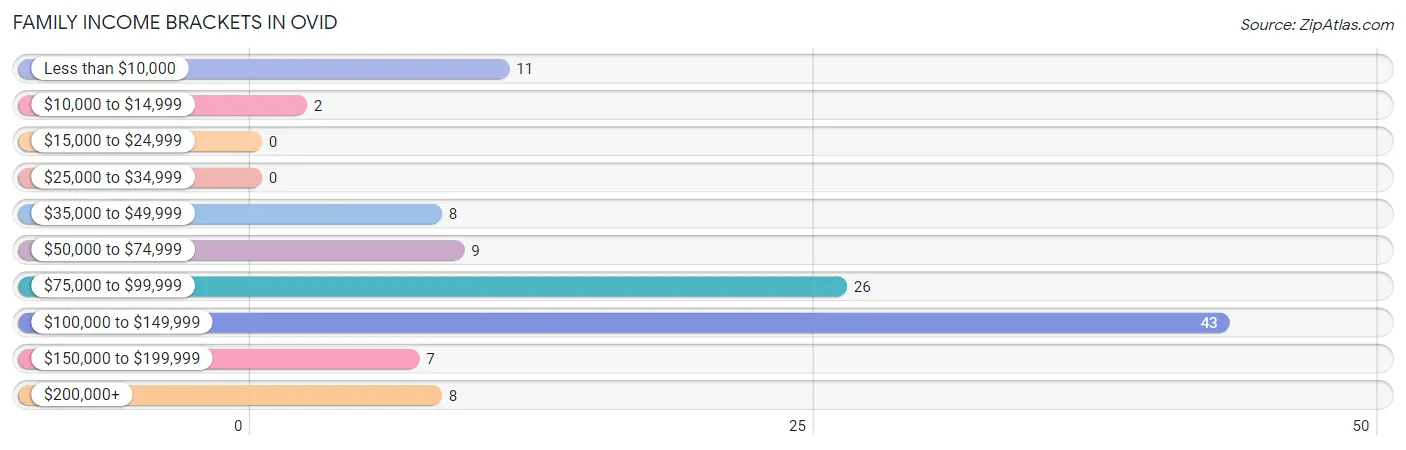
| Income Bracket | # Families | % Families |
| Less than $10,000 | 11 | 9.6% |
| $10,000 to $14,999 | 2 | 1.8% |
| $15,000 to $24,999 | 0 | 0.0% |
| $25,000 to $34,999 | 0 | 0.0% |
| $35,000 to $49,999 | 8 | 7.0% |
| $50,000 to $74,999 | 9 | 7.9% |
| $75,000 to $99,999 | 26 | 22.8% |
| $100,000 to $149,999 | 43 | 37.7% |
| $150,000 to $199,999 | 7 | 6.1% |
| $200,000+ | 8 | 7.0% |
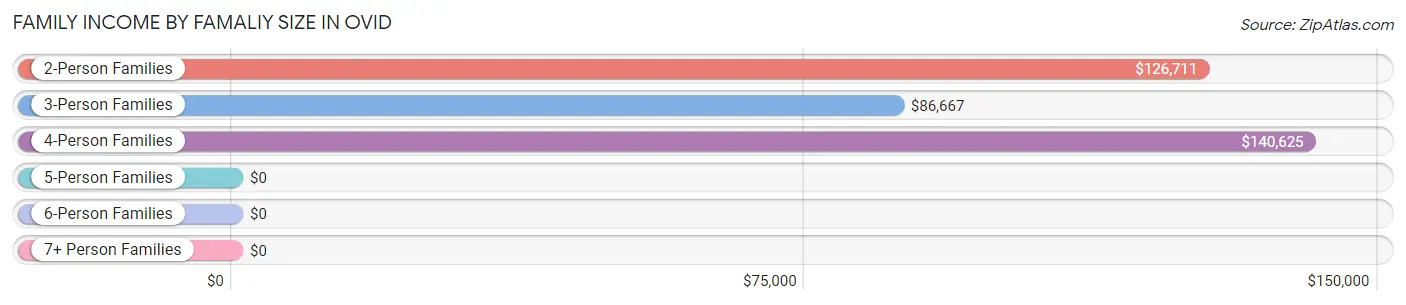
Family Income by Famaliy Size in Ovid
4-person families (17 | 14.9%) account for the highest median family income in Ovid with $140,625 per family, while 2-person families (56 | 49.1%) have the highest median income of $63,356 per family member.
| Income Bracket | # Families | Median Income |
| 2-Person Families | 56 (49.1%) | $126,711 |
| 3-Person Families | 32 (28.1%) | $86,667 |
| 4-Person Families | 17 (14.9%) | $140,625 |
| 5-Person Families | 9 (7.9%) | $0 |
| 6-Person Families | 0 (0.0%) | $0 |
| 7+ Person Families | 0 (0.0%) | $0 |
| Total | 114 (100.0%) | $125,132 |
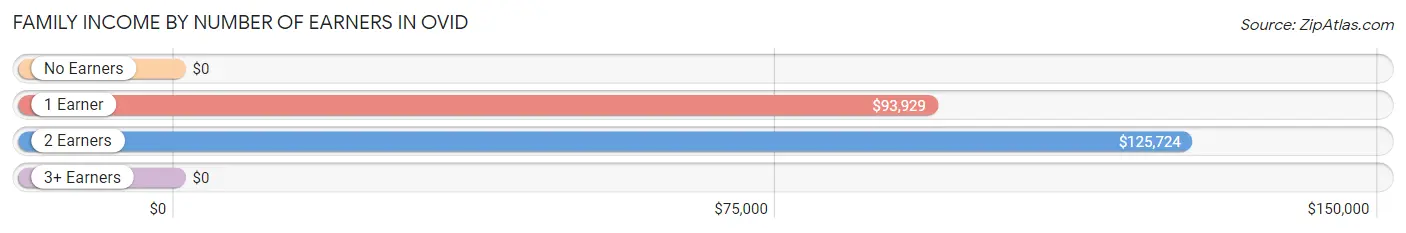
Family Income by Number of Earners in Ovid
| Number of Earners | # Families | Median Income |
| No Earners | 6 (5.3%) | $0 |
| 1 Earner | 38 (33.3%) | $93,929 |
| 2 Earners | 67 (58.8%) | $125,724 |
| 3+ Earners | 3 (2.6%) | $0 |
| Total | 114 (100.0%) | $125,132 |
Household Income in Ovid
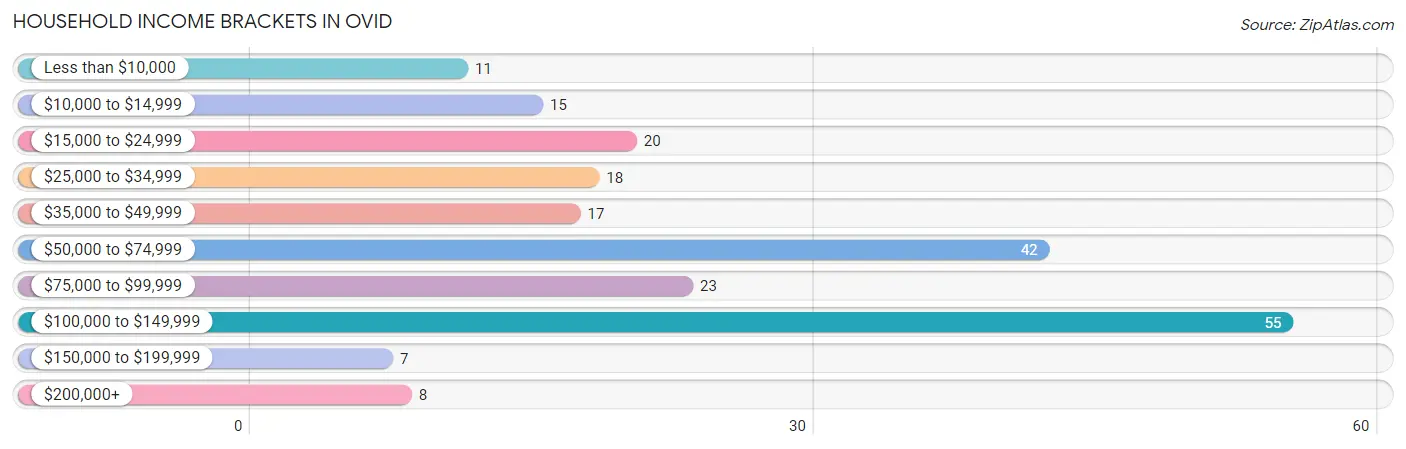
Household Income Brackets in Ovid
With 55 households falling in the category, the $100,000 to $149,999 income range is the most frequent in Ovid, accounting for 25.5% of all households. In contrast, only 7 households (3.2%) fall into the $150,000 to $199,999 income bracket, making it the least populous group.
| Income Bracket | # Households | % Households |
| Less than $10,000 | 11 | 5.1% |
| $10,000 to $14,999 | 15 | 6.9% |
| $15,000 to $24,999 | 20 | 9.3% |
| $25,000 to $34,999 | 18 | 8.3% |
| $35,000 to $49,999 | 17 | 7.9% |
| $50,000 to $74,999 | 42 | 19.4% |
| $75,000 to $99,999 | 23 | 10.6% |
| $100,000 to $149,999 | 55 | 25.5% |
| $150,000 to $199,999 | 7 | 3.2% |
| $200,000+ | 8 | 3.7% |
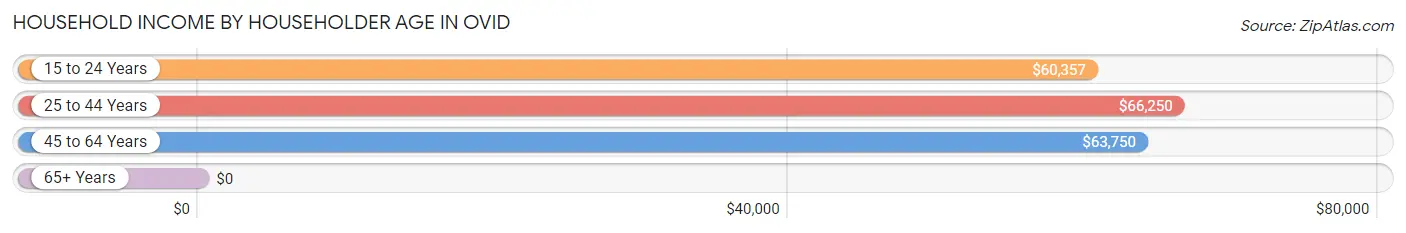
Household Income by Householder Age in Ovid
The median household income in Ovid is $62,361, with the highest median household income of $66,250 found in the 25 to 44 years age bracket for the primary householder. A total of 53 households (24.5%) fall into this category. Meanwhile, the 65+ years age bracket for the primary householder has the lowest median household income of $0, with 87 households (40.3%) in this group.
| Income Bracket | # Households | Median Income |
| 15 to 24 Years | 12 (5.6%) | $60,357 |
| 25 to 44 Years | 53 (24.5%) | $66,250 |
| 45 to 64 Years | 64 (29.6%) | $63,750 |
| 65+ Years | 87 (40.3%) | $0 |
| Total | 216 (100.0%) | $62,361 |
Poverty in Ovid
Income Below Poverty by Sex and Age in Ovid
With 17.2% poverty level for males and 15.3% for females among the residents of Ovid, 6 to 11 year old males and 25 to 34 year old females are the most vulnerable to poverty, with 9 males (81.8%) and 15 females (36.6%) in their respective age groups living below the poverty level.
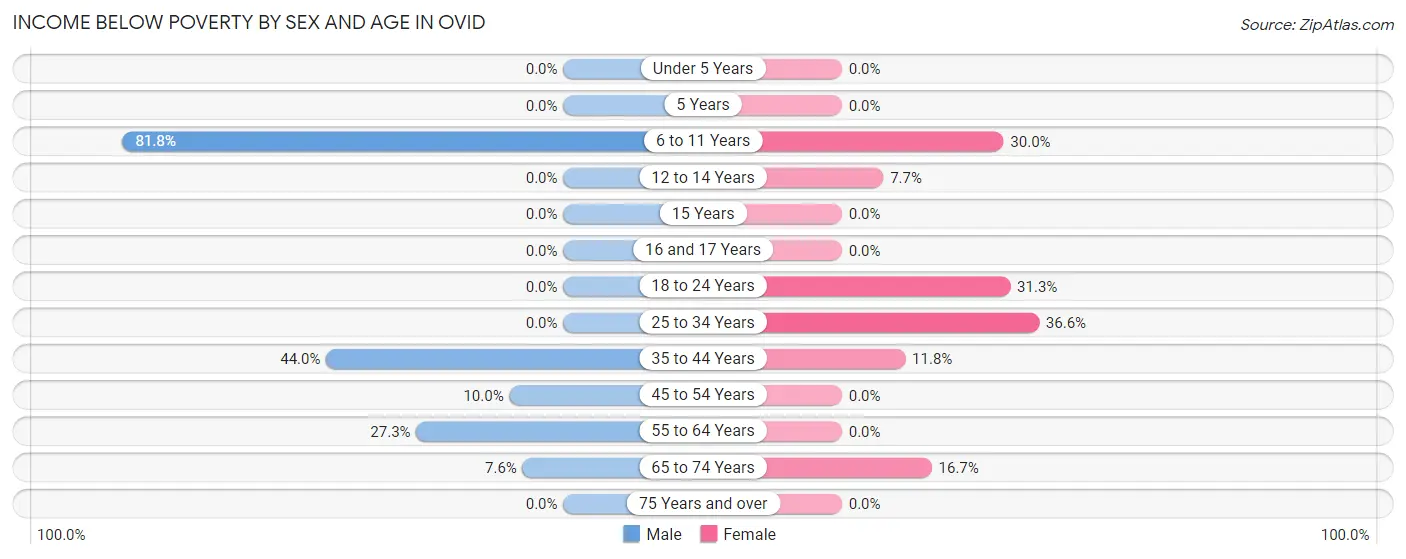
| Age Bracket | Male | Female |
| Under 5 Years | 0 (0.0%) | 0 (0.0%) |
| 5 Years | 0 (0.0%) | 0 (0.0%) |
| 6 to 11 Years | 9 (81.8%) | 6 (30.0%) |
| 12 to 14 Years | 0 (0.0%) | 1 (7.7%) |
| 15 Years | 0 (0.0%) | 0 (0.0%) |
| 16 and 17 Years | 0 (0.0%) | 0 (0.0%) |
| 18 to 24 Years | 0 (0.0%) | 10 (31.2%) |
| 25 to 34 Years | 0 (0.0%) | 15 (36.6%) |
| 35 to 44 Years | 11 (44.0%) | 2 (11.8%) |
| 45 to 54 Years | 2 (10.0%) | 0 (0.0%) |
| 55 to 64 Years | 9 (27.3%) | 0 (0.0%) |
| 65 to 74 Years | 4 (7.5%) | 6 (16.7%) |
| 75 Years and over | 0 (0.0%) | 0 (0.0%) |
| Total | 35 (17.2%) | 40 (15.3%) |
Income Above Poverty by Sex and Age in Ovid
According to the poverty statistics in Ovid, males aged 12 to 14 years and females aged under 5 years are the age groups that are most secure financially, with 100.0% of males and 100.0% of females in these age groups living above the poverty line.
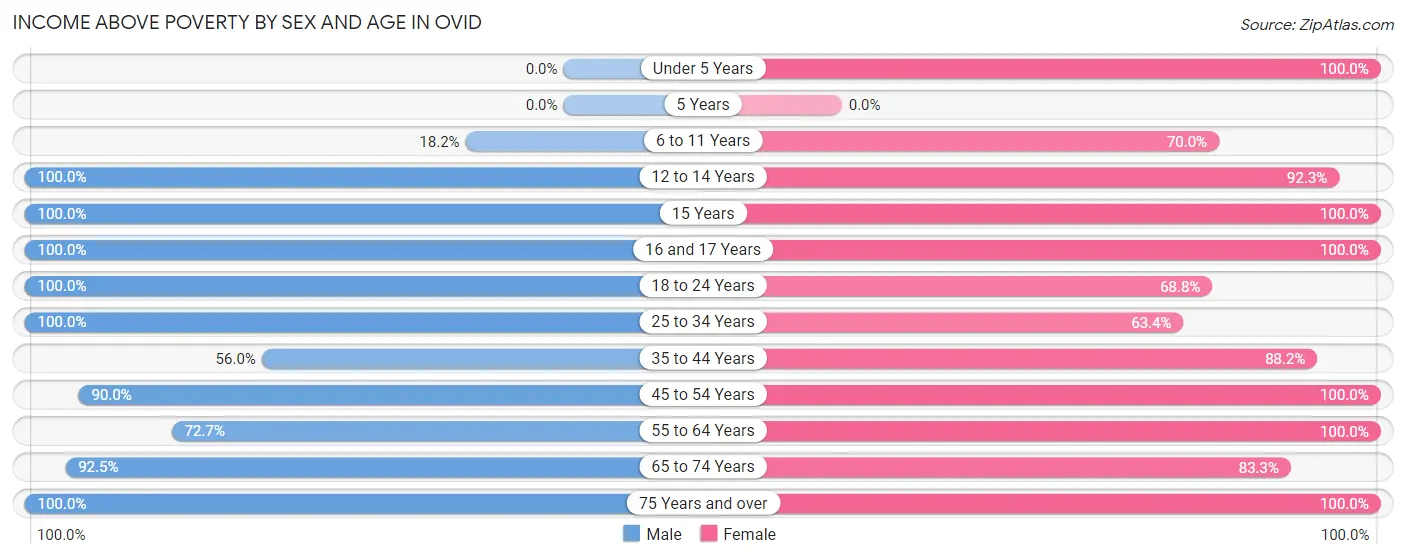
| Age Bracket | Male | Female |
| Under 5 Years | 0 (0.0%) | 11 (100.0%) |
| 5 Years | 0 (0.0%) | 0 (0.0%) |
| 6 to 11 Years | 2 (18.2%) | 14 (70.0%) |
| 12 to 14 Years | 3 (100.0%) | 12 (92.3%) |
| 15 Years | 5 (100.0%) | 3 (100.0%) |
| 16 and 17 Years | 5 (100.0%) | 7 (100.0%) |
| 18 to 24 Years | 11 (100.0%) | 22 (68.8%) |
| 25 to 34 Years | 34 (100.0%) | 26 (63.4%) |
| 35 to 44 Years | 14 (56.0%) | 15 (88.2%) |
| 45 to 54 Years | 18 (90.0%) | 24 (100.0%) |
| 55 to 64 Years | 24 (72.7%) | 37 (100.0%) |
| 65 to 74 Years | 49 (92.4%) | 30 (83.3%) |
| 75 Years and over | 3 (100.0%) | 20 (100.0%) |
| Total | 168 (82.8%) | 221 (84.7%) |
Income Below Poverty Among Married-Couple Families in Ovid
The poverty statistics for married-couple families in Ovid show that 9.5% or 8 of the total 84 families live below the poverty line. Families with 1 or 2 children have the highest poverty rate of 25.8%, comprising of 8 families. On the other hand, families with no children have the lowest poverty rate of 0.0%, which includes 0 families.
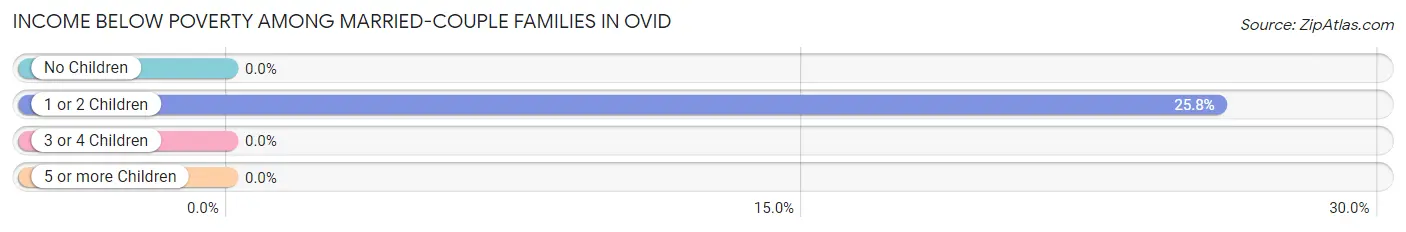
| Children | Above Poverty | Below Poverty |
| No Children | 47 (100.0%) | 0 (0.0%) |
| 1 or 2 Children | 23 (74.2%) | 8 (25.8%) |
| 3 or 4 Children | 6 (100.0%) | 0 (0.0%) |
| 5 or more Children | 0 (0.0%) | 0 (0.0%) |
| Total | 76 (90.5%) | 8 (9.5%) |
Income Below Poverty Among Single-Parent Households in Ovid
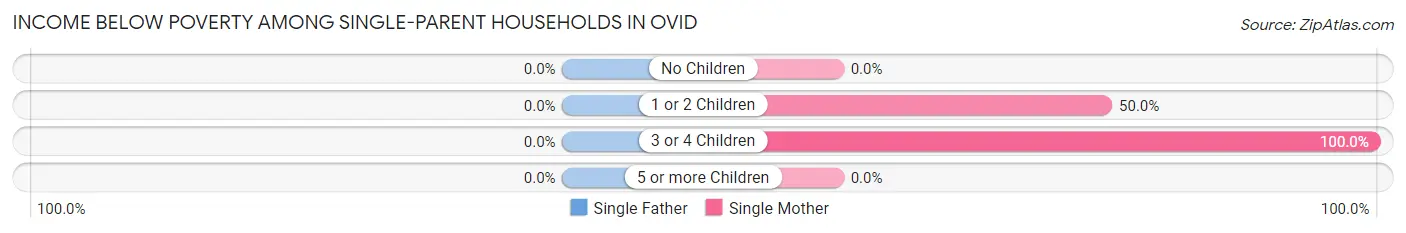
| Children | Single Father | Single Mother |
| No Children | 0 (0.0%) | 0 (0.0%) |
| 1 or 2 Children | 0 (0.0%) | 2 (50.0%) |
| 3 or 4 Children | 0 (0.0%) | 3 (100.0%) |
| 5 or more Children | 0 (0.0%) | 0 (0.0%) |
| Total | 0 (0.0%) | 5 (50.0%) |
Income Below Poverty Among Married-Couple vs Single-Parent Households in Ovid
The poverty data for Ovid shows that 8 of the married-couple family households (9.5%) and 5 of the single-parent households (16.7%) are living below the poverty level. Within the married-couple family households, those with 1 or 2 children have the highest poverty rate, with 8 households (25.8%) falling below the poverty line. Among the single-parent households, those with 3 or 4 children have the highest poverty rate, with 3 household (100.0%) living below poverty.
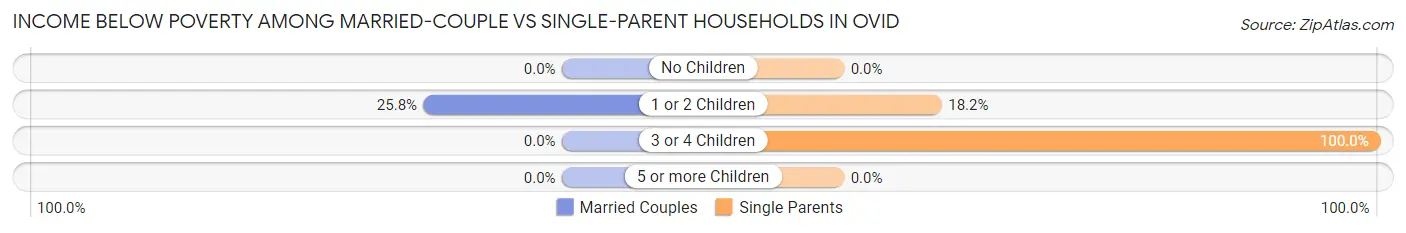
| Children | Married-Couple Families | Single-Parent Households |
| No Children | 0 (0.0%) | 0 (0.0%) |
| 1 or 2 Children | 8 (25.8%) | 2 (18.2%) |
| 3 or 4 Children | 0 (0.0%) | 3 (100.0%) |
| 5 or more Children | 0 (0.0%) | 0 (0.0%) |
| Total | 8 (9.5%) | 5 (16.7%) |
Employment Characteristics in Ovid
Employment by Class of Employer in Ovid
Among the 257 employed individuals in Ovid, private company employees (141 | 54.9%), state government employees (33 | 12.8%), and local government employees (29 | 11.3%) make up the most common classes of employment.
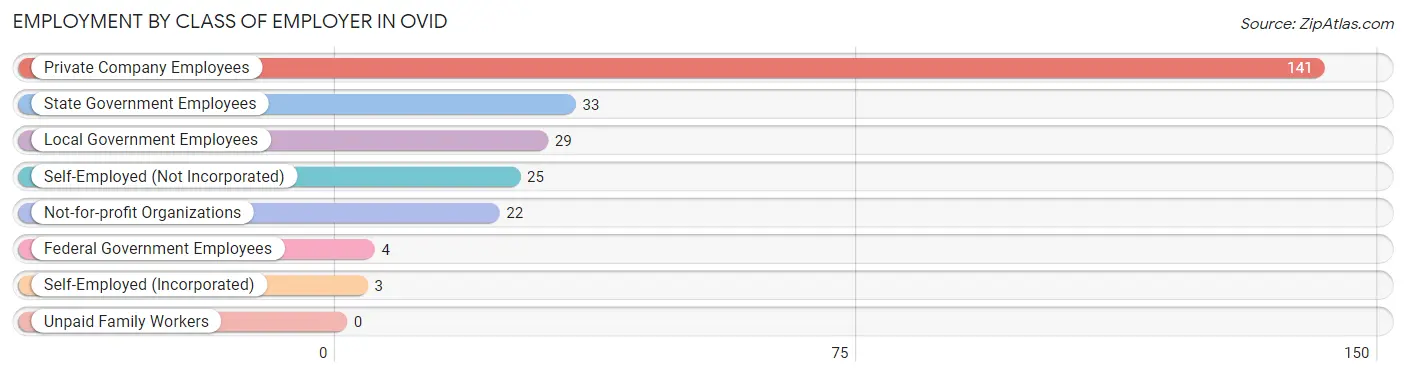
| Employer Class | # Employees | % Employees |
| Private Company Employees | 141 | 54.9% |
| Self-Employed (Incorporated) | 3 | 1.2% |
| Self-Employed (Not Incorporated) | 25 | 9.7% |
| Not-for-profit Organizations | 22 | 8.6% |
| Local Government Employees | 29 | 11.3% |
| State Government Employees | 33 | 12.8% |
| Federal Government Employees | 4 | 1.6% |
| Unpaid Family Workers | 0 | 0.0% |
| Total | 257 | 100.0% |
Employment Status by Age in Ovid
According to the labor force statistics for Ovid, out of the total population over 16 years of age (398), 67.6% or 269 individuals are in the labor force, with 4.5% or 12 of them unemployed. The age group with the highest labor force participation rate is 45 to 54 years, with 90.9% or 40 individuals in the labor force. Within the labor force, the 35 to 44 years age range has the highest percentage of unemployed individuals, with 19.4% or 7 of them being unemployed.
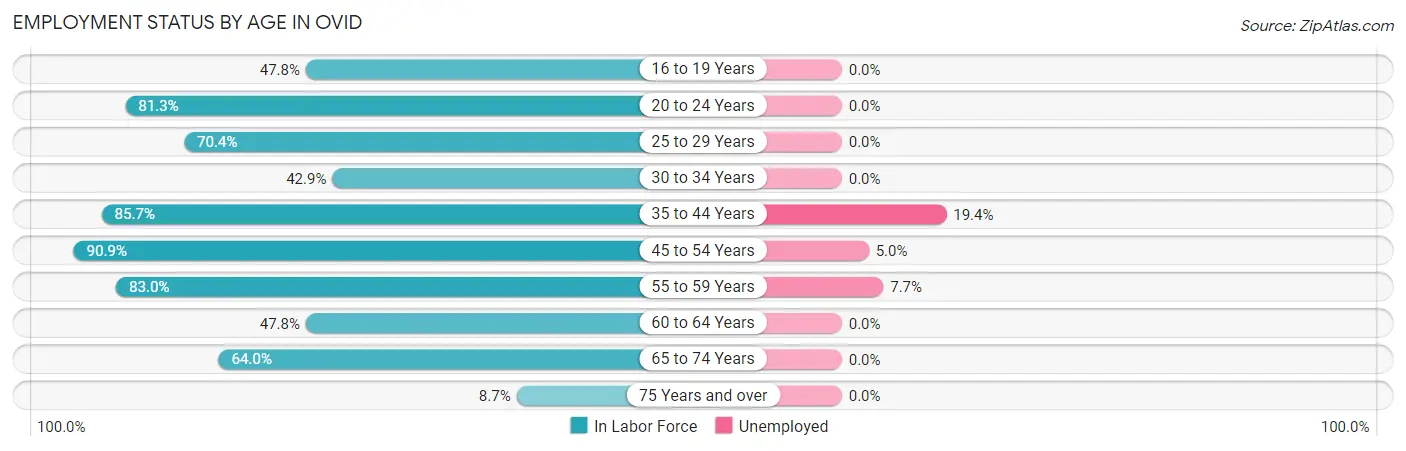
| Age Bracket | In Labor Force | Unemployed |
| 16 to 19 Years | 11 (47.8%) | 0 (0.0%) |
| 20 to 24 Years | 26 (81.3%) | 0 (0.0%) |
| 25 to 29 Years | 38 (70.4%) | 0 (0.0%) |
| 30 to 34 Years | 9 (42.9%) | 0 (0.0%) |
| 35 to 44 Years | 36 (85.7%) | 7 (19.4%) |
| 45 to 54 Years | 40 (90.9%) | 2 (5.0%) |
| 55 to 59 Years | 39 (83.0%) | 3 (7.7%) |
| 60 to 64 Years | 11 (47.8%) | 0 (0.0%) |
| 65 to 74 Years | 57 (64.0%) | 0 (0.0%) |
| 75 Years and over | 2 (8.7%) | 0 (0.0%) |
| Total | 269 (67.6%) | 12 (4.5%) |
Employment Status by Educational Attainment in Ovid
According to labor force statistics for Ovid, 74.9% of individuals (173) out of the total population between 25 and 64 years of age (231) are in the labor force, with 6.9% or 12 of them being unemployed. The group with the highest labor force participation rate are those with the educational attainment of college / associate degree, with 84.7% or 50 individuals in the labor force. Within the labor force, individuals with high school diploma education have the highest percentage of unemployment, with 11.1% or 7 of them being unemployed.
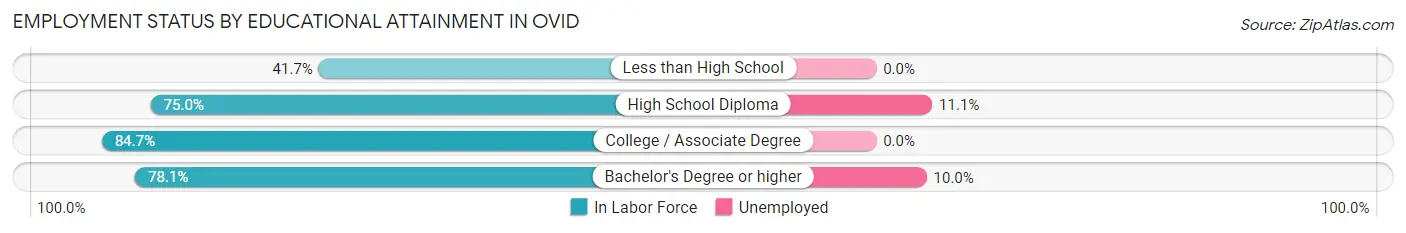
| Educational Attainment | In Labor Force | Unemployed |
| Less than High School | 10 (41.7%) | 0 (0.0%) |
| High School Diploma | 63 (75.0%) | 9 (11.1%) |
| College / Associate Degree | 50 (84.7%) | 0 (0.0%) |
| Bachelor's Degree or higher | 50 (78.1%) | 6 (10.0%) |
| Total | 173 (74.9%) | 16 (6.9%) |
Employment Occupations by Sex in Ovid
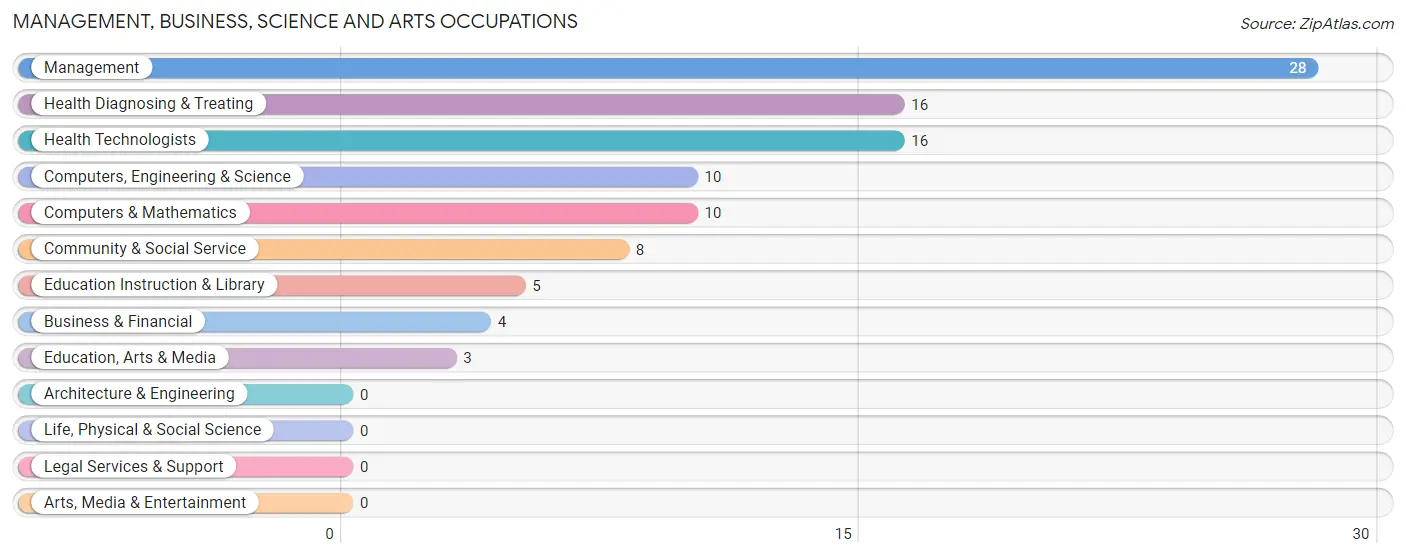
Management, Business, Science and Arts Occupations
The most common Management, Business, Science and Arts occupations in Ovid are Management (28 | 10.9%), Health Diagnosing & Treating (16 | 6.2%), Health Technologists (16 | 6.2%), Computers, Engineering & Science (10 | 3.9%), and Computers & Mathematics (10 | 3.9%).
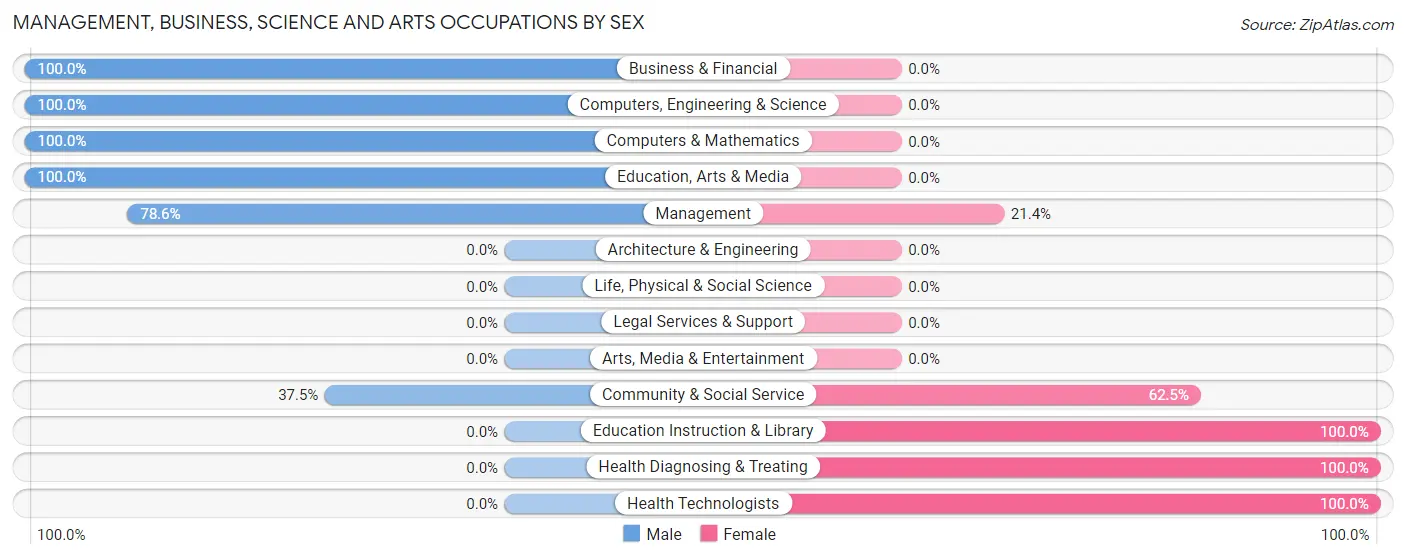
Management, Business, Science and Arts Occupations by Sex
Within the Management, Business, Science and Arts occupations in Ovid, the most male-oriented occupations are Business & Financial (100.0%), Computers, Engineering & Science (100.0%), and Computers & Mathematics (100.0%), while the most female-oriented occupations are Education Instruction & Library (100.0%), Health Diagnosing & Treating (100.0%), and Health Technologists (100.0%).
| Occupation | Male | Female |
| Management | 22 (78.6%) | 6 (21.4%) |
| Business & Financial | 4 (100.0%) | 0 (0.0%) |
| Computers, Engineering & Science | 10 (100.0%) | 0 (0.0%) |
| Computers & Mathematics | 10 (100.0%) | 0 (0.0%) |
| Architecture & Engineering | 0 (0.0%) | 0 (0.0%) |
| Life, Physical & Social Science | 0 (0.0%) | 0 (0.0%) |
| Community & Social Service | 3 (37.5%) | 5 (62.5%) |
| Education, Arts & Media | 3 (100.0%) | 0 (0.0%) |
| Legal Services & Support | 0 (0.0%) | 0 (0.0%) |
| Education Instruction & Library | 0 (0.0%) | 5 (100.0%) |
| Arts, Media & Entertainment | 0 (0.0%) | 0 (0.0%) |
| Health Diagnosing & Treating | 0 (0.0%) | 16 (100.0%) |
| Health Technologists | 0 (0.0%) | 16 (100.0%) |
| Total (Category) | 39 (59.1%) | 27 (40.9%) |
| Total (Overall) | 130 (50.6%) | 127 (49.4%) |
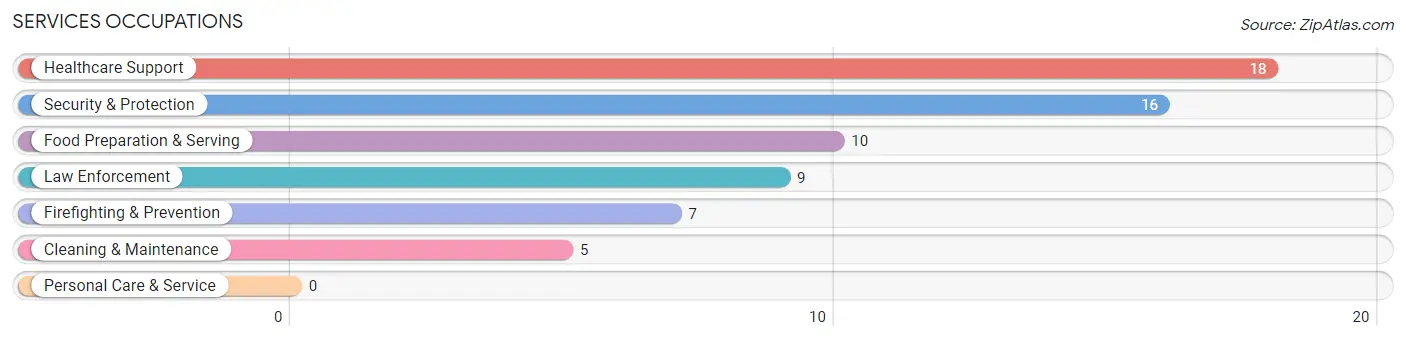
Services Occupations
The most common Services occupations in Ovid are Healthcare Support (18 | 7.0%), Security & Protection (16 | 6.2%), Food Preparation & Serving (10 | 3.9%), Law Enforcement (9 | 3.5%), and Firefighting & Prevention (7 | 2.7%).
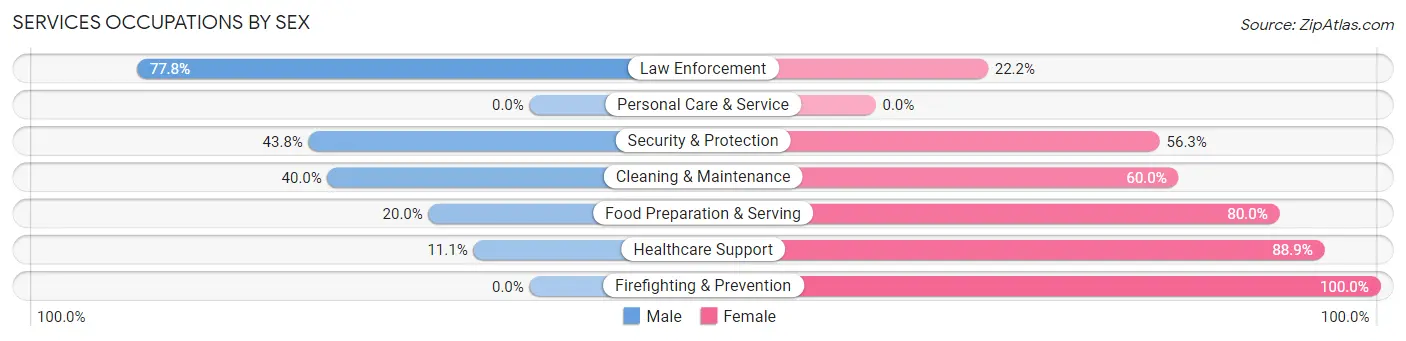
Services Occupations by Sex
Within the Services occupations in Ovid, the most male-oriented occupations are Law Enforcement (77.8%), Security & Protection (43.8%), and Cleaning & Maintenance (40.0%), while the most female-oriented occupations are Firefighting & Prevention (100.0%), Healthcare Support (88.9%), and Food Preparation & Serving (80.0%).
| Occupation | Male | Female |
| Healthcare Support | 2 (11.1%) | 16 (88.9%) |
| Security & Protection | 7 (43.8%) | 9 (56.2%) |
| Firefighting & Prevention | 0 (0.0%) | 7 (100.0%) |
| Law Enforcement | 7 (77.8%) | 2 (22.2%) |
| Food Preparation & Serving | 2 (20.0%) | 8 (80.0%) |
| Cleaning & Maintenance | 2 (40.0%) | 3 (60.0%) |
| Personal Care & Service | 0 (0.0%) | 0 (0.0%) |
| Total (Category) | 13 (26.5%) | 36 (73.5%) |
| Total (Overall) | 130 (50.6%) | 127 (49.4%) |
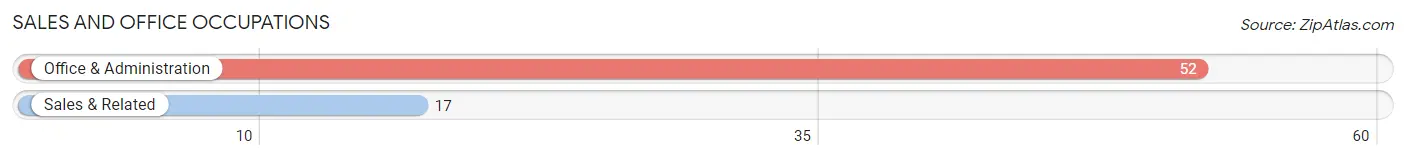
Sales and Office Occupations
The most common Sales and Office occupations in Ovid are Office & Administration (52 | 20.2%), and Sales & Related (17 | 6.6%).
Sales and Office Occupations by Sex
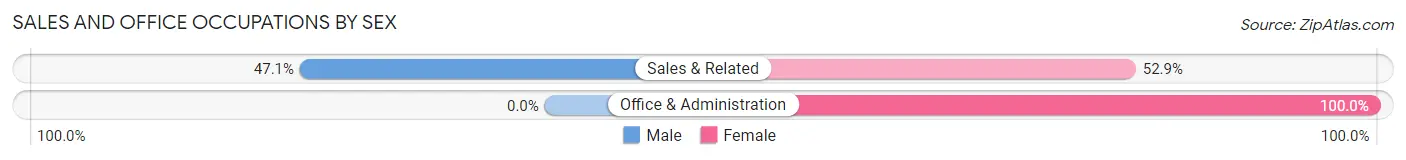
| Occupation | Male | Female |
| Sales & Related | 8 (47.1%) | 9 (52.9%) |
| Office & Administration | 0 (0.0%) | 52 (100.0%) |
| Total (Category) | 8 (11.6%) | 61 (88.4%) |
| Total (Overall) | 130 (50.6%) | 127 (49.4%) |
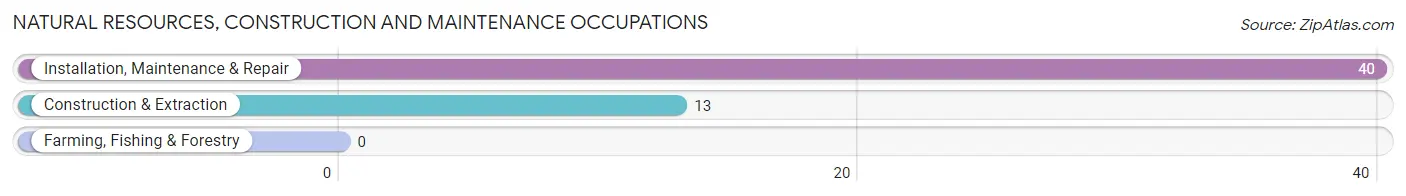
Natural Resources, Construction and Maintenance Occupations
The most common Natural Resources, Construction and Maintenance occupations in Ovid are Installation, Maintenance & Repair (40 | 15.6%), and Construction & Extraction (13 | 5.1%).
Natural Resources, Construction and Maintenance Occupations by Sex
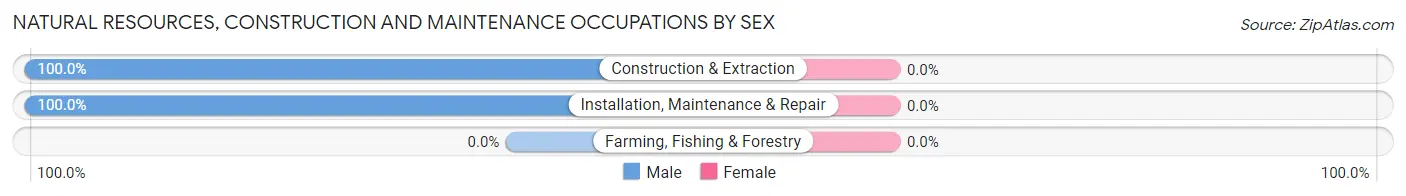
| Occupation | Male | Female |
| Farming, Fishing & Forestry | 0 (0.0%) | 0 (0.0%) |
| Construction & Extraction | 13 (100.0%) | 0 (0.0%) |
| Installation, Maintenance & Repair | 40 (100.0%) | 0 (0.0%) |
| Total (Category) | 53 (100.0%) | 0 (0.0%) |
| Total (Overall) | 130 (50.6%) | 127 (49.4%) |
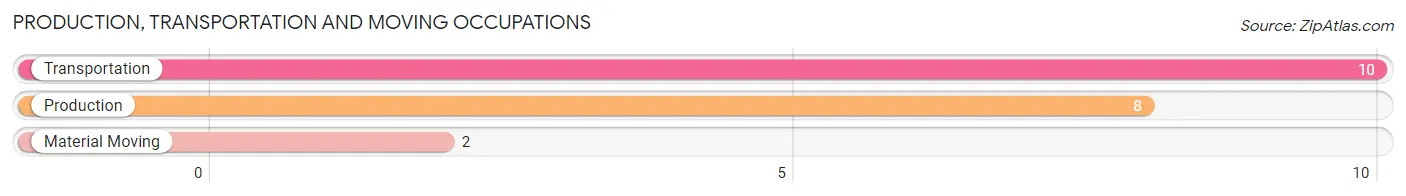
Production, Transportation and Moving Occupations
The most common Production, Transportation and Moving occupations in Ovid are Transportation (10 | 3.9%), Production (8 | 3.1%), and Material Moving (2 | 0.8%).
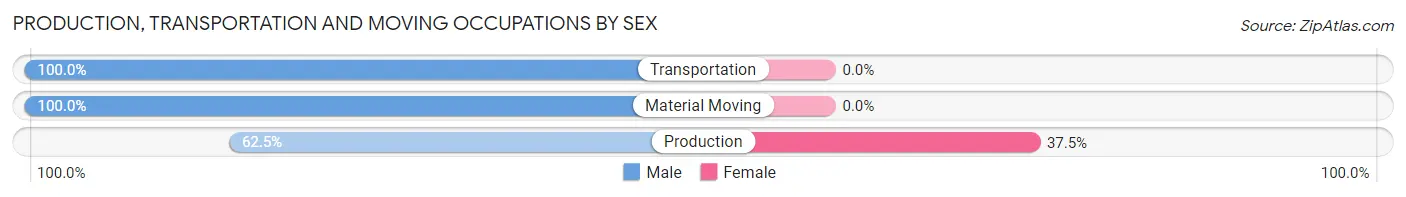
Production, Transportation and Moving Occupations by Sex
| Occupation | Male | Female |
| Production | 5 (62.5%) | 3 (37.5%) |
| Transportation | 10 (100.0%) | 0 (0.0%) |
| Material Moving | 2 (100.0%) | 0 (0.0%) |
| Total (Category) | 17 (85.0%) | 3 (15.0%) |
| Total (Overall) | 130 (50.6%) | 127 (49.4%) |
Employment Industries by Sex in Ovid
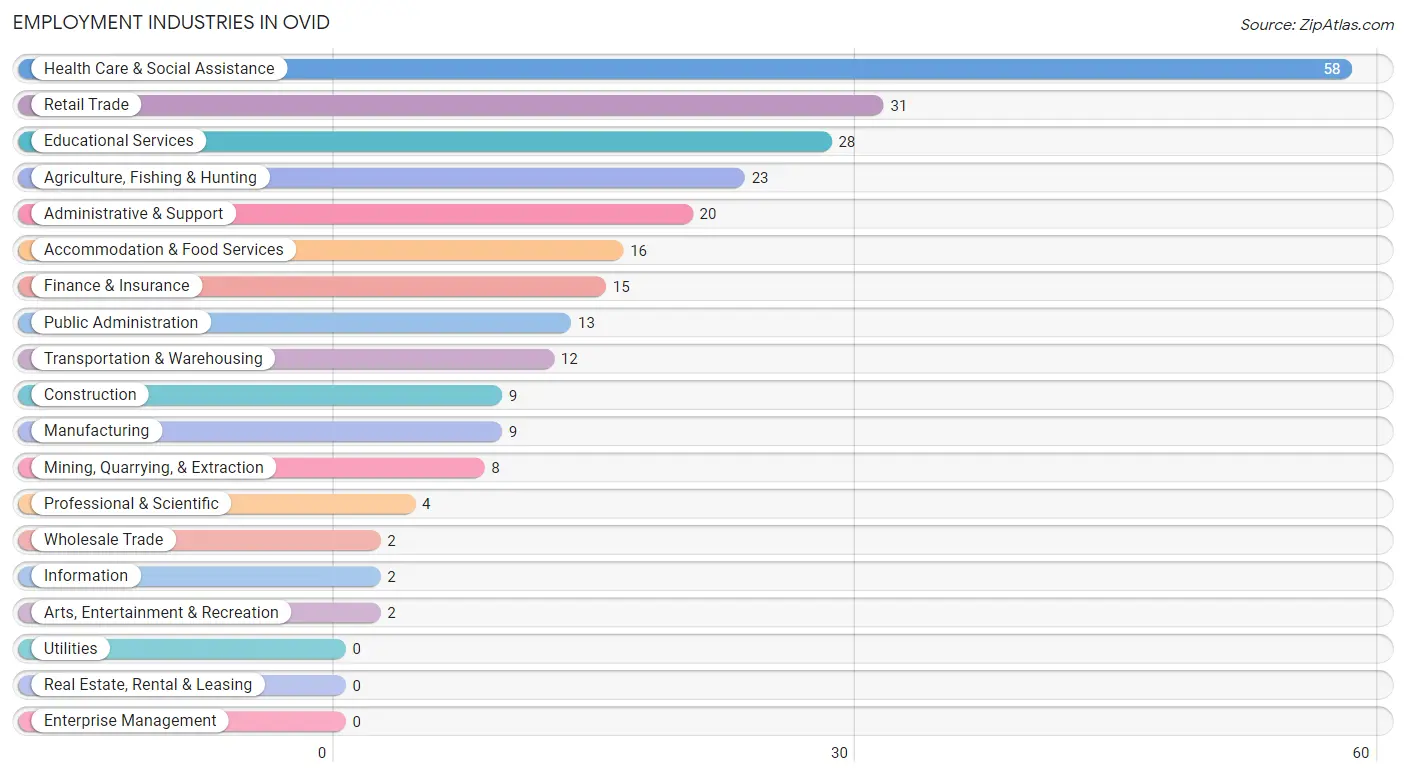
Employment Industries in Ovid
The major employment industries in Ovid include Health Care & Social Assistance (58 | 22.6%), Retail Trade (31 | 12.1%), Educational Services (28 | 10.9%), Agriculture, Fishing & Hunting (23 | 8.9%), and Administrative & Support (20 | 7.8%).
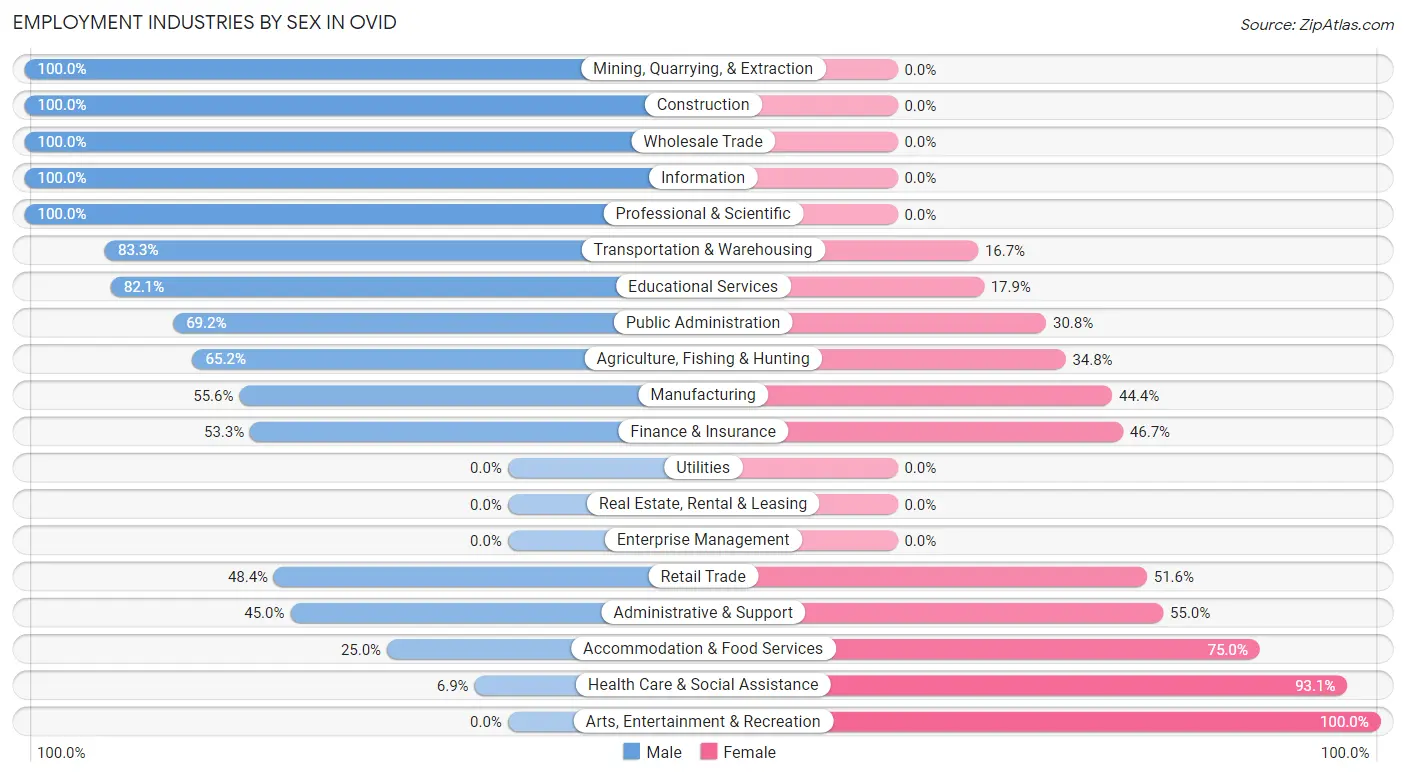
Employment Industries by Sex in Ovid
The Ovid industries that see more men than women are Mining, Quarrying, & Extraction (100.0%), Construction (100.0%), and Wholesale Trade (100.0%), whereas the industries that tend to have a higher number of women are Arts, Entertainment & Recreation (100.0%), Health Care & Social Assistance (93.1%), and Accommodation & Food Services (75.0%).
| Industry | Male | Female |
| Agriculture, Fishing & Hunting | 15 (65.2%) | 8 (34.8%) |
| Mining, Quarrying, & Extraction | 8 (100.0%) | 0 (0.0%) |
| Construction | 9 (100.0%) | 0 (0.0%) |
| Manufacturing | 5 (55.6%) | 4 (44.4%) |
| Wholesale Trade | 2 (100.0%) | 0 (0.0%) |
| Retail Trade | 15 (48.4%) | 16 (51.6%) |
| Transportation & Warehousing | 10 (83.3%) | 2 (16.7%) |
| Utilities | 0 (0.0%) | 0 (0.0%) |
| Information | 2 (100.0%) | 0 (0.0%) |
| Finance & Insurance | 8 (53.3%) | 7 (46.7%) |
| Real Estate, Rental & Leasing | 0 (0.0%) | 0 (0.0%) |
| Professional & Scientific | 4 (100.0%) | 0 (0.0%) |
| Enterprise Management | 0 (0.0%) | 0 (0.0%) |
| Administrative & Support | 9 (45.0%) | 11 (55.0%) |
| Educational Services | 23 (82.1%) | 5 (17.9%) |
| Health Care & Social Assistance | 4 (6.9%) | 54 (93.1%) |
| Arts, Entertainment & Recreation | 0 (0.0%) | 2 (100.0%) |
| Accommodation & Food Services | 4 (25.0%) | 12 (75.0%) |
| Public Administration | 9 (69.2%) | 4 (30.8%) |
| Total | 130 (50.6%) | 127 (49.4%) |
Education in Ovid
School Enrollment in Ovid
The most common levels of schooling among the 89 students in Ovid are high school (35 | 39.3%), college / undergraduate (22 | 24.7%), and elementary school (18 | 20.2%).
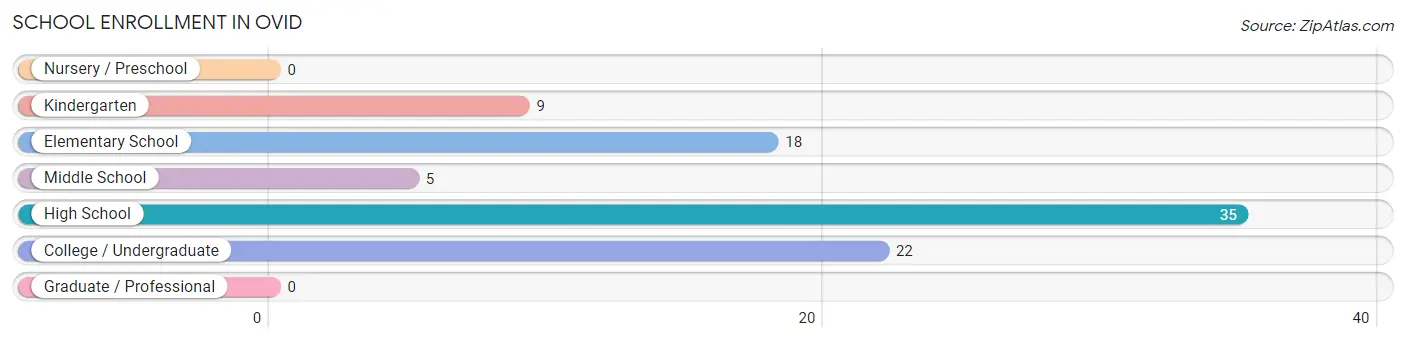
| School Level | # Students | % Students |
| Nursery / Preschool | 0 | 0.0% |
| Kindergarten | 9 | 10.1% |
| Elementary School | 18 | 20.2% |
| Middle School | 5 | 5.6% |
| High School | 35 | 39.3% |
| College / Undergraduate | 22 | 24.7% |
| Graduate / Professional | 0 | 0.0% |
| Total | 89 | 100.0% |
School Enrollment by Age by Funding Source in Ovid
Out of a total of 89 students who are enrolled in schools in Ovid, 6 (6.7%) attend a private institution, while the remaining 83 (93.3%) are enrolled in public schools. The age group of 5 to 9 year old has the highest likelihood of being enrolled in private schools, with 6 (22.2% in the age bracket) enrolled. Conversely, the age group of 10 to 14 year olds has the lowest likelihood of being enrolled in a private school, with 20 (100.0% in the age bracket) attending a public institution.
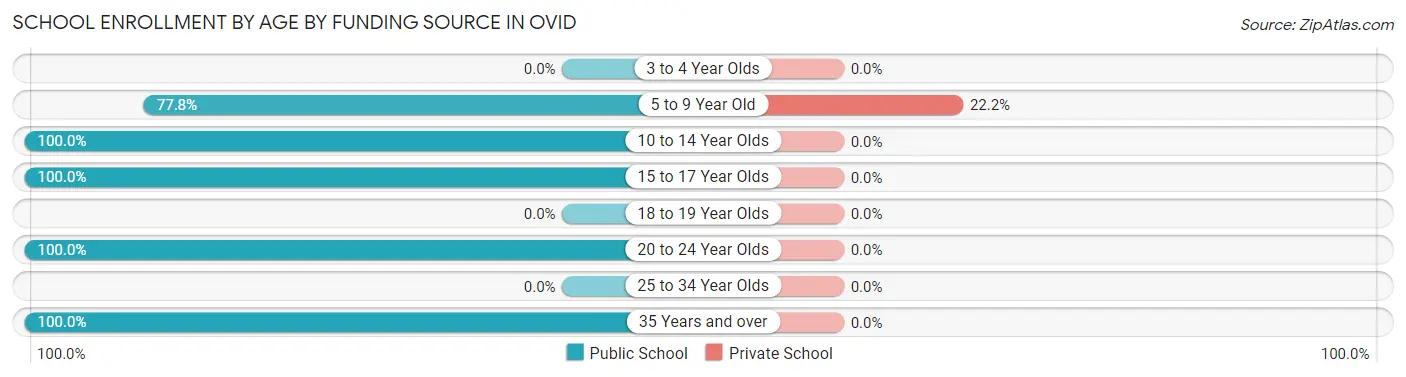
| Age Bracket | Public School | Private School |
| 3 to 4 Year Olds | 0 (0.0%) | 0 (0.0%) |
| 5 to 9 Year Old | 21 (77.8%) | 6 (22.2%) |
| 10 to 14 Year Olds | 20 (100.0%) | 0 (0.0%) |
| 15 to 17 Year Olds | 20 (100.0%) | 0 (0.0%) |
| 18 to 19 Year Olds | 0 (0.0%) | 0 (0.0%) |
| 20 to 24 Year Olds | 20 (100.0%) | 0 (0.0%) |
| 25 to 34 Year Olds | 0 (0.0%) | 0 (0.0%) |
| 35 Years and over | 2 (100.0%) | 0 (0.0%) |
| Total | 83 (93.3%) | 6 (6.7%) |
Educational Attainment by Field of Study in Ovid
Science & technology (24 | 31.2%), education (14 | 18.2%), social sciences (10 | 13.0%), literature & languages (9 | 11.7%), and business (8 | 10.4%) are the most common fields of study among 77 individuals in Ovid who have obtained a bachelor's degree or higher.
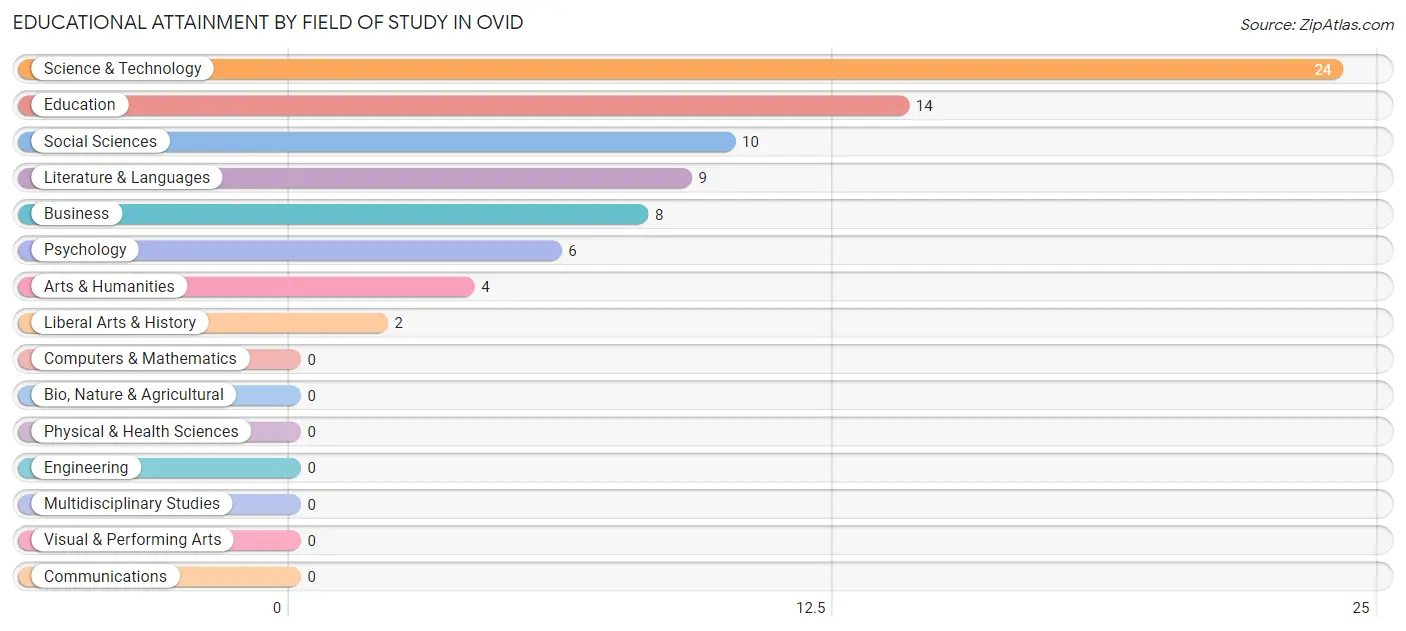
| Field of Study | # Graduates | % Graduates |
| Computers & Mathematics | 0 | 0.0% |
| Bio, Nature & Agricultural | 0 | 0.0% |
| Physical & Health Sciences | 0 | 0.0% |
| Psychology | 6 | 7.8% |
| Social Sciences | 10 | 13.0% |
| Engineering | 0 | 0.0% |
| Multidisciplinary Studies | 0 | 0.0% |
| Science & Technology | 24 | 31.2% |
| Business | 8 | 10.4% |
| Education | 14 | 18.2% |
| Literature & Languages | 9 | 11.7% |
| Liberal Arts & History | 2 | 2.6% |
| Visual & Performing Arts | 0 | 0.0% |
| Communications | 0 | 0.0% |
| Arts & Humanities | 4 | 5.2% |
| Total | 77 | 100.0% |
Transportation & Commute in Ovid
Vehicle Availability by Sex in Ovid
The most prevalent vehicle ownership categories in Ovid are males with 2 vehicles (60, accounting for 46.2%) and females with 2 vehicles (54, making up 47.2%).
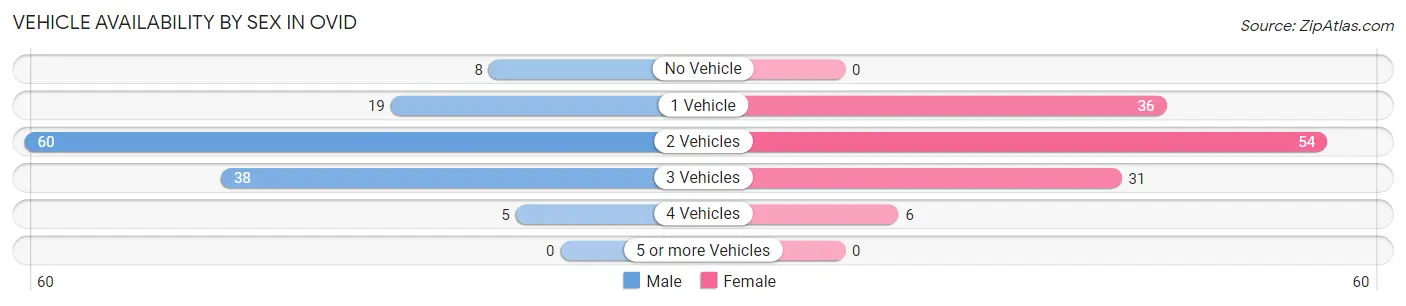
| Vehicles Available | Male | Female |
| No Vehicle | 8 (6.1%) | 0 (0.0%) |
| 1 Vehicle | 19 (14.6%) | 36 (28.3%) |
| 2 Vehicles | 60 (46.2%) | 54 (42.5%) |
| 3 Vehicles | 38 (29.2%) | 31 (24.4%) |
| 4 Vehicles | 5 (3.8%) | 6 (4.7%) |
| 5 or more Vehicles | 0 (0.0%) | 0 (0.0%) |
| Total | 130 (100.0%) | 127 (100.0%) |
Commute Time in Ovid
The most frequently occuring commute durations in Ovid are less than 5 minutes (49 commuters, 19.4%), 15 to 19 minutes (34 commuters, 13.4%), and 10 to 14 minutes (31 commuters, 12.2%).
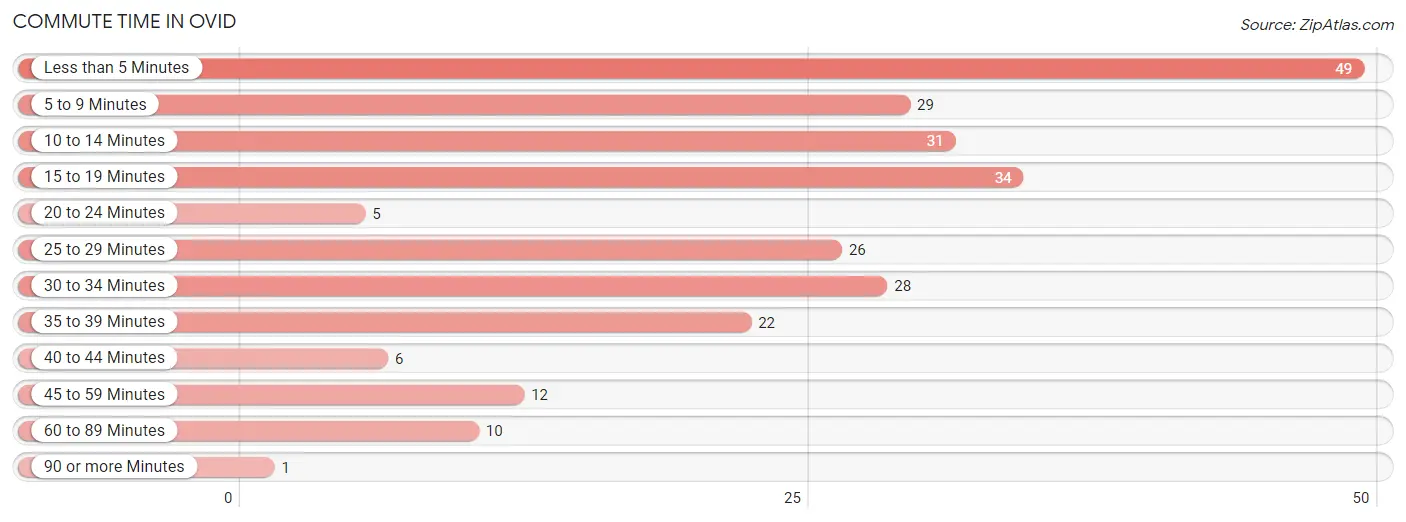
| Commute Time | # Commuters | % Commuters |
| Less than 5 Minutes | 49 | 19.4% |
| 5 to 9 Minutes | 29 | 11.5% |
| 10 to 14 Minutes | 31 | 12.2% |
| 15 to 19 Minutes | 34 | 13.4% |
| 20 to 24 Minutes | 5 | 2.0% |
| 25 to 29 Minutes | 26 | 10.3% |
| 30 to 34 Minutes | 28 | 11.1% |
| 35 to 39 Minutes | 22 | 8.7% |
| 40 to 44 Minutes | 6 | 2.4% |
| 45 to 59 Minutes | 12 | 4.7% |
| 60 to 89 Minutes | 10 | 4.0% |
| 90 or more Minutes | 1 | 0.4% |
Commute Time by Sex in Ovid
The most common commute times in Ovid are 10 to 14 minutes (26 commuters, 20.6%) for males and less than 5 minutes (31 commuters, 24.4%) for females.
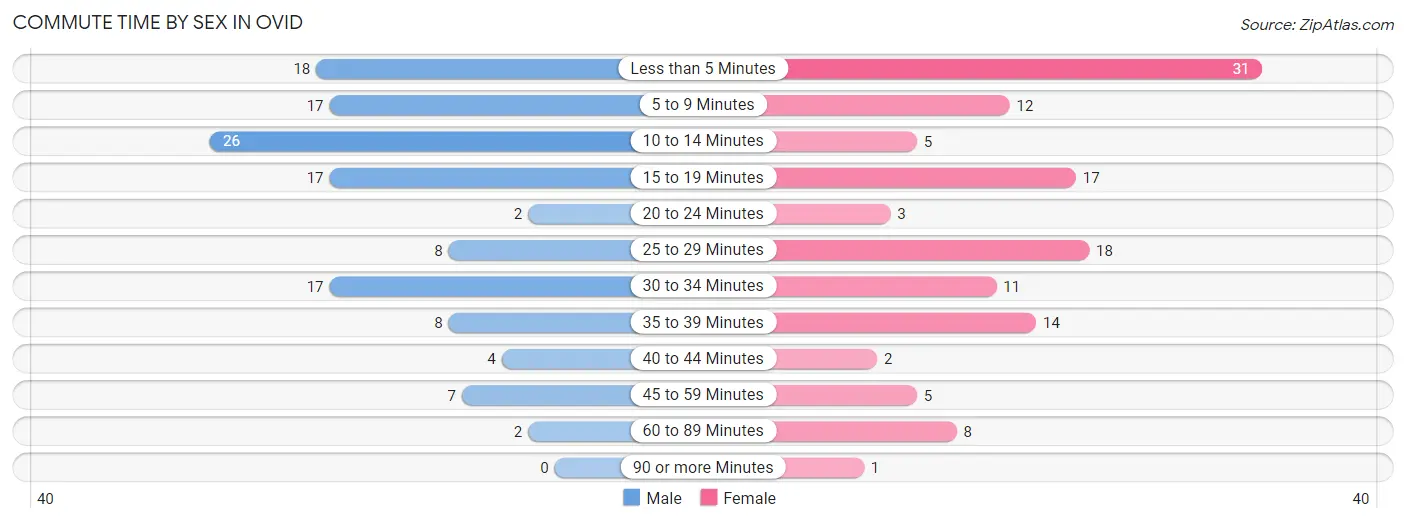
| Commute Time | Male | Female |
| Less than 5 Minutes | 18 (14.3%) | 31 (24.4%) |
| 5 to 9 Minutes | 17 (13.5%) | 12 (9.5%) |
| 10 to 14 Minutes | 26 (20.6%) | 5 (3.9%) |
| 15 to 19 Minutes | 17 (13.5%) | 17 (13.4%) |
| 20 to 24 Minutes | 2 (1.6%) | 3 (2.4%) |
| 25 to 29 Minutes | 8 (6.4%) | 18 (14.2%) |
| 30 to 34 Minutes | 17 (13.5%) | 11 (8.7%) |
| 35 to 39 Minutes | 8 (6.4%) | 14 (11.0%) |
| 40 to 44 Minutes | 4 (3.2%) | 2 (1.6%) |
| 45 to 59 Minutes | 7 (5.6%) | 5 (3.9%) |
| 60 to 89 Minutes | 2 (1.6%) | 8 (6.3%) |
| 90 or more Minutes | 0 (0.0%) | 1 (0.8%) |
Time of Departure to Work by Sex in Ovid
The most frequent times of departure to work in Ovid are 5:30 AM to 5:59 AM (26, 20.6%) for males and 6:30 AM to 6:59 AM (38, 29.9%) for females.
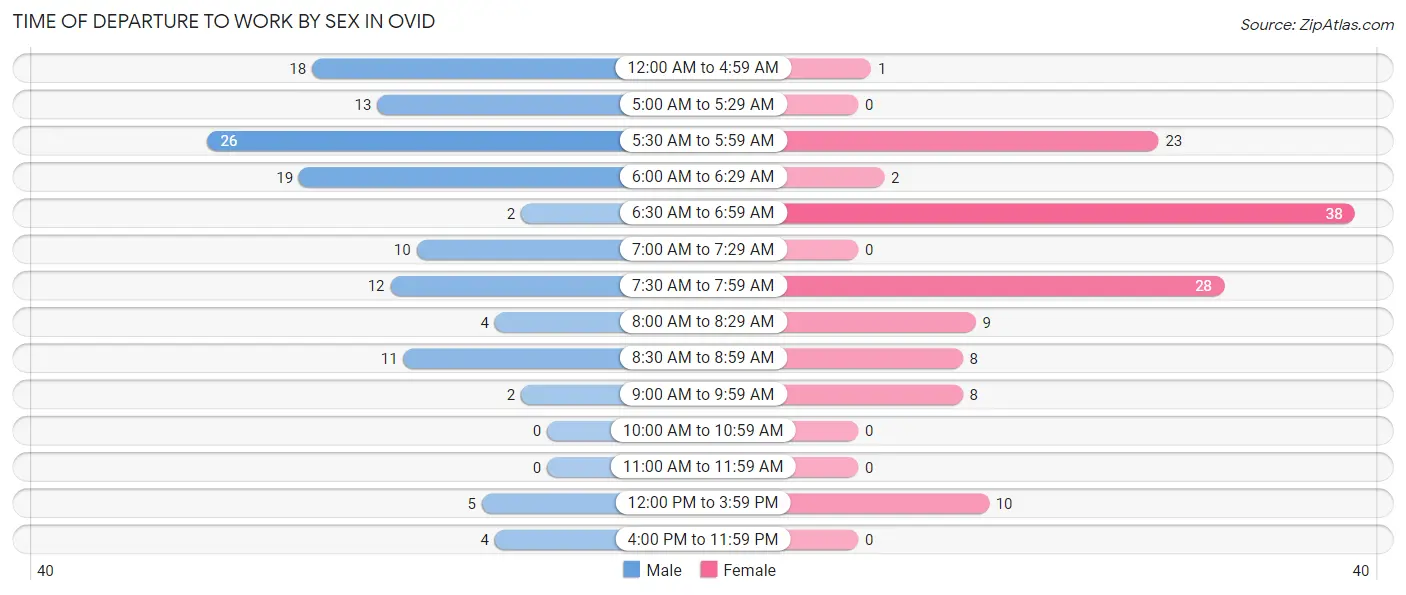
| Time of Departure | Male | Female |
| 12:00 AM to 4:59 AM | 18 (14.3%) | 1 (0.8%) |
| 5:00 AM to 5:29 AM | 13 (10.3%) | 0 (0.0%) |
| 5:30 AM to 5:59 AM | 26 (20.6%) | 23 (18.1%) |
| 6:00 AM to 6:29 AM | 19 (15.1%) | 2 (1.6%) |
| 6:30 AM to 6:59 AM | 2 (1.6%) | 38 (29.9%) |
| 7:00 AM to 7:29 AM | 10 (7.9%) | 0 (0.0%) |
| 7:30 AM to 7:59 AM | 12 (9.5%) | 28 (22.1%) |
| 8:00 AM to 8:29 AM | 4 (3.2%) | 9 (7.1%) |
| 8:30 AM to 8:59 AM | 11 (8.7%) | 8 (6.3%) |
| 9:00 AM to 9:59 AM | 2 (1.6%) | 8 (6.3%) |
| 10:00 AM to 10:59 AM | 0 (0.0%) | 0 (0.0%) |
| 11:00 AM to 11:59 AM | 0 (0.0%) | 0 (0.0%) |
| 12:00 PM to 3:59 PM | 5 (4.0%) | 10 (7.9%) |
| 4:00 PM to 11:59 PM | 4 (3.2%) | 0 (0.0%) |
| Total | 126 (100.0%) | 127 (100.0%) |
Housing Occupancy in Ovid
Occupancy by Ownership in Ovid
Of the total 216 dwellings in Ovid, owner-occupied units account for 146 (67.6%), while renter-occupied units make up 70 (32.4%).
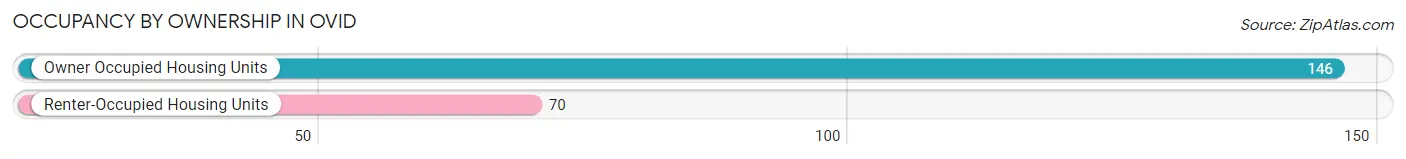
| Occupancy | # Housing Units | % Housing Units |
| Owner Occupied Housing Units | 146 | 67.6% |
| Renter-Occupied Housing Units | 70 | 32.4% |
| Total Occupied Housing Units | 216 | 100.0% |
Occupancy by Household Size in Ovid
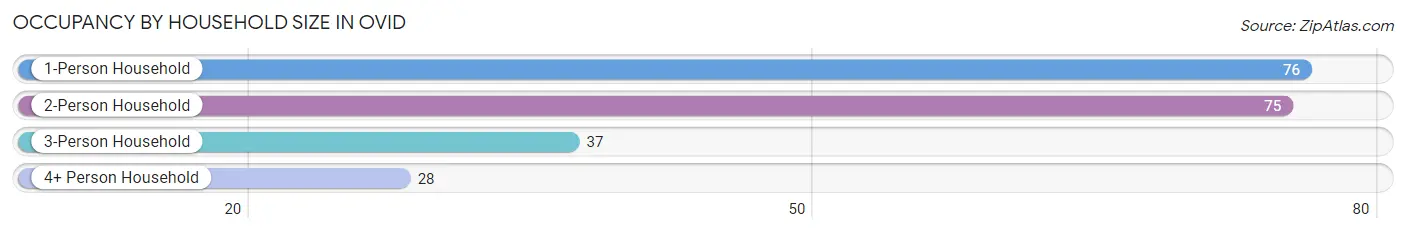
| Household Size | # Housing Units | % Housing Units |
| 1-Person Household | 76 | 35.2% |
| 2-Person Household | 75 | 34.7% |
| 3-Person Household | 37 | 17.1% |
| 4+ Person Household | 28 | 13.0% |
| Total Housing Units | 216 | 100.0% |
Occupancy by Ownership by Household Size in Ovid
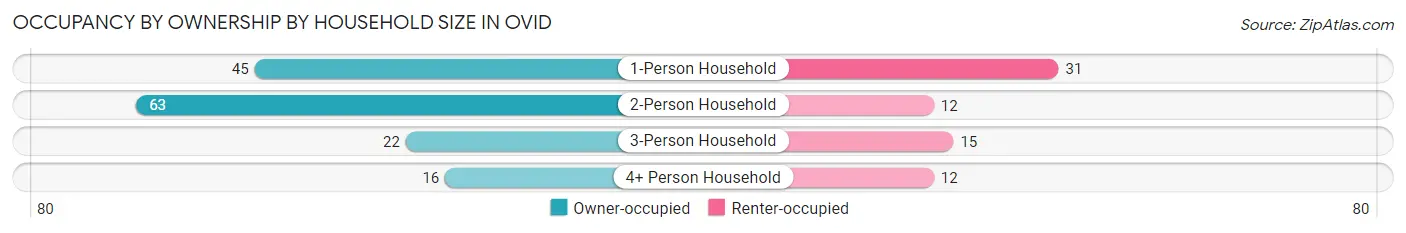
| Household Size | Owner-occupied | Renter-occupied |
| 1-Person Household | 45 (59.2%) | 31 (40.8%) |
| 2-Person Household | 63 (84.0%) | 12 (16.0%) |
| 3-Person Household | 22 (59.5%) | 15 (40.5%) |
| 4+ Person Household | 16 (57.1%) | 12 (42.9%) |
| Total Housing Units | 146 (67.6%) | 70 (32.4%) |
Occupancy by Educational Attainment in Ovid
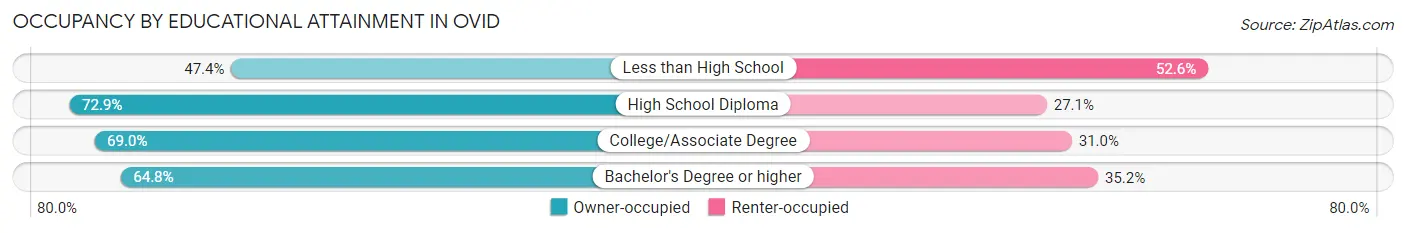
| Household Size | Owner-occupied | Renter-occupied |
| Less than High School | 9 (47.4%) | 10 (52.6%) |
| High School Diploma | 62 (72.9%) | 23 (27.1%) |
| College/Associate Degree | 40 (69.0%) | 18 (31.0%) |
| Bachelor's Degree or higher | 35 (64.8%) | 19 (35.2%) |
Occupancy by Age of Householder in Ovid
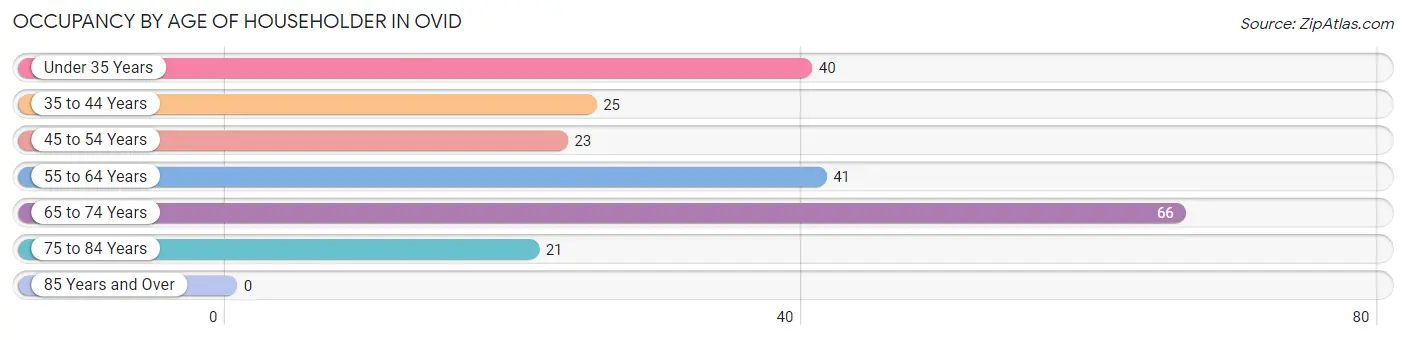
| Age Bracket | # Households | % Households |
| Under 35 Years | 40 | 18.5% |
| 35 to 44 Years | 25 | 11.6% |
| 45 to 54 Years | 23 | 10.6% |
| 55 to 64 Years | 41 | 19.0% |
| 65 to 74 Years | 66 | 30.6% |
| 75 to 84 Years | 21 | 9.7% |
| 85 Years and Over | 0 | 0.0% |
| Total | 216 | 100.0% |
Housing Finances in Ovid
Median Income by Occupancy in Ovid
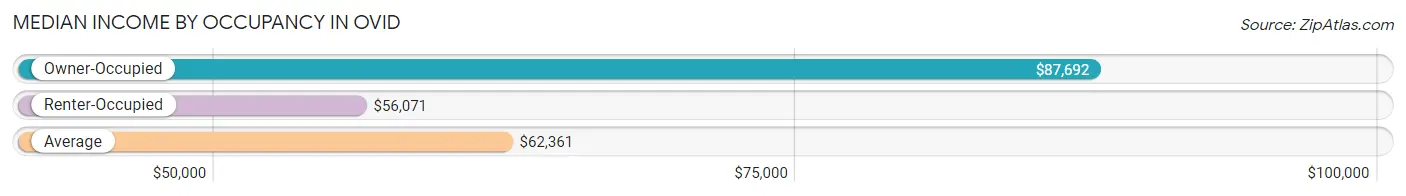
| Occupancy Type | # Households | Median Income |
| Owner-Occupied | 146 (67.6%) | $87,692 |
| Renter-Occupied | 70 (32.4%) | $56,071 |
| Average | 216 (100.0%) | $62,361 |
Occupancy by Householder Income Bracket in Ovid
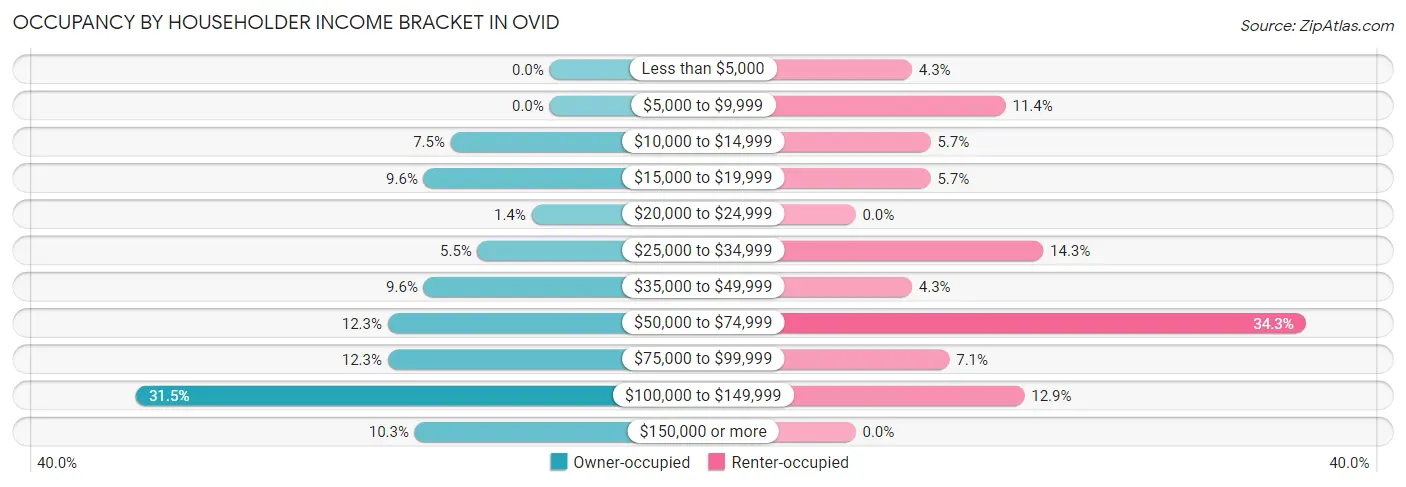
| Income Bracket | Owner-occupied | Renter-occupied |
| Less than $5,000 | 0 (0.0%) | 3 (4.3%) |
| $5,000 to $9,999 | 0 (0.0%) | 8 (11.4%) |
| $10,000 to $14,999 | 11 (7.5%) | 4 (5.7%) |
| $15,000 to $19,999 | 14 (9.6%) | 4 (5.7%) |
| $20,000 to $24,999 | 2 (1.4%) | 0 (0.0%) |
| $25,000 to $34,999 | 8 (5.5%) | 10 (14.3%) |
| $35,000 to $49,999 | 14 (9.6%) | 3 (4.3%) |
| $50,000 to $74,999 | 18 (12.3%) | 24 (34.3%) |
| $75,000 to $99,999 | 18 (12.3%) | 5 (7.1%) |
| $100,000 to $149,999 | 46 (31.5%) | 9 (12.9%) |
| $150,000 or more | 15 (10.3%) | 0 (0.0%) |
| Total | 146 (100.0%) | 70 (100.0%) |
Monthly Housing Cost Tiers in Ovid
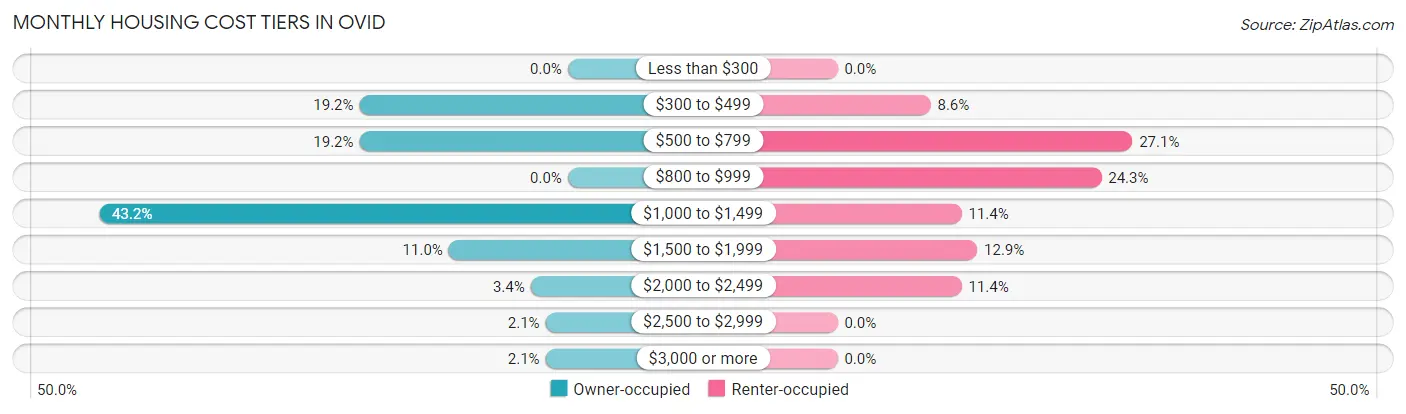
| Monthly Cost | Owner-occupied | Renter-occupied |
| Less than $300 | 0 (0.0%) | 0 (0.0%) |
| $300 to $499 | 28 (19.2%) | 6 (8.6%) |
| $500 to $799 | 28 (19.2%) | 19 (27.1%) |
| $800 to $999 | 0 (0.0%) | 17 (24.3%) |
| $1,000 to $1,499 | 63 (43.1%) | 8 (11.4%) |
| $1,500 to $1,999 | 16 (11.0%) | 9 (12.9%) |
| $2,000 to $2,499 | 5 (3.4%) | 8 (11.4%) |
| $2,500 to $2,999 | 3 (2.1%) | 0 (0.0%) |
| $3,000 or more | 3 (2.1%) | 0 (0.0%) |
| Total | 146 (100.0%) | 70 (100.0%) |
Physical Housing Characteristics in Ovid
Housing Structures in Ovid
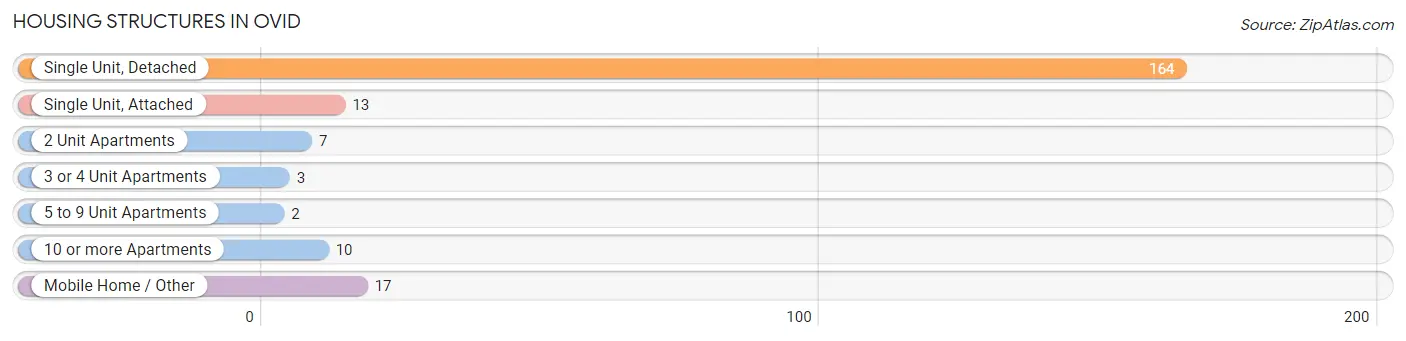
| Structure Type | # Housing Units | % Housing Units |
| Single Unit, Detached | 164 | 75.9% |
| Single Unit, Attached | 13 | 6.0% |
| 2 Unit Apartments | 7 | 3.2% |
| 3 or 4 Unit Apartments | 3 | 1.4% |
| 5 to 9 Unit Apartments | 2 | 0.9% |
| 10 or more Apartments | 10 | 4.6% |
| Mobile Home / Other | 17 | 7.9% |
| Total | 216 | 100.0% |
Housing Structures by Occupancy in Ovid
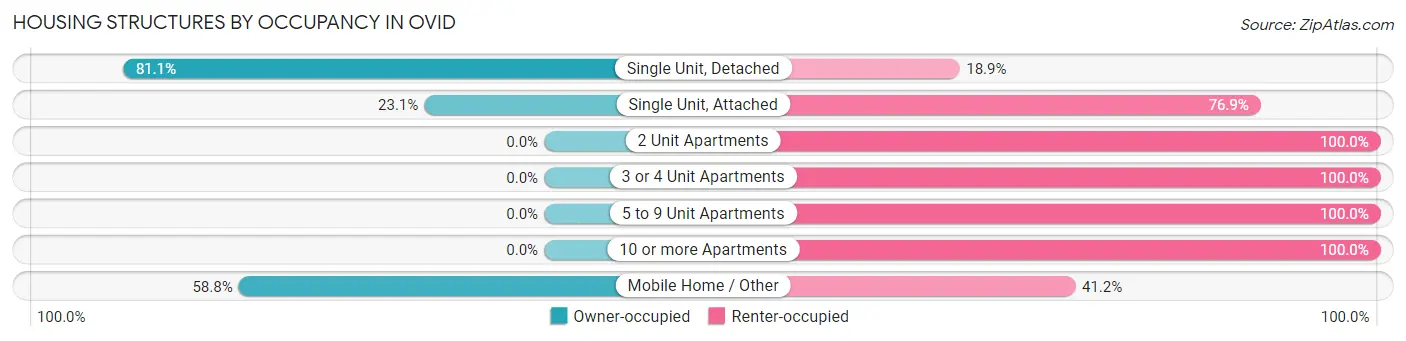
| Structure Type | Owner-occupied | Renter-occupied |
| Single Unit, Detached | 133 (81.1%) | 31 (18.9%) |
| Single Unit, Attached | 3 (23.1%) | 10 (76.9%) |
| 2 Unit Apartments | 0 (0.0%) | 7 (100.0%) |
| 3 or 4 Unit Apartments | 0 (0.0%) | 3 (100.0%) |
| 5 to 9 Unit Apartments | 0 (0.0%) | 2 (100.0%) |
| 10 or more Apartments | 0 (0.0%) | 10 (100.0%) |
| Mobile Home / Other | 10 (58.8%) | 7 (41.2%) |
| Total | 146 (67.6%) | 70 (32.4%) |
Housing Structures by Number of Rooms in Ovid
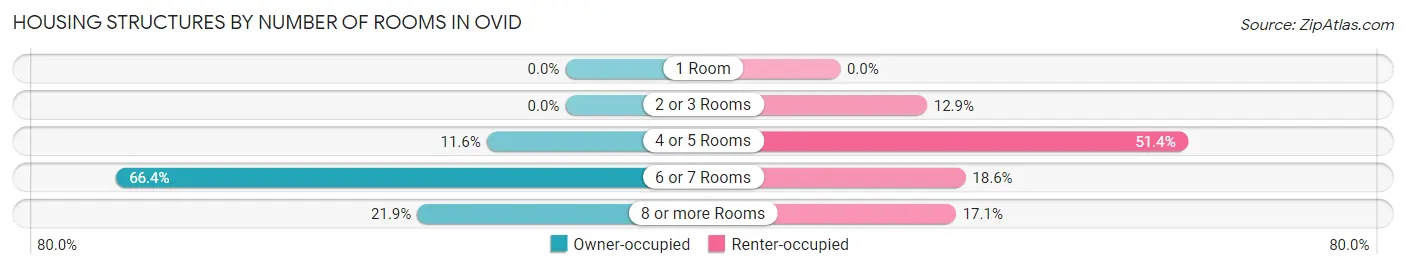
| Number of Rooms | Owner-occupied | Renter-occupied |
| 1 Room | 0 (0.0%) | 0 (0.0%) |
| 2 or 3 Rooms | 0 (0.0%) | 9 (12.9%) |
| 4 or 5 Rooms | 17 (11.6%) | 36 (51.4%) |
| 6 or 7 Rooms | 97 (66.4%) | 13 (18.6%) |
| 8 or more Rooms | 32 (21.9%) | 12 (17.1%) |
| Total | 146 (100.0%) | 70 (100.0%) |
Housing Structure by Heating Type in Ovid
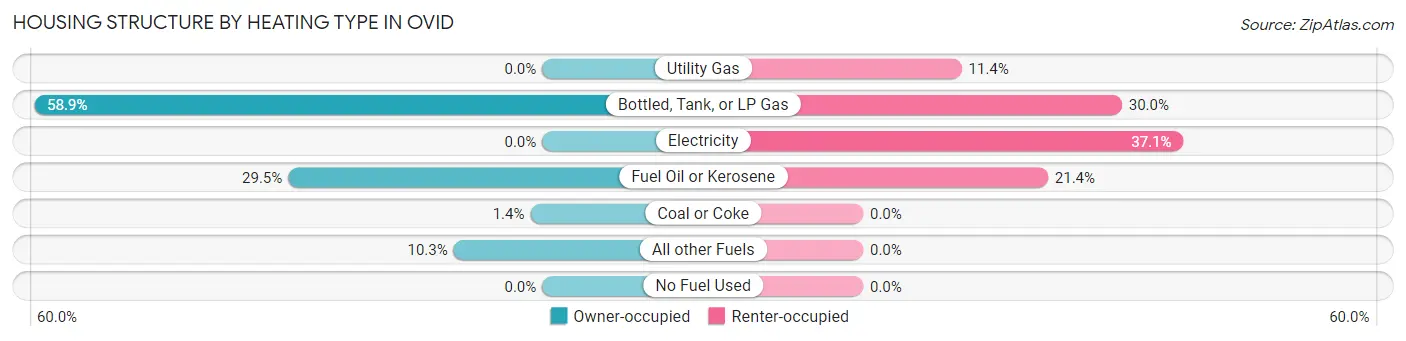
| Heating Type | Owner-occupied | Renter-occupied |
| Utility Gas | 0 (0.0%) | 8 (11.4%) |
| Bottled, Tank, or LP Gas | 86 (58.9%) | 21 (30.0%) |
| Electricity | 0 (0.0%) | 26 (37.1%) |
| Fuel Oil or Kerosene | 43 (29.4%) | 15 (21.4%) |
| Coal or Coke | 2 (1.4%) | 0 (0.0%) |
| All other Fuels | 15 (10.3%) | 0 (0.0%) |
| No Fuel Used | 0 (0.0%) | 0 (0.0%) |
| Total | 146 (100.0%) | 70 (100.0%) |
Household Vehicle Usage in Ovid
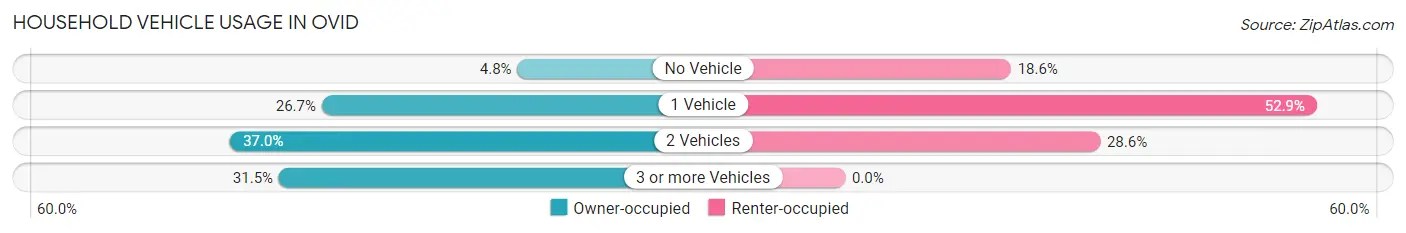
| Vehicles per Household | Owner-occupied | Renter-occupied |
| No Vehicle | 7 (4.8%) | 13 (18.6%) |
| 1 Vehicle | 39 (26.7%) | 37 (52.9%) |
| 2 Vehicles | 54 (37.0%) | 20 (28.6%) |
| 3 or more Vehicles | 46 (31.5%) | 0 (0.0%) |
| Total | 146 (100.0%) | 70 (100.0%) |
Real Estate & Mortgages in Ovid
Real Estate and Mortgage Overview in Ovid
| Characteristic | Without Mortgage | With Mortgage |
| Housing Units | 56 | 90 |
| Median Property Value | $81,100 | $122,600 |
| Median Household Income | - | - |
| Monthly Housing Costs | $500 | $3 |
| Real Estate Taxes | $1,397 | $0 |
Property Value by Mortgage Status in Ovid
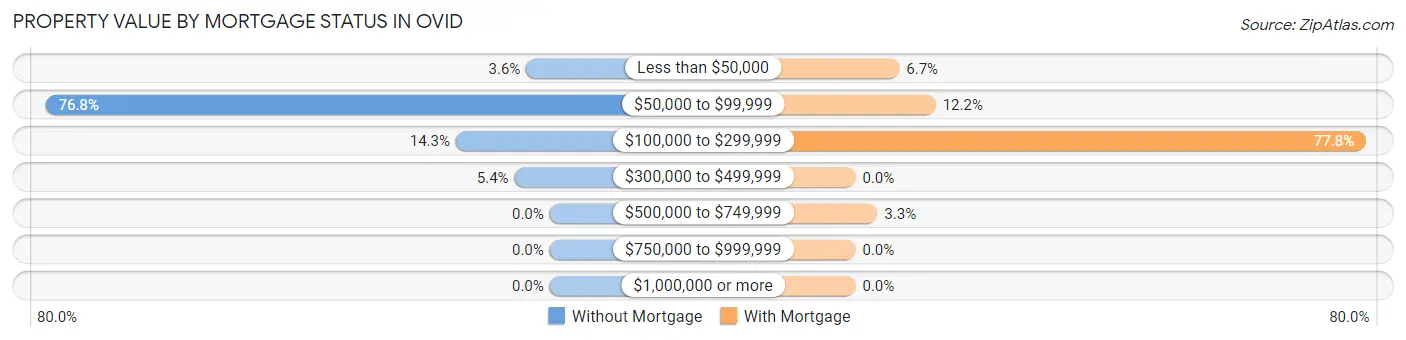
| Property Value | Without Mortgage | With Mortgage |
| Less than $50,000 | 2 (3.6%) | 6 (6.7%) |
| $50,000 to $99,999 | 43 (76.8%) | 11 (12.2%) |
| $100,000 to $299,999 | 8 (14.3%) | 70 (77.8%) |
| $300,000 to $499,999 | 3 (5.4%) | 0 (0.0%) |
| $500,000 to $749,999 | 0 (0.0%) | 3 (3.3%) |
| $750,000 to $999,999 | 0 (0.0%) | 0 (0.0%) |
| $1,000,000 or more | 0 (0.0%) | 0 (0.0%) |
| Total | 56 (100.0%) | 90 (100.0%) |
Household Income by Mortgage Status in Ovid
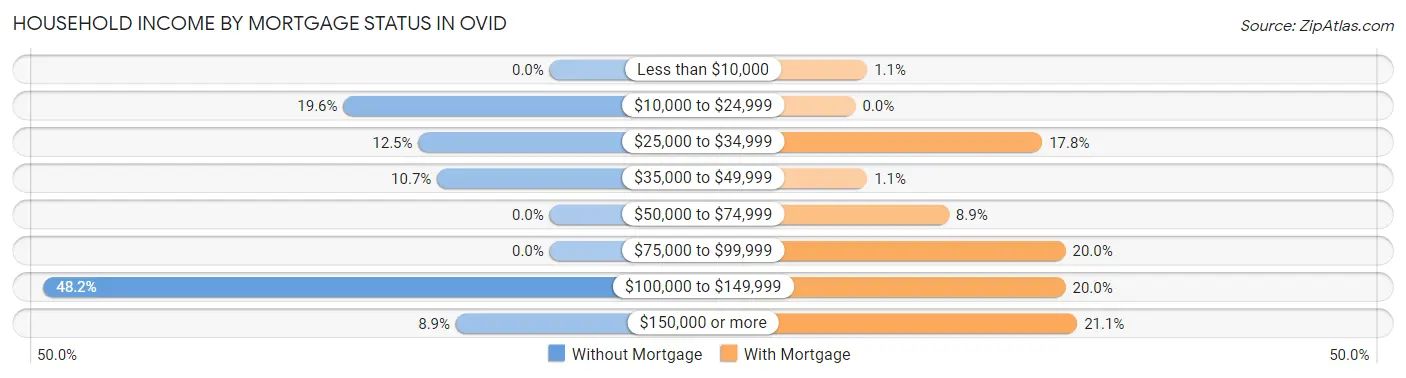
| Household Income | Without Mortgage | With Mortgage |
| Less than $10,000 | 0 (0.0%) | 1 (1.1%) |
| $10,000 to $24,999 | 11 (19.6%) | 0 (0.0%) |
| $25,000 to $34,999 | 7 (12.5%) | 16 (17.8%) |
| $35,000 to $49,999 | 6 (10.7%) | 1 (1.1%) |
| $50,000 to $74,999 | 0 (0.0%) | 8 (8.9%) |
| $75,000 to $99,999 | 0 (0.0%) | 18 (20.0%) |
| $100,000 to $149,999 | 27 (48.2%) | 18 (20.0%) |
| $150,000 or more | 5 (8.9%) | 19 (21.1%) |
| Total | 56 (100.0%) | 90 (100.0%) |
Property Value to Household Income Ratio in Ovid
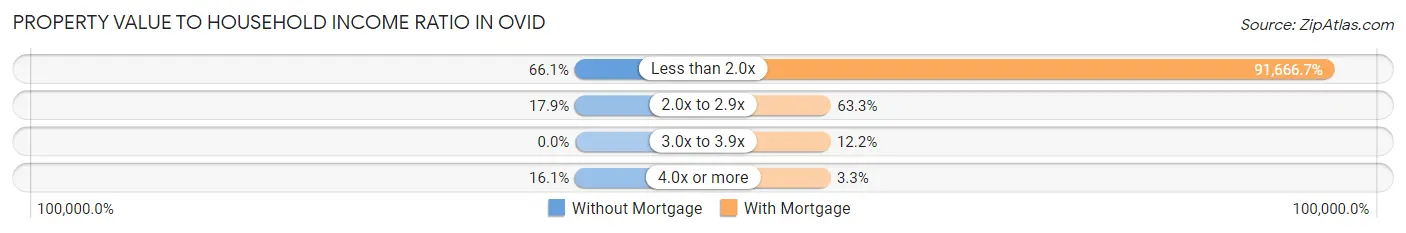
| Value-to-Income Ratio | Without Mortgage | With Mortgage |
| Less than 2.0x | 37 (66.1%) | 82,500 (91,666.7%) |
| 2.0x to 2.9x | 10 (17.9%) | 57 (63.3%) |
| 3.0x to 3.9x | 0 (0.0%) | 11 (12.2%) |
| 4.0x or more | 9 (16.1%) | 3 (3.3%) |
| Total | 56 (100.0%) | 90 (100.0%) |
Real Estate Taxes by Mortgage Status in Ovid
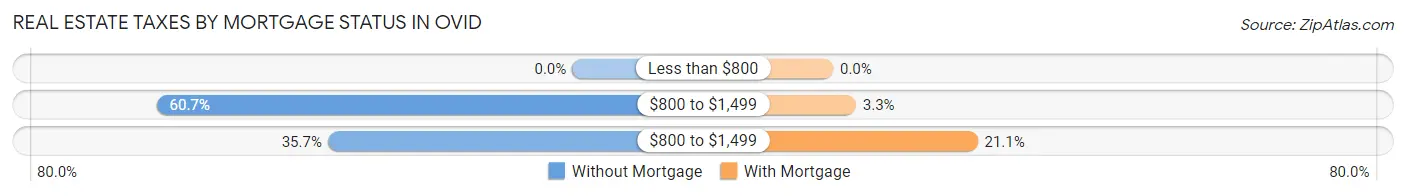
| Property Taxes | Without Mortgage | With Mortgage |
| Less than $800 | 0 (0.0%) | 0 (0.0%) |
| $800 to $1,499 | 34 (60.7%) | 3 (3.3%) |
| $800 to $1,499 | 20 (35.7%) | 19 (21.1%) |
| Total | 56 (100.0%) | 90 (100.0%) |
Health & Disability in Ovid
Health Insurance Coverage by Age in Ovid
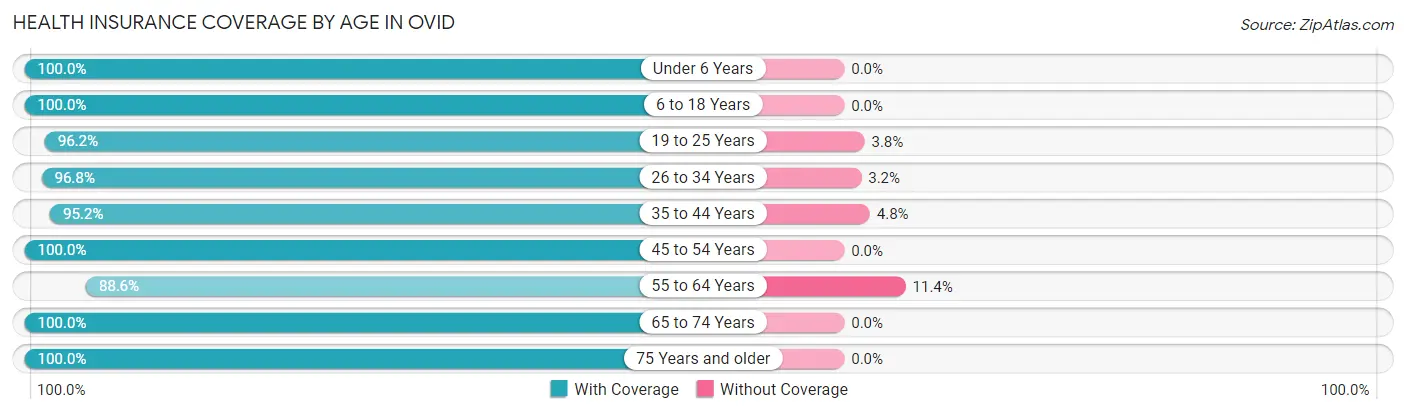
| Age Bracket | With Coverage | Without Coverage |
| Under 6 Years | 11 (100.0%) | 0 (0.0%) |
| 6 to 18 Years | 69 (100.0%) | 0 (0.0%) |
| 19 to 25 Years | 51 (96.2%) | 2 (3.8%) |
| 26 to 34 Years | 61 (96.8%) | 2 (3.2%) |
| 35 to 44 Years | 40 (95.2%) | 2 (4.8%) |
| 45 to 54 Years | 44 (100.0%) | 0 (0.0%) |
| 55 to 64 Years | 62 (88.6%) | 8 (11.4%) |
| 65 to 74 Years | 89 (100.0%) | 0 (0.0%) |
| 75 Years and older | 23 (100.0%) | 0 (0.0%) |
| Total | 450 (97.0%) | 14 (3.0%) |
Health Insurance Coverage by Citizenship Status in Ovid
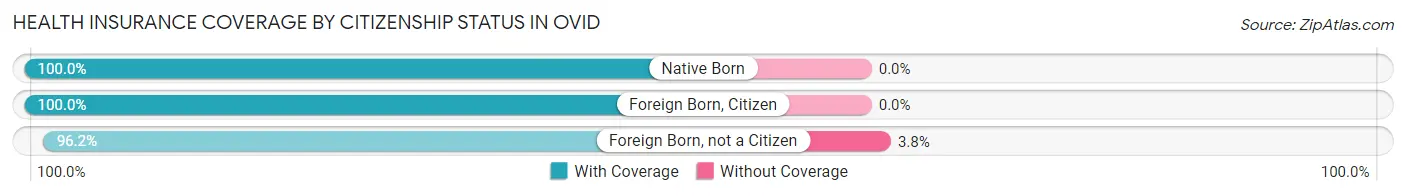
| Citizenship Status | With Coverage | Without Coverage |
| Native Born | 11 (100.0%) | 0 (0.0%) |
| Foreign Born, Citizen | 69 (100.0%) | 0 (0.0%) |
| Foreign Born, not a Citizen | 51 (96.2%) | 2 (3.8%) |
Health Insurance Coverage by Household Income in Ovid
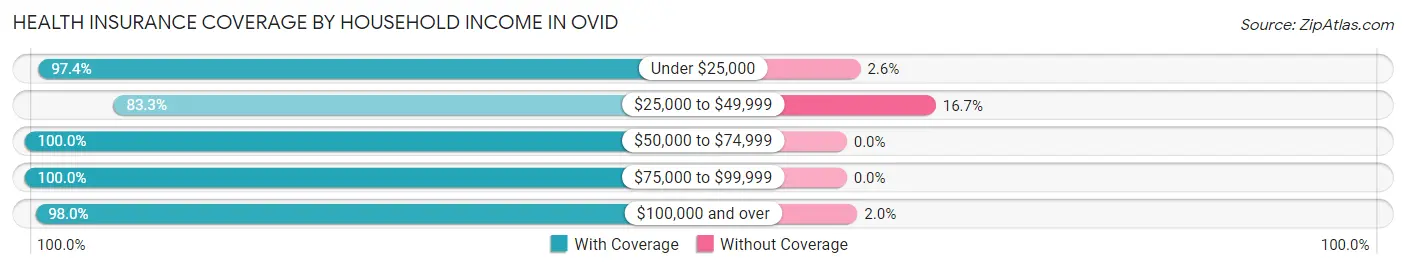
| Household Income | With Coverage | Without Coverage |
| Under $25,000 | 76 (97.4%) | 2 (2.6%) |
| $25,000 to $49,999 | 40 (83.3%) | 8 (16.7%) |
| $50,000 to $74,999 | 82 (100.0%) | 0 (0.0%) |
| $75,000 to $99,999 | 55 (100.0%) | 0 (0.0%) |
| $100,000 and over | 197 (98.0%) | 4 (2.0%) |
Public vs Private Health Insurance Coverage by Age in Ovid
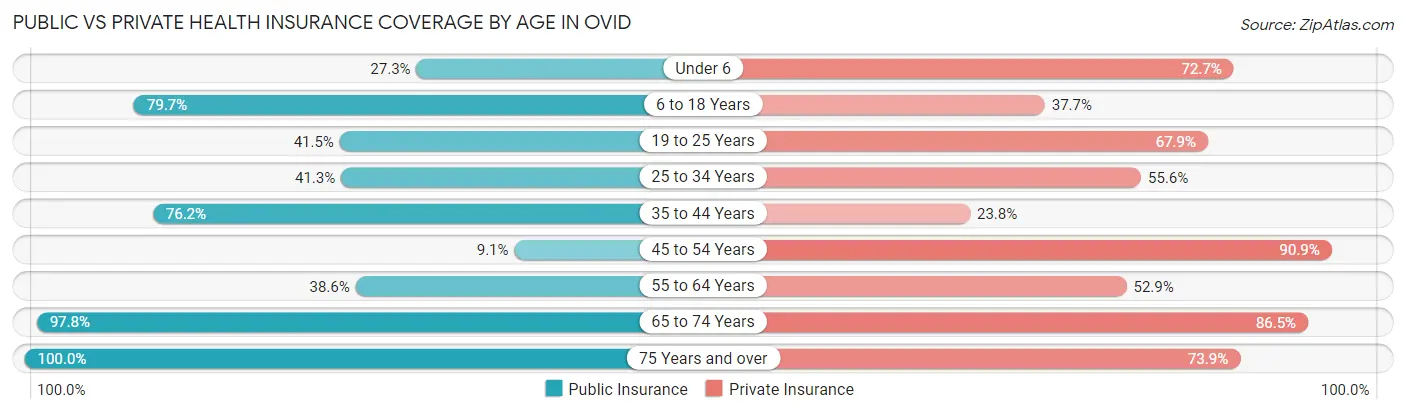
| Age Bracket | Public Insurance | Private Insurance |
| Under 6 | 3 (27.3%) | 8 (72.7%) |
| 6 to 18 Years | 55 (79.7%) | 26 (37.7%) |
| 19 to 25 Years | 22 (41.5%) | 36 (67.9%) |
| 25 to 34 Years | 26 (41.3%) | 35 (55.6%) |
| 35 to 44 Years | 32 (76.2%) | 10 (23.8%) |
| 45 to 54 Years | 4 (9.1%) | 40 (90.9%) |
| 55 to 64 Years | 27 (38.6%) | 37 (52.9%) |
| 65 to 74 Years | 87 (97.8%) | 77 (86.5%) |
| 75 Years and over | 23 (100.0%) | 17 (73.9%) |
| Total | 279 (60.1%) | 286 (61.6%) |
Disability Status by Sex by Age in Ovid
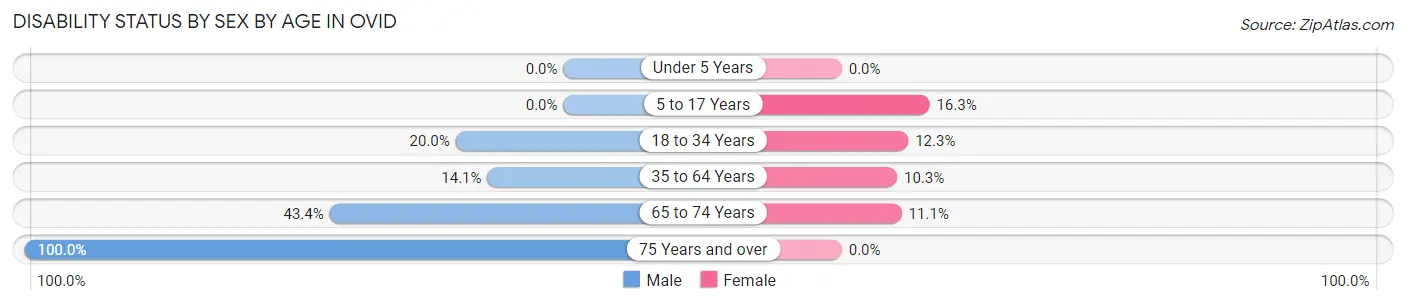
| Age Bracket | Male | Female |
| Under 5 Years | 0 (0.0%) | 0 (0.0%) |
| 5 to 17 Years | 0 (0.0%) | 7 (16.3%) |
| 18 to 34 Years | 9 (20.0%) | 9 (12.3%) |
| 35 to 64 Years | 11 (14.1%) | 8 (10.3%) |
| 65 to 74 Years | 23 (43.4%) | 4 (11.1%) |
| 75 Years and over | 3 (100.0%) | 0 (0.0%) |
Disability Class by Sex by Age in Ovid
Disability Class: Hearing Difficulty
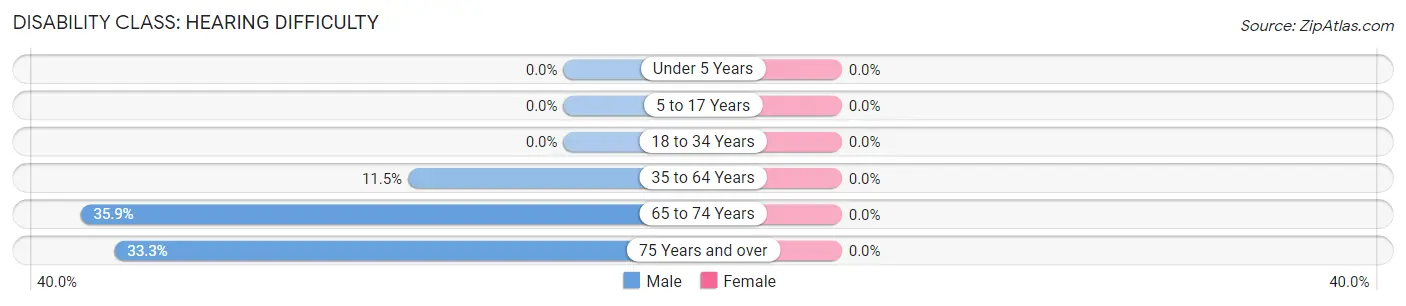
| Age Bracket | Male | Female |
| Under 5 Years | 0 (0.0%) | 0 (0.0%) |
| 5 to 17 Years | 0 (0.0%) | 0 (0.0%) |
| 18 to 34 Years | 0 (0.0%) | 0 (0.0%) |
| 35 to 64 Years | 9 (11.5%) | 0 (0.0%) |
| 65 to 74 Years | 19 (35.8%) | 0 (0.0%) |
| 75 Years and over | 1 (33.3%) | 0 (0.0%) |
Disability Class: Vision Difficulty
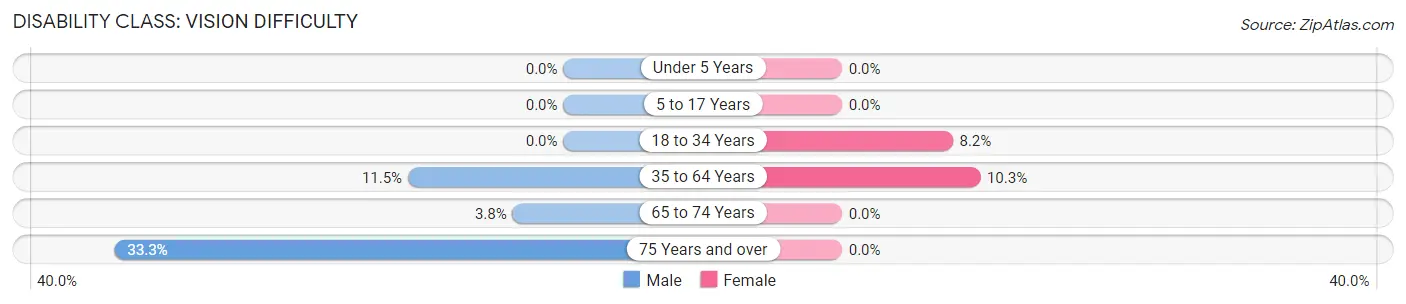
| Age Bracket | Male | Female |
| Under 5 Years | 0 (0.0%) | 0 (0.0%) |
| 5 to 17 Years | 0 (0.0%) | 0 (0.0%) |
| 18 to 34 Years | 0 (0.0%) | 6 (8.2%) |
| 35 to 64 Years | 9 (11.5%) | 8 (10.3%) |
| 65 to 74 Years | 2 (3.8%) | 0 (0.0%) |
| 75 Years and over | 1 (33.3%) | 0 (0.0%) |
Disability Class: Cognitive Difficulty
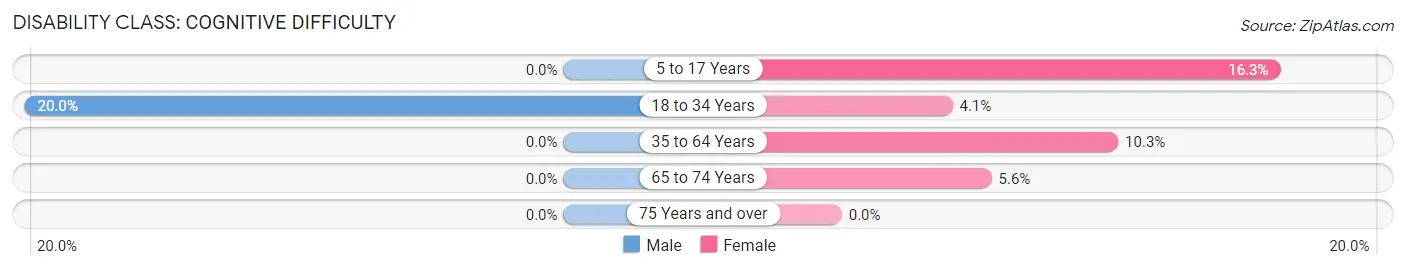
| Age Bracket | Male | Female |
| 5 to 17 Years | 0 (0.0%) | 7 (16.3%) |
| 18 to 34 Years | 9 (20.0%) | 3 (4.1%) |
| 35 to 64 Years | 0 (0.0%) | 8 (10.3%) |
| 65 to 74 Years | 0 (0.0%) | 2 (5.6%) |
| 75 Years and over | 0 (0.0%) | 0 (0.0%) |
Disability Class: Ambulatory Difficulty
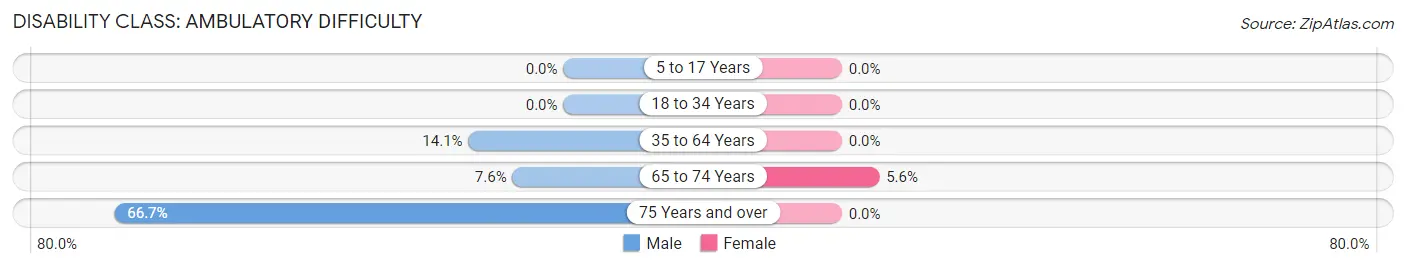
| Age Bracket | Male | Female |
| 5 to 17 Years | 0 (0.0%) | 0 (0.0%) |
| 18 to 34 Years | 0 (0.0%) | 0 (0.0%) |
| 35 to 64 Years | 11 (14.1%) | 0 (0.0%) |
| 65 to 74 Years | 4 (7.5%) | 2 (5.6%) |
| 75 Years and over | 2 (66.7%) | 0 (0.0%) |
Disability Class: Self-Care Difficulty
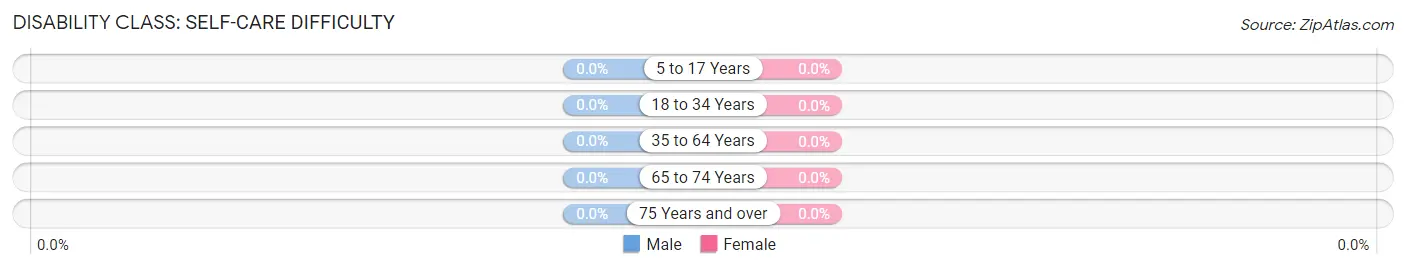
| Age Bracket | Male | Female |
| 5 to 17 Years | 0 (0.0%) | 0 (0.0%) |
| 18 to 34 Years | 0 (0.0%) | 0 (0.0%) |
| 35 to 64 Years | 0 (0.0%) | 0 (0.0%) |
| 65 to 74 Years | 0 (0.0%) | 0 (0.0%) |
| 75 Years and over | 0 (0.0%) | 0 (0.0%) |
Technology Access in Ovid
Computing Device Access in Ovid
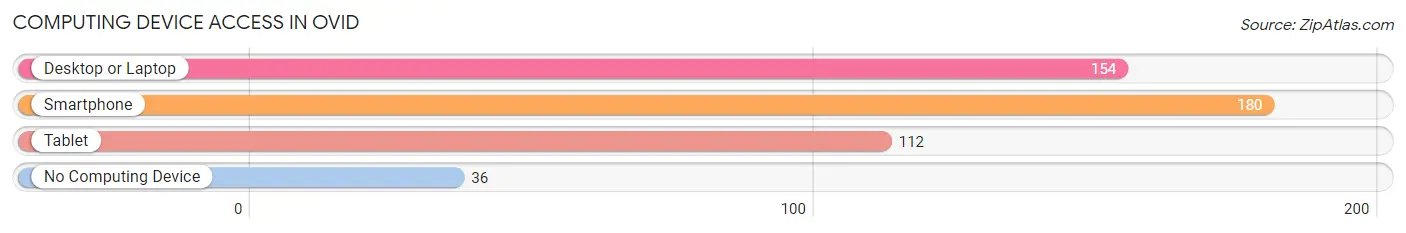
| Device Type | # Households | % Households |
| Desktop or Laptop | 154 | 71.3% |
| Smartphone | 180 | 83.3% |
| Tablet | 112 | 51.8% |
| No Computing Device | 36 | 16.7% |
| Total | 216 | 100.0% |
Internet Access in Ovid
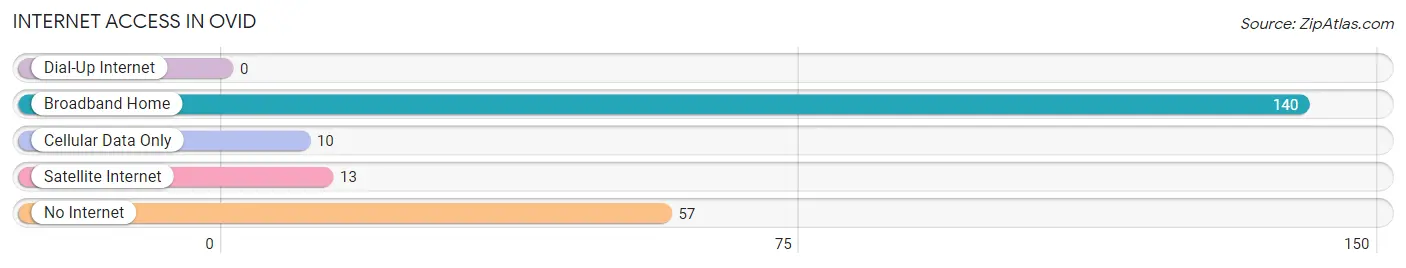
| Internet Type | # Households | % Households |
| Dial-Up Internet | 0 | 0.0% |
| Broadband Home | 140 | 64.8% |
| Cellular Data Only | 10 | 4.6% |
| Satellite Internet | 13 | 6.0% |
| No Internet | 57 | 26.4% |
| Total | 216 | 100.0% |
Ovid Summary
Ovid is a small town located in Seneca County, New York, United States. It is situated on the eastern shore of Cayuga Lake, the largest of the Finger Lakes. The town was named after the Roman poet Ovid, who wrote the Metamorphoses. The town of Ovid has a population of approximately 1,500 people and covers an area of about 10 square miles.
Geography
Ovid is located in the Finger Lakes region of New York State. It is situated on the eastern shore of Cayuga Lake, the largest of the Finger Lakes. The town is bordered by the towns of Covert to the north, Romulus to the east, Lodi to the south, and Varick to the west. The town is located approximately 30 miles south of the city of Rochester and about 40 miles east of the city of Syracuse.
The terrain of Ovid is mostly flat, with some rolling hills. The town is located in a region of New York known for its fertile soil and abundant natural resources. The Finger Lakes region is known for its many vineyards and wineries, and Ovid is no exception. The town is home to several wineries, including the Ovid Winery and the Seneca Lake Winery.
Climate
Ovid has a humid continental climate, with cold winters and warm summers. The average annual temperature is around 50°F, with an average high of around 70°F in the summer and an average low of around 30°F in the winter. The town receives an average of around 40 inches of precipitation per year, with most of it falling in the form of snow in the winter months.
Demographics
As of the 2010 census, the town of Ovid had a population of 1,521 people. The racial makeup of the town was 97.2% White, 0.7% African American, 0.3% Native American, 0.3% Asian, 0.2% from other races, and 1.5% from two or more races. Hispanic or Latino of any race were 1.2% of the population.
The median household income in Ovid was $45,938 in 2018, with a poverty rate of 11.3%. The median age of the town's population was 43.7 years. The largest age group was 45-64, making up 33.3% of the population.
Economy
The economy of Ovid is largely based on agriculture and tourism. The town is home to several wineries, including the Ovid Winery and the Seneca Lake Winery. The town is also home to several farms, including the Ovid Farm Market, which sells locally grown produce.
The town is also home to several small businesses, including restaurants, shops, and other services. The town is also home to a few manufacturing companies, including a plastics manufacturer and a metal fabrication company.
The town is served by the Ovid-Willard Airport, which offers general aviation services. The airport is located just outside of town and is used primarily for recreational flying.
Conclusion
Ovid is a small town located in Seneca County, New York, United States. It is situated on the eastern shore of Cayuga Lake, the largest of the Finger Lakes. The town has a population of approximately 1,500 people and covers an area of about 10 square miles. The town is known for its wineries, farms, and other small businesses. The town is also home to a few manufacturing companies and is served by the Ovid-Willard Airport. The town has a humid continental climate, with cold winters and warm summers. The median household income in Ovid was $45,938 in 2018, with a poverty rate of 11.3%. The town's economy is largely based on agriculture and tourism.
Common Questions
What is the Total Population of Ovid?
Total Population of Ovid is 464.
What is the Total Male Population of Ovid?
Total Male Population of Ovid is 203.
What is the Total Female Population of Ovid?
Total Female Population of Ovid is 261.
What is the Ratio of Males per 100 Females in Ovid?
There are 77.78 Males per 100 Females in Ovid.
What is the Ratio of Females per 100 Males in Ovid?
There are 128.57 Females per 100 Males in Ovid.
What is the Median Population Age in Ovid?
Median Population Age in Ovid is 42.0 Years.
What is the Average Family Size in Ovid
Average Family Size in Ovid is 2.8 People.
What is the Average Household Size in Ovid
Average Household Size in Ovid is 2.1 People.
What is Per Capita Income in Ovid?
Per Capita income in Ovid is $37,475.
What is the Median Family Income in Ovid?
Median Family Income in Ovid is $125,132.
What is the Median Household income in Ovid?
Median Household Income in Ovid is $62,361.
What is Income or Wage Gap in Ovid?
Income or Wage Gap in Ovid is 14.1%.
Women in Ovid earn 85.9 cents for every dollar earned by a man.
What is Inequality or Gini Index in Ovid?
Inequality or Gini Index in Ovid is 0.41.
How Large is the Labor Force in Ovid?
There are 269 People in the Labor Forcein in Ovid.
What is the Percentage of People in the Labor Force in Ovid?
67.6% of People are in the Labor Force in Ovid.
What is the Unemployment Rate in Ovid?
Unemployment Rate in Ovid is 4.5%.