Oriskany, NY
Oriskany Map
Oriskany Overview
1,201
TOTAL POPULATION
564
MALE POPULATION
637
FEMALE POPULATION
88.54
MALES / 100 FEMALES
112.94
FEMALES / 100 MALES
44.3
MEDIAN AGE
2.9
AVG FAMILY SIZE
2.2
AVG HOUSEHOLD SIZE
$32,758
PER CAPITA INCOME
$79,286
AVG FAMILY INCOME
$63,194
AVG HOUSEHOLD INCOME
4.0%
WAGE / INCOME GAP [ % ]
96.0¢/ $1
WAGE / INCOME GAP [ $ ]
0.41
INEQUALITY / GINI INDEX
599
LABOR FORCE [ PEOPLE ]
59.8%
PERCENT IN LABOR FORCE
2.2%
UNEMPLOYMENT RATE
Oriskany Zip Codes
Oriskany Area Codes
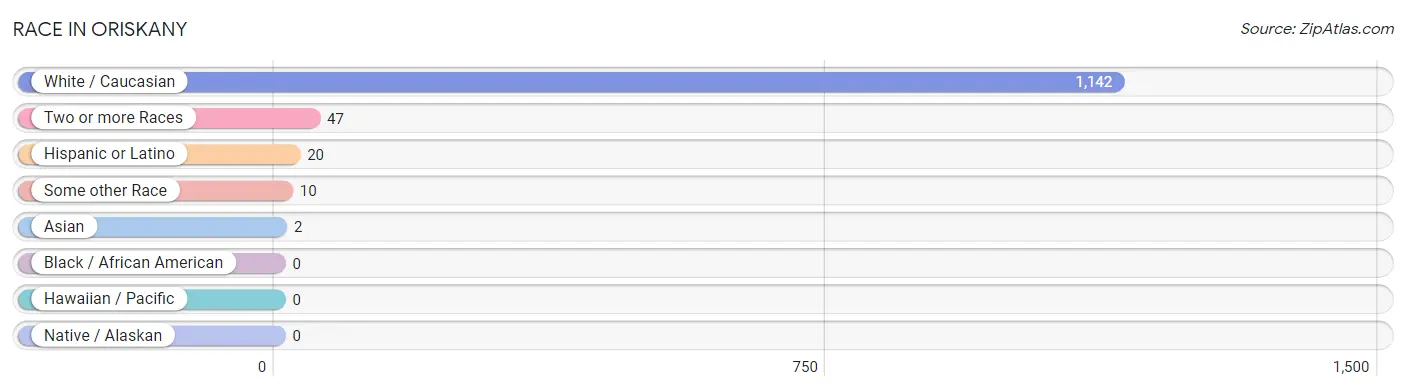
Race in Oriskany
The most populous races in Oriskany are White / Caucasian (1,142 | 95.1%), Two or more Races (47 | 3.9%), and Hispanic or Latino (20 | 1.7%).
| Race | # Population | % Population |
| Asian | 2 | 0.2% |
| Black / African American | 0 | 0.0% |
| Hawaiian / Pacific | 0 | 0.0% |
| Hispanic or Latino | 20 | 1.7% |
| Native / Alaskan | 0 | 0.0% |
| White / Caucasian | 1,142 | 95.1% |
| Two or more Races | 47 | 3.9% |
| Some other Race | 10 | 0.8% |
| Total | 1,201 | 100.0% |
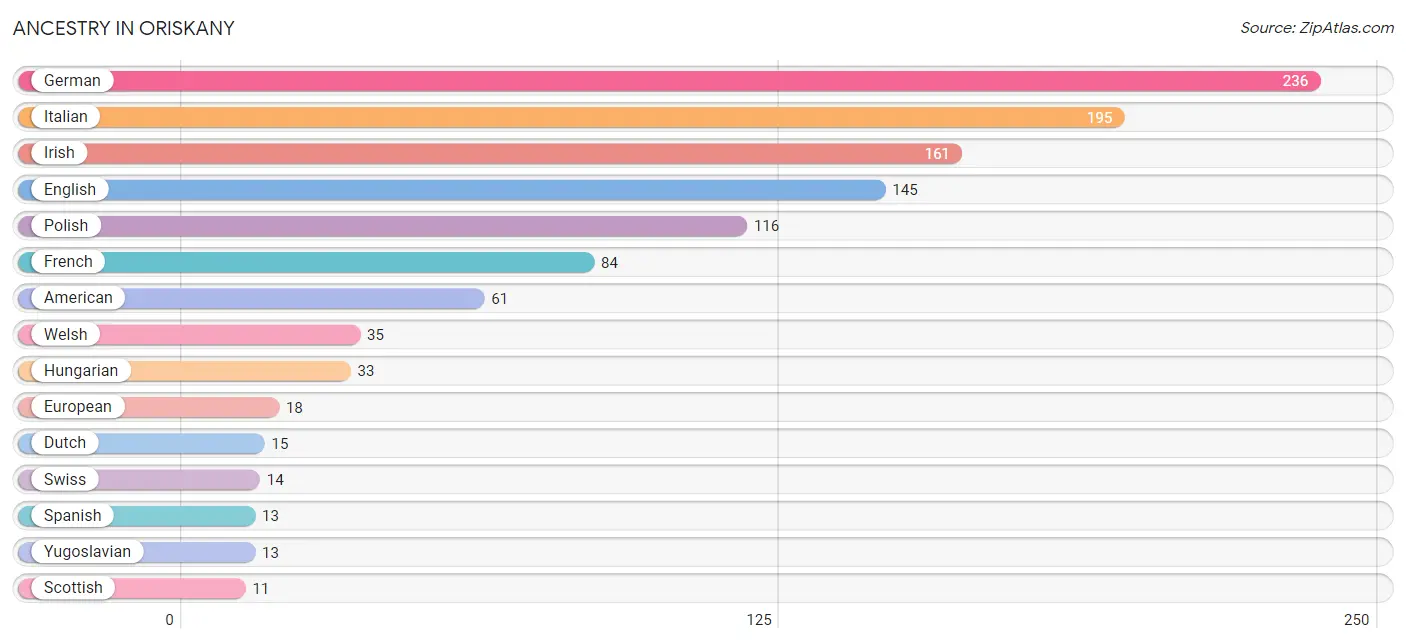
Ancestry in Oriskany
The most populous ancestries reported in Oriskany are German (236 | 19.7%), Italian (195 | 16.2%), Irish (161 | 13.4%), English (145 | 12.1%), and Polish (116 | 9.7%), together accounting for 71.0% of all Oriskany residents.
| Ancestry | # Population | % Population |
| American | 61 | 5.1% |
| Bhutanese | 9 | 0.7% |
| Brazilian | 3 | 0.3% |
| British | 9 | 0.7% |
| Burmese | 2 | 0.2% |
| Czech | 10 | 0.8% |
| Dutch | 15 | 1.3% |
| English | 145 | 12.1% |
| European | 18 | 1.5% |
| French | 84 | 7.0% |
| French Canadian | 10 | 0.8% |
| German | 236 | 19.7% |
| Greek | 5 | 0.4% |
| Hungarian | 33 | 2.8% |
| Irish | 161 | 13.4% |
| Italian | 195 | 16.2% |
| Northern European | 4 | 0.3% |
| Polish | 116 | 9.7% |
| Puerto Rican | 7 | 0.6% |
| Russian | 5 | 0.4% |
| Scandinavian | 4 | 0.3% |
| Scottish | 11 | 0.9% |
| Spanish | 13 | 1.1% |
| Swedish | 8 | 0.7% |
| Swiss | 14 | 1.2% |
| Welsh | 35 | 2.9% |
| Yugoslavian | 13 | 1.1% | View All 27 Rows |
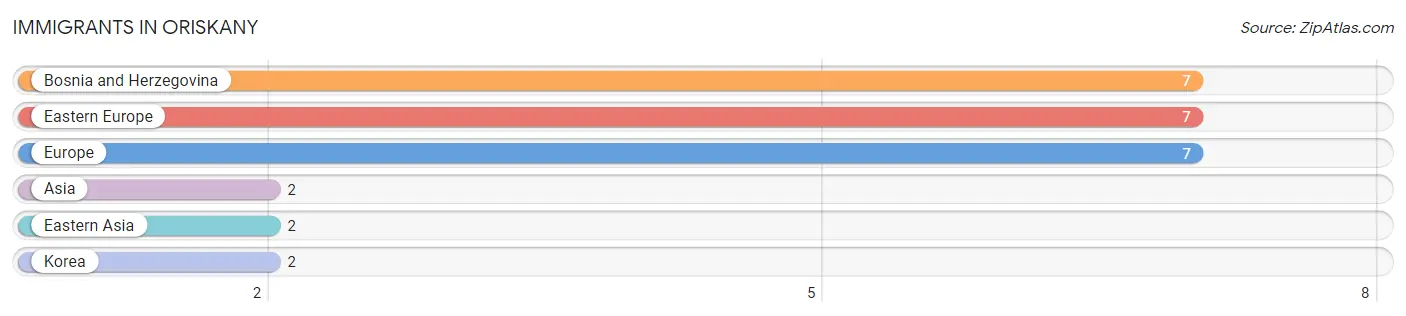
Immigrants in Oriskany
The most numerous immigrant groups reported in Oriskany came from Bosnia and Herzegovina (7 | 0.6%), Eastern Europe (7 | 0.6%), Europe (7 | 0.6%), Asia (2 | 0.2%), and Eastern Asia (2 | 0.2%), together accounting for 2.1% of all Oriskany residents.
| Immigration Origin | # Population | % Population |
| Asia | 2 | 0.2% |
| Bosnia and Herzegovina | 7 | 0.6% |
| Eastern Asia | 2 | 0.2% |
| Eastern Europe | 7 | 0.6% |
| Europe | 7 | 0.6% |
| Korea | 2 | 0.2% | View All 6 Rows |
Sex and Age in Oriskany
Sex and Age in Oriskany
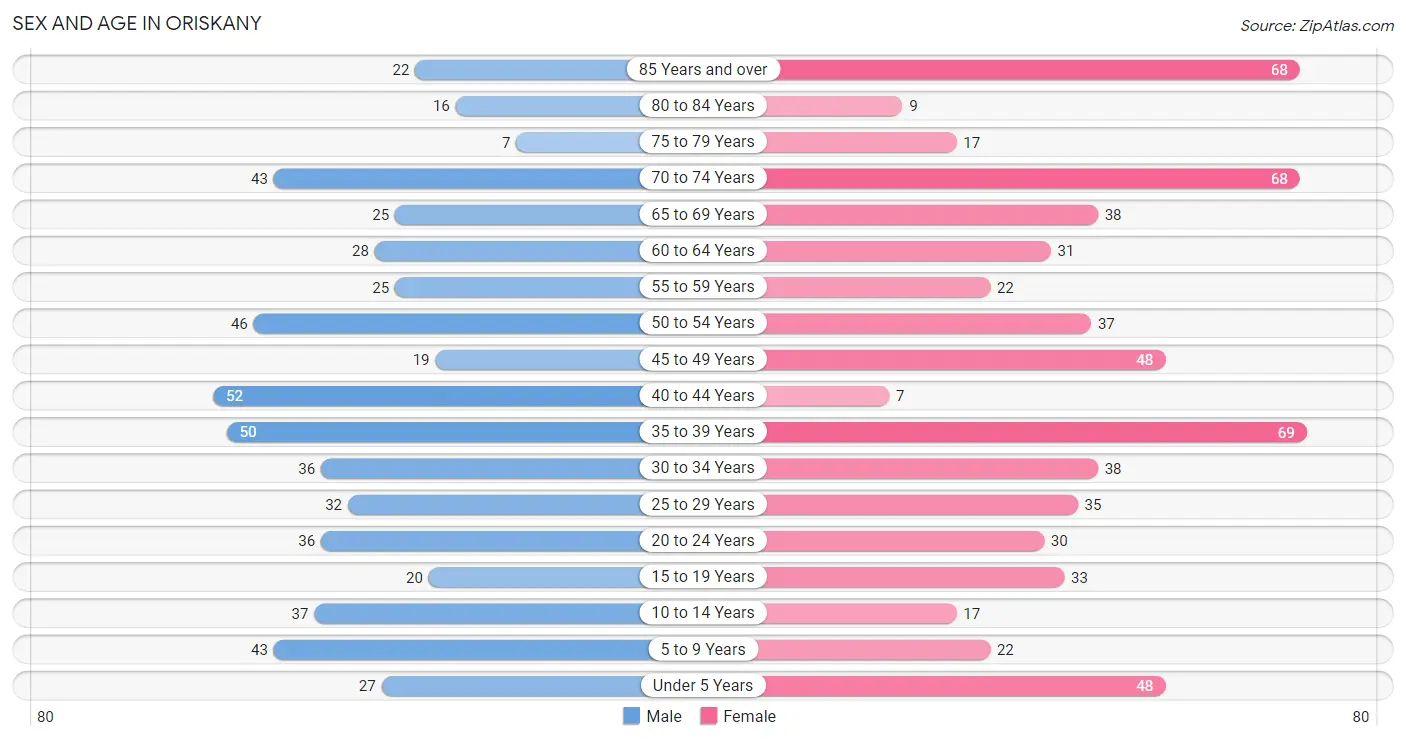
The most populous age groups in Oriskany are 40 to 44 Years (52 | 9.2%) for men and 35 to 39 Years (69 | 10.8%) for women.
| Age Bracket | Male | Female |
| Under 5 Years | 27 (4.8%) | 48 (7.5%) |
| 5 to 9 Years | 43 (7.6%) | 22 (3.5%) |
| 10 to 14 Years | 37 (6.6%) | 17 (2.7%) |
| 15 to 19 Years | 20 (3.5%) | 33 (5.2%) |
| 20 to 24 Years | 36 (6.4%) | 30 (4.7%) |
| 25 to 29 Years | 32 (5.7%) | 35 (5.5%) |
| 30 to 34 Years | 36 (6.4%) | 38 (6.0%) |
| 35 to 39 Years | 50 (8.9%) | 69 (10.8%) |
| 40 to 44 Years | 52 (9.2%) | 7 (1.1%) |
| 45 to 49 Years | 19 (3.4%) | 48 (7.5%) |
| 50 to 54 Years | 46 (8.2%) | 37 (5.8%) |
| 55 to 59 Years | 25 (4.4%) | 22 (3.5%) |
| 60 to 64 Years | 28 (5.0%) | 31 (4.9%) |
| 65 to 69 Years | 25 (4.4%) | 38 (6.0%) |
| 70 to 74 Years | 43 (7.6%) | 68 (10.7%) |
| 75 to 79 Years | 7 (1.2%) | 17 (2.7%) |
| 80 to 84 Years | 16 (2.8%) | 9 (1.4%) |
| 85 Years and over | 22 (3.9%) | 68 (10.7%) |
| Total | 564 (100.0%) | 637 (100.0%) |
Families and Households in Oriskany
Median Family Size in Oriskany
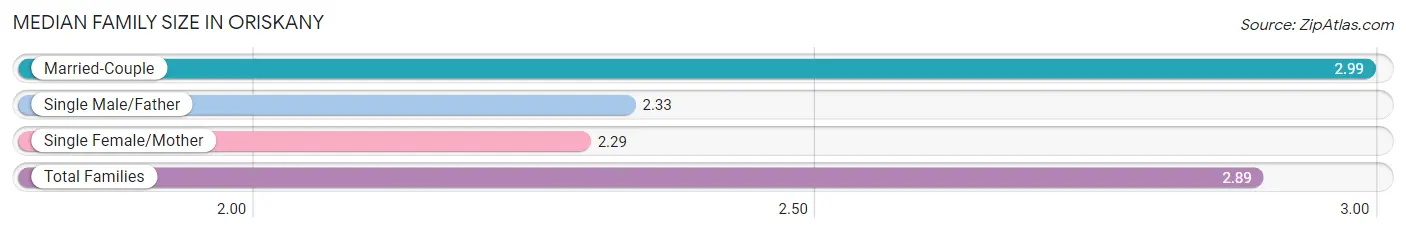
The median family size in Oriskany is 2.89 persons per family, with married-couple families (250 | 85.0%) accounting for the largest median family size of 2.99 persons per family. On the other hand, single female/mother families (35 | 11.9%) represent the smallest median family size with 2.29 persons per family.
| Family Type | # Families | Family Size |
| Married-Couple | 250 (85.0%) | 2.99 |
| Single Male/Father | 9 (3.1%) | 2.33 |
| Single Female/Mother | 35 (11.9%) | 2.29 |
| Total Families | 294 (100.0%) | 2.89 |
Median Household Size in Oriskany
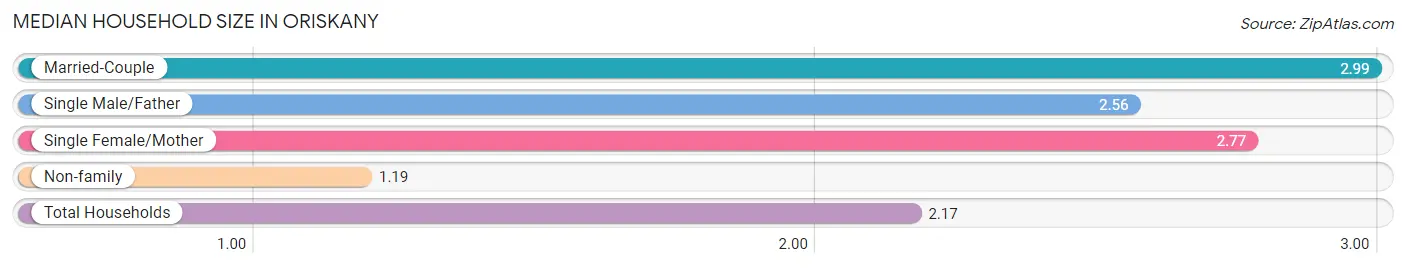
The median household size in Oriskany is 2.17 persons per household, with married-couple households (250 | 47.2%) accounting for the largest median household size of 2.99 persons per household. non-family households (236 | 44.5%) represent the smallest median household size with 1.19 persons per household.
| Household Type | # Households | Household Size |
| Married-Couple | 250 (47.2%) | 2.99 |
| Single Male/Father | 9 (1.7%) | 2.56 |
| Single Female/Mother | 35 (6.6%) | 2.77 |
| Non-family | 236 (44.5%) | 1.19 |
| Total Households | 530 (100.0%) | 2.17 |
Household Size by Marriage Status in Oriskany
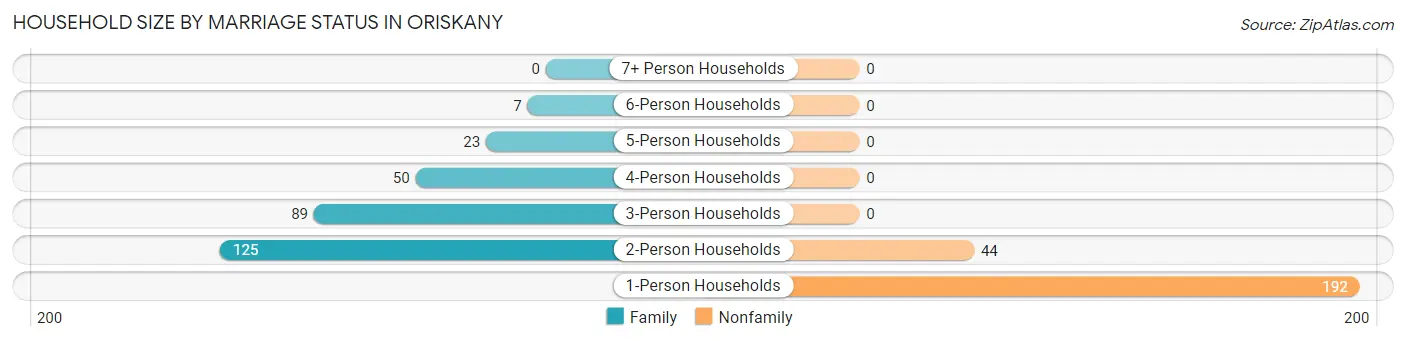
Out of a total of 530 households in Oriskany, 294 (55.5%) are family households, while 236 (44.5%) are nonfamily households. The most numerous type of family households are 2-person households, comprising 125, and the most common type of nonfamily households are 1-person households, comprising 192.
| Household Size | Family Households | Nonfamily Households |
| 1-Person Households | - | 192 (36.2%) |
| 2-Person Households | 125 (23.6%) | 44 (8.3%) |
| 3-Person Households | 89 (16.8%) | 0 (0.0%) |
| 4-Person Households | 50 (9.4%) | 0 (0.0%) |
| 5-Person Households | 23 (4.3%) | 0 (0.0%) |
| 6-Person Households | 7 (1.3%) | 0 (0.0%) |
| 7+ Person Households | 0 (0.0%) | 0 (0.0%) |
| Total | 294 (55.5%) | 236 (44.5%) |
Female Fertility in Oriskany
Fertility by Age in Oriskany
Average fertility rate in Oriskany is 29.0 births per 1,000 women. Women in the age bracket of 20 to 34 years have the highest fertility rate with 78.0 births per 1,000 women. Women in the age bracket of 20 to 34 years acount for 100.0% of all women with births.
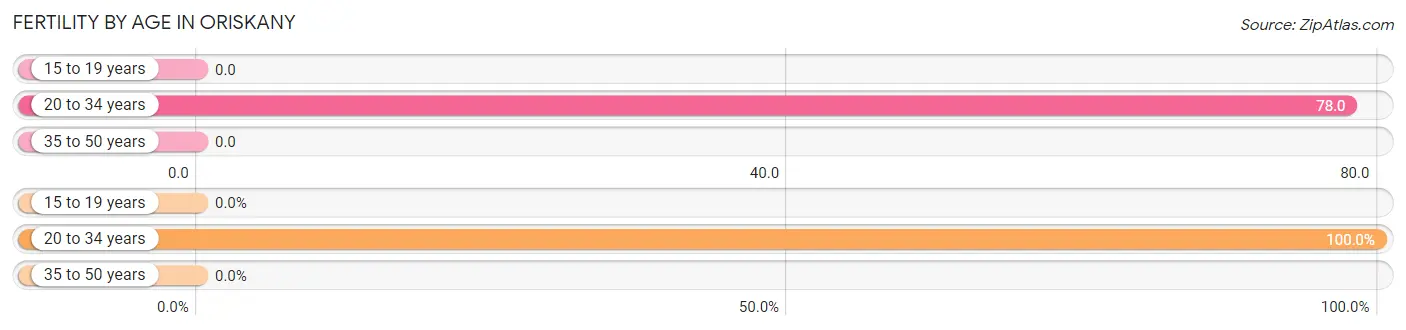
| Age Bracket | Women with Births | Births / 1,000 Women |
| 15 to 19 years | 0 (0.0%) | 0.0 |
| 20 to 34 years | 8 (100.0%) | 78.0 |
| 35 to 50 years | 0 (0.0%) | 0.0 |
| Total | 8 (100.0%) | 29.0 |
Fertility by Age by Marriage Status in Oriskany
37.5% of women with births (8) in Oriskany are married. The highest percentage of unmarried women with births falls into 20 to 34 years age bracket with 62.5% of them unmarried at the time of birth, while the lowest percentage of unmarried women with births belong to 20 to 34 years age bracket with 62.5% of them unmarried.
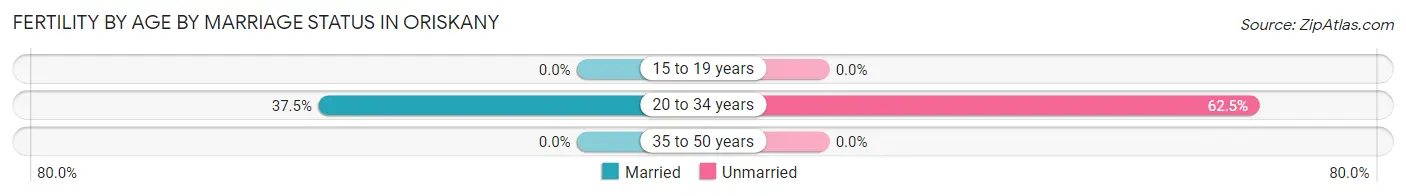
| Age Bracket | Married | Unmarried |
| 15 to 19 years | 0 (0.0%) | 0 (0.0%) |
| 20 to 34 years | 3 (37.5%) | 5 (62.5%) |
| 35 to 50 years | 0 (0.0%) | 0 (0.0%) |
| Total | 3 (37.5%) | 5 (62.5%) |
Fertility by Education in Oriskany
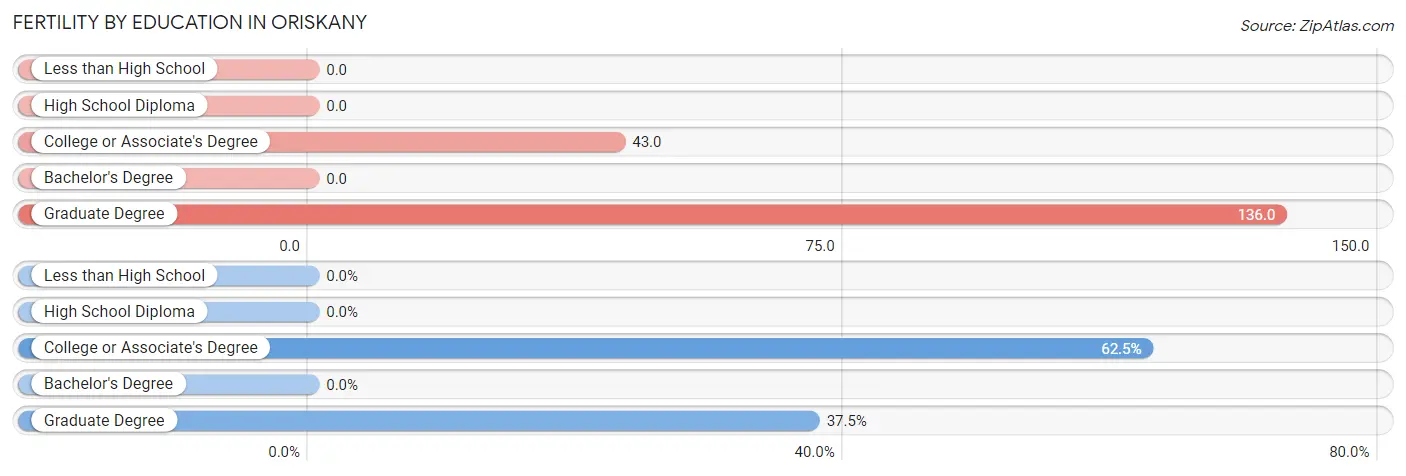
| Educational Attainment | Women with Births | Births / 1,000 Women |
| Less than High School | 0 (0.0%) | 0.0 |
| High School Diploma | 0 (0.0%) | 0.0 |
| College or Associate's Degree | 5 (62.5%) | 43.0 |
| Bachelor's Degree | 0 (0.0%) | 0.0 |
| Graduate Degree | 3 (37.5%) | 136.0 |
| Total | 8 (100.0%) | 29.0 |
Fertility by Education by Marriage Status in Oriskany
62.5% of women with births in Oriskany are unmarried. Women with the educational attainment of graduate degree are most likely to be married with 100.0% of them married at childbirth, while women with the educational attainment of college or associate's degree are least likely to be married with 100.0% of them unmarried at childbirth.
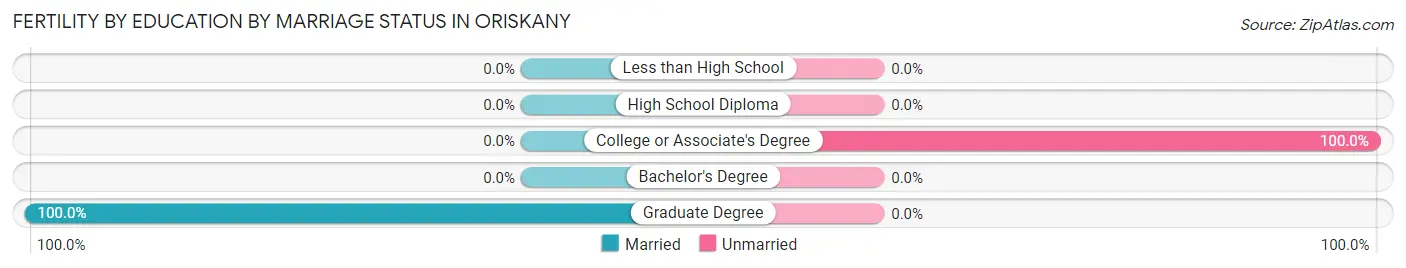
| Educational Attainment | Married | Unmarried |
| Less than High School | 0 (0.0%) | 0 (0.0%) |
| High School Diploma | 0 (0.0%) | 0 (0.0%) |
| College or Associate's Degree | 0 (0.0%) | 5 (100.0%) |
| Bachelor's Degree | 0 (0.0%) | 0 (0.0%) |
| Graduate Degree | 3 (100.0%) | 0 (0.0%) |
| Total | 3 (37.5%) | 5 (62.5%) |
Income in Oriskany
Income Overview in Oriskany
Per Capita Income in Oriskany is $32,758, while median incomes of families and households are $79,286 and $63,194 respectively.
| Characteristic | Number | Measure |
| Per Capita Income | 1,201 | $32,758 |
| Median Family Income | 294 | $79,286 |
| Mean Family Income | 294 | $92,086 |
| Median Household Income | 530 | $63,194 |
| Mean Household Income | 530 | $73,683 |
| Income Deficit | 294 | $0 |
| Wage / Income Gap (%) | 1,201 | 3.99% |
| Wage / Income Gap ($) | 1,201 | 96.01¢ per $1 |
| Gini / Inequality Index | 1,201 | 0.41 |
Earnings by Sex in Oriskany
Average Earnings in Oriskany are $42,273, $43,125 for men and $41,406 for women, a difference of 4.0%.
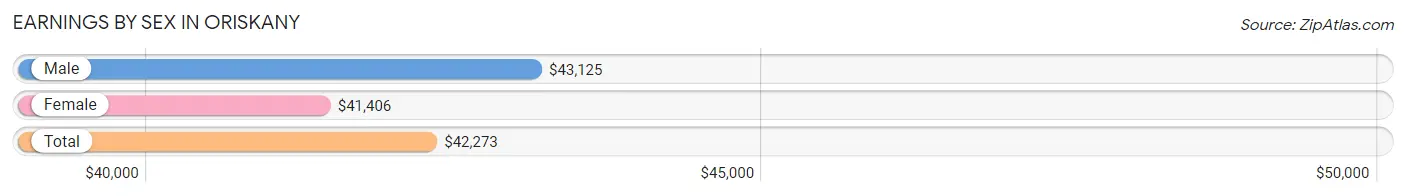
| Sex | Number | Average Earnings |
| Male | 339 (53.6%) | $43,125 |
| Female | 293 (46.4%) | $41,406 |
| Total | 632 (100.0%) | $42,273 |
Earnings by Sex by Income Bracket in Oriskany
The most common earnings brackets in Oriskany are $75,000 to $99,999 for men (64 | 18.9%) and $55,000 to $64,999 for women (53 | 18.1%).
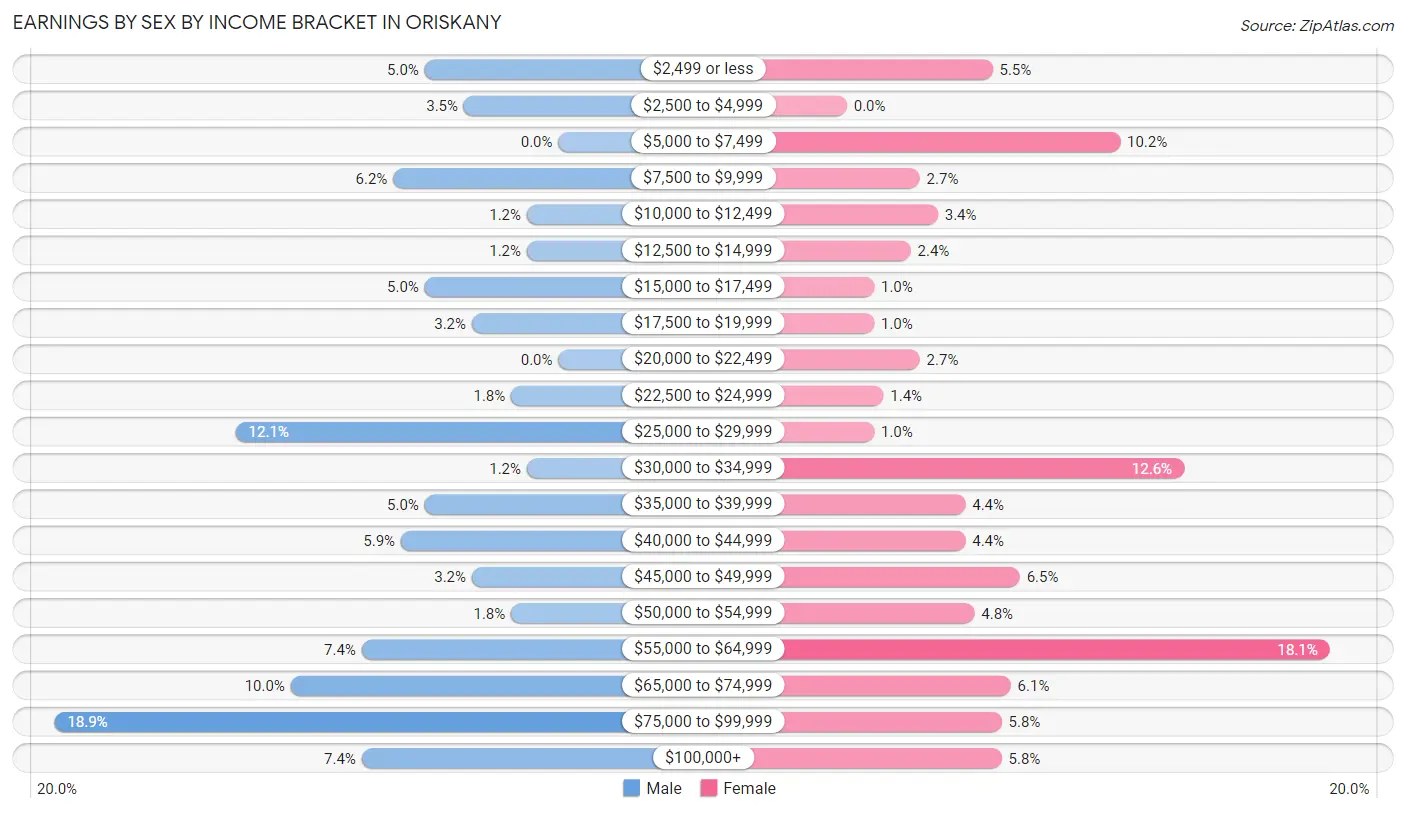
| Income | Male | Female |
| $2,499 or less | 17 (5.0%) | 16 (5.5%) |
| $2,500 to $4,999 | 12 (3.5%) | 0 (0.0%) |
| $5,000 to $7,499 | 0 (0.0%) | 30 (10.2%) |
| $7,500 to $9,999 | 21 (6.2%) | 8 (2.7%) |
| $10,000 to $12,499 | 4 (1.2%) | 10 (3.4%) |
| $12,500 to $14,999 | 4 (1.2%) | 7 (2.4%) |
| $15,000 to $17,499 | 17 (5.0%) | 3 (1.0%) |
| $17,500 to $19,999 | 11 (3.2%) | 3 (1.0%) |
| $20,000 to $22,499 | 0 (0.0%) | 8 (2.7%) |
| $22,500 to $24,999 | 6 (1.8%) | 4 (1.4%) |
| $25,000 to $29,999 | 41 (12.1%) | 3 (1.0%) |
| $30,000 to $34,999 | 4 (1.2%) | 37 (12.6%) |
| $35,000 to $39,999 | 17 (5.0%) | 13 (4.4%) |
| $40,000 to $44,999 | 20 (5.9%) | 13 (4.4%) |
| $45,000 to $49,999 | 11 (3.2%) | 19 (6.5%) |
| $50,000 to $54,999 | 6 (1.8%) | 14 (4.8%) |
| $55,000 to $64,999 | 25 (7.4%) | 53 (18.1%) |
| $65,000 to $74,999 | 34 (10.0%) | 18 (6.1%) |
| $75,000 to $99,999 | 64 (18.9%) | 17 (5.8%) |
| $100,000+ | 25 (7.4%) | 17 (5.8%) |
| Total | 339 (100.0%) | 293 (100.0%) |
Earnings by Sex by Educational Attainment in Oriskany
Average earnings in Oriskany are $50,208 for men and $45,855 for women, a difference of 8.7%. Men with an educational attainment of graduate degree enjoy the highest average annual earnings of $90,938, while those with college or associate's degree education earn the least with $38,021. Women with an educational attainment of graduate degree earn the most with the average annual earnings of $78,125, while those with college or associate's degree education have the smallest earnings of $43,000.
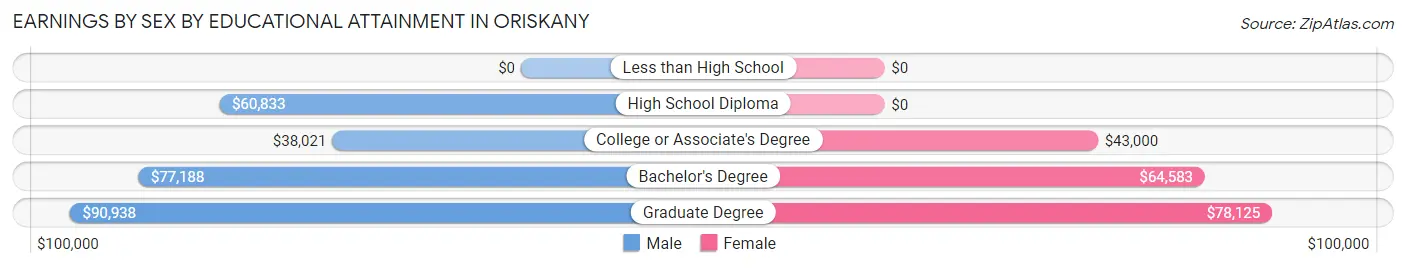
| Educational Attainment | Male Income | Female Income |
| Less than High School | - | - |
| High School Diploma | $60,833 | $0 |
| College or Associate's Degree | $38,021 | $43,000 |
| Bachelor's Degree | $77,188 | $64,583 |
| Graduate Degree | $90,938 | $78,125 |
| Total | $50,208 | $45,855 |
Family Income in Oriskany
Family Income Brackets in Oriskany
According to the Oriskany family income data, there are 53 families falling into the $100,000 to $149,999 income range, which is the most common income bracket and makes up 18.0% of all families.
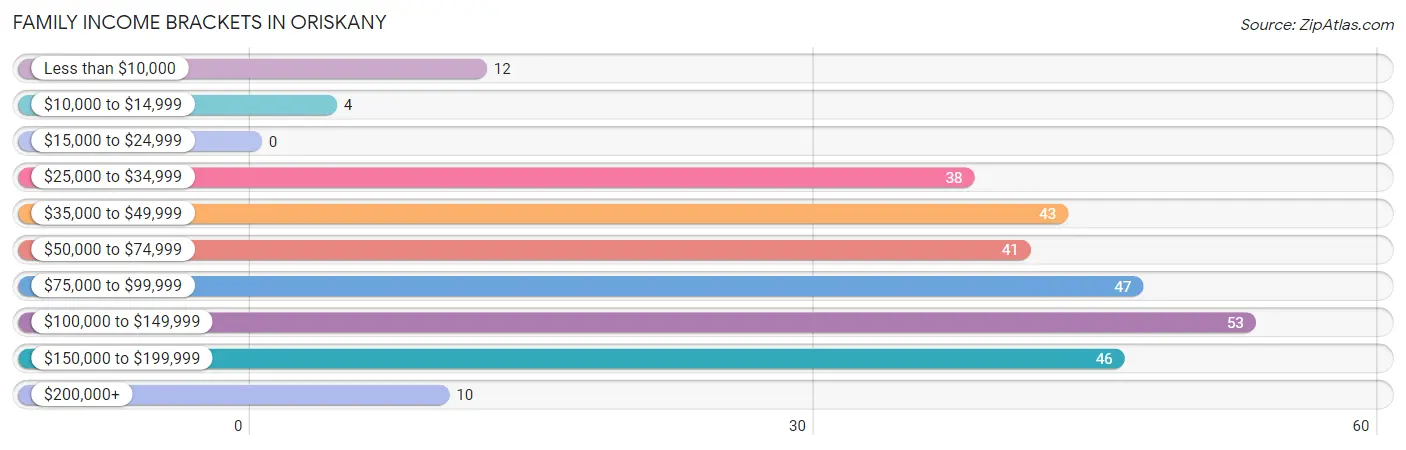
| Income Bracket | # Families | % Families |
| Less than $10,000 | 12 | 4.1% |
| $10,000 to $14,999 | 4 | 1.4% |
| $15,000 to $24,999 | 0 | 0.0% |
| $25,000 to $34,999 | 38 | 12.9% |
| $35,000 to $49,999 | 43 | 14.6% |
| $50,000 to $74,999 | 41 | 13.9% |
| $75,000 to $99,999 | 47 | 16.0% |
| $100,000 to $149,999 | 53 | 18.0% |
| $150,000 to $199,999 | 46 | 15.6% |
| $200,000+ | 10 | 3.4% |
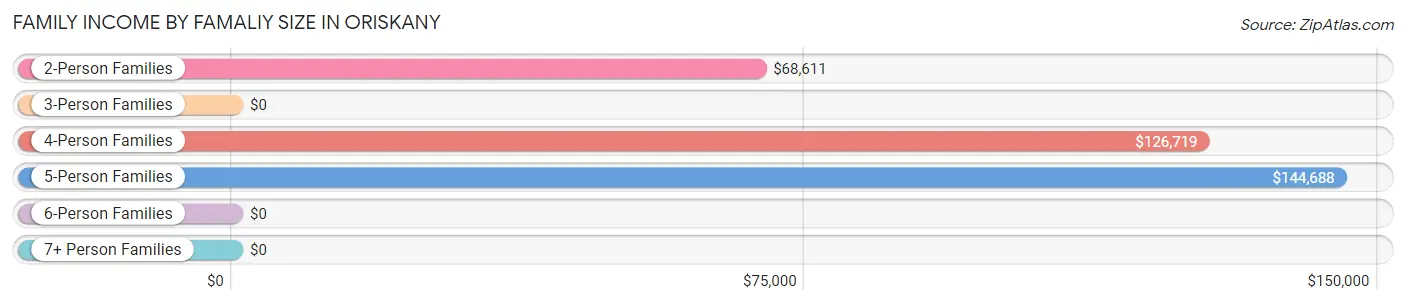
Family Income by Famaliy Size in Oriskany
5-person families (23 | 7.8%) account for the highest median family income in Oriskany with $144,688 per family, while 2-person families (134 | 45.6%) have the highest median income of $34,306 per family member.
| Income Bracket | # Families | Median Income |
| 2-Person Families | 134 (45.6%) | $68,611 |
| 3-Person Families | 91 (30.9%) | $0 |
| 4-Person Families | 39 (13.3%) | $126,719 |
| 5-Person Families | 23 (7.8%) | $144,688 |
| 6-Person Families | 7 (2.4%) | $0 |
| 7+ Person Families | 0 (0.0%) | $0 |
| Total | 294 (100.0%) | $79,286 |
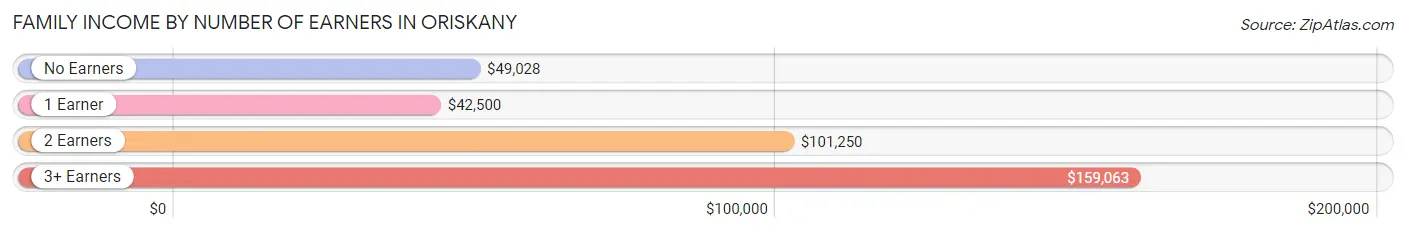
Family Income by Number of Earners in Oriskany
The median family income in Oriskany is $79,286, with families comprising 3+ earners (47) having the highest median family income of $159,063, while families with 1 earner (96) have the lowest median family income of $42,500, accounting for 16.0% and 32.7% of families, respectively.
| Number of Earners | # Families | Median Income |
| No Earners | 53 (18.0%) | $49,028 |
| 1 Earner | 96 (32.7%) | $42,500 |
| 2 Earners | 98 (33.3%) | $101,250 |
| 3+ Earners | 47 (16.0%) | $159,063 |
| Total | 294 (100.0%) | $79,286 |
Household Income in Oriskany
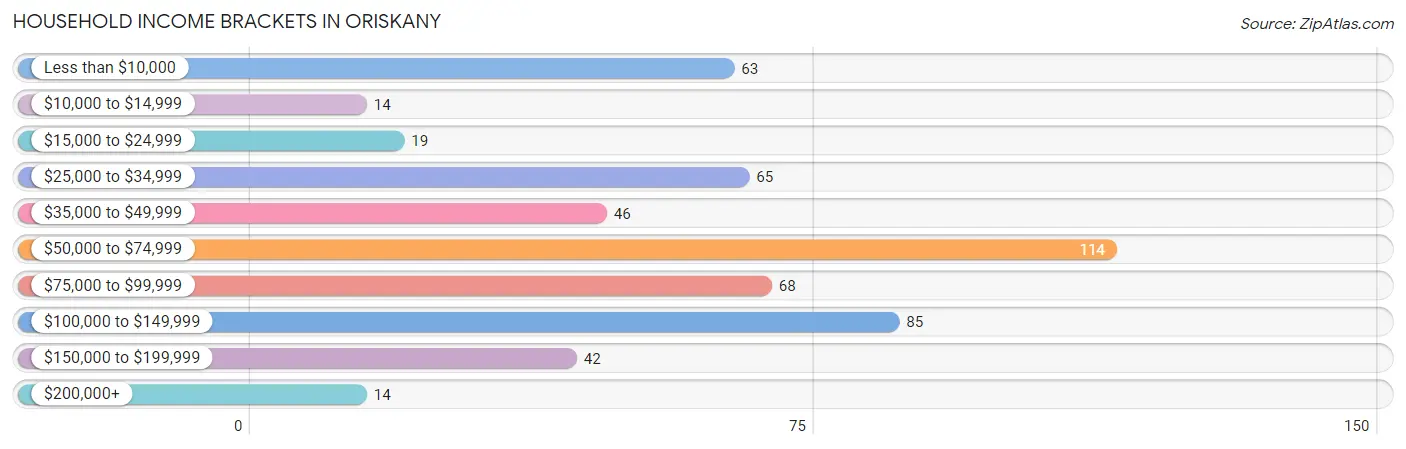
Household Income Brackets in Oriskany
With 114 households falling in the category, the $50,000 to $74,999 income range is the most frequent in Oriskany, accounting for 21.5% of all households. In contrast, only 14 households (2.6%) fall into the $10,000 to $14,999 income bracket, making it the least populous group.
| Income Bracket | # Households | % Households |
| Less than $10,000 | 63 | 11.9% |
| $10,000 to $14,999 | 14 | 2.6% |
| $15,000 to $24,999 | 19 | 3.6% |
| $25,000 to $34,999 | 65 | 12.3% |
| $35,000 to $49,999 | 46 | 8.7% |
| $50,000 to $74,999 | 114 | 21.5% |
| $75,000 to $99,999 | 68 | 12.8% |
| $100,000 to $149,999 | 85 | 16.0% |
| $150,000 to $199,999 | 42 | 7.9% |
| $200,000+ | 14 | 2.6% |
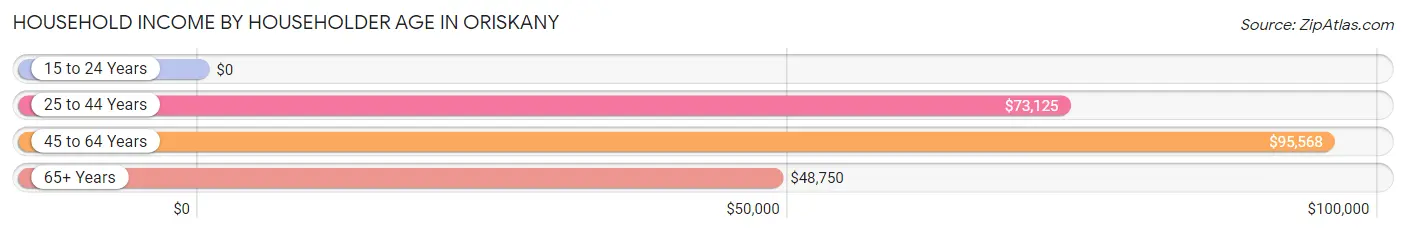
Household Income by Householder Age in Oriskany
The median household income in Oriskany is $63,194, with the highest median household income of $95,568 found in the 45 to 64 years age bracket for the primary householder. A total of 174 households (32.8%) fall into this category. Meanwhile, the 15 to 24 years age bracket for the primary householder has the lowest median household income of $0, with 21 households (4.0%) in this group.
| Income Bracket | # Households | Median Income |
| 15 to 24 Years | 21 (4.0%) | $0 |
| 25 to 44 Years | 152 (28.7%) | $73,125 |
| 45 to 64 Years | 174 (32.8%) | $95,568 |
| 65+ Years | 183 (34.5%) | $48,750 |
| Total | 530 (100.0%) | $63,194 |
Poverty in Oriskany
Income Below Poverty by Sex and Age in Oriskany
With 11.4% poverty level for males and 13.6% for females among the residents of Oriskany, 75 year old and over males and 16 and 17 year old females are the most vulnerable to poverty, with 16 males (43.2%) and 13 females (76.5%) in their respective age groups living below the poverty level.
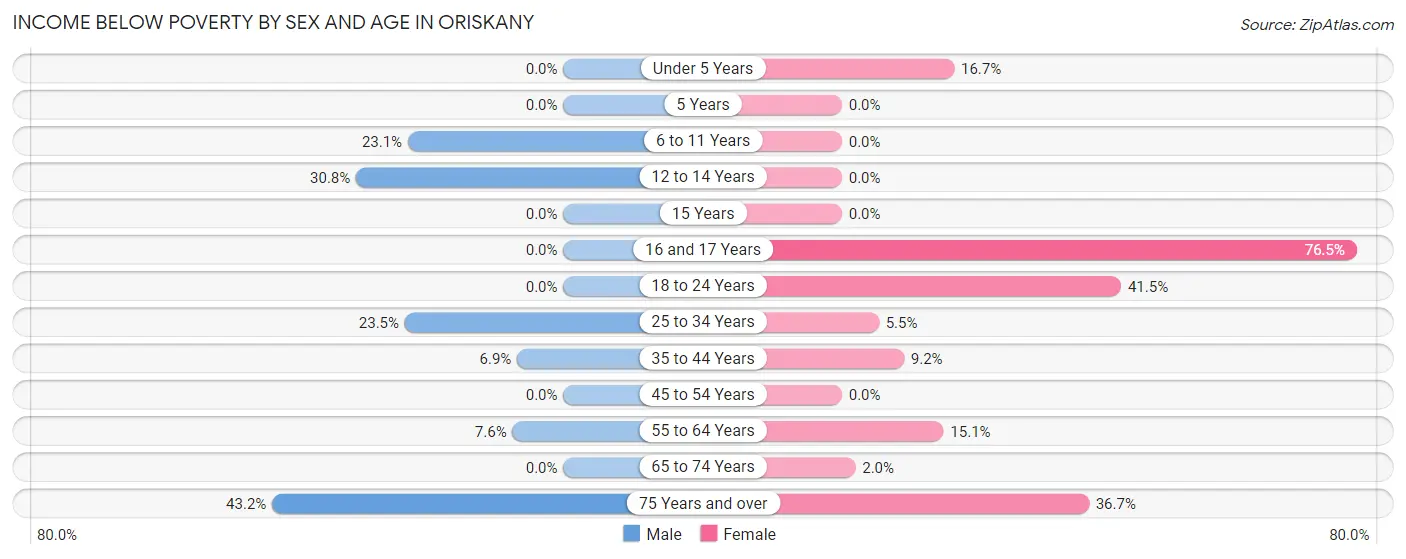
| Age Bracket | Male | Female |
| Under 5 Years | 0 (0.0%) | 8 (16.7%) |
| 5 Years | 0 (0.0%) | 0 (0.0%) |
| 6 to 11 Years | 12 (23.1%) | 0 (0.0%) |
| 12 to 14 Years | 8 (30.8%) | 0 (0.0%) |
| 15 Years | 0 (0.0%) | 0 (0.0%) |
| 16 and 17 Years | 0 (0.0%) | 13 (76.5%) |
| 18 to 24 Years | 0 (0.0%) | 17 (41.5%) |
| 25 to 34 Years | 16 (23.5%) | 4 (5.5%) |
| 35 to 44 Years | 7 (6.9%) | 7 (9.2%) |
| 45 to 54 Years | 0 (0.0%) | 0 (0.0%) |
| 55 to 64 Years | 4 (7.5%) | 8 (15.1%) |
| 65 to 74 Years | 0 (0.0%) | 2 (2.0%) |
| 75 Years and over | 16 (43.2%) | 22 (36.7%) |
| Total | 63 (11.4%) | 81 (13.6%) |
Income Above Poverty by Sex and Age in Oriskany
According to the poverty statistics in Oriskany, males aged under 5 years and females aged 5 years are the age groups that are most secure financially, with 100.0% of males and 100.0% of females in these age groups living above the poverty line.
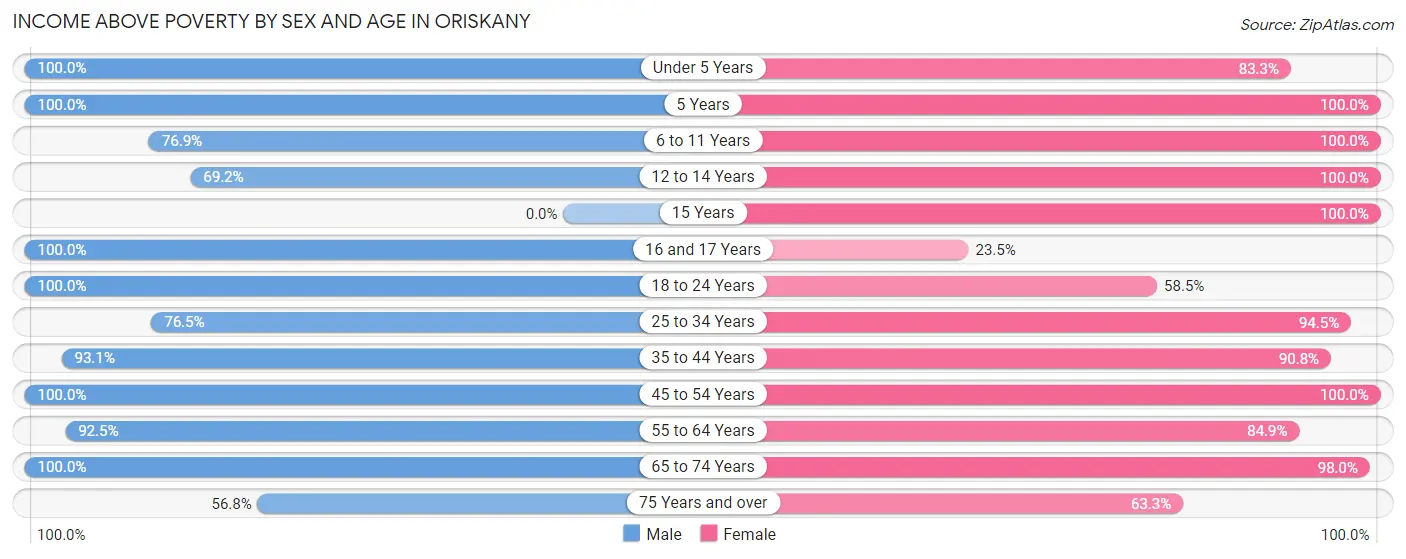
| Age Bracket | Male | Female |
| Under 5 Years | 27 (100.0%) | 40 (83.3%) |
| 5 Years | 2 (100.0%) | 4 (100.0%) |
| 6 to 11 Years | 40 (76.9%) | 27 (100.0%) |
| 12 to 14 Years | 18 (69.2%) | 8 (100.0%) |
| 15 Years | 0 (0.0%) | 5 (100.0%) |
| 16 and 17 Years | 16 (100.0%) | 4 (23.5%) |
| 18 to 24 Years | 40 (100.0%) | 24 (58.5%) |
| 25 to 34 Years | 52 (76.5%) | 69 (94.5%) |
| 35 to 44 Years | 95 (93.1%) | 69 (90.8%) |
| 45 to 54 Years | 61 (100.0%) | 85 (100.0%) |
| 55 to 64 Years | 49 (92.4%) | 45 (84.9%) |
| 65 to 74 Years | 68 (100.0%) | 98 (98.0%) |
| 75 Years and over | 21 (56.8%) | 38 (63.3%) |
| Total | 489 (88.6%) | 516 (86.4%) |
Income Below Poverty Among Married-Couple Families in Oriskany
The poverty statistics for married-couple families in Oriskany show that 2.8% or 7 of the total 250 families live below the poverty line. Families with 3 or 4 children have the highest poverty rate of 33.3%, comprising of 7 families. On the other hand, families with no children have the lowest poverty rate of 0.0%, which includes 0 families.
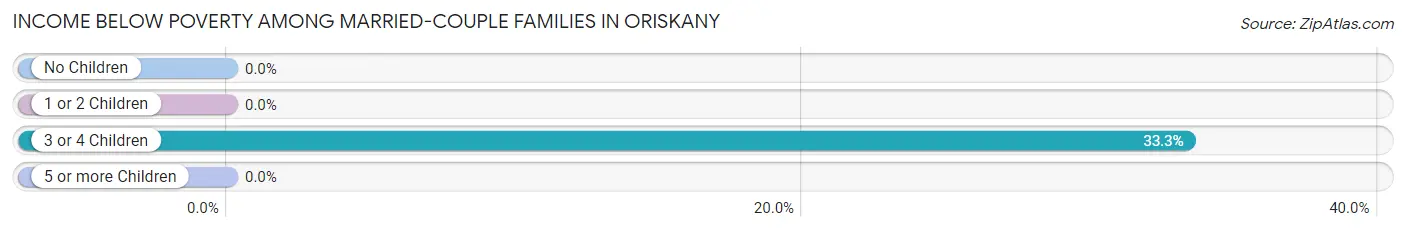
| Children | Above Poverty | Below Poverty |
| No Children | 132 (100.0%) | 0 (0.0%) |
| 1 or 2 Children | 97 (100.0%) | 0 (0.0%) |
| 3 or 4 Children | 14 (66.7%) | 7 (33.3%) |
| 5 or more Children | 0 (0.0%) | 0 (0.0%) |
| Total | 243 (97.2%) | 7 (2.8%) |
Income Below Poverty Among Single-Parent Households in Oriskany
According to the poverty data in Oriskany, 44.4% or 4 single-father households and 14.3% or 5 single-mother households are living below the poverty line. Among single-father households, those with 1 or 2 children have the highest poverty rate, with 4 households (66.7%) experiencing poverty. Likewise, among single-mother households, those with 1 or 2 children have the highest poverty rate, with 5 households (29.4%) falling below the poverty line.
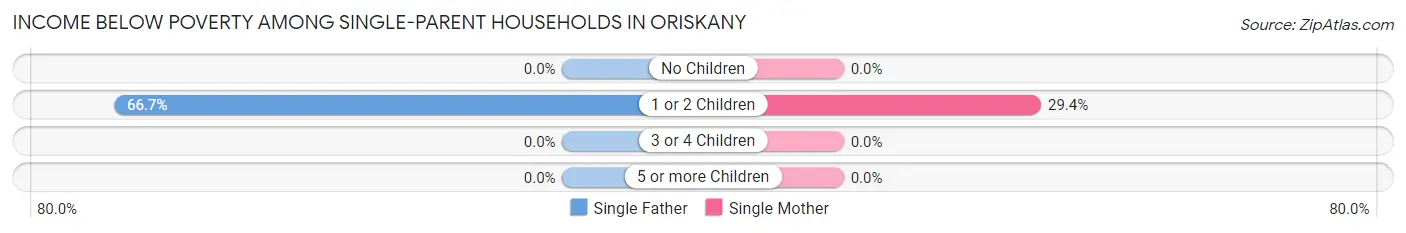
| Children | Single Father | Single Mother |
| No Children | 0 (0.0%) | 0 (0.0%) |
| 1 or 2 Children | 4 (66.7%) | 5 (29.4%) |
| 3 or 4 Children | 0 (0.0%) | 0 (0.0%) |
| 5 or more Children | 0 (0.0%) | 0 (0.0%) |
| Total | 4 (44.4%) | 5 (14.3%) |
Income Below Poverty Among Married-Couple vs Single-Parent Households in Oriskany
The poverty data for Oriskany shows that 7 of the married-couple family households (2.8%) and 9 of the single-parent households (20.4%) are living below the poverty level. Within the married-couple family households, those with 3 or 4 children have the highest poverty rate, with 7 households (33.3%) falling below the poverty line. Among the single-parent households, those with 1 or 2 children have the highest poverty rate, with 9 household (39.1%) living below poverty.
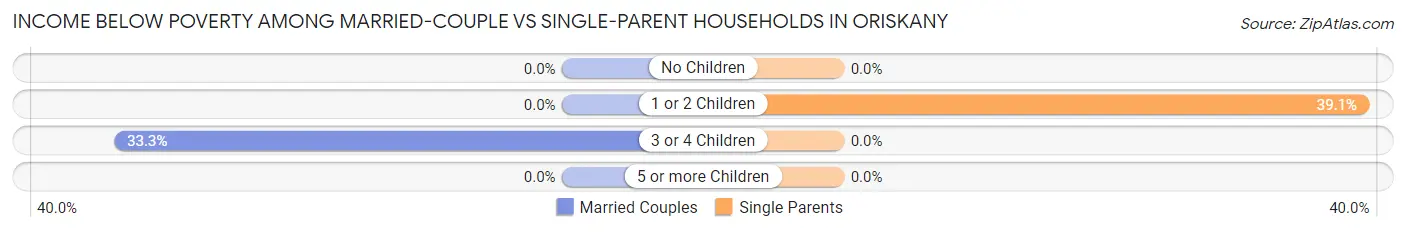
| Children | Married-Couple Families | Single-Parent Households |
| No Children | 0 (0.0%) | 0 (0.0%) |
| 1 or 2 Children | 0 (0.0%) | 9 (39.1%) |
| 3 or 4 Children | 7 (33.3%) | 0 (0.0%) |
| 5 or more Children | 0 (0.0%) | 0 (0.0%) |
| Total | 7 (2.8%) | 9 (20.4%) |
Employment Characteristics in Oriskany
Employment by Class of Employer in Oriskany
Among the 581 employed individuals in Oriskany, private company employees (328 | 56.5%), state government employees (81 | 13.9%), and not-for-profit organizations (57 | 9.8%) make up the most common classes of employment.
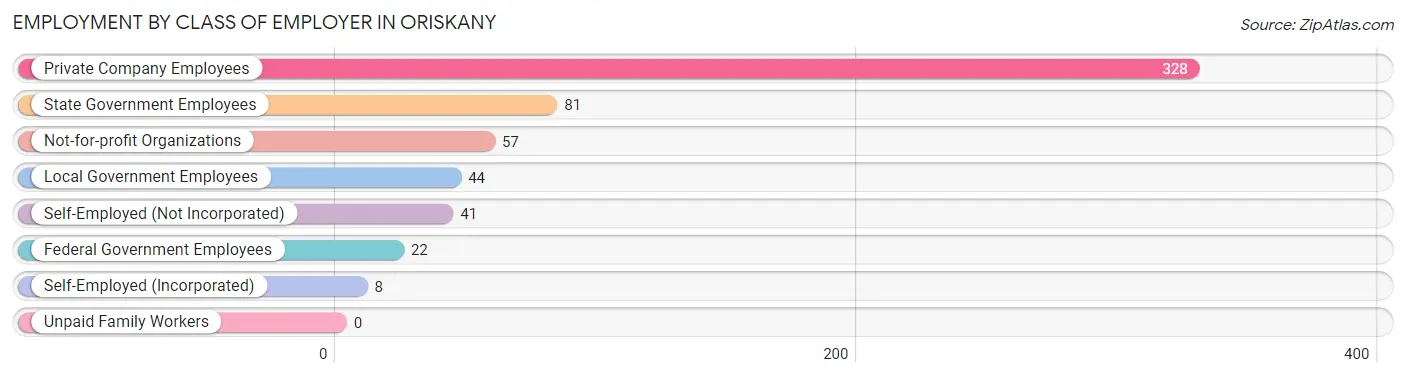
| Employer Class | # Employees | % Employees |
| Private Company Employees | 328 | 56.5% |
| Self-Employed (Incorporated) | 8 | 1.4% |
| Self-Employed (Not Incorporated) | 41 | 7.1% |
| Not-for-profit Organizations | 57 | 9.8% |
| Local Government Employees | 44 | 7.6% |
| State Government Employees | 81 | 13.9% |
| Federal Government Employees | 22 | 3.8% |
| Unpaid Family Workers | 0 | 0.0% |
| Total | 581 | 100.0% |
Employment Status by Age in Oriskany
According to the labor force statistics for Oriskany, out of the total population over 16 years of age (1,002), 59.8% or 599 individuals are in the labor force, with 2.2% or 13 of them unemployed. The age group with the highest labor force participation rate is 25 to 29 years, with 100.0% or 67 individuals in the labor force. Within the labor force, the 55 to 59 years age range has the highest percentage of unemployed individuals, with 10.0% or 4 of them being unemployed.
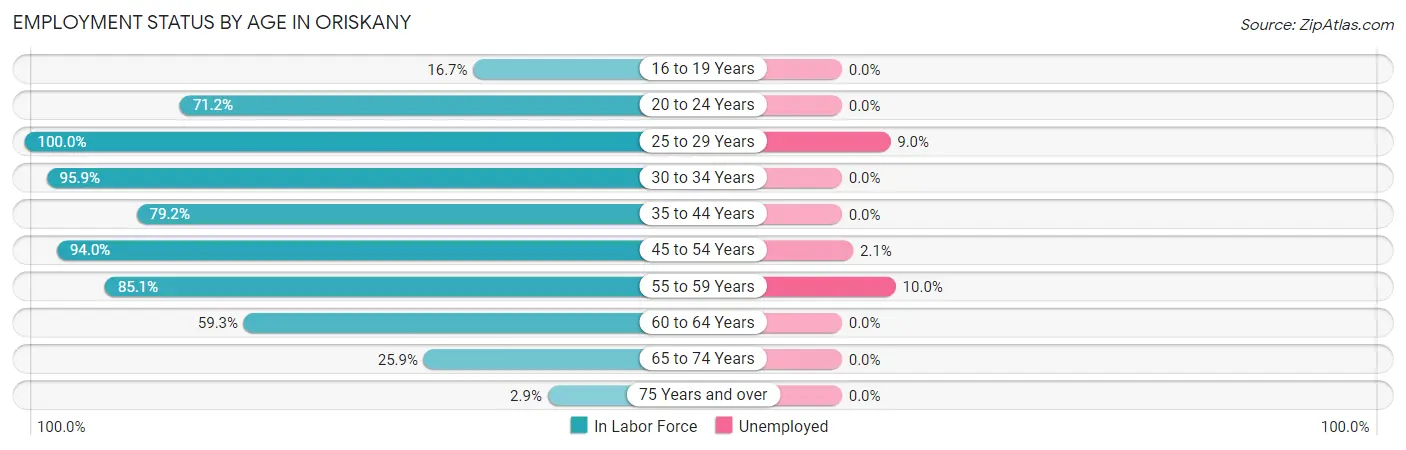
| Age Bracket | In Labor Force | Unemployed |
| 16 to 19 Years | 8 (16.7%) | 0 (0.0%) |
| 20 to 24 Years | 47 (71.2%) | 0 (0.0%) |
| 25 to 29 Years | 67 (100.0%) | 6 (9.0%) |
| 30 to 34 Years | 71 (95.9%) | 0 (0.0%) |
| 35 to 44 Years | 141 (79.2%) | 0 (0.0%) |
| 45 to 54 Years | 141 (94.0%) | 3 (2.1%) |
| 55 to 59 Years | 40 (85.1%) | 4 (10.0%) |
| 60 to 64 Years | 35 (59.3%) | 0 (0.0%) |
| 65 to 74 Years | 45 (25.9%) | 0 (0.0%) |
| 75 Years and over | 4 (2.9%) | 0 (0.0%) |
| Total | 599 (59.8%) | 13 (2.2%) |
Employment Status by Educational Attainment in Oriskany
According to labor force statistics for Oriskany, 86.1% of individuals (495) out of the total population between 25 and 64 years of age (575) are in the labor force, with 2.6% or 13 of them being unemployed. The group with the highest labor force participation rate are those with the educational attainment of less than high school, with 100.0% or 8 individuals in the labor force. Within the labor force, individuals with high school diploma education have the highest percentage of unemployment, with 5.5% or 7 of them being unemployed.
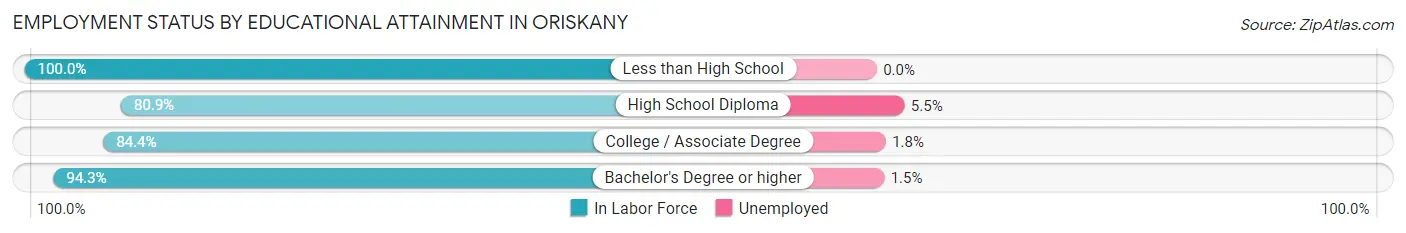
| Educational Attainment | In Labor Force | Unemployed |
| Less than High School | 8 (100.0%) | 0 (0.0%) |
| High School Diploma | 127 (80.9%) | 9 (5.5%) |
| College / Associate Degree | 227 (84.4%) | 5 (1.8%) |
| Bachelor's Degree or higher | 133 (94.3%) | 2 (1.5%) |
| Total | 495 (86.1%) | 15 (2.6%) |
Employment Occupations by Sex in Oriskany
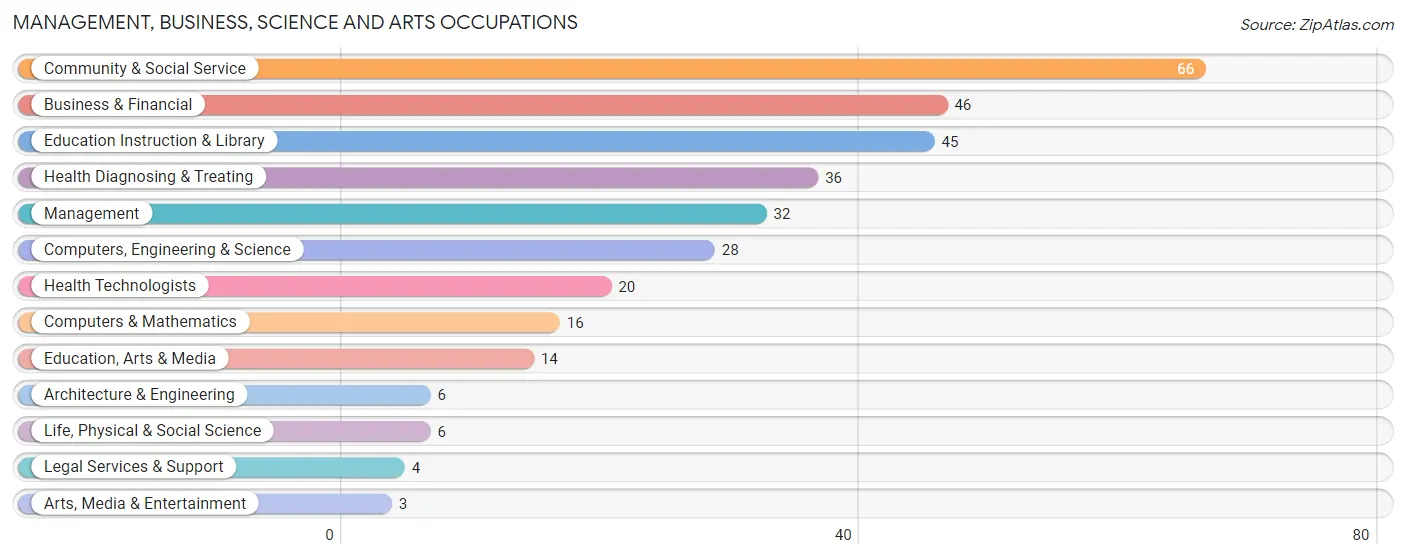
Management, Business, Science and Arts Occupations
The most common Management, Business, Science and Arts occupations in Oriskany are Community & Social Service (66 | 11.3%), Business & Financial (46 | 7.9%), Education Instruction & Library (45 | 7.7%), Health Diagnosing & Treating (36 | 6.1%), and Management (32 | 5.5%).
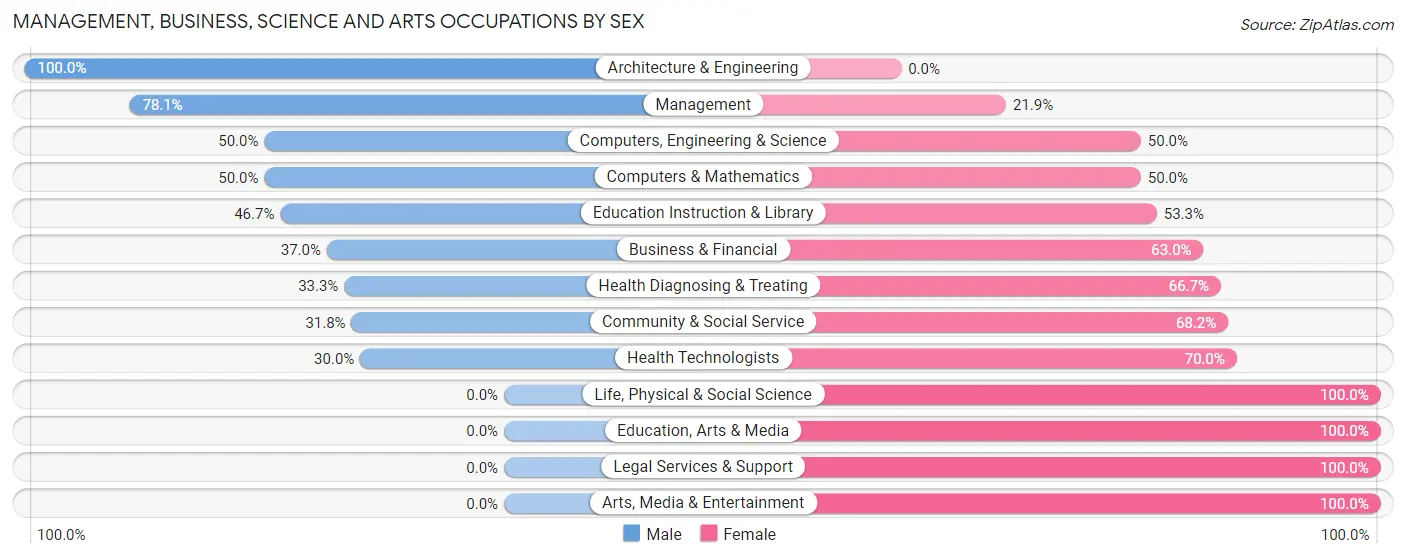
Management, Business, Science and Arts Occupations by Sex
Within the Management, Business, Science and Arts occupations in Oriskany, the most male-oriented occupations are Architecture & Engineering (100.0%), Management (78.1%), and Computers, Engineering & Science (50.0%), while the most female-oriented occupations are Life, Physical & Social Science (100.0%), Education, Arts & Media (100.0%), and Legal Services & Support (100.0%).
| Occupation | Male | Female |
| Management | 25 (78.1%) | 7 (21.9%) |
| Business & Financial | 17 (37.0%) | 29 (63.0%) |
| Computers, Engineering & Science | 14 (50.0%) | 14 (50.0%) |
| Computers & Mathematics | 8 (50.0%) | 8 (50.0%) |
| Architecture & Engineering | 6 (100.0%) | 0 (0.0%) |
| Life, Physical & Social Science | 0 (0.0%) | 6 (100.0%) |
| Community & Social Service | 21 (31.8%) | 45 (68.2%) |
| Education, Arts & Media | 0 (0.0%) | 14 (100.0%) |
| Legal Services & Support | 0 (0.0%) | 4 (100.0%) |
| Education Instruction & Library | 21 (46.7%) | 24 (53.3%) |
| Arts, Media & Entertainment | 0 (0.0%) | 3 (100.0%) |
| Health Diagnosing & Treating | 12 (33.3%) | 24 (66.7%) |
| Health Technologists | 6 (30.0%) | 14 (70.0%) |
| Total (Category) | 89 (42.8%) | 119 (57.2%) |
| Total (Overall) | 309 (52.7%) | 277 (47.3%) |
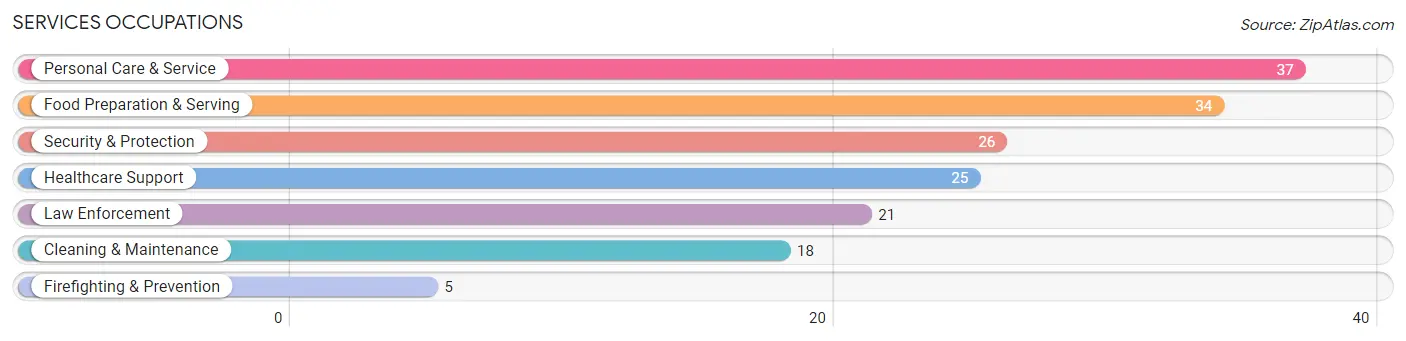
Services Occupations
The most common Services occupations in Oriskany are Personal Care & Service (37 | 6.3%), Food Preparation & Serving (34 | 5.8%), Security & Protection (26 | 4.4%), Healthcare Support (25 | 4.3%), and Law Enforcement (21 | 3.6%).
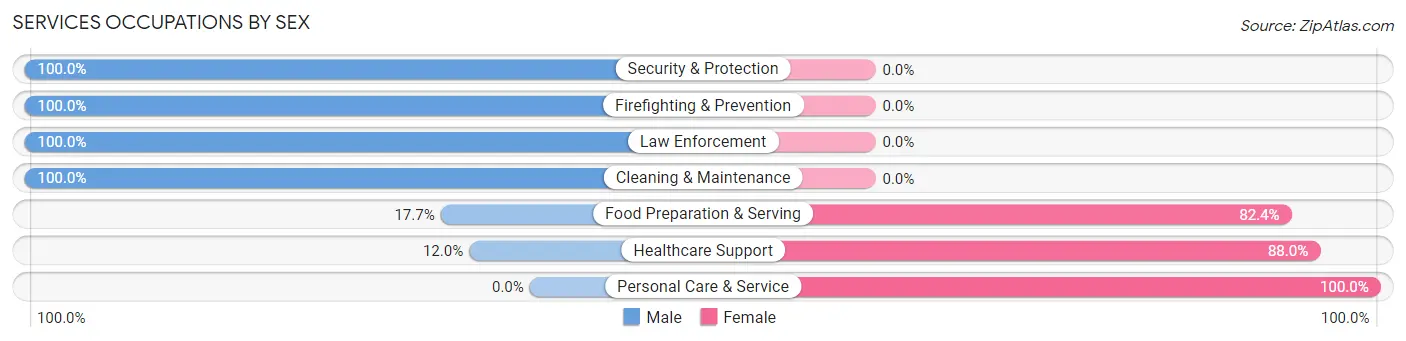
Services Occupations by Sex
Within the Services occupations in Oriskany, the most male-oriented occupations are Security & Protection (100.0%), Firefighting & Prevention (100.0%), and Law Enforcement (100.0%), while the most female-oriented occupations are Personal Care & Service (100.0%), Healthcare Support (88.0%), and Food Preparation & Serving (82.4%).
| Occupation | Male | Female |
| Healthcare Support | 3 (12.0%) | 22 (88.0%) |
| Security & Protection | 26 (100.0%) | 0 (0.0%) |
| Firefighting & Prevention | 5 (100.0%) | 0 (0.0%) |
| Law Enforcement | 21 (100.0%) | 0 (0.0%) |
| Food Preparation & Serving | 6 (17.6%) | 28 (82.4%) |
| Cleaning & Maintenance | 18 (100.0%) | 0 (0.0%) |
| Personal Care & Service | 0 (0.0%) | 37 (100.0%) |
| Total (Category) | 53 (37.9%) | 87 (62.1%) |
| Total (Overall) | 309 (52.7%) | 277 (47.3%) |
Sales and Office Occupations
The most common Sales and Office occupations in Oriskany are Office & Administration (122 | 20.8%), and Sales & Related (37 | 6.3%).
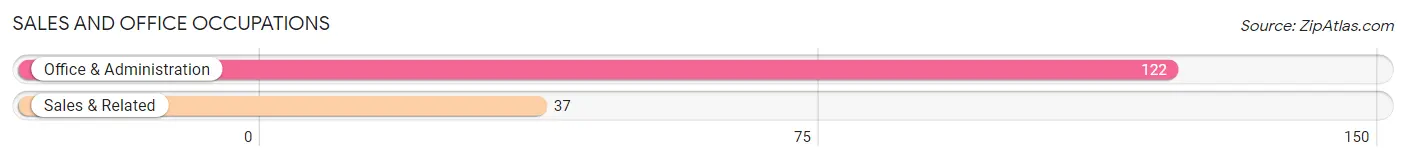
Sales and Office Occupations by Sex
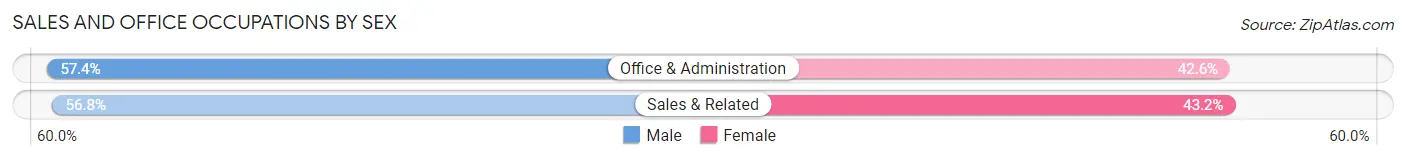
| Occupation | Male | Female |
| Sales & Related | 21 (56.8%) | 16 (43.2%) |
| Office & Administration | 70 (57.4%) | 52 (42.6%) |
| Total (Category) | 91 (57.2%) | 68 (42.8%) |
| Total (Overall) | 309 (52.7%) | 277 (47.3%) |
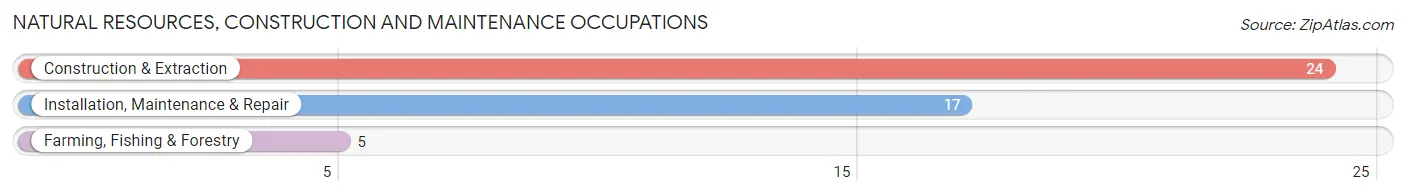
Natural Resources, Construction and Maintenance Occupations
The most common Natural Resources, Construction and Maintenance occupations in Oriskany are Construction & Extraction (24 | 4.1%), Installation, Maintenance & Repair (17 | 2.9%), and Farming, Fishing & Forestry (5 | 0.9%).
Natural Resources, Construction and Maintenance Occupations by Sex
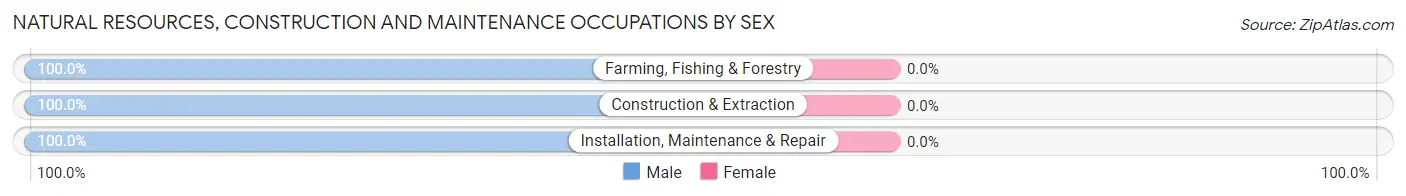
| Occupation | Male | Female |
| Farming, Fishing & Forestry | 5 (100.0%) | 0 (0.0%) |
| Construction & Extraction | 24 (100.0%) | 0 (0.0%) |
| Installation, Maintenance & Repair | 17 (100.0%) | 0 (0.0%) |
| Total (Category) | 46 (100.0%) | 0 (0.0%) |
| Total (Overall) | 309 (52.7%) | 277 (47.3%) |
Production, Transportation and Moving Occupations
The most common Production, Transportation and Moving occupations in Oriskany are Material Moving (13 | 2.2%), Transportation (11 | 1.9%), and Production (9 | 1.5%).
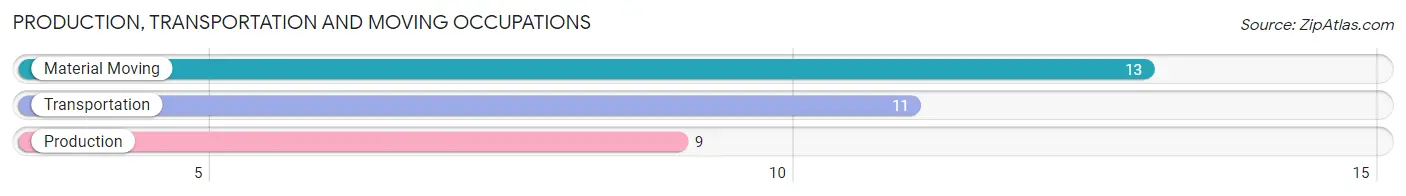
Production, Transportation and Moving Occupations by Sex
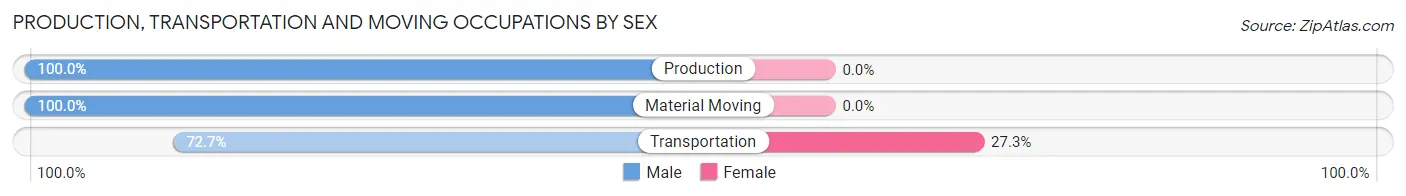
| Occupation | Male | Female |
| Production | 9 (100.0%) | 0 (0.0%) |
| Transportation | 8 (72.7%) | 3 (27.3%) |
| Material Moving | 13 (100.0%) | 0 (0.0%) |
| Total (Category) | 30 (90.9%) | 3 (9.1%) |
| Total (Overall) | 309 (52.7%) | 277 (47.3%) |
Employment Industries by Sex in Oriskany
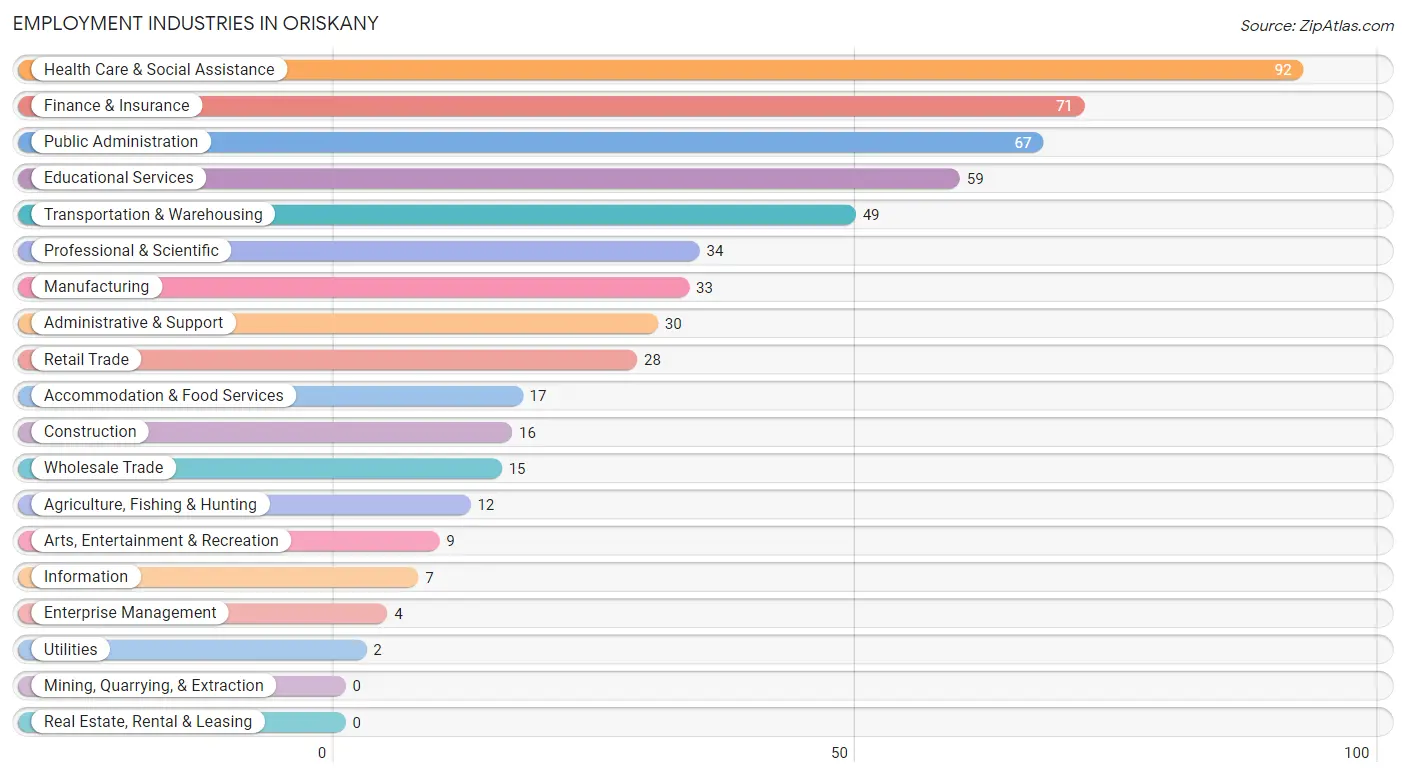
Employment Industries in Oriskany
The major employment industries in Oriskany include Health Care & Social Assistance (92 | 15.7%), Finance & Insurance (71 | 12.1%), Public Administration (67 | 11.4%), Educational Services (59 | 10.1%), and Transportation & Warehousing (49 | 8.4%).
Employment Industries by Sex in Oriskany
The Oriskany industries that see more men than women are Agriculture, Fishing & Hunting (100.0%), Construction (100.0%), and Wholesale Trade (100.0%), whereas the industries that tend to have a higher number of women are Enterprise Management (100.0%), Health Care & Social Assistance (78.3%), and Finance & Insurance (74.7%).
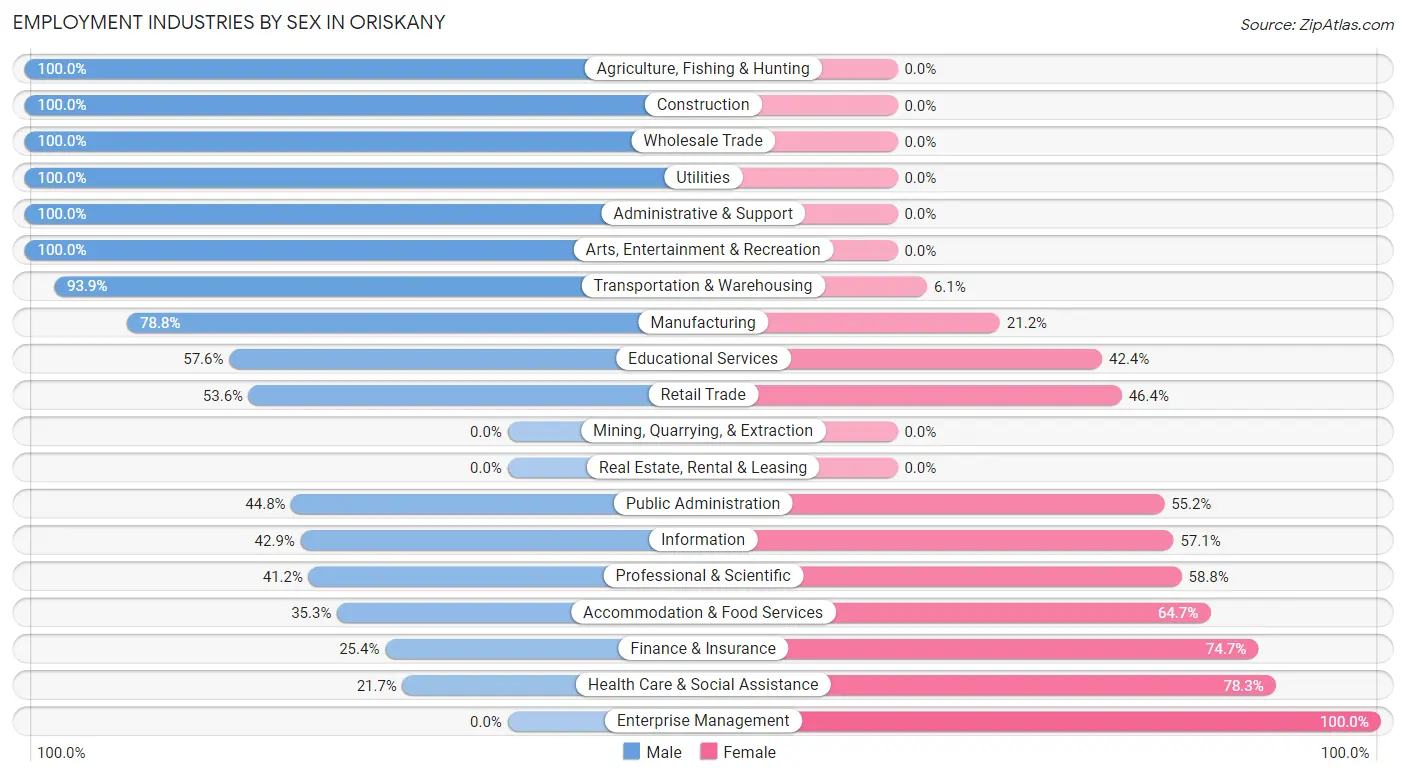
| Industry | Male | Female |
| Agriculture, Fishing & Hunting | 12 (100.0%) | 0 (0.0%) |
| Mining, Quarrying, & Extraction | 0 (0.0%) | 0 (0.0%) |
| Construction | 16 (100.0%) | 0 (0.0%) |
| Manufacturing | 26 (78.8%) | 7 (21.2%) |
| Wholesale Trade | 15 (100.0%) | 0 (0.0%) |
| Retail Trade | 15 (53.6%) | 13 (46.4%) |
| Transportation & Warehousing | 46 (93.9%) | 3 (6.1%) |
| Utilities | 2 (100.0%) | 0 (0.0%) |
| Information | 3 (42.9%) | 4 (57.1%) |
| Finance & Insurance | 18 (25.4%) | 53 (74.7%) |
| Real Estate, Rental & Leasing | 0 (0.0%) | 0 (0.0%) |
| Professional & Scientific | 14 (41.2%) | 20 (58.8%) |
| Enterprise Management | 0 (0.0%) | 4 (100.0%) |
| Administrative & Support | 30 (100.0%) | 0 (0.0%) |
| Educational Services | 34 (57.6%) | 25 (42.4%) |
| Health Care & Social Assistance | 20 (21.7%) | 72 (78.3%) |
| Arts, Entertainment & Recreation | 9 (100.0%) | 0 (0.0%) |
| Accommodation & Food Services | 6 (35.3%) | 11 (64.7%) |
| Public Administration | 30 (44.8%) | 37 (55.2%) |
| Total | 309 (52.7%) | 277 (47.3%) |
Education in Oriskany
School Enrollment in Oriskany
The most common levels of schooling among the 199 students in Oriskany are elementary school (59 | 29.6%), high school (47 | 23.6%), and college / undergraduate (47 | 23.6%).
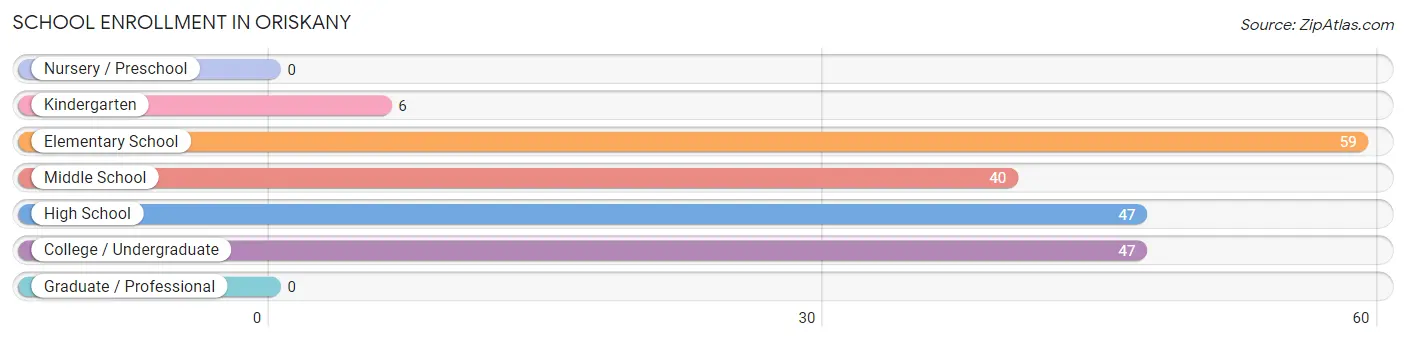
| School Level | # Students | % Students |
| Nursery / Preschool | 0 | 0.0% |
| Kindergarten | 6 | 3.0% |
| Elementary School | 59 | 29.6% |
| Middle School | 40 | 20.1% |
| High School | 47 | 23.6% |
| College / Undergraduate | 47 | 23.6% |
| Graduate / Professional | 0 | 0.0% |
| Total | 199 | 100.0% |
School Enrollment by Age by Funding Source in Oriskany
Out of a total of 199 students who are enrolled in schools in Oriskany, 26 (13.1%) attend a private institution, while the remaining 173 (86.9%) are enrolled in public schools. The age group of 35 years and over has the highest likelihood of being enrolled in private schools, with 3 (100.0% in the age bracket) enrolled. Conversely, the age group of 5 to 9 year old has the lowest likelihood of being enrolled in a private school, with 65 (100.0% in the age bracket) attending a public institution.
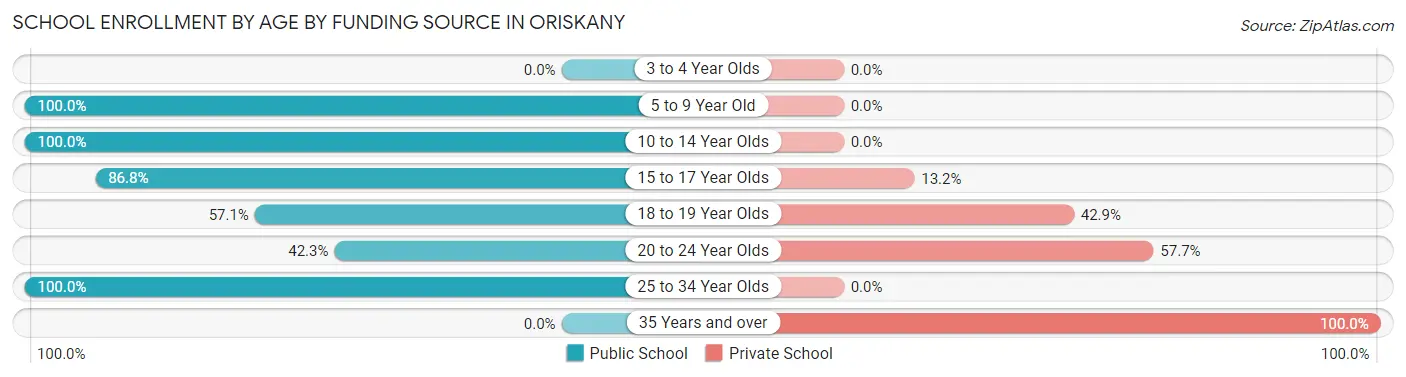
| Age Bracket | Public School | Private School |
| 3 to 4 Year Olds | 0 (0.0%) | 0 (0.0%) |
| 5 to 9 Year Old | 65 (100.0%) | 0 (0.0%) |
| 10 to 14 Year Olds | 54 (100.0%) | 0 (0.0%) |
| 15 to 17 Year Olds | 33 (86.8%) | 5 (13.2%) |
| 18 to 19 Year Olds | 4 (57.1%) | 3 (42.9%) |
| 20 to 24 Year Olds | 11 (42.3%) | 15 (57.7%) |
| 25 to 34 Year Olds | 6 (100.0%) | 0 (0.0%) |
| 35 Years and over | 0 (0.0%) | 3 (100.0%) |
| Total | 173 (86.9%) | 26 (13.1%) |
Educational Attainment by Field of Study in Oriskany
Business (39 | 21.5%), science & technology (34 | 18.8%), psychology (19 | 10.5%), education (17 | 9.4%), and computers & mathematics (15 | 8.3%) are the most common fields of study among 181 individuals in Oriskany who have obtained a bachelor's degree or higher.
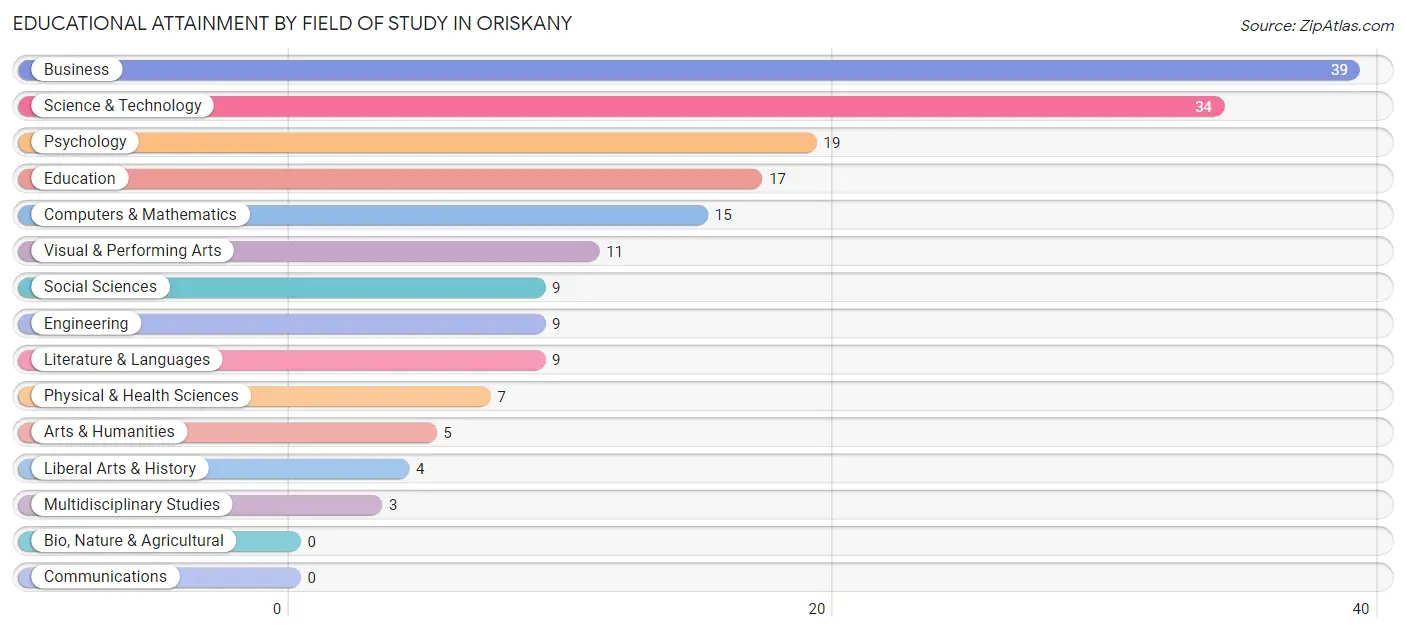
| Field of Study | # Graduates | % Graduates |
| Computers & Mathematics | 15 | 8.3% |
| Bio, Nature & Agricultural | 0 | 0.0% |
| Physical & Health Sciences | 7 | 3.9% |
| Psychology | 19 | 10.5% |
| Social Sciences | 9 | 5.0% |
| Engineering | 9 | 5.0% |
| Multidisciplinary Studies | 3 | 1.7% |
| Science & Technology | 34 | 18.8% |
| Business | 39 | 21.5% |
| Education | 17 | 9.4% |
| Literature & Languages | 9 | 5.0% |
| Liberal Arts & History | 4 | 2.2% |
| Visual & Performing Arts | 11 | 6.1% |
| Communications | 0 | 0.0% |
| Arts & Humanities | 5 | 2.8% |
| Total | 181 | 100.0% |
Transportation & Commute in Oriskany
Vehicle Availability by Sex in Oriskany
The most prevalent vehicle ownership categories in Oriskany are males with 2 vehicles (176, accounting for 57.9%) and females with 2 vehicles (162, making up 63.5%).
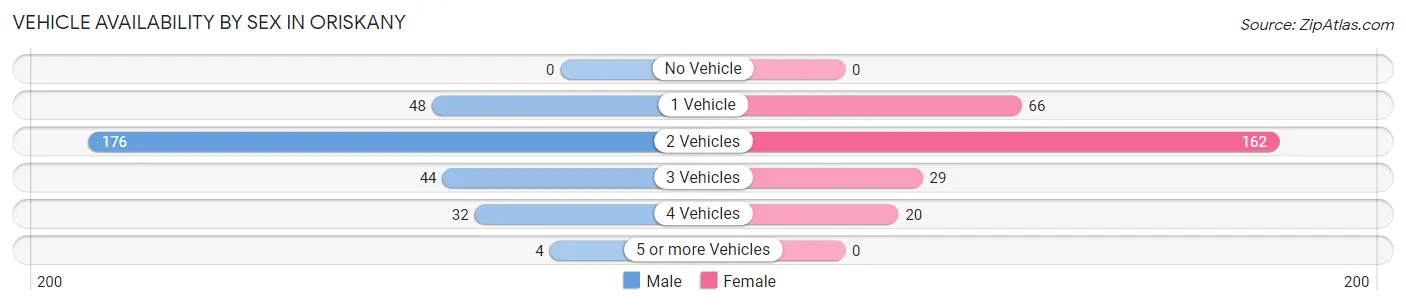
| Vehicles Available | Male | Female |
| No Vehicle | 0 (0.0%) | 0 (0.0%) |
| 1 Vehicle | 48 (15.8%) | 66 (23.8%) |
| 2 Vehicles | 176 (57.9%) | 162 (58.5%) |
| 3 Vehicles | 44 (14.5%) | 29 (10.5%) |
| 4 Vehicles | 32 (10.5%) | 20 (7.2%) |
| 5 or more Vehicles | 4 (1.3%) | 0 (0.0%) |
| Total | 304 (100.0%) | 277 (100.0%) |
Commute Time in Oriskany
The most frequently occuring commute durations in Oriskany are 10 to 14 minutes (165 commuters, 30.6%), 15 to 19 minutes (155 commuters, 28.7%), and 5 to 9 minutes (86 commuters, 15.9%).
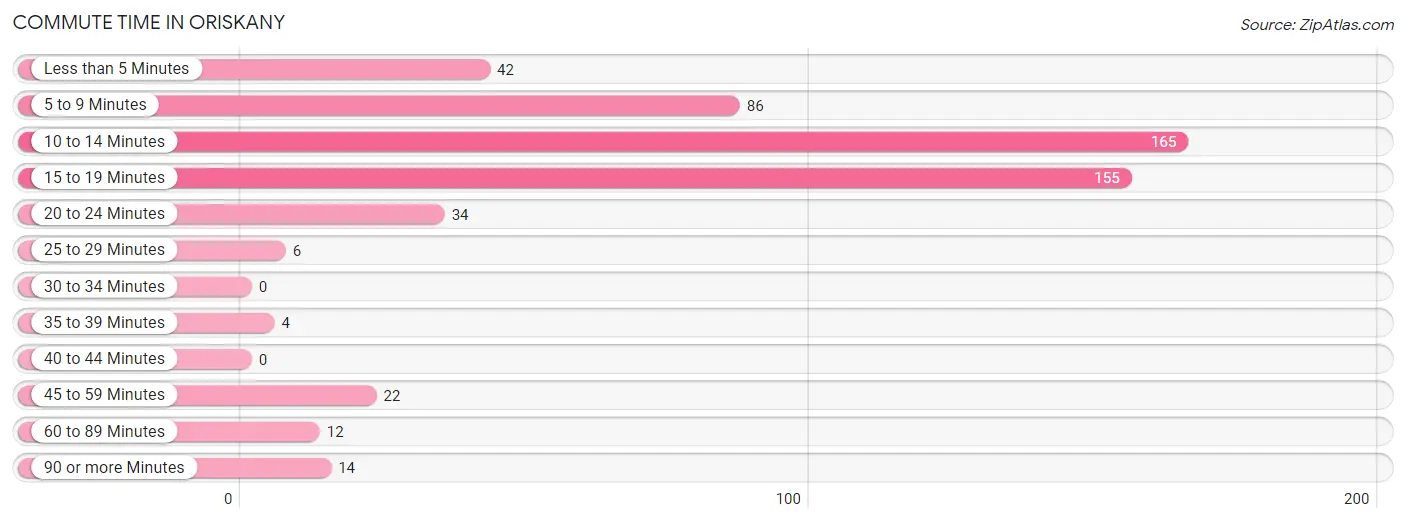
| Commute Time | # Commuters | % Commuters |
| Less than 5 Minutes | 42 | 7.8% |
| 5 to 9 Minutes | 86 | 15.9% |
| 10 to 14 Minutes | 165 | 30.6% |
| 15 to 19 Minutes | 155 | 28.7% |
| 20 to 24 Minutes | 34 | 6.3% |
| 25 to 29 Minutes | 6 | 1.1% |
| 30 to 34 Minutes | 0 | 0.0% |
| 35 to 39 Minutes | 4 | 0.7% |
| 40 to 44 Minutes | 0 | 0.0% |
| 45 to 59 Minutes | 22 | 4.1% |
| 60 to 89 Minutes | 12 | 2.2% |
| 90 or more Minutes | 14 | 2.6% |
Commute Time by Sex in Oriskany
The most common commute times in Oriskany are 10 to 14 minutes (115 commuters, 39.0%) for males and 15 to 19 minutes (83 commuters, 33.9%) for females.
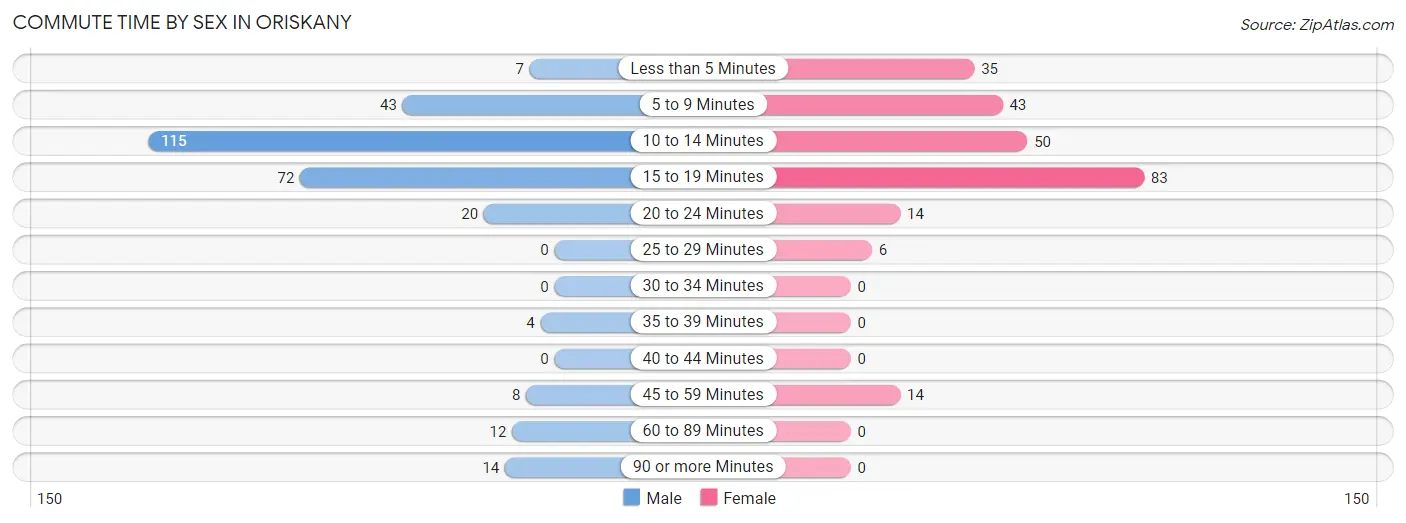
| Commute Time | Male | Female |
| Less than 5 Minutes | 7 (2.4%) | 35 (14.3%) |
| 5 to 9 Minutes | 43 (14.6%) | 43 (17.5%) |
| 10 to 14 Minutes | 115 (39.0%) | 50 (20.4%) |
| 15 to 19 Minutes | 72 (24.4%) | 83 (33.9%) |
| 20 to 24 Minutes | 20 (6.8%) | 14 (5.7%) |
| 25 to 29 Minutes | 0 (0.0%) | 6 (2.5%) |
| 30 to 34 Minutes | 0 (0.0%) | 0 (0.0%) |
| 35 to 39 Minutes | 4 (1.4%) | 0 (0.0%) |
| 40 to 44 Minutes | 0 (0.0%) | 0 (0.0%) |
| 45 to 59 Minutes | 8 (2.7%) | 14 (5.7%) |
| 60 to 89 Minutes | 12 (4.1%) | 0 (0.0%) |
| 90 or more Minutes | 14 (4.8%) | 0 (0.0%) |
Time of Departure to Work by Sex in Oriskany
The most frequent times of departure to work in Oriskany are 6:00 AM to 6:29 AM (60, 20.3%) for males and 7:30 AM to 7:59 AM (66, 26.9%) for females.
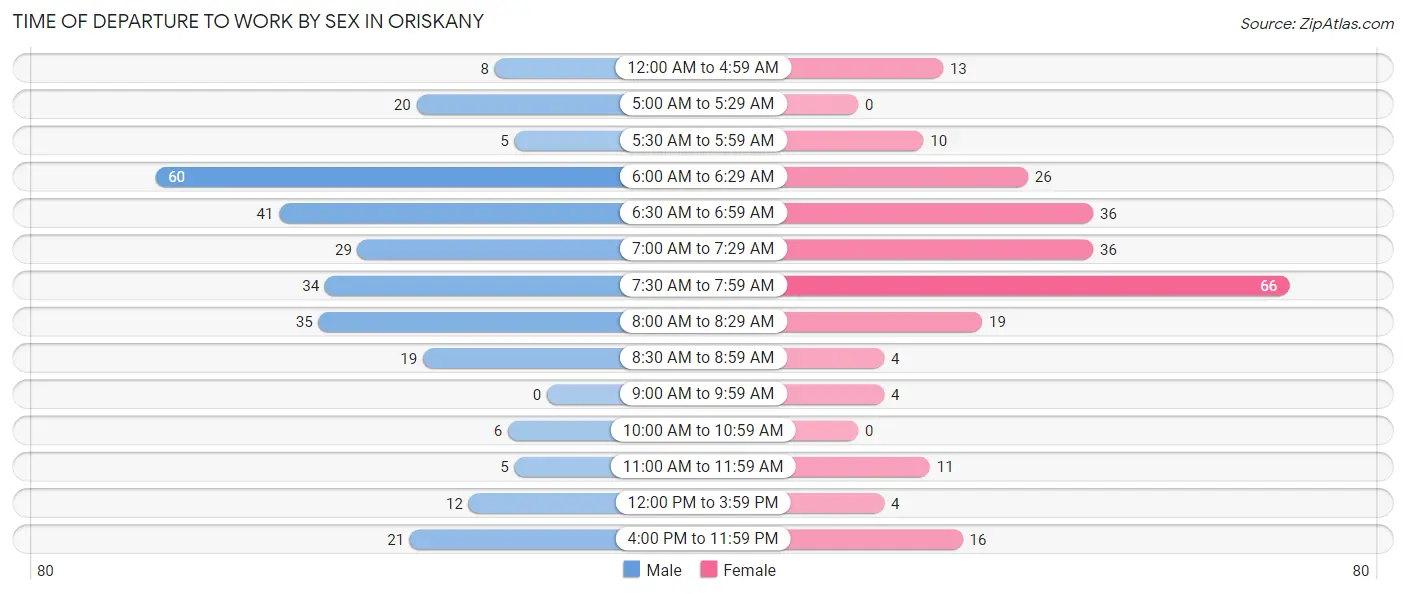
| Time of Departure | Male | Female |
| 12:00 AM to 4:59 AM | 8 (2.7%) | 13 (5.3%) |
| 5:00 AM to 5:29 AM | 20 (6.8%) | 0 (0.0%) |
| 5:30 AM to 5:59 AM | 5 (1.7%) | 10 (4.1%) |
| 6:00 AM to 6:29 AM | 60 (20.3%) | 26 (10.6%) |
| 6:30 AM to 6:59 AM | 41 (13.9%) | 36 (14.7%) |
| 7:00 AM to 7:29 AM | 29 (9.8%) | 36 (14.7%) |
| 7:30 AM to 7:59 AM | 34 (11.5%) | 66 (26.9%) |
| 8:00 AM to 8:29 AM | 35 (11.9%) | 19 (7.8%) |
| 8:30 AM to 8:59 AM | 19 (6.4%) | 4 (1.6%) |
| 9:00 AM to 9:59 AM | 0 (0.0%) | 4 (1.6%) |
| 10:00 AM to 10:59 AM | 6 (2.0%) | 0 (0.0%) |
| 11:00 AM to 11:59 AM | 5 (1.7%) | 11 (4.5%) |
| 12:00 PM to 3:59 PM | 12 (4.1%) | 4 (1.6%) |
| 4:00 PM to 11:59 PM | 21 (7.1%) | 16 (6.5%) |
| Total | 295 (100.0%) | 245 (100.0%) |
Housing Occupancy in Oriskany
Occupancy by Ownership in Oriskany
Of the total 530 dwellings in Oriskany, owner-occupied units account for 380 (71.7%), while renter-occupied units make up 150 (28.3%).
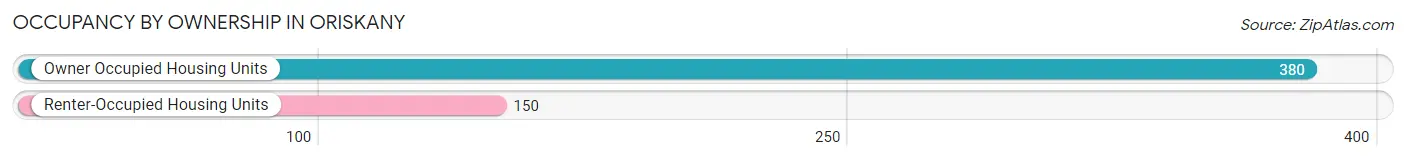
| Occupancy | # Housing Units | % Housing Units |
| Owner Occupied Housing Units | 380 | 71.7% |
| Renter-Occupied Housing Units | 150 | 28.3% |
| Total Occupied Housing Units | 530 | 100.0% |
Occupancy by Household Size in Oriskany
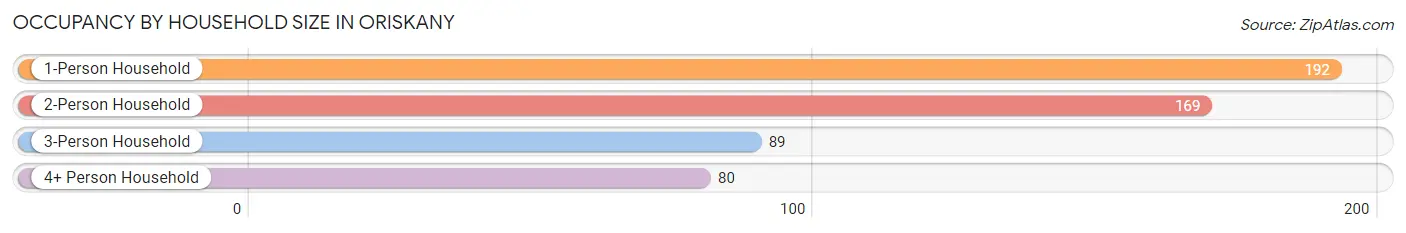
| Household Size | # Housing Units | % Housing Units |
| 1-Person Household | 192 | 36.2% |
| 2-Person Household | 169 | 31.9% |
| 3-Person Household | 89 | 16.8% |
| 4+ Person Household | 80 | 15.1% |
| Total Housing Units | 530 | 100.0% |
Occupancy by Ownership by Household Size in Oriskany

| Household Size | Owner-occupied | Renter-occupied |
| 1-Person Household | 102 (53.1%) | 90 (46.9%) |
| 2-Person Household | 135 (79.9%) | 34 (20.1%) |
| 3-Person Household | 72 (80.9%) | 17 (19.1%) |
| 4+ Person Household | 71 (88.7%) | 9 (11.3%) |
| Total Housing Units | 380 (71.7%) | 150 (28.3%) |
Occupancy by Educational Attainment in Oriskany
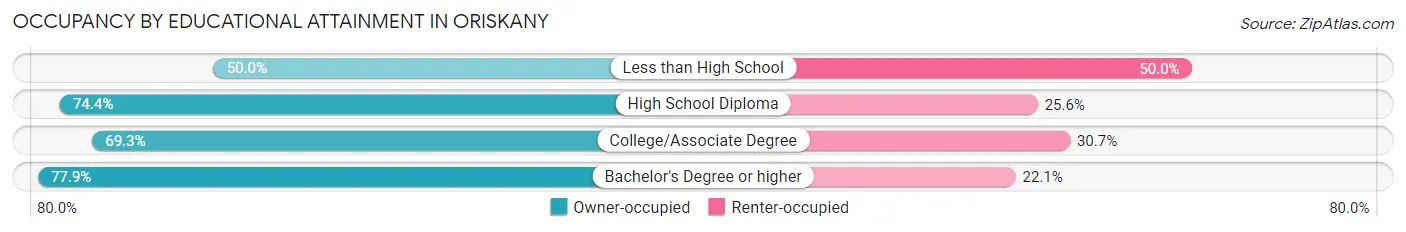
| Household Size | Owner-occupied | Renter-occupied |
| Less than High School | 13 (50.0%) | 13 (50.0%) |
| High School Diploma | 119 (74.4%) | 41 (25.6%) |
| College/Associate Degree | 160 (69.3%) | 71 (30.7%) |
| Bachelor's Degree or higher | 88 (77.9%) | 25 (22.1%) |
Occupancy by Age of Householder in Oriskany
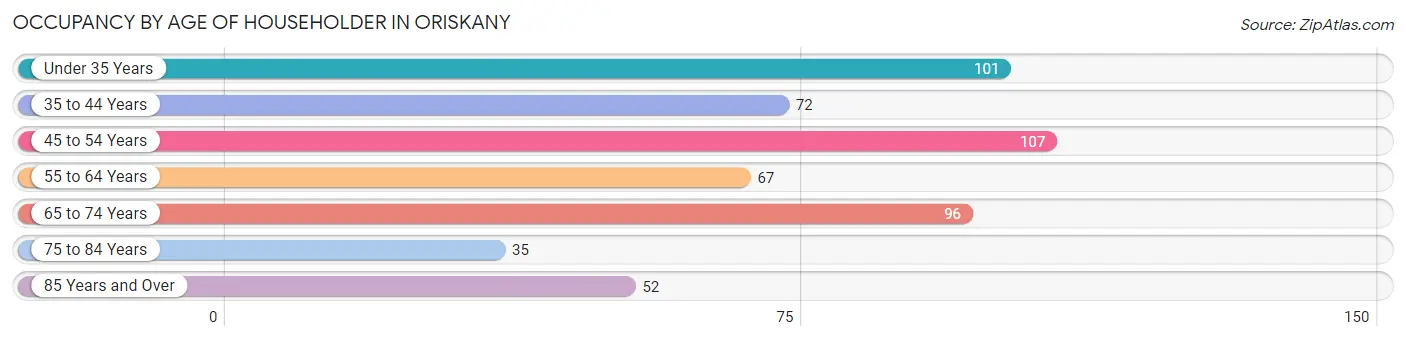
| Age Bracket | # Households | % Households |
| Under 35 Years | 101 | 19.1% |
| 35 to 44 Years | 72 | 13.6% |
| 45 to 54 Years | 107 | 20.2% |
| 55 to 64 Years | 67 | 12.6% |
| 65 to 74 Years | 96 | 18.1% |
| 75 to 84 Years | 35 | 6.6% |
| 85 Years and Over | 52 | 9.8% |
| Total | 530 | 100.0% |
Housing Finances in Oriskany
Median Income by Occupancy in Oriskany
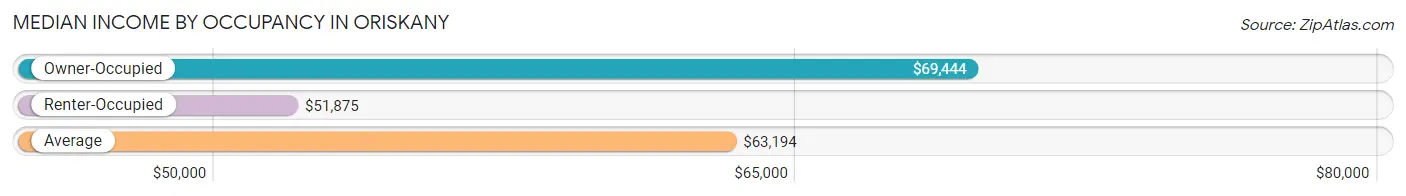
| Occupancy Type | # Households | Median Income |
| Owner-Occupied | 380 (71.7%) | $69,444 |
| Renter-Occupied | 150 (28.3%) | $51,875 |
| Average | 530 (100.0%) | $63,194 |
Occupancy by Householder Income Bracket in Oriskany
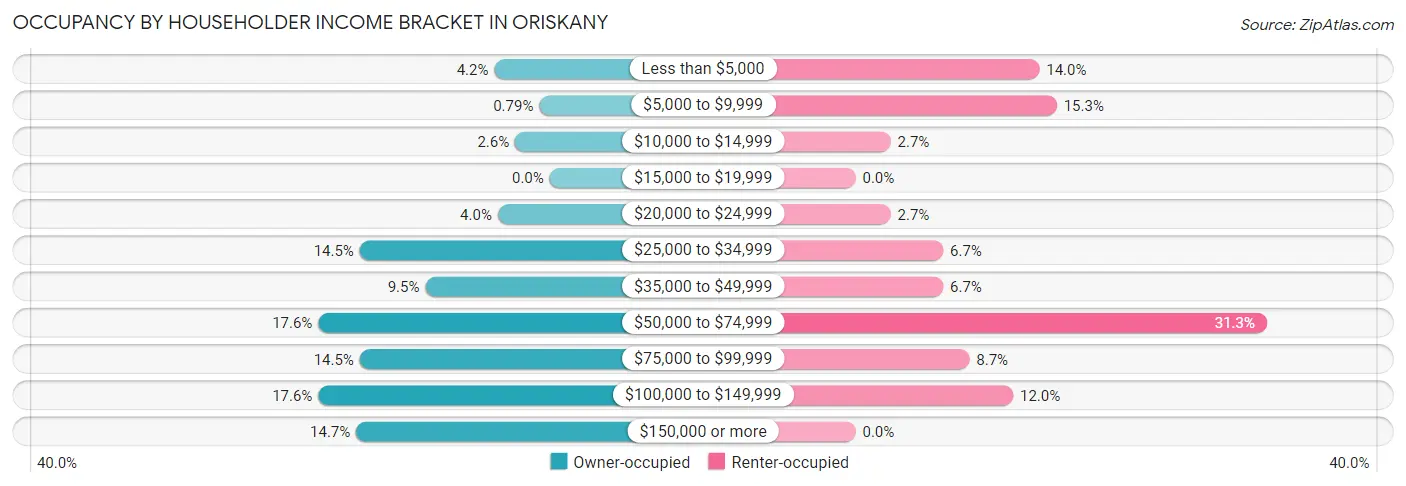
| Income Bracket | Owner-occupied | Renter-occupied |
| Less than $5,000 | 16 (4.2%) | 21 (14.0%) |
| $5,000 to $9,999 | 3 (0.8%) | 23 (15.3%) |
| $10,000 to $14,999 | 10 (2.6%) | 4 (2.7%) |
| $15,000 to $19,999 | 0 (0.0%) | 0 (0.0%) |
| $20,000 to $24,999 | 15 (4.0%) | 4 (2.7%) |
| $25,000 to $34,999 | 55 (14.5%) | 10 (6.7%) |
| $35,000 to $49,999 | 36 (9.5%) | 10 (6.7%) |
| $50,000 to $74,999 | 67 (17.6%) | 47 (31.3%) |
| $75,000 to $99,999 | 55 (14.5%) | 13 (8.7%) |
| $100,000 to $149,999 | 67 (17.6%) | 18 (12.0%) |
| $150,000 or more | 56 (14.7%) | 0 (0.0%) |
| Total | 380 (100.0%) | 150 (100.0%) |
Monthly Housing Cost Tiers in Oriskany
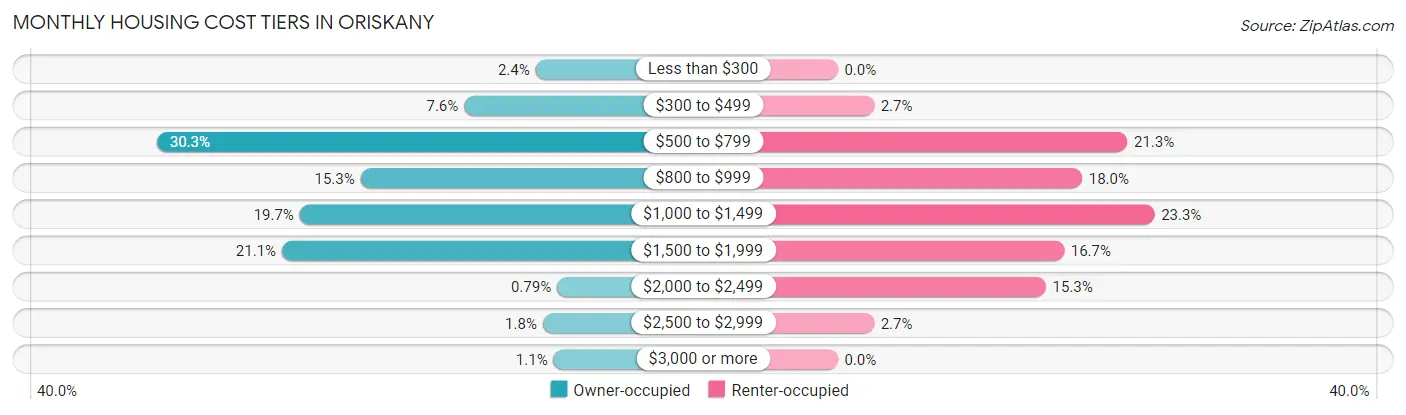
| Monthly Cost | Owner-occupied | Renter-occupied |
| Less than $300 | 9 (2.4%) | 0 (0.0%) |
| $300 to $499 | 29 (7.6%) | 4 (2.7%) |
| $500 to $799 | 115 (30.3%) | 32 (21.3%) |
| $800 to $999 | 58 (15.3%) | 27 (18.0%) |
| $1,000 to $1,499 | 75 (19.7%) | 35 (23.3%) |
| $1,500 to $1,999 | 80 (21.0%) | 25 (16.7%) |
| $2,000 to $2,499 | 3 (0.8%) | 23 (15.3%) |
| $2,500 to $2,999 | 7 (1.8%) | 4 (2.7%) |
| $3,000 or more | 4 (1.1%) | 0 (0.0%) |
| Total | 380 (100.0%) | 150 (100.0%) |
Physical Housing Characteristics in Oriskany
Housing Structures in Oriskany
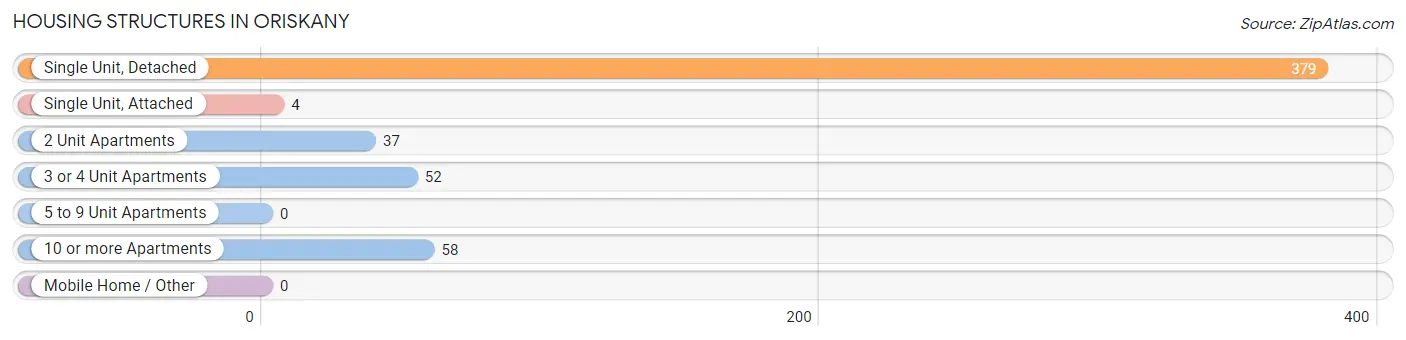
| Structure Type | # Housing Units | % Housing Units |
| Single Unit, Detached | 379 | 71.5% |
| Single Unit, Attached | 4 | 0.7% |
| 2 Unit Apartments | 37 | 7.0% |
| 3 or 4 Unit Apartments | 52 | 9.8% |
| 5 to 9 Unit Apartments | 0 | 0.0% |
| 10 or more Apartments | 58 | 10.9% |
| Mobile Home / Other | 0 | 0.0% |
| Total | 530 | 100.0% |
Housing Structures by Occupancy in Oriskany
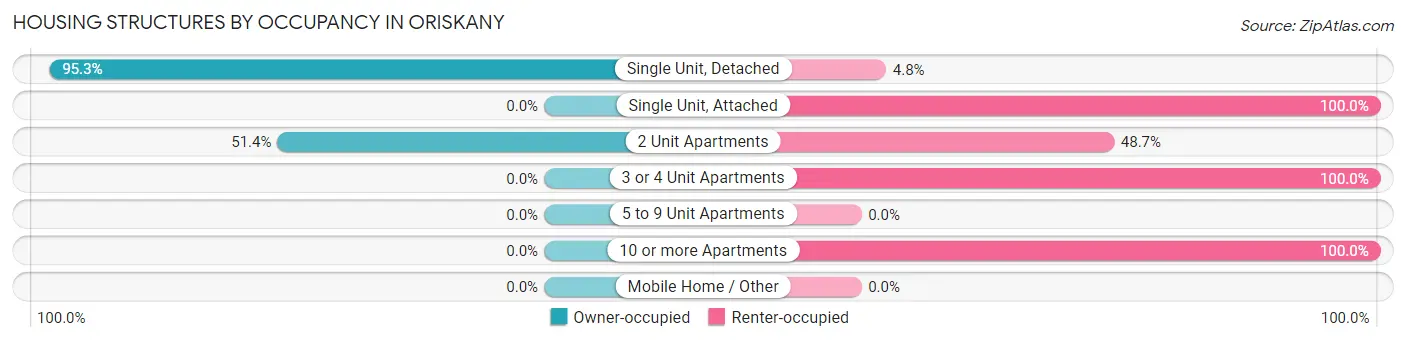
| Structure Type | Owner-occupied | Renter-occupied |
| Single Unit, Detached | 361 (95.3%) | 18 (4.8%) |
| Single Unit, Attached | 0 (0.0%) | 4 (100.0%) |
| 2 Unit Apartments | 19 (51.3%) | 18 (48.6%) |
| 3 or 4 Unit Apartments | 0 (0.0%) | 52 (100.0%) |
| 5 to 9 Unit Apartments | 0 (0.0%) | 0 (0.0%) |
| 10 or more Apartments | 0 (0.0%) | 58 (100.0%) |
| Mobile Home / Other | 0 (0.0%) | 0 (0.0%) |
| Total | 380 (71.7%) | 150 (28.3%) |
Housing Structures by Number of Rooms in Oriskany
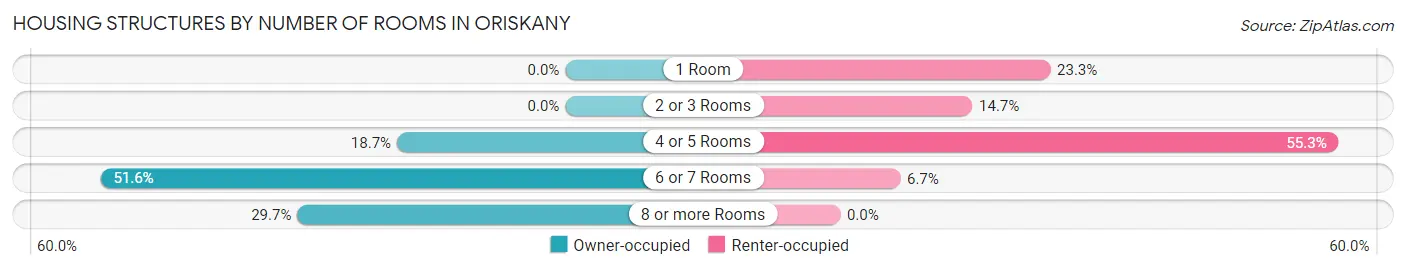
| Number of Rooms | Owner-occupied | Renter-occupied |
| 1 Room | 0 (0.0%) | 35 (23.3%) |
| 2 or 3 Rooms | 0 (0.0%) | 22 (14.7%) |
| 4 or 5 Rooms | 71 (18.7%) | 83 (55.3%) |
| 6 or 7 Rooms | 196 (51.6%) | 10 (6.7%) |
| 8 or more Rooms | 113 (29.7%) | 0 (0.0%) |
| Total | 380 (100.0%) | 150 (100.0%) |
Housing Structure by Heating Type in Oriskany
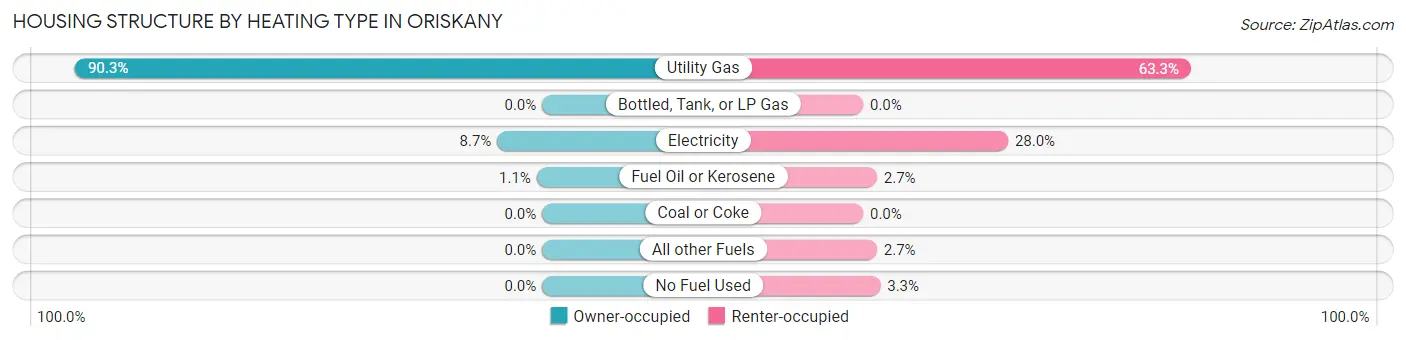
| Heating Type | Owner-occupied | Renter-occupied |
| Utility Gas | 343 (90.3%) | 95 (63.3%) |
| Bottled, Tank, or LP Gas | 0 (0.0%) | 0 (0.0%) |
| Electricity | 33 (8.7%) | 42 (28.0%) |
| Fuel Oil or Kerosene | 4 (1.1%) | 4 (2.7%) |
| Coal or Coke | 0 (0.0%) | 0 (0.0%) |
| All other Fuels | 0 (0.0%) | 4 (2.7%) |
| No Fuel Used | 0 (0.0%) | 5 (3.3%) |
| Total | 380 (100.0%) | 150 (100.0%) |
Household Vehicle Usage in Oriskany
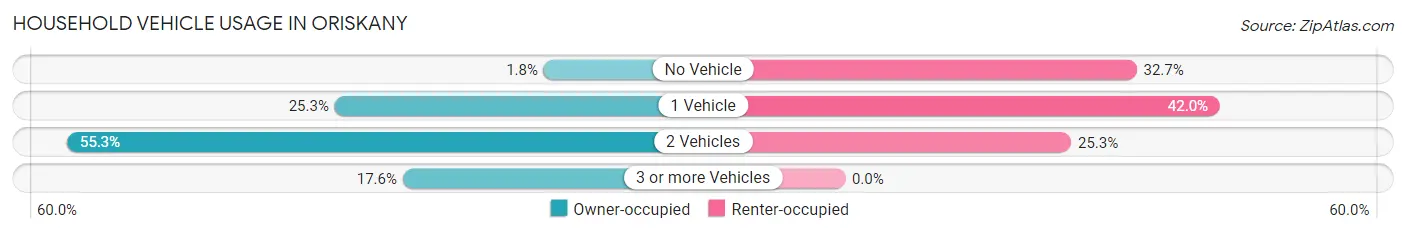
| Vehicles per Household | Owner-occupied | Renter-occupied |
| No Vehicle | 7 (1.8%) | 49 (32.7%) |
| 1 Vehicle | 96 (25.3%) | 63 (42.0%) |
| 2 Vehicles | 210 (55.3%) | 38 (25.3%) |
| 3 or more Vehicles | 67 (17.6%) | 0 (0.0%) |
| Total | 380 (100.0%) | 150 (100.0%) |
Real Estate & Mortgages in Oriskany
Real Estate and Mortgage Overview in Oriskany
| Characteristic | Without Mortgage | With Mortgage |
| Housing Units | 192 | 188 |
| Median Property Value | $129,600 | $171,500 |
| Median Household Income | $64,722 | $37 |
| Monthly Housing Costs | $627 | $4 |
| Real Estate Taxes | $3,520 | $0 |
Property Value by Mortgage Status in Oriskany
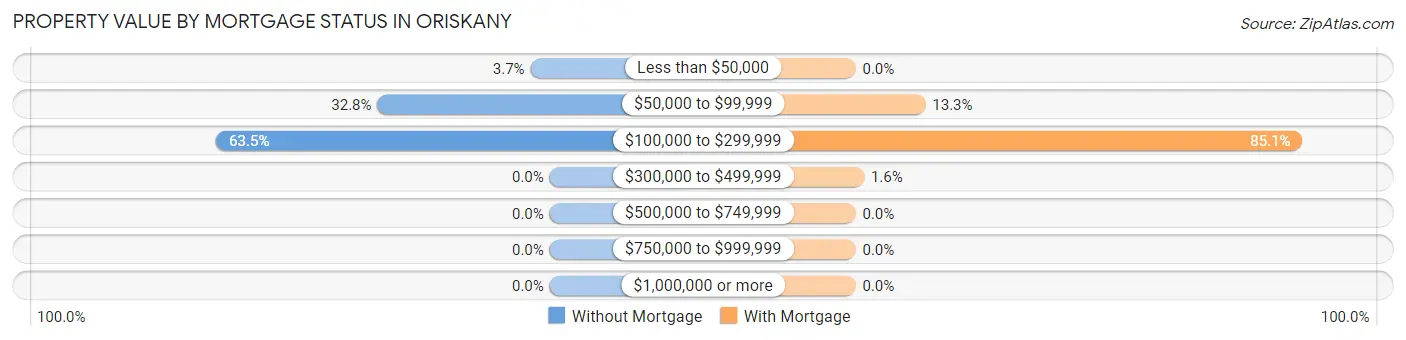
| Property Value | Without Mortgage | With Mortgage |
| Less than $50,000 | 7 (3.6%) | 0 (0.0%) |
| $50,000 to $99,999 | 63 (32.8%) | 25 (13.3%) |
| $100,000 to $299,999 | 122 (63.5%) | 160 (85.1%) |
| $300,000 to $499,999 | 0 (0.0%) | 3 (1.6%) |
| $500,000 to $749,999 | 0 (0.0%) | 0 (0.0%) |
| $750,000 to $999,999 | 0 (0.0%) | 0 (0.0%) |
| $1,000,000 or more | 0 (0.0%) | 0 (0.0%) |
| Total | 192 (100.0%) | 188 (100.0%) |
Household Income by Mortgage Status in Oriskany
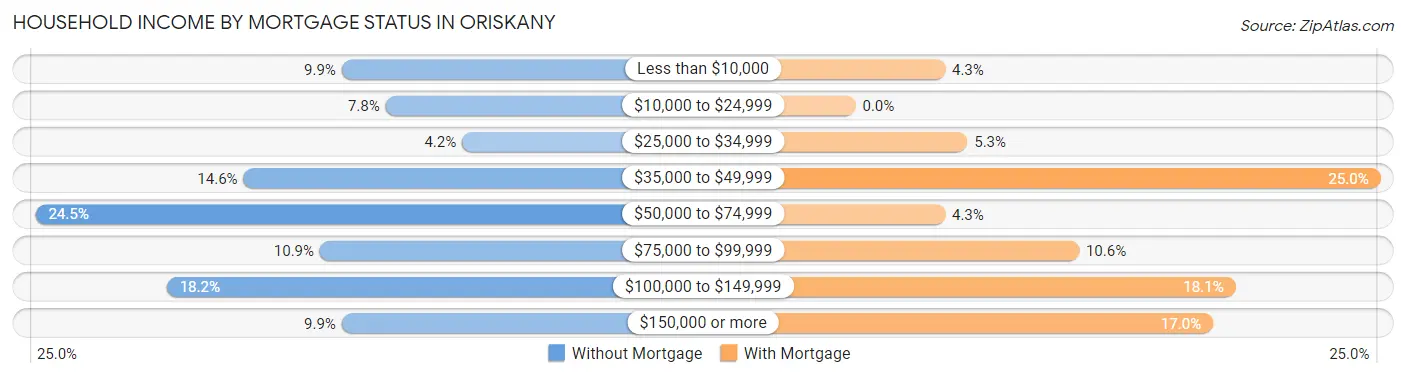
| Household Income | Without Mortgage | With Mortgage |
| Less than $10,000 | 19 (9.9%) | 8 (4.3%) |
| $10,000 to $24,999 | 15 (7.8%) | 0 (0.0%) |
| $25,000 to $34,999 | 8 (4.2%) | 10 (5.3%) |
| $35,000 to $49,999 | 28 (14.6%) | 47 (25.0%) |
| $50,000 to $74,999 | 47 (24.5%) | 8 (4.3%) |
| $75,000 to $99,999 | 21 (10.9%) | 20 (10.6%) |
| $100,000 to $149,999 | 35 (18.2%) | 34 (18.1%) |
| $150,000 or more | 19 (9.9%) | 32 (17.0%) |
| Total | 192 (100.0%) | 188 (100.0%) |
Property Value to Household Income Ratio in Oriskany
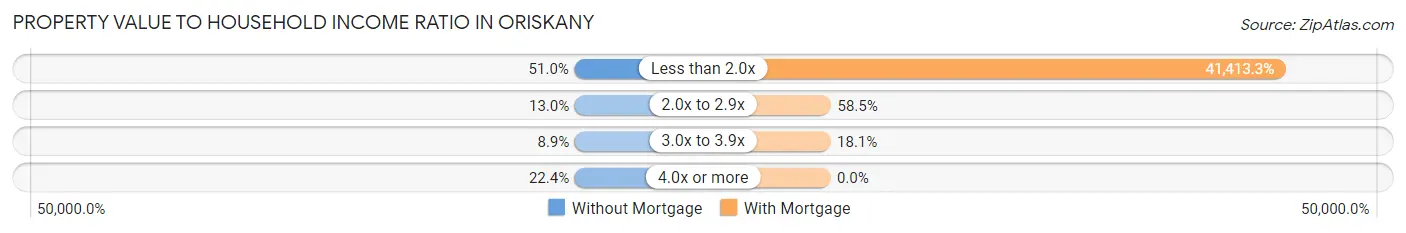
| Value-to-Income Ratio | Without Mortgage | With Mortgage |
| Less than 2.0x | 98 (51.0%) | 77,857 (41,413.3%) |
| 2.0x to 2.9x | 25 (13.0%) | 110 (58.5%) |
| 3.0x to 3.9x | 17 (8.8%) | 34 (18.1%) |
| 4.0x or more | 43 (22.4%) | 0 (0.0%) |
| Total | 192 (100.0%) | 188 (100.0%) |
Real Estate Taxes by Mortgage Status in Oriskany
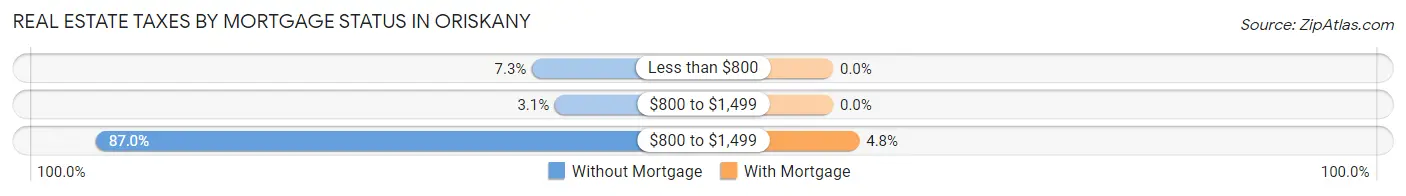
| Property Taxes | Without Mortgage | With Mortgage |
| Less than $800 | 14 (7.3%) | 0 (0.0%) |
| $800 to $1,499 | 6 (3.1%) | 0 (0.0%) |
| $800 to $1,499 | 167 (87.0%) | 9 (4.8%) |
| Total | 192 (100.0%) | 188 (100.0%) |
Health & Disability in Oriskany
Health Insurance Coverage by Age in Oriskany
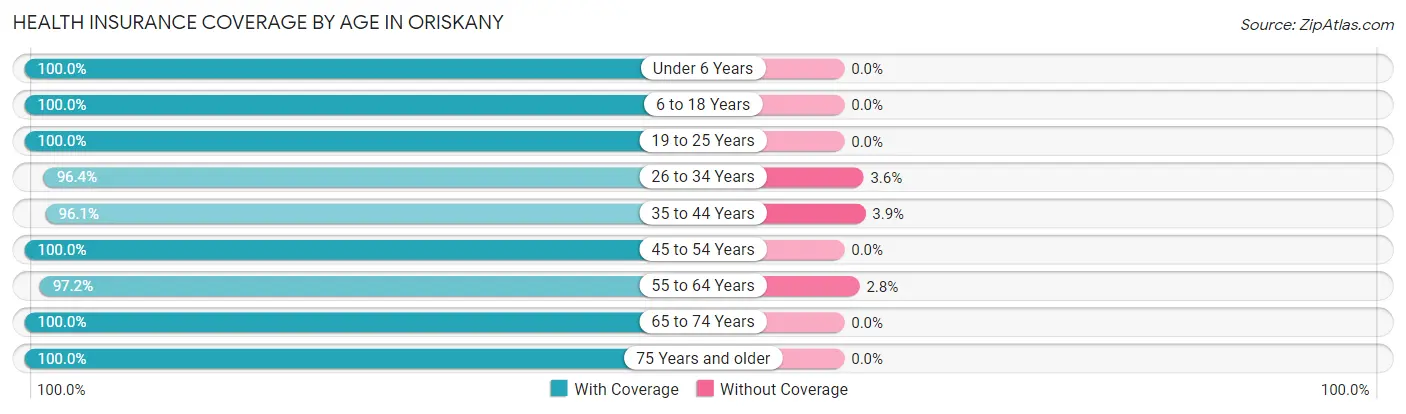
| Age Bracket | With Coverage | Without Coverage |
| Under 6 Years | 81 (100.0%) | 0 (0.0%) |
| 6 to 18 Years | 154 (100.0%) | 0 (0.0%) |
| 19 to 25 Years | 107 (100.0%) | 0 (0.0%) |
| 26 to 34 Years | 108 (96.4%) | 4 (3.6%) |
| 35 to 44 Years | 171 (96.1%) | 7 (3.9%) |
| 45 to 54 Years | 146 (100.0%) | 0 (0.0%) |
| 55 to 64 Years | 103 (97.2%) | 3 (2.8%) |
| 65 to 74 Years | 168 (100.0%) | 0 (0.0%) |
| 75 Years and older | 97 (100.0%) | 0 (0.0%) |
| Total | 1,135 (98.8%) | 14 (1.2%) |
Health Insurance Coverage by Citizenship Status in Oriskany
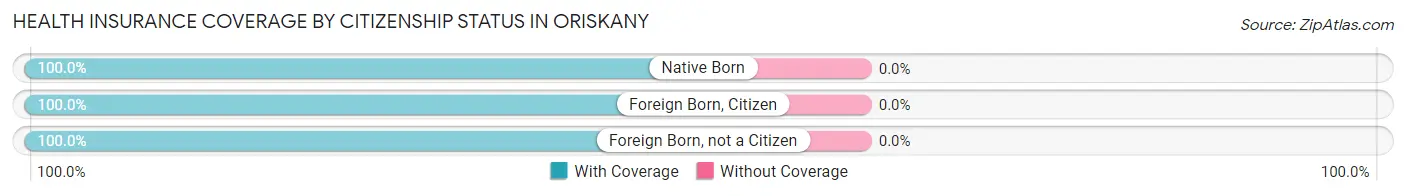
| Citizenship Status | With Coverage | Without Coverage |
| Native Born | 81 (100.0%) | 0 (0.0%) |
| Foreign Born, Citizen | 154 (100.0%) | 0 (0.0%) |
| Foreign Born, not a Citizen | 107 (100.0%) | 0 (0.0%) |
Health Insurance Coverage by Household Income in Oriskany
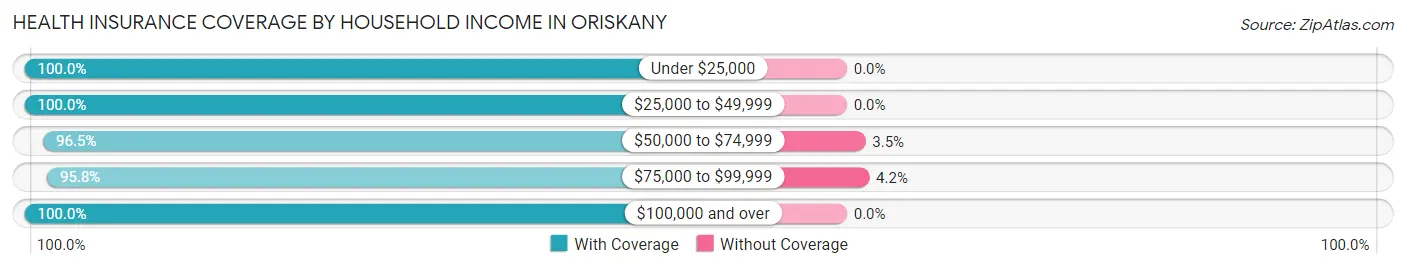
| Household Income | With Coverage | Without Coverage |
| Under $25,000 | 142 (100.0%) | 0 (0.0%) |
| $25,000 to $49,999 | 241 (100.0%) | 0 (0.0%) |
| $50,000 to $74,999 | 195 (96.5%) | 7 (3.5%) |
| $75,000 to $99,999 | 160 (95.8%) | 7 (4.2%) |
| $100,000 and over | 397 (100.0%) | 0 (0.0%) |
Public vs Private Health Insurance Coverage by Age in Oriskany
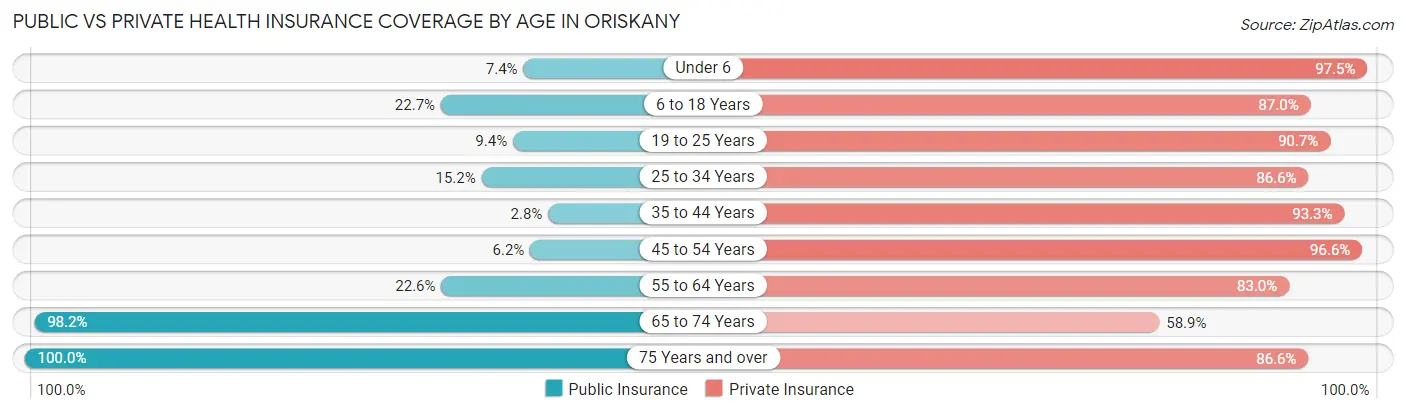
| Age Bracket | Public Insurance | Private Insurance |
| Under 6 | 6 (7.4%) | 79 (97.5%) |
| 6 to 18 Years | 35 (22.7%) | 134 (87.0%) |
| 19 to 25 Years | 10 (9.3%) | 97 (90.6%) |
| 25 to 34 Years | 17 (15.2%) | 97 (86.6%) |
| 35 to 44 Years | 5 (2.8%) | 166 (93.3%) |
| 45 to 54 Years | 9 (6.2%) | 141 (96.6%) |
| 55 to 64 Years | 24 (22.6%) | 88 (83.0%) |
| 65 to 74 Years | 165 (98.2%) | 99 (58.9%) |
| 75 Years and over | 97 (100.0%) | 84 (86.6%) |
| Total | 368 (32.0%) | 985 (85.7%) |
Disability Status by Sex by Age in Oriskany
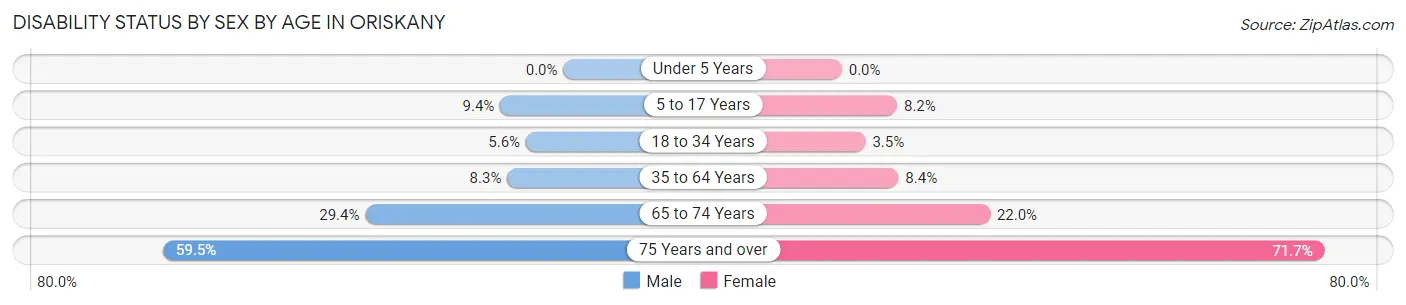
| Age Bracket | Male | Female |
| Under 5 Years | 0 (0.0%) | 0 (0.0%) |
| 5 to 17 Years | 9 (9.4%) | 5 (8.2%) |
| 18 to 34 Years | 6 (5.6%) | 4 (3.5%) |
| 35 to 64 Years | 18 (8.3%) | 18 (8.4%) |
| 65 to 74 Years | 20 (29.4%) | 22 (22.0%) |
| 75 Years and over | 22 (59.5%) | 43 (71.7%) |
Disability Class by Sex by Age in Oriskany
Disability Class: Hearing Difficulty
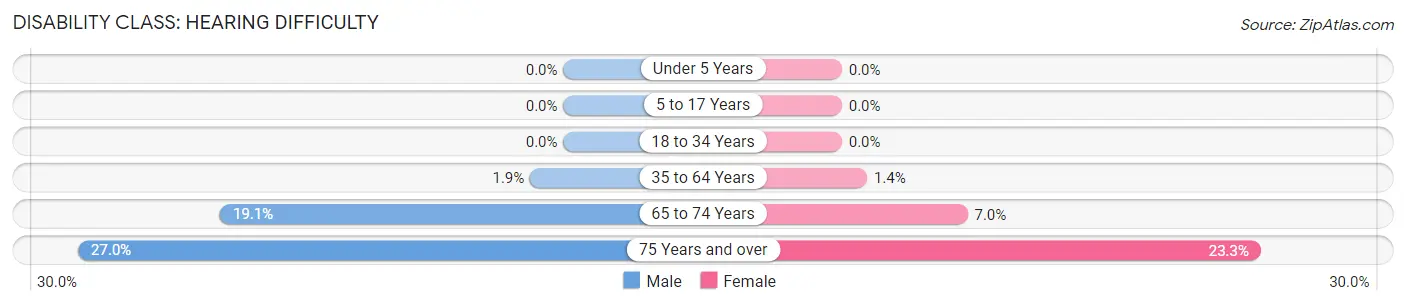
| Age Bracket | Male | Female |
| Under 5 Years | 0 (0.0%) | 0 (0.0%) |
| 5 to 17 Years | 0 (0.0%) | 0 (0.0%) |
| 18 to 34 Years | 0 (0.0%) | 0 (0.0%) |
| 35 to 64 Years | 4 (1.8%) | 3 (1.4%) |
| 65 to 74 Years | 13 (19.1%) | 7 (7.0%) |
| 75 Years and over | 10 (27.0%) | 14 (23.3%) |
Disability Class: Vision Difficulty
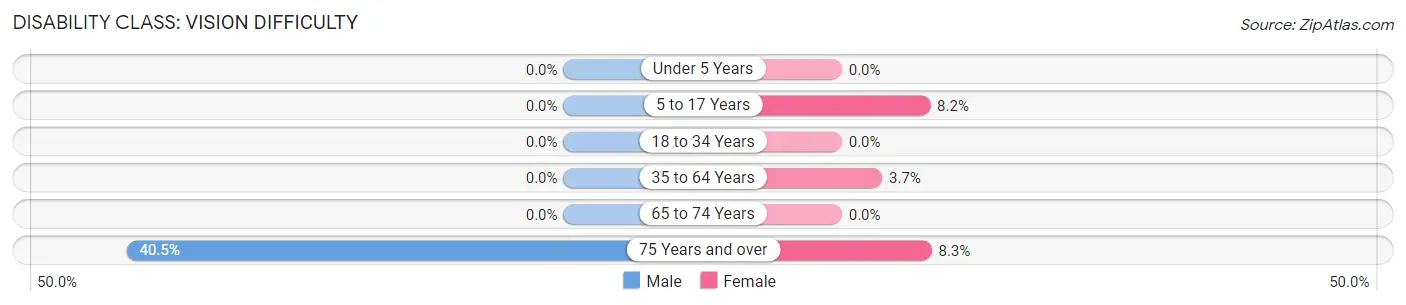
| Age Bracket | Male | Female |
| Under 5 Years | 0 (0.0%) | 0 (0.0%) |
| 5 to 17 Years | 0 (0.0%) | 5 (8.2%) |
| 18 to 34 Years | 0 (0.0%) | 0 (0.0%) |
| 35 to 64 Years | 0 (0.0%) | 8 (3.7%) |
| 65 to 74 Years | 0 (0.0%) | 0 (0.0%) |
| 75 Years and over | 15 (40.5%) | 5 (8.3%) |
Disability Class: Cognitive Difficulty
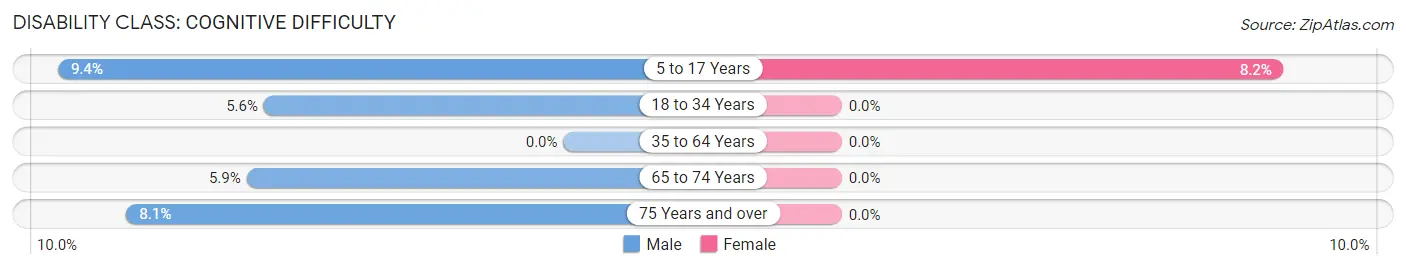
| Age Bracket | Male | Female |
| 5 to 17 Years | 9 (9.4%) | 5 (8.2%) |
| 18 to 34 Years | 6 (5.6%) | 0 (0.0%) |
| 35 to 64 Years | 0 (0.0%) | 0 (0.0%) |
| 65 to 74 Years | 4 (5.9%) | 0 (0.0%) |
| 75 Years and over | 3 (8.1%) | 0 (0.0%) |
Disability Class: Ambulatory Difficulty
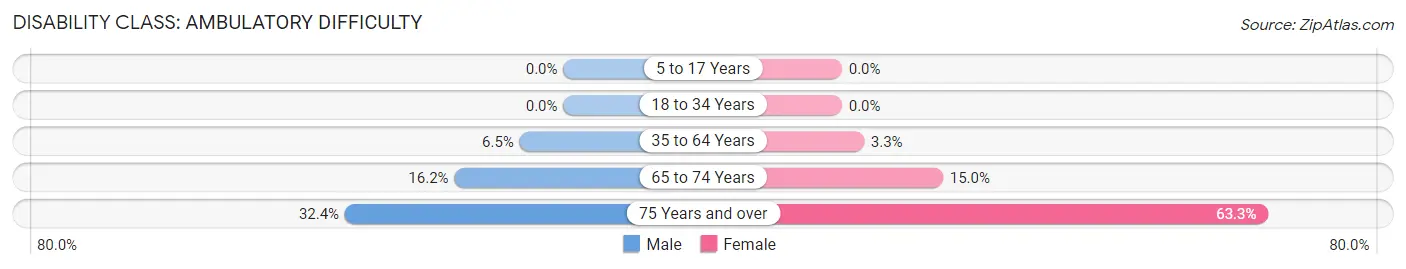
| Age Bracket | Male | Female |
| 5 to 17 Years | 0 (0.0%) | 0 (0.0%) |
| 18 to 34 Years | 0 (0.0%) | 0 (0.0%) |
| 35 to 64 Years | 14 (6.5%) | 7 (3.3%) |
| 65 to 74 Years | 11 (16.2%) | 15 (15.0%) |
| 75 Years and over | 12 (32.4%) | 38 (63.3%) |
Disability Class: Self-Care Difficulty
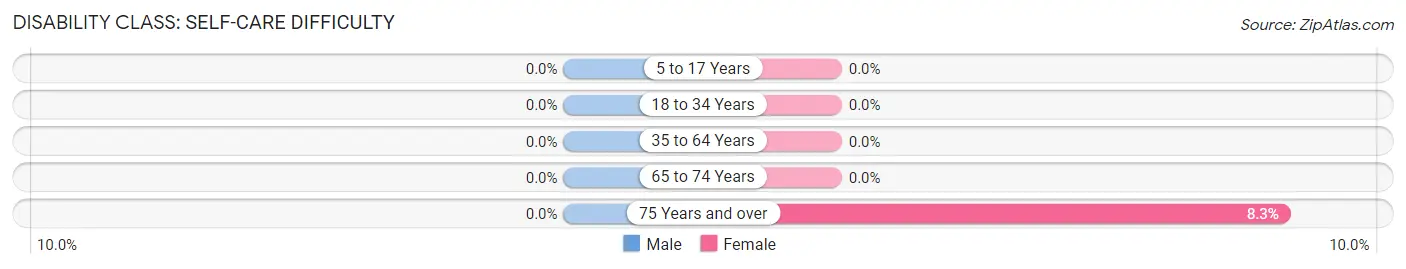
| Age Bracket | Male | Female |
| 5 to 17 Years | 0 (0.0%) | 0 (0.0%) |
| 18 to 34 Years | 0 (0.0%) | 0 (0.0%) |
| 35 to 64 Years | 0 (0.0%) | 0 (0.0%) |
| 65 to 74 Years | 0 (0.0%) | 0 (0.0%) |
| 75 Years and over | 0 (0.0%) | 5 (8.3%) |
Technology Access in Oriskany
Computing Device Access in Oriskany
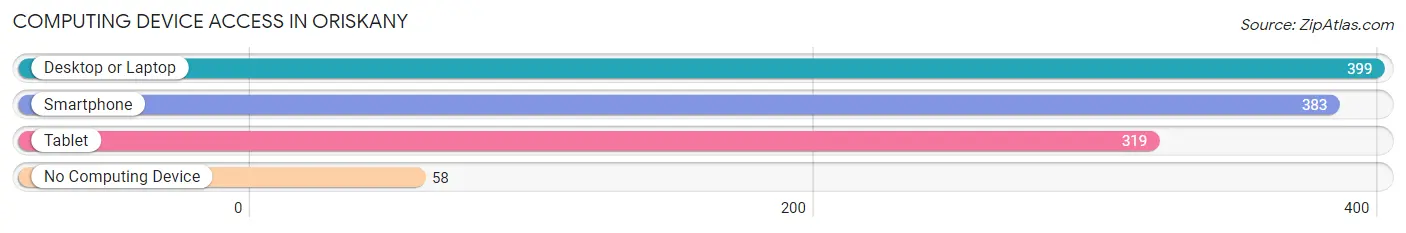
| Device Type | # Households | % Households |
| Desktop or Laptop | 399 | 75.3% |
| Smartphone | 383 | 72.3% |
| Tablet | 319 | 60.2% |
| No Computing Device | 58 | 10.9% |
| Total | 530 | 100.0% |
Internet Access in Oriskany
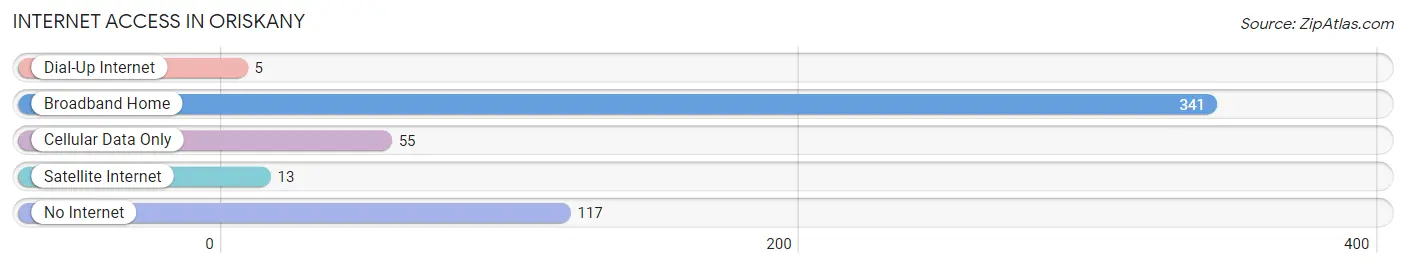
| Internet Type | # Households | % Households |
| Dial-Up Internet | 5 | 0.9% |
| Broadband Home | 341 | 64.3% |
| Cellular Data Only | 55 | 10.4% |
| Satellite Internet | 13 | 2.5% |
| No Internet | 117 | 22.1% |
| Total | 530 | 100.0% |
Oriskany Summary
Oriskany, NY is a small village located in Oneida County, New York. It is situated on the Mohawk River, about 10 miles east of Utica. The village is part of the Town of Whitestown and is part of the Utica-Rome Metropolitan Statistical Area. As of the 2010 census, the population of Oriskany was 1,749.
History
The area that is now Oriskany was originally inhabited by the Mohawk people, who called it “O-ris-ka-neh,” meaning “place of the upright stone.” The first European settlers arrived in the area in 1784, and the village was officially incorporated in 1827.
The village was named after the Battle of Oriskany, which took place during the American Revolutionary War in 1777. The battle was fought between the American forces and the British-allied Iroquois Confederacy. The Americans were victorious, and the battle is considered to be one of the most important battles of the war.
Geography
Oriskany is located at 43°7′N 75°17′W (43.1167, -75.2833). According to the United States Census Bureau, the village has a total area of 0.7 square miles (1.8 km2), all of it land.
The village is situated on the Mohawk River, which is a major tributary of the Hudson River. The river is used for recreational activities such as fishing and boating. The village is also home to the Oriskany Creek, which is a tributary of the Mohawk River.
Economy
The economy of Oriskany is largely based on agriculture and manufacturing. The village is home to several farms, which produce a variety of crops such as corn, soybeans, and hay. The village is also home to several manufacturing companies, which produce a variety of products such as paper products, plastics, and metal products.
The village is also home to several small businesses, including restaurants, retail stores, and service providers. The village is also home to several educational institutions, including a public school district and a community college.
Demographics
As of the 2010 census, there were 1,749 people, 690 households, and 463 families residing in the village. The population density was 2,521.3 people per square mile (973.2/km2). There were 745 housing units at an average density of 1,072.3 per square mile (414.7/km2). The racial makeup of the village was 97.2% White, 0.9% African American, 0.2% Native American, 0.2% Asian, 0.1% Pacific Islander, 0.3% from other races, and 1.1% from two or more races. Hispanic or Latino of any race were 1.3% of the population.
There were 690 households, out of which 32.2% had children under the age of 18 living with them, 48.3% were married couples living together, 13.2% had a female householder with no husband present, and 33.0% were non-families. 28.3% of all households were made up of individuals, and 12.2% had someone living alone who was 65 years of age or older. The average household size was 2.53 and the average family size was 3.09.
In the village, the population was spread out, with 25.7% under the age of 18, 7.2% from 18 to 24, 28.2% from 25 to 44, 24.2% from 45 to 64, and 14.7% who were 65 years of age or older. The median age was 38 years. For every 100 females, there were 92.2 males. For every 100 females age 18 and over, there were 88.2 males.
The median income for a household in the village was $41,250, and the median income for a family was $50,000. Males had a median income of $36,250 versus $25,000 for females. The per capita income for the village was $19,945. About 6.2% of families and 8.2% of the population were below the poverty line, including 10.2% of those under age 18 and 6.3% of those age 65 or over.
Common Questions
What is the Total Population of Oriskany?
Total Population of Oriskany is 1,201.
What is the Total Male Population of Oriskany?
Total Male Population of Oriskany is 564.
What is the Total Female Population of Oriskany?
Total Female Population of Oriskany is 637.
What is the Ratio of Males per 100 Females in Oriskany?
There are 88.54 Males per 100 Females in Oriskany.
What is the Ratio of Females per 100 Males in Oriskany?
There are 112.94 Females per 100 Males in Oriskany.
What is the Median Population Age in Oriskany?
Median Population Age in Oriskany is 44.3 Years.
What is the Average Family Size in Oriskany
Average Family Size in Oriskany is 2.9 People.
What is the Average Household Size in Oriskany
Average Household Size in Oriskany is 2.2 People.
What is Per Capita Income in Oriskany?
Per Capita income in Oriskany is $32,758.
What is the Median Family Income in Oriskany?
Median Family Income in Oriskany is $79,286.
What is the Median Household income in Oriskany?
Median Household Income in Oriskany is $63,194.
What is Income or Wage Gap in Oriskany?
Income or Wage Gap in Oriskany is 4.0%.
Women in Oriskany earn 96.0 cents for every dollar earned by a man.
What is Inequality or Gini Index in Oriskany?
Inequality or Gini Index in Oriskany is 0.41.
How Large is the Labor Force in Oriskany?
There are 599 People in the Labor Forcein in Oriskany.
What is the Percentage of People in the Labor Force in Oriskany?
59.8% of People are in the Labor Force in Oriskany.
What is the Unemployment Rate in Oriskany?
Unemployment Rate in Oriskany is 2.2%.