Zip Codes with the Highest Percentage of Owner-Occupied Units in New York, NY

RELATED REPORTS & OPTIONS

Highest Owner-Occupied
Population
Families and Households
Female Fertility
Female Fertility (Unmarried)
Race (Community Size)
Race (Percentage)
Ancestry (Community Size)
AfghanAfricanAlbanianAlsatianAmericanApacheArabArgentineanArmenianAssyrian / Chaldean / SyriacAustralianAustrianBahamianBarbadianBasqueBelgianBelizeanBermudanBhutaneseBlackfeetBolivianBrazilianBritishBritish West IndianBulgarianBurmeseCajunCambodianCanadianCape VerdeanCarpatho RusynCelticCentral AmericanCentral American IndianCherokeeChickasawChileanChippewaChoctawColombianCosta RicanCreekCroatianCubanCypriotCzechCzechoslovakianDanishDelawareDominicanDutchDutch West IndianEastern EuropeanEcuadorianEgyptianEnglishEstonianEthiopianEuropeanFilipinoFinnishFrenchFrench American IndianFrench CanadianGermanGhanaianGreekGuamanian / ChamorroGuatemalanGuyaneseHaitianHmongHonduranHungarianIcelanderIndian (Asian)IndonesianIranianIraqiIrishIroquoisIsraeliItalianJamaicanJapaneseJordanianKenyanKoreanLaotianLatvianLebaneseLiberianLithuanianLuxembourgerMacedonianMalaysianMalteseMexicanMexican American IndianMongolianMoroccanNative HawaiianNew ZealanderNicaraguanNigerianNorthern EuropeanNorwegianOkinawanPakistaniPalestinianPanamanianParaguayanPennsylvania GermanPeruvianPolishPortuguesePuebloPuerto RicanRomanianRussianSalvadoranSamoanScandinavianScotch-IrishScottishSenegaleseSerbianSierra LeoneanSiouxSlavicSlovakSloveneSomaliSouth AfricanSouth AmericanSouth American IndianSoviet UnionSpaniardSpanishSpanish AmericanSpanish American IndianSri LankanSubsaharan AfricanSudaneseSwedishSwissSyrianThaiTrinidadian and TobagonianTurkishU.S. Virgin IslanderUgandanUkrainianUruguayanVenezuelanVietnameseWelshWest IndianYugoslavianZimbabwean
Ancestry (Percentage)
AfghanAfricanAlbanianAlsatianAmericanApacheArabArgentineanArmenianAssyrian / Chaldean / SyriacAustralianAustrianBahamianBarbadianBasqueBelgianBelizeanBermudanBhutaneseBlackfeetBolivianBrazilianBritishBritish West IndianBulgarianBurmeseCajunCambodianCanadianCape VerdeanCarpatho RusynCelticCentral AmericanCentral American IndianCherokeeChickasawChileanChippewaChoctawColombianCosta RicanCreekCroatianCubanCypriotCzechCzechoslovakianDanishDelawareDominicanDutchDutch West IndianEastern EuropeanEcuadorianEgyptianEnglishEstonianEthiopianEuropeanFilipinoFinnishFrenchFrench American IndianFrench CanadianGermanGhanaianGreekGuamanian / ChamorroGuatemalanGuyaneseHaitianHmongHonduranHungarianIcelanderIndian (Asian)IndonesianIranianIraqiIrishIroquoisIsraeliItalianJamaicanJapaneseJordanianKenyanKoreanLaotianLatvianLebaneseLiberianLithuanianLuxembourgerMacedonianMalaysianMalteseMexicanMexican American IndianMongolianMoroccanNative HawaiianNew ZealanderNicaraguanNigerianNorthern EuropeanNorwegianOkinawanPakistaniPalestinianPanamanianParaguayanPennsylvania GermanPeruvianPolishPortuguesePuebloPuerto RicanRomanianRussianSalvadoranSamoanScandinavianScotch-IrishScottishSenegaleseSerbianSierra LeoneanSiouxSlavicSlovakSloveneSomaliSouth AfricanSouth AmericanSouth American IndianSoviet UnionSpaniardSpanishSpanish AmericanSpanish American IndianSri LankanSubsaharan AfricanSudaneseSwedishSwissSyrianThaiTrinidadian and TobagonianTurkishU.S. Virgin IslanderUgandanUkrainianUruguayanVenezuelanVietnameseWelshWest IndianYugoslavianZimbabwean
Immigrant Origin (Total)
AfghanistanAfricaAlbaniaArgentinaArmeniaAsiaAustraliaAustriaBahamasBangladeshBarbadosBelarusBelgiumBelizeBoliviaBosnia and HerzegovinaBrazilBulgariaBurma / MyanmarCambodiaCameroonCanadaCaribbeanCentral AmericaChileChinaColombiaCongoCosta RicaCroatiaCubaCzechoslovakiaDenmarkDominicaDominican RepublicEastern AfricaEastern AsiaEastern EuropeEcuadorEgyptEl SalvadorEnglandEritreaEthiopiaEuropeFranceGermanyGhanaGreeceGrenadaGuatemalaGuyanaHaitiHondurasHong KongHungaryIndiaIndonesiaIranIraqIrelandIsraelItalyJamaicaJapanJordanKazakhstanKenyaKoreaKuwaitLatin AmericaLatviaLebanonLiberiaLithuaniaMalaysiaMexicoMiddle AfricaMoldovaMoroccoNepalNetherlandsNicaraguaNigeriaNorth MacedoniaNorthern AfricaNorthern EuropeNorwayOceaniaPakistanPanamaPeruPhilippinesPolandPortugalRomaniaRussiaSaudi ArabiaScotlandSenegalSerbiaSierra LeoneSingaporeSomaliaSouth AfricaSouth AmericaSouth Central AsiaSouth Eastern AsiaSouthern EuropeSpainSri LankaSt. Vincent and the GrenadinesSudanSwedenSwitzerlandSyriaTaiwanThailandTrinidad and TobagoTurkeyUgandaUkraineUruguayUzbekistanVenezuelaVietnamWest IndiesWestern AfricaWestern AsiaWestern EuropeYemenZaireZimbabwe
Immigrant Origin (Percentage)
AfghanistanAfricaAlbaniaArgentinaArmeniaAsiaAustraliaAustriaBahamasBangladeshBarbadosBelarusBelgiumBelizeBoliviaBosnia and HerzegovinaBrazilBulgariaBurma / MyanmarCambodiaCameroonCanadaCaribbeanCentral AmericaChileChinaColombiaCongoCosta RicaCroatiaCubaCzechoslovakiaDenmarkDominicaDominican RepublicEastern AfricaEastern AsiaEastern EuropeEcuadorEgyptEl SalvadorEnglandEritreaEthiopiaEuropeFranceGermanyGhanaGreeceGrenadaGuatemalaGuyanaHaitiHondurasHong KongHungaryIndiaIndonesiaIranIraqIrelandIsraelItalyJamaicaJapanJordanKazakhstanKenyaKoreaKuwaitLatin AmericaLatviaLebanonLiberiaLithuaniaMalaysiaMexicoMiddle AfricaMoldovaMoroccoNepalNetherlandsNicaraguaNigeriaNorth MacedoniaNorthern AfricaNorthern EuropeNorwayOceaniaPakistanPanamaPeruPhilippinesPolandPortugalRomaniaRussiaSaudi ArabiaScotlandSenegalSerbiaSierra LeoneSingaporeSomaliaSouth AfricaSouth AmericaSouth Central AsiaSouth Eastern AsiaSouthern EuropeSpainSri LankaSt. Vincent and the GrenadinesSudanSwedenSwitzerlandSyriaTaiwanThailandTrinidad and TobagoTurkeyUgandaUkraineUruguayUzbekistanVenezuelaVietnamWest IndiesWestern AfricaWestern AsiaWestern EuropeYemenZaireZimbabwe
Income
Income (Families)
Income (Households)
Poverty
Poverty (Families)
Unemployment
Employment Occupations
Employment Industries
Employer Class
Commute Time
Commute Means
School Enrollment
Education by Degree Field
Occupancy
Finances
Physical Characteristics
New York
Compare Zip Codes
Comparison Subject

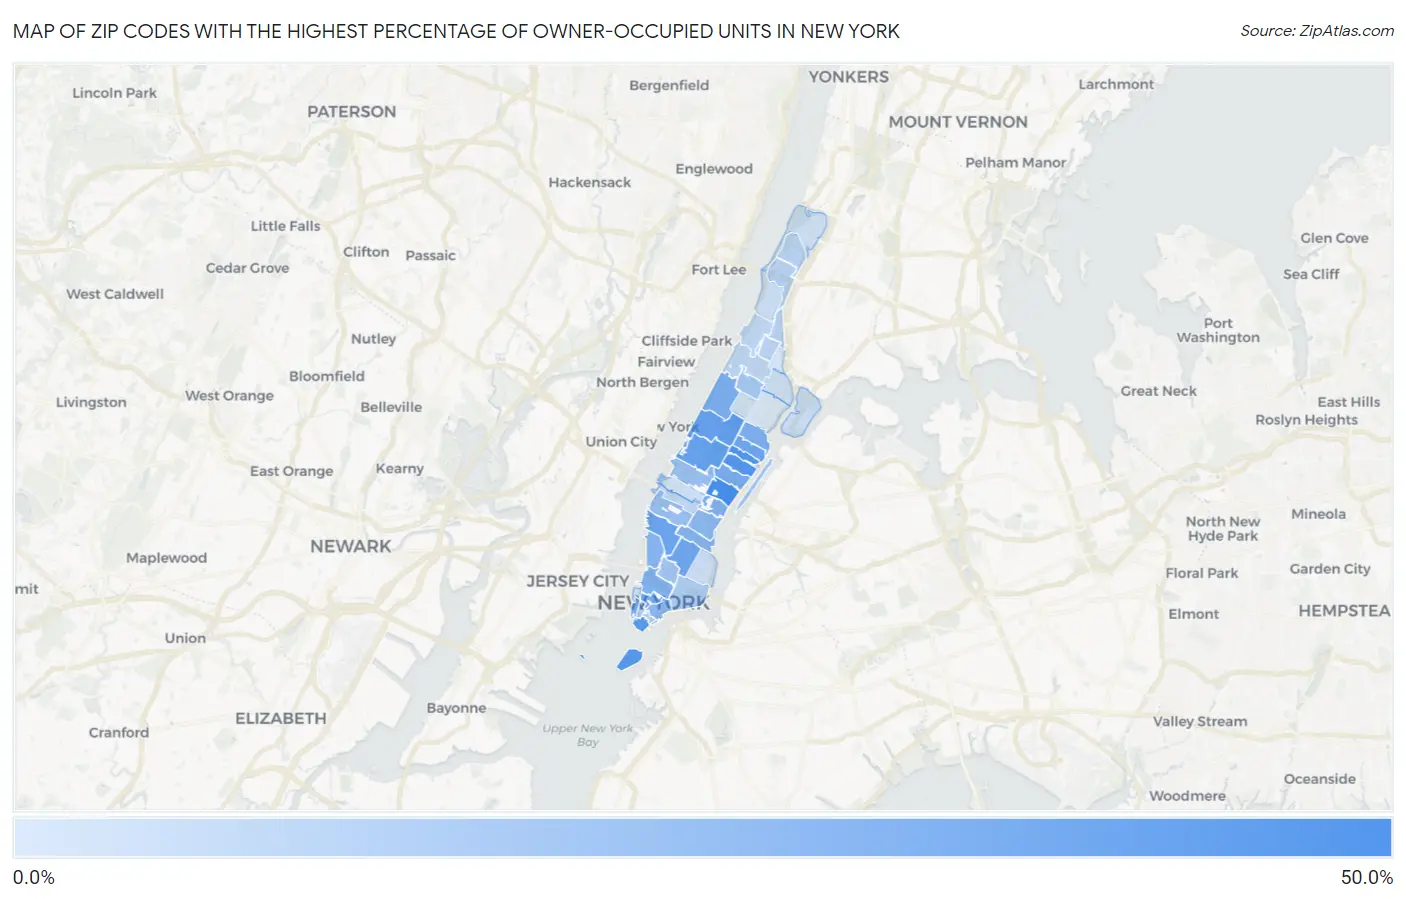
Map of Zip Codes with the Highest Percentage of Owner-Occupied Units in New York

0.0%
50.0%
Zip Codes with the Highest Percentage of Owner-Occupied Units in New York Map

Zip Codes with the Highest Percentage of Owner-Occupied Units in New York, NY

Zip Code % Owner-Occupied vs State vs National
1.1002248.8%54.3%(-5.45)#1,53064.8%(-16.0)#29,914
2.1007545.3%54.3%(-8.97)#1,55264.8%(-19.5)#30,439
3.1002144.6%54.3%(-9.66)#1,55764.8%(-20.2)#30,537
4.1000442.1%54.3%(-12.2)#1,57064.8%(-22.8)#30,812
5.1002438.3%54.3%(-16.0)#1,59064.8%(-26.5)#31,158
6.1002338.1%54.3%(-16.1)#1,59364.8%(-26.7)#31,173
7.1001136.6%54.3%(-17.7)#1,60064.8%(-28.3)#31,303
8.1000335.7%54.3%(-18.6)#1,60664.8%(-29.1)#31,389
9.1002835.7%54.3%(-18.6)#1,60764.8%(-29.2)#31,395
10.1000734.1%54.3%(-20.1)#1,61764.8%(-30.7)#31,505
11.1006932.6%54.3%(-21.7)#1,62064.8%(-32.2)#31,602
12.1006532.5%54.3%(-21.8)#1,62164.8%(-32.3)#31,610
13.1002531.5%54.3%(-22.8)#1,62464.8%(-33.3)#31,680
14.1028031.3%54.3%(-23.0)#1,62564.8%(-33.5)#31,687
15.1012831.0%54.3%(-23.3)#1,62764.8%(-33.8)#31,702
16.1001730.6%54.3%(-23.7)#1,63164.8%(-34.2)#31,730
17.1001329.5%54.3%(-24.8)#1,63964.8%(-35.3)#31,777
18.1001028.8%54.3%(-25.5)#1,64464.8%(-36.0)#31,816
19.1001428.4%54.3%(-25.9)#1,64764.8%(-36.4)#31,838
20.1001627.3%54.3%(-27.0)#1,65764.8%(-37.6)#31,896
21.1003826.9%54.3%(-27.4)#1,66064.8%(-38.0)#31,913
22.1000123.8%54.3%(-30.5)#1,67264.8%(-41.0)#32,024
23.1001923.0%54.3%(-31.3)#1,67364.8%(-41.8)#32,045
24.1004420.7%54.3%(-33.5)#1,68064.8%(-44.1)#32,125
25.1001220.4%54.3%(-33.9)#1,68264.8%(-44.4)#32,135
26.1002619.8%54.3%(-34.5)#1,68564.8%(-45.0)#32,152
27.1000617.7%54.3%(-36.5)#1,69164.8%(-47.1)#32,204
28.1000217.3%54.3%(-37.0)#1,69264.8%(-47.5)#32,210
29.1000516.7%54.3%(-37.6)#1,69364.8%(-48.1)#32,220
30.1003914.9%54.3%(-39.4)#1,69864.8%(-49.9)#32,264
31.1004014.8%54.3%(-39.5)#1,70064.8%(-50.1)#32,268
32.1003314.7%54.3%(-39.6)#1,70164.8%(-50.1)#32,270
33.1003014.4%54.3%(-39.9)#1,70364.8%(-50.5)#32,276
34.1002713.3%54.3%(-41.0)#1,70964.8%(-51.5)#32,293
35.1003113.0%54.3%(-41.3)#1,71064.8%(-51.8)#32,296
36.1001812.4%54.3%(-41.9)#1,71264.8%(-52.4)#32,304
37.100359.7%54.3%(-44.5)#1,72164.8%(-55.1)#32,361
38.100099.6%54.3%(-44.7)#1,72264.8%(-55.3)#32,363
39.100329.3%54.3%(-45.0)#1,72364.8%(-55.5)#32,371
40.100349.1%54.3%(-45.2)#1,72564.8%(-55.7)#32,373
41.102829.1%54.3%(-45.2)#1,72664.8%(-55.7)#32,374
42.100368.3%54.3%(-46.0)#1,72764.8%(-56.6)#32,388
43.100296.8%54.3%(-47.4)#1,73064.8%(-58.0)#32,413
44.100376.8%54.3%(-47.5)#1,73164.8%(-58.1)#32,416

Common Questions

What are the Top 10 Zip Codes with the Highest Percentage of Owner-Occupied Units in New York, NY?
Top 10 Zip Codes with the Highest Percentage of Owner-Occupied Units in New York, NY are:
#1
48.8%
#2
45.3%
#3
44.6%
#4
42.1%
#5
38.3%
#6
38.1%
#7
36.6%
#8
35.7%
#9
35.7%
#10
34.1%
What zip code has the Highest Percentage of Owner-Occupied Units in New York, NY?
10022 has the Highest Percentage of Owner-Occupied Units in New York, NY with 48.8%.
What is the Percentage of Owner-Occupied Units in New York, NY?
Percentage of Owner-Occupied Units in New York is 32.9%.
What is the Percentage of Owner-Occupied Units in New York?
Percentage of Owner-Occupied Units in New York is 54.3%.
What is the Percentage of Owner-Occupied Units in the United States?
Percentage of Owner-Occupied Units in the United States is 64.8%.