New Suffolk, NY
New Suffolk Map
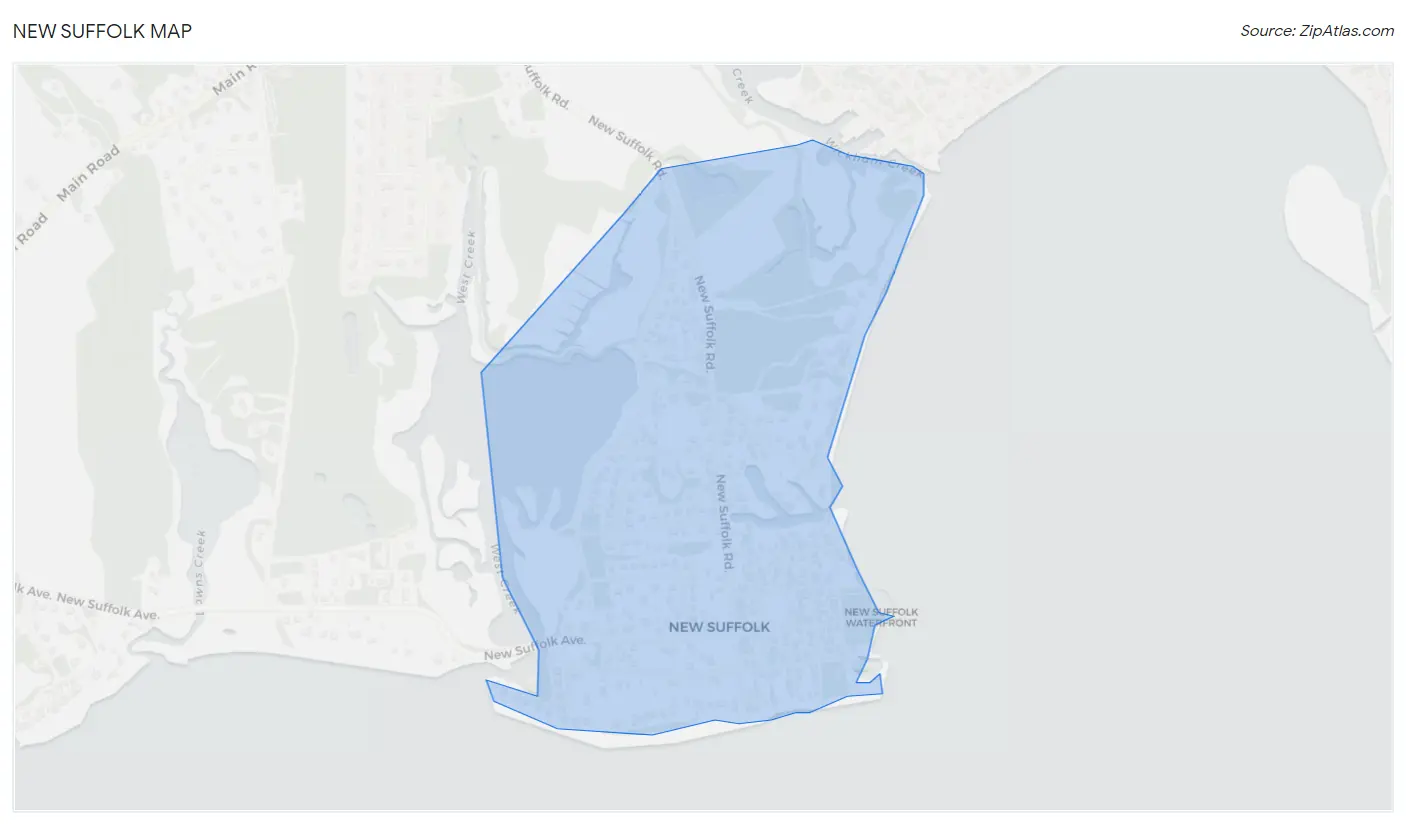
New Suffolk Overview
305
TOTAL POPULATION
154
MALE POPULATION
151
FEMALE POPULATION
101.99
MALES / 100 FEMALES
98.05
FEMALES / 100 MALES
58.8
MEDIAN AGE
2.6
AVG FAMILY SIZE
2.1
AVG HOUSEHOLD SIZE
$63,796
PER CAPITA INCOME
$148,125
AVG FAMILY INCOME
$106,042
AVG HOUSEHOLD INCOME
0.43
INEQUALITY / GINI INDEX
127
LABOR FORCE [ PEOPLE ]
45.4%
PERCENT IN LABOR FORCE
New Suffolk Zip Codes
New Suffolk Area Codes
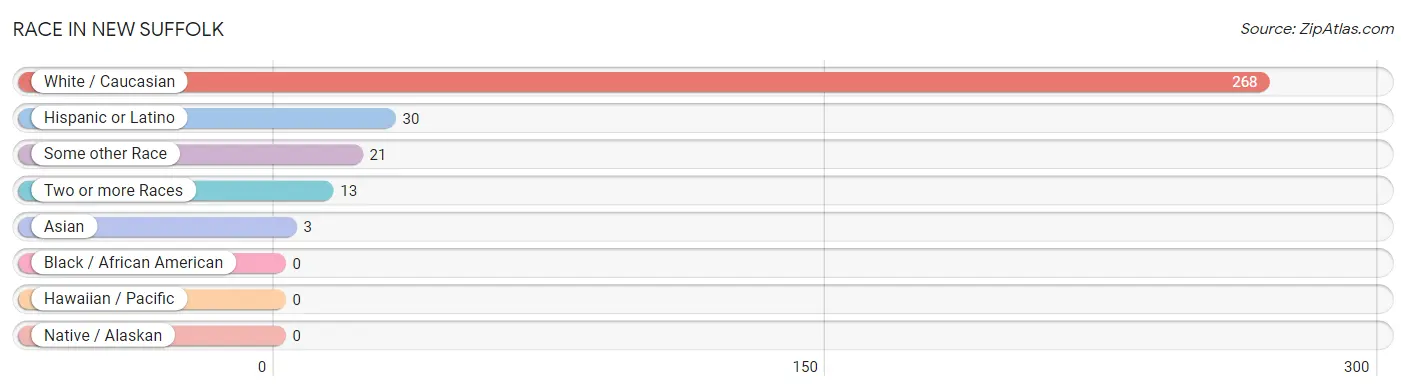
Race in New Suffolk
The most populous races in New Suffolk are White / Caucasian (268 | 87.9%), Hispanic or Latino (30 | 9.8%), and Some other Race (21 | 6.9%).
| Race | # Population | % Population |
| Asian | 3 | 1.0% |
| Black / African American | 0 | 0.0% |
| Hawaiian / Pacific | 0 | 0.0% |
| Hispanic or Latino | 30 | 9.8% |
| Native / Alaskan | 0 | 0.0% |
| White / Caucasian | 268 | 87.9% |
| Two or more Races | 13 | 4.3% |
| Some other Race | 21 | 6.9% |
| Total | 305 | 100.0% |
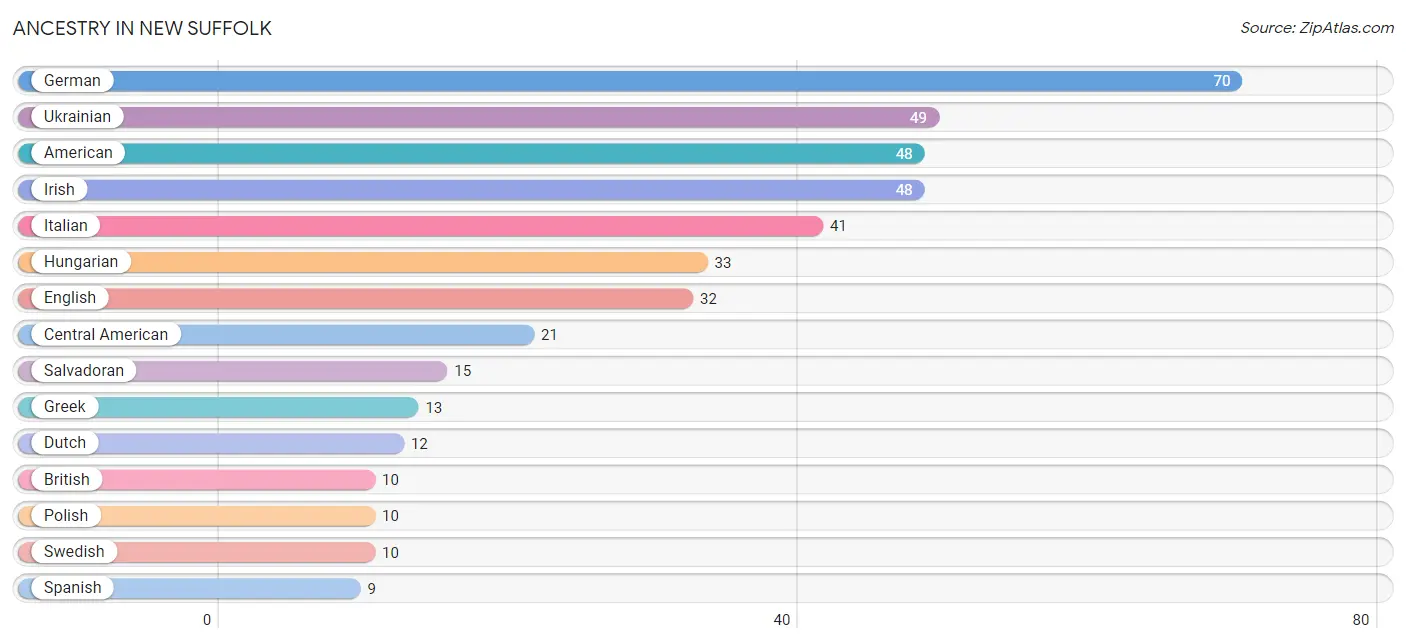
Ancestry in New Suffolk
The most populous ancestries reported in New Suffolk are German (70 | 23.0%), Ukrainian (49 | 16.1%), American (48 | 15.7%), Irish (48 | 15.7%), and Italian (41 | 13.4%), together accounting for 83.9% of all New Suffolk residents.
| Ancestry | # Population | % Population |
| American | 48 | 15.7% |
| British | 10 | 3.3% |
| Central American | 21 | 6.9% |
| Dutch | 12 | 3.9% |
| Eastern European | 3 | 1.0% |
| English | 32 | 10.5% |
| Finnish | 7 | 2.3% |
| German | 70 | 23.0% |
| Greek | 13 | 4.3% |
| Guatemalan | 6 | 2.0% |
| Hungarian | 33 | 10.8% |
| Irish | 48 | 15.7% |
| Italian | 41 | 13.4% |
| Korean | 3 | 1.0% |
| Norwegian | 8 | 2.6% |
| Polish | 10 | 3.3% |
| Salvadoran | 15 | 4.9% |
| Scottish | 4 | 1.3% |
| Spanish | 9 | 2.9% |
| Swedish | 10 | 3.3% |
| Swiss | 4 | 1.3% |
| Ukrainian | 49 | 16.1% | View All 22 Rows |
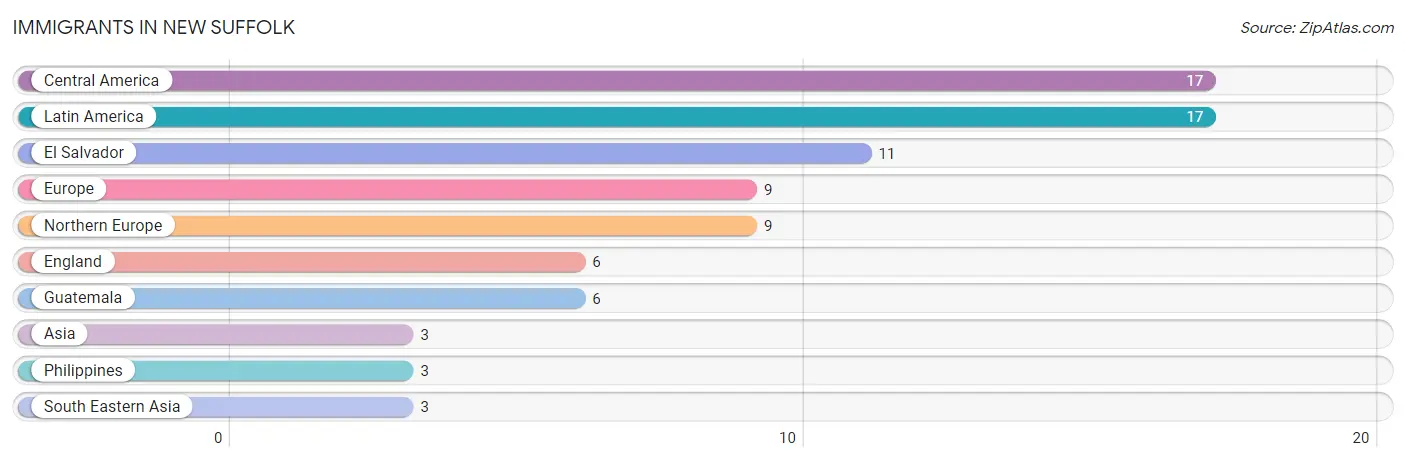
Immigrants in New Suffolk
The most numerous immigrant groups reported in New Suffolk came from Central America (17 | 5.6%), Latin America (17 | 5.6%), El Salvador (11 | 3.6%), Europe (9 | 2.9%), and Northern Europe (9 | 2.9%), together accounting for 20.6% of all New Suffolk residents.
| Immigration Origin | # Population | % Population |
| Asia | 3 | 1.0% |
| Central America | 17 | 5.6% |
| El Salvador | 11 | 3.6% |
| England | 6 | 2.0% |
| Europe | 9 | 2.9% |
| Guatemala | 6 | 2.0% |
| Latin America | 17 | 5.6% |
| Northern Europe | 9 | 2.9% |
| Philippines | 3 | 1.0% |
| South Eastern Asia | 3 | 1.0% | View All 10 Rows |
Sex and Age in New Suffolk
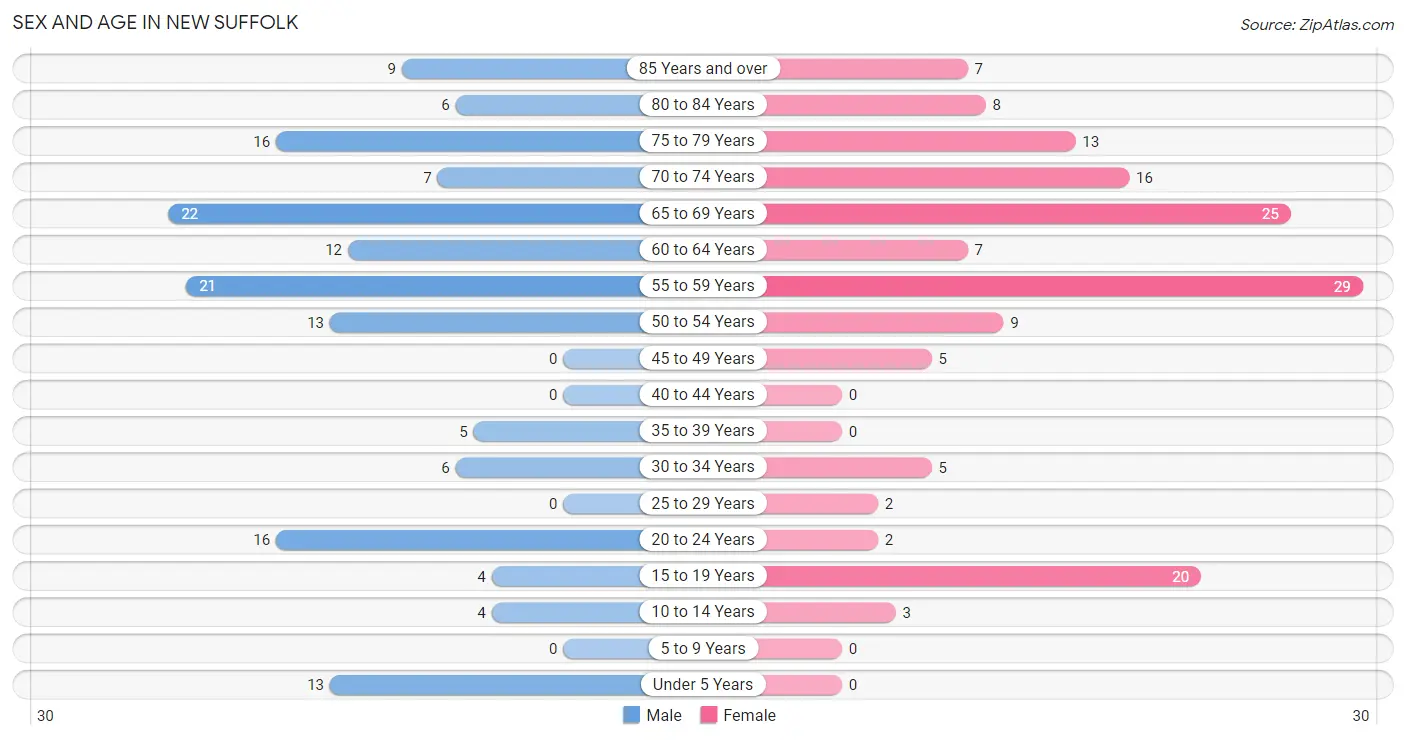
Sex and Age in New Suffolk
The most populous age groups in New Suffolk are 65 to 69 Years (22 | 14.3%) for men and 55 to 59 Years (29 | 19.2%) for women.
| Age Bracket | Male | Female |
| Under 5 Years | 13 (8.4%) | 0 (0.0%) |
| 5 to 9 Years | 0 (0.0%) | 0 (0.0%) |
| 10 to 14 Years | 4 (2.6%) | 3 (2.0%) |
| 15 to 19 Years | 4 (2.6%) | 20 (13.3%) |
| 20 to 24 Years | 16 (10.4%) | 2 (1.3%) |
| 25 to 29 Years | 0 (0.0%) | 2 (1.3%) |
| 30 to 34 Years | 6 (3.9%) | 5 (3.3%) |
| 35 to 39 Years | 5 (3.3%) | 0 (0.0%) |
| 40 to 44 Years | 0 (0.0%) | 0 (0.0%) |
| 45 to 49 Years | 0 (0.0%) | 5 (3.3%) |
| 50 to 54 Years | 13 (8.4%) | 9 (6.0%) |
| 55 to 59 Years | 21 (13.6%) | 29 (19.2%) |
| 60 to 64 Years | 12 (7.8%) | 7 (4.6%) |
| 65 to 69 Years | 22 (14.3%) | 25 (16.6%) |
| 70 to 74 Years | 7 (4.5%) | 16 (10.6%) |
| 75 to 79 Years | 16 (10.4%) | 13 (8.6%) |
| 80 to 84 Years | 6 (3.9%) | 8 (5.3%) |
| 85 Years and over | 9 (5.8%) | 7 (4.6%) |
| Total | 154 (100.0%) | 151 (100.0%) |
Families and Households in New Suffolk
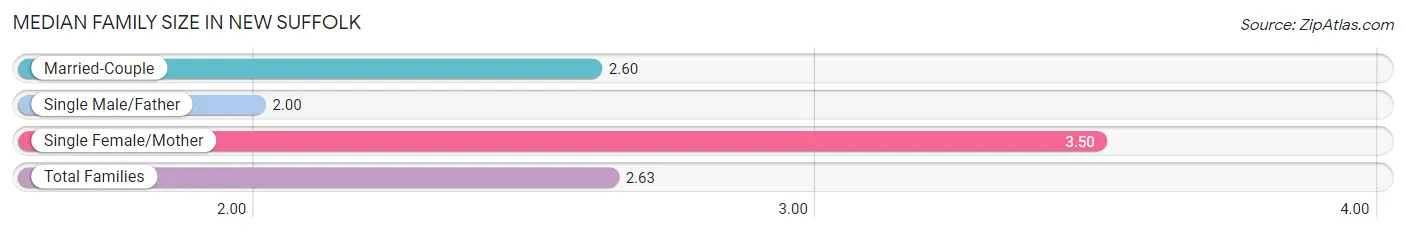
Median Family Size in New Suffolk
The median family size in New Suffolk is 2.63 persons per family, with single female/mother families (6 | 6.4%) accounting for the largest median family size of 3.5 persons per family. On the other hand, single male/father families (4 | 4.3%) represent the smallest median family size with 2.00 persons per family.
| Family Type | # Families | Family Size |
| Married-Couple | 84 (89.4%) | 2.60 |
| Single Male/Father | 4 (4.3%) | 2.00 |
| Single Female/Mother | 6 (6.4%) | 3.50 |
| Total Families | 94 (100.0%) | 2.63 |
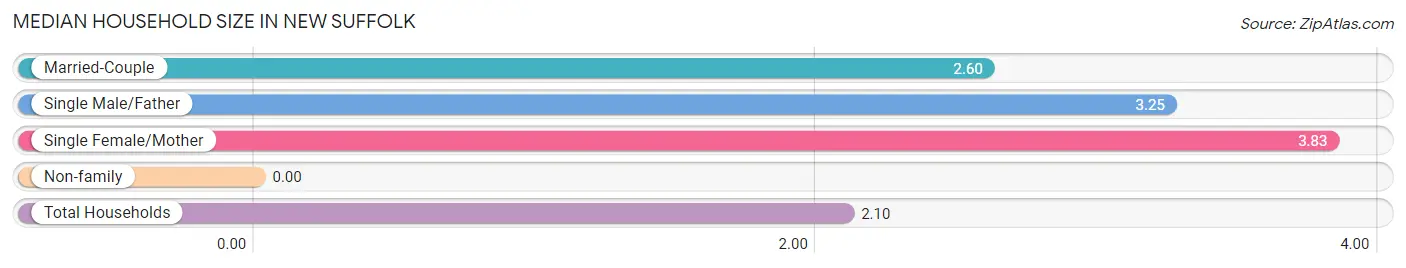
Median Household Size in New Suffolk
| Household Type | # Households | Household Size |
| Married-Couple | 84 (57.9%) | 2.60 |
| Single Male/Father | 4 (2.8%) | 3.25 |
| Single Female/Mother | 6 (4.1%) | 3.83 |
| Non-family | 51 (35.2%) | - |
| Total Households | 145 (100.0%) | 2.10 |
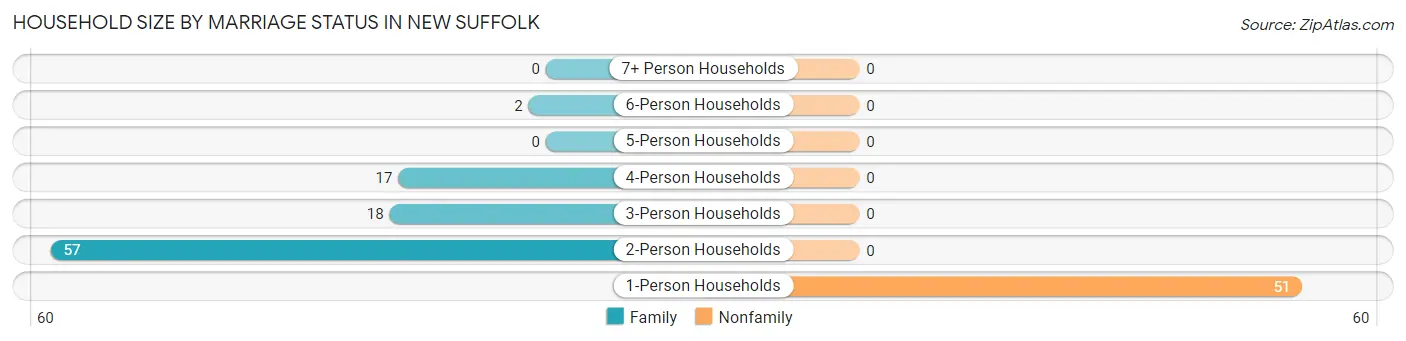
Household Size by Marriage Status in New Suffolk
Out of a total of 145 households in New Suffolk, 94 (64.8%) are family households, while 51 (35.2%) are nonfamily households. The most numerous type of family households are 2-person households, comprising 57, and the most common type of nonfamily households are 1-person households, comprising 51.
| Household Size | Family Households | Nonfamily Households |
| 1-Person Households | - | 51 (35.2%) |
| 2-Person Households | 57 (39.3%) | 0 (0.0%) |
| 3-Person Households | 18 (12.4%) | 0 (0.0%) |
| 4-Person Households | 17 (11.7%) | 0 (0.0%) |
| 5-Person Households | 0 (0.0%) | 0 (0.0%) |
| 6-Person Households | 2 (1.4%) | 0 (0.0%) |
| 7+ Person Households | 0 (0.0%) | 0 (0.0%) |
| Total | 94 (64.8%) | 51 (35.2%) |
Female Fertility in New Suffolk
Fertility by Age in New Suffolk
| Age Bracket | Women with Births | Births / 1,000 Women |
| 15 to 19 years | 0 (0.0%) | 0.0 |
| 20 to 34 years | 0 (0.0%) | 0.0 |
| 35 to 50 years | 0 (0.0%) | 0.0 |
| Total | 0 (0.0%) | 0.0 |
Fertility by Age by Marriage Status in New Suffolk
| Age Bracket | Married | Unmarried |
| 15 to 19 years | 0 (0.0%) | 0 (0.0%) |
| 20 to 34 years | 0 (0.0%) | 0 (0.0%) |
| 35 to 50 years | 0 (0.0%) | 0 (0.0%) |
| Total | 0 (0.0%) | 0 (0.0%) |
Fertility by Education in New Suffolk
| Educational Attainment | Women with Births | Births / 1,000 Women |
| Less than High School | 0 (0.0%) | 0.0 |
| High School Diploma | 0 (0.0%) | 0.0 |
| College or Associate's Degree | 0 (0.0%) | 0.0 |
| Bachelor's Degree | 0 (0.0%) | 0.0 |
| Graduate Degree | 0 (0.0%) | 0.0 |
| Total | 0 (0.0%) | 0.0 |
Fertility by Education by Marriage Status in New Suffolk
| Educational Attainment | Married | Unmarried |
| Less than High School | 0 (0.0%) | 0 (0.0%) |
| High School Diploma | 0 (0.0%) | 0 (0.0%) |
| College or Associate's Degree | 0 (0.0%) | 0 (0.0%) |
| Bachelor's Degree | 0 (0.0%) | 0 (0.0%) |
| Graduate Degree | 0 (0.0%) | 0 (0.0%) |
| Total | 0 (0.0%) | 0 (0.0%) |
Income in New Suffolk
Income Overview in New Suffolk
Per Capita Income in New Suffolk is $63,796, while median incomes of families and households are $148,125 and $106,042 respectively.
| Characteristic | Number | Measure |
| Per Capita Income | 305 | $63,796 |
| Median Family Income | 94 | $148,125 |
| Mean Family Income | 94 | $158,965 |
| Median Household Income | 145 | $106,042 |
| Mean Household Income | 145 | $129,259 |
| Income Deficit | 94 | $0 |
| Wage / Income Gap (%) | 305 | 0.00% |
| Wage / Income Gap ($) | 305 | 100.00¢ per $1 |
| Gini / Inequality Index | 305 | 0.43 |
Earnings by Sex in New Suffolk
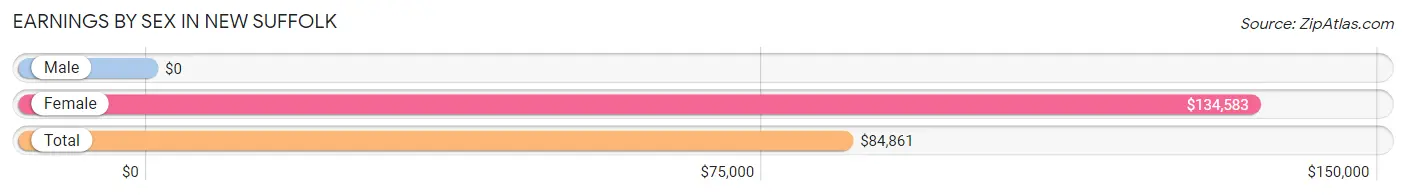
| Sex | Number | Average Earnings |
| Male | 63 (46.7%) | $0 |
| Female | 72 (53.3%) | $134,583 |
| Total | 135 (100.0%) | $84,861 |
Earnings by Sex by Income Bracket in New Suffolk
The most common earnings brackets in New Suffolk are $100,000+ for men (18 | 28.6%) and $100,000+ for women (49 | 68.1%).
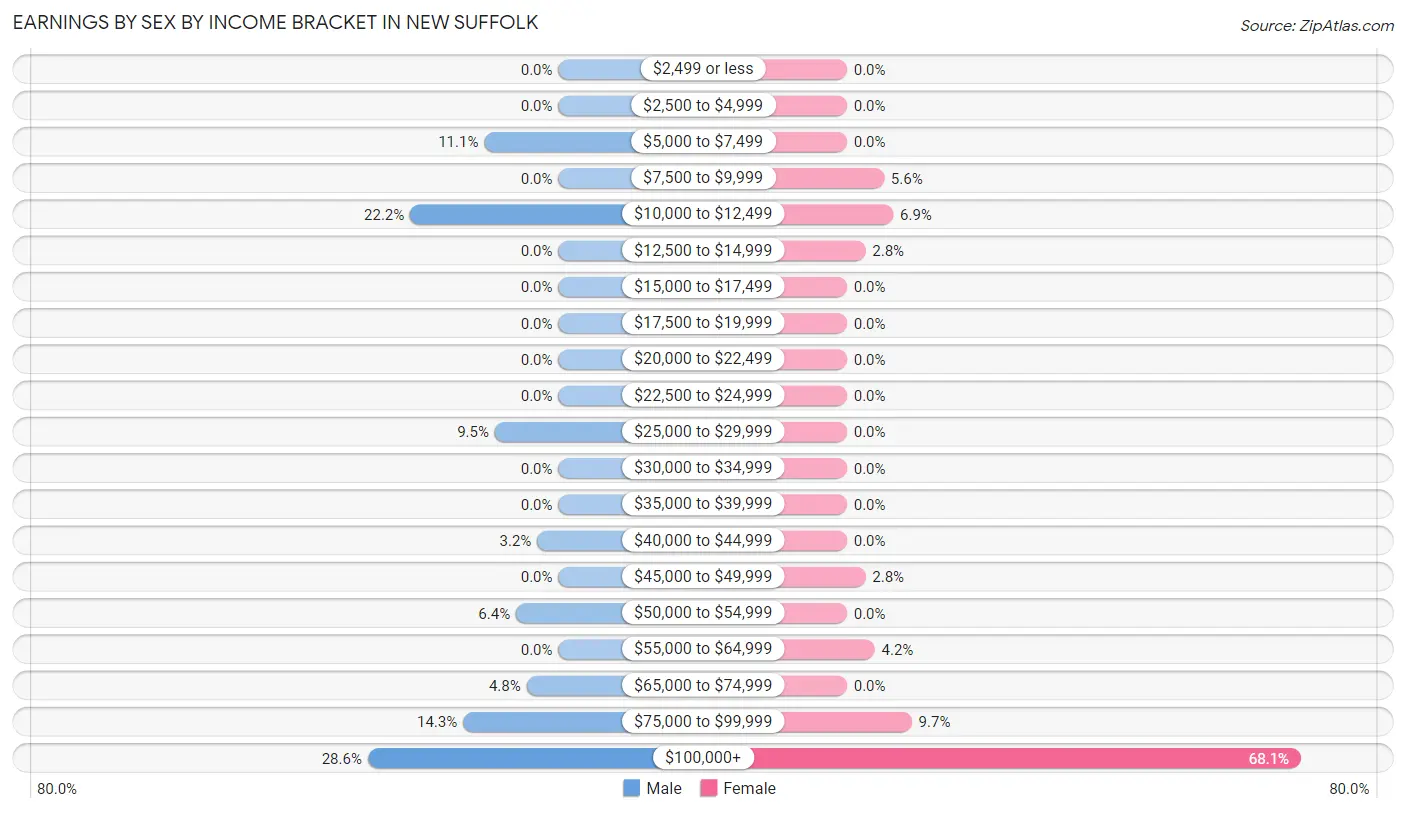
| Income | Male | Female |
| $2,499 or less | 0 (0.0%) | 0 (0.0%) |
| $2,500 to $4,999 | 0 (0.0%) | 0 (0.0%) |
| $5,000 to $7,499 | 7 (11.1%) | 0 (0.0%) |
| $7,500 to $9,999 | 0 (0.0%) | 4 (5.6%) |
| $10,000 to $12,499 | 14 (22.2%) | 5 (6.9%) |
| $12,500 to $14,999 | 0 (0.0%) | 2 (2.8%) |
| $15,000 to $17,499 | 0 (0.0%) | 0 (0.0%) |
| $17,500 to $19,999 | 0 (0.0%) | 0 (0.0%) |
| $20,000 to $22,499 | 0 (0.0%) | 0 (0.0%) |
| $22,500 to $24,999 | 0 (0.0%) | 0 (0.0%) |
| $25,000 to $29,999 | 6 (9.5%) | 0 (0.0%) |
| $30,000 to $34,999 | 0 (0.0%) | 0 (0.0%) |
| $35,000 to $39,999 | 0 (0.0%) | 0 (0.0%) |
| $40,000 to $44,999 | 2 (3.2%) | 0 (0.0%) |
| $45,000 to $49,999 | 0 (0.0%) | 2 (2.8%) |
| $50,000 to $54,999 | 4 (6.4%) | 0 (0.0%) |
| $55,000 to $64,999 | 0 (0.0%) | 3 (4.2%) |
| $65,000 to $74,999 | 3 (4.8%) | 0 (0.0%) |
| $75,000 to $99,999 | 9 (14.3%) | 7 (9.7%) |
| $100,000+ | 18 (28.6%) | 49 (68.1%) |
| Total | 63 (100.0%) | 72 (100.0%) |
Earnings by Sex by Educational Attainment in New Suffolk
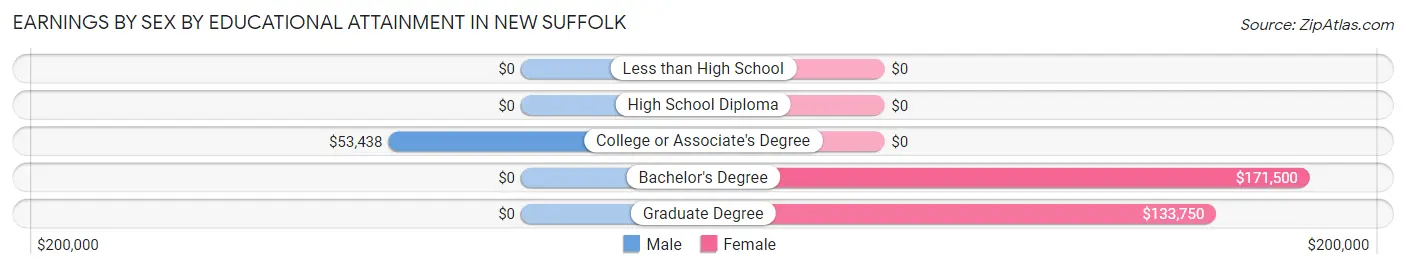
| Educational Attainment | Male Income | Female Income |
| Less than High School | - | - |
| High School Diploma | - | - |
| College or Associate's Degree | $53,438 | $0 |
| Bachelor's Degree | - | - |
| Graduate Degree | - | - |
| Total | - | - |
Family Income in New Suffolk
Family Income Brackets in New Suffolk
According to the New Suffolk family income data, there are 38 families falling into the $200,000+ income range, which is the most common income bracket and makes up 40.4% of all families.
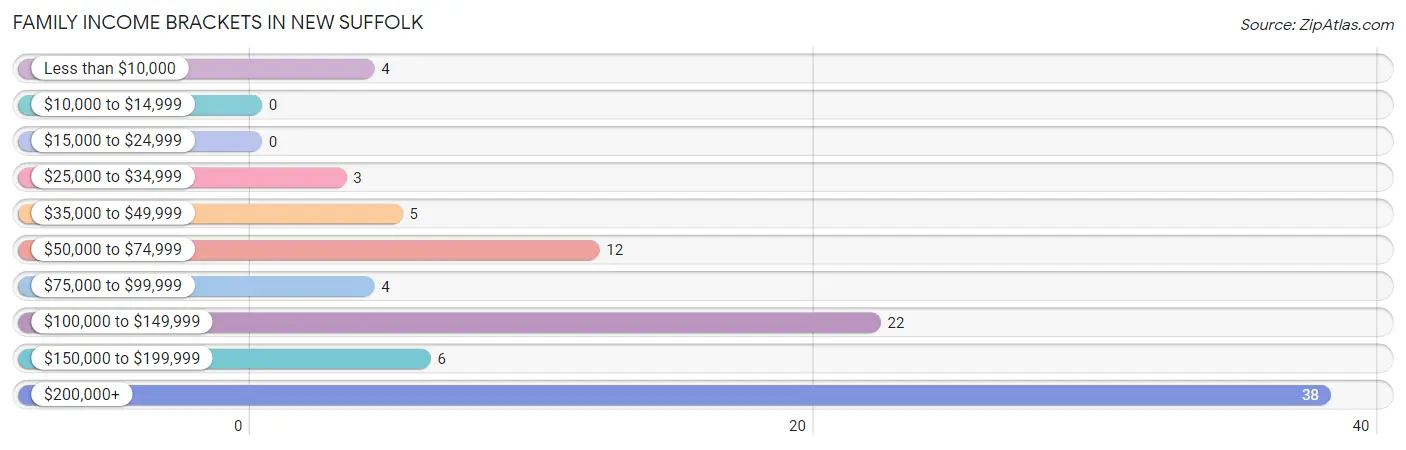
| Income Bracket | # Families | % Families |
| Less than $10,000 | 4 | 4.3% |
| $10,000 to $14,999 | 0 | 0.0% |
| $15,000 to $24,999 | 0 | 0.0% |
| $25,000 to $34,999 | 3 | 3.2% |
| $35,000 to $49,999 | 5 | 5.3% |
| $50,000 to $74,999 | 12 | 12.8% |
| $75,000 to $99,999 | 4 | 4.3% |
| $100,000 to $149,999 | 22 | 23.4% |
| $150,000 to $199,999 | 6 | 6.4% |
| $200,000+ | 38 | 40.4% |
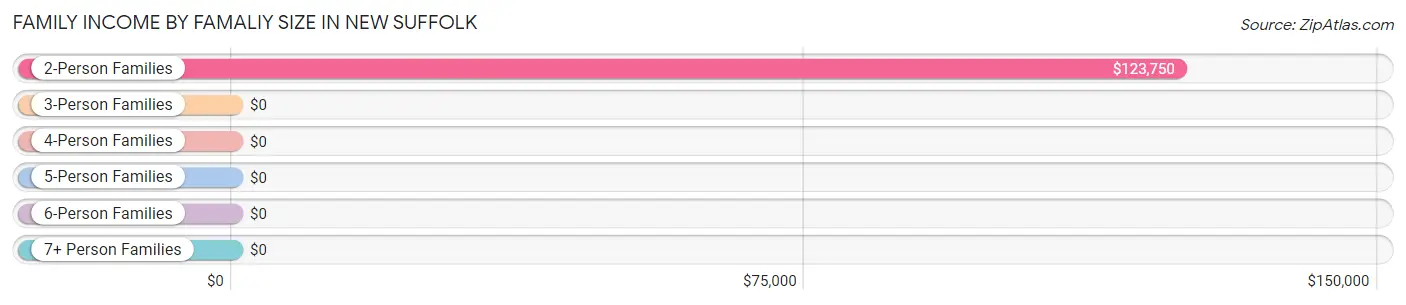
Family Income by Famaliy Size in New Suffolk
2-person families (61 | 64.9%) account for the highest median family income in New Suffolk with $123,750 per family, while 2-person families (61 | 64.9%) have the highest median income of $61,875 per family member.
| Income Bracket | # Families | Median Income |
| 2-Person Families | 61 (64.9%) | $123,750 |
| 3-Person Families | 14 (14.9%) | $0 |
| 4-Person Families | 17 (18.1%) | $0 |
| 5-Person Families | 2 (2.1%) | $0 |
| 6-Person Families | 0 (0.0%) | $0 |
| 7+ Person Families | 0 (0.0%) | $0 |
| Total | 94 (100.0%) | $148,125 |
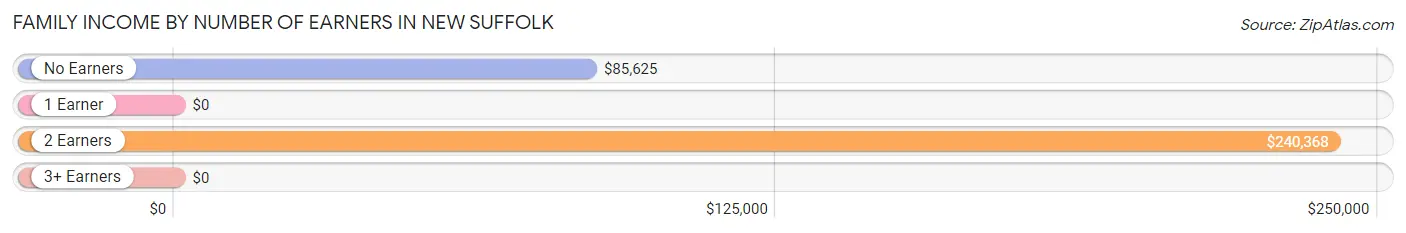
Family Income by Number of Earners in New Suffolk
| Number of Earners | # Families | Median Income |
| No Earners | 28 (29.8%) | $85,625 |
| 1 Earner | 21 (22.3%) | $0 |
| 2 Earners | 45 (47.9%) | $240,368 |
| 3+ Earners | 0 (0.0%) | $0 |
| Total | 94 (100.0%) | $148,125 |
Household Income in New Suffolk
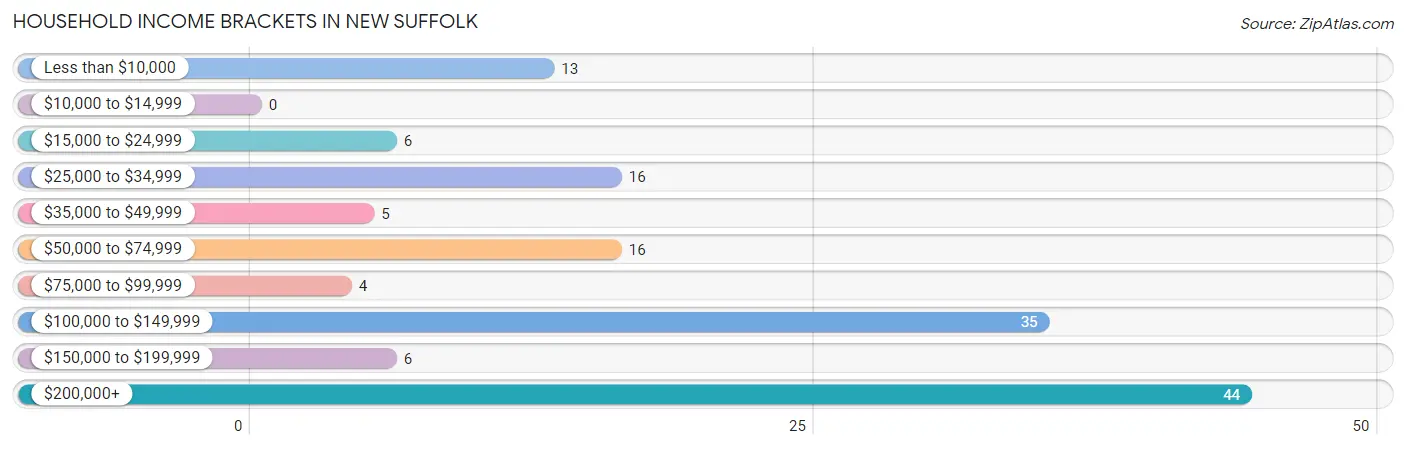
Household Income Brackets in New Suffolk
With 44 households falling in the category, the $200,000+ income range is the most frequent in New Suffolk, accounting for 30.3% of all households.
| Income Bracket | # Households | % Households |
| Less than $10,000 | 13 | 9.0% |
| $10,000 to $14,999 | 0 | 0.0% |
| $15,000 to $24,999 | 6 | 4.1% |
| $25,000 to $34,999 | 16 | 11.0% |
| $35,000 to $49,999 | 5 | 3.4% |
| $50,000 to $74,999 | 16 | 11.0% |
| $75,000 to $99,999 | 4 | 2.8% |
| $100,000 to $149,999 | 35 | 24.1% |
| $150,000 to $199,999 | 6 | 4.1% |
| $200,000+ | 44 | 30.3% |
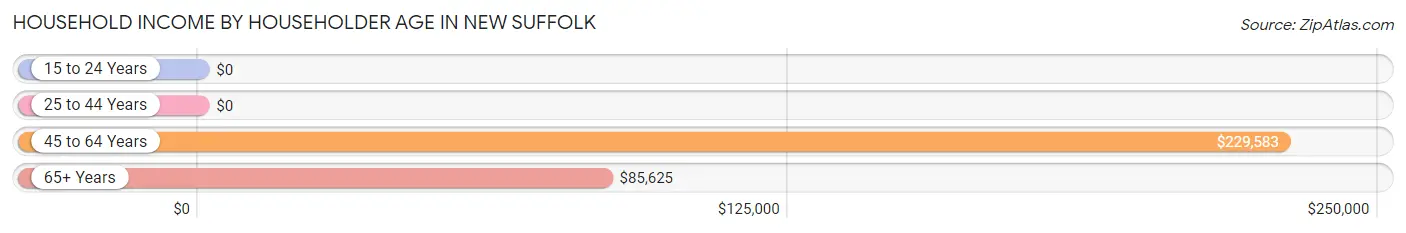
Household Income by Householder Age in New Suffolk
The median household income in New Suffolk is $106,042, with the highest median household income of $229,583 found in the 45 to 64 years age bracket for the primary householder. A total of 51 households (35.2%) fall into this category.
| Income Bracket | # Households | Median Income |
| 15 to 24 Years | 0 (0.0%) | $0 |
| 25 to 44 Years | 10 (6.9%) | $0 |
| 45 to 64 Years | 51 (35.2%) | $229,583 |
| 65+ Years | 84 (57.9%) | $85,625 |
| Total | 145 (100.0%) | $106,042 |
Poverty in New Suffolk
Income Below Poverty by Sex and Age in New Suffolk
With 9.7% poverty level for males and 4.0% for females among the residents of New Suffolk, 16 and 17 year old males and 75 year old and over females are the most vulnerable to poverty, with 4 males (100.0%) and 3 females (10.7%) in their respective age groups living below the poverty level.
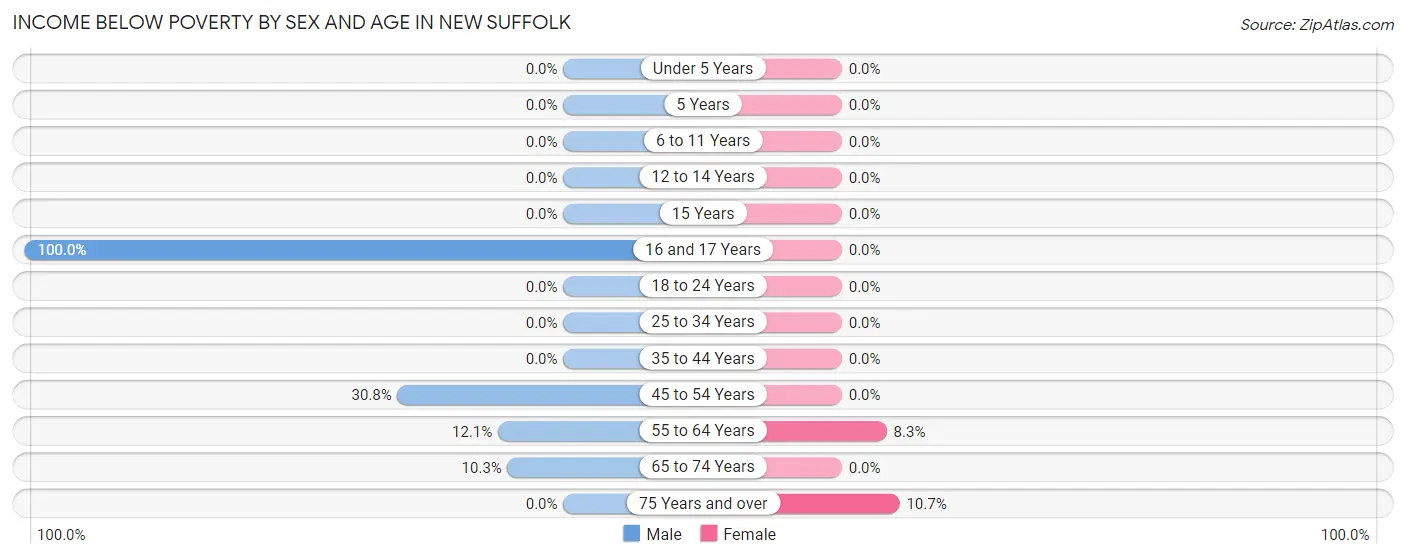
| Age Bracket | Male | Female |
| Under 5 Years | 0 (0.0%) | 0 (0.0%) |
| 5 Years | 0 (0.0%) | 0 (0.0%) |
| 6 to 11 Years | 0 (0.0%) | 0 (0.0%) |
| 12 to 14 Years | 0 (0.0%) | 0 (0.0%) |
| 15 Years | 0 (0.0%) | 0 (0.0%) |
| 16 and 17 Years | 4 (100.0%) | 0 (0.0%) |
| 18 to 24 Years | 0 (0.0%) | 0 (0.0%) |
| 25 to 34 Years | 0 (0.0%) | 0 (0.0%) |
| 35 to 44 Years | 0 (0.0%) | 0 (0.0%) |
| 45 to 54 Years | 4 (30.8%) | 0 (0.0%) |
| 55 to 64 Years | 4 (12.1%) | 3 (8.3%) |
| 65 to 74 Years | 3 (10.3%) | 0 (0.0%) |
| 75 Years and over | 0 (0.0%) | 3 (10.7%) |
| Total | 15 (9.7%) | 6 (4.0%) |
Income Above Poverty by Sex and Age in New Suffolk
According to the poverty statistics in New Suffolk, males aged under 5 years and females aged 12 to 14 years are the age groups that are most secure financially, with 100.0% of males and 100.0% of females in these age groups living above the poverty line.
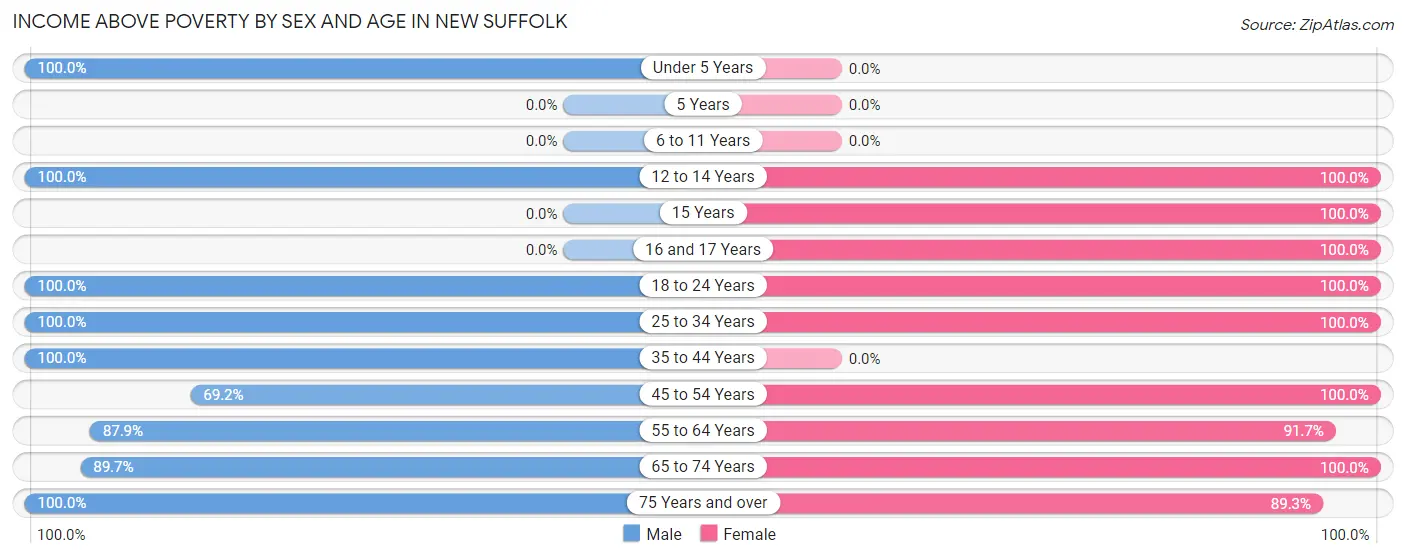
| Age Bracket | Male | Female |
| Under 5 Years | 13 (100.0%) | 0 (0.0%) |
| 5 Years | 0 (0.0%) | 0 (0.0%) |
| 6 to 11 Years | 0 (0.0%) | 0 (0.0%) |
| 12 to 14 Years | 4 (100.0%) | 3 (100.0%) |
| 15 Years | 0 (0.0%) | 5 (100.0%) |
| 16 and 17 Years | 0 (0.0%) | 2 (100.0%) |
| 18 to 24 Years | 16 (100.0%) | 15 (100.0%) |
| 25 to 34 Years | 6 (100.0%) | 7 (100.0%) |
| 35 to 44 Years | 5 (100.0%) | 0 (0.0%) |
| 45 to 54 Years | 9 (69.2%) | 14 (100.0%) |
| 55 to 64 Years | 29 (87.9%) | 33 (91.7%) |
| 65 to 74 Years | 26 (89.7%) | 41 (100.0%) |
| 75 Years and over | 31 (100.0%) | 25 (89.3%) |
| Total | 139 (90.3%) | 145 (96.0%) |
Income Below Poverty Among Married-Couple Families in New Suffolk
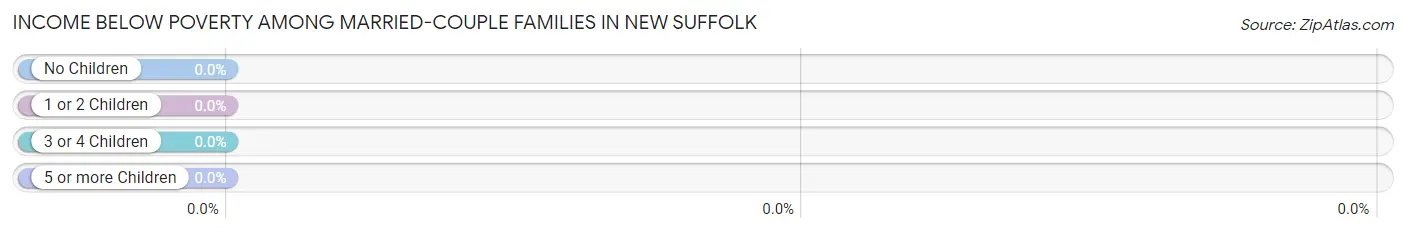
| Children | Above Poverty | Below Poverty |
| No Children | 70 (100.0%) | 0 (0.0%) |
| 1 or 2 Children | 14 (100.0%) | 0 (0.0%) |
| 3 or 4 Children | 0 (0.0%) | 0 (0.0%) |
| 5 or more Children | 0 (0.0%) | 0 (0.0%) |
| Total | 84 (100.0%) | 0 (0.0%) |
Income Below Poverty Among Single-Parent Households in New Suffolk
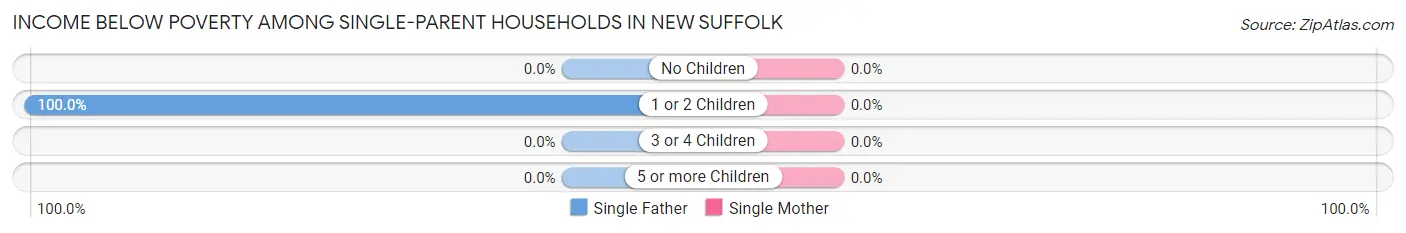
| Children | Single Father | Single Mother |
| No Children | 0 (0.0%) | 0 (0.0%) |
| 1 or 2 Children | 4 (100.0%) | 0 (0.0%) |
| 3 or 4 Children | 0 (0.0%) | 0 (0.0%) |
| 5 or more Children | 0 (0.0%) | 0 (0.0%) |
| Total | 4 (100.0%) | 0 (0.0%) |
Income Below Poverty Among Married-Couple vs Single-Parent Households in New Suffolk
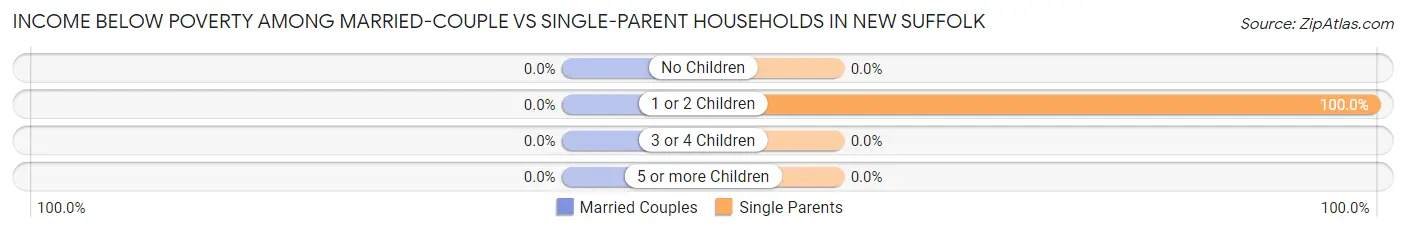
| Children | Married-Couple Families | Single-Parent Households |
| No Children | 0 (0.0%) | 0 (0.0%) |
| 1 or 2 Children | 0 (0.0%) | 4 (100.0%) |
| 3 or 4 Children | 0 (0.0%) | 0 (0.0%) |
| 5 or more Children | 0 (0.0%) | 0 (0.0%) |
| Total | 0 (0.0%) | 4 (40.0%) |
Employment Characteristics in New Suffolk
Employment by Class of Employer in New Suffolk
Among the 123 employed individuals in New Suffolk, private company employees (89 | 72.4%), self-employed (not incorporated) (12 | 9.8%), and not-for-profit organizations (10 | 8.1%) make up the most common classes of employment.
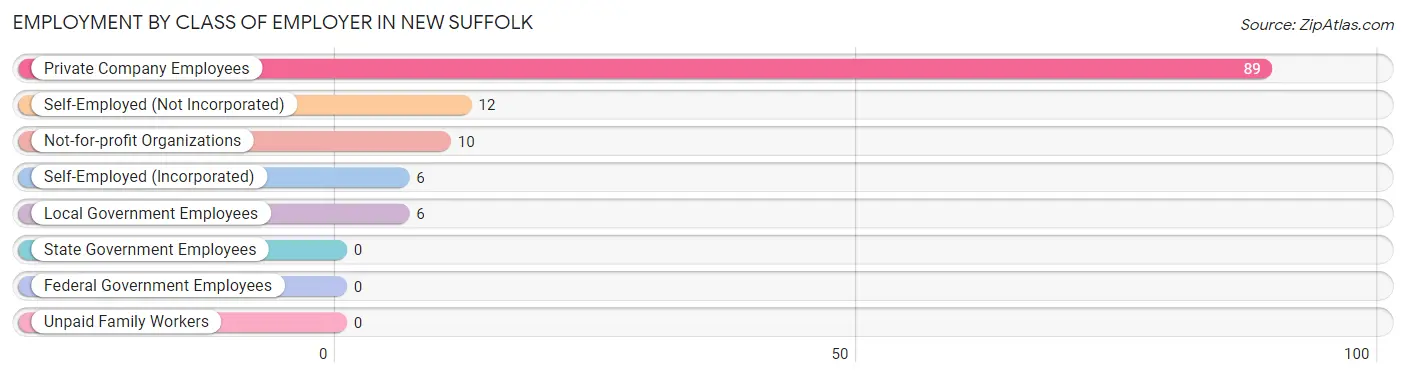
| Employer Class | # Employees | % Employees |
| Private Company Employees | 89 | 72.4% |
| Self-Employed (Incorporated) | 6 | 4.9% |
| Self-Employed (Not Incorporated) | 12 | 9.8% |
| Not-for-profit Organizations | 10 | 8.1% |
| Local Government Employees | 6 | 4.9% |
| State Government Employees | 0 | 0.0% |
| Federal Government Employees | 0 | 0.0% |
| Unpaid Family Workers | 0 | 0.0% |
| Total | 123 | 100.0% |
Employment Status by Age in New Suffolk
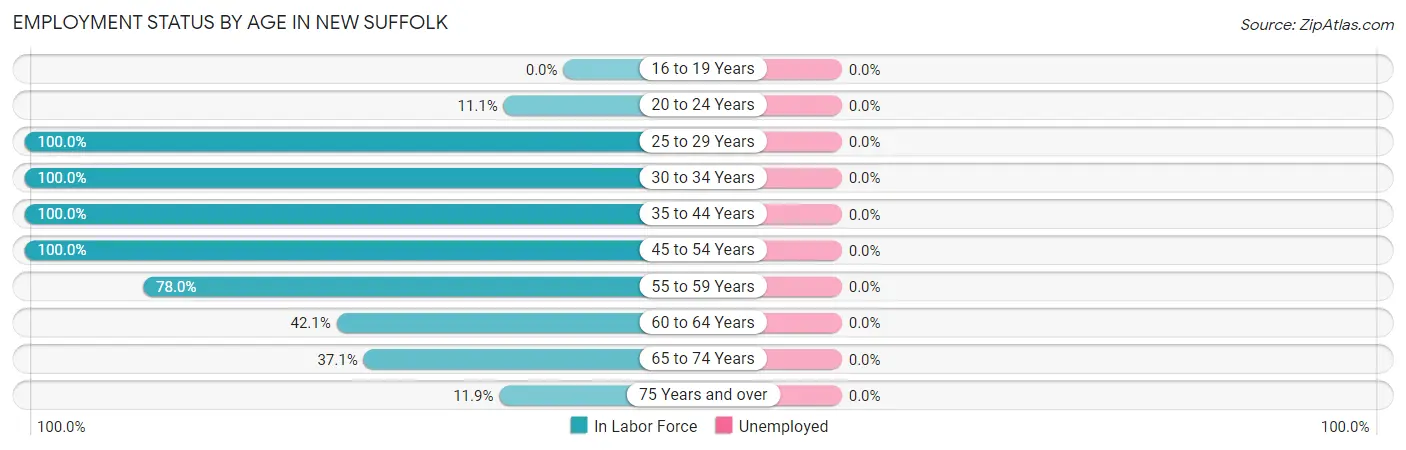
| Age Bracket | In Labor Force | Unemployed |
| 16 to 19 Years | 0 (0.0%) | 0 (0.0%) |
| 20 to 24 Years | 2 (11.1%) | 0 (0.0%) |
| 25 to 29 Years | 2 (100.0%) | 0 (0.0%) |
| 30 to 34 Years | 11 (100.0%) | 0 (0.0%) |
| 35 to 44 Years | 5 (100.0%) | 0 (0.0%) |
| 45 to 54 Years | 27 (100.0%) | 0 (0.0%) |
| 55 to 59 Years | 39 (78.0%) | 0 (0.0%) |
| 60 to 64 Years | 8 (42.1%) | 0 (0.0%) |
| 65 to 74 Years | 26 (37.1%) | 0 (0.0%) |
| 75 Years and over | 7 (11.9%) | 0 (0.0%) |
| Total | 127 (45.4%) | 0 (0.0%) |
Employment Status by Educational Attainment in New Suffolk
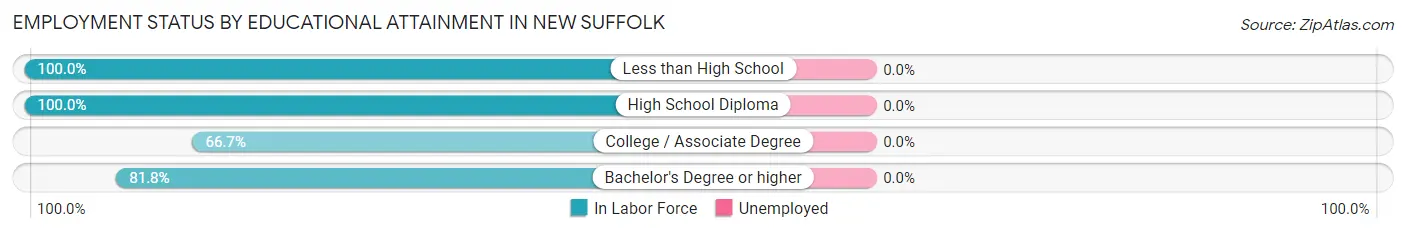
| Educational Attainment | In Labor Force | Unemployed |
| Less than High School | 4 (100.0%) | 0 (0.0%) |
| High School Diploma | 9 (100.0%) | 0 (0.0%) |
| College / Associate Degree | 16 (66.7%) | 0 (0.0%) |
| Bachelor's Degree or higher | 63 (81.8%) | 0 (0.0%) |
| Total | 92 (80.7%) | 0 (0.0%) |
Employment Occupations by Sex in New Suffolk
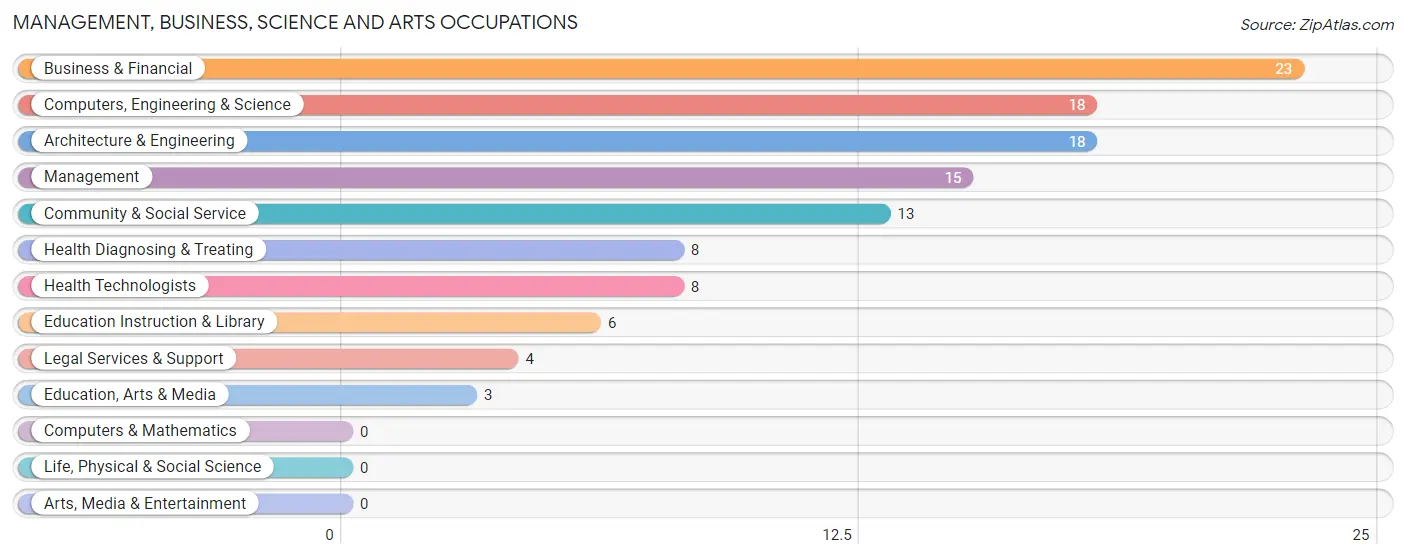
Management, Business, Science and Arts Occupations
The most common Management, Business, Science and Arts occupations in New Suffolk are Business & Financial (23 | 18.1%), Computers, Engineering & Science (18 | 14.2%), Architecture & Engineering (18 | 14.2%), Management (15 | 11.8%), and Community & Social Service (13 | 10.2%).
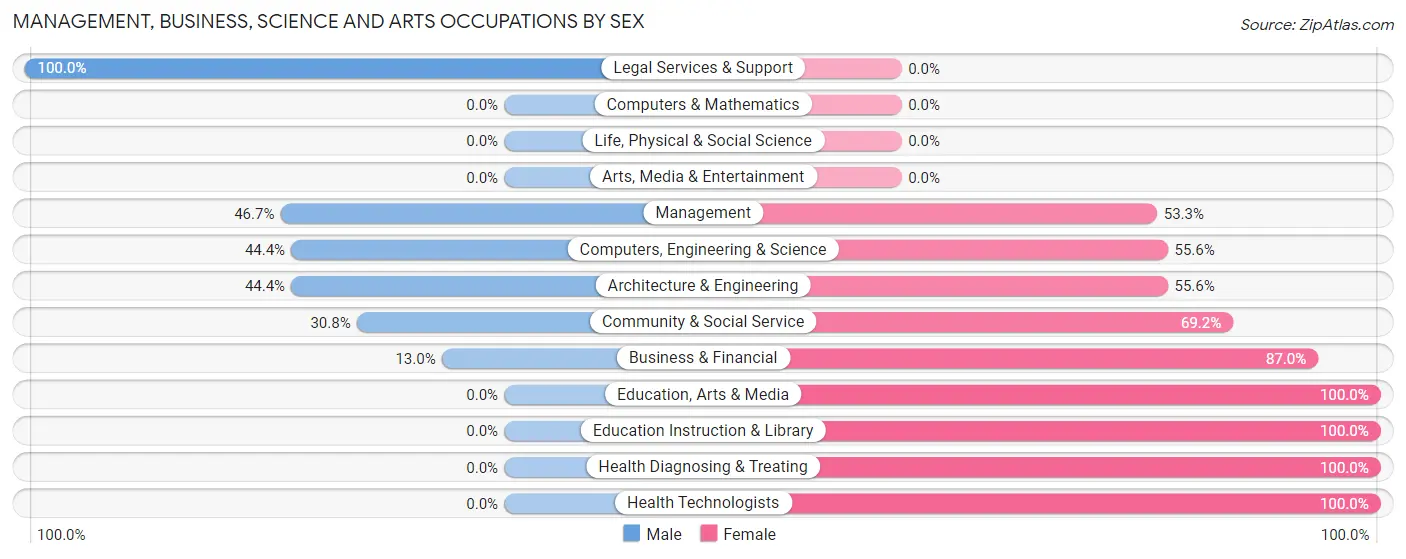
Management, Business, Science and Arts Occupations by Sex
Within the Management, Business, Science and Arts occupations in New Suffolk, the most male-oriented occupations are Legal Services & Support (100.0%), Management (46.7%), and Computers, Engineering & Science (44.4%), while the most female-oriented occupations are Education, Arts & Media (100.0%), Education Instruction & Library (100.0%), and Health Diagnosing & Treating (100.0%).
| Occupation | Male | Female |
| Management | 7 (46.7%) | 8 (53.3%) |
| Business & Financial | 3 (13.0%) | 20 (87.0%) |
| Computers, Engineering & Science | 8 (44.4%) | 10 (55.6%) |
| Computers & Mathematics | 0 (0.0%) | 0 (0.0%) |
| Architecture & Engineering | 8 (44.4%) | 10 (55.6%) |
| Life, Physical & Social Science | 0 (0.0%) | 0 (0.0%) |
| Community & Social Service | 4 (30.8%) | 9 (69.2%) |
| Education, Arts & Media | 0 (0.0%) | 3 (100.0%) |
| Legal Services & Support | 4 (100.0%) | 0 (0.0%) |
| Education Instruction & Library | 0 (0.0%) | 6 (100.0%) |
| Arts, Media & Entertainment | 0 (0.0%) | 0 (0.0%) |
| Health Diagnosing & Treating | 0 (0.0%) | 8 (100.0%) |
| Health Technologists | 0 (0.0%) | 8 (100.0%) |
| Total (Category) | 22 (28.6%) | 55 (71.4%) |
| Total (Overall) | 59 (46.5%) | 68 (53.5%) |
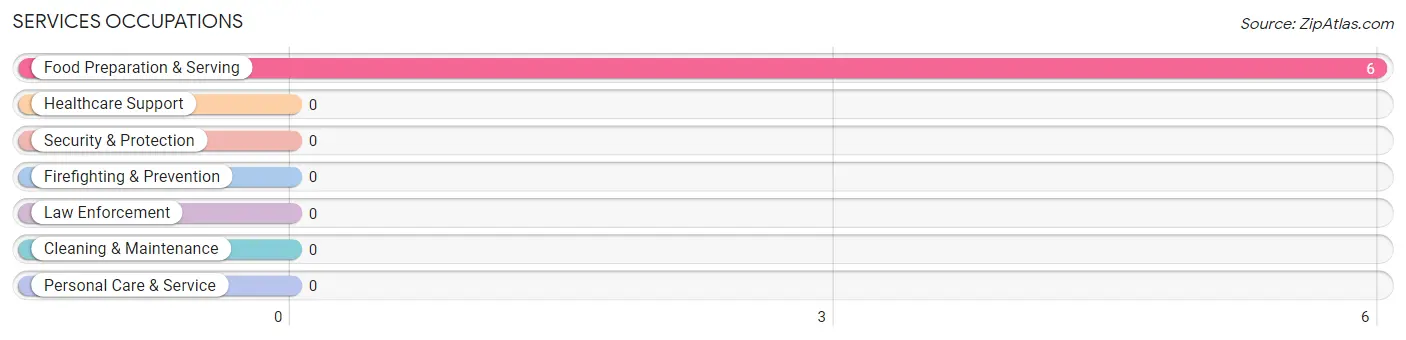
Services Occupations
The most common Services occupations in New Suffolk are , and Food Preparation & Serving (6 | 4.7%).
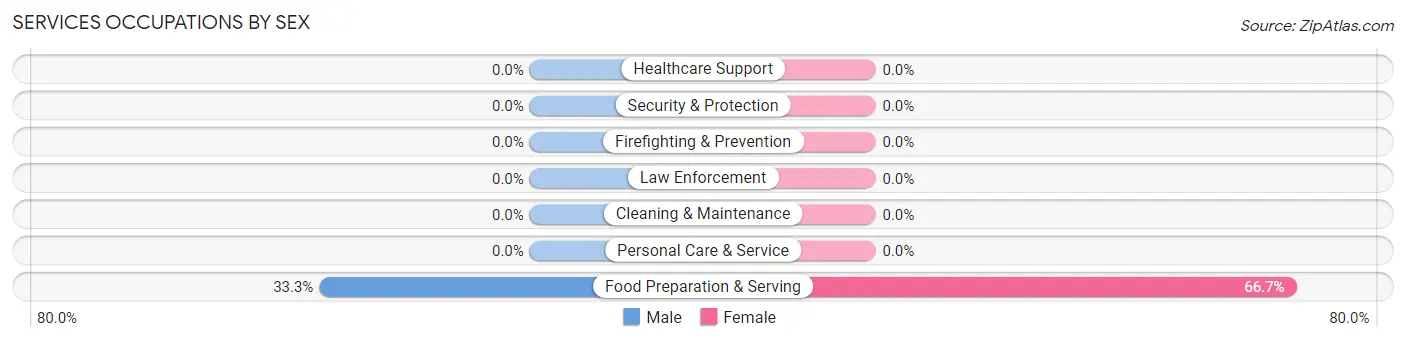
Services Occupations by Sex
| Occupation | Male | Female |
| Healthcare Support | 0 (0.0%) | 0 (0.0%) |
| Security & Protection | 0 (0.0%) | 0 (0.0%) |
| Firefighting & Prevention | 0 (0.0%) | 0 (0.0%) |
| Law Enforcement | 0 (0.0%) | 0 (0.0%) |
| Food Preparation & Serving | 2 (33.3%) | 4 (66.7%) |
| Cleaning & Maintenance | 0 (0.0%) | 0 (0.0%) |
| Personal Care & Service | 0 (0.0%) | 0 (0.0%) |
| Total (Category) | 2 (33.3%) | 4 (66.7%) |
| Total (Overall) | 59 (46.5%) | 68 (53.5%) |
Sales and Office Occupations
The most common Sales and Office occupations in New Suffolk are Office & Administration (19 | 15.0%), and Sales & Related (7 | 5.5%).
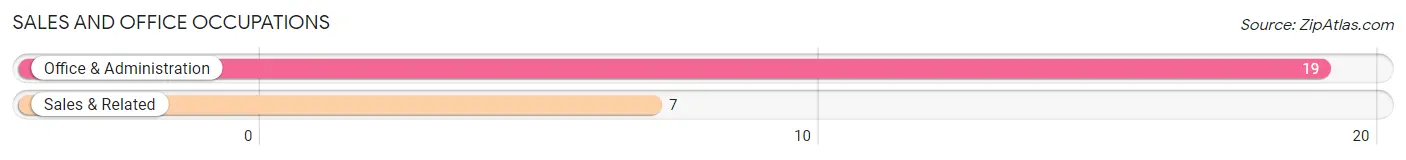
Sales and Office Occupations by Sex

| Occupation | Male | Female |
| Sales & Related | 3 (42.9%) | 4 (57.1%) |
| Office & Administration | 19 (100.0%) | 0 (0.0%) |
| Total (Category) | 22 (84.6%) | 4 (15.4%) |
| Total (Overall) | 59 (46.5%) | 68 (53.5%) |
Natural Resources, Construction and Maintenance Occupations
The most common Natural Resources, Construction and Maintenance occupations in New Suffolk are Farming, Fishing & Forestry (11 | 8.7%), and Installation, Maintenance & Repair (7 | 5.5%).
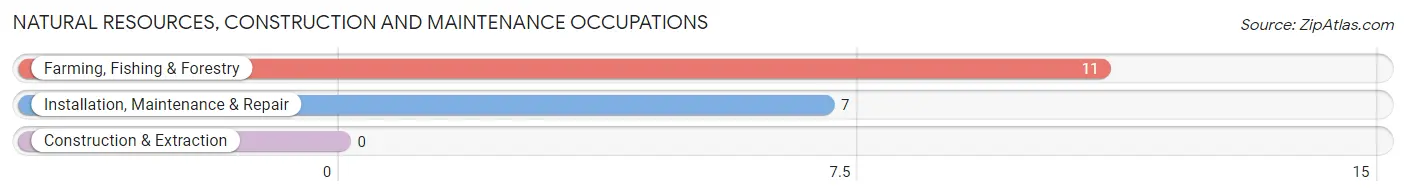
Natural Resources, Construction and Maintenance Occupations by Sex
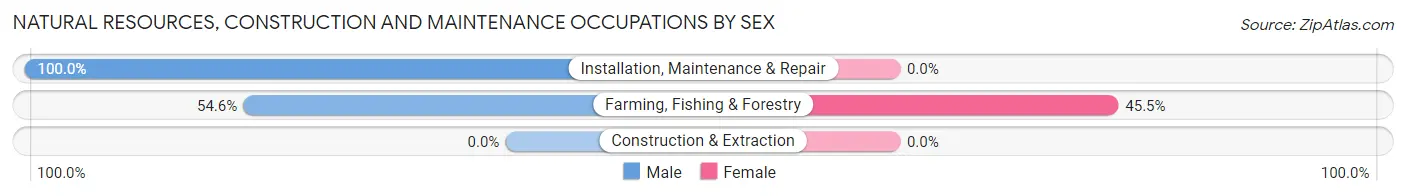
| Occupation | Male | Female |
| Farming, Fishing & Forestry | 6 (54.5%) | 5 (45.5%) |
| Construction & Extraction | 0 (0.0%) | 0 (0.0%) |
| Installation, Maintenance & Repair | 7 (100.0%) | 0 (0.0%) |
| Total (Category) | 13 (72.2%) | 5 (27.8%) |
| Total (Overall) | 59 (46.5%) | 68 (53.5%) |
Production, Transportation and Moving Occupations
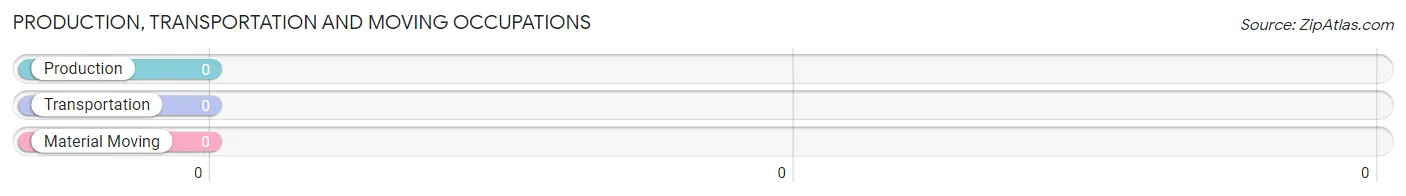
Production, Transportation and Moving Occupations by Sex
| Occupation | Male | Female |
| Production | 0 (0.0%) | 0 (0.0%) |
| Transportation | 0 (0.0%) | 0 (0.0%) |
| Material Moving | 0 (0.0%) | 0 (0.0%) |
| Total (Category) | 0 (0.0%) | 0 (0.0%) |
| Total (Overall) | 59 (46.5%) | 68 (53.5%) |
Employment Industries by Sex in New Suffolk
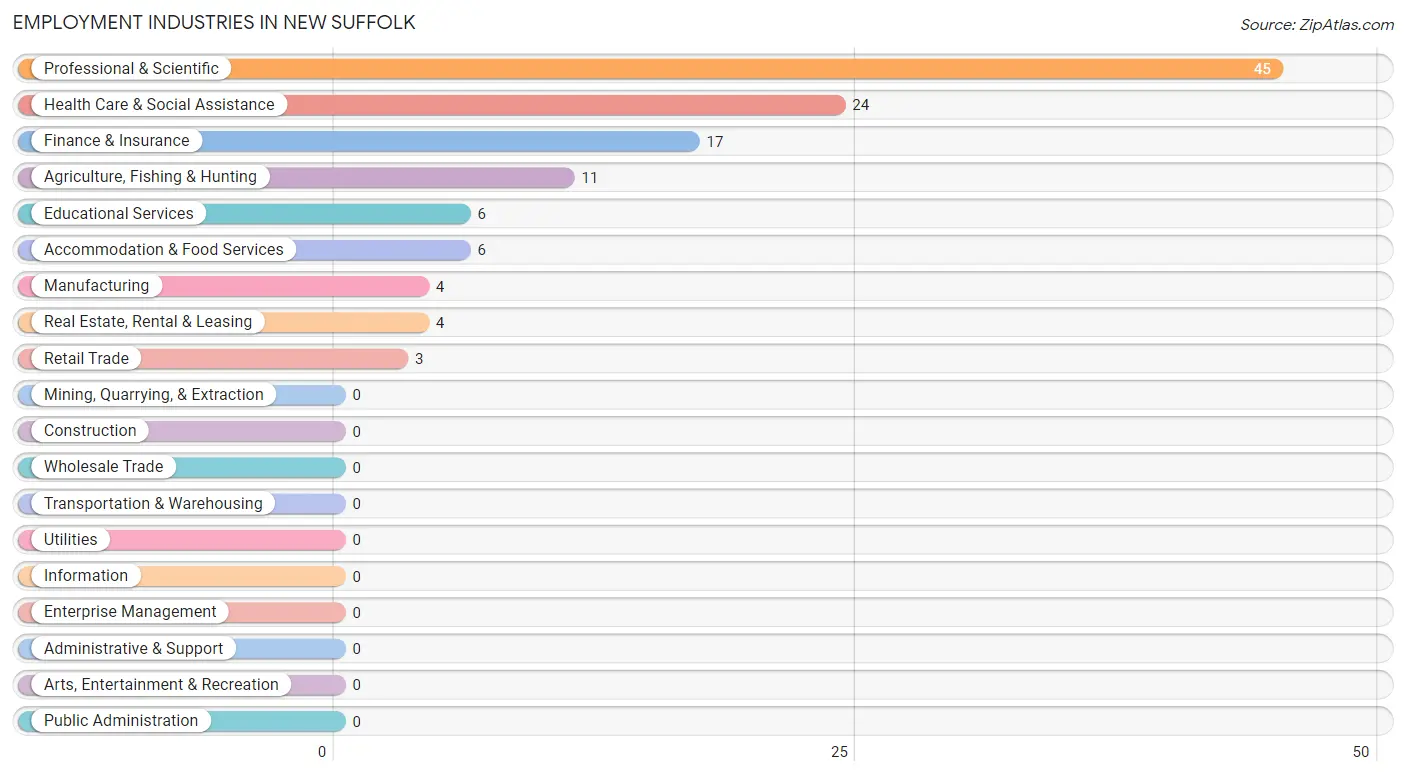
Employment Industries in New Suffolk
The major employment industries in New Suffolk include Professional & Scientific (45 | 35.4%), Health Care & Social Assistance (24 | 18.9%), Finance & Insurance (17 | 13.4%), Agriculture, Fishing & Hunting (11 | 8.7%), and Educational Services (6 | 4.7%).
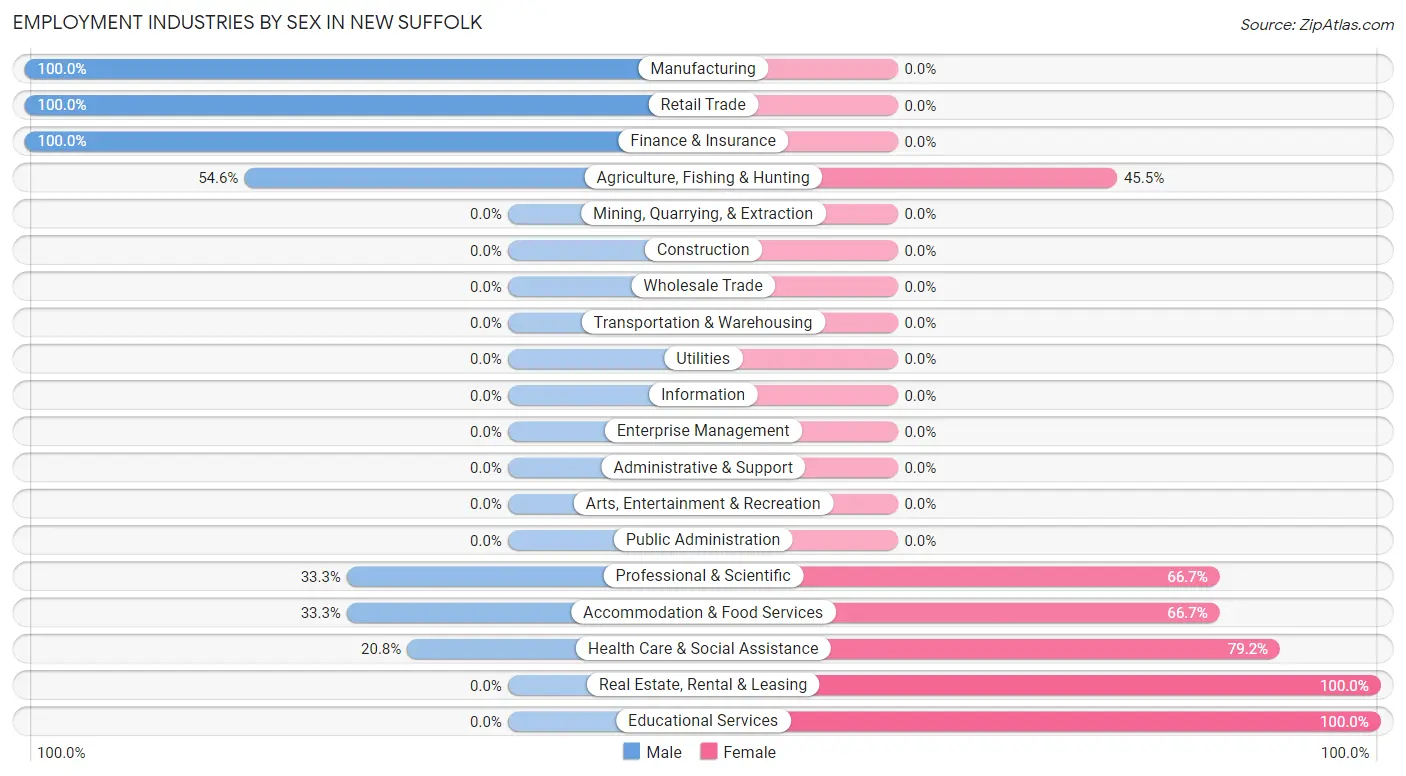
Employment Industries by Sex in New Suffolk
The New Suffolk industries that see more men than women are Manufacturing (100.0%), Retail Trade (100.0%), and Finance & Insurance (100.0%), whereas the industries that tend to have a higher number of women are Real Estate, Rental & Leasing (100.0%), Educational Services (100.0%), and Health Care & Social Assistance (79.2%).
| Industry | Male | Female |
| Agriculture, Fishing & Hunting | 6 (54.5%) | 5 (45.5%) |
| Mining, Quarrying, & Extraction | 0 (0.0%) | 0 (0.0%) |
| Construction | 0 (0.0%) | 0 (0.0%) |
| Manufacturing | 4 (100.0%) | 0 (0.0%) |
| Wholesale Trade | 0 (0.0%) | 0 (0.0%) |
| Retail Trade | 3 (100.0%) | 0 (0.0%) |
| Transportation & Warehousing | 0 (0.0%) | 0 (0.0%) |
| Utilities | 0 (0.0%) | 0 (0.0%) |
| Information | 0 (0.0%) | 0 (0.0%) |
| Finance & Insurance | 17 (100.0%) | 0 (0.0%) |
| Real Estate, Rental & Leasing | 0 (0.0%) | 4 (100.0%) |
| Professional & Scientific | 15 (33.3%) | 30 (66.7%) |
| Enterprise Management | 0 (0.0%) | 0 (0.0%) |
| Administrative & Support | 0 (0.0%) | 0 (0.0%) |
| Educational Services | 0 (0.0%) | 6 (100.0%) |
| Health Care & Social Assistance | 5 (20.8%) | 19 (79.2%) |
| Arts, Entertainment & Recreation | 0 (0.0%) | 0 (0.0%) |
| Accommodation & Food Services | 2 (33.3%) | 4 (66.7%) |
| Public Administration | 0 (0.0%) | 0 (0.0%) |
| Total | 59 (46.5%) | 68 (53.5%) |
Education in New Suffolk
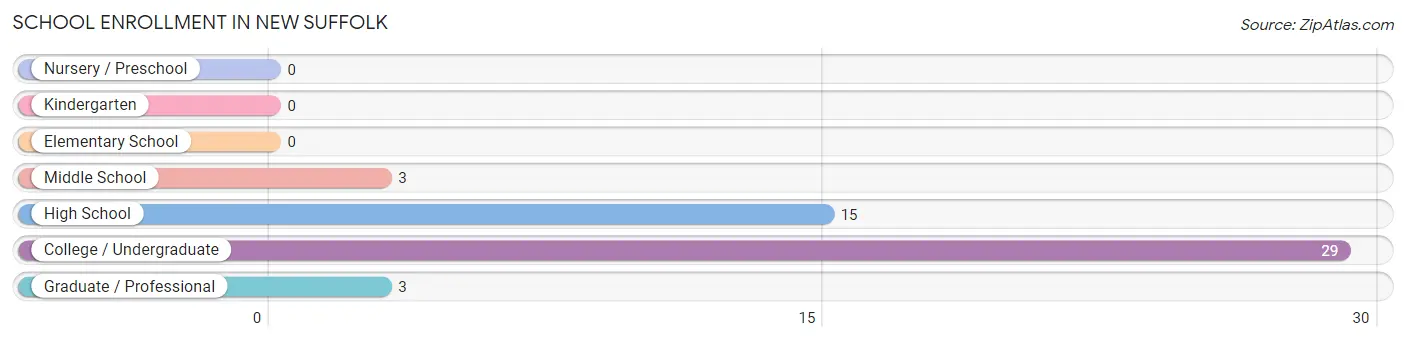
School Enrollment in New Suffolk
The most common levels of schooling among the 50 students in New Suffolk are college / undergraduate (29 | 58.0%), high school (15 | 30.0%), and middle school (3 | 6.0%).
| School Level | # Students | % Students |
| Nursery / Preschool | 0 | 0.0% |
| Kindergarten | 0 | 0.0% |
| Elementary School | 0 | 0.0% |
| Middle School | 3 | 6.0% |
| High School | 15 | 30.0% |
| College / Undergraduate | 29 | 58.0% |
| Graduate / Professional | 3 | 6.0% |
| Total | 50 | 100.0% |
School Enrollment by Age by Funding Source in New Suffolk
Out of a total of 50 students who are enrolled in schools in New Suffolk, 29 (58.0%) attend a private institution, while the remaining 21 (42.0%) are enrolled in public schools. The age group of 18 to 19 year olds has the highest likelihood of being enrolled in private schools, with 13 (100.0% in the age bracket) enrolled. Conversely, the age group of 10 to 14 year olds has the lowest likelihood of being enrolled in a private school, with 7 (100.0% in the age bracket) attending a public institution.
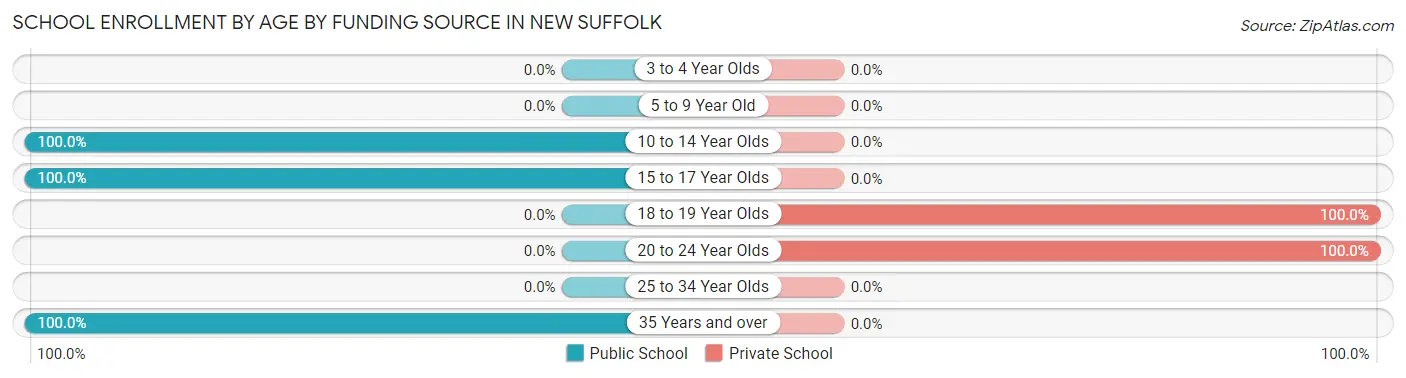
| Age Bracket | Public School | Private School |
| 3 to 4 Year Olds | 0 (0.0%) | 0 (0.0%) |
| 5 to 9 Year Old | 0 (0.0%) | 0 (0.0%) |
| 10 to 14 Year Olds | 7 (100.0%) | 0 (0.0%) |
| 15 to 17 Year Olds | 11 (100.0%) | 0 (0.0%) |
| 18 to 19 Year Olds | 0 (0.0%) | 13 (100.0%) |
| 20 to 24 Year Olds | 0 (0.0%) | 16 (100.0%) |
| 25 to 34 Year Olds | 0 (0.0%) | 0 (0.0%) |
| 35 Years and over | 3 (100.0%) | 0 (0.0%) |
| Total | 21 (42.0%) | 29 (58.0%) |
Educational Attainment by Field of Study in New Suffolk
Science & technology (41 | 25.5%), business (30 | 18.6%), liberal arts & history (29 | 18.0%), communications (17 | 10.6%), and visual & performing arts (11 | 6.8%) are the most common fields of study among 161 individuals in New Suffolk who have obtained a bachelor's degree or higher.
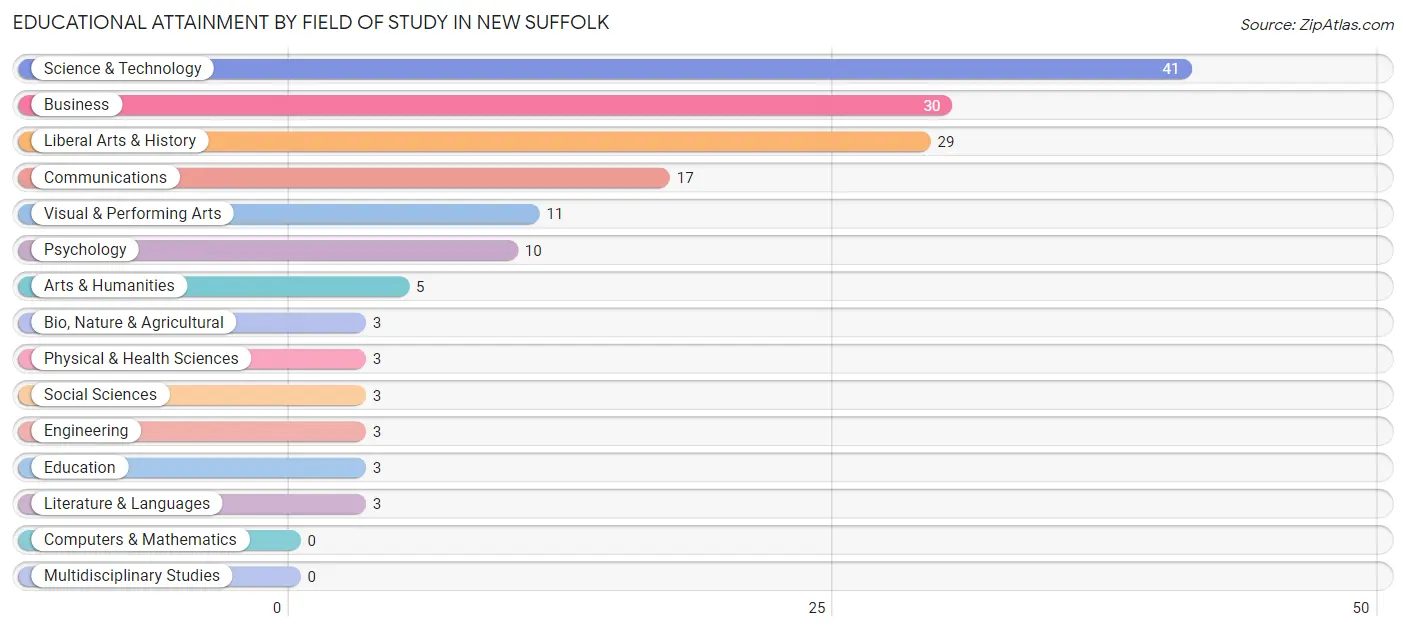
| Field of Study | # Graduates | % Graduates |
| Computers & Mathematics | 0 | 0.0% |
| Bio, Nature & Agricultural | 3 | 1.9% |
| Physical & Health Sciences | 3 | 1.9% |
| Psychology | 10 | 6.2% |
| Social Sciences | 3 | 1.9% |
| Engineering | 3 | 1.9% |
| Multidisciplinary Studies | 0 | 0.0% |
| Science & Technology | 41 | 25.5% |
| Business | 30 | 18.6% |
| Education | 3 | 1.9% |
| Literature & Languages | 3 | 1.9% |
| Liberal Arts & History | 29 | 18.0% |
| Visual & Performing Arts | 11 | 6.8% |
| Communications | 17 | 10.6% |
| Arts & Humanities | 5 | 3.1% |
| Total | 161 | 100.0% |
Transportation & Commute in New Suffolk
Vehicle Availability by Sex in New Suffolk
The most prevalent vehicle ownership categories in New Suffolk are males with 2 vehicles (36, accounting for 65.4%) and females with 2 vehicles (44, making up 52.9%).
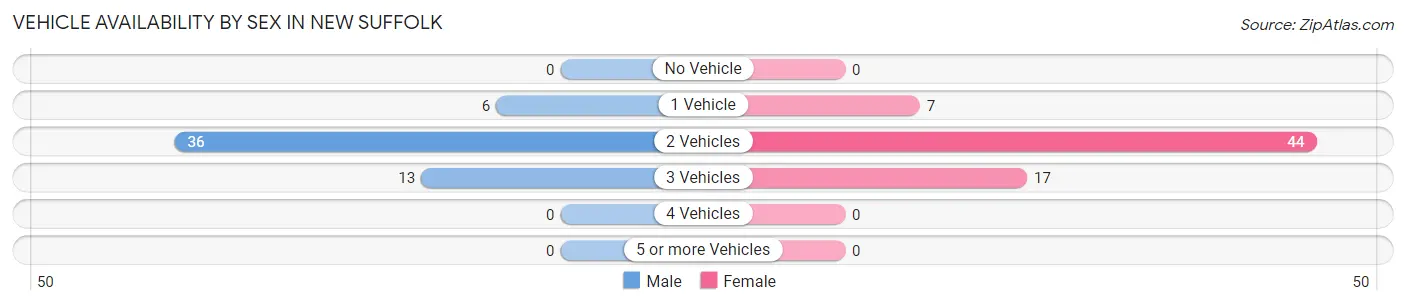
| Vehicles Available | Male | Female |
| No Vehicle | 0 (0.0%) | 0 (0.0%) |
| 1 Vehicle | 6 (10.9%) | 7 (10.3%) |
| 2 Vehicles | 36 (65.4%) | 44 (64.7%) |
| 3 Vehicles | 13 (23.6%) | 17 (25.0%) |
| 4 Vehicles | 0 (0.0%) | 0 (0.0%) |
| 5 or more Vehicles | 0 (0.0%) | 0 (0.0%) |
| Total | 55 (100.0%) | 68 (100.0%) |
Commute Time in New Suffolk
The most frequently occuring commute durations in New Suffolk are 90 or more minutes (31 commuters, 31.0%), less than 5 minutes (18 commuters, 18.0%), and 5 to 9 minutes (13 commuters, 13.0%).
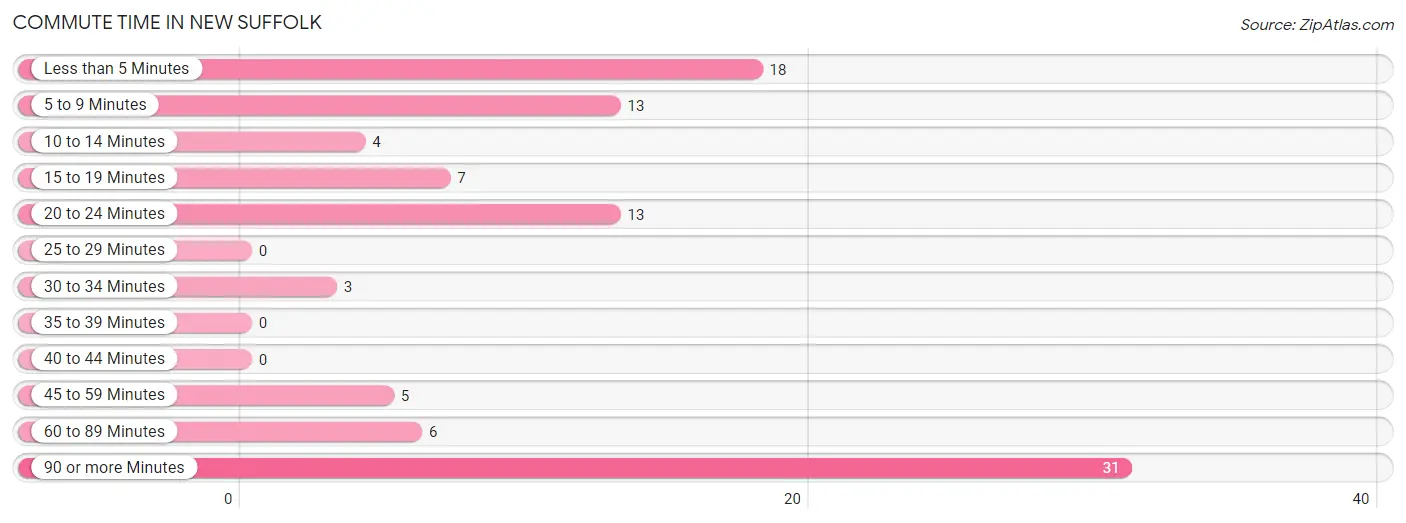
| Commute Time | # Commuters | % Commuters |
| Less than 5 Minutes | 18 | 18.0% |
| 5 to 9 Minutes | 13 | 13.0% |
| 10 to 14 Minutes | 4 | 4.0% |
| 15 to 19 Minutes | 7 | 7.0% |
| 20 to 24 Minutes | 13 | 13.0% |
| 25 to 29 Minutes | 0 | 0.0% |
| 30 to 34 Minutes | 3 | 3.0% |
| 35 to 39 Minutes | 0 | 0.0% |
| 40 to 44 Minutes | 0 | 0.0% |
| 45 to 59 Minutes | 5 | 5.0% |
| 60 to 89 Minutes | 6 | 6.0% |
| 90 or more Minutes | 31 | 31.0% |
Commute Time by Sex in New Suffolk
The most common commute times in New Suffolk are 90 or more minutes (14 commuters, 35.0%) for males and 90 or more minutes (17 commuters, 28.3%) for females.
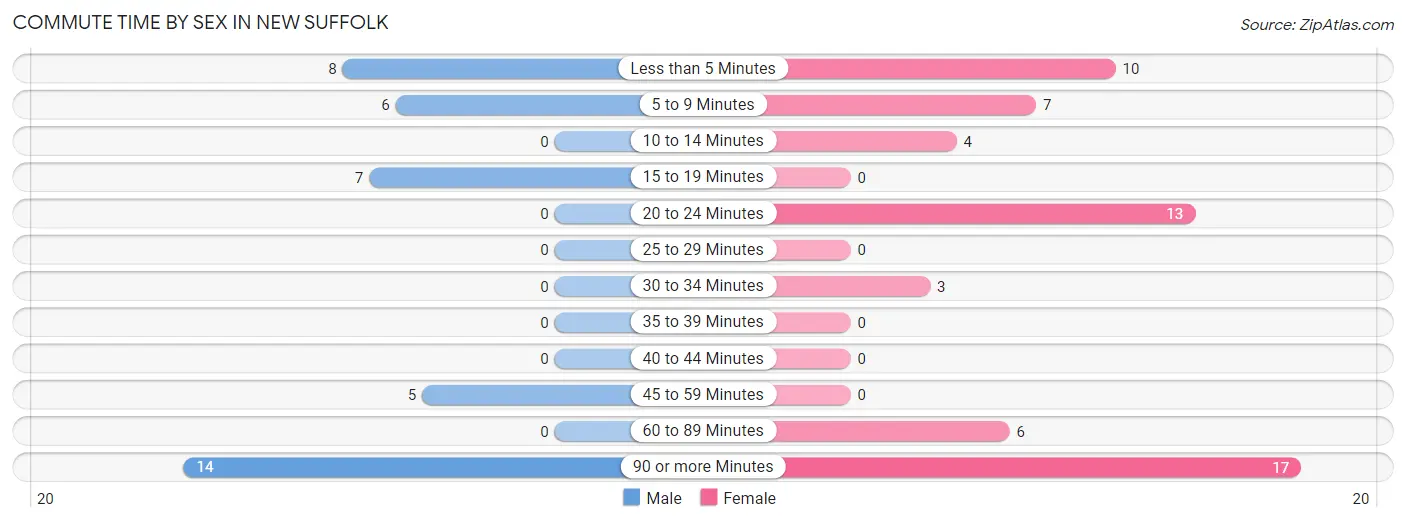
| Commute Time | Male | Female |
| Less than 5 Minutes | 8 (20.0%) | 10 (16.7%) |
| 5 to 9 Minutes | 6 (15.0%) | 7 (11.7%) |
| 10 to 14 Minutes | 0 (0.0%) | 4 (6.7%) |
| 15 to 19 Minutes | 7 (17.5%) | 0 (0.0%) |
| 20 to 24 Minutes | 0 (0.0%) | 13 (21.7%) |
| 25 to 29 Minutes | 0 (0.0%) | 0 (0.0%) |
| 30 to 34 Minutes | 0 (0.0%) | 3 (5.0%) |
| 35 to 39 Minutes | 0 (0.0%) | 0 (0.0%) |
| 40 to 44 Minutes | 0 (0.0%) | 0 (0.0%) |
| 45 to 59 Minutes | 5 (12.5%) | 0 (0.0%) |
| 60 to 89 Minutes | 0 (0.0%) | 6 (10.0%) |
| 90 or more Minutes | 14 (35.0%) | 17 (28.3%) |
Time of Departure to Work by Sex in New Suffolk
The most frequent times of departure to work in New Suffolk are 5:00 AM to 5:29 AM (14, 35.0%) for males and 5:00 AM to 5:29 AM (17, 28.3%) for females.
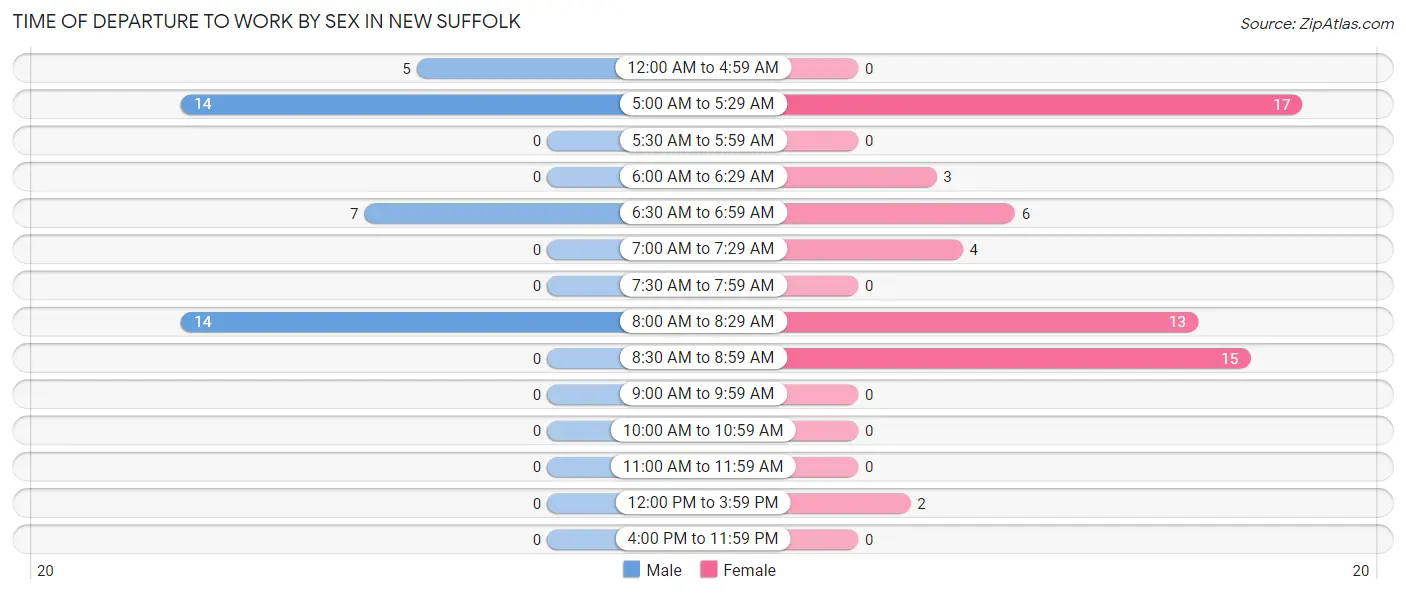
| Time of Departure | Male | Female |
| 12:00 AM to 4:59 AM | 5 (12.5%) | 0 (0.0%) |
| 5:00 AM to 5:29 AM | 14 (35.0%) | 17 (28.3%) |
| 5:30 AM to 5:59 AM | 0 (0.0%) | 0 (0.0%) |
| 6:00 AM to 6:29 AM | 0 (0.0%) | 3 (5.0%) |
| 6:30 AM to 6:59 AM | 7 (17.5%) | 6 (10.0%) |
| 7:00 AM to 7:29 AM | 0 (0.0%) | 4 (6.7%) |
| 7:30 AM to 7:59 AM | 0 (0.0%) | 0 (0.0%) |
| 8:00 AM to 8:29 AM | 14 (35.0%) | 13 (21.7%) |
| 8:30 AM to 8:59 AM | 0 (0.0%) | 15 (25.0%) |
| 9:00 AM to 9:59 AM | 0 (0.0%) | 0 (0.0%) |
| 10:00 AM to 10:59 AM | 0 (0.0%) | 0 (0.0%) |
| 11:00 AM to 11:59 AM | 0 (0.0%) | 0 (0.0%) |
| 12:00 PM to 3:59 PM | 0 (0.0%) | 2 (3.3%) |
| 4:00 PM to 11:59 PM | 0 (0.0%) | 0 (0.0%) |
| Total | 40 (100.0%) | 60 (100.0%) |
Housing Occupancy in New Suffolk
Occupancy by Ownership in New Suffolk
Of the total 145 dwellings in New Suffolk, owner-occupied units account for 124 (85.5%), while renter-occupied units make up 21 (14.5%).
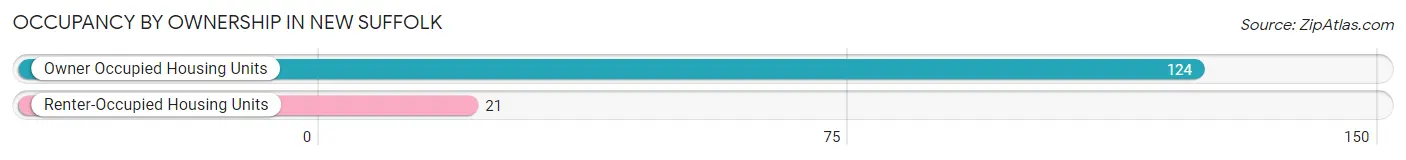
| Occupancy | # Housing Units | % Housing Units |
| Owner Occupied Housing Units | 124 | 85.5% |
| Renter-Occupied Housing Units | 21 | 14.5% |
| Total Occupied Housing Units | 145 | 100.0% |
Occupancy by Household Size in New Suffolk
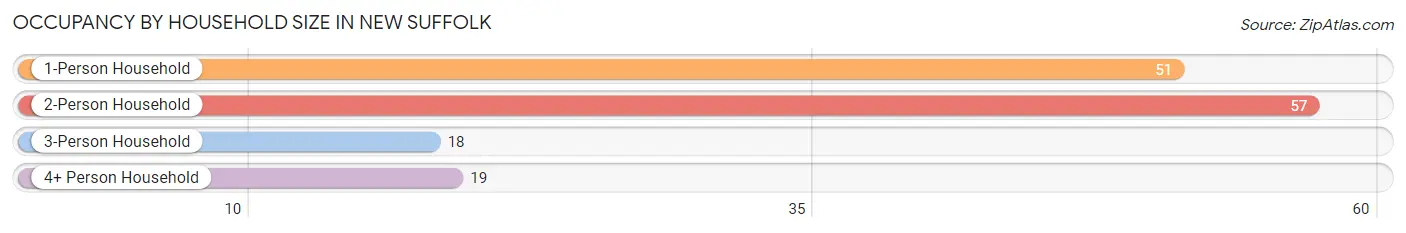
| Household Size | # Housing Units | % Housing Units |
| 1-Person Household | 51 | 35.2% |
| 2-Person Household | 57 | 39.3% |
| 3-Person Household | 18 | 12.4% |
| 4+ Person Household | 19 | 13.1% |
| Total Housing Units | 145 | 100.0% |
Occupancy by Ownership by Household Size in New Suffolk
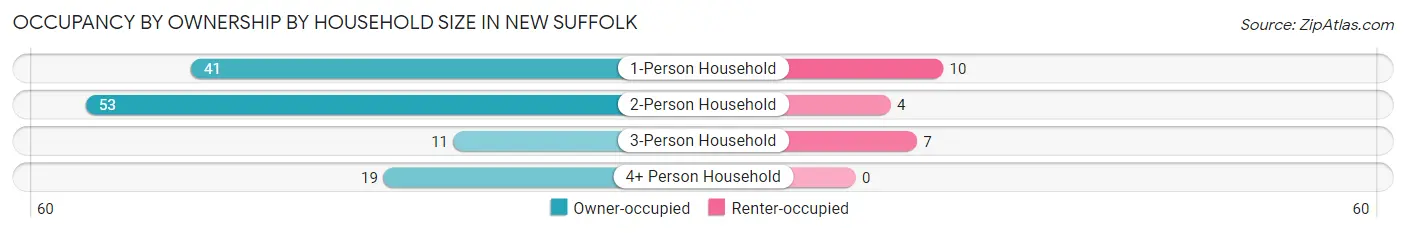
| Household Size | Owner-occupied | Renter-occupied |
| 1-Person Household | 41 (80.4%) | 10 (19.6%) |
| 2-Person Household | 53 (93.0%) | 4 (7.0%) |
| 3-Person Household | 11 (61.1%) | 7 (38.9%) |
| 4+ Person Household | 19 (100.0%) | 0 (0.0%) |
| Total Housing Units | 124 (85.5%) | 21 (14.5%) |
Occupancy by Educational Attainment in New Suffolk
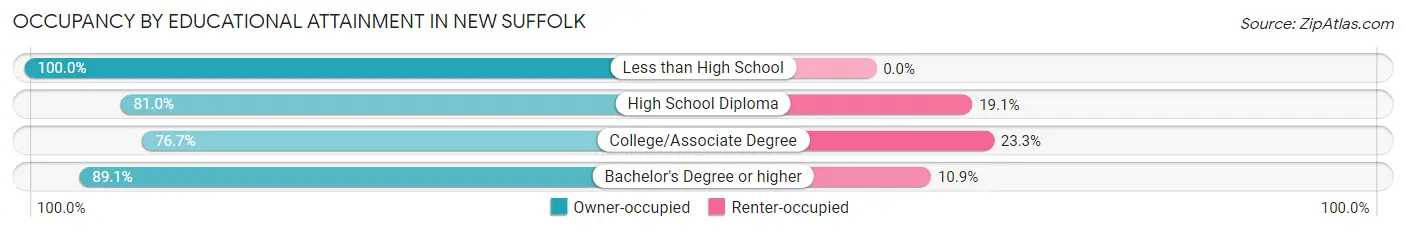
| Household Size | Owner-occupied | Renter-occupied |
| Less than High School | 2 (100.0%) | 0 (0.0%) |
| High School Diploma | 17 (80.9%) | 4 (19.1%) |
| College/Associate Degree | 23 (76.7%) | 7 (23.3%) |
| Bachelor's Degree or higher | 82 (89.1%) | 10 (10.9%) |
Occupancy by Age of Householder in New Suffolk
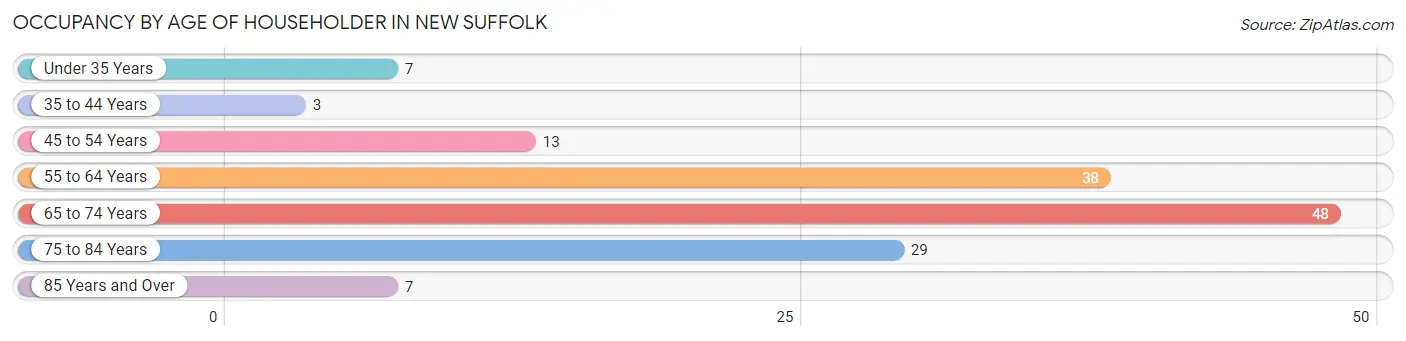
| Age Bracket | # Households | % Households |
| Under 35 Years | 7 | 4.8% |
| 35 to 44 Years | 3 | 2.1% |
| 45 to 54 Years | 13 | 9.0% |
| 55 to 64 Years | 38 | 26.2% |
| 65 to 74 Years | 48 | 33.1% |
| 75 to 84 Years | 29 | 20.0% |
| 85 Years and Over | 7 | 4.8% |
| Total | 145 | 100.0% |
Housing Finances in New Suffolk
Median Income by Occupancy in New Suffolk
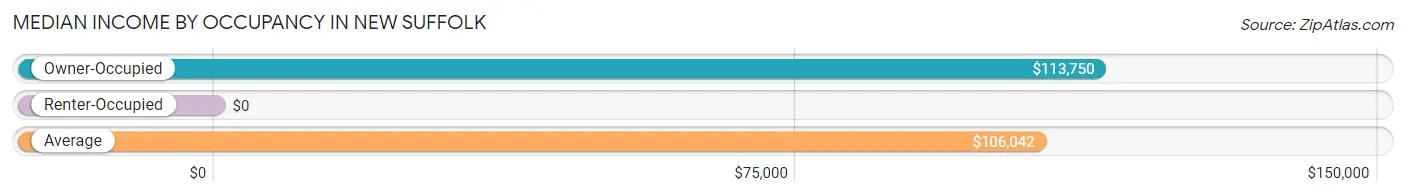
| Occupancy Type | # Households | Median Income |
| Owner-Occupied | 124 (85.5%) | $113,750 |
| Renter-Occupied | 21 (14.5%) | $0 |
| Average | 145 (100.0%) | $106,042 |
Occupancy by Householder Income Bracket in New Suffolk
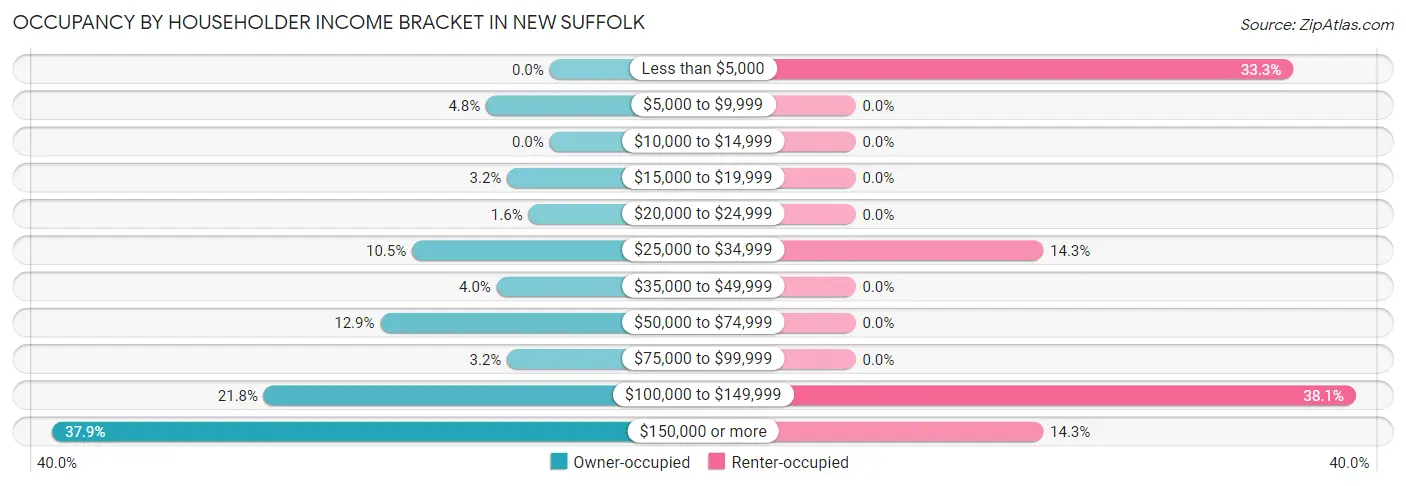
| Income Bracket | Owner-occupied | Renter-occupied |
| Less than $5,000 | 0 (0.0%) | 7 (33.3%) |
| $5,000 to $9,999 | 6 (4.8%) | 0 (0.0%) |
| $10,000 to $14,999 | 0 (0.0%) | 0 (0.0%) |
| $15,000 to $19,999 | 4 (3.2%) | 0 (0.0%) |
| $20,000 to $24,999 | 2 (1.6%) | 0 (0.0%) |
| $25,000 to $34,999 | 13 (10.5%) | 3 (14.3%) |
| $35,000 to $49,999 | 5 (4.0%) | 0 (0.0%) |
| $50,000 to $74,999 | 16 (12.9%) | 0 (0.0%) |
| $75,000 to $99,999 | 4 (3.2%) | 0 (0.0%) |
| $100,000 to $149,999 | 27 (21.8%) | 8 (38.1%) |
| $150,000 or more | 47 (37.9%) | 3 (14.3%) |
| Total | 124 (100.0%) | 21 (100.0%) |
Monthly Housing Cost Tiers in New Suffolk
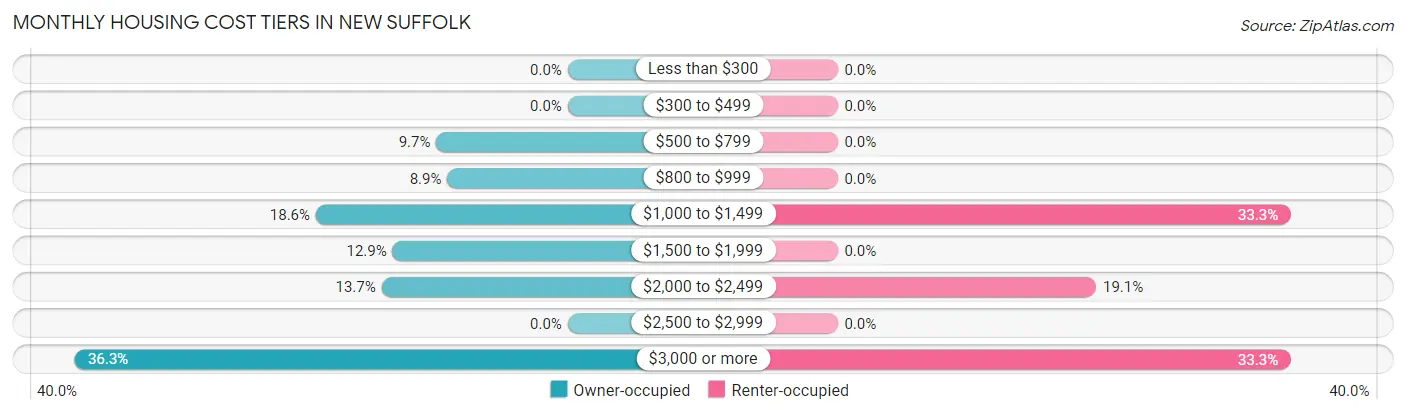
| Monthly Cost | Owner-occupied | Renter-occupied |
| Less than $300 | 0 (0.0%) | 0 (0.0%) |
| $300 to $499 | 0 (0.0%) | 0 (0.0%) |
| $500 to $799 | 12 (9.7%) | 0 (0.0%) |
| $800 to $999 | 11 (8.9%) | 0 (0.0%) |
| $1,000 to $1,499 | 23 (18.5%) | 7 (33.3%) |
| $1,500 to $1,999 | 16 (12.9%) | 0 (0.0%) |
| $2,000 to $2,499 | 17 (13.7%) | 4 (19.1%) |
| $2,500 to $2,999 | 0 (0.0%) | 0 (0.0%) |
| $3,000 or more | 45 (36.3%) | 7 (33.3%) |
| Total | 124 (100.0%) | 21 (100.0%) |
Physical Housing Characteristics in New Suffolk
Housing Structures in New Suffolk
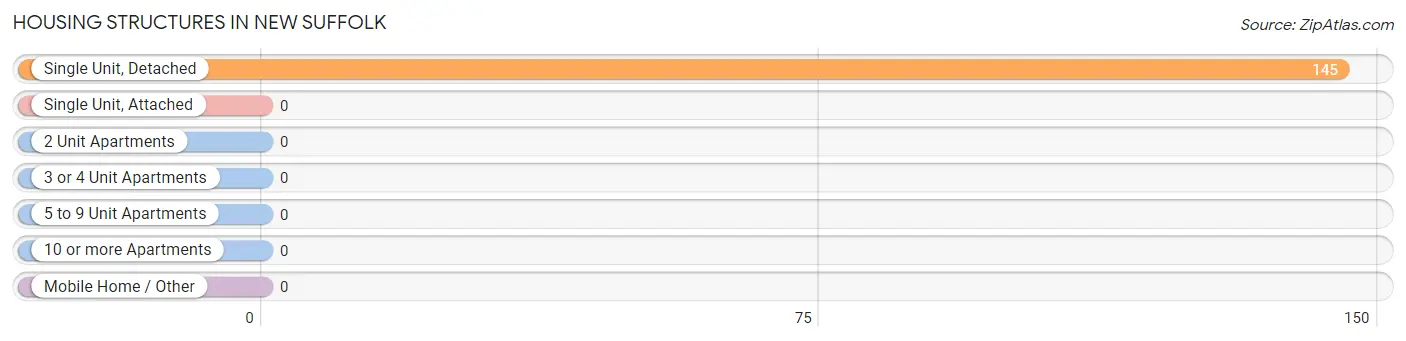
| Structure Type | # Housing Units | % Housing Units |
| Single Unit, Detached | 145 | 100.0% |
| Single Unit, Attached | 0 | 0.0% |
| 2 Unit Apartments | 0 | 0.0% |
| 3 or 4 Unit Apartments | 0 | 0.0% |
| 5 to 9 Unit Apartments | 0 | 0.0% |
| 10 or more Apartments | 0 | 0.0% |
| Mobile Home / Other | 0 | 0.0% |
| Total | 145 | 100.0% |
Housing Structures by Occupancy in New Suffolk
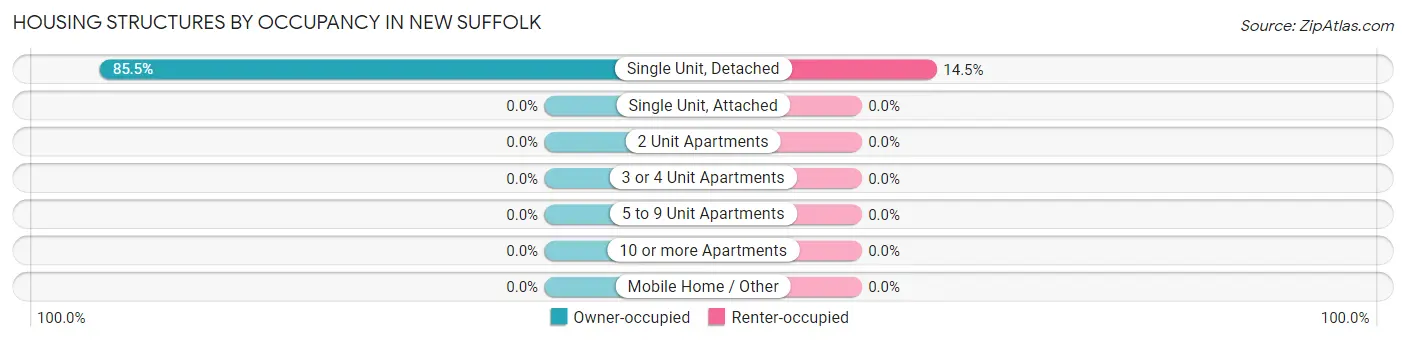
| Structure Type | Owner-occupied | Renter-occupied |
| Single Unit, Detached | 124 (85.5%) | 21 (14.5%) |
| Single Unit, Attached | 0 (0.0%) | 0 (0.0%) |
| 2 Unit Apartments | 0 (0.0%) | 0 (0.0%) |
| 3 or 4 Unit Apartments | 0 (0.0%) | 0 (0.0%) |
| 5 to 9 Unit Apartments | 0 (0.0%) | 0 (0.0%) |
| 10 or more Apartments | 0 (0.0%) | 0 (0.0%) |
| Mobile Home / Other | 0 (0.0%) | 0 (0.0%) |
| Total | 124 (85.5%) | 21 (14.5%) |
Housing Structures by Number of Rooms in New Suffolk
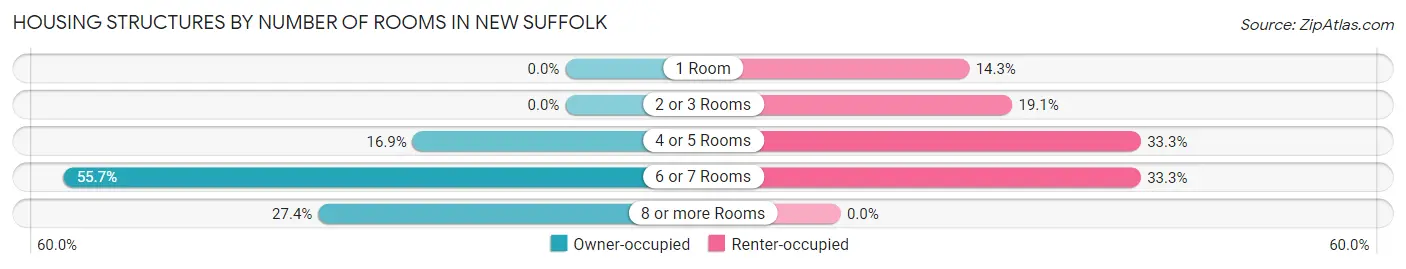
| Number of Rooms | Owner-occupied | Renter-occupied |
| 1 Room | 0 (0.0%) | 3 (14.3%) |
| 2 or 3 Rooms | 0 (0.0%) | 4 (19.1%) |
| 4 or 5 Rooms | 21 (16.9%) | 7 (33.3%) |
| 6 or 7 Rooms | 69 (55.6%) | 7 (33.3%) |
| 8 or more Rooms | 34 (27.4%) | 0 (0.0%) |
| Total | 124 (100.0%) | 21 (100.0%) |
Housing Structure by Heating Type in New Suffolk
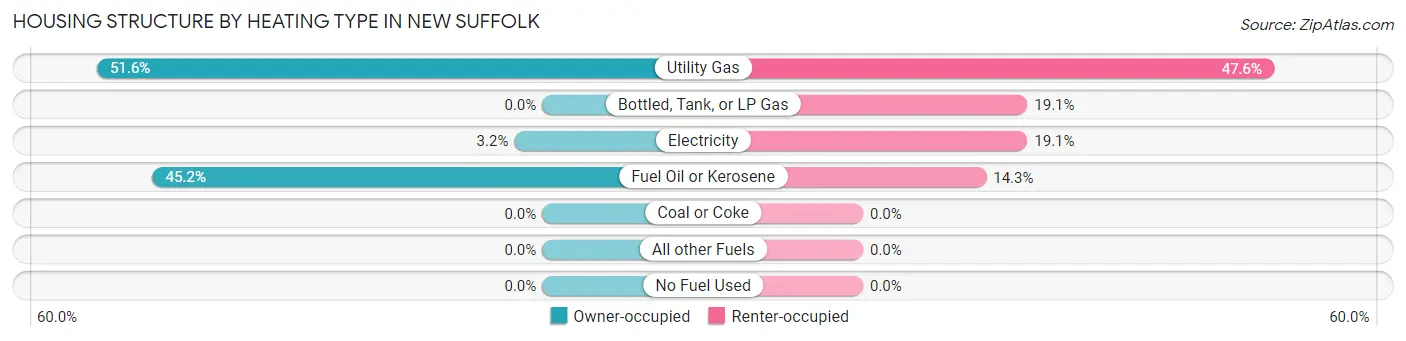
| Heating Type | Owner-occupied | Renter-occupied |
| Utility Gas | 64 (51.6%) | 10 (47.6%) |
| Bottled, Tank, or LP Gas | 0 (0.0%) | 4 (19.1%) |
| Electricity | 4 (3.2%) | 4 (19.1%) |
| Fuel Oil or Kerosene | 56 (45.2%) | 3 (14.3%) |
| Coal or Coke | 0 (0.0%) | 0 (0.0%) |
| All other Fuels | 0 (0.0%) | 0 (0.0%) |
| No Fuel Used | 0 (0.0%) | 0 (0.0%) |
| Total | 124 (100.0%) | 21 (100.0%) |
Household Vehicle Usage in New Suffolk
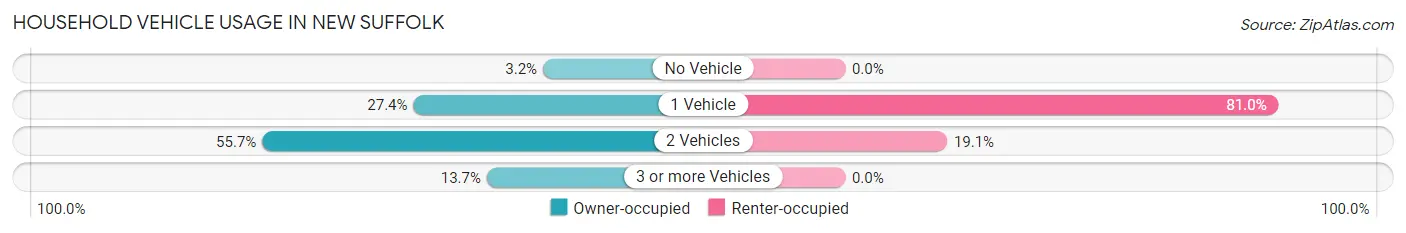
| Vehicles per Household | Owner-occupied | Renter-occupied |
| No Vehicle | 4 (3.2%) | 0 (0.0%) |
| 1 Vehicle | 34 (27.4%) | 17 (80.9%) |
| 2 Vehicles | 69 (55.6%) | 4 (19.1%) |
| 3 or more Vehicles | 17 (13.7%) | 0 (0.0%) |
| Total | 124 (100.0%) | 21 (100.0%) |
Real Estate & Mortgages in New Suffolk
Real Estate and Mortgage Overview in New Suffolk
| Characteristic | Without Mortgage | With Mortgage |
| Housing Units | 68 | 56 |
| Median Property Value | $1,000,000 | $1,031,300 |
| Median Household Income | $70,625 | $37 |
| Monthly Housing Costs | $1,218 | $45 |
| Real Estate Taxes | $6,667 | $0 |
Property Value by Mortgage Status in New Suffolk
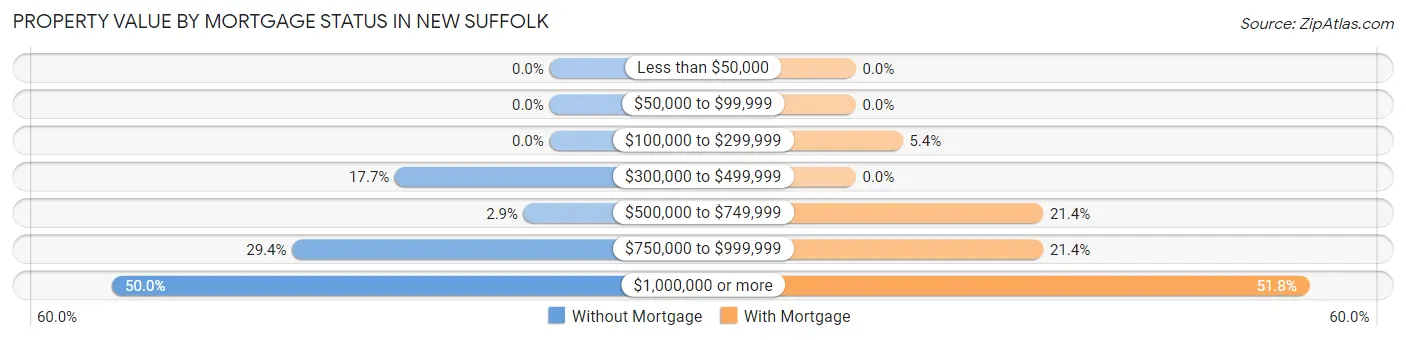
| Property Value | Without Mortgage | With Mortgage |
| Less than $50,000 | 0 (0.0%) | 0 (0.0%) |
| $50,000 to $99,999 | 0 (0.0%) | 0 (0.0%) |
| $100,000 to $299,999 | 0 (0.0%) | 3 (5.4%) |
| $300,000 to $499,999 | 12 (17.6%) | 0 (0.0%) |
| $500,000 to $749,999 | 2 (2.9%) | 12 (21.4%) |
| $750,000 to $999,999 | 20 (29.4%) | 12 (21.4%) |
| $1,000,000 or more | 34 (50.0%) | 29 (51.8%) |
| Total | 68 (100.0%) | 56 (100.0%) |
Household Income by Mortgage Status in New Suffolk
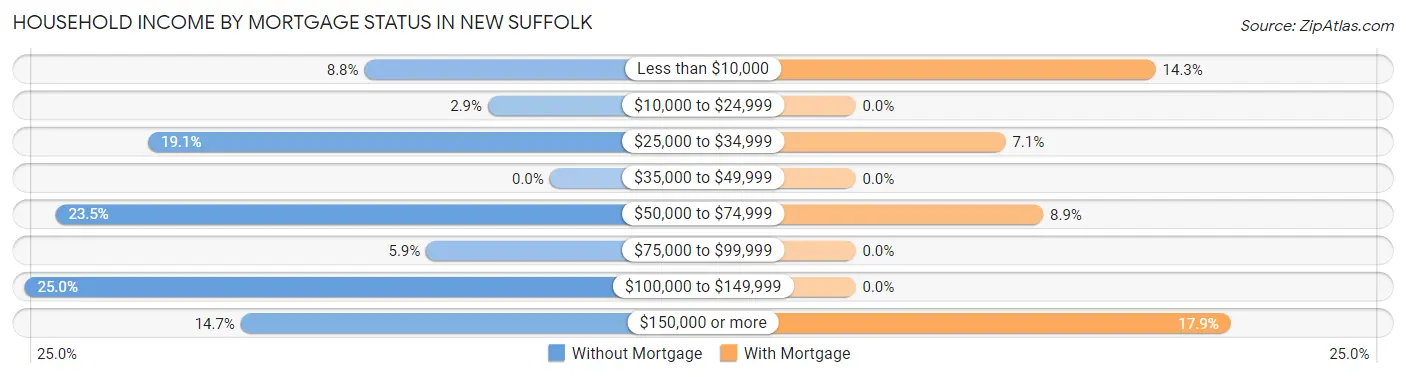
| Household Income | Without Mortgage | With Mortgage |
| Less than $10,000 | 6 (8.8%) | 8 (14.3%) |
| $10,000 to $24,999 | 2 (2.9%) | 0 (0.0%) |
| $25,000 to $34,999 | 13 (19.1%) | 4 (7.1%) |
| $35,000 to $49,999 | 0 (0.0%) | 0 (0.0%) |
| $50,000 to $74,999 | 16 (23.5%) | 5 (8.9%) |
| $75,000 to $99,999 | 4 (5.9%) | 0 (0.0%) |
| $100,000 to $149,999 | 17 (25.0%) | 0 (0.0%) |
| $150,000 or more | 10 (14.7%) | 10 (17.9%) |
| Total | 68 (100.0%) | 56 (100.0%) |
Property Value to Household Income Ratio in New Suffolk
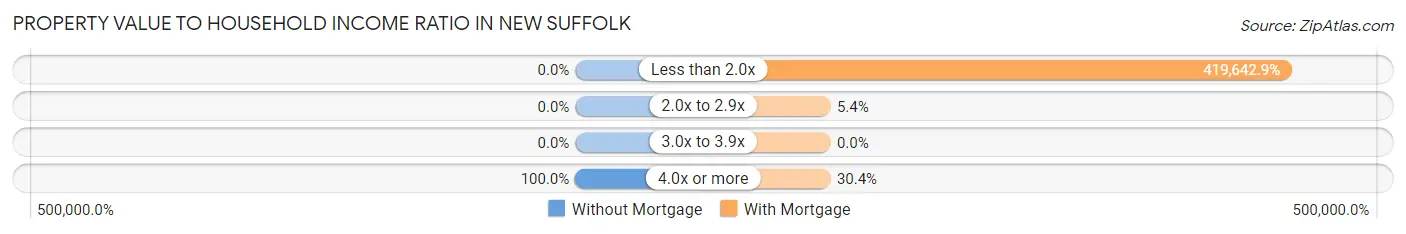
| Value-to-Income Ratio | Without Mortgage | With Mortgage |
| Less than 2.0x | 0 (0.0%) | 235,000 (419,642.9%) |
| 2.0x to 2.9x | 0 (0.0%) | 3 (5.4%) |
| 3.0x to 3.9x | 0 (0.0%) | 0 (0.0%) |
| 4.0x or more | 68 (100.0%) | 17 (30.4%) |
| Total | 68 (100.0%) | 56 (100.0%) |
Real Estate Taxes by Mortgage Status in New Suffolk
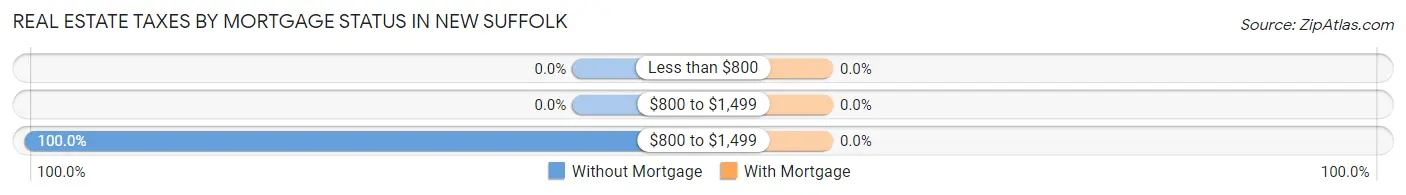
| Property Taxes | Without Mortgage | With Mortgage |
| Less than $800 | 0 (0.0%) | 0 (0.0%) |
| $800 to $1,499 | 0 (0.0%) | 0 (0.0%) |
| $800 to $1,499 | 68 (100.0%) | 0 (0.0%) |
| Total | 68 (100.0%) | 56 (100.0%) |
Health & Disability in New Suffolk
Health Insurance Coverage by Age in New Suffolk
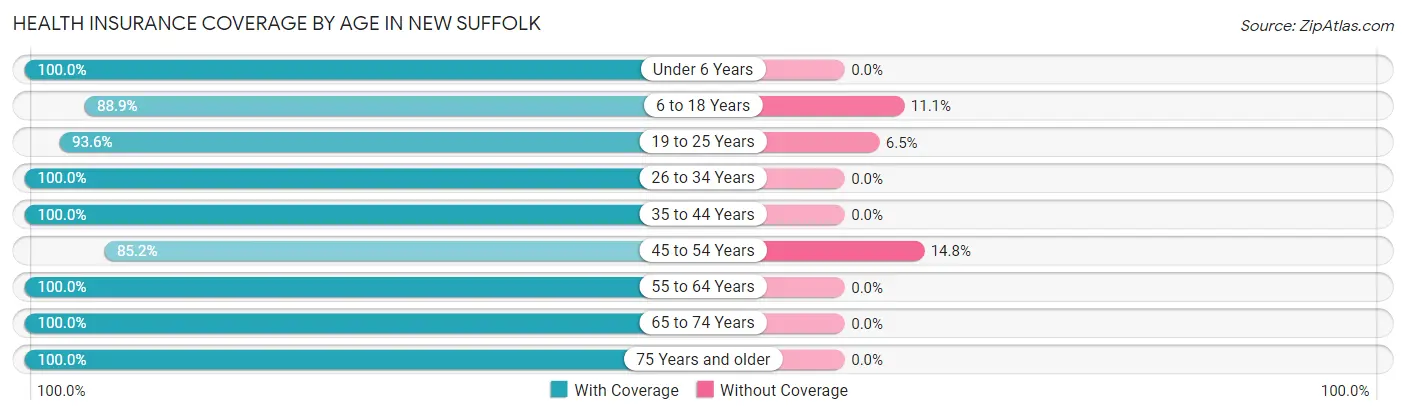
| Age Bracket | With Coverage | Without Coverage |
| Under 6 Years | 13 (100.0%) | 0 (0.0%) |
| 6 to 18 Years | 16 (88.9%) | 2 (11.1%) |
| 19 to 25 Years | 29 (93.5%) | 2 (6.5%) |
| 26 to 34 Years | 13 (100.0%) | 0 (0.0%) |
| 35 to 44 Years | 5 (100.0%) | 0 (0.0%) |
| 45 to 54 Years | 23 (85.2%) | 4 (14.8%) |
| 55 to 64 Years | 69 (100.0%) | 0 (0.0%) |
| 65 to 74 Years | 70 (100.0%) | 0 (0.0%) |
| 75 Years and older | 59 (100.0%) | 0 (0.0%) |
| Total | 297 (97.4%) | 8 (2.6%) |
Health Insurance Coverage by Citizenship Status in New Suffolk
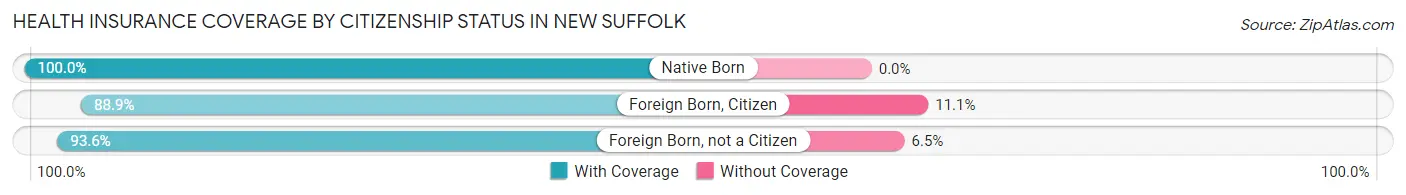
| Citizenship Status | With Coverage | Without Coverage |
| Native Born | 13 (100.0%) | 0 (0.0%) |
| Foreign Born, Citizen | 16 (88.9%) | 2 (11.1%) |
| Foreign Born, not a Citizen | 29 (93.5%) | 2 (6.5%) |
Health Insurance Coverage by Household Income in New Suffolk
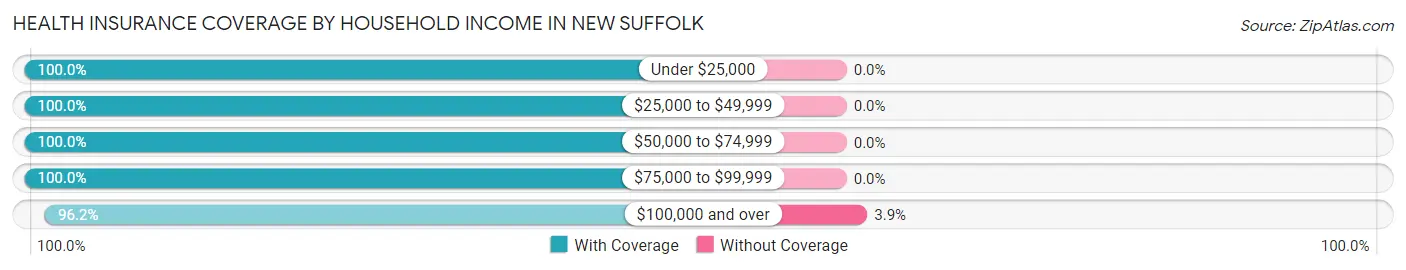
| Household Income | With Coverage | Without Coverage |
| Under $25,000 | 19 (100.0%) | 0 (0.0%) |
| $25,000 to $49,999 | 43 (100.0%) | 0 (0.0%) |
| $50,000 to $74,999 | 27 (100.0%) | 0 (0.0%) |
| $75,000 to $99,999 | 8 (100.0%) | 0 (0.0%) |
| $100,000 and over | 200 (96.2%) | 8 (3.8%) |
Public vs Private Health Insurance Coverage by Age in New Suffolk
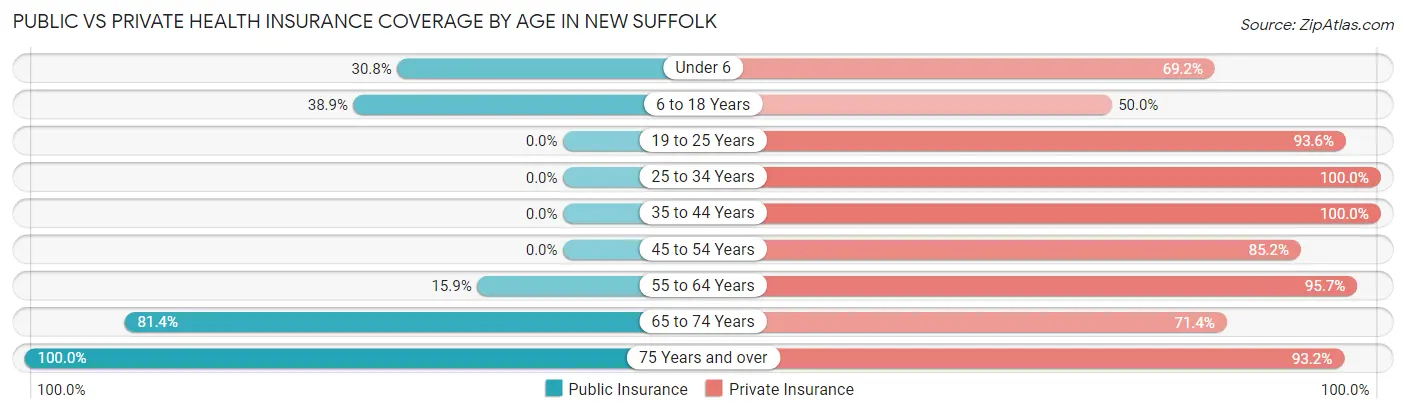
| Age Bracket | Public Insurance | Private Insurance |
| Under 6 | 4 (30.8%) | 9 (69.2%) |
| 6 to 18 Years | 7 (38.9%) | 9 (50.0%) |
| 19 to 25 Years | 0 (0.0%) | 29 (93.5%) |
| 25 to 34 Years | 0 (0.0%) | 13 (100.0%) |
| 35 to 44 Years | 0 (0.0%) | 5 (100.0%) |
| 45 to 54 Years | 0 (0.0%) | 23 (85.2%) |
| 55 to 64 Years | 11 (15.9%) | 66 (95.7%) |
| 65 to 74 Years | 57 (81.4%) | 50 (71.4%) |
| 75 Years and over | 59 (100.0%) | 55 (93.2%) |
| Total | 138 (45.3%) | 259 (84.9%) |
Disability Status by Sex by Age in New Suffolk
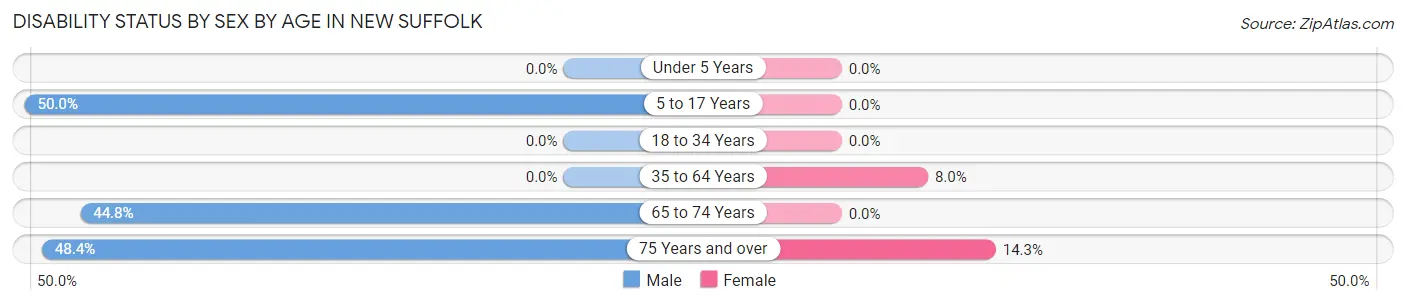
| Age Bracket | Male | Female |
| Under 5 Years | 0 (0.0%) | 0 (0.0%) |
| 5 to 17 Years | 4 (50.0%) | 0 (0.0%) |
| 18 to 34 Years | 0 (0.0%) | 0 (0.0%) |
| 35 to 64 Years | 0 (0.0%) | 4 (8.0%) |
| 65 to 74 Years | 13 (44.8%) | 0 (0.0%) |
| 75 Years and over | 15 (48.4%) | 4 (14.3%) |
Disability Class by Sex by Age in New Suffolk
Disability Class: Hearing Difficulty
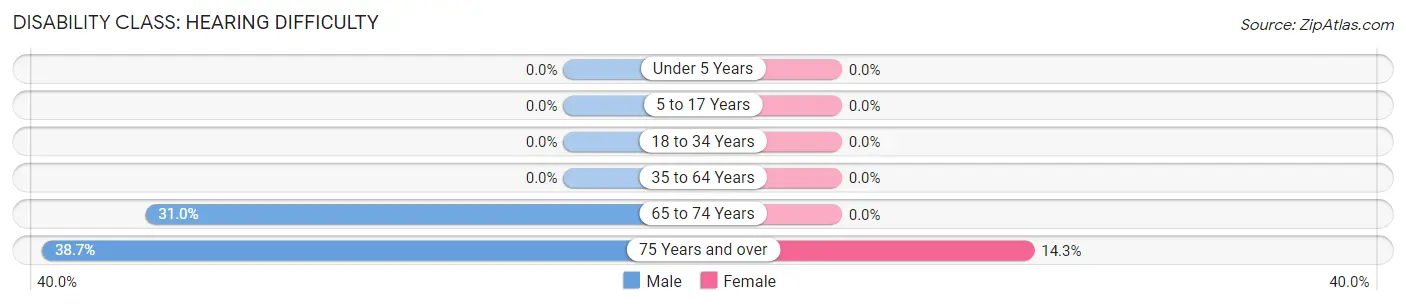
| Age Bracket | Male | Female |
| Under 5 Years | 0 (0.0%) | 0 (0.0%) |
| 5 to 17 Years | 0 (0.0%) | 0 (0.0%) |
| 18 to 34 Years | 0 (0.0%) | 0 (0.0%) |
| 35 to 64 Years | 0 (0.0%) | 0 (0.0%) |
| 65 to 74 Years | 9 (31.0%) | 0 (0.0%) |
| 75 Years and over | 12 (38.7%) | 4 (14.3%) |
Disability Class: Vision Difficulty
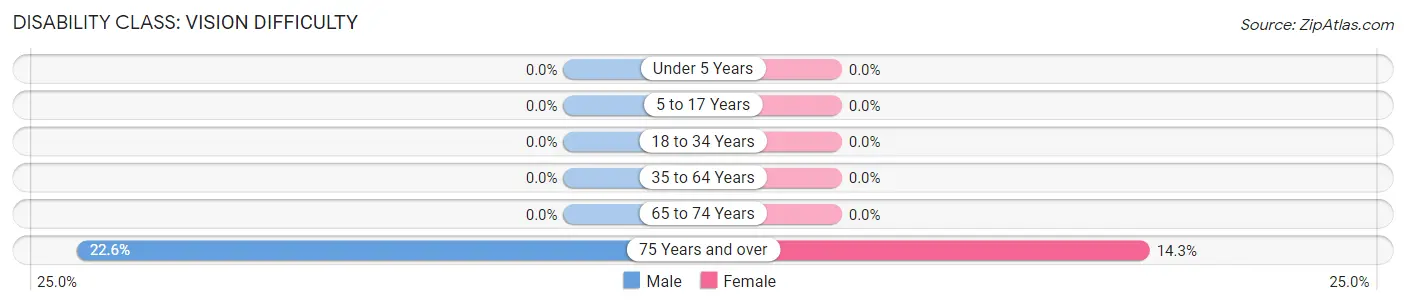
| Age Bracket | Male | Female |
| Under 5 Years | 0 (0.0%) | 0 (0.0%) |
| 5 to 17 Years | 0 (0.0%) | 0 (0.0%) |
| 18 to 34 Years | 0 (0.0%) | 0 (0.0%) |
| 35 to 64 Years | 0 (0.0%) | 0 (0.0%) |
| 65 to 74 Years | 0 (0.0%) | 0 (0.0%) |
| 75 Years and over | 7 (22.6%) | 4 (14.3%) |
Disability Class: Cognitive Difficulty
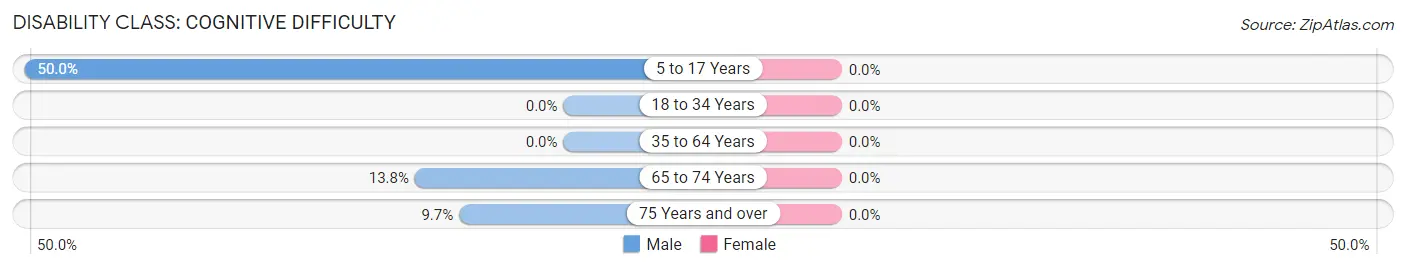
| Age Bracket | Male | Female |
| 5 to 17 Years | 4 (50.0%) | 0 (0.0%) |
| 18 to 34 Years | 0 (0.0%) | 0 (0.0%) |
| 35 to 64 Years | 0 (0.0%) | 0 (0.0%) |
| 65 to 74 Years | 4 (13.8%) | 0 (0.0%) |
| 75 Years and over | 3 (9.7%) | 0 (0.0%) |
Disability Class: Ambulatory Difficulty
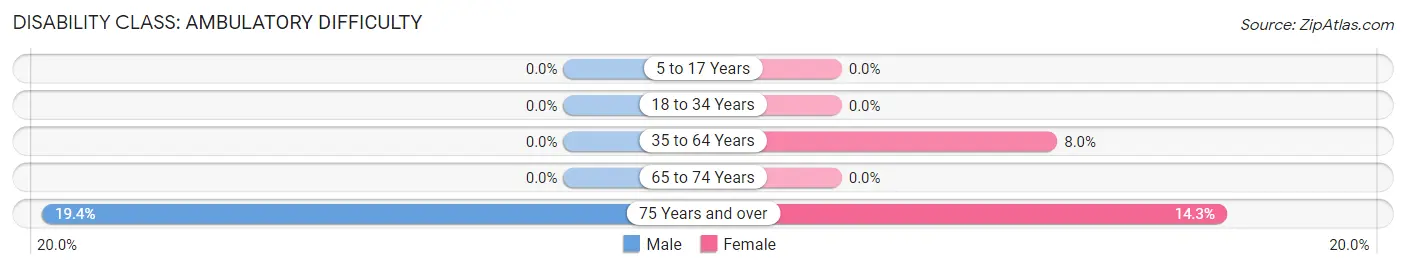
| Age Bracket | Male | Female |
| 5 to 17 Years | 0 (0.0%) | 0 (0.0%) |
| 18 to 34 Years | 0 (0.0%) | 0 (0.0%) |
| 35 to 64 Years | 0 (0.0%) | 4 (8.0%) |
| 65 to 74 Years | 0 (0.0%) | 0 (0.0%) |
| 75 Years and over | 6 (19.4%) | 4 (14.3%) |
Disability Class: Self-Care Difficulty
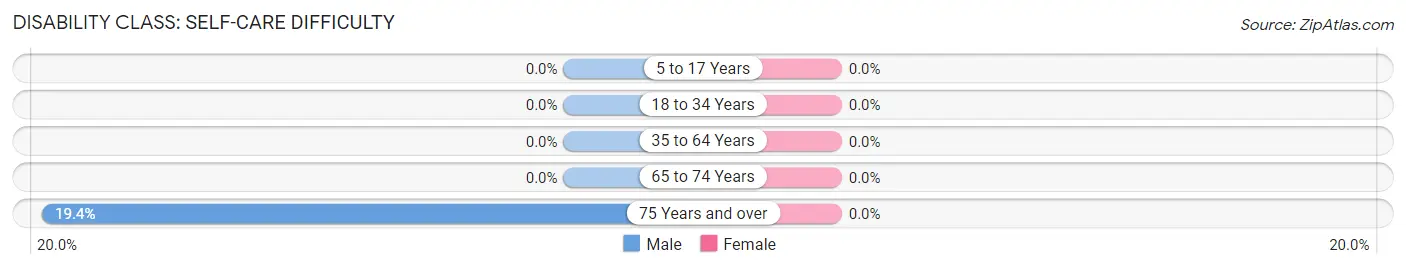
| Age Bracket | Male | Female |
| 5 to 17 Years | 0 (0.0%) | 0 (0.0%) |
| 18 to 34 Years | 0 (0.0%) | 0 (0.0%) |
| 35 to 64 Years | 0 (0.0%) | 0 (0.0%) |
| 65 to 74 Years | 0 (0.0%) | 0 (0.0%) |
| 75 Years and over | 6 (19.4%) | 0 (0.0%) |
Technology Access in New Suffolk
Computing Device Access in New Suffolk
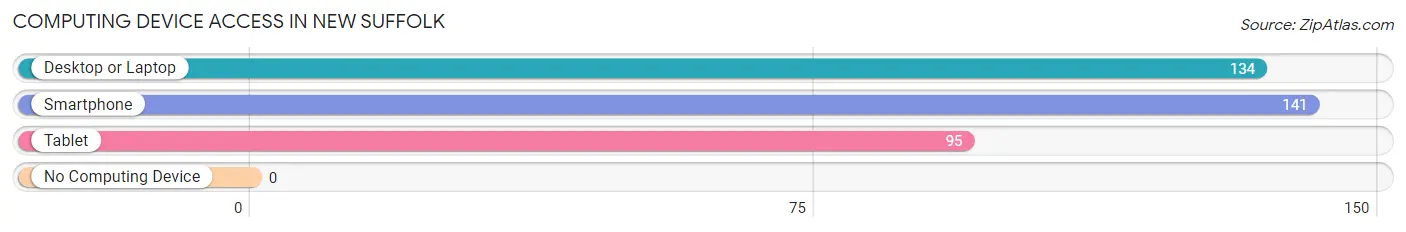
| Device Type | # Households | % Households |
| Desktop or Laptop | 134 | 92.4% |
| Smartphone | 141 | 97.2% |
| Tablet | 95 | 65.5% |
| No Computing Device | 0 | 0.0% |
| Total | 145 | 100.0% |
Internet Access in New Suffolk
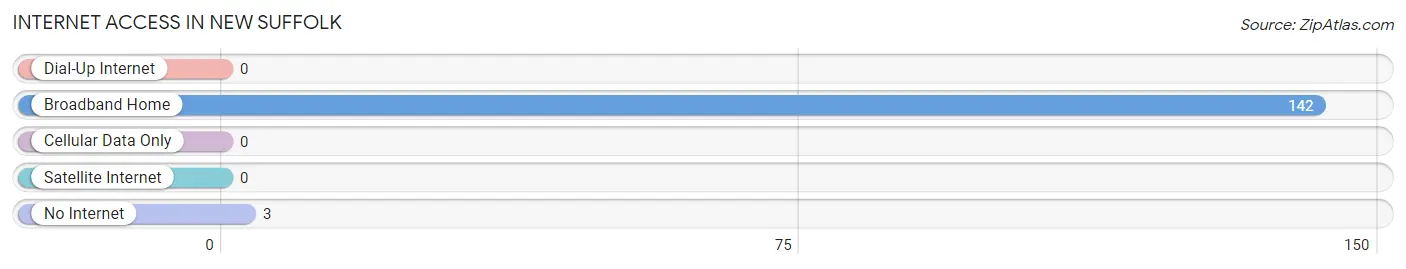
| Internet Type | # Households | % Households |
| Dial-Up Internet | 0 | 0.0% |
| Broadband Home | 142 | 97.9% |
| Cellular Data Only | 0 | 0.0% |
| Satellite Internet | 0 | 0.0% |
| No Internet | 3 | 2.1% |
| Total | 145 | 100.0% |
New Suffolk Summary
Suffolk County, New York is located on the eastern end of Long Island and is the easternmost county in the state. It is bordered by Nassau County to the west, the Atlantic Ocean to the south, and the Long Island Sound to the north. The county seat is Riverhead, and the largest town is Brookhaven. The county is home to 1.5 million people, making it the fourth most populous county in New York.
History
Suffolk County was established in 1683, when it was split off from the eastern portion of Queens County. The county was named after the English county of Suffolk, which was the home of many of the early settlers. The first settlers of Suffolk County were English Puritans who arrived in the 1640s. They established several towns, including Southampton, East Hampton, and Southold.
In the late 19th century, Suffolk County became a popular destination for wealthy New Yorkers looking to escape the hustle and bustle of the city. The county was home to several large estates, including the Vanderbilt Estate in Southampton and the Woolworth Estate in East Hampton.
In the 20th century, Suffolk County experienced rapid population growth as people moved to the area for its beaches and rural lifestyle. The county also became a popular destination for retirees, and the population continues to grow today.
Geography
Suffolk County covers an area of 912 square miles, making it the largest county in New York. The county is divided into two distinct regions: the North Shore and the South Shore. The North Shore is home to the towns of Huntington, Smithtown, and Islip, while the South Shore is home to the towns of Brookhaven, Babylon, and Southampton.
The county is home to several bodies of water, including the Long Island Sound, the Great South Bay, and the Peconic Bay. The county also contains several parks, including the Fire Island National Seashore, the Sunken Meadow State Park, and the Montauk Point State Park.
Economy
Suffolk County has a diverse economy, with a mix of industries including agriculture, manufacturing, tourism, and technology. The county is home to several large companies, including Canon USA, Stony Brook University, and Brookhaven National Laboratory.
Agriculture is an important part of the county’s economy, with the county producing a variety of crops, including potatoes, corn, and tomatoes. The county is also home to several wineries, including the Macari Vineyards and the Wölffer Estate Vineyard.
Tourism is also an important part of the county’s economy, with the county’s beaches and parks attracting millions of visitors each year. The county is also home to several popular attractions, including the Long Island Aquarium and the Montauk Point Lighthouse.
Demographics
As of the 2010 census, Suffolk County had a population of 1,493,350. The population is made up of a diverse mix of ethnicities, including White (77.3%), Hispanic or Latino (14.2%), African American (7.2%), and Asian (4.3%).
The median household income in the county is $90,890, and the median home value is $400,000. The county has a high rate of homeownership, with 73.3% of households owning their own homes.
Conclusion
Suffolk County, New York is a diverse and vibrant county located on the eastern end of Long Island. The county is home to 1.5 million people, and its economy is made up of a mix of industries, including agriculture, manufacturing, tourism, and technology. The county is also home to several popular attractions, including the Long Island Aquarium and the Montauk Point Lighthouse. Suffolk County is a great place to live, work, and visit.
Common Questions
What is the Total Population of New Suffolk?
Total Population of New Suffolk is 305.
What is the Total Male Population of New Suffolk?
Total Male Population of New Suffolk is 154.
What is the Total Female Population of New Suffolk?
Total Female Population of New Suffolk is 151.
What is the Ratio of Males per 100 Females in New Suffolk?
There are 101.99 Males per 100 Females in New Suffolk.
What is the Ratio of Females per 100 Males in New Suffolk?
There are 98.05 Females per 100 Males in New Suffolk.
What is the Median Population Age in New Suffolk?
Median Population Age in New Suffolk is 58.8 Years.
What is the Average Family Size in New Suffolk
Average Family Size in New Suffolk is 2.6 People.
What is the Average Household Size in New Suffolk
Average Household Size in New Suffolk is 2.1 People.
What is Per Capita Income in New Suffolk?
Per Capita income in New Suffolk is $63,796.
What is the Median Family Income in New Suffolk?
Median Family Income in New Suffolk is $148,125.
What is the Median Household income in New Suffolk?
Median Household Income in New Suffolk is $106,042.
What is Inequality or Gini Index in New Suffolk?
Inequality or Gini Index in New Suffolk is 0.43.
How Large is the Labor Force in New Suffolk?
There are 127 People in the Labor Forcein in New Suffolk.
What is the Percentage of People in the Labor Force in New Suffolk?
45.4% of People are in the Labor Force in New Suffolk.