Nassau, NY
Nassau Map
Nassau Overview
1,169
TOTAL POPULATION
588
MALE POPULATION
581
FEMALE POPULATION
101.20
MALES / 100 FEMALES
98.81
FEMALES / 100 MALES
41.9
MEDIAN AGE
3.1
AVG FAMILY SIZE
2.5
AVG HOUSEHOLD SIZE
$36,351
PER CAPITA INCOME
$92,450
AVG FAMILY INCOME
$74,931
AVG HOUSEHOLD INCOME
26.0%
WAGE / INCOME GAP [ % ]
74.0¢/ $1
WAGE / INCOME GAP [ $ ]
0.41
INEQUALITY / GINI INDEX
672
LABOR FORCE [ PEOPLE ]
69.9%
PERCENT IN LABOR FORCE
11.4%
UNEMPLOYMENT RATE
Nassau Zip Codes
Nassau Area Codes
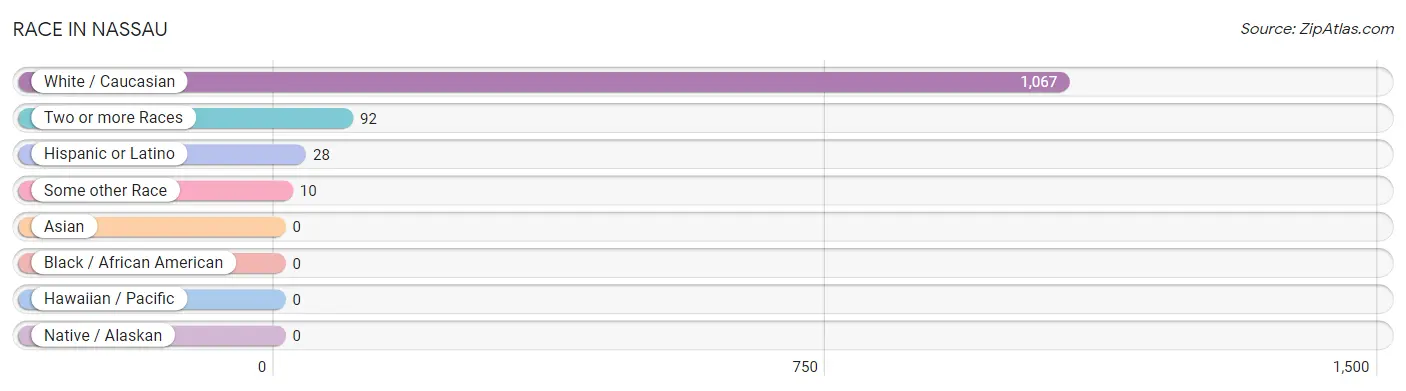
Race in Nassau
The most populous races in Nassau are White / Caucasian (1,067 | 91.3%), Two or more Races (92 | 7.9%), and Hispanic or Latino (28 | 2.4%).
| Race | # Population | % Population |
| Asian | 0 | 0.0% |
| Black / African American | 0 | 0.0% |
| Hawaiian / Pacific | 0 | 0.0% |
| Hispanic or Latino | 28 | 2.4% |
| Native / Alaskan | 0 | 0.0% |
| White / Caucasian | 1,067 | 91.3% |
| Two or more Races | 92 | 7.9% |
| Some other Race | 10 | 0.9% |
| Total | 1,169 | 100.0% |
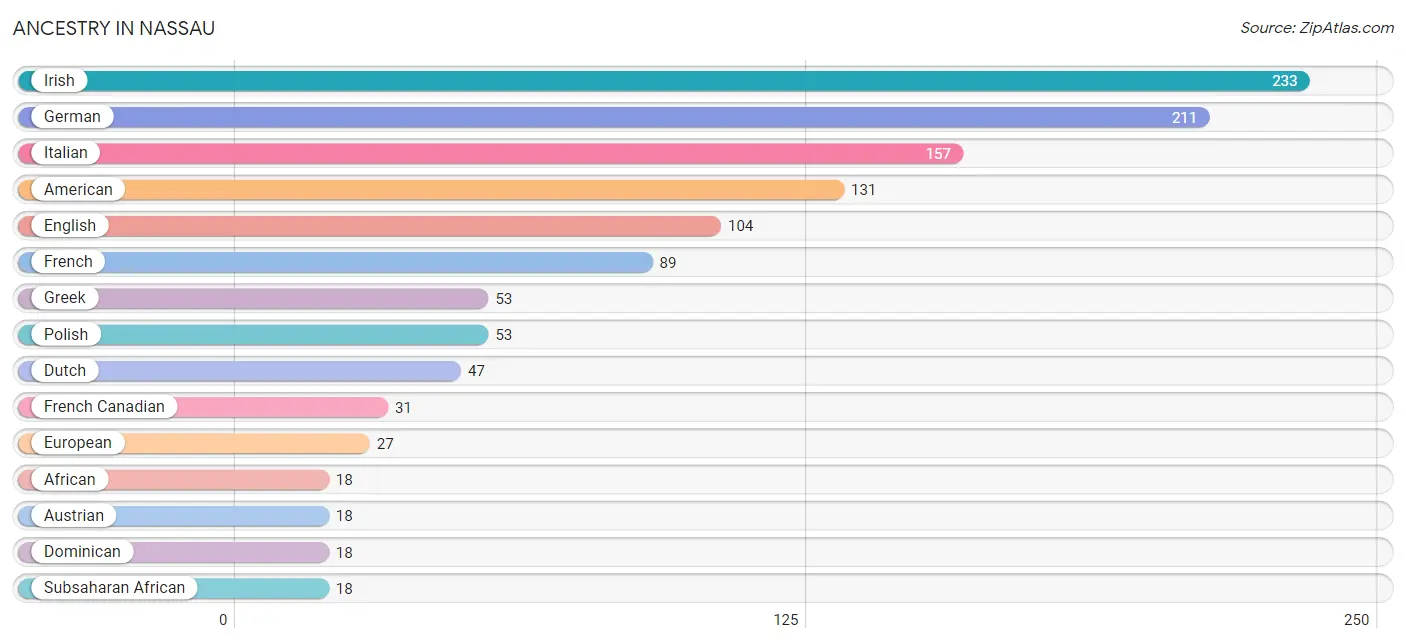
Ancestry in Nassau
The most populous ancestries reported in Nassau are Irish (233 | 19.9%), German (211 | 18.0%), Italian (157 | 13.4%), American (131 | 11.2%), and English (104 | 8.9%), together accounting for 71.5% of all Nassau residents.
| Ancestry | # Population | % Population |
| African | 18 | 1.5% |
| American | 131 | 11.2% |
| Austrian | 18 | 1.5% |
| Dominican | 18 | 1.5% |
| Dutch | 47 | 4.0% |
| Eastern European | 6 | 0.5% |
| English | 104 | 8.9% |
| European | 27 | 2.3% |
| French | 89 | 7.6% |
| French Canadian | 31 | 2.6% |
| German | 211 | 18.0% |
| Greek | 53 | 4.5% |
| Hungarian | 14 | 1.2% |
| Irish | 233 | 19.9% |
| Italian | 157 | 13.4% |
| Mexican | 5 | 0.4% |
| Norwegian | 9 | 0.8% |
| Polish | 53 | 4.5% |
| Portuguese | 4 | 0.3% |
| Puerto Rican | 5 | 0.4% |
| Russian | 2 | 0.2% |
| Scandinavian | 1 | 0.1% |
| Scotch-Irish | 5 | 0.4% |
| Scottish | 13 | 1.1% |
| Subsaharan African | 18 | 1.5% |
| Thai | 3 | 0.3% |
| Ukrainian | 5 | 0.4% |
| Welsh | 9 | 0.8% | View All 28 Rows |
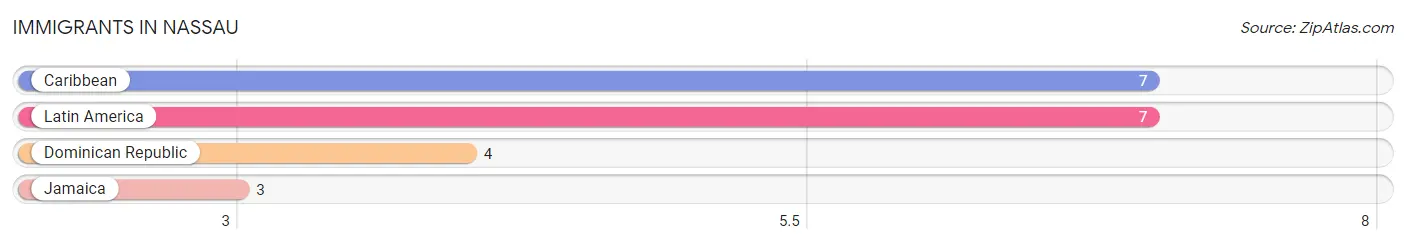
Immigrants in Nassau
The most numerous immigrant groups reported in Nassau came from Caribbean (7 | 0.6%), Latin America (7 | 0.6%), Dominican Republic (4 | 0.3%), and Jamaica (3 | 0.3%), together accounting for 1.8% of all Nassau residents.
| Immigration Origin | # Population | % Population |
| Caribbean | 7 | 0.6% |
| Dominican Republic | 4 | 0.3% |
| Jamaica | 3 | 0.3% |
| Latin America | 7 | 0.6% | View All 4 Rows |
Sex and Age in Nassau
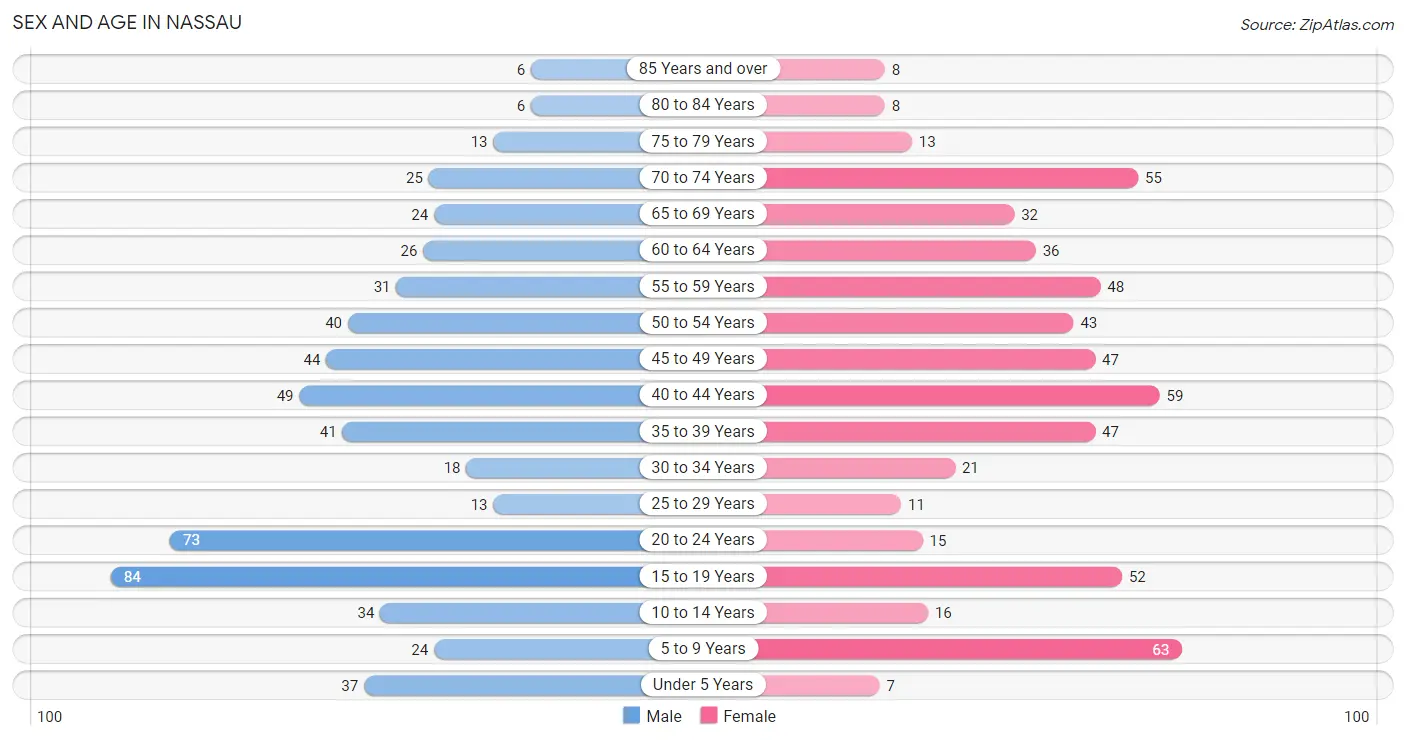
Sex and Age in Nassau
The most populous age groups in Nassau are 15 to 19 Years (84 | 14.3%) for men and 5 to 9 Years (63 | 10.8%) for women.
| Age Bracket | Male | Female |
| Under 5 Years | 37 (6.3%) | 7 (1.2%) |
| 5 to 9 Years | 24 (4.1%) | 63 (10.8%) |
| 10 to 14 Years | 34 (5.8%) | 16 (2.8%) |
| 15 to 19 Years | 84 (14.3%) | 52 (8.9%) |
| 20 to 24 Years | 73 (12.4%) | 15 (2.6%) |
| 25 to 29 Years | 13 (2.2%) | 11 (1.9%) |
| 30 to 34 Years | 18 (3.1%) | 21 (3.6%) |
| 35 to 39 Years | 41 (7.0%) | 47 (8.1%) |
| 40 to 44 Years | 49 (8.3%) | 59 (10.2%) |
| 45 to 49 Years | 44 (7.5%) | 47 (8.1%) |
| 50 to 54 Years | 40 (6.8%) | 43 (7.4%) |
| 55 to 59 Years | 31 (5.3%) | 48 (8.3%) |
| 60 to 64 Years | 26 (4.4%) | 36 (6.2%) |
| 65 to 69 Years | 24 (4.1%) | 32 (5.5%) |
| 70 to 74 Years | 25 (4.3%) | 55 (9.5%) |
| 75 to 79 Years | 13 (2.2%) | 13 (2.2%) |
| 80 to 84 Years | 6 (1.0%) | 8 (1.4%) |
| 85 Years and over | 6 (1.0%) | 8 (1.4%) |
| Total | 588 (100.0%) | 581 (100.0%) |
Families and Households in Nassau
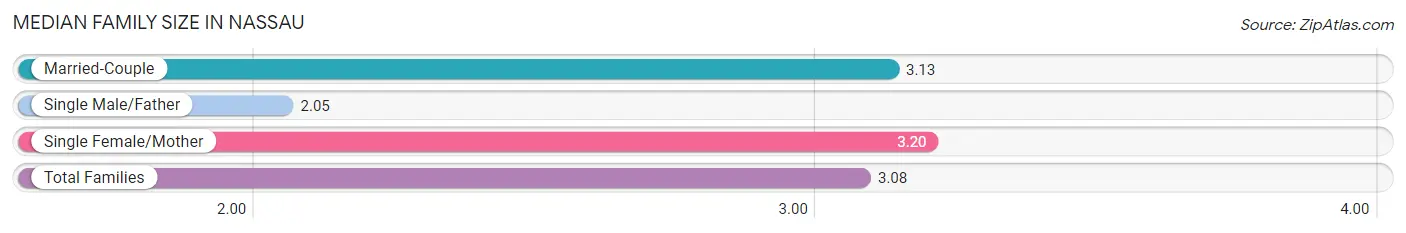
Median Family Size in Nassau
The median family size in Nassau is 3.08 persons per family, with single female/mother families (86 | 28.8%) accounting for the largest median family size of 3.2 persons per family. On the other hand, single male/father families (19 | 6.4%) represent the smallest median family size with 2.05 persons per family.
| Family Type | # Families | Family Size |
| Married-Couple | 194 (64.9%) | 3.13 |
| Single Male/Father | 19 (6.4%) | 2.05 |
| Single Female/Mother | 86 (28.8%) | 3.20 |
| Total Families | 299 (100.0%) | 3.08 |
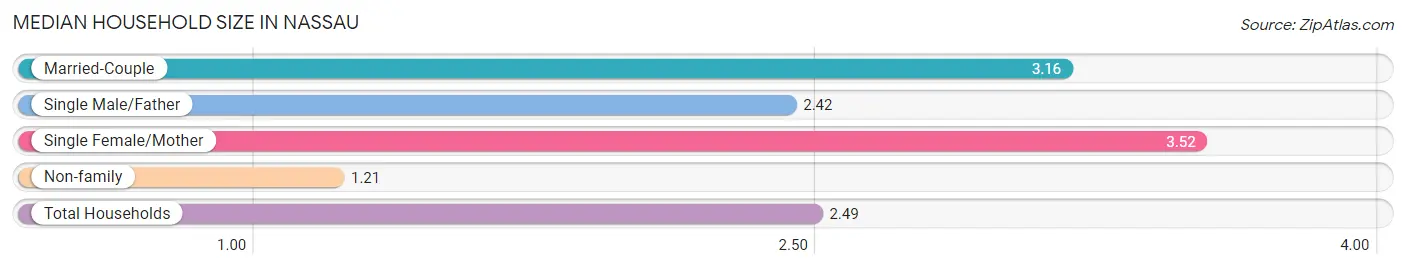
Median Household Size in Nassau
The median household size in Nassau is 2.49 persons per household, with single female/mother households (86 | 18.3%) accounting for the largest median household size of 3.52 persons per household. non-family households (170 | 36.2%) represent the smallest median household size with 1.21 persons per household.
| Household Type | # Households | Household Size |
| Married-Couple | 194 (41.4%) | 3.16 |
| Single Male/Father | 19 (4.1%) | 2.42 |
| Single Female/Mother | 86 (18.3%) | 3.52 |
| Non-family | 170 (36.2%) | 1.21 |
| Total Households | 469 (100.0%) | 2.49 |
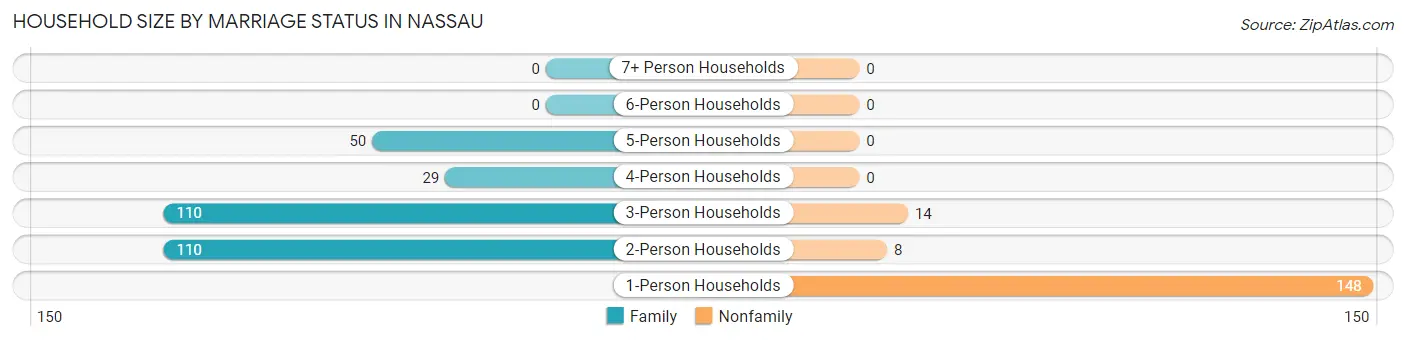
Household Size by Marriage Status in Nassau
Out of a total of 469 households in Nassau, 299 (63.7%) are family households, while 170 (36.2%) are nonfamily households. The most numerous type of family households are 2-person households, comprising 110, and the most common type of nonfamily households are 1-person households, comprising 148.
| Household Size | Family Households | Nonfamily Households |
| 1-Person Households | - | 148 (31.6%) |
| 2-Person Households | 110 (23.4%) | 8 (1.7%) |
| 3-Person Households | 110 (23.4%) | 14 (3.0%) |
| 4-Person Households | 29 (6.2%) | 0 (0.0%) |
| 5-Person Households | 50 (10.7%) | 0 (0.0%) |
| 6-Person Households | 0 (0.0%) | 0 (0.0%) |
| 7+ Person Households | 0 (0.0%) | 0 (0.0%) |
| Total | 299 (63.7%) | 170 (36.2%) |
Female Fertility in Nassau
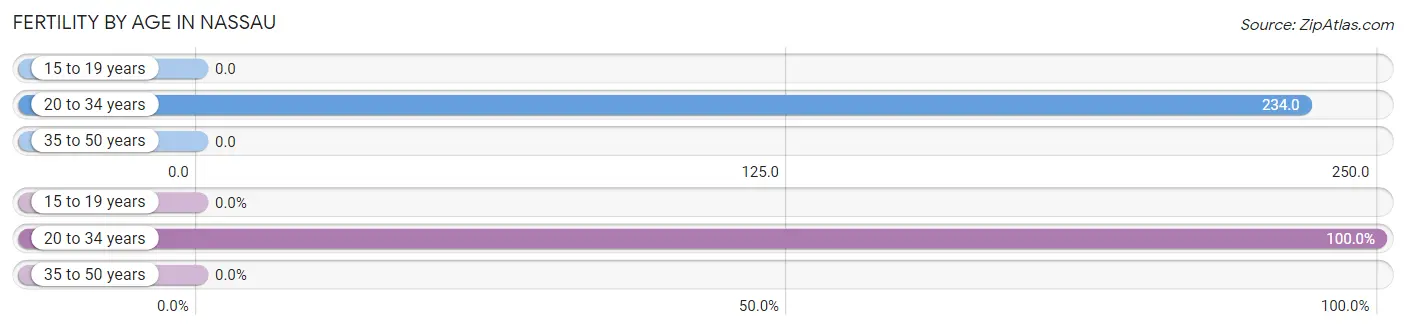
Fertility by Age in Nassau
Average fertility rate in Nassau is 42.0 births per 1,000 women. Women in the age bracket of 20 to 34 years have the highest fertility rate with 234.0 births per 1,000 women. Women in the age bracket of 20 to 34 years acount for 100.0% of all women with births.
| Age Bracket | Women with Births | Births / 1,000 Women |
| 15 to 19 years | 0 (0.0%) | 0.0 |
| 20 to 34 years | 11 (100.0%) | 234.0 |
| 35 to 50 years | 0 (0.0%) | 0.0 |
| Total | 11 (100.0%) | 42.0 |
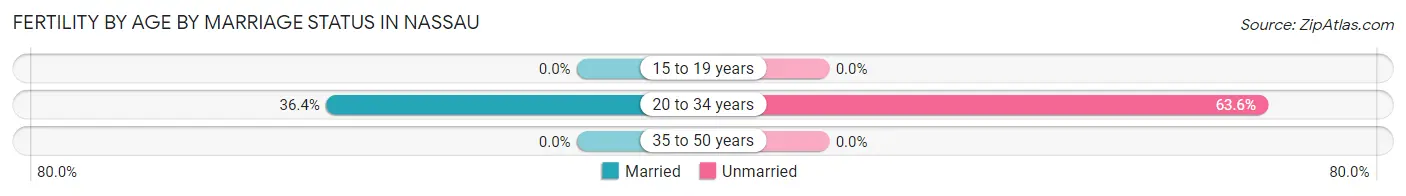
Fertility by Age by Marriage Status in Nassau
36.4% of women with births (11) in Nassau are married. The highest percentage of unmarried women with births falls into 20 to 34 years age bracket with 63.6% of them unmarried at the time of birth, while the lowest percentage of unmarried women with births belong to 20 to 34 years age bracket with 63.6% of them unmarried.
| Age Bracket | Married | Unmarried |
| 15 to 19 years | 0 (0.0%) | 0 (0.0%) |
| 20 to 34 years | 4 (36.4%) | 7 (63.6%) |
| 35 to 50 years | 0 (0.0%) | 0 (0.0%) |
| Total | 4 (36.4%) | 7 (63.6%) |
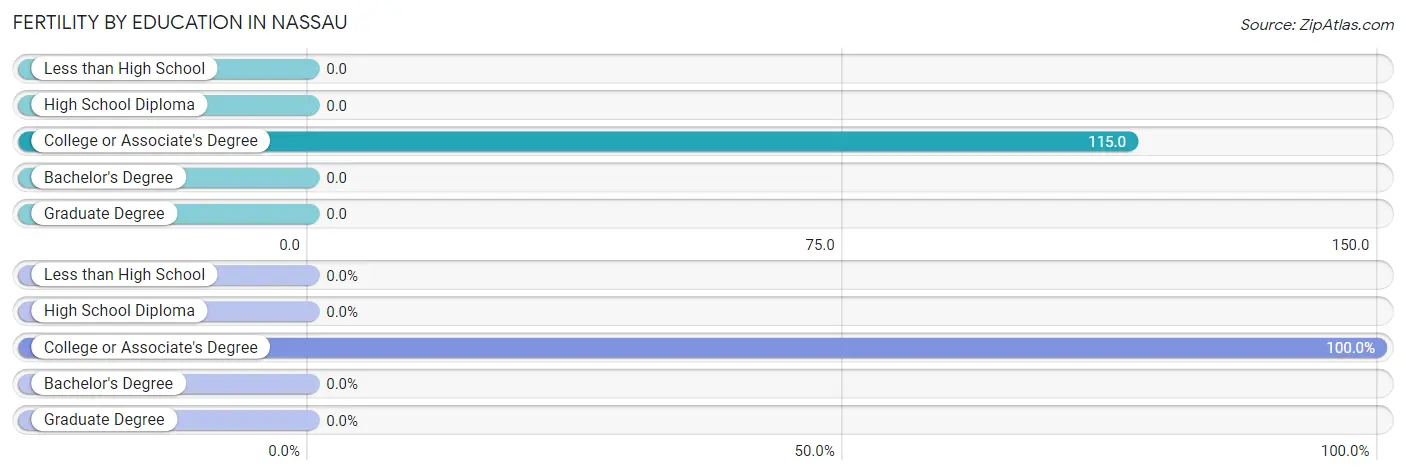
Fertility by Education in Nassau
| Educational Attainment | Women with Births | Births / 1,000 Women |
| Less than High School | 0 (0.0%) | 0.0 |
| High School Diploma | 0 (0.0%) | 0.0 |
| College or Associate's Degree | 11 (100.0%) | 115.0 |
| Bachelor's Degree | 0 (0.0%) | 0.0 |
| Graduate Degree | 0 (0.0%) | 0.0 |
| Total | 11 (100.0%) | 42.0 |
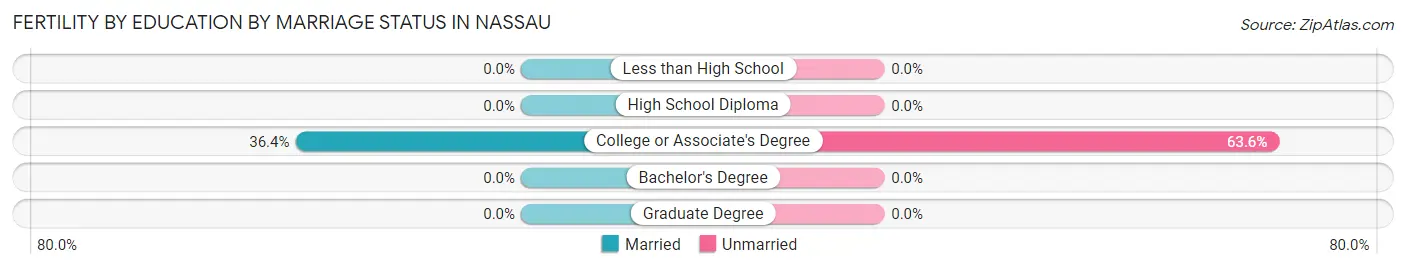
Fertility by Education by Marriage Status in Nassau
63.6% of women with births in Nassau are unmarried. Women with the educational attainment of college or associate's degree are most likely to be married with 36.4% of them married at childbirth, while women with the educational attainment of college or associate's degree are least likely to be married with 63.6% of them unmarried at childbirth.
| Educational Attainment | Married | Unmarried |
| Less than High School | 0 (0.0%) | 0 (0.0%) |
| High School Diploma | 0 (0.0%) | 0 (0.0%) |
| College or Associate's Degree | 4 (36.4%) | 7 (63.6%) |
| Bachelor's Degree | 0 (0.0%) | 0 (0.0%) |
| Graduate Degree | 0 (0.0%) | 0 (0.0%) |
| Total | 4 (36.4%) | 7 (63.6%) |
Income in Nassau
Income Overview in Nassau
Per Capita Income in Nassau is $36,351, while median incomes of families and households are $92,450 and $74,931 respectively.
| Characteristic | Number | Measure |
| Per Capita Income | 1,169 | $36,351 |
| Median Family Income | 299 | $92,450 |
| Mean Family Income | 299 | $102,074 |
| Median Household Income | 469 | $74,931 |
| Mean Household Income | 469 | $89,910 |
| Income Deficit | 299 | $0 |
| Wage / Income Gap (%) | 1,169 | 25.97% |
| Wage / Income Gap ($) | 1,169 | 74.03¢ per $1 |
| Gini / Inequality Index | 1,169 | 0.41 |
Earnings by Sex in Nassau
Average Earnings in Nassau are $39,688, $46,713 for men and $34,583 for women, a difference of 26.0%.
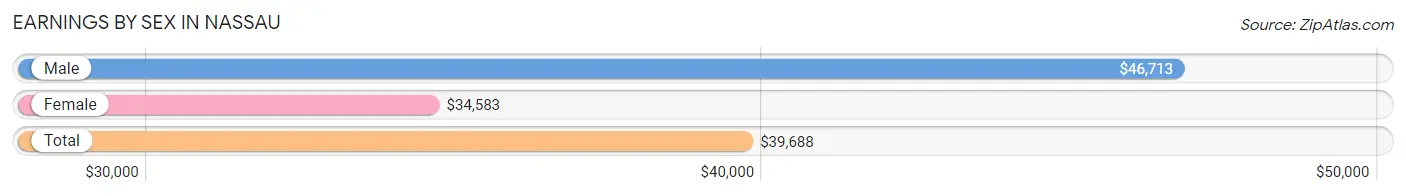
| Sex | Number | Average Earnings |
| Male | 371 (55.7%) | $46,713 |
| Female | 295 (44.3%) | $34,583 |
| Total | 666 (100.0%) | $39,688 |
Earnings by Sex by Income Bracket in Nassau
The most common earnings brackets in Nassau are $65,000 to $74,999 for men (46 | 12.4%) and $2,500 to $4,999 for women (52 | 17.6%).
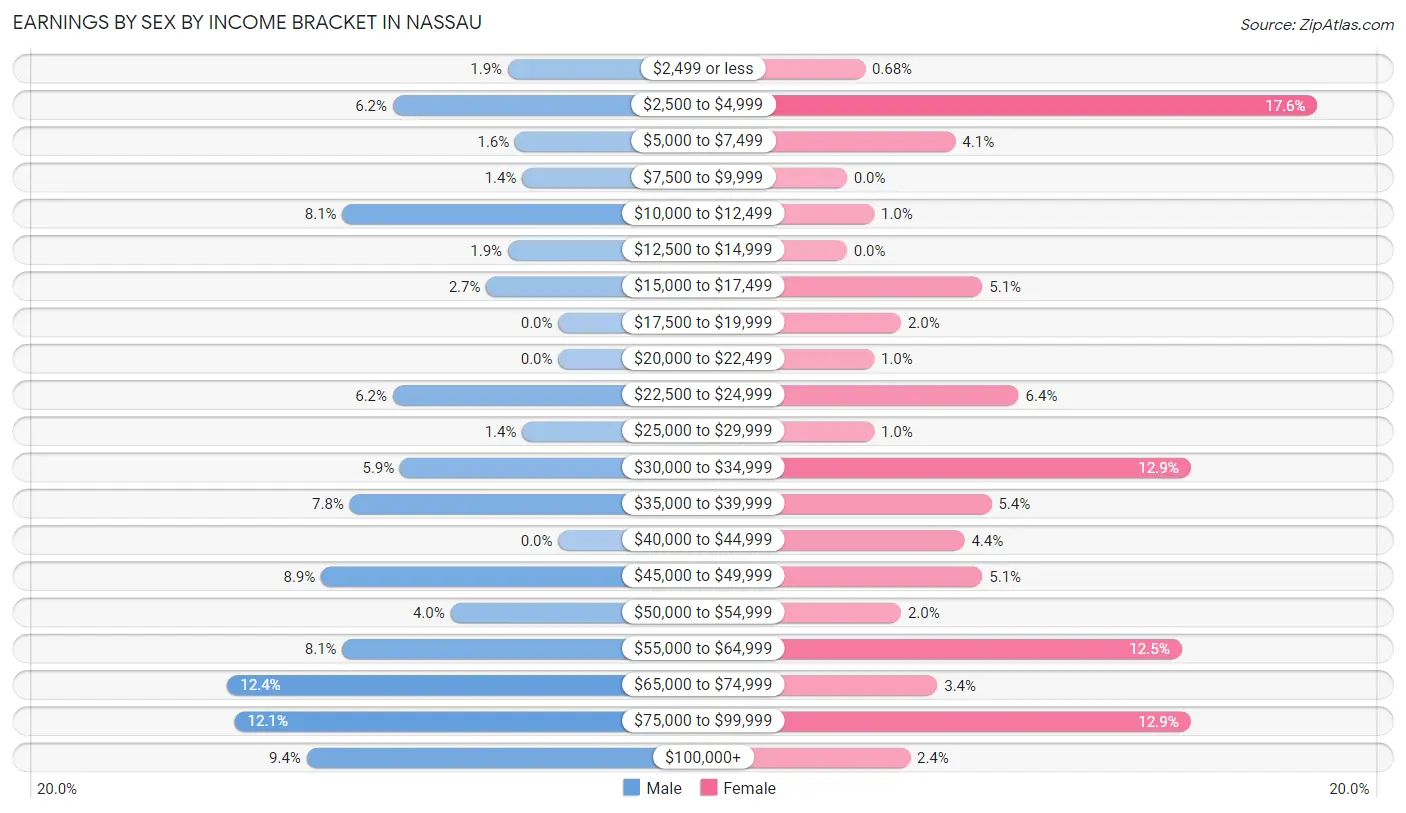
| Income | Male | Female |
| $2,499 or less | 7 (1.9%) | 2 (0.7%) |
| $2,500 to $4,999 | 23 (6.2%) | 52 (17.6%) |
| $5,000 to $7,499 | 6 (1.6%) | 12 (4.1%) |
| $7,500 to $9,999 | 5 (1.3%) | 0 (0.0%) |
| $10,000 to $12,499 | 30 (8.1%) | 3 (1.0%) |
| $12,500 to $14,999 | 7 (1.9%) | 0 (0.0%) |
| $15,000 to $17,499 | 10 (2.7%) | 15 (5.1%) |
| $17,500 to $19,999 | 0 (0.0%) | 6 (2.0%) |
| $20,000 to $22,499 | 0 (0.0%) | 3 (1.0%) |
| $22,500 to $24,999 | 23 (6.2%) | 19 (6.4%) |
| $25,000 to $29,999 | 5 (1.3%) | 3 (1.0%) |
| $30,000 to $34,999 | 22 (5.9%) | 38 (12.9%) |
| $35,000 to $39,999 | 29 (7.8%) | 16 (5.4%) |
| $40,000 to $44,999 | 0 (0.0%) | 13 (4.4%) |
| $45,000 to $49,999 | 33 (8.9%) | 15 (5.1%) |
| $50,000 to $54,999 | 15 (4.0%) | 6 (2.0%) |
| $55,000 to $64,999 | 30 (8.1%) | 37 (12.5%) |
| $65,000 to $74,999 | 46 (12.4%) | 10 (3.4%) |
| $75,000 to $99,999 | 45 (12.1%) | 38 (12.9%) |
| $100,000+ | 35 (9.4%) | 7 (2.4%) |
| Total | 371 (100.0%) | 295 (100.0%) |
Earnings by Sex by Educational Attainment in Nassau
Average earnings in Nassau are $57,917 for men and $40,156 for women, a difference of 30.7%. Men with an educational attainment of high school diploma enjoy the highest average annual earnings of $67,917, while those with college or associate's degree education earn the least with $46,750. Women with an educational attainment of graduate degree earn the most with the average annual earnings of $66,250, while those with high school diploma education have the smallest earnings of $33,068.
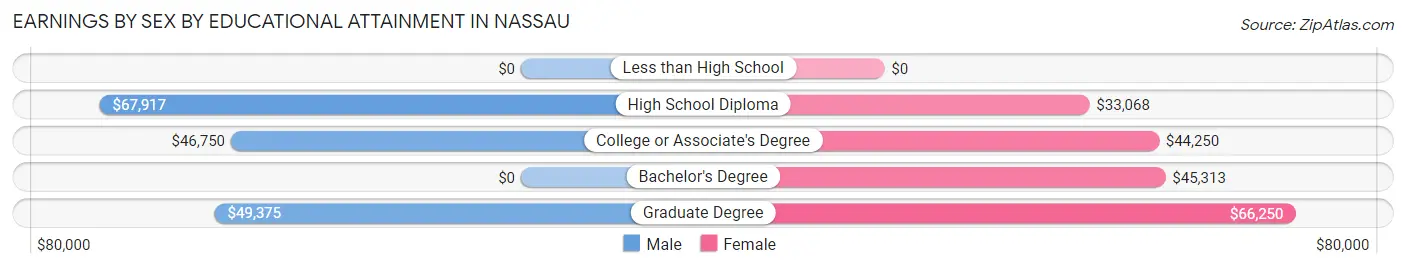
| Educational Attainment | Male Income | Female Income |
| Less than High School | - | - |
| High School Diploma | $67,917 | $33,068 |
| College or Associate's Degree | $46,750 | $44,250 |
| Bachelor's Degree | - | - |
| Graduate Degree | $49,375 | $66,250 |
| Total | $57,917 | $40,156 |
Family Income in Nassau
Family Income Brackets in Nassau
According to the Nassau family income data, there are 99 families falling into the $100,000 to $149,999 income range, which is the most common income bracket and makes up 33.1% of all families.
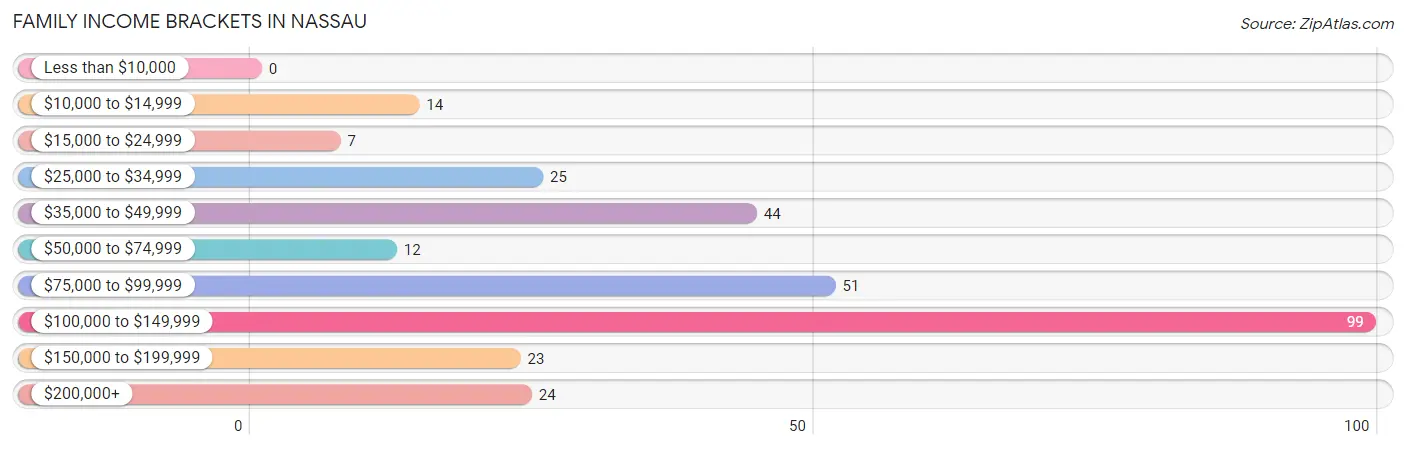
| Income Bracket | # Families | % Families |
| Less than $10,000 | 0 | 0.0% |
| $10,000 to $14,999 | 14 | 4.7% |
| $15,000 to $24,999 | 7 | 2.3% |
| $25,000 to $34,999 | 25 | 8.4% |
| $35,000 to $49,999 | 44 | 14.7% |
| $50,000 to $74,999 | 12 | 4.0% |
| $75,000 to $99,999 | 51 | 17.1% |
| $100,000 to $149,999 | 99 | 33.1% |
| $150,000 to $199,999 | 23 | 7.7% |
| $200,000+ | 24 | 8.0% |
Family Income by Famaliy Size in Nassau
4-person families (47 | 15.7%) account for the highest median family income in Nassau with $145,234 per family, while 4-person families (47 | 15.7%) have the highest median income of $36,308 per family member.
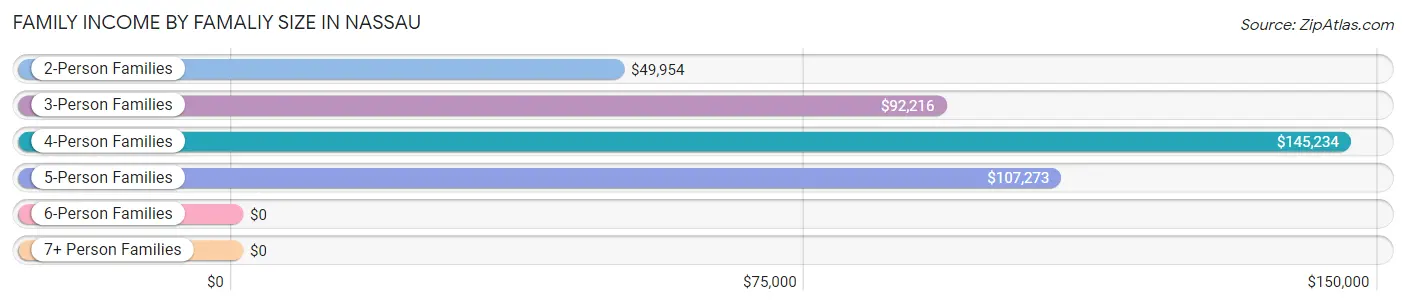
| Income Bracket | # Families | Median Income |
| 2-Person Families | 137 (45.8%) | $49,954 |
| 3-Person Families | 87 (29.1%) | $92,216 |
| 4-Person Families | 47 (15.7%) | $145,234 |
| 5-Person Families | 28 (9.4%) | $107,273 |
| 6-Person Families | 0 (0.0%) | $0 |
| 7+ Person Families | 0 (0.0%) | $0 |
| Total | 299 (100.0%) | $92,450 |
Family Income by Number of Earners in Nassau
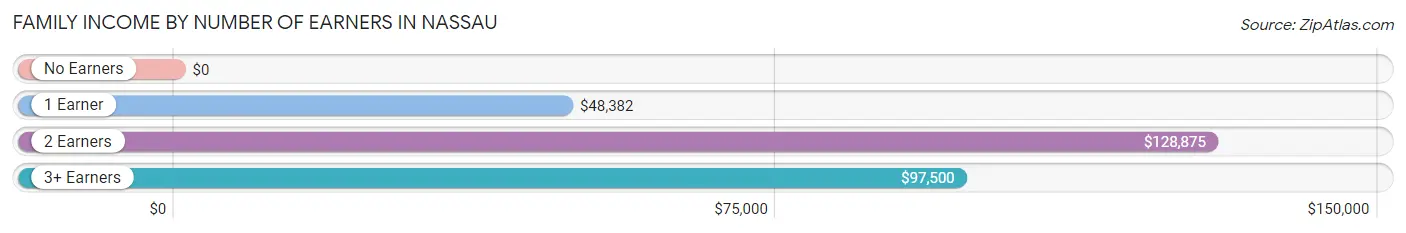
| Number of Earners | # Families | Median Income |
| No Earners | 40 (13.4%) | $0 |
| 1 Earner | 78 (26.1%) | $48,382 |
| 2 Earners | 141 (47.2%) | $128,875 |
| 3+ Earners | 40 (13.4%) | $97,500 |
| Total | 299 (100.0%) | $92,450 |
Household Income in Nassau
Household Income Brackets in Nassau
With 105 households falling in the category, the $100,000 to $149,999 income range is the most frequent in Nassau, accounting for 22.4% of all households. In contrast, only 7 households (1.5%) fall into the less than $10,000 income bracket, making it the least populous group.
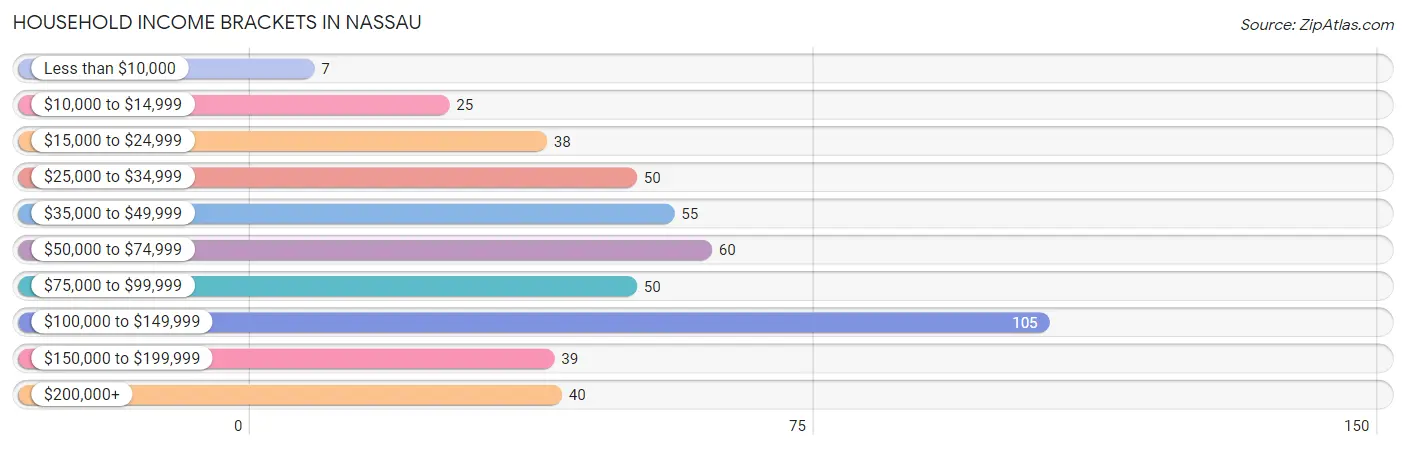
| Income Bracket | # Households | % Households |
| Less than $10,000 | 7 | 1.5% |
| $10,000 to $14,999 | 25 | 5.3% |
| $15,000 to $24,999 | 38 | 8.1% |
| $25,000 to $34,999 | 50 | 10.7% |
| $35,000 to $49,999 | 55 | 11.7% |
| $50,000 to $74,999 | 60 | 12.8% |
| $75,000 to $99,999 | 50 | 10.7% |
| $100,000 to $149,999 | 105 | 22.4% |
| $150,000 to $199,999 | 39 | 8.3% |
| $200,000+ | 40 | 8.5% |
Household Income by Householder Age in Nassau
The median household income in Nassau is $74,931, with the highest median household income of $90,417 found in the 25 to 44 years age bracket for the primary householder. A total of 147 households (31.3%) fall into this category. Meanwhile, the 15 to 24 years age bracket for the primary householder has the lowest median household income of $0, with 15 households (3.2%) in this group.
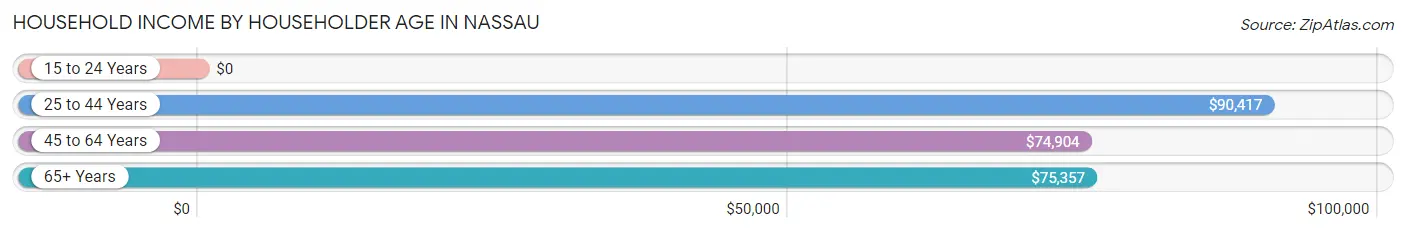
| Income Bracket | # Households | Median Income |
| 15 to 24 Years | 15 (3.2%) | $0 |
| 25 to 44 Years | 147 (31.3%) | $90,417 |
| 45 to 64 Years | 187 (39.9%) | $74,904 |
| 65+ Years | 120 (25.6%) | $75,357 |
| Total | 469 (100.0%) | $74,931 |
Poverty in Nassau
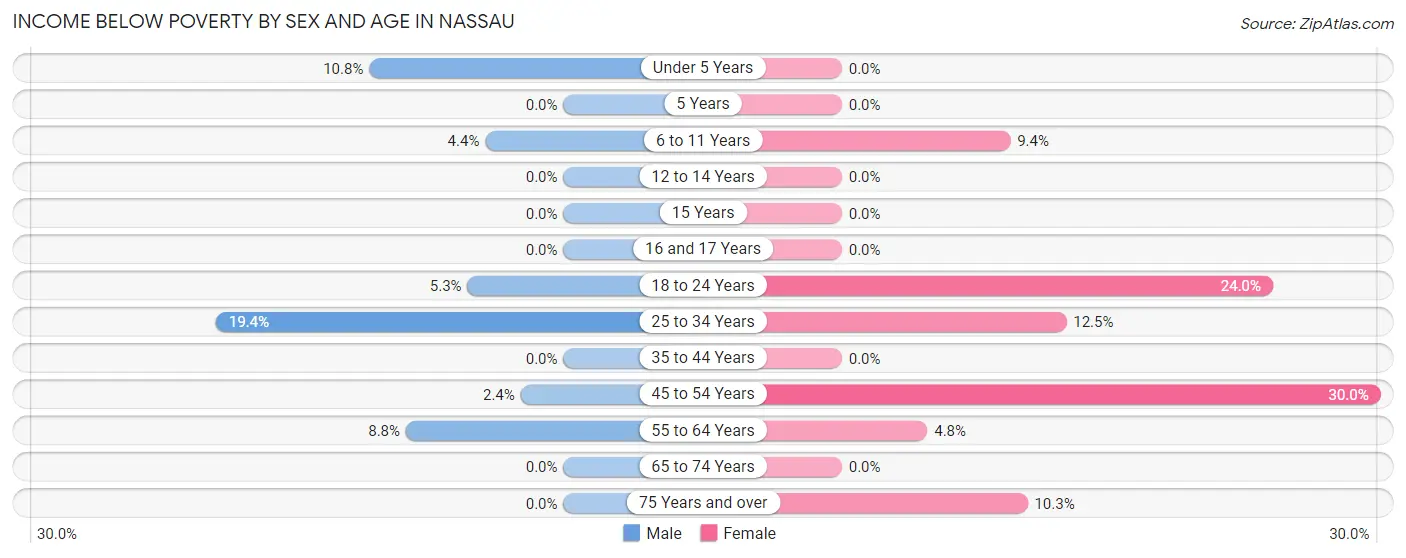
Income Below Poverty by Sex and Age in Nassau
With 4.4% poverty level for males and 9.6% for females among the residents of Nassau, 25 to 34 year old males and 45 to 54 year old females are the most vulnerable to poverty, with 6 males (19.4%) and 27 females (30.0%) in their respective age groups living below the poverty level.
| Age Bracket | Male | Female |
| Under 5 Years | 4 (10.8%) | 0 (0.0%) |
| 5 Years | 0 (0.0%) | 0 (0.0%) |
| 6 to 11 Years | 2 (4.3%) | 3 (9.4%) |
| 12 to 14 Years | 0 (0.0%) | 0 (0.0%) |
| 15 Years | 0 (0.0%) | 0 (0.0%) |
| 16 and 17 Years | 0 (0.0%) | 0 (0.0%) |
| 18 to 24 Years | 7 (5.3%) | 12 (24.0%) |
| 25 to 34 Years | 6 (19.4%) | 4 (12.5%) |
| 35 to 44 Years | 0 (0.0%) | 0 (0.0%) |
| 45 to 54 Years | 2 (2.4%) | 27 (30.0%) |
| 55 to 64 Years | 5 (8.8%) | 4 (4.8%) |
| 65 to 74 Years | 0 (0.0%) | 0 (0.0%) |
| 75 Years and over | 0 (0.0%) | 3 (10.3%) |
| Total | 26 (4.4%) | 53 (9.6%) |
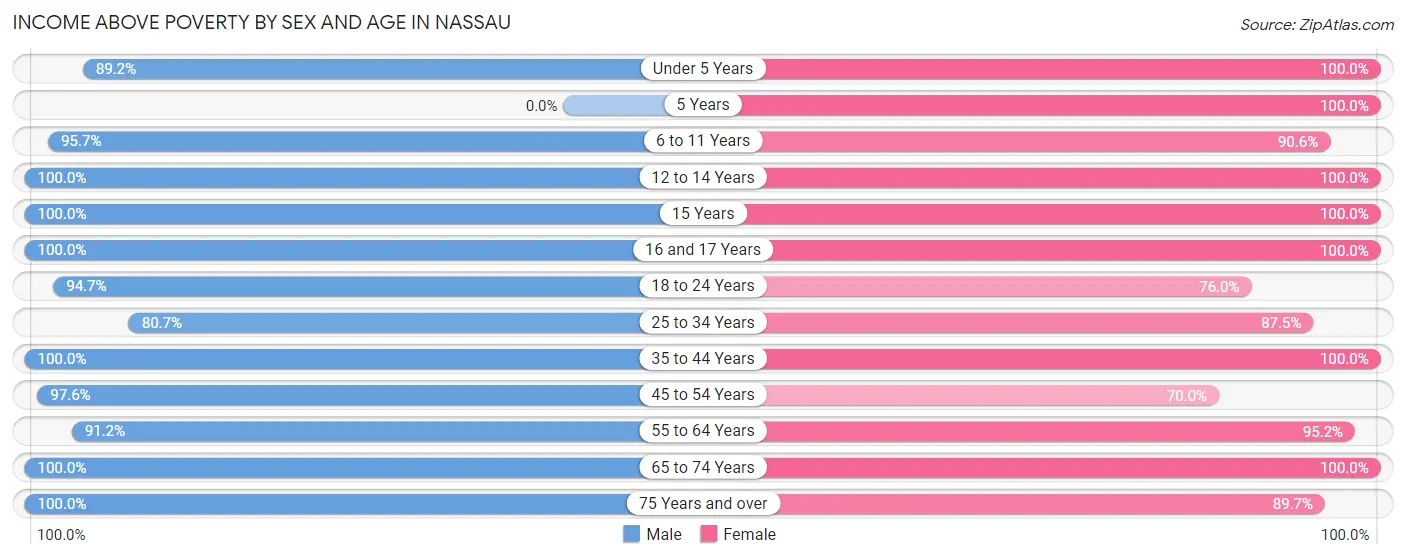
Income Above Poverty by Sex and Age in Nassau
According to the poverty statistics in Nassau, males aged 12 to 14 years and females aged under 5 years are the age groups that are most secure financially, with 100.0% of males and 100.0% of females in these age groups living above the poverty line.
| Age Bracket | Male | Female |
| Under 5 Years | 33 (89.2%) | 7 (100.0%) |
| 5 Years | 0 (0.0%) | 9 (100.0%) |
| 6 to 11 Years | 44 (95.7%) | 29 (90.6%) |
| 12 to 14 Years | 12 (100.0%) | 12 (100.0%) |
| 15 Years | 20 (100.0%) | 7 (100.0%) |
| 16 and 17 Years | 6 (100.0%) | 10 (100.0%) |
| 18 to 24 Years | 124 (94.7%) | 38 (76.0%) |
| 25 to 34 Years | 25 (80.6%) | 28 (87.5%) |
| 35 to 44 Years | 90 (100.0%) | 106 (100.0%) |
| 45 to 54 Years | 82 (97.6%) | 63 (70.0%) |
| 55 to 64 Years | 52 (91.2%) | 80 (95.2%) |
| 65 to 74 Years | 49 (100.0%) | 87 (100.0%) |
| 75 Years and over | 25 (100.0%) | 26 (89.7%) |
| Total | 562 (95.6%) | 502 (90.4%) |
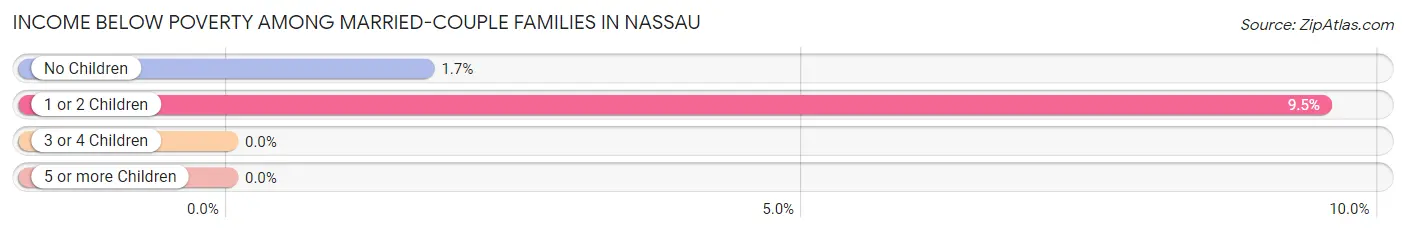
Income Below Poverty Among Married-Couple Families in Nassau
The poverty statistics for married-couple families in Nassau show that 4.1% or 8 of the total 194 families live below the poverty line. Families with 1 or 2 children have the highest poverty rate of 9.5%, comprising of 6 families. On the other hand, families with 3 or 4 children have the lowest poverty rate of 0.0%, which includes 0 families.
| Children | Above Poverty | Below Poverty |
| No Children | 115 (98.3%) | 2 (1.7%) |
| 1 or 2 Children | 57 (90.5%) | 6 (9.5%) |
| 3 or 4 Children | 14 (100.0%) | 0 (0.0%) |
| 5 or more Children | 0 (0.0%) | 0 (0.0%) |
| Total | 186 (95.9%) | 8 (4.1%) |
Income Below Poverty Among Single-Parent Households in Nassau
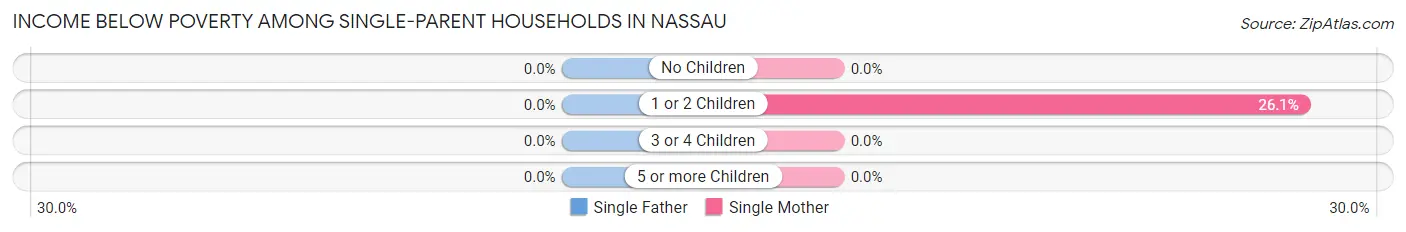
| Children | Single Father | Single Mother |
| No Children | 0 (0.0%) | 0 (0.0%) |
| 1 or 2 Children | 0 (0.0%) | 12 (26.1%) |
| 3 or 4 Children | 0 (0.0%) | 0 (0.0%) |
| 5 or more Children | 0 (0.0%) | 0 (0.0%) |
| Total | 0 (0.0%) | 12 (14.0%) |
Income Below Poverty Among Married-Couple vs Single-Parent Households in Nassau
The poverty data for Nassau shows that 8 of the married-couple family households (4.1%) and 12 of the single-parent households (11.4%) are living below the poverty level. Within the married-couple family households, those with 1 or 2 children have the highest poverty rate, with 6 households (9.5%) falling below the poverty line. Among the single-parent households, those with 1 or 2 children have the highest poverty rate, with 12 household (22.2%) living below poverty.
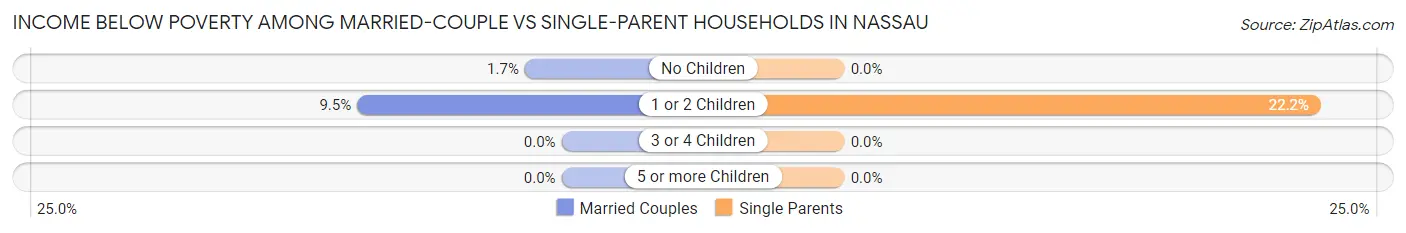
| Children | Married-Couple Families | Single-Parent Households |
| No Children | 2 (1.7%) | 0 (0.0%) |
| 1 or 2 Children | 6 (9.5%) | 12 (22.2%) |
| 3 or 4 Children | 0 (0.0%) | 0 (0.0%) |
| 5 or more Children | 0 (0.0%) | 0 (0.0%) |
| Total | 8 (4.1%) | 12 (11.4%) |
Employment Characteristics in Nassau
Employment by Class of Employer in Nassau
Among the 563 employed individuals in Nassau, private company employees (297 | 52.7%), local government employees (76 | 13.5%), and self-employed (incorporated) (66 | 11.7%) make up the most common classes of employment.
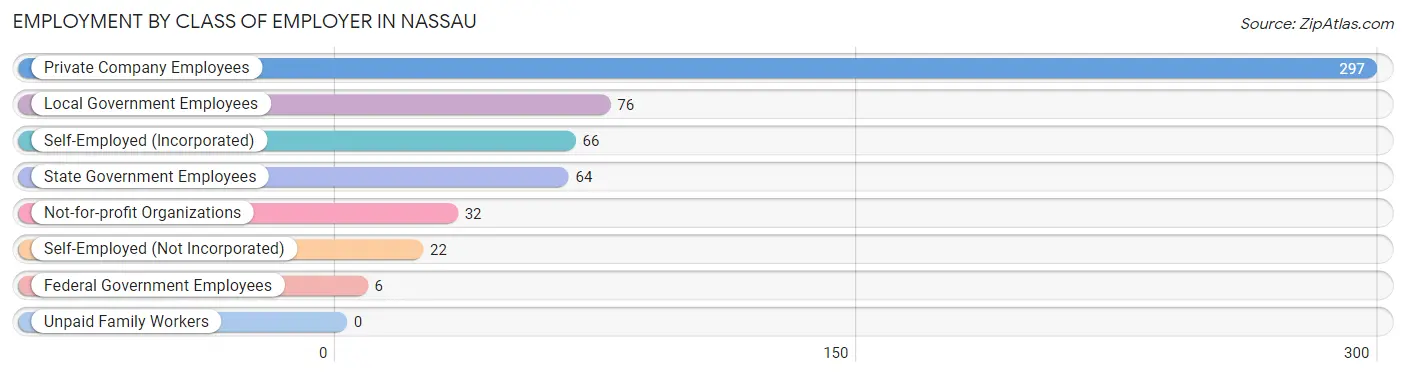
| Employer Class | # Employees | % Employees |
| Private Company Employees | 297 | 52.7% |
| Self-Employed (Incorporated) | 66 | 11.7% |
| Self-Employed (Not Incorporated) | 22 | 3.9% |
| Not-for-profit Organizations | 32 | 5.7% |
| Local Government Employees | 76 | 13.5% |
| State Government Employees | 64 | 11.4% |
| Federal Government Employees | 6 | 1.1% |
| Unpaid Family Workers | 0 | 0.0% |
| Total | 563 | 100.0% |
Employment Status by Age in Nassau
According to the labor force statistics for Nassau, out of the total population over 16 years of age (961), 69.9% or 672 individuals are in the labor force, with 11.4% or 77 of them unemployed. The age group with the highest labor force participation rate is 25 to 29 years, with 100.0% or 24 individuals in the labor force. Within the labor force, the 16 to 19 years age range has the highest percentage of unemployed individuals, with 43.9% or 29 of them being unemployed.
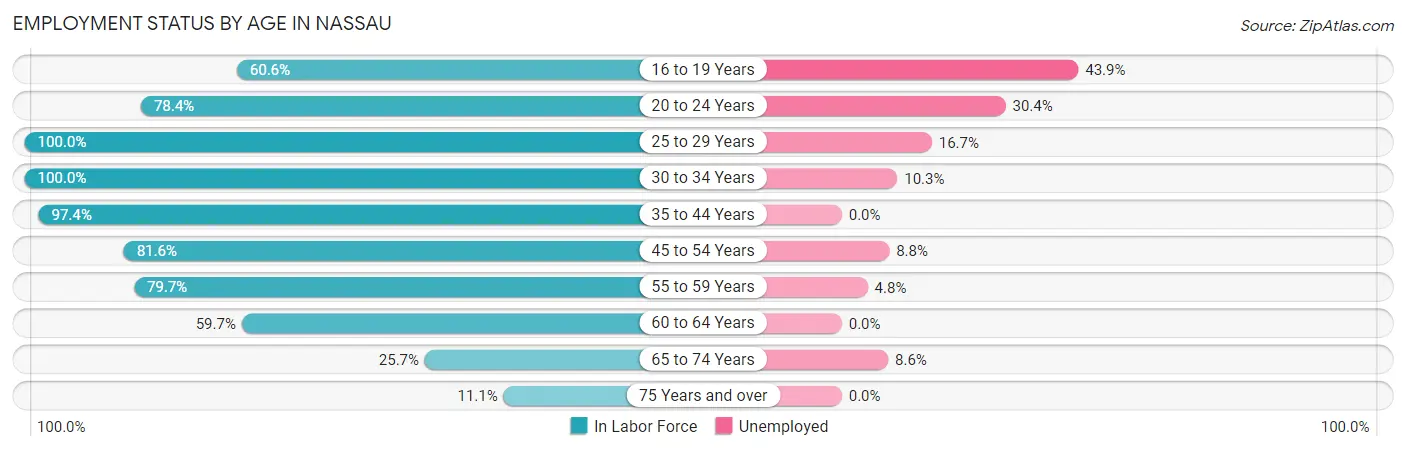
| Age Bracket | In Labor Force | Unemployed |
| 16 to 19 Years | 66 (60.6%) | 29 (43.9%) |
| 20 to 24 Years | 69 (78.4%) | 21 (30.4%) |
| 25 to 29 Years | 24 (100.0%) | 4 (16.7%) |
| 30 to 34 Years | 39 (100.0%) | 4 (10.3%) |
| 35 to 44 Years | 191 (97.4%) | 0 (0.0%) |
| 45 to 54 Years | 142 (81.6%) | 12 (8.8%) |
| 55 to 59 Years | 63 (79.7%) | 3 (4.8%) |
| 60 to 64 Years | 37 (59.7%) | 0 (0.0%) |
| 65 to 74 Years | 35 (25.7%) | 3 (8.6%) |
| 75 Years and over | 6 (11.1%) | 0 (0.0%) |
| Total | 672 (69.9%) | 77 (11.4%) |
Employment Status by Educational Attainment in Nassau
According to labor force statistics for Nassau, 86.4% of individuals (496) out of the total population between 25 and 64 years of age (574) are in the labor force, with 4.7% or 23 of them being unemployed. The group with the highest labor force participation rate are those with the educational attainment of bachelor's degree or higher, with 97.8% or 176 individuals in the labor force. Within the labor force, individuals with bachelor's degree or higher education have the highest percentage of unemployment, with 7.0% or 12 of them being unemployed.
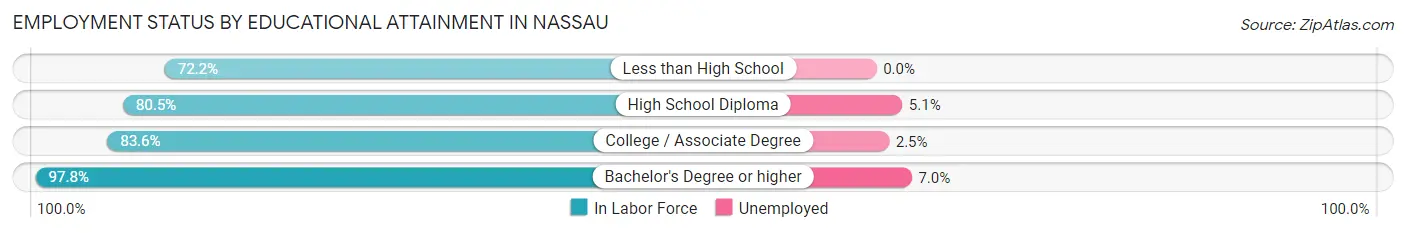
| Educational Attainment | In Labor Force | Unemployed |
| Less than High School | 26 (72.2%) | 0 (0.0%) |
| High School Diploma | 136 (80.5%) | 9 (5.1%) |
| College / Associate Degree | 158 (83.6%) | 5 (2.5%) |
| Bachelor's Degree or higher | 176 (97.8%) | 13 (7.0%) |
| Total | 496 (86.4%) | 27 (4.7%) |
Employment Occupations by Sex in Nassau
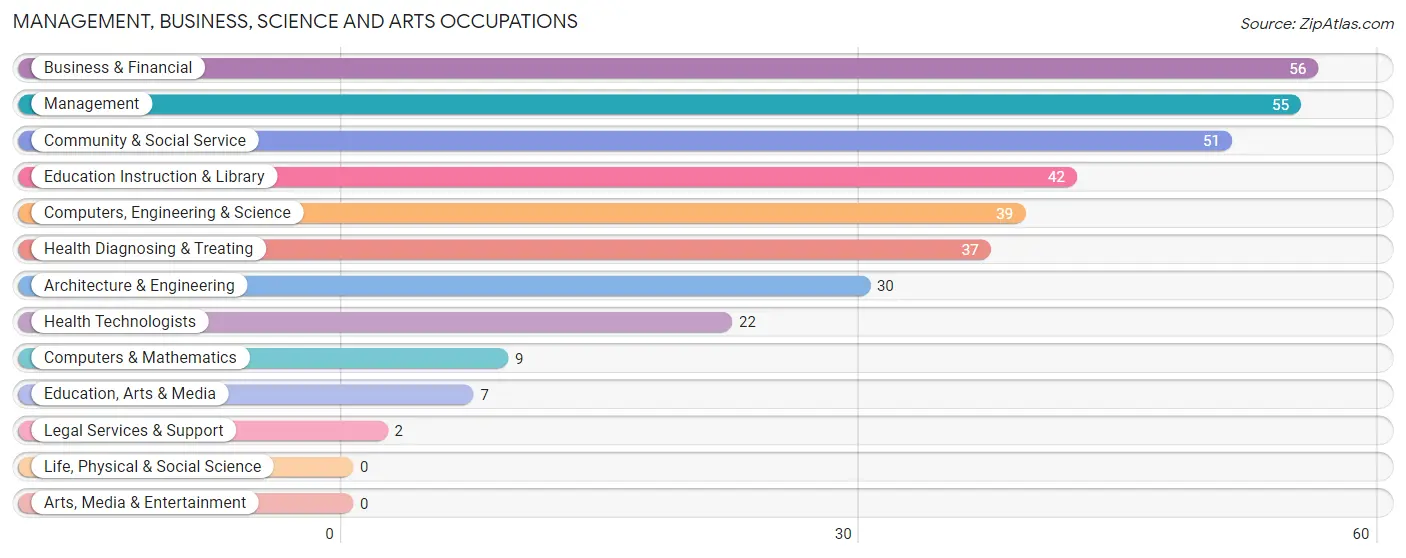
Management, Business, Science and Arts Occupations
The most common Management, Business, Science and Arts occupations in Nassau are Business & Financial (56 | 9.5%), Management (55 | 9.3%), Community & Social Service (51 | 8.6%), Education Instruction & Library (42 | 7.1%), and Computers, Engineering & Science (39 | 6.6%).
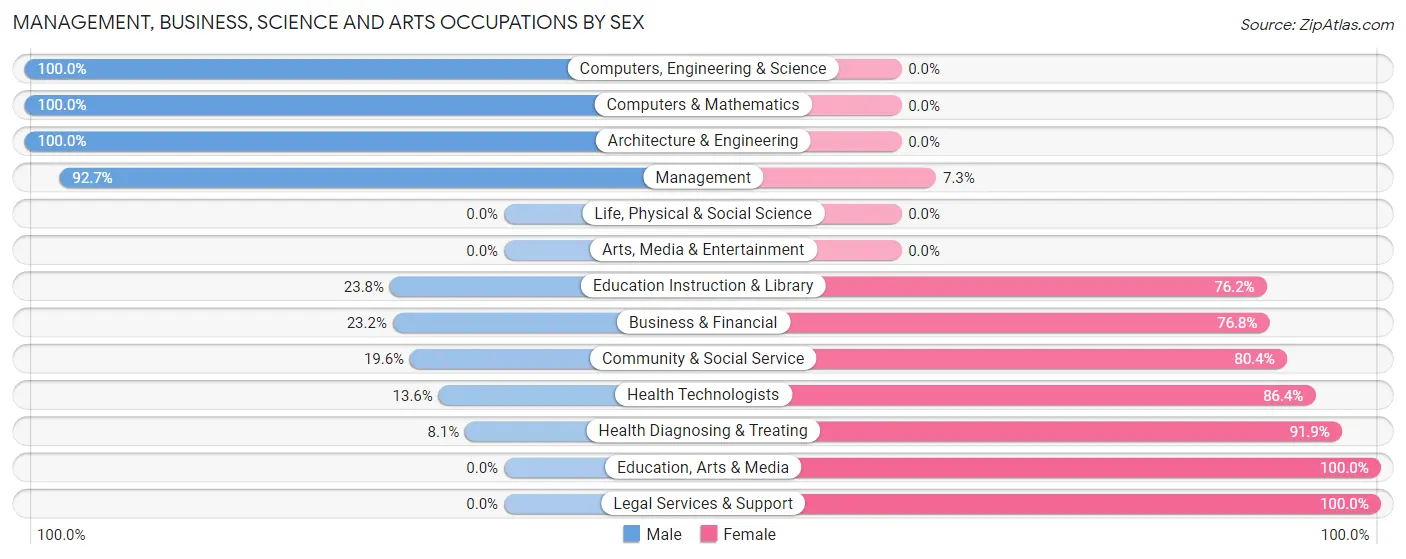
Management, Business, Science and Arts Occupations by Sex
Within the Management, Business, Science and Arts occupations in Nassau, the most male-oriented occupations are Computers, Engineering & Science (100.0%), Computers & Mathematics (100.0%), and Architecture & Engineering (100.0%), while the most female-oriented occupations are Education, Arts & Media (100.0%), Legal Services & Support (100.0%), and Health Diagnosing & Treating (91.9%).
| Occupation | Male | Female |
| Management | 51 (92.7%) | 4 (7.3%) |
| Business & Financial | 13 (23.2%) | 43 (76.8%) |
| Computers, Engineering & Science | 39 (100.0%) | 0 (0.0%) |
| Computers & Mathematics | 9 (100.0%) | 0 (0.0%) |
| Architecture & Engineering | 30 (100.0%) | 0 (0.0%) |
| Life, Physical & Social Science | 0 (0.0%) | 0 (0.0%) |
| Community & Social Service | 10 (19.6%) | 41 (80.4%) |
| Education, Arts & Media | 0 (0.0%) | 7 (100.0%) |
| Legal Services & Support | 0 (0.0%) | 2 (100.0%) |
| Education Instruction & Library | 10 (23.8%) | 32 (76.2%) |
| Arts, Media & Entertainment | 0 (0.0%) | 0 (0.0%) |
| Health Diagnosing & Treating | 3 (8.1%) | 34 (91.9%) |
| Health Technologists | 3 (13.6%) | 19 (86.4%) |
| Total (Category) | 116 (48.7%) | 122 (51.3%) |
| Total (Overall) | 311 (52.6%) | 280 (47.4%) |
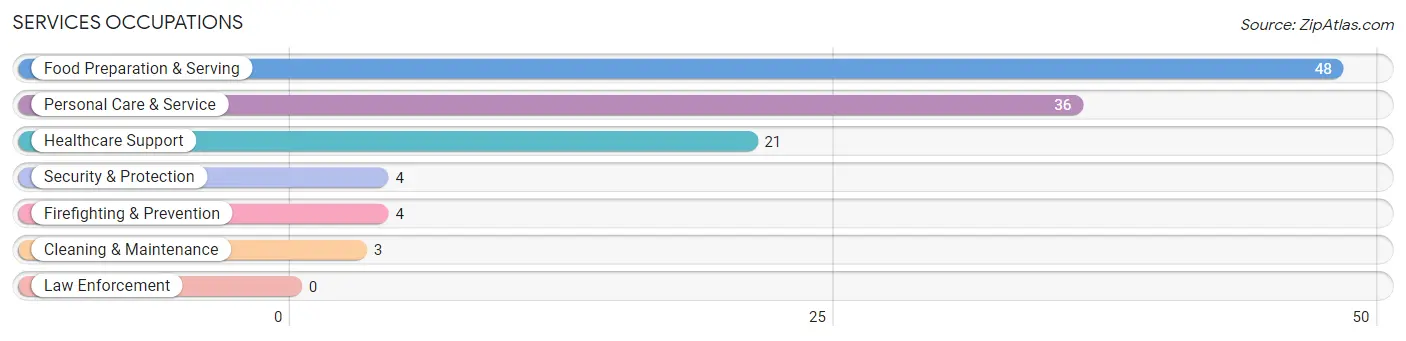
Services Occupations
The most common Services occupations in Nassau are Food Preparation & Serving (48 | 8.1%), Personal Care & Service (36 | 6.1%), Healthcare Support (21 | 3.5%), Security & Protection (4 | 0.7%), and Firefighting & Prevention (4 | 0.7%).
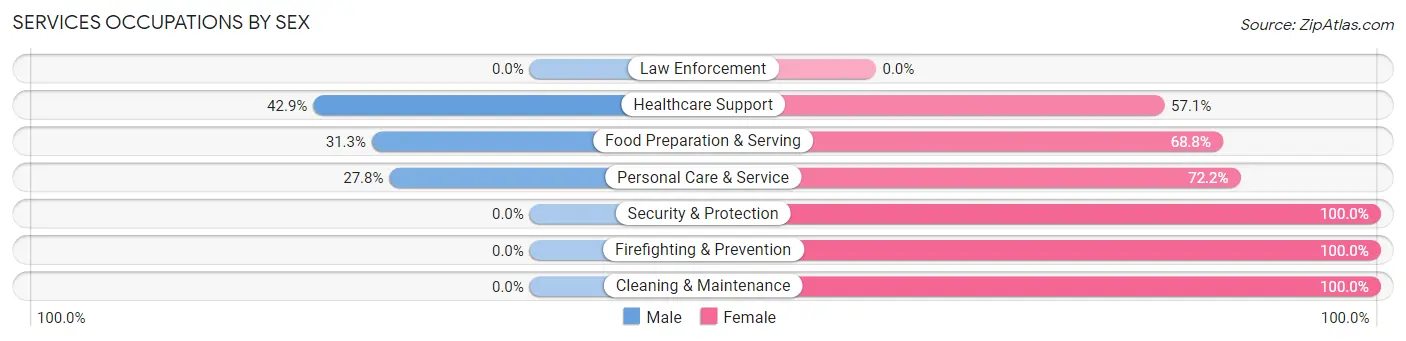
Services Occupations by Sex
Within the Services occupations in Nassau, the most male-oriented occupations are Healthcare Support (42.9%), Food Preparation & Serving (31.2%), and Personal Care & Service (27.8%), while the most female-oriented occupations are Security & Protection (100.0%), Firefighting & Prevention (100.0%), and Cleaning & Maintenance (100.0%).
| Occupation | Male | Female |
| Healthcare Support | 9 (42.9%) | 12 (57.1%) |
| Security & Protection | 0 (0.0%) | 4 (100.0%) |
| Firefighting & Prevention | 0 (0.0%) | 4 (100.0%) |
| Law Enforcement | 0 (0.0%) | 0 (0.0%) |
| Food Preparation & Serving | 15 (31.2%) | 33 (68.8%) |
| Cleaning & Maintenance | 0 (0.0%) | 3 (100.0%) |
| Personal Care & Service | 10 (27.8%) | 26 (72.2%) |
| Total (Category) | 34 (30.4%) | 78 (69.6%) |
| Total (Overall) | 311 (52.6%) | 280 (47.4%) |
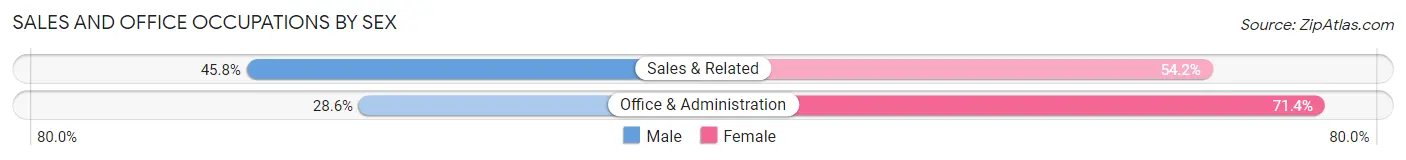
Sales and Office Occupations
The most common Sales and Office occupations in Nassau are Office & Administration (63 | 10.7%), and Sales & Related (48 | 8.1%).

Sales and Office Occupations by Sex
| Occupation | Male | Female |
| Sales & Related | 22 (45.8%) | 26 (54.2%) |
| Office & Administration | 18 (28.6%) | 45 (71.4%) |
| Total (Category) | 40 (36.0%) | 71 (64.0%) |
| Total (Overall) | 311 (52.6%) | 280 (47.4%) |
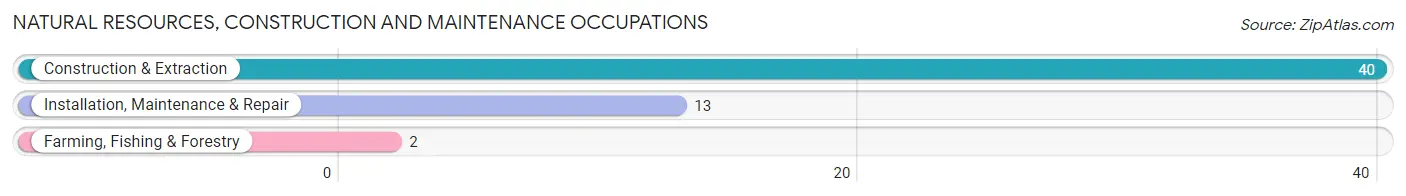
Natural Resources, Construction and Maintenance Occupations
The most common Natural Resources, Construction and Maintenance occupations in Nassau are Construction & Extraction (40 | 6.8%), Installation, Maintenance & Repair (13 | 2.2%), and Farming, Fishing & Forestry (2 | 0.3%).
Natural Resources, Construction and Maintenance Occupations by Sex

| Occupation | Male | Female |
| Farming, Fishing & Forestry | 2 (100.0%) | 0 (0.0%) |
| Construction & Extraction | 40 (100.0%) | 0 (0.0%) |
| Installation, Maintenance & Repair | 13 (100.0%) | 0 (0.0%) |
| Total (Category) | 55 (100.0%) | 0 (0.0%) |
| Total (Overall) | 311 (52.6%) | 280 (47.4%) |
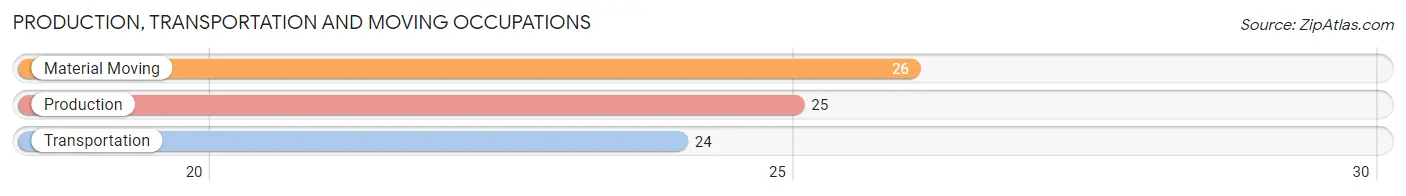
Production, Transportation and Moving Occupations
The most common Production, Transportation and Moving occupations in Nassau are Material Moving (26 | 4.4%), Production (25 | 4.2%), and Transportation (24 | 4.1%).
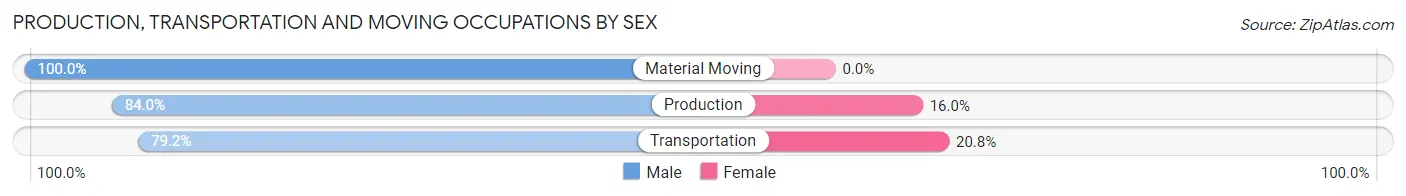
Production, Transportation and Moving Occupations by Sex
| Occupation | Male | Female |
| Production | 21 (84.0%) | 4 (16.0%) |
| Transportation | 19 (79.2%) | 5 (20.8%) |
| Material Moving | 26 (100.0%) | 0 (0.0%) |
| Total (Category) | 66 (88.0%) | 9 (12.0%) |
| Total (Overall) | 311 (52.6%) | 280 (47.4%) |
Employment Industries by Sex in Nassau
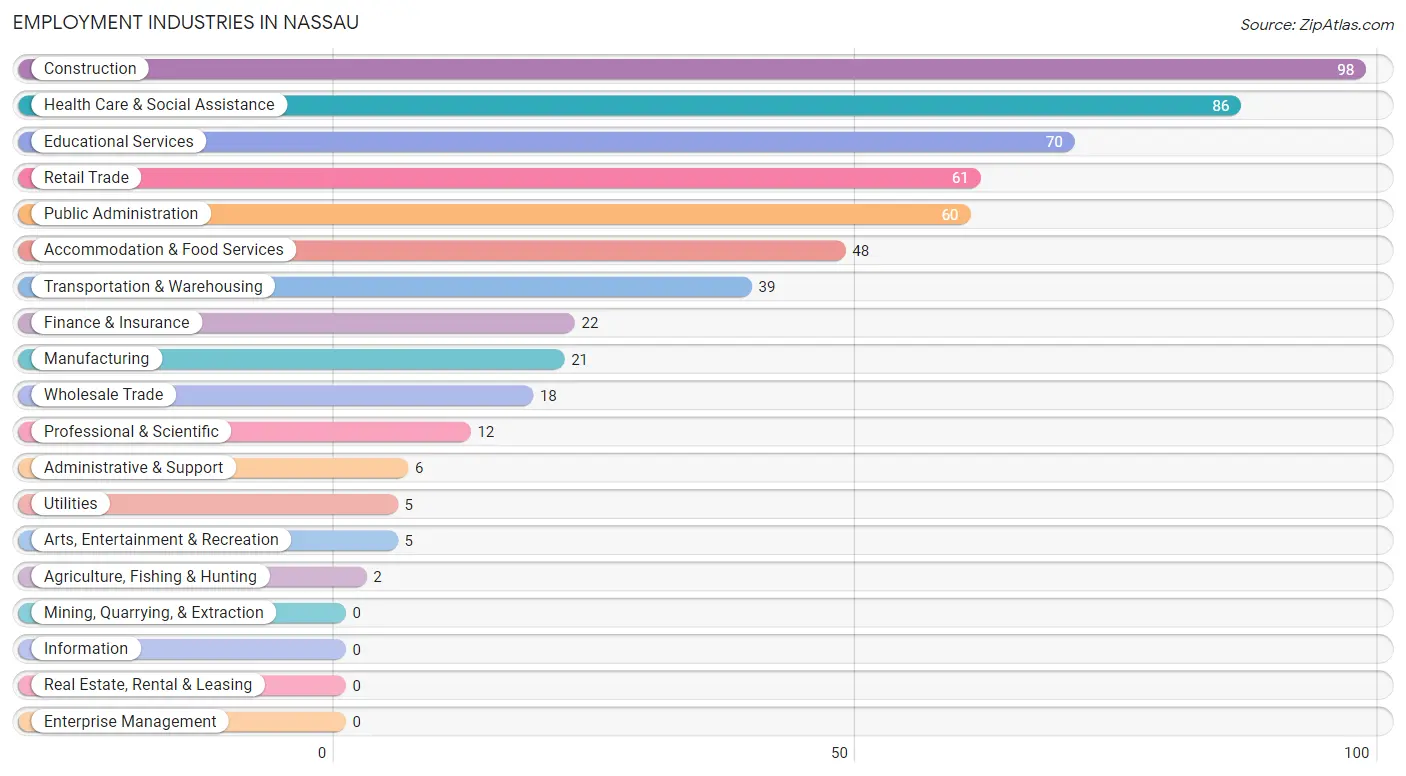
Employment Industries in Nassau
The major employment industries in Nassau include Construction (98 | 16.6%), Health Care & Social Assistance (86 | 14.5%), Educational Services (70 | 11.8%), Retail Trade (61 | 10.3%), and Public Administration (60 | 10.2%).
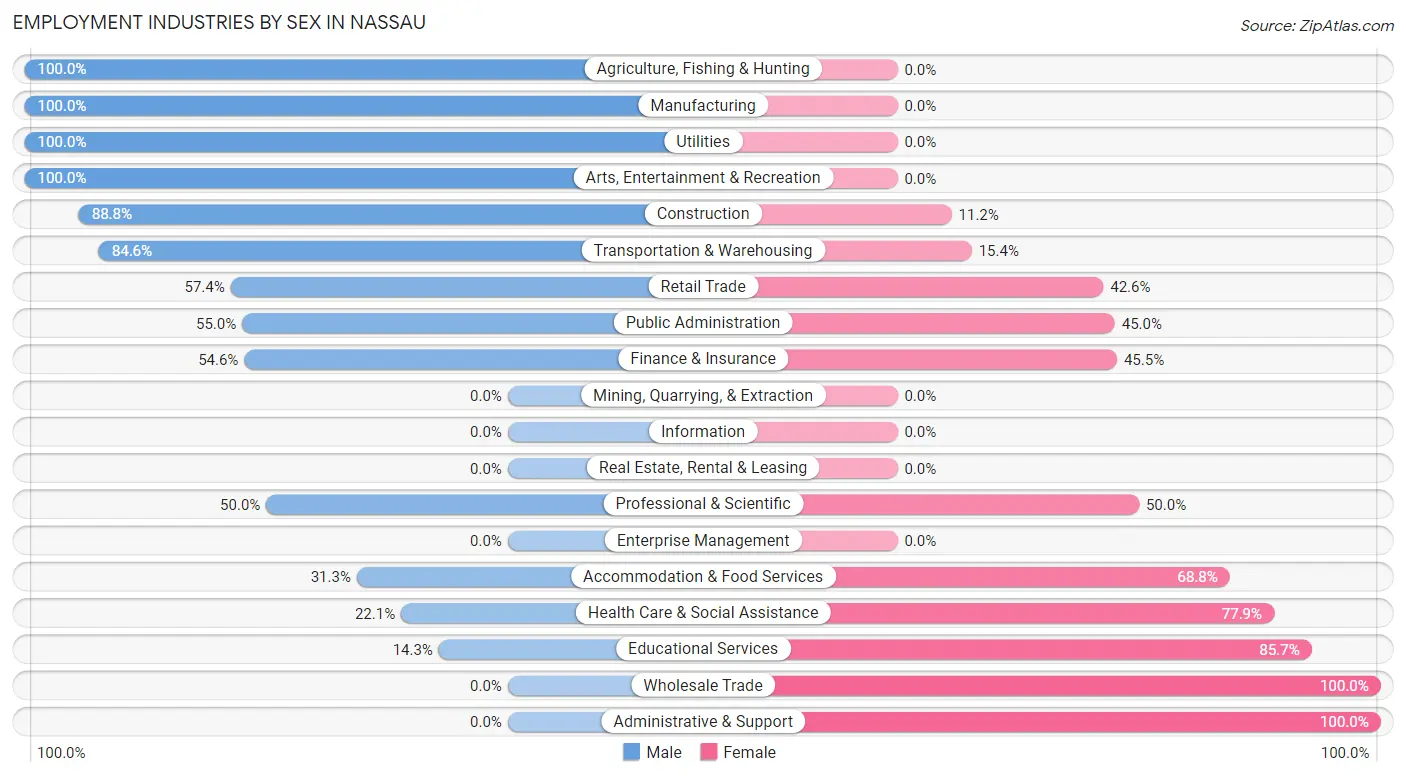
Employment Industries by Sex in Nassau
The Nassau industries that see more men than women are Agriculture, Fishing & Hunting (100.0%), Manufacturing (100.0%), and Utilities (100.0%), whereas the industries that tend to have a higher number of women are Wholesale Trade (100.0%), Administrative & Support (100.0%), and Educational Services (85.7%).
| Industry | Male | Female |
| Agriculture, Fishing & Hunting | 2 (100.0%) | 0 (0.0%) |
| Mining, Quarrying, & Extraction | 0 (0.0%) | 0 (0.0%) |
| Construction | 87 (88.8%) | 11 (11.2%) |
| Manufacturing | 21 (100.0%) | 0 (0.0%) |
| Wholesale Trade | 0 (0.0%) | 18 (100.0%) |
| Retail Trade | 35 (57.4%) | 26 (42.6%) |
| Transportation & Warehousing | 33 (84.6%) | 6 (15.4%) |
| Utilities | 5 (100.0%) | 0 (0.0%) |
| Information | 0 (0.0%) | 0 (0.0%) |
| Finance & Insurance | 12 (54.5%) | 10 (45.5%) |
| Real Estate, Rental & Leasing | 0 (0.0%) | 0 (0.0%) |
| Professional & Scientific | 6 (50.0%) | 6 (50.0%) |
| Enterprise Management | 0 (0.0%) | 0 (0.0%) |
| Administrative & Support | 0 (0.0%) | 6 (100.0%) |
| Educational Services | 10 (14.3%) | 60 (85.7%) |
| Health Care & Social Assistance | 19 (22.1%) | 67 (77.9%) |
| Arts, Entertainment & Recreation | 5 (100.0%) | 0 (0.0%) |
| Accommodation & Food Services | 15 (31.2%) | 33 (68.8%) |
| Public Administration | 33 (55.0%) | 27 (45.0%) |
| Total | 311 (52.6%) | 280 (47.4%) |
Education in Nassau
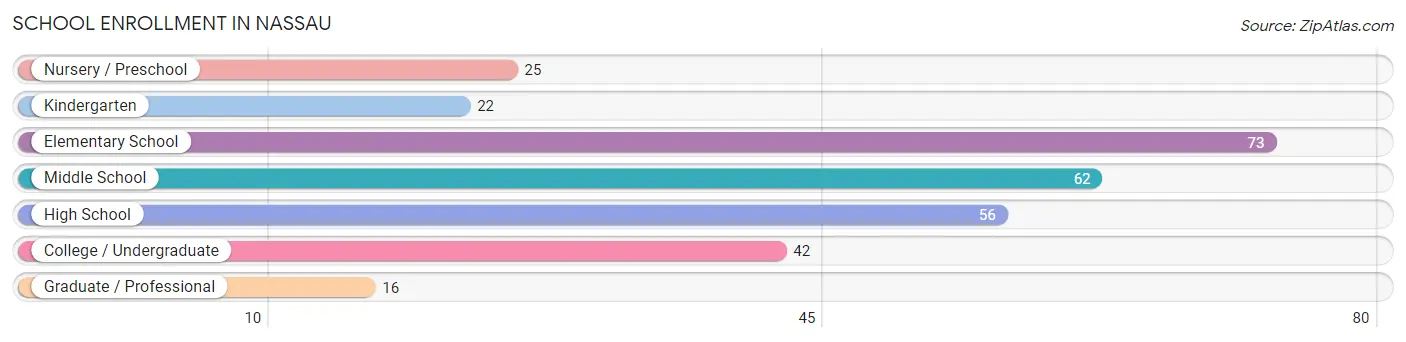
School Enrollment in Nassau
The most common levels of schooling among the 296 students in Nassau are elementary school (73 | 24.7%), middle school (62 | 20.9%), and high school (56 | 18.9%).
| School Level | # Students | % Students |
| Nursery / Preschool | 25 | 8.5% |
| Kindergarten | 22 | 7.4% |
| Elementary School | 73 | 24.7% |
| Middle School | 62 | 20.9% |
| High School | 56 | 18.9% |
| College / Undergraduate | 42 | 14.2% |
| Graduate / Professional | 16 | 5.4% |
| Total | 296 | 100.0% |
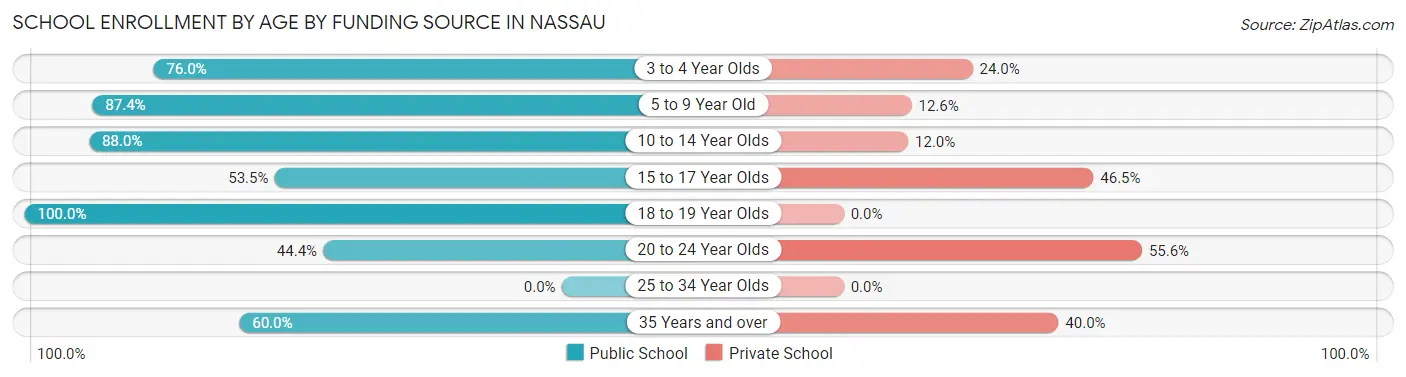
School Enrollment by Age by Funding Source in Nassau
Out of a total of 296 students who are enrolled in schools in Nassau, 56 (18.9%) attend a private institution, while the remaining 240 (81.1%) are enrolled in public schools. The age group of 20 to 24 year olds has the highest likelihood of being enrolled in private schools, with 5 (55.6% in the age bracket) enrolled. Conversely, the age group of 18 to 19 year olds has the lowest likelihood of being enrolled in a private school, with 62 (100.0% in the age bracket) attending a public institution.
| Age Bracket | Public School | Private School |
| 3 to 4 Year Olds | 19 (76.0%) | 6 (24.0%) |
| 5 to 9 Year Old | 76 (87.4%) | 11 (12.6%) |
| 10 to 14 Year Olds | 44 (88.0%) | 6 (12.0%) |
| 15 to 17 Year Olds | 23 (53.5%) | 20 (46.5%) |
| 18 to 19 Year Olds | 62 (100.0%) | 0 (0.0%) |
| 20 to 24 Year Olds | 4 (44.4%) | 5 (55.6%) |
| 25 to 34 Year Olds | 0 (0.0%) | 0 (0.0%) |
| 35 Years and over | 12 (60.0%) | 8 (40.0%) |
| Total | 240 (81.1%) | 56 (18.9%) |
Educational Attainment by Field of Study in Nassau
Education (41 | 15.5%), arts & humanities (33 | 12.5%), liberal arts & history (31 | 11.7%), business (30 | 11.4%), and science & technology (25 | 9.5%) are the most common fields of study among 264 individuals in Nassau who have obtained a bachelor's degree or higher.
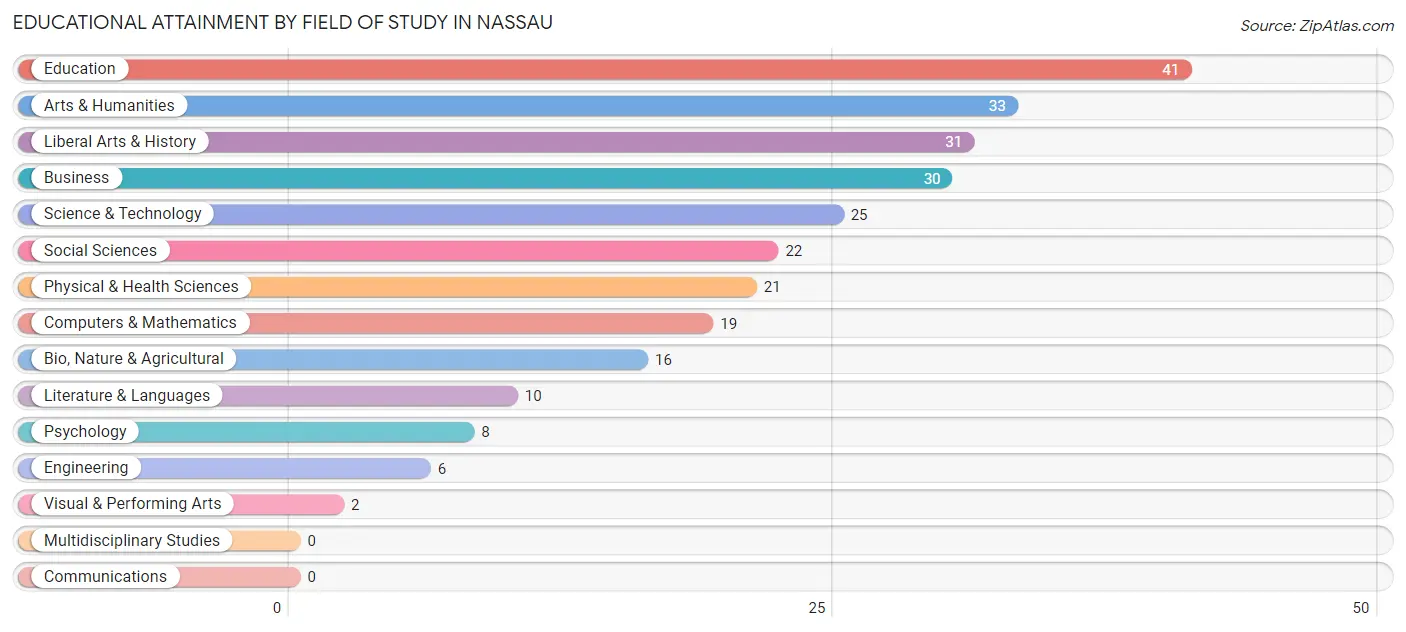
| Field of Study | # Graduates | % Graduates |
| Computers & Mathematics | 19 | 7.2% |
| Bio, Nature & Agricultural | 16 | 6.1% |
| Physical & Health Sciences | 21 | 8.0% |
| Psychology | 8 | 3.0% |
| Social Sciences | 22 | 8.3% |
| Engineering | 6 | 2.3% |
| Multidisciplinary Studies | 0 | 0.0% |
| Science & Technology | 25 | 9.5% |
| Business | 30 | 11.4% |
| Education | 41 | 15.5% |
| Literature & Languages | 10 | 3.8% |
| Liberal Arts & History | 31 | 11.7% |
| Visual & Performing Arts | 2 | 0.8% |
| Communications | 0 | 0.0% |
| Arts & Humanities | 33 | 12.5% |
| Total | 264 | 100.0% |
Transportation & Commute in Nassau
Vehicle Availability by Sex in Nassau
The most prevalent vehicle ownership categories in Nassau are males with 2 vehicles (164, accounting for 55.6%) and females with 2 vehicles (155, making up 61.2%).
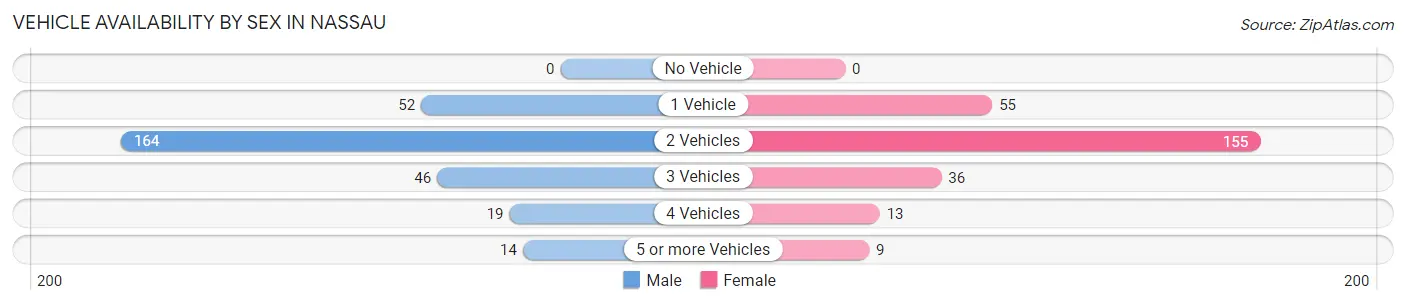
| Vehicles Available | Male | Female |
| No Vehicle | 0 (0.0%) | 0 (0.0%) |
| 1 Vehicle | 52 (17.6%) | 55 (20.5%) |
| 2 Vehicles | 164 (55.6%) | 155 (57.8%) |
| 3 Vehicles | 46 (15.6%) | 36 (13.4%) |
| 4 Vehicles | 19 (6.4%) | 13 (4.9%) |
| 5 or more Vehicles | 14 (4.8%) | 9 (3.4%) |
| Total | 295 (100.0%) | 268 (100.0%) |
Commute Time in Nassau
The most frequently occuring commute durations in Nassau are 20 to 24 minutes (103 commuters, 21.0%), 30 to 34 minutes (74 commuters, 15.1%), and 35 to 39 minutes (71 commuters, 14.5%).
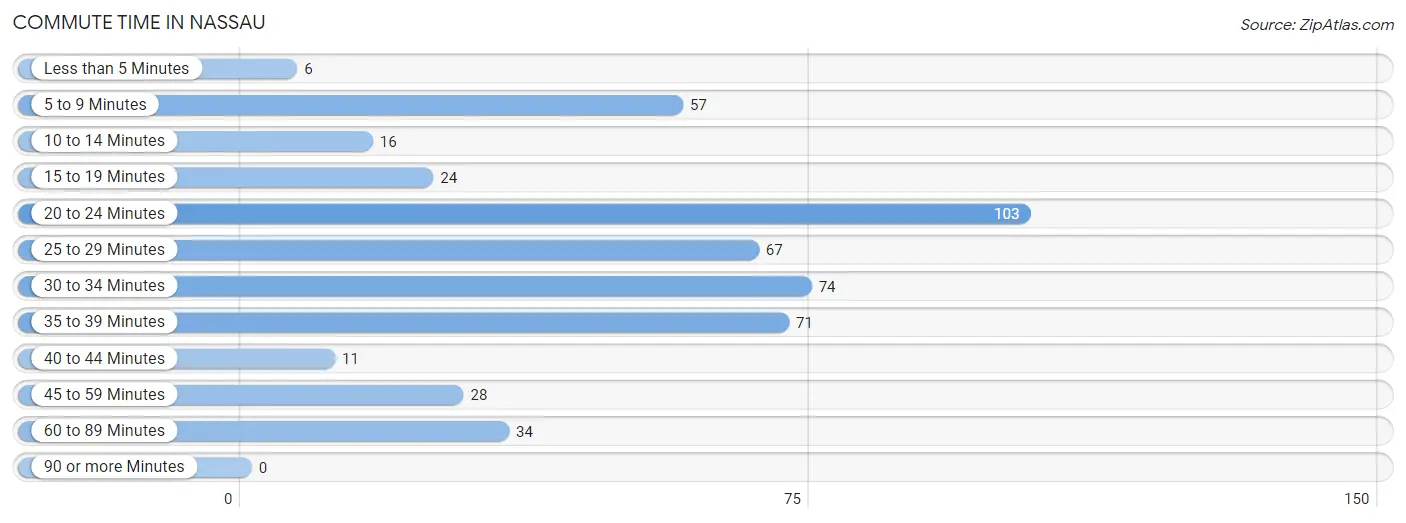
| Commute Time | # Commuters | % Commuters |
| Less than 5 Minutes | 6 | 1.2% |
| 5 to 9 Minutes | 57 | 11.6% |
| 10 to 14 Minutes | 16 | 3.3% |
| 15 to 19 Minutes | 24 | 4.9% |
| 20 to 24 Minutes | 103 | 21.0% |
| 25 to 29 Minutes | 67 | 13.7% |
| 30 to 34 Minutes | 74 | 15.1% |
| 35 to 39 Minutes | 71 | 14.5% |
| 40 to 44 Minutes | 11 | 2.2% |
| 45 to 59 Minutes | 28 | 5.7% |
| 60 to 89 Minutes | 34 | 6.9% |
| 90 or more Minutes | 0 | 0.0% |
Commute Time by Sex in Nassau
The most common commute times in Nassau are 20 to 24 minutes (72 commuters, 28.2%) for males and 30 to 34 minutes (57 commuters, 24.1%) for females.
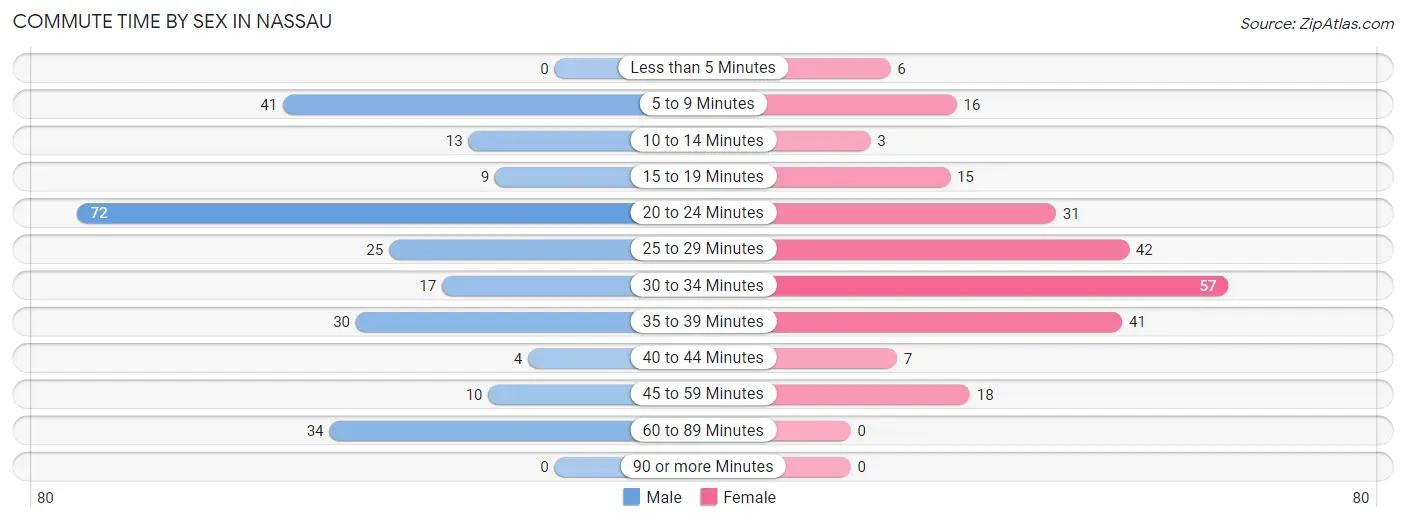
| Commute Time | Male | Female |
| Less than 5 Minutes | 0 (0.0%) | 6 (2.5%) |
| 5 to 9 Minutes | 41 (16.1%) | 16 (6.8%) |
| 10 to 14 Minutes | 13 (5.1%) | 3 (1.3%) |
| 15 to 19 Minutes | 9 (3.5%) | 15 (6.4%) |
| 20 to 24 Minutes | 72 (28.2%) | 31 (13.1%) |
| 25 to 29 Minutes | 25 (9.8%) | 42 (17.8%) |
| 30 to 34 Minutes | 17 (6.7%) | 57 (24.1%) |
| 35 to 39 Minutes | 30 (11.8%) | 41 (17.4%) |
| 40 to 44 Minutes | 4 (1.6%) | 7 (3.0%) |
| 45 to 59 Minutes | 10 (3.9%) | 18 (7.6%) |
| 60 to 89 Minutes | 34 (13.3%) | 0 (0.0%) |
| 90 or more Minutes | 0 (0.0%) | 0 (0.0%) |
Time of Departure to Work by Sex in Nassau
The most frequent times of departure to work in Nassau are 6:30 AM to 6:59 AM (94, 36.9%) for males and 7:00 AM to 7:29 AM (128, 54.2%) for females.
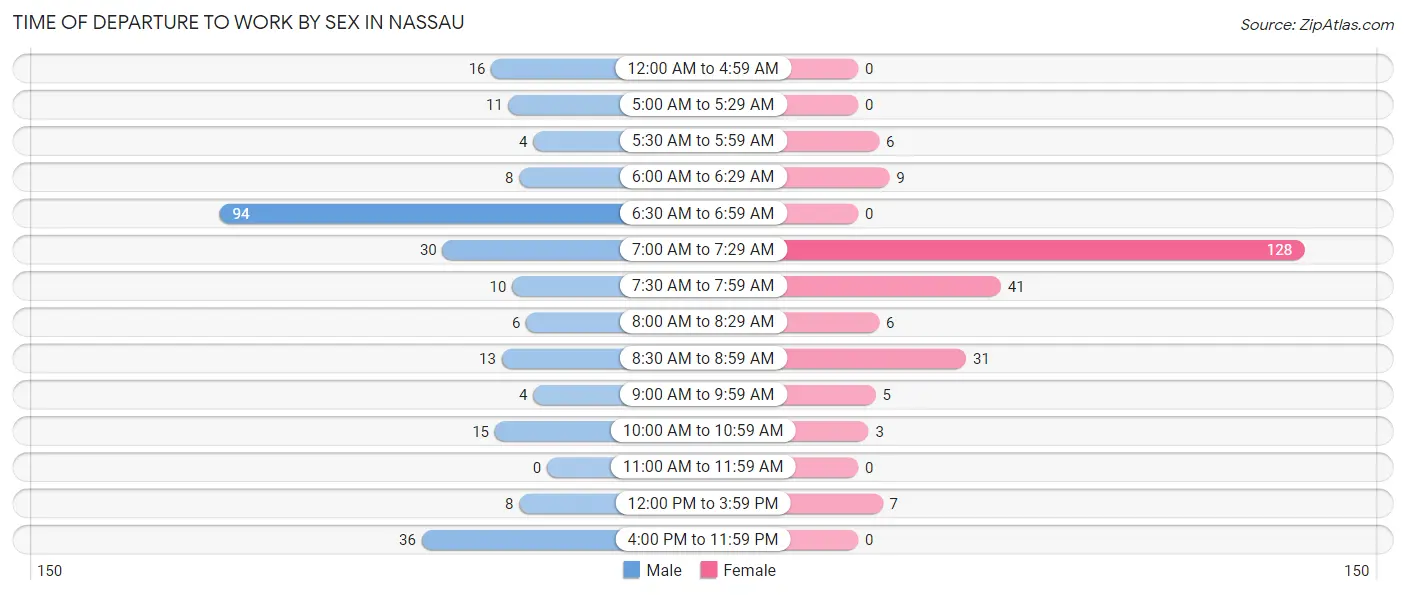
| Time of Departure | Male | Female |
| 12:00 AM to 4:59 AM | 16 (6.3%) | 0 (0.0%) |
| 5:00 AM to 5:29 AM | 11 (4.3%) | 0 (0.0%) |
| 5:30 AM to 5:59 AM | 4 (1.6%) | 6 (2.5%) |
| 6:00 AM to 6:29 AM | 8 (3.1%) | 9 (3.8%) |
| 6:30 AM to 6:59 AM | 94 (36.9%) | 0 (0.0%) |
| 7:00 AM to 7:29 AM | 30 (11.8%) | 128 (54.2%) |
| 7:30 AM to 7:59 AM | 10 (3.9%) | 41 (17.4%) |
| 8:00 AM to 8:29 AM | 6 (2.4%) | 6 (2.5%) |
| 8:30 AM to 8:59 AM | 13 (5.1%) | 31 (13.1%) |
| 9:00 AM to 9:59 AM | 4 (1.6%) | 5 (2.1%) |
| 10:00 AM to 10:59 AM | 15 (5.9%) | 3 (1.3%) |
| 11:00 AM to 11:59 AM | 0 (0.0%) | 0 (0.0%) |
| 12:00 PM to 3:59 PM | 8 (3.1%) | 7 (3.0%) |
| 4:00 PM to 11:59 PM | 36 (14.1%) | 0 (0.0%) |
| Total | 255 (100.0%) | 236 (100.0%) |
Housing Occupancy in Nassau
Occupancy by Ownership in Nassau
Of the total 469 dwellings in Nassau, owner-occupied units account for 290 (61.8%), while renter-occupied units make up 179 (38.2%).
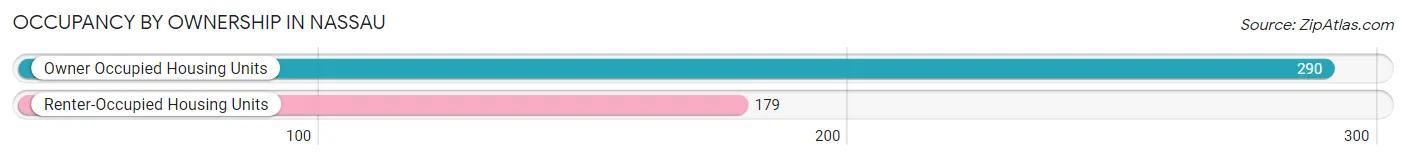
| Occupancy | # Housing Units | % Housing Units |
| Owner Occupied Housing Units | 290 | 61.8% |
| Renter-Occupied Housing Units | 179 | 38.2% |
| Total Occupied Housing Units | 469 | 100.0% |
Occupancy by Household Size in Nassau
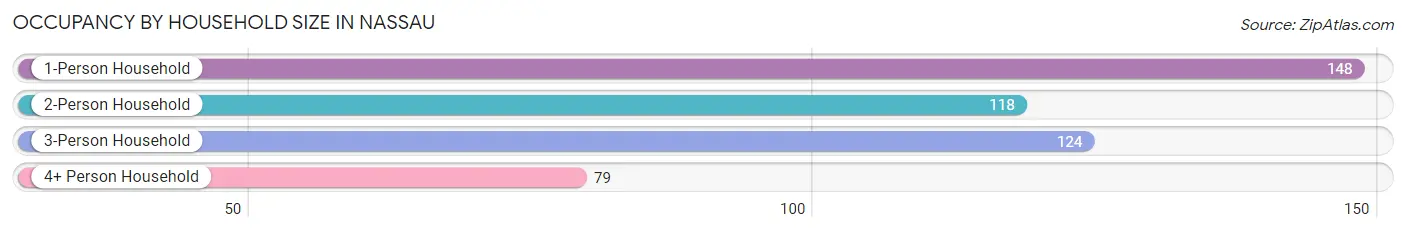
| Household Size | # Housing Units | % Housing Units |
| 1-Person Household | 148 | 31.6% |
| 2-Person Household | 118 | 25.2% |
| 3-Person Household | 124 | 26.4% |
| 4+ Person Household | 79 | 16.8% |
| Total Housing Units | 469 | 100.0% |
Occupancy by Ownership by Household Size in Nassau
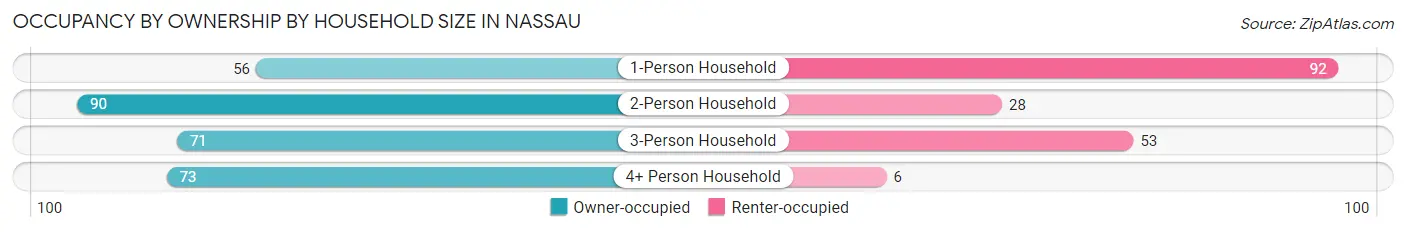
| Household Size | Owner-occupied | Renter-occupied |
| 1-Person Household | 56 (37.8%) | 92 (62.2%) |
| 2-Person Household | 90 (76.3%) | 28 (23.7%) |
| 3-Person Household | 71 (57.3%) | 53 (42.7%) |
| 4+ Person Household | 73 (92.4%) | 6 (7.6%) |
| Total Housing Units | 290 (61.8%) | 179 (38.2%) |
Occupancy by Educational Attainment in Nassau
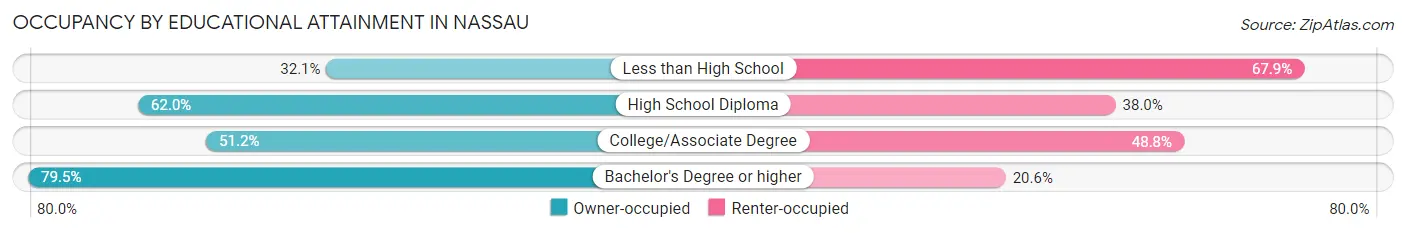
| Household Size | Owner-occupied | Renter-occupied |
| Less than High School | 9 (32.1%) | 19 (67.9%) |
| High School Diploma | 80 (62.0%) | 49 (38.0%) |
| College/Associate Degree | 85 (51.2%) | 81 (48.8%) |
| Bachelor's Degree or higher | 116 (79.4%) | 30 (20.5%) |
Occupancy by Age of Householder in Nassau
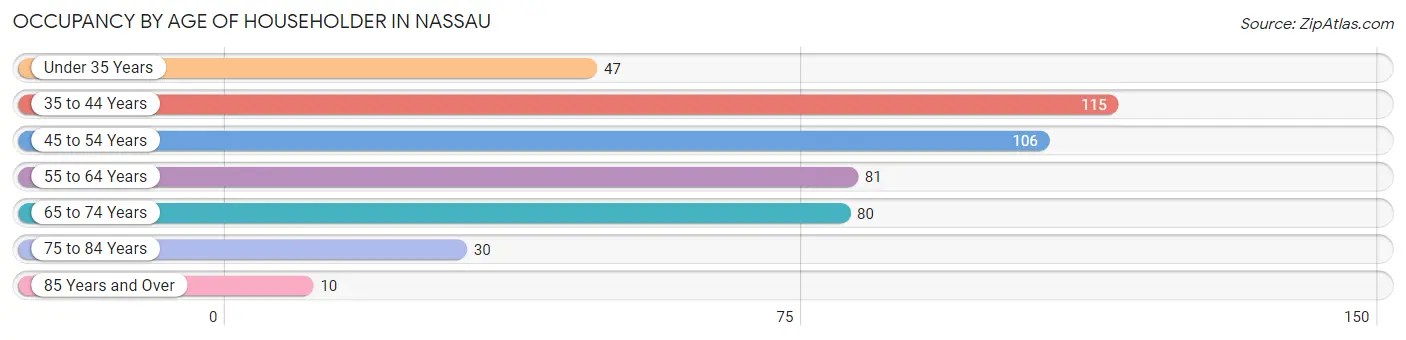
| Age Bracket | # Households | % Households |
| Under 35 Years | 47 | 10.0% |
| 35 to 44 Years | 115 | 24.5% |
| 45 to 54 Years | 106 | 22.6% |
| 55 to 64 Years | 81 | 17.3% |
| 65 to 74 Years | 80 | 17.1% |
| 75 to 84 Years | 30 | 6.4% |
| 85 Years and Over | 10 | 2.1% |
| Total | 469 | 100.0% |
Housing Finances in Nassau
Median Income by Occupancy in Nassau
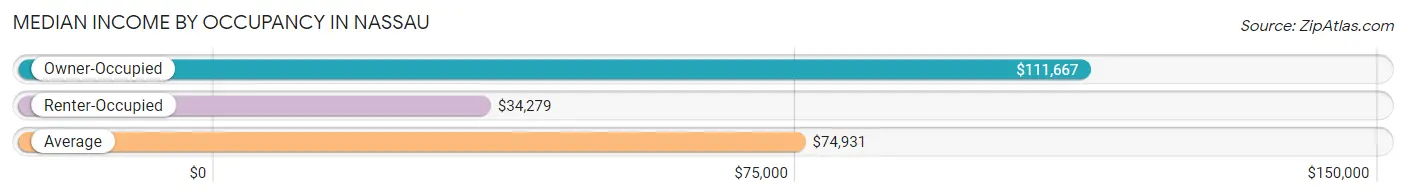
| Occupancy Type | # Households | Median Income |
| Owner-Occupied | 290 (61.8%) | $111,667 |
| Renter-Occupied | 179 (38.2%) | $34,279 |
| Average | 469 (100.0%) | $74,931 |
Occupancy by Householder Income Bracket in Nassau
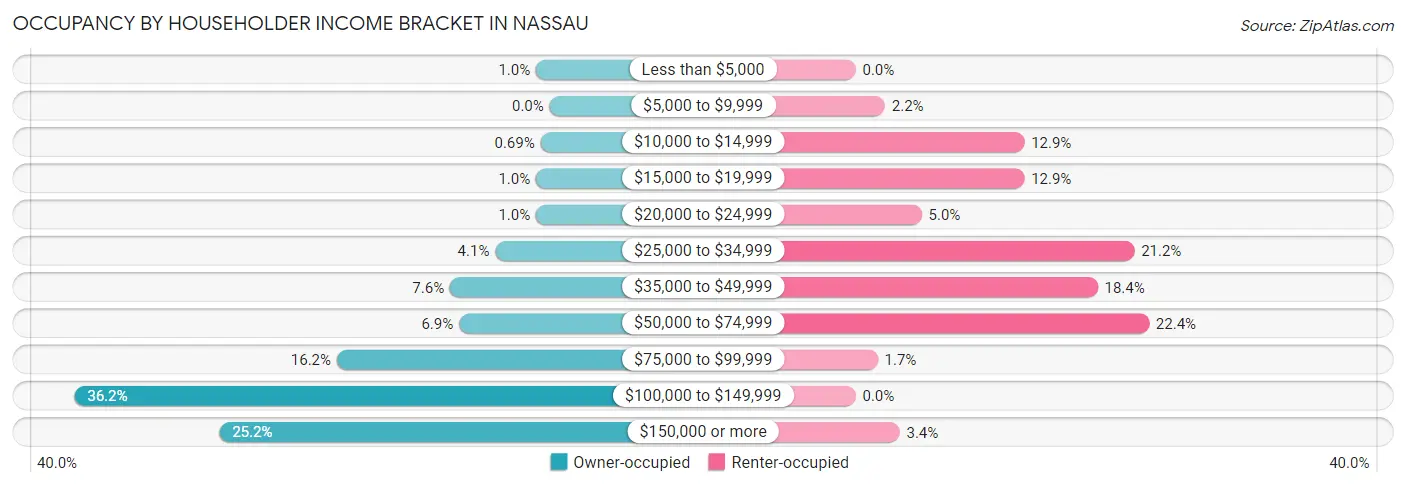
| Income Bracket | Owner-occupied | Renter-occupied |
| Less than $5,000 | 3 (1.0%) | 0 (0.0%) |
| $5,000 to $9,999 | 0 (0.0%) | 4 (2.2%) |
| $10,000 to $14,999 | 2 (0.7%) | 23 (12.9%) |
| $15,000 to $19,999 | 3 (1.0%) | 23 (12.9%) |
| $20,000 to $24,999 | 3 (1.0%) | 9 (5.0%) |
| $25,000 to $34,999 | 12 (4.1%) | 38 (21.2%) |
| $35,000 to $49,999 | 22 (7.6%) | 33 (18.4%) |
| $50,000 to $74,999 | 20 (6.9%) | 40 (22.4%) |
| $75,000 to $99,999 | 47 (16.2%) | 3 (1.7%) |
| $100,000 to $149,999 | 105 (36.2%) | 0 (0.0%) |
| $150,000 or more | 73 (25.2%) | 6 (3.4%) |
| Total | 290 (100.0%) | 179 (100.0%) |
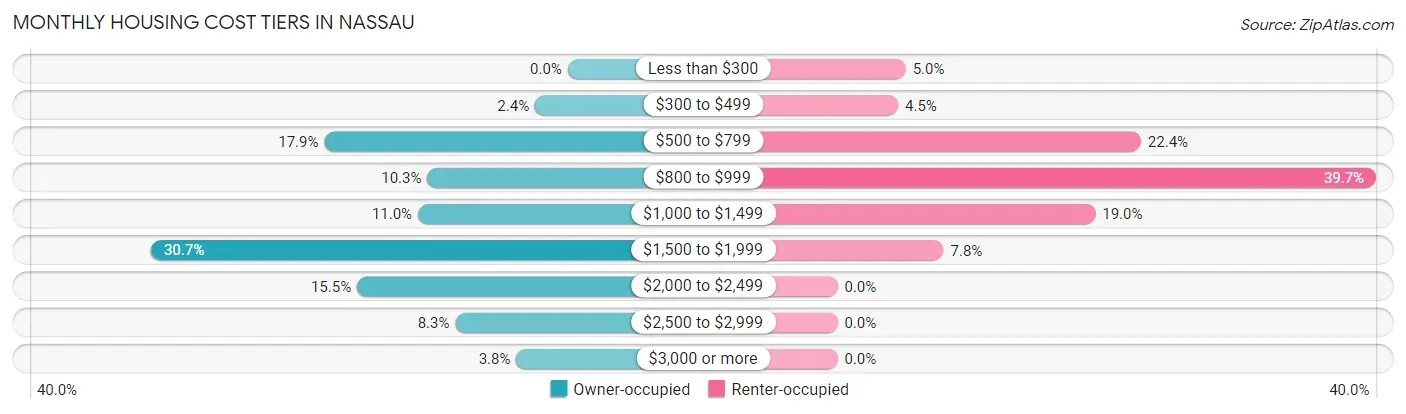
Monthly Housing Cost Tiers in Nassau
| Monthly Cost | Owner-occupied | Renter-occupied |
| Less than $300 | 0 (0.0%) | 9 (5.0%) |
| $300 to $499 | 7 (2.4%) | 8 (4.5%) |
| $500 to $799 | 52 (17.9%) | 40 (22.4%) |
| $800 to $999 | 30 (10.3%) | 71 (39.7%) |
| $1,000 to $1,499 | 32 (11.0%) | 34 (19.0%) |
| $1,500 to $1,999 | 89 (30.7%) | 14 (7.8%) |
| $2,000 to $2,499 | 45 (15.5%) | 0 (0.0%) |
| $2,500 to $2,999 | 24 (8.3%) | 0 (0.0%) |
| $3,000 or more | 11 (3.8%) | 0 (0.0%) |
| Total | 290 (100.0%) | 179 (100.0%) |
Physical Housing Characteristics in Nassau
Housing Structures in Nassau
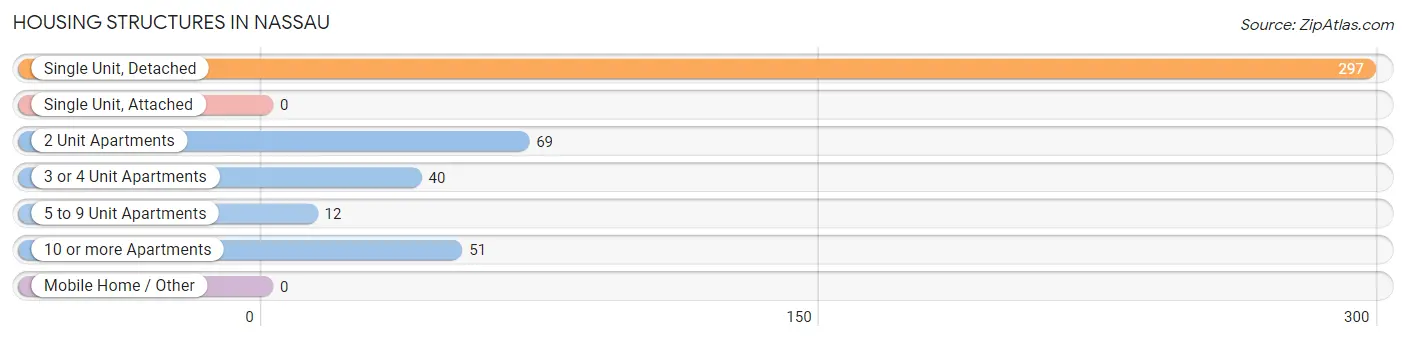
| Structure Type | # Housing Units | % Housing Units |
| Single Unit, Detached | 297 | 63.3% |
| Single Unit, Attached | 0 | 0.0% |
| 2 Unit Apartments | 69 | 14.7% |
| 3 or 4 Unit Apartments | 40 | 8.5% |
| 5 to 9 Unit Apartments | 12 | 2.6% |
| 10 or more Apartments | 51 | 10.9% |
| Mobile Home / Other | 0 | 0.0% |
| Total | 469 | 100.0% |
Housing Structures by Occupancy in Nassau
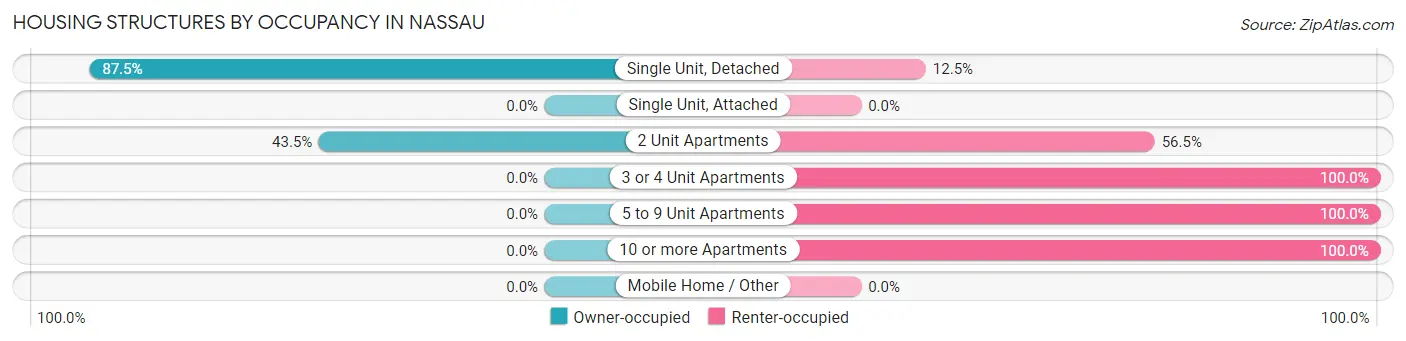
| Structure Type | Owner-occupied | Renter-occupied |
| Single Unit, Detached | 260 (87.5%) | 37 (12.5%) |
| Single Unit, Attached | 0 (0.0%) | 0 (0.0%) |
| 2 Unit Apartments | 30 (43.5%) | 39 (56.5%) |
| 3 or 4 Unit Apartments | 0 (0.0%) | 40 (100.0%) |
| 5 to 9 Unit Apartments | 0 (0.0%) | 12 (100.0%) |
| 10 or more Apartments | 0 (0.0%) | 51 (100.0%) |
| Mobile Home / Other | 0 (0.0%) | 0 (0.0%) |
| Total | 290 (61.8%) | 179 (38.2%) |
Housing Structures by Number of Rooms in Nassau
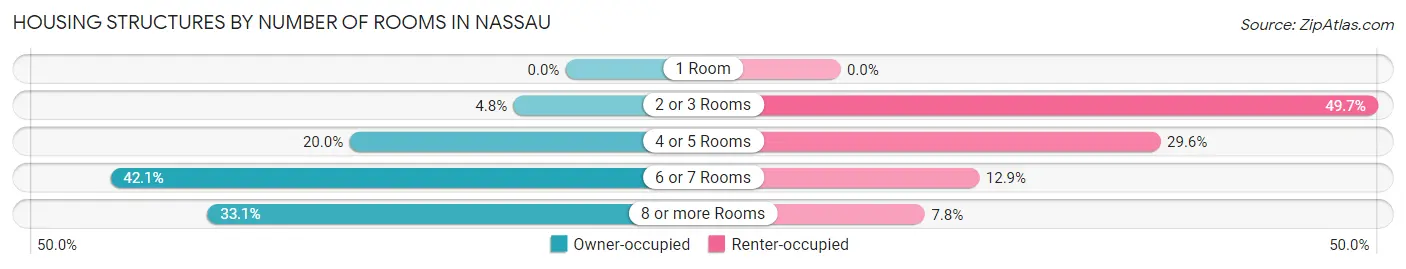
| Number of Rooms | Owner-occupied | Renter-occupied |
| 1 Room | 0 (0.0%) | 0 (0.0%) |
| 2 or 3 Rooms | 14 (4.8%) | 89 (49.7%) |
| 4 or 5 Rooms | 58 (20.0%) | 53 (29.6%) |
| 6 or 7 Rooms | 122 (42.1%) | 23 (12.9%) |
| 8 or more Rooms | 96 (33.1%) | 14 (7.8%) |
| Total | 290 (100.0%) | 179 (100.0%) |
Housing Structure by Heating Type in Nassau
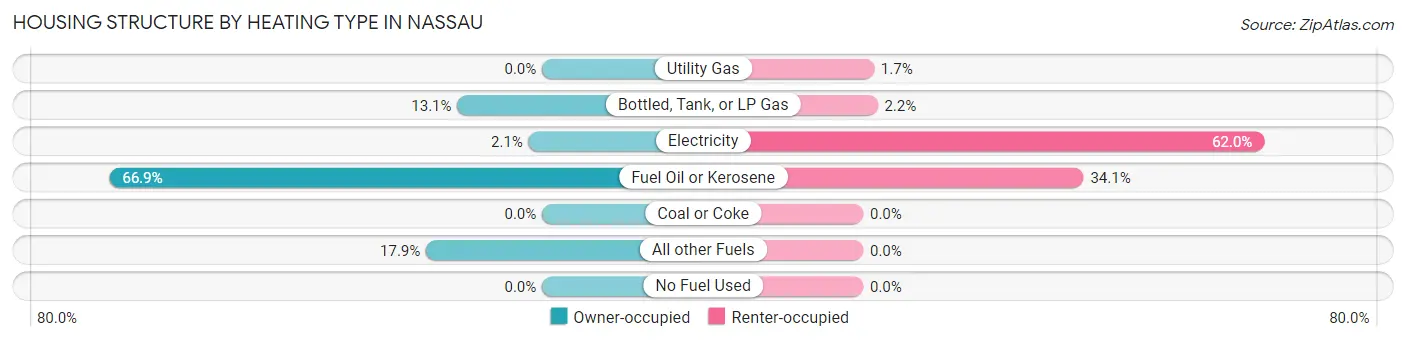
| Heating Type | Owner-occupied | Renter-occupied |
| Utility Gas | 0 (0.0%) | 3 (1.7%) |
| Bottled, Tank, or LP Gas | 38 (13.1%) | 4 (2.2%) |
| Electricity | 6 (2.1%) | 111 (62.0%) |
| Fuel Oil or Kerosene | 194 (66.9%) | 61 (34.1%) |
| Coal or Coke | 0 (0.0%) | 0 (0.0%) |
| All other Fuels | 52 (17.9%) | 0 (0.0%) |
| No Fuel Used | 0 (0.0%) | 0 (0.0%) |
| Total | 290 (100.0%) | 179 (100.0%) |
Household Vehicle Usage in Nassau
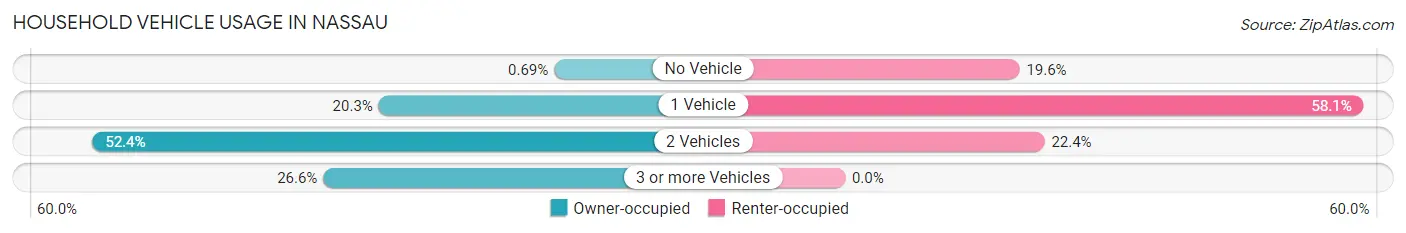
| Vehicles per Household | Owner-occupied | Renter-occupied |
| No Vehicle | 2 (0.7%) | 35 (19.6%) |
| 1 Vehicle | 59 (20.3%) | 104 (58.1%) |
| 2 Vehicles | 152 (52.4%) | 40 (22.4%) |
| 3 or more Vehicles | 77 (26.6%) | 0 (0.0%) |
| Total | 290 (100.0%) | 179 (100.0%) |
Real Estate & Mortgages in Nassau
Real Estate and Mortgage Overview in Nassau
| Characteristic | Without Mortgage | With Mortgage |
| Housing Units | 87 | 203 |
| Median Property Value | $209,800 | $202,400 |
| Median Household Income | $110,625 | $45 |
| Monthly Housing Costs | $750 | $11 |
| Real Estate Taxes | $4,229 | $0 |
Property Value by Mortgage Status in Nassau
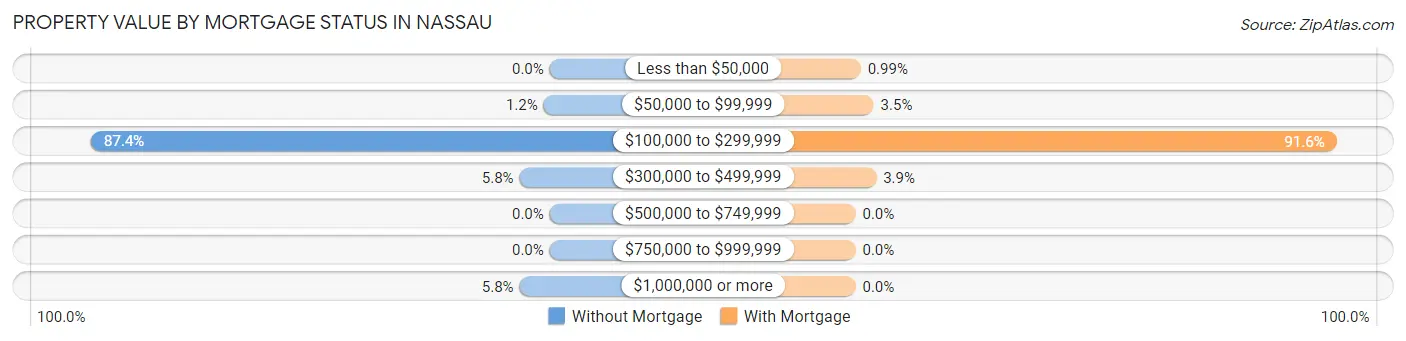
| Property Value | Without Mortgage | With Mortgage |
| Less than $50,000 | 0 (0.0%) | 2 (1.0%) |
| $50,000 to $99,999 | 1 (1.1%) | 7 (3.5%) |
| $100,000 to $299,999 | 76 (87.4%) | 186 (91.6%) |
| $300,000 to $499,999 | 5 (5.8%) | 8 (3.9%) |
| $500,000 to $749,999 | 0 (0.0%) | 0 (0.0%) |
| $750,000 to $999,999 | 0 (0.0%) | 0 (0.0%) |
| $1,000,000 or more | 5 (5.8%) | 0 (0.0%) |
| Total | 87 (100.0%) | 203 (100.0%) |
Household Income by Mortgage Status in Nassau
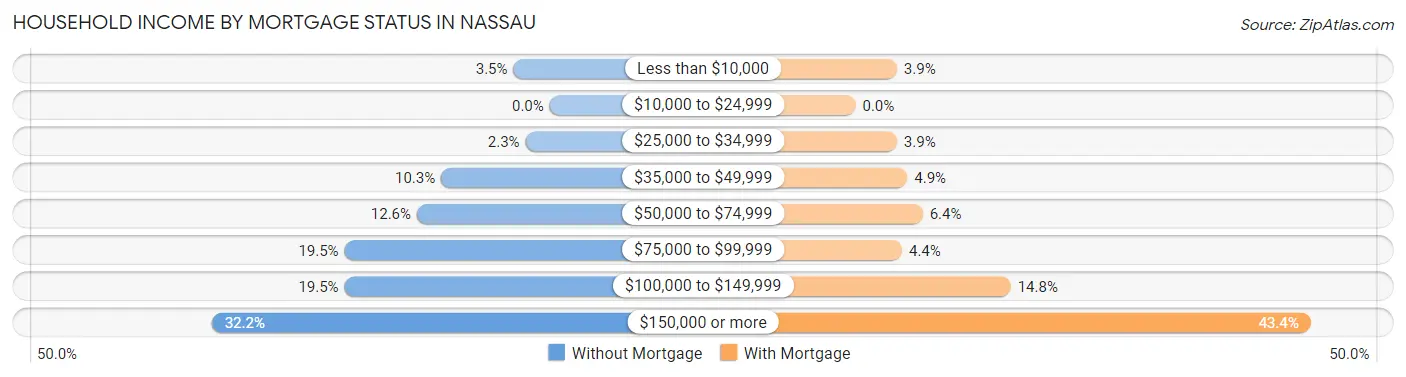
| Household Income | Without Mortgage | With Mortgage |
| Less than $10,000 | 3 (3.5%) | 8 (3.9%) |
| $10,000 to $24,999 | 0 (0.0%) | 0 (0.0%) |
| $25,000 to $34,999 | 2 (2.3%) | 8 (3.9%) |
| $35,000 to $49,999 | 9 (10.3%) | 10 (4.9%) |
| $50,000 to $74,999 | 11 (12.6%) | 13 (6.4%) |
| $75,000 to $99,999 | 17 (19.5%) | 9 (4.4%) |
| $100,000 to $149,999 | 17 (19.5%) | 30 (14.8%) |
| $150,000 or more | 28 (32.2%) | 88 (43.3%) |
| Total | 87 (100.0%) | 203 (100.0%) |
Property Value to Household Income Ratio in Nassau
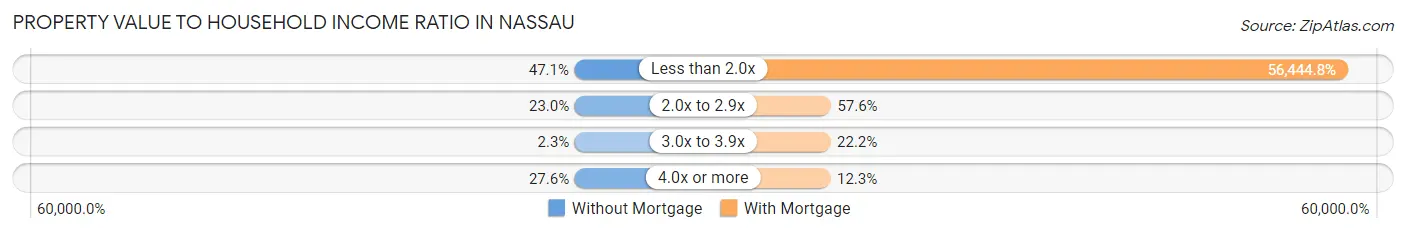
| Value-to-Income Ratio | Without Mortgage | With Mortgage |
| Less than 2.0x | 41 (47.1%) | 114,583 (56,444.8%) |
| 2.0x to 2.9x | 20 (23.0%) | 117 (57.6%) |
| 3.0x to 3.9x | 2 (2.3%) | 45 (22.2%) |
| 4.0x or more | 24 (27.6%) | 25 (12.3%) |
| Total | 87 (100.0%) | 203 (100.0%) |
Real Estate Taxes by Mortgage Status in Nassau
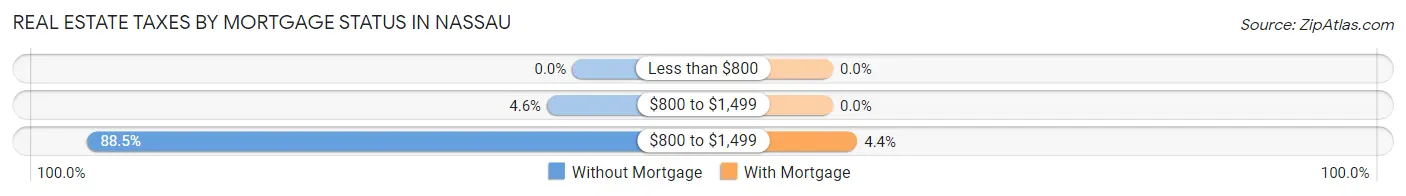
| Property Taxes | Without Mortgage | With Mortgage |
| Less than $800 | 0 (0.0%) | 0 (0.0%) |
| $800 to $1,499 | 4 (4.6%) | 0 (0.0%) |
| $800 to $1,499 | 77 (88.5%) | 9 (4.4%) |
| Total | 87 (100.0%) | 203 (100.0%) |
Health & Disability in Nassau
Health Insurance Coverage by Age in Nassau
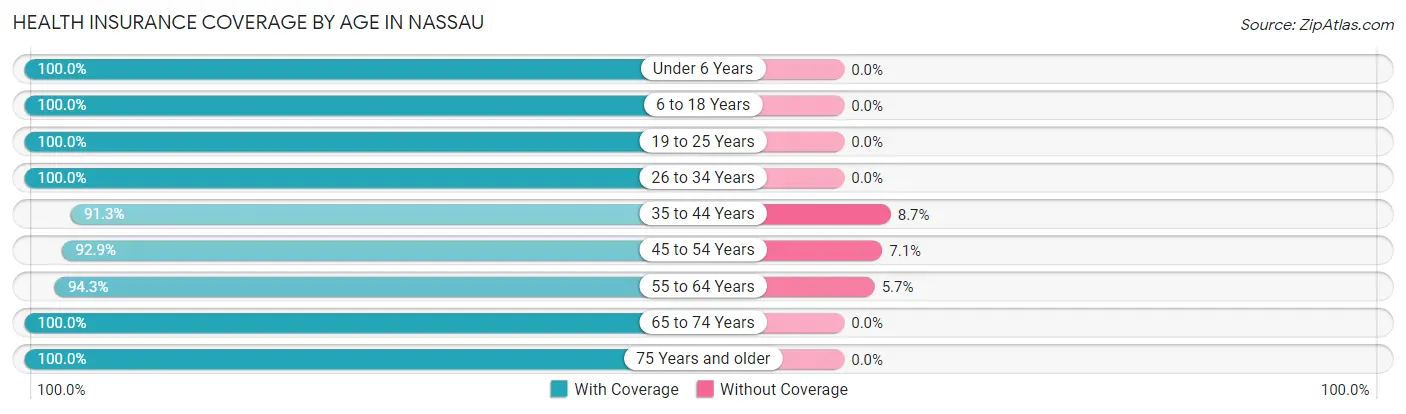
| Age Bracket | With Coverage | Without Coverage |
| Under 6 Years | 66 (100.0%) | 0 (0.0%) |
| 6 to 18 Years | 213 (100.0%) | 0 (0.0%) |
| 19 to 25 Years | 128 (100.0%) | 0 (0.0%) |
| 26 to 34 Years | 61 (100.0%) | 0 (0.0%) |
| 35 to 44 Years | 179 (91.3%) | 17 (8.7%) |
| 45 to 54 Years | 157 (92.9%) | 12 (7.1%) |
| 55 to 64 Years | 133 (94.3%) | 8 (5.7%) |
| 65 to 74 Years | 136 (100.0%) | 0 (0.0%) |
| 75 Years and older | 54 (100.0%) | 0 (0.0%) |
| Total | 1,127 (96.8%) | 37 (3.2%) |
Health Insurance Coverage by Citizenship Status in Nassau
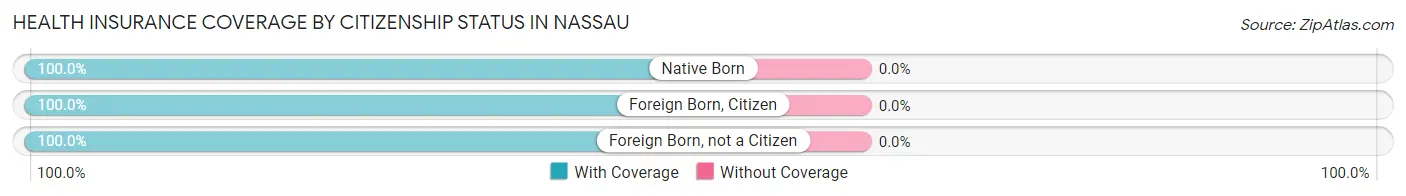
| Citizenship Status | With Coverage | Without Coverage |
| Native Born | 66 (100.0%) | 0 (0.0%) |
| Foreign Born, Citizen | 213 (100.0%) | 0 (0.0%) |
| Foreign Born, not a Citizen | 128 (100.0%) | 0 (0.0%) |
Health Insurance Coverage by Household Income in Nassau
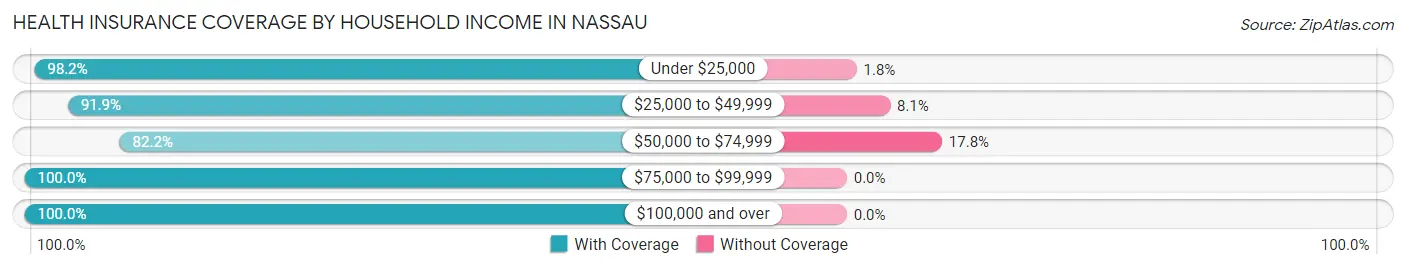
| Household Income | With Coverage | Without Coverage |
| Under $25,000 | 107 (98.2%) | 2 (1.8%) |
| $25,000 to $49,999 | 193 (91.9%) | 17 (8.1%) |
| $50,000 to $74,999 | 83 (82.2%) | 18 (17.8%) |
| $75,000 to $99,999 | 126 (100.0%) | 0 (0.0%) |
| $100,000 and over | 618 (100.0%) | 0 (0.0%) |
Public vs Private Health Insurance Coverage by Age in Nassau
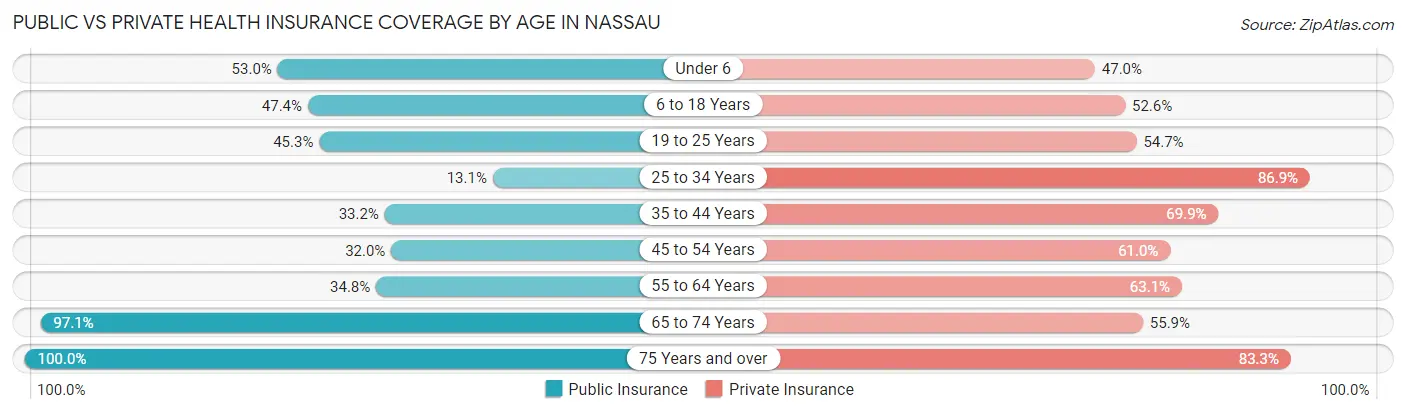
| Age Bracket | Public Insurance | Private Insurance |
| Under 6 | 35 (53.0%) | 31 (47.0%) |
| 6 to 18 Years | 101 (47.4%) | 112 (52.6%) |
| 19 to 25 Years | 58 (45.3%) | 70 (54.7%) |
| 25 to 34 Years | 8 (13.1%) | 53 (86.9%) |
| 35 to 44 Years | 65 (33.2%) | 137 (69.9%) |
| 45 to 54 Years | 54 (32.0%) | 103 (61.0%) |
| 55 to 64 Years | 49 (34.7%) | 89 (63.1%) |
| 65 to 74 Years | 132 (97.1%) | 76 (55.9%) |
| 75 Years and over | 54 (100.0%) | 45 (83.3%) |
| Total | 556 (47.8%) | 716 (61.5%) |
Disability Status by Sex by Age in Nassau
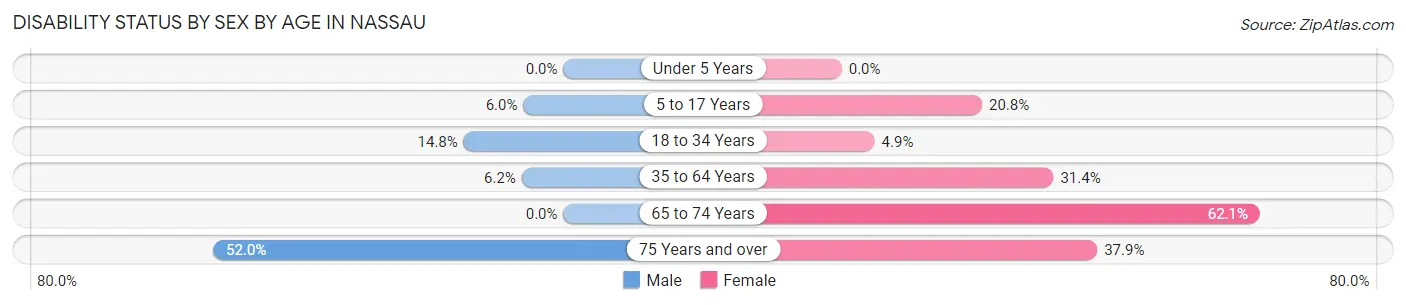
| Age Bracket | Male | Female |
| Under 5 Years | 0 (0.0%) | 0 (0.0%) |
| 5 to 17 Years | 5 (5.9%) | 20 (20.8%) |
| 18 to 34 Years | 24 (14.8%) | 4 (4.9%) |
| 35 to 64 Years | 14 (6.2%) | 88 (31.4%) |
| 65 to 74 Years | 0 (0.0%) | 54 (62.1%) |
| 75 Years and over | 13 (52.0%) | 11 (37.9%) |
Disability Class by Sex by Age in Nassau
Disability Class: Hearing Difficulty
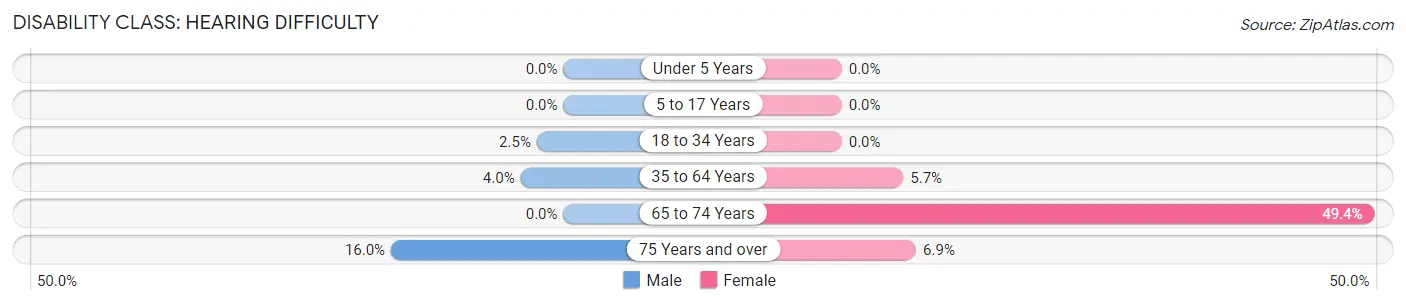
| Age Bracket | Male | Female |
| Under 5 Years | 0 (0.0%) | 0 (0.0%) |
| 5 to 17 Years | 0 (0.0%) | 0 (0.0%) |
| 18 to 34 Years | 4 (2.5%) | 0 (0.0%) |
| 35 to 64 Years | 9 (4.0%) | 16 (5.7%) |
| 65 to 74 Years | 0 (0.0%) | 43 (49.4%) |
| 75 Years and over | 4 (16.0%) | 2 (6.9%) |
Disability Class: Vision Difficulty
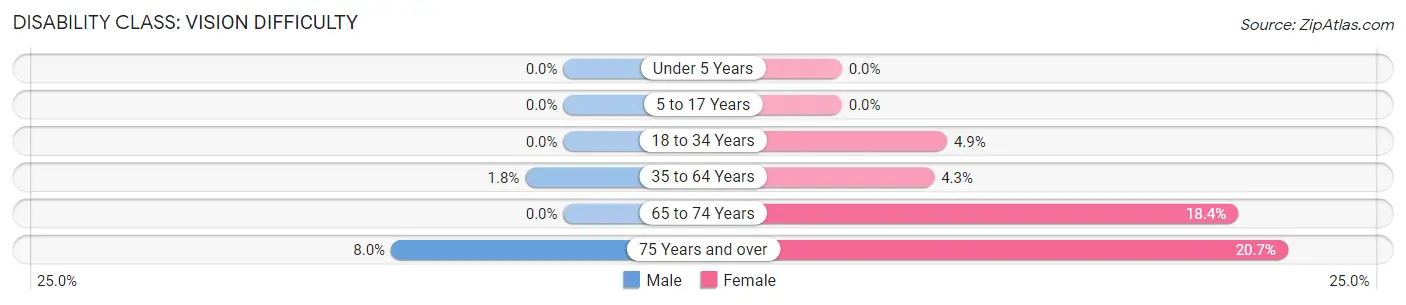
| Age Bracket | Male | Female |
| Under 5 Years | 0 (0.0%) | 0 (0.0%) |
| 5 to 17 Years | 0 (0.0%) | 0 (0.0%) |
| 18 to 34 Years | 0 (0.0%) | 4 (4.9%) |
| 35 to 64 Years | 4 (1.8%) | 12 (4.3%) |
| 65 to 74 Years | 0 (0.0%) | 16 (18.4%) |
| 75 Years and over | 2 (8.0%) | 6 (20.7%) |
Disability Class: Cognitive Difficulty
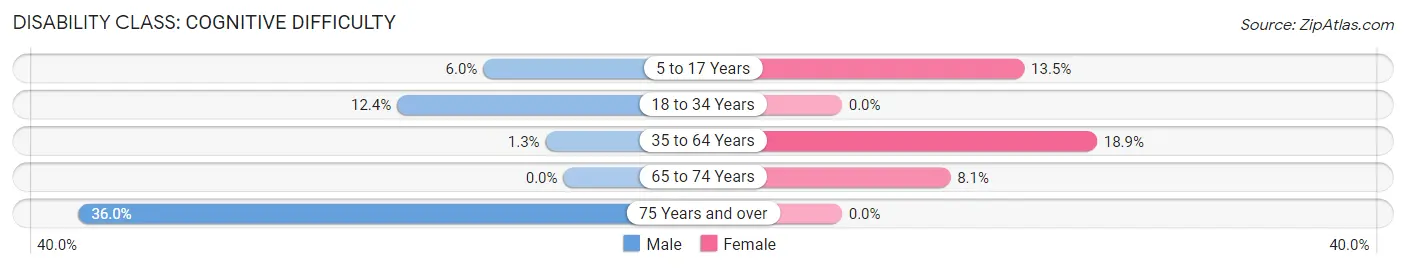
| Age Bracket | Male | Female |
| 5 to 17 Years | 5 (5.9%) | 13 (13.5%) |
| 18 to 34 Years | 20 (12.3%) | 0 (0.0%) |
| 35 to 64 Years | 3 (1.3%) | 53 (18.9%) |
| 65 to 74 Years | 0 (0.0%) | 7 (8.1%) |
| 75 Years and over | 9 (36.0%) | 0 (0.0%) |
Disability Class: Ambulatory Difficulty
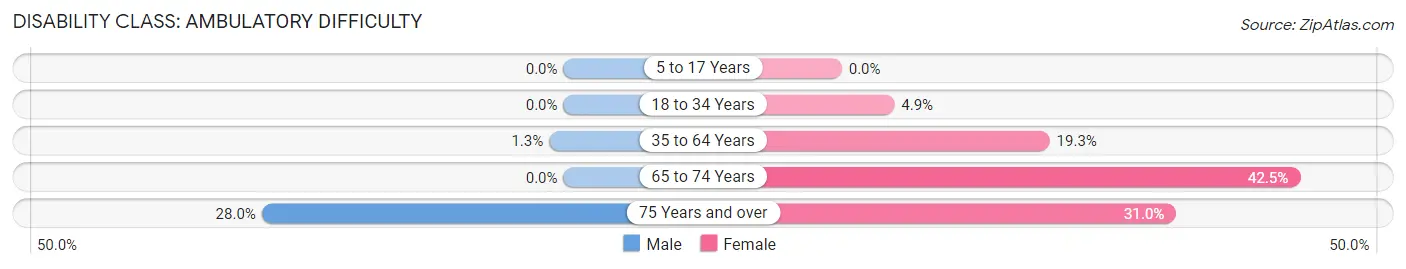
| Age Bracket | Male | Female |
| 5 to 17 Years | 0 (0.0%) | 0 (0.0%) |
| 18 to 34 Years | 0 (0.0%) | 4 (4.9%) |
| 35 to 64 Years | 3 (1.3%) | 54 (19.3%) |
| 65 to 74 Years | 0 (0.0%) | 37 (42.5%) |
| 75 Years and over | 7 (28.0%) | 9 (31.0%) |
Disability Class: Self-Care Difficulty
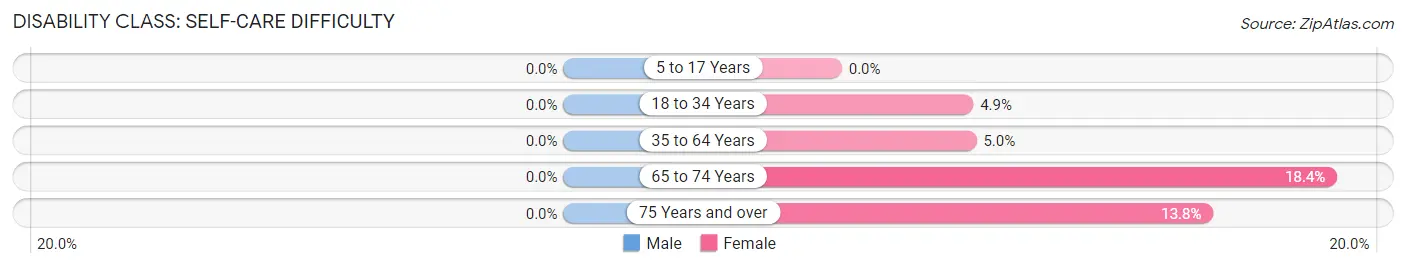
| Age Bracket | Male | Female |
| 5 to 17 Years | 0 (0.0%) | 0 (0.0%) |
| 18 to 34 Years | 0 (0.0%) | 4 (4.9%) |
| 35 to 64 Years | 0 (0.0%) | 14 (5.0%) |
| 65 to 74 Years | 0 (0.0%) | 16 (18.4%) |
| 75 Years and over | 0 (0.0%) | 4 (13.8%) |
Technology Access in Nassau
Computing Device Access in Nassau
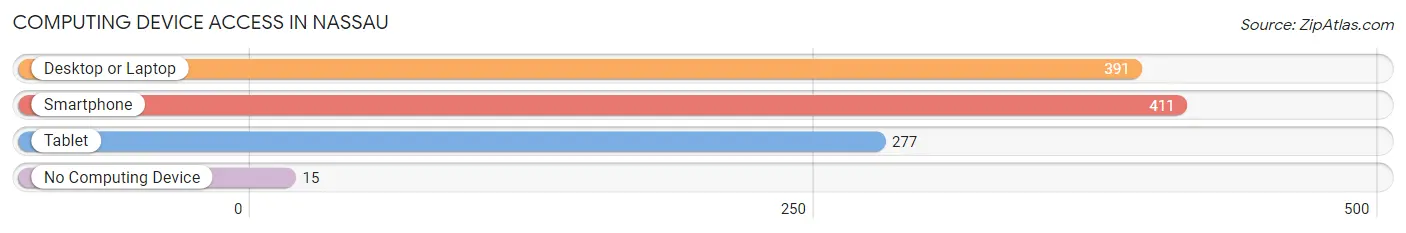
| Device Type | # Households | % Households |
| Desktop or Laptop | 391 | 83.4% |
| Smartphone | 411 | 87.6% |
| Tablet | 277 | 59.1% |
| No Computing Device | 15 | 3.2% |
| Total | 469 | 100.0% |
Internet Access in Nassau
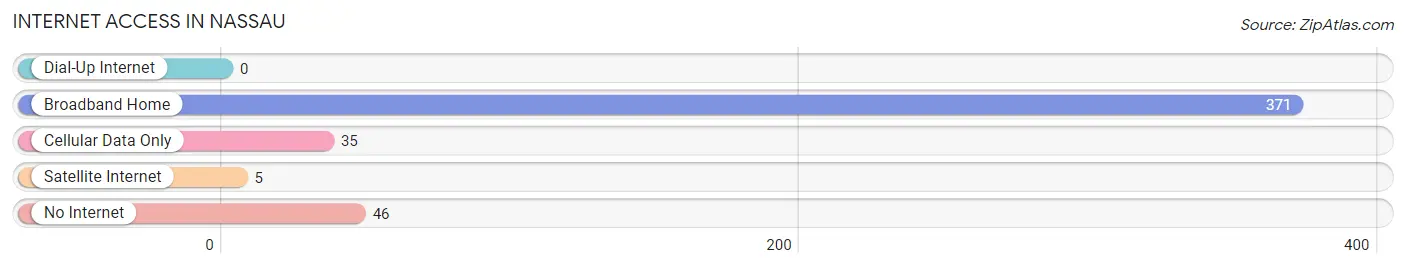
| Internet Type | # Households | % Households |
| Dial-Up Internet | 0 | 0.0% |
| Broadband Home | 371 | 79.1% |
| Cellular Data Only | 35 | 7.5% |
| Satellite Internet | 5 | 1.1% |
| No Internet | 46 | 9.8% |
| Total | 469 | 100.0% |
Nassau Summary
Nassau is a county located in the state of New York, in the United States of America. It is located on the western end of Long Island, and is the most populous county in the state. Nassau County is home to a population of 1,339,532 people, as of the 2010 census. The county seat is located in Mineola, and the county is divided into three towns and two cities. The towns are Hempstead, North Hempstead, and Oyster Bay, while the cities are Long Beach and Glen Cove.
Nassau County has a rich history, dating back to the 1600s when it was first settled by Dutch and English colonists. The county was named after the Dutch Prince of Orange, William of Nassau. The county was originally part of Queens County, but was split off in 1899. The county has seen a great deal of growth and development over the years, and is now a major economic center in the region.
Geographically, Nassau County is located on the western end of Long Island, and is bordered by Suffolk County to the east, Queens County to the west, and the Atlantic Ocean to the south. The county is divided into three towns and two cities, and is home to a number of villages and hamlets. The county is home to a number of parks and beaches, as well as a number of historic sites.
The economy of Nassau County is largely based on the service industry, with a large number of businesses providing services to the local population. The county is also home to a number of large corporations, such as Northrop Grumman, Cablevision, and Canon USA. The county is also home to a number of educational institutions, including Hofstra University, Nassau Community College, and Adelphi University.
Demographically, Nassau County is home to a diverse population. The population is largely white, with a large number of African Americans, Hispanics, and Asians. The median household income in the county is $90,890, and the median age is 40. The county is also home to a large number of immigrants, with a large number of people coming from Latin America, Asia, and the Caribbean.
Nassau County is a vibrant and diverse county, with a rich history and a strong economy. The county is home to a number of parks and beaches, as well as a number of educational institutions. The county is also home to a diverse population, with a large number of immigrants and a strong economy.
Common Questions
What is the Total Population of Nassau?
Total Population of Nassau is 1,169.
What is the Total Male Population of Nassau?
Total Male Population of Nassau is 588.
What is the Total Female Population of Nassau?
Total Female Population of Nassau is 581.
What is the Ratio of Males per 100 Females in Nassau?
There are 101.20 Males per 100 Females in Nassau.
What is the Ratio of Females per 100 Males in Nassau?
There are 98.81 Females per 100 Males in Nassau.
What is the Median Population Age in Nassau?
Median Population Age in Nassau is 41.9 Years.
What is the Average Family Size in Nassau
Average Family Size in Nassau is 3.1 People.
What is the Average Household Size in Nassau
Average Household Size in Nassau is 2.5 People.
What is Per Capita Income in Nassau?
Per Capita income in Nassau is $36,351.
What is the Median Family Income in Nassau?
Median Family Income in Nassau is $92,450.
What is the Median Household income in Nassau?
Median Household Income in Nassau is $74,931.
What is Income or Wage Gap in Nassau?
Income or Wage Gap in Nassau is 26.0%.
Women in Nassau earn 74.0 cents for every dollar earned by a man.
What is Inequality or Gini Index in Nassau?
Inequality or Gini Index in Nassau is 0.41.
How Large is the Labor Force in Nassau?
There are 672 People in the Labor Forcein in Nassau.
What is the Percentage of People in the Labor Force in Nassau?
69.9% of People are in the Labor Force in Nassau.
What is the Unemployment Rate in Nassau?
Unemployment Rate in Nassau is 11.4%.