Mattituck, NY
Mattituck Map
Mattituck Overview
4,800
TOTAL POPULATION
2,310
MALE POPULATION
2,490
FEMALE POPULATION
92.77
MALES / 100 FEMALES
107.79
FEMALES / 100 MALES
50.1
MEDIAN AGE
2.9
AVG FAMILY SIZE
2.4
AVG HOUSEHOLD SIZE
$55,569
PER CAPITA INCOME
$131,611
AVG FAMILY INCOME
$106,813
AVG HOUSEHOLD INCOME
3.8%
WAGE / INCOME GAP [ % ]
96.2¢/ $1
WAGE / INCOME GAP [ $ ]
0.37
INEQUALITY / GINI INDEX
2,414
LABOR FORCE [ PEOPLE ]
57.4%
PERCENT IN LABOR FORCE
8.2%
UNEMPLOYMENT RATE
Mattituck Zip Codes
Mattituck Area Codes
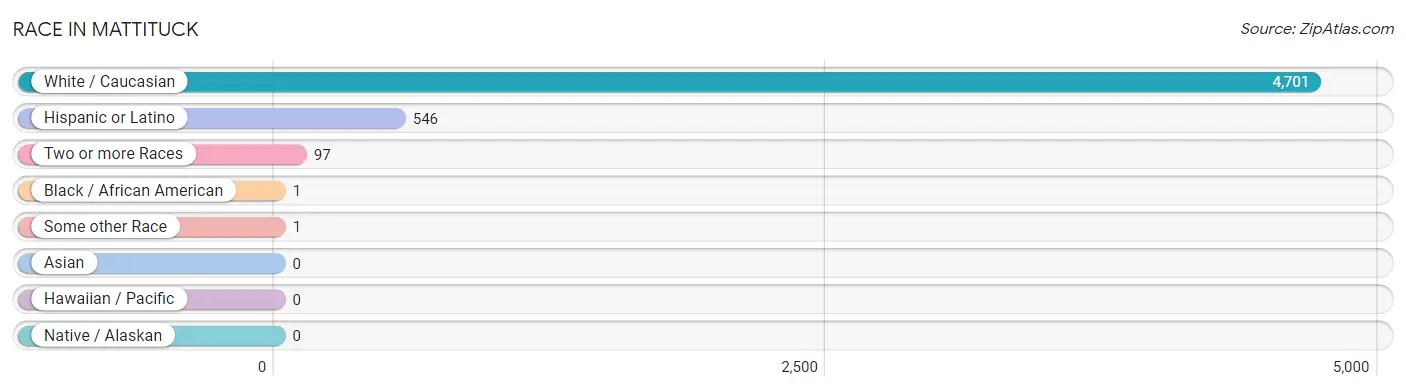
Race in Mattituck
The most populous races in Mattituck are White / Caucasian (4,701 | 97.9%), Hispanic or Latino (546 | 11.4%), and Two or more Races (97 | 2.0%).
| Race | # Population | % Population |
| Asian | 0 | 0.0% |
| Black / African American | 1 | 0.0% |
| Hawaiian / Pacific | 0 | 0.0% |
| Hispanic or Latino | 546 | 11.4% |
| Native / Alaskan | 0 | 0.0% |
| White / Caucasian | 4,701 | 97.9% |
| Two or more Races | 97 | 2.0% |
| Some other Race | 1 | 0.0% |
| Total | 4,800 | 100.0% |
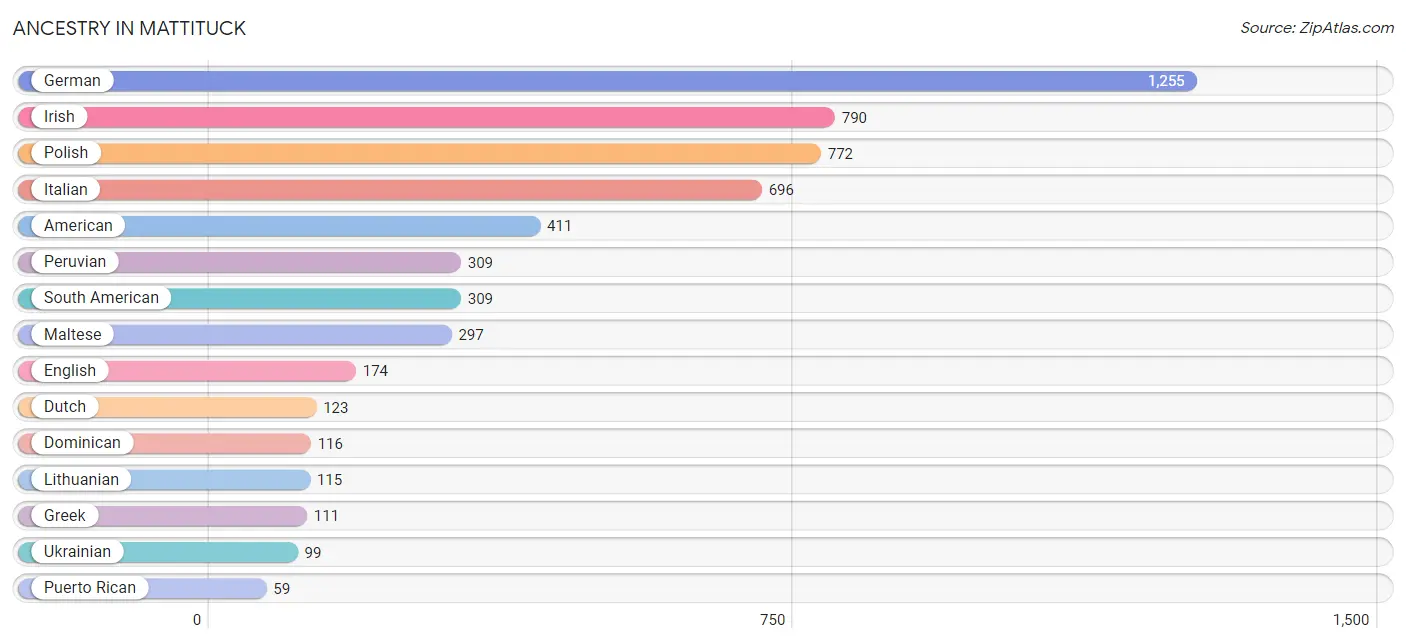
Ancestry in Mattituck
The most populous ancestries reported in Mattituck are German (1,255 | 26.2%), Irish (790 | 16.5%), Polish (772 | 16.1%), Italian (696 | 14.5%), and American (411 | 8.6%), together accounting for 81.8% of all Mattituck residents.
| Ancestry | # Population | % Population |
| American | 411 | 8.6% |
| Austrian | 13 | 0.3% |
| British | 18 | 0.4% |
| Celtic | 21 | 0.4% |
| Central American Indian | 30 | 0.6% |
| Czechoslovakian | 19 | 0.4% |
| Dominican | 116 | 2.4% |
| Dutch | 123 | 2.6% |
| English | 174 | 3.6% |
| European | 23 | 0.5% |
| French | 39 | 0.8% |
| German | 1,255 | 26.2% |
| Greek | 111 | 2.3% |
| Hungarian | 48 | 1.0% |
| Irish | 790 | 16.5% |
| Italian | 696 | 14.5% |
| Lithuanian | 115 | 2.4% |
| Maltese | 297 | 6.2% |
| Mexican | 49 | 1.0% |
| Peruvian | 309 | 6.4% |
| Polish | 772 | 16.1% |
| Puerto Rican | 59 | 1.2% |
| Russian | 18 | 0.4% |
| Scandinavian | 21 | 0.4% |
| Scotch-Irish | 24 | 0.5% |
| Scottish | 22 | 0.5% |
| Slovak | 14 | 0.3% |
| South American | 309 | 6.4% |
| Swedish | 21 | 0.4% |
| Ukrainian | 99 | 2.1% |
| Welsh | 22 | 0.5% | View All 31 Rows |
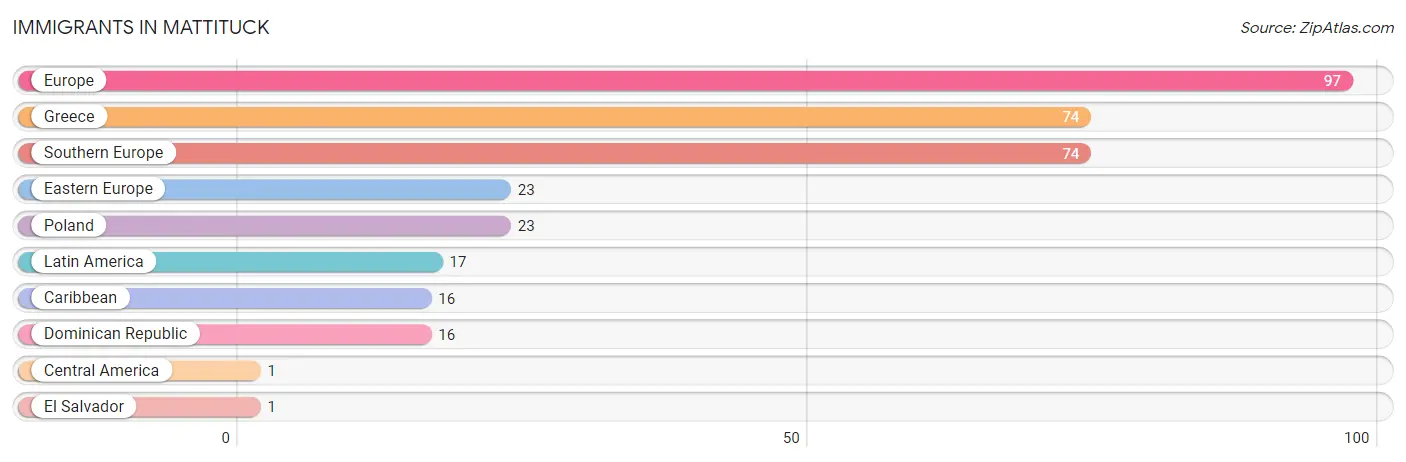
Immigrants in Mattituck
The most numerous immigrant groups reported in Mattituck came from Europe (97 | 2.0%), Greece (74 | 1.5%), Southern Europe (74 | 1.5%), Eastern Europe (23 | 0.5%), and Poland (23 | 0.5%), together accounting for 6.1% of all Mattituck residents.
| Immigration Origin | # Population | % Population |
| Caribbean | 16 | 0.3% |
| Central America | 1 | 0.0% |
| Dominican Republic | 16 | 0.3% |
| Eastern Europe | 23 | 0.5% |
| El Salvador | 1 | 0.0% |
| Europe | 97 | 2.0% |
| Greece | 74 | 1.5% |
| Latin America | 17 | 0.4% |
| Poland | 23 | 0.5% |
| Southern Europe | 74 | 1.5% | View All 10 Rows |
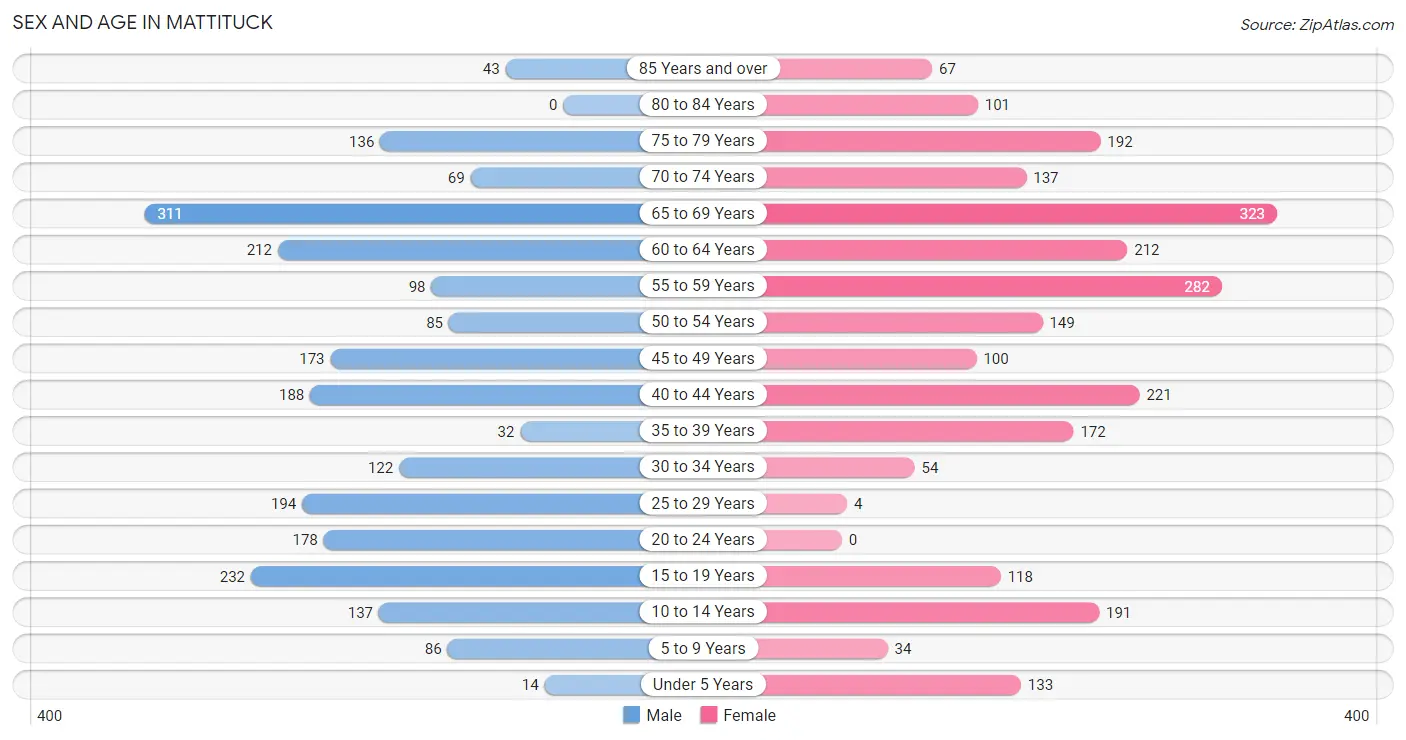
Sex and Age in Mattituck
Sex and Age in Mattituck
The most populous age groups in Mattituck are 65 to 69 Years (311 | 13.5%) for men and 65 to 69 Years (323 | 13.0%) for women.
| Age Bracket | Male | Female |
| Under 5 Years | 14 (0.6%) | 133 (5.3%) |
| 5 to 9 Years | 86 (3.7%) | 34 (1.4%) |
| 10 to 14 Years | 137 (5.9%) | 191 (7.7%) |
| 15 to 19 Years | 232 (10.0%) | 118 (4.7%) |
| 20 to 24 Years | 178 (7.7%) | 0 (0.0%) |
| 25 to 29 Years | 194 (8.4%) | 4 (0.2%) |
| 30 to 34 Years | 122 (5.3%) | 54 (2.2%) |
| 35 to 39 Years | 32 (1.4%) | 172 (6.9%) |
| 40 to 44 Years | 188 (8.1%) | 221 (8.9%) |
| 45 to 49 Years | 173 (7.5%) | 100 (4.0%) |
| 50 to 54 Years | 85 (3.7%) | 149 (6.0%) |
| 55 to 59 Years | 98 (4.2%) | 282 (11.3%) |
| 60 to 64 Years | 212 (9.2%) | 212 (8.5%) |
| 65 to 69 Years | 311 (13.5%) | 323 (13.0%) |
| 70 to 74 Years | 69 (3.0%) | 137 (5.5%) |
| 75 to 79 Years | 136 (5.9%) | 192 (7.7%) |
| 80 to 84 Years | 0 (0.0%) | 101 (4.1%) |
| 85 Years and over | 43 (1.9%) | 67 (2.7%) |
| Total | 2,310 (100.0%) | 2,490 (100.0%) |
Families and Households in Mattituck
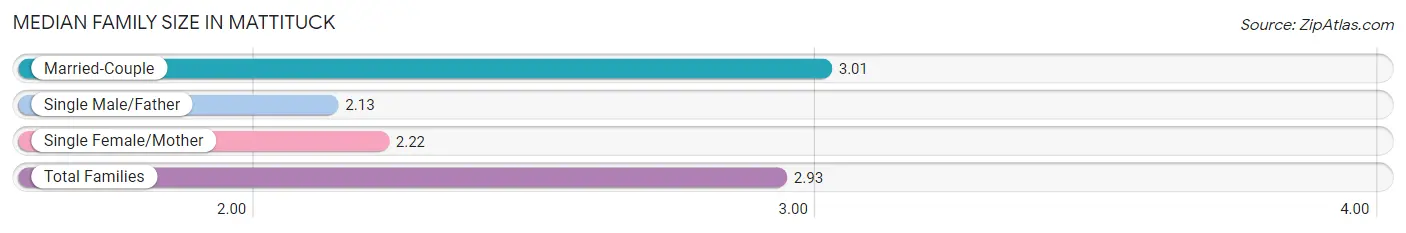
Median Family Size in Mattituck
The median family size in Mattituck is 2.93 persons per family, with married-couple families (1,309 | 89.3%) accounting for the largest median family size of 3.01 persons per family. On the other hand, single male/father families (15 | 1.0%) represent the smallest median family size with 2.13 persons per family.
| Family Type | # Families | Family Size |
| Married-Couple | 1,309 (89.3%) | 3.01 |
| Single Male/Father | 15 (1.0%) | 2.13 |
| Single Female/Mother | 141 (9.6%) | 2.22 |
| Total Families | 1,465 (100.0%) | 2.93 |
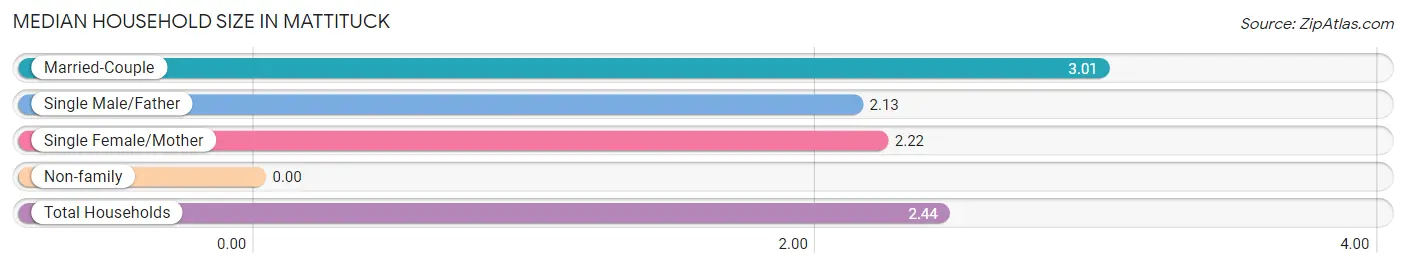
Median Household Size in Mattituck
| Household Type | # Households | Household Size |
| Married-Couple | 1,309 (66.7%) | 3.01 |
| Single Male/Father | 15 (0.8%) | 2.13 |
| Single Female/Mother | 141 (7.2%) | 2.22 |
| Non-family | 498 (25.4%) | - |
| Total Households | 1,963 (100.0%) | 2.44 |
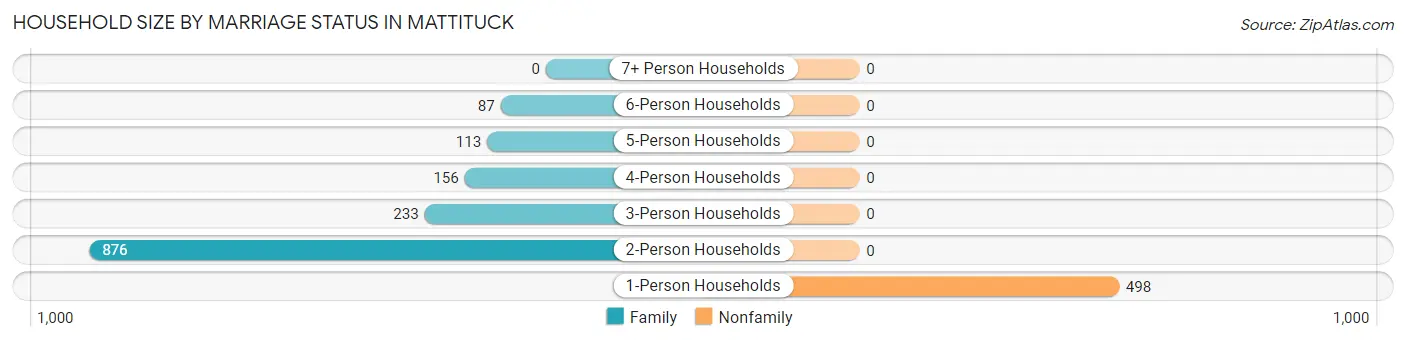
Household Size by Marriage Status in Mattituck
Out of a total of 1,963 households in Mattituck, 1,465 (74.6%) are family households, while 498 (25.4%) are nonfamily households. The most numerous type of family households are 2-person households, comprising 876, and the most common type of nonfamily households are 1-person households, comprising 498.
| Household Size | Family Households | Nonfamily Households |
| 1-Person Households | - | 498 (25.4%) |
| 2-Person Households | 876 (44.6%) | 0 (0.0%) |
| 3-Person Households | 233 (11.9%) | 0 (0.0%) |
| 4-Person Households | 156 (8.0%) | 0 (0.0%) |
| 5-Person Households | 113 (5.8%) | 0 (0.0%) |
| 6-Person Households | 87 (4.4%) | 0 (0.0%) |
| 7+ Person Households | 0 (0.0%) | 0 (0.0%) |
| Total | 1,465 (74.6%) | 498 (25.4%) |
Female Fertility in Mattituck
Fertility by Age in Mattituck
Average fertility rate in Mattituck is 162.0 births per 1,000 women. Women in the age bracket of 20 to 34 years have the highest fertility rate with 638.0 births per 1,000 women. Women in the age bracket of 35 to 50 years acount for 70.2% of all women with births.
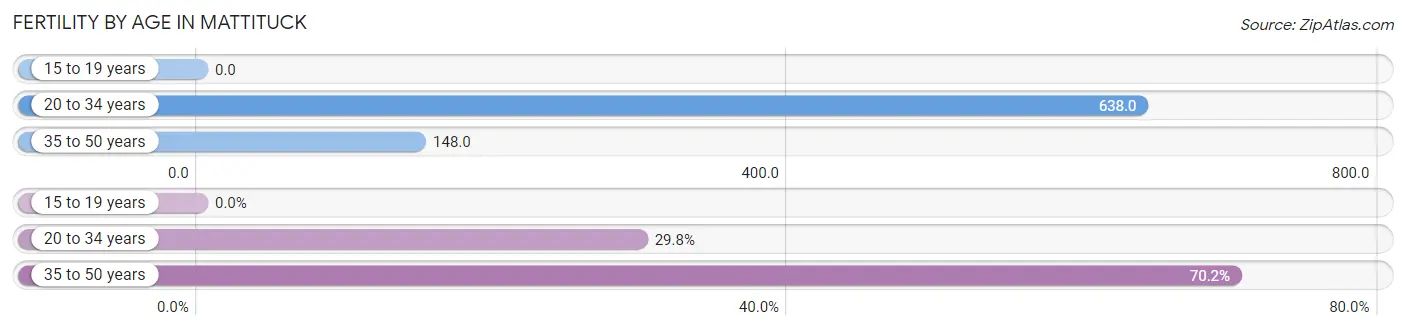
| Age Bracket | Women with Births | Births / 1,000 Women |
| 15 to 19 years | 0 (0.0%) | 0.0 |
| 20 to 34 years | 37 (29.8%) | 638.0 |
| 35 to 50 years | 87 (70.2%) | 148.0 |
| Total | 124 (100.0%) | 162.0 |
Fertility by Age by Marriage Status in Mattituck
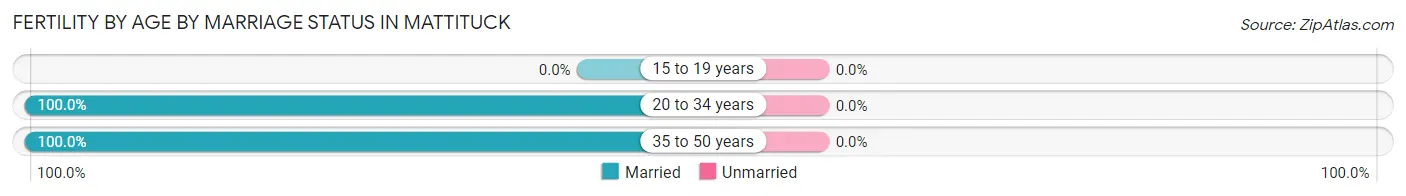
| Age Bracket | Married | Unmarried |
| 15 to 19 years | 0 (0.0%) | 0 (0.0%) |
| 20 to 34 years | 37 (100.0%) | 0 (0.0%) |
| 35 to 50 years | 87 (100.0%) | 0 (0.0%) |
| Total | 124 (100.0%) | 0 (0.0%) |
Fertility by Education in Mattituck
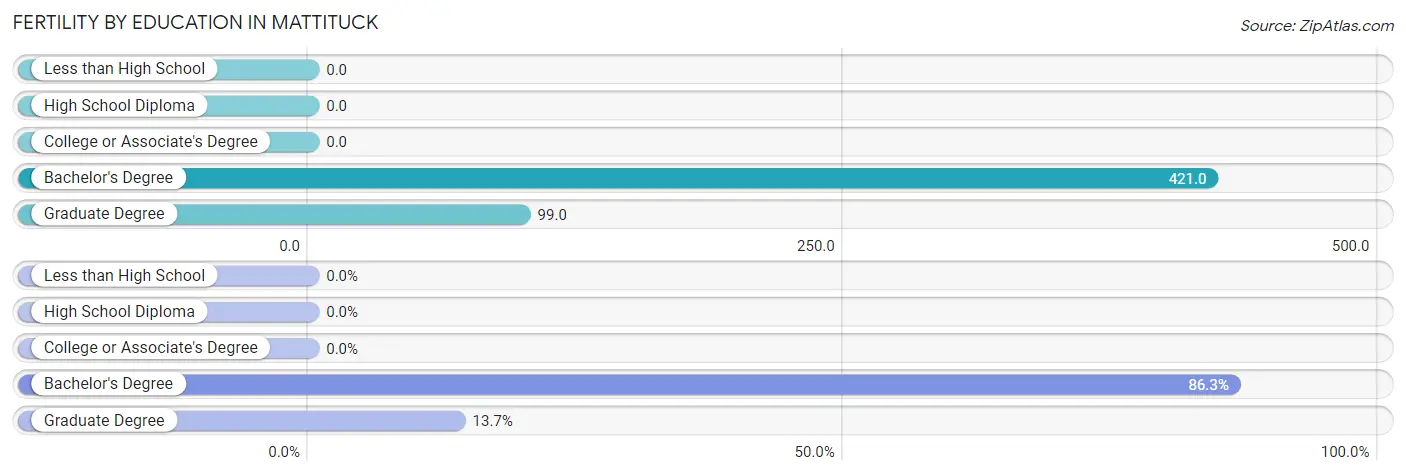
| Educational Attainment | Women with Births | Births / 1,000 Women |
| Less than High School | 0 (0.0%) | 0.0 |
| High School Diploma | 0 (0.0%) | 0.0 |
| College or Associate's Degree | 0 (0.0%) | 0.0 |
| Bachelor's Degree | 107 (86.3%) | 421.0 |
| Graduate Degree | 17 (13.7%) | 99.0 |
| Total | 124 (100.0%) | 162.0 |
Fertility by Education by Marriage Status in Mattituck
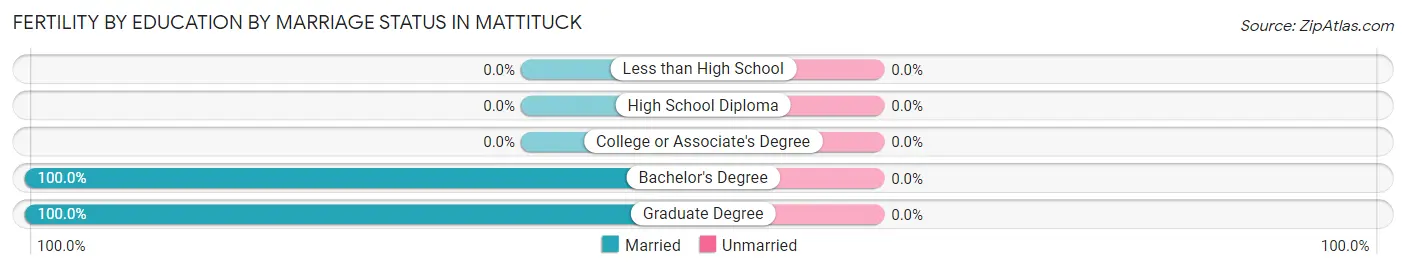
| Educational Attainment | Married | Unmarried |
| Less than High School | 0 (0.0%) | 0 (0.0%) |
| High School Diploma | 0 (0.0%) | 0 (0.0%) |
| College or Associate's Degree | 0 (0.0%) | 0 (0.0%) |
| Bachelor's Degree | 107 (100.0%) | 0 (0.0%) |
| Graduate Degree | 17 (100.0%) | 0 (0.0%) |
| Total | 124 (100.0%) | 0 (0.0%) |
Income in Mattituck
Income Overview in Mattituck
Per Capita Income in Mattituck is $55,569, while median incomes of families and households are $131,611 and $106,813 respectively.
| Characteristic | Number | Measure |
| Per Capita Income | 4,800 | $55,569 |
| Median Family Income | 1,465 | $131,611 |
| Mean Family Income | 1,465 | $161,046 |
| Median Household Income | 1,963 | $106,813 |
| Mean Household Income | 1,963 | $133,385 |
| Income Deficit | 1,465 | $0 |
| Wage / Income Gap (%) | 4,800 | 3.75% |
| Wage / Income Gap ($) | 4,800 | 96.25¢ per $1 |
| Gini / Inequality Index | 4,800 | 0.37 |
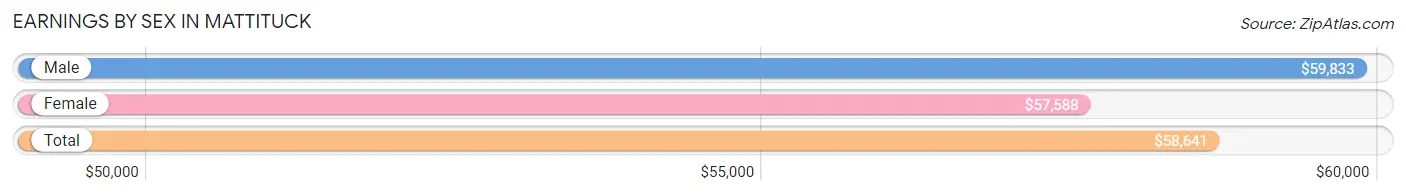
Earnings by Sex in Mattituck
Average Earnings in Mattituck are $58,641, $59,833 for men and $57,588 for women, a difference of 3.7%.
| Sex | Number | Average Earnings |
| Male | 1,294 (49.8%) | $59,833 |
| Female | 1,304 (50.2%) | $57,588 |
| Total | 2,598 (100.0%) | $58,641 |
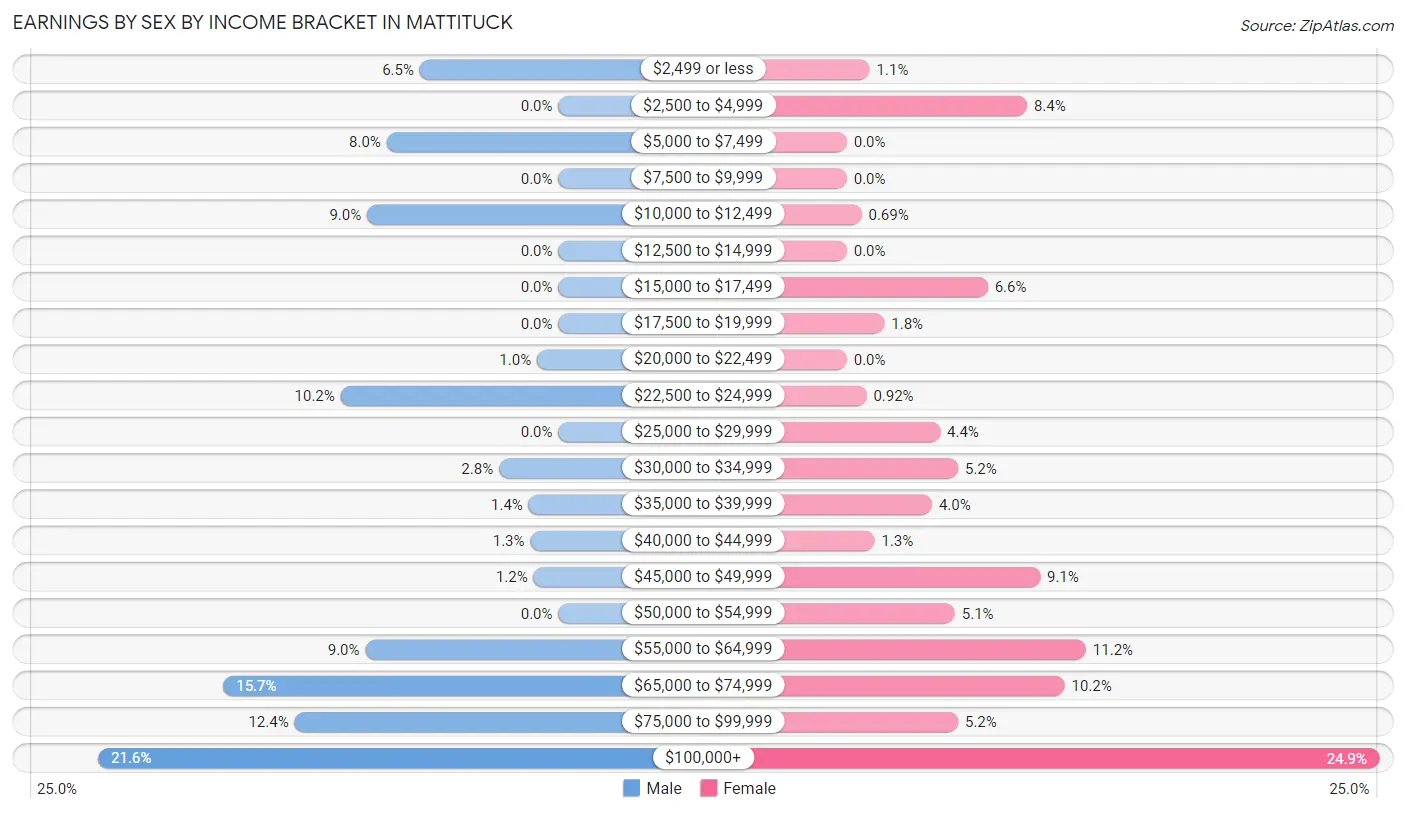
Earnings by Sex by Income Bracket in Mattituck
The most common earnings brackets in Mattituck are $100,000+ for men (279 | 21.6%) and $100,000+ for women (325 | 24.9%).
| Income | Male | Female |
| $2,499 or less | 84 (6.5%) | 14 (1.1%) |
| $2,500 to $4,999 | 0 (0.0%) | 110 (8.4%) |
| $5,000 to $7,499 | 104 (8.0%) | 0 (0.0%) |
| $7,500 to $9,999 | 0 (0.0%) | 0 (0.0%) |
| $10,000 to $12,499 | 116 (9.0%) | 9 (0.7%) |
| $12,500 to $14,999 | 0 (0.0%) | 0 (0.0%) |
| $15,000 to $17,499 | 0 (0.0%) | 86 (6.6%) |
| $17,500 to $19,999 | 0 (0.0%) | 23 (1.8%) |
| $20,000 to $22,499 | 13 (1.0%) | 0 (0.0%) |
| $22,500 to $24,999 | 132 (10.2%) | 12 (0.9%) |
| $25,000 to $29,999 | 0 (0.0%) | 57 (4.4%) |
| $30,000 to $34,999 | 36 (2.8%) | 68 (5.2%) |
| $35,000 to $39,999 | 18 (1.4%) | 52 (4.0%) |
| $40,000 to $44,999 | 17 (1.3%) | 17 (1.3%) |
| $45,000 to $49,999 | 15 (1.2%) | 118 (9.0%) |
| $50,000 to $54,999 | 0 (0.0%) | 66 (5.1%) |
| $55,000 to $64,999 | 117 (9.0%) | 146 (11.2%) |
| $65,000 to $74,999 | 203 (15.7%) | 133 (10.2%) |
| $75,000 to $99,999 | 160 (12.4%) | 68 (5.2%) |
| $100,000+ | 279 (21.6%) | 325 (24.9%) |
| Total | 1,294 (100.0%) | 1,304 (100.0%) |
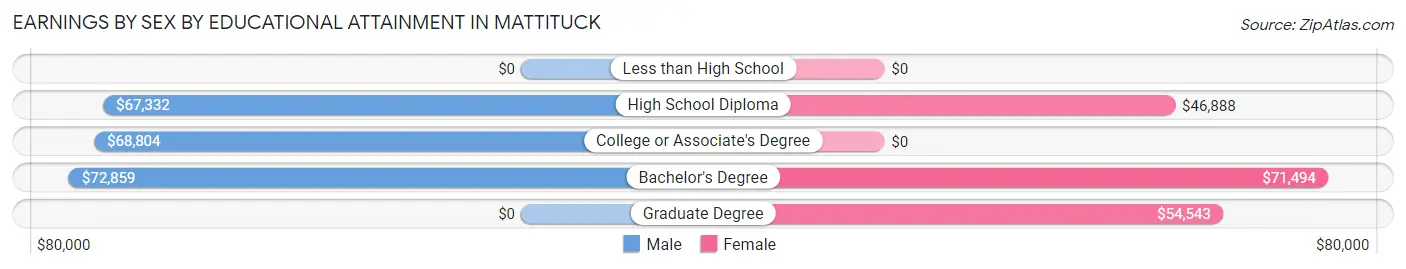
Earnings by Sex by Educational Attainment in Mattituck
Average earnings in Mattituck are $72,760 for men and $58,853 for women, a difference of 19.1%. Men with an educational attainment of bachelor's degree enjoy the highest average annual earnings of $72,859, while those with high school diploma education earn the least with $67,332. Women with an educational attainment of bachelor's degree earn the most with the average annual earnings of $71,494, while those with high school diploma education have the smallest earnings of $46,888.
| Educational Attainment | Male Income | Female Income |
| Less than High School | - | - |
| High School Diploma | $67,332 | $46,888 |
| College or Associate's Degree | $68,804 | $0 |
| Bachelor's Degree | $72,859 | $71,494 |
| Graduate Degree | - | - |
| Total | $72,760 | $58,853 |
Family Income in Mattituck
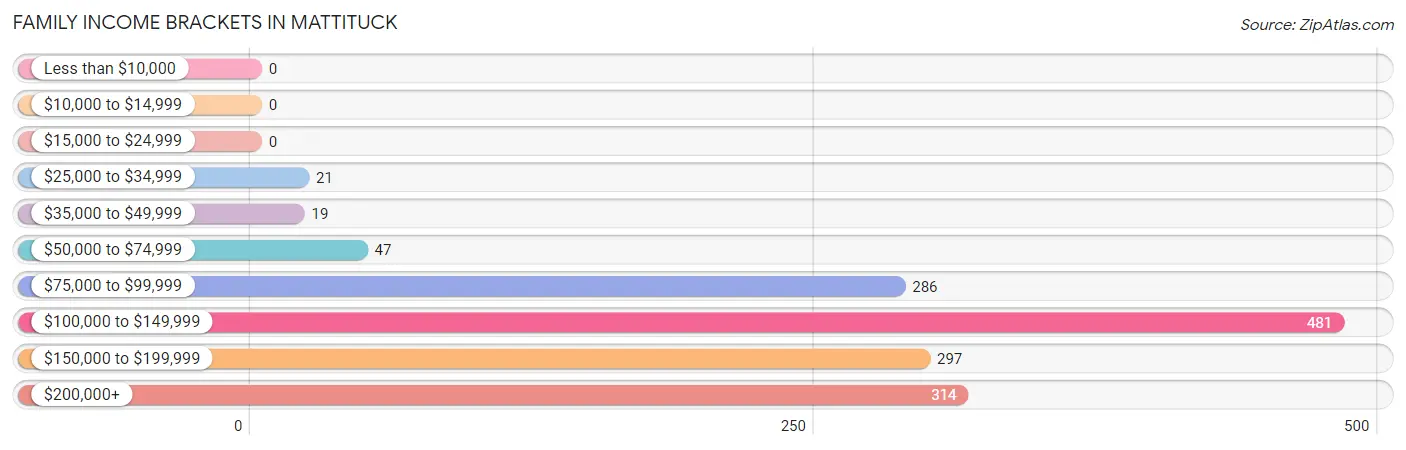
Family Income Brackets in Mattituck
According to the Mattituck family income data, there are 481 families falling into the $100,000 to $149,999 income range, which is the most common income bracket and makes up 32.8% of all families.
| Income Bracket | # Families | % Families |
| Less than $10,000 | 0 | 0.0% |
| $10,000 to $14,999 | 0 | 0.0% |
| $15,000 to $24,999 | 0 | 0.0% |
| $25,000 to $34,999 | 21 | 1.4% |
| $35,000 to $49,999 | 19 | 1.3% |
| $50,000 to $74,999 | 47 | 3.2% |
| $75,000 to $99,999 | 286 | 19.5% |
| $100,000 to $149,999 | 481 | 32.8% |
| $150,000 to $199,999 | 297 | 20.3% |
| $200,000+ | 314 | 21.4% |
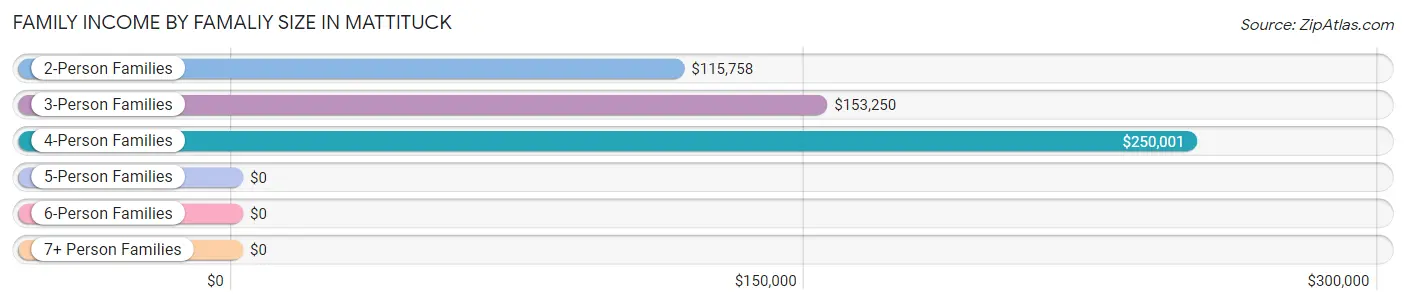
Family Income by Famaliy Size in Mattituck
4-person families (156 | 10.6%) account for the highest median family income in Mattituck with $250,001 per family, while 4-person families (156 | 10.6%) have the highest median income of $62,500 per family member.
| Income Bracket | # Families | Median Income |
| 2-Person Families | 876 (59.8%) | $115,758 |
| 3-Person Families | 233 (15.9%) | $153,250 |
| 4-Person Families | 156 (10.6%) | $250,001 |
| 5-Person Families | 113 (7.7%) | $0 |
| 6-Person Families | 87 (5.9%) | $0 |
| 7+ Person Families | 0 (0.0%) | $0 |
| Total | 1,465 (100.0%) | $131,611 |
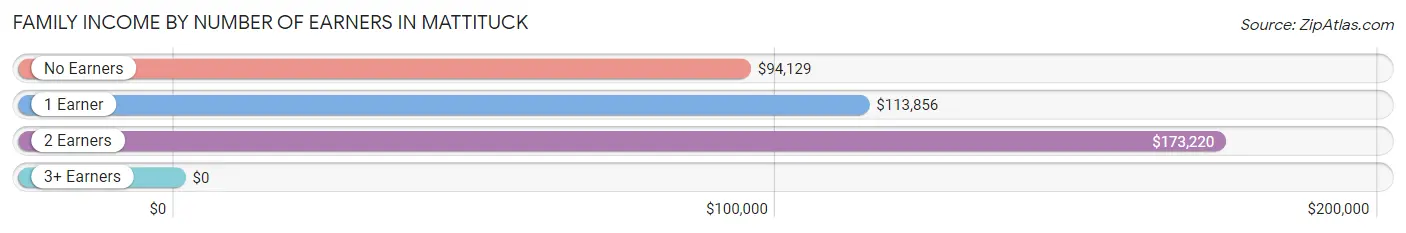
Family Income by Number of Earners in Mattituck
| Number of Earners | # Families | Median Income |
| No Earners | 336 (22.9%) | $94,129 |
| 1 Earner | 227 (15.5%) | $113,856 |
| 2 Earners | 723 (49.3%) | $173,220 |
| 3+ Earners | 179 (12.2%) | $0 |
| Total | 1,465 (100.0%) | $131,611 |
Household Income in Mattituck
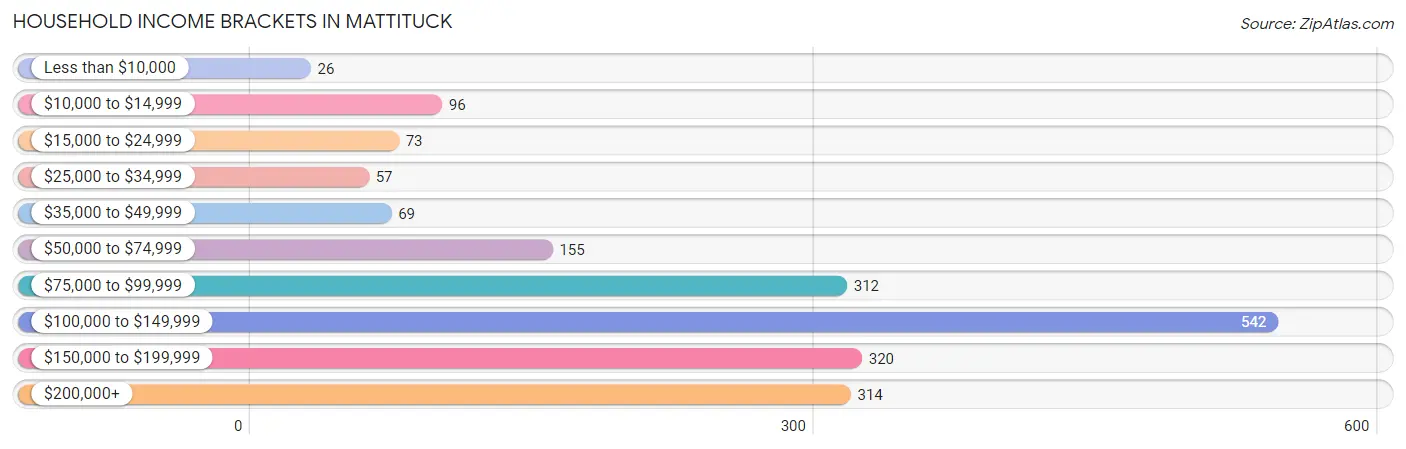
Household Income Brackets in Mattituck
With 542 households falling in the category, the $100,000 to $149,999 income range is the most frequent in Mattituck, accounting for 27.6% of all households. In contrast, only 26 households (1.3%) fall into the less than $10,000 income bracket, making it the least populous group.
| Income Bracket | # Households | % Households |
| Less than $10,000 | 26 | 1.3% |
| $10,000 to $14,999 | 96 | 4.9% |
| $15,000 to $24,999 | 73 | 3.7% |
| $25,000 to $34,999 | 57 | 2.9% |
| $35,000 to $49,999 | 69 | 3.5% |
| $50,000 to $74,999 | 155 | 7.9% |
| $75,000 to $99,999 | 312 | 15.9% |
| $100,000 to $149,999 | 542 | 27.6% |
| $150,000 to $199,999 | 320 | 16.3% |
| $200,000+ | 314 | 16.0% |
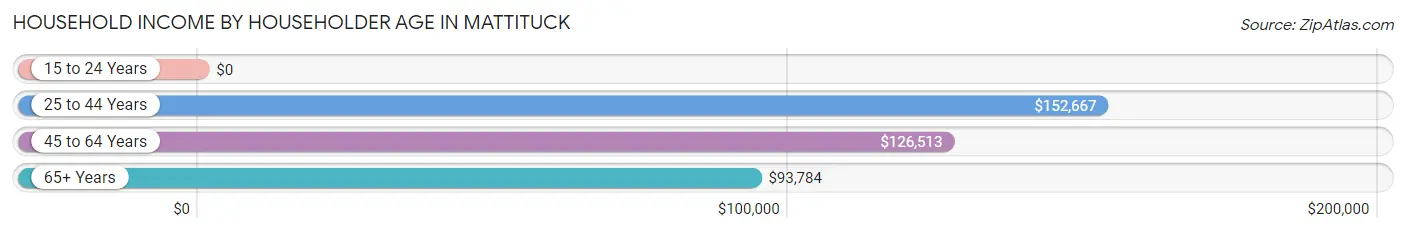
Household Income by Householder Age in Mattituck
The median household income in Mattituck is $106,813, with the highest median household income of $152,667 found in the 25 to 44 years age bracket for the primary householder. A total of 432 households (22.0%) fall into this category.
| Income Bracket | # Households | Median Income |
| 15 to 24 Years | 0 (0.0%) | $0 |
| 25 to 44 Years | 432 (22.0%) | $152,667 |
| 45 to 64 Years | 729 (37.1%) | $126,513 |
| 65+ Years | 802 (40.9%) | $93,784 |
| Total | 1,963 (100.0%) | $106,813 |
Poverty in Mattituck
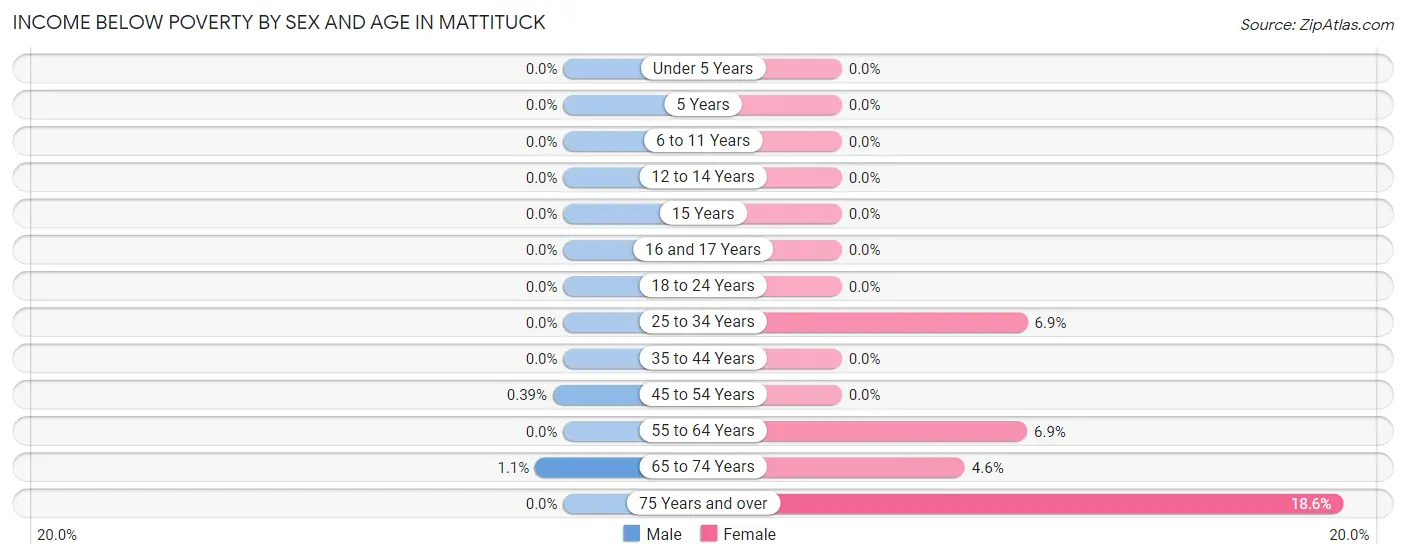
Income Below Poverty by Sex and Age in Mattituck
With 0.2% poverty level for males and 5.1% for females among the residents of Mattituck, 65 to 74 year old males and 75 year old and over females are the most vulnerable to poverty, with 4 males (1.1%) and 67 females (18.6%) in their respective age groups living below the poverty level.
| Age Bracket | Male | Female |
| Under 5 Years | 0 (0.0%) | 0 (0.0%) |
| 5 Years | 0 (0.0%) | 0 (0.0%) |
| 6 to 11 Years | 0 (0.0%) | 0 (0.0%) |
| 12 to 14 Years | 0 (0.0%) | 0 (0.0%) |
| 15 Years | 0 (0.0%) | 0 (0.0%) |
| 16 and 17 Years | 0 (0.0%) | 0 (0.0%) |
| 18 to 24 Years | 0 (0.0%) | 0 (0.0%) |
| 25 to 34 Years | 0 (0.0%) | 4 (6.9%) |
| 35 to 44 Years | 0 (0.0%) | 0 (0.0%) |
| 45 to 54 Years | 1 (0.4%) | 0 (0.0%) |
| 55 to 64 Years | 0 (0.0%) | 34 (6.9%) |
| 65 to 74 Years | 4 (1.1%) | 21 (4.6%) |
| 75 Years and over | 0 (0.0%) | 67 (18.6%) |
| Total | 5 (0.2%) | 126 (5.1%) |
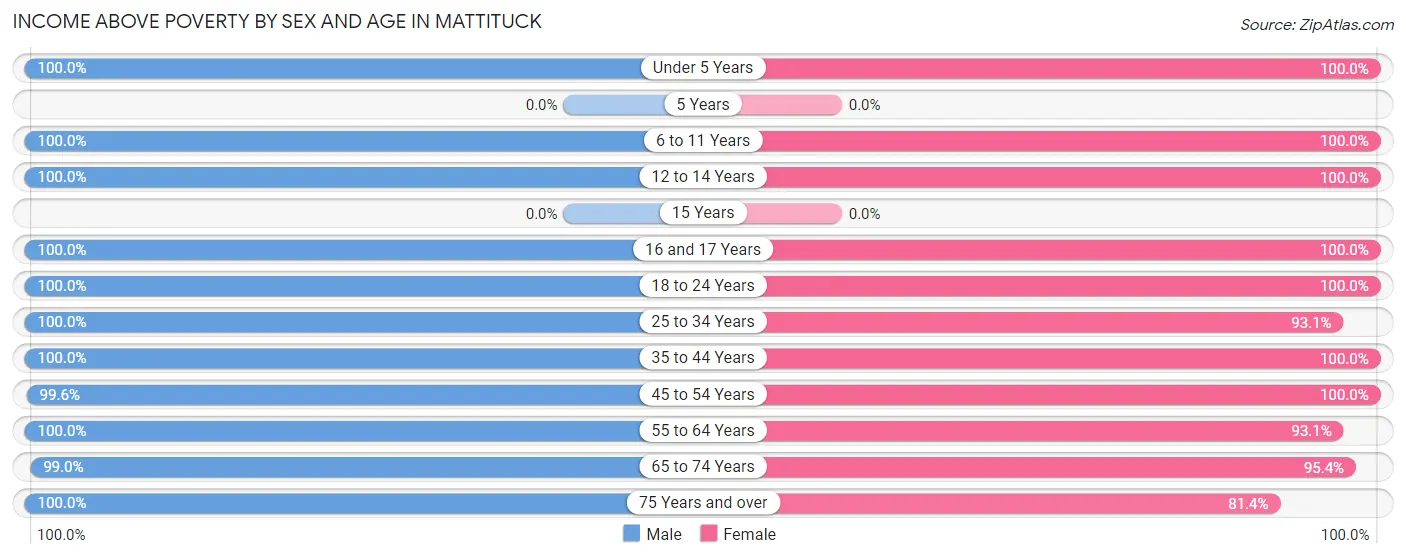
Income Above Poverty by Sex and Age in Mattituck
According to the poverty statistics in Mattituck, males aged under 5 years and females aged under 5 years are the age groups that are most secure financially, with 100.0% of males and 100.0% of females in these age groups living above the poverty line.
| Age Bracket | Male | Female |
| Under 5 Years | 14 (100.0%) | 133 (100.0%) |
| 5 Years | 0 (0.0%) | 0 (0.0%) |
| 6 to 11 Years | 106 (100.0%) | 87 (100.0%) |
| 12 to 14 Years | 117 (100.0%) | 138 (100.0%) |
| 15 Years | 0 (0.0%) | 0 (0.0%) |
| 16 and 17 Years | 197 (100.0%) | 32 (100.0%) |
| 18 to 24 Years | 213 (100.0%) | 86 (100.0%) |
| 25 to 34 Years | 316 (100.0%) | 54 (93.1%) |
| 35 to 44 Years | 220 (100.0%) | 393 (100.0%) |
| 45 to 54 Years | 257 (99.6%) | 249 (100.0%) |
| 55 to 64 Years | 310 (100.0%) | 460 (93.1%) |
| 65 to 74 Years | 376 (99.0%) | 439 (95.4%) |
| 75 Years and over | 179 (100.0%) | 293 (81.4%) |
| Total | 2,305 (99.8%) | 2,364 (94.9%) |
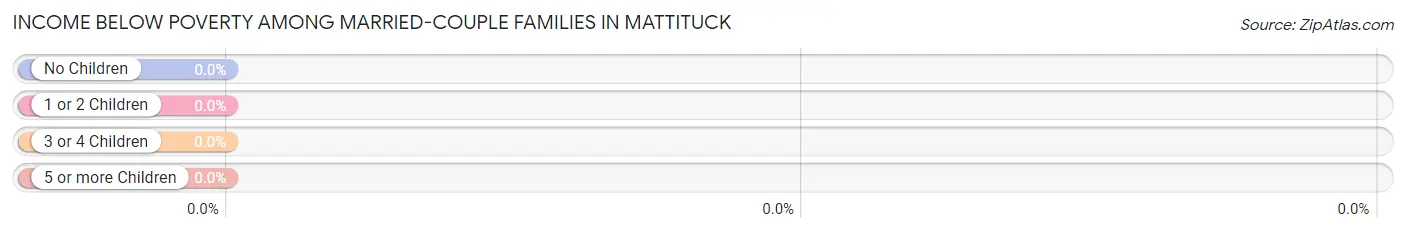
Income Below Poverty Among Married-Couple Families in Mattituck
| Children | Above Poverty | Below Poverty |
| No Children | 892 (100.0%) | 0 (0.0%) |
| 1 or 2 Children | 318 (100.0%) | 0 (0.0%) |
| 3 or 4 Children | 99 (100.0%) | 0 (0.0%) |
| 5 or more Children | 0 (0.0%) | 0 (0.0%) |
| Total | 1,309 (100.0%) | 0 (0.0%) |
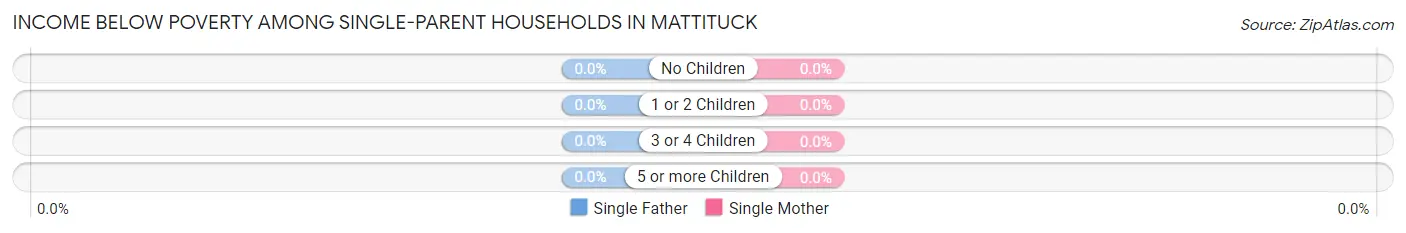
Income Below Poverty Among Single-Parent Households in Mattituck
| Children | Single Father | Single Mother |
| No Children | 0 (0.0%) | 0 (0.0%) |
| 1 or 2 Children | 0 (0.0%) | 0 (0.0%) |
| 3 or 4 Children | 0 (0.0%) | 0 (0.0%) |
| 5 or more Children | 0 (0.0%) | 0 (0.0%) |
| Total | 0 (0.0%) | 0 (0.0%) |
Income Below Poverty Among Married-Couple vs Single-Parent Households in Mattituck
| Children | Married-Couple Families | Single-Parent Households |
| No Children | 0 (0.0%) | 0 (0.0%) |
| 1 or 2 Children | 0 (0.0%) | 0 (0.0%) |
| 3 or 4 Children | 0 (0.0%) | 0 (0.0%) |
| 5 or more Children | 0 (0.0%) | 0 (0.0%) |
| Total | 0 (0.0%) | 0 (0.0%) |
Employment Characteristics in Mattituck
Employment by Class of Employer in Mattituck
Among the 2,144 employed individuals in Mattituck, private company employees (1,427 | 66.6%), local government employees (276 | 12.9%), and self-employed (incorporated) (118 | 5.5%) make up the most common classes of employment.
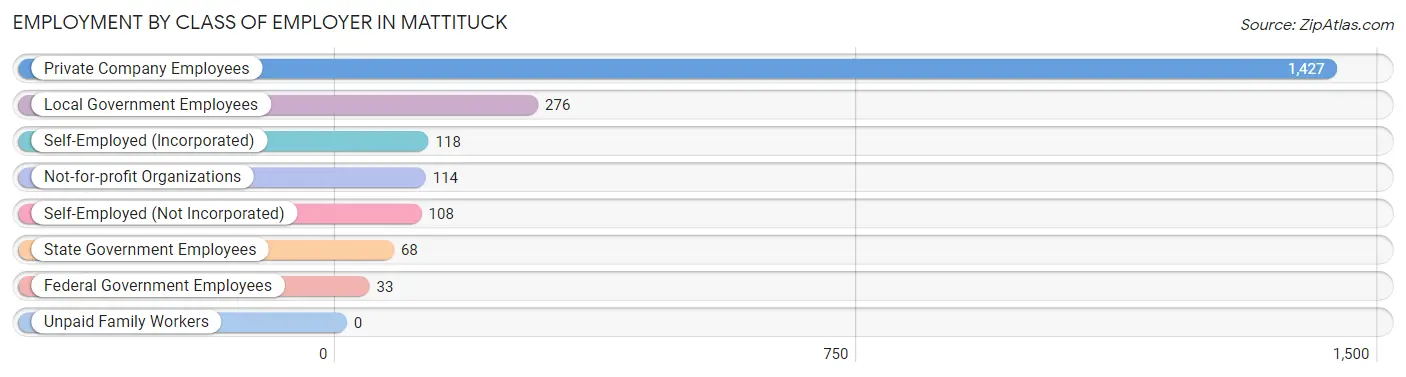
| Employer Class | # Employees | % Employees |
| Private Company Employees | 1,427 | 66.6% |
| Self-Employed (Incorporated) | 118 | 5.5% |
| Self-Employed (Not Incorporated) | 108 | 5.0% |
| Not-for-profit Organizations | 114 | 5.3% |
| Local Government Employees | 276 | 12.9% |
| State Government Employees | 68 | 3.2% |
| Federal Government Employees | 33 | 1.5% |
| Unpaid Family Workers | 0 | 0.0% |
| Total | 2,144 | 100.0% |
Employment Status by Age in Mattituck
According to the labor force statistics for Mattituck, out of the total population over 16 years of age (4,205), 57.4% or 2,414 individuals are in the labor force, with 8.2% or 198 of them unemployed. The age group with the highest labor force participation rate is 30 to 34 years, with 100.0% or 176 individuals in the labor force. Within the labor force, the 20 to 24 years age range has the highest percentage of unemployed individuals, with 100.0% or 116 of them being unemployed.
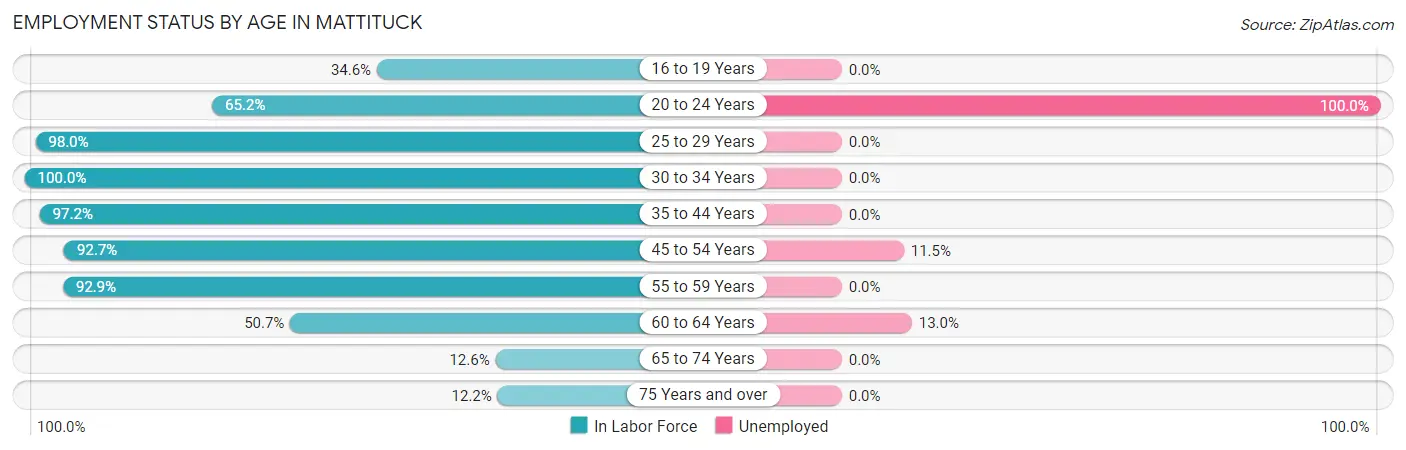
| Age Bracket | In Labor Force | Unemployed |
| 16 to 19 Years | 121 (34.6%) | 0 (0.0%) |
| 20 to 24 Years | 116 (65.2%) | 116 (100.0%) |
| 25 to 29 Years | 194 (98.0%) | 0 (0.0%) |
| 30 to 34 Years | 176 (100.0%) | 0 (0.0%) |
| 35 to 44 Years | 596 (97.2%) | 0 (0.0%) |
| 45 to 54 Years | 470 (92.7%) | 54 (11.5%) |
| 55 to 59 Years | 353 (92.9%) | 0 (0.0%) |
| 60 to 64 Years | 215 (50.7%) | 28 (13.0%) |
| 65 to 74 Years | 106 (12.6%) | 0 (0.0%) |
| 75 Years and over | 66 (12.2%) | 0 (0.0%) |
| Total | 2,414 (57.4%) | 198 (8.2%) |
Employment Status by Educational Attainment in Mattituck
According to labor force statistics for Mattituck, 87.2% of individuals (2,004) out of the total population between 25 and 64 years of age (2,298) are in the labor force, with 4.1% or 82 of them being unemployed. The group with the highest labor force participation rate are those with the educational attainment of less than high school, with 100.0% or 1 individuals in the labor force. Within the labor force, individuals with college / associate degree education have the highest percentage of unemployment, with 5.1% or 29 of them being unemployed.
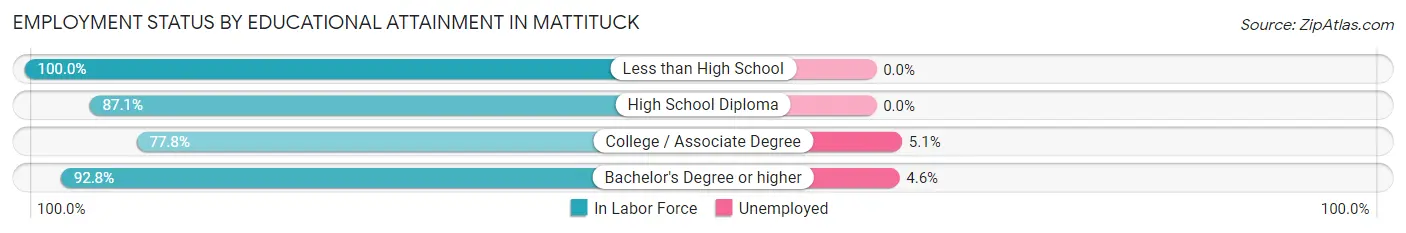
| Educational Attainment | In Labor Force | Unemployed |
| Less than High School | 1 (100.0%) | 0 (0.0%) |
| High School Diploma | 277 (87.1%) | 0 (0.0%) |
| College / Associate Degree | 571 (77.8%) | 37 (5.1%) |
| Bachelor's Degree or higher | 1,155 (92.8%) | 57 (4.6%) |
| Total | 2,004 (87.2%) | 94 (4.1%) |
Employment Occupations by Sex in Mattituck
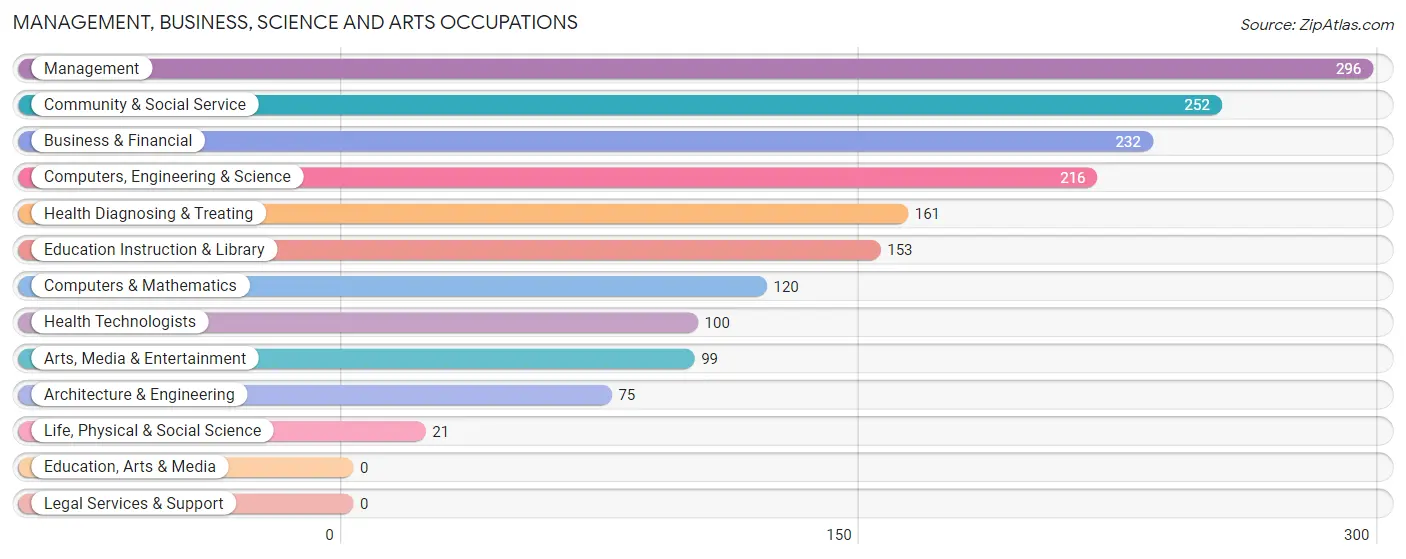
Management, Business, Science and Arts Occupations
The most common Management, Business, Science and Arts occupations in Mattituck are Management (296 | 13.4%), Community & Social Service (252 | 11.4%), Business & Financial (232 | 10.5%), Computers, Engineering & Science (216 | 9.8%), and Health Diagnosing & Treating (161 | 7.3%).
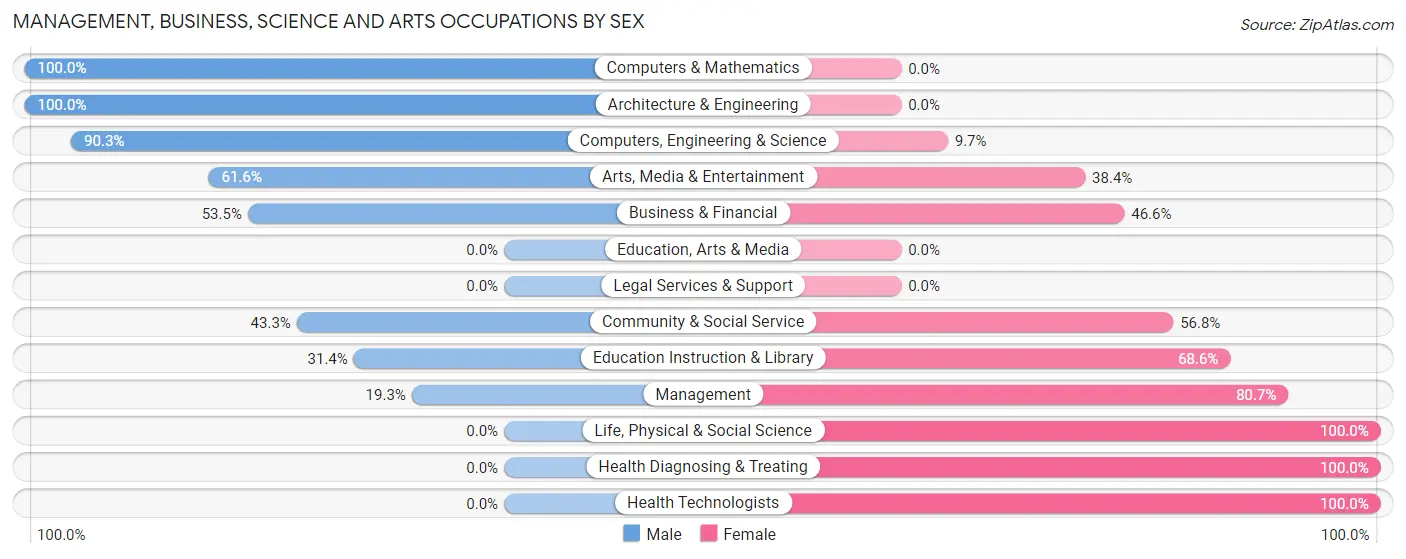
Management, Business, Science and Arts Occupations by Sex
Within the Management, Business, Science and Arts occupations in Mattituck, the most male-oriented occupations are Computers & Mathematics (100.0%), Architecture & Engineering (100.0%), and Computers, Engineering & Science (90.3%), while the most female-oriented occupations are Life, Physical & Social Science (100.0%), Health Diagnosing & Treating (100.0%), and Health Technologists (100.0%).
| Occupation | Male | Female |
| Management | 57 (19.3%) | 239 (80.7%) |
| Business & Financial | 124 (53.4%) | 108 (46.6%) |
| Computers, Engineering & Science | 195 (90.3%) | 21 (9.7%) |
| Computers & Mathematics | 120 (100.0%) | 0 (0.0%) |
| Architecture & Engineering | 75 (100.0%) | 0 (0.0%) |
| Life, Physical & Social Science | 0 (0.0%) | 21 (100.0%) |
| Community & Social Service | 109 (43.2%) | 143 (56.8%) |
| Education, Arts & Media | 0 (0.0%) | 0 (0.0%) |
| Legal Services & Support | 0 (0.0%) | 0 (0.0%) |
| Education Instruction & Library | 48 (31.4%) | 105 (68.6%) |
| Arts, Media & Entertainment | 61 (61.6%) | 38 (38.4%) |
| Health Diagnosing & Treating | 0 (0.0%) | 161 (100.0%) |
| Health Technologists | 0 (0.0%) | 100 (100.0%) |
| Total (Category) | 485 (41.9%) | 672 (58.1%) |
| Total (Overall) | 1,029 (46.5%) | 1,186 (53.5%) |
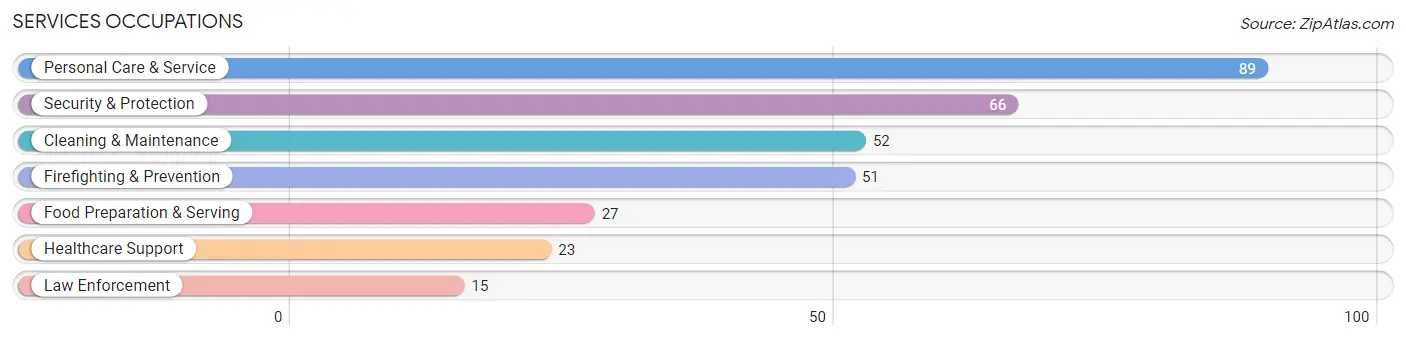
Services Occupations
The most common Services occupations in Mattituck are Personal Care & Service (89 | 4.0%), Security & Protection (66 | 3.0%), Cleaning & Maintenance (52 | 2.4%), Firefighting & Prevention (51 | 2.3%), and Food Preparation & Serving (27 | 1.2%).
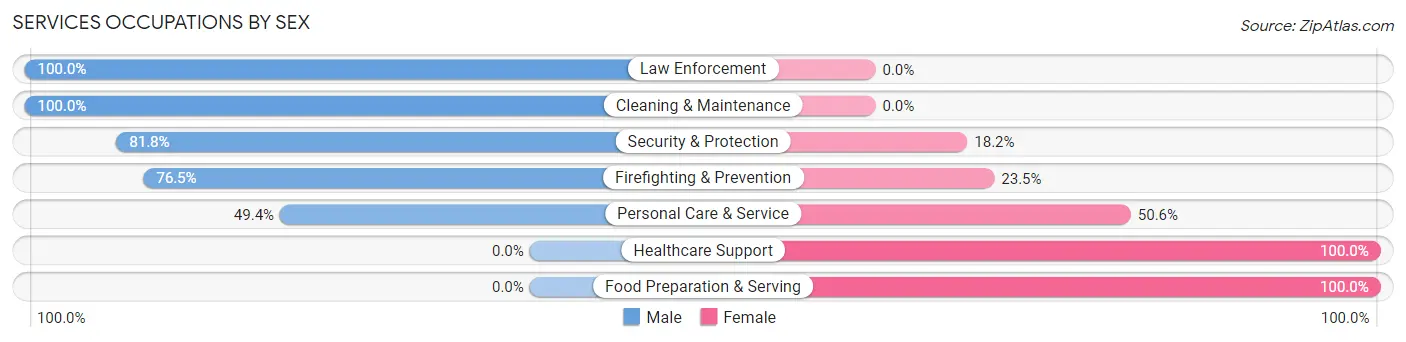
Services Occupations by Sex
Within the Services occupations in Mattituck, the most male-oriented occupations are Law Enforcement (100.0%), Cleaning & Maintenance (100.0%), and Security & Protection (81.8%), while the most female-oriented occupations are Healthcare Support (100.0%), Food Preparation & Serving (100.0%), and Personal Care & Service (50.6%).
| Occupation | Male | Female |
| Healthcare Support | 0 (0.0%) | 23 (100.0%) |
| Security & Protection | 54 (81.8%) | 12 (18.2%) |
| Firefighting & Prevention | 39 (76.5%) | 12 (23.5%) |
| Law Enforcement | 15 (100.0%) | 0 (0.0%) |
| Food Preparation & Serving | 0 (0.0%) | 27 (100.0%) |
| Cleaning & Maintenance | 52 (100.0%) | 0 (0.0%) |
| Personal Care & Service | 44 (49.4%) | 45 (50.6%) |
| Total (Category) | 150 (58.4%) | 107 (41.6%) |
| Total (Overall) | 1,029 (46.5%) | 1,186 (53.5%) |
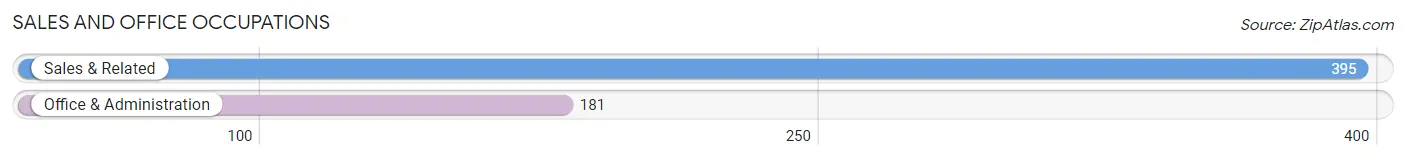
Sales and Office Occupations
The most common Sales and Office occupations in Mattituck are Sales & Related (395 | 17.8%), and Office & Administration (181 | 8.2%).
Sales and Office Occupations by Sex
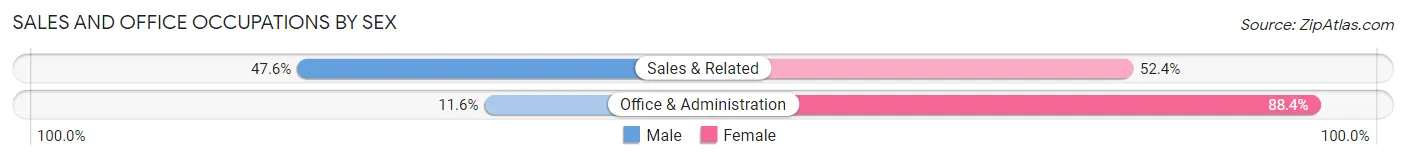
| Occupation | Male | Female |
| Sales & Related | 188 (47.6%) | 207 (52.4%) |
| Office & Administration | 21 (11.6%) | 160 (88.4%) |
| Total (Category) | 209 (36.3%) | 367 (63.7%) |
| Total (Overall) | 1,029 (46.5%) | 1,186 (53.5%) |
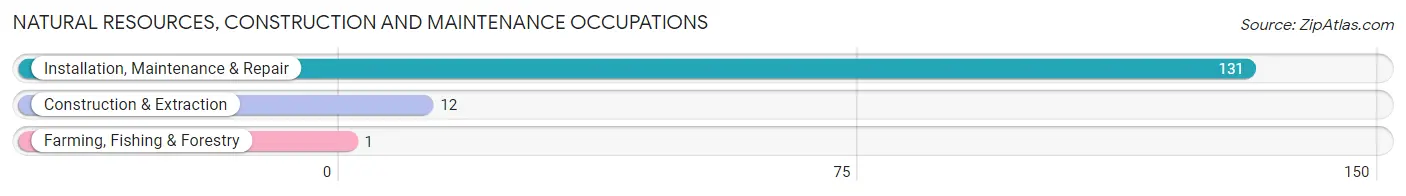
Natural Resources, Construction and Maintenance Occupations
The most common Natural Resources, Construction and Maintenance occupations in Mattituck are Installation, Maintenance & Repair (131 | 5.9%), Construction & Extraction (12 | 0.5%), and Farming, Fishing & Forestry (1 | 0.1%).
Natural Resources, Construction and Maintenance Occupations by Sex
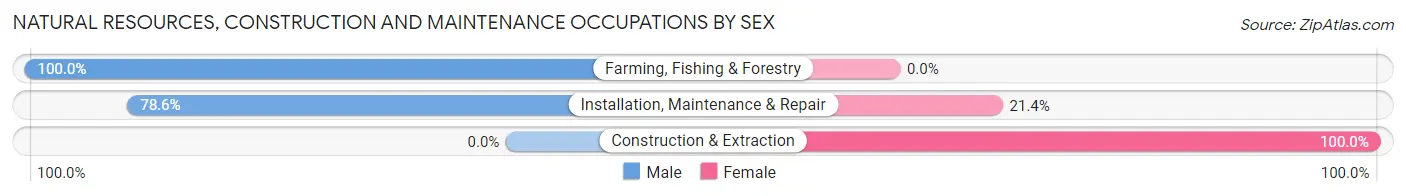
| Occupation | Male | Female |
| Farming, Fishing & Forestry | 1 (100.0%) | 0 (0.0%) |
| Construction & Extraction | 0 (0.0%) | 12 (100.0%) |
| Installation, Maintenance & Repair | 103 (78.6%) | 28 (21.4%) |
| Total (Category) | 104 (72.2%) | 40 (27.8%) |
| Total (Overall) | 1,029 (46.5%) | 1,186 (53.5%) |
Production, Transportation and Moving Occupations
The most common Production, Transportation and Moving occupations in Mattituck are Transportation (53 | 2.4%), and Production (28 | 1.3%).
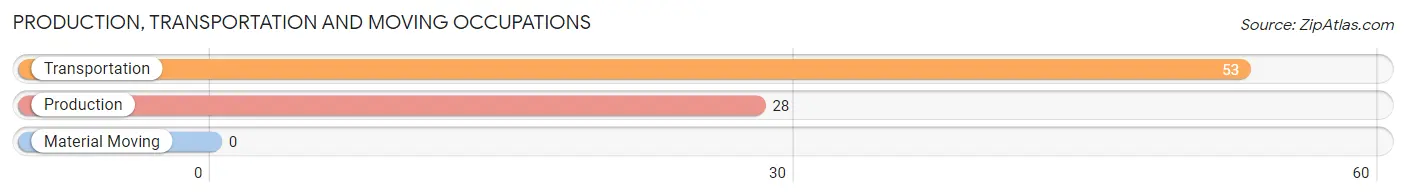
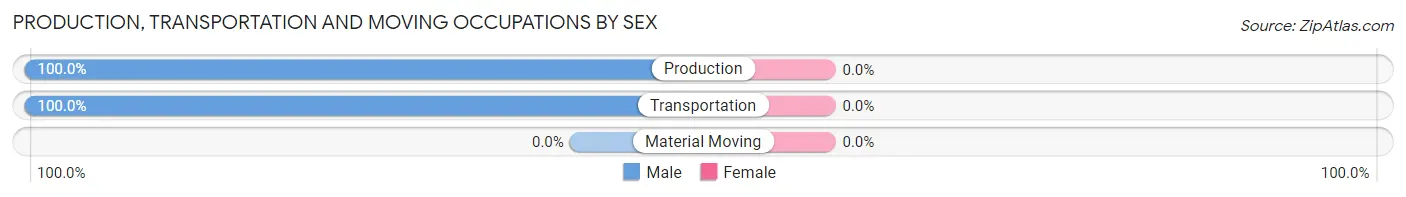
Production, Transportation and Moving Occupations by Sex
| Occupation | Male | Female |
| Production | 28 (100.0%) | 0 (0.0%) |
| Transportation | 53 (100.0%) | 0 (0.0%) |
| Material Moving | 0 (0.0%) | 0 (0.0%) |
| Total (Category) | 81 (100.0%) | 0 (0.0%) |
| Total (Overall) | 1,029 (46.5%) | 1,186 (53.5%) |
Employment Industries by Sex in Mattituck
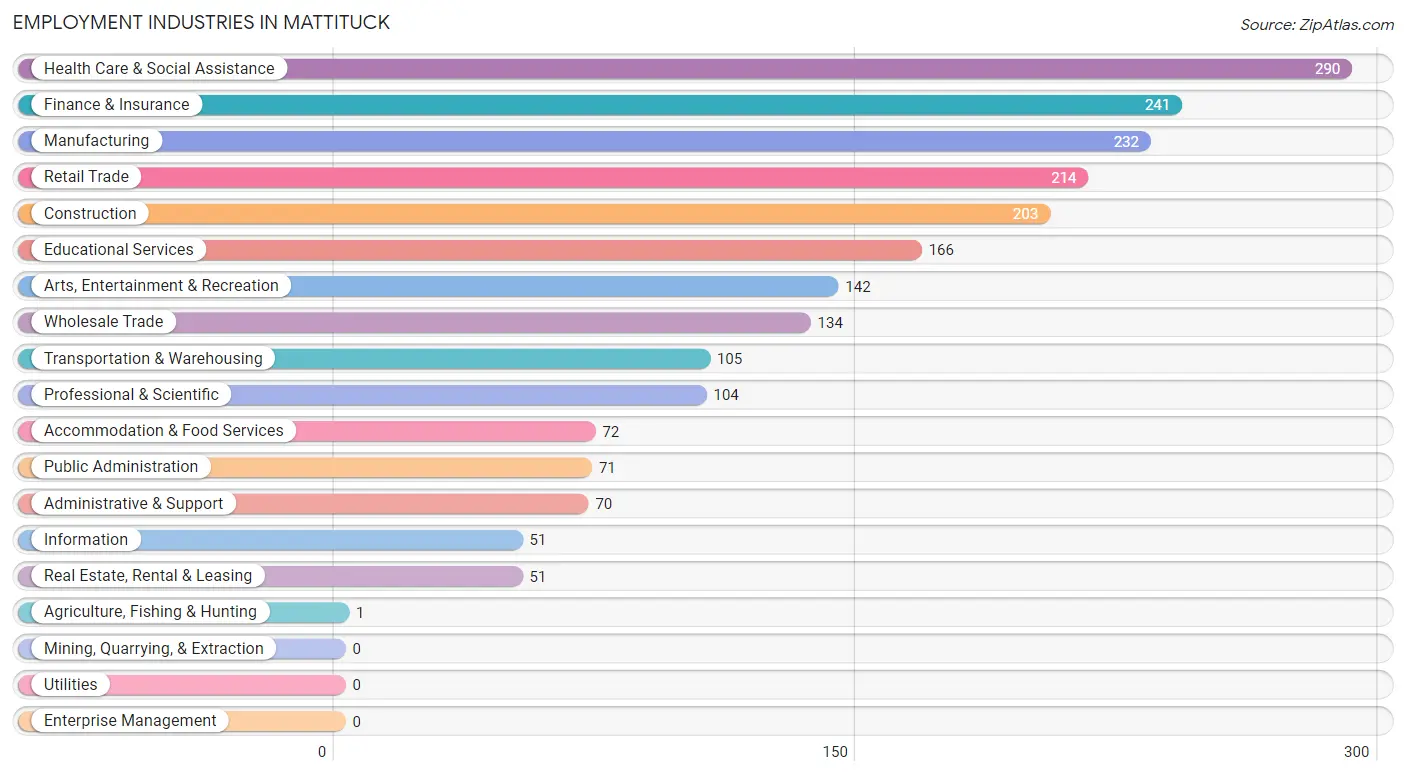
Employment Industries in Mattituck
The major employment industries in Mattituck include Health Care & Social Assistance (290 | 13.1%), Finance & Insurance (241 | 10.9%), Manufacturing (232 | 10.5%), Retail Trade (214 | 9.7%), and Construction (203 | 9.2%).
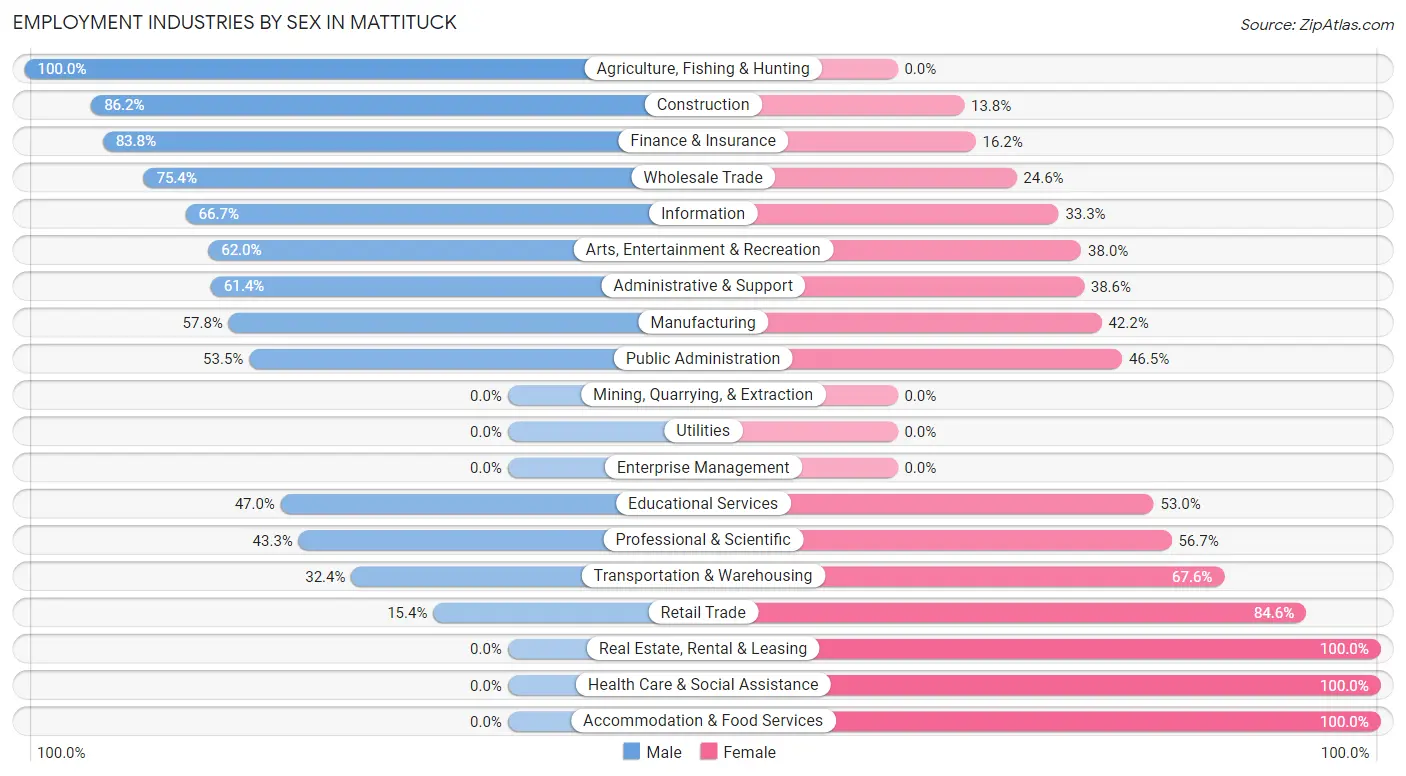
Employment Industries by Sex in Mattituck
The Mattituck industries that see more men than women are Agriculture, Fishing & Hunting (100.0%), Construction (86.2%), and Finance & Insurance (83.8%), whereas the industries that tend to have a higher number of women are Real Estate, Rental & Leasing (100.0%), Health Care & Social Assistance (100.0%), and Accommodation & Food Services (100.0%).
| Industry | Male | Female |
| Agriculture, Fishing & Hunting | 1 (100.0%) | 0 (0.0%) |
| Mining, Quarrying, & Extraction | 0 (0.0%) | 0 (0.0%) |
| Construction | 175 (86.2%) | 28 (13.8%) |
| Manufacturing | 134 (57.8%) | 98 (42.2%) |
| Wholesale Trade | 101 (75.4%) | 33 (24.6%) |
| Retail Trade | 33 (15.4%) | 181 (84.6%) |
| Transportation & Warehousing | 34 (32.4%) | 71 (67.6%) |
| Utilities | 0 (0.0%) | 0 (0.0%) |
| Information | 34 (66.7%) | 17 (33.3%) |
| Finance & Insurance | 202 (83.8%) | 39 (16.2%) |
| Real Estate, Rental & Leasing | 0 (0.0%) | 51 (100.0%) |
| Professional & Scientific | 45 (43.3%) | 59 (56.7%) |
| Enterprise Management | 0 (0.0%) | 0 (0.0%) |
| Administrative & Support | 43 (61.4%) | 27 (38.6%) |
| Educational Services | 78 (47.0%) | 88 (53.0%) |
| Health Care & Social Assistance | 0 (0.0%) | 290 (100.0%) |
| Arts, Entertainment & Recreation | 88 (62.0%) | 54 (38.0%) |
| Accommodation & Food Services | 0 (0.0%) | 72 (100.0%) |
| Public Administration | 38 (53.5%) | 33 (46.5%) |
| Total | 1,029 (46.5%) | 1,186 (53.5%) |
Education in Mattituck
School Enrollment in Mattituck
The most common levels of schooling among the 980 students in Mattituck are middle school (294 | 30.0%), college / undergraduate (286 | 29.2%), and high school (242 | 24.7%).
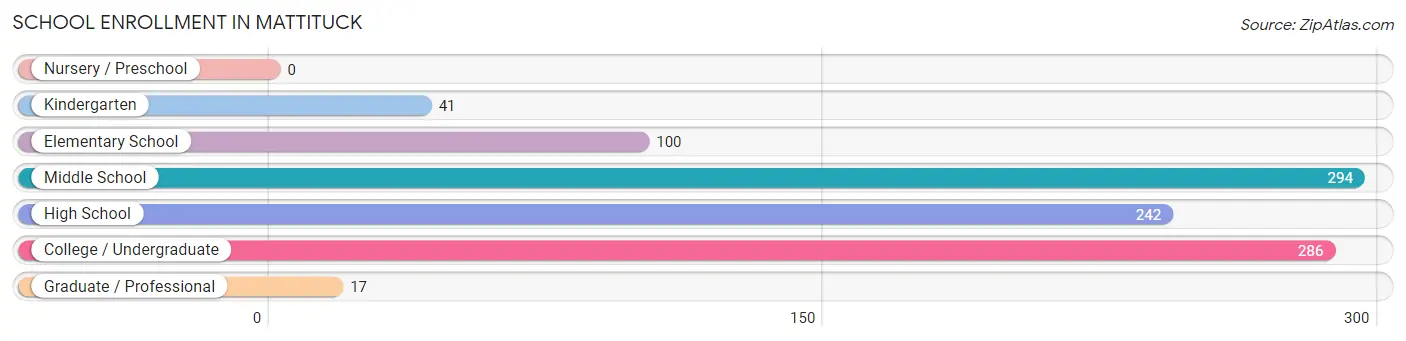
| School Level | # Students | % Students |
| Nursery / Preschool | 0 | 0.0% |
| Kindergarten | 41 | 4.2% |
| Elementary School | 100 | 10.2% |
| Middle School | 294 | 30.0% |
| High School | 242 | 24.7% |
| College / Undergraduate | 286 | 29.2% |
| Graduate / Professional | 17 | 1.7% |
| Total | 980 | 100.0% |
School Enrollment by Age by Funding Source in Mattituck
Out of a total of 980 students who are enrolled in schools in Mattituck, 164 (16.7%) attend a private institution, while the remaining 816 (83.3%) are enrolled in public schools. The age group of 18 to 19 year olds has the highest likelihood of being enrolled in private schools, with 86 (100.0% in the age bracket) enrolled. Conversely, the age group of 5 to 9 year old has the lowest likelihood of being enrolled in a private school, with 120 (100.0% in the age bracket) attending a public institution.
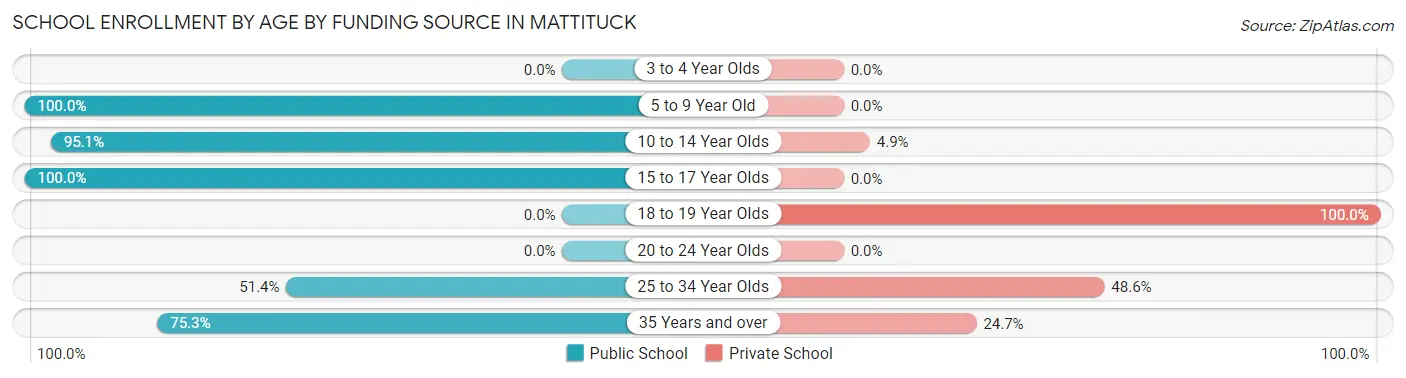
| Age Bracket | Public School | Private School |
| 3 to 4 Year Olds | 0 (0.0%) | 0 (0.0%) |
| 5 to 9 Year Old | 120 (100.0%) | 0 (0.0%) |
| 10 to 14 Year Olds | 312 (95.1%) | 16 (4.9%) |
| 15 to 17 Year Olds | 229 (100.0%) | 0 (0.0%) |
| 18 to 19 Year Olds | 0 (0.0%) | 86 (100.0%) |
| 20 to 24 Year Olds | 0 (0.0%) | 0 (0.0%) |
| 25 to 34 Year Olds | 18 (51.4%) | 17 (48.6%) |
| 35 Years and over | 137 (75.3%) | 45 (24.7%) |
| Total | 816 (83.3%) | 164 (16.7%) |
Educational Attainment by Field of Study in Mattituck
Business (522 | 28.8%), engineering (209 | 11.5%), visual & performing arts (207 | 11.4%), literature & languages (163 | 9.0%), and computers & mathematics (142 | 7.8%) are the most common fields of study among 1,811 individuals in Mattituck who have obtained a bachelor's degree or higher.
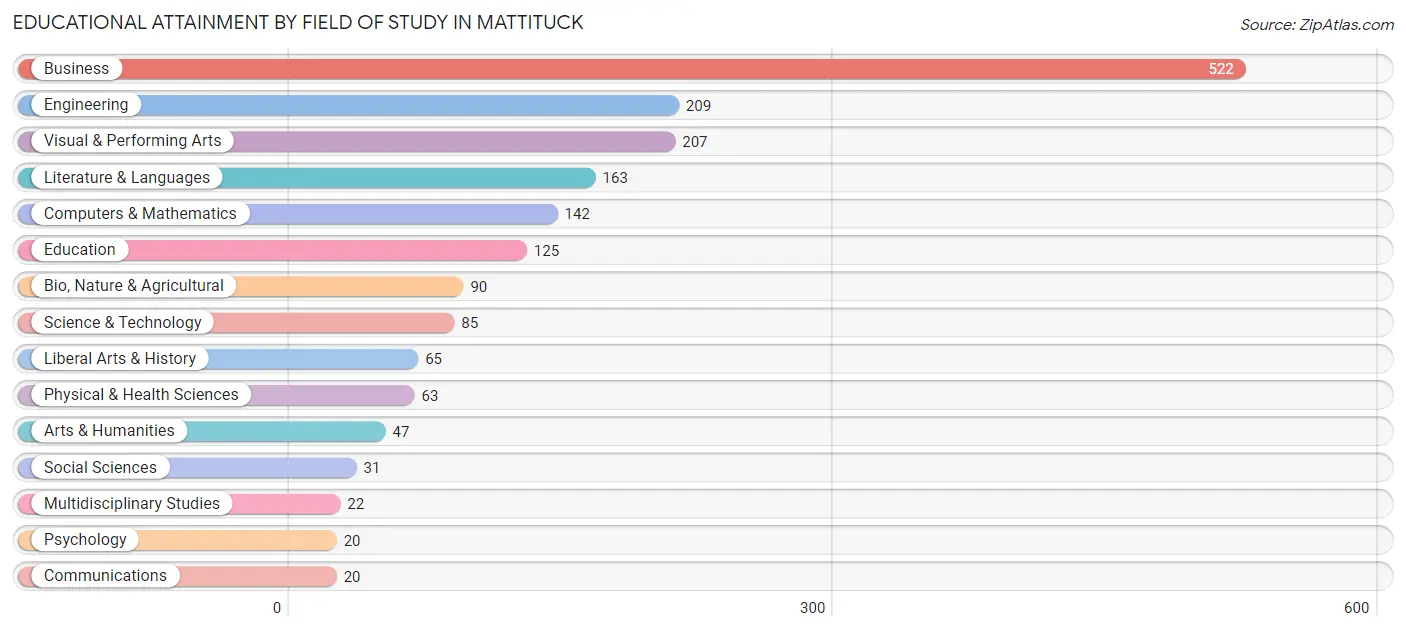
| Field of Study | # Graduates | % Graduates |
| Computers & Mathematics | 142 | 7.8% |
| Bio, Nature & Agricultural | 90 | 5.0% |
| Physical & Health Sciences | 63 | 3.5% |
| Psychology | 20 | 1.1% |
| Social Sciences | 31 | 1.7% |
| Engineering | 209 | 11.5% |
| Multidisciplinary Studies | 22 | 1.2% |
| Science & Technology | 85 | 4.7% |
| Business | 522 | 28.8% |
| Education | 125 | 6.9% |
| Literature & Languages | 163 | 9.0% |
| Liberal Arts & History | 65 | 3.6% |
| Visual & Performing Arts | 207 | 11.4% |
| Communications | 20 | 1.1% |
| Arts & Humanities | 47 | 2.6% |
| Total | 1,811 | 100.0% |
Transportation & Commute in Mattituck
Vehicle Availability by Sex in Mattituck
The most prevalent vehicle ownership categories in Mattituck are males with 2 vehicles (429, accounting for 41.7%) and females with 2 vehicles (612, making up 38.5%).
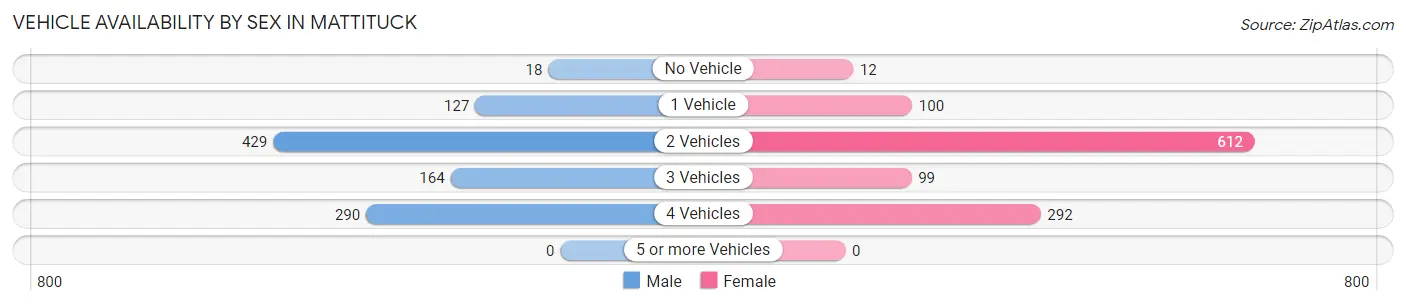
| Vehicles Available | Male | Female |
| No Vehicle | 18 (1.8%) | 12 (1.1%) |
| 1 Vehicle | 127 (12.3%) | 100 (9.0%) |
| 2 Vehicles | 429 (41.7%) | 612 (54.9%) |
| 3 Vehicles | 164 (16.0%) | 99 (8.9%) |
| 4 Vehicles | 290 (28.2%) | 292 (26.2%) |
| 5 or more Vehicles | 0 (0.0%) | 0 (0.0%) |
| Total | 1,028 (100.0%) | 1,115 (100.0%) |
Commute Time in Mattituck
The most frequently occuring commute durations in Mattituck are 60 to 89 minutes (401 commuters, 20.9%), 5 to 9 minutes (303 commuters, 15.8%), and 10 to 14 minutes (270 commuters, 14.1%).
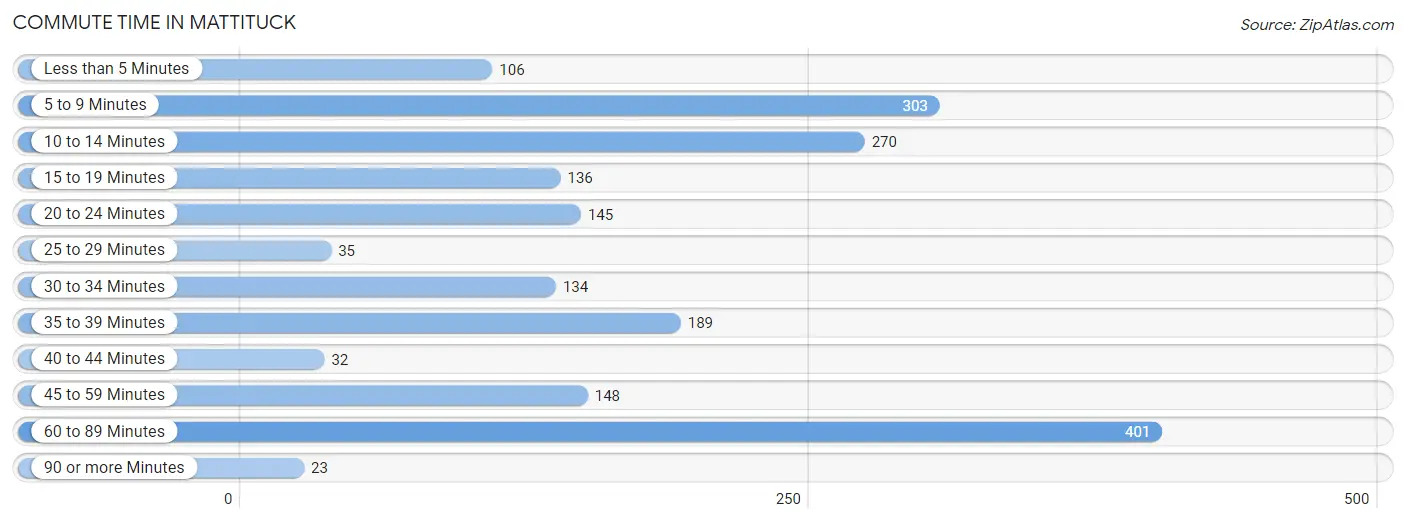
| Commute Time | # Commuters | % Commuters |
| Less than 5 Minutes | 106 | 5.5% |
| 5 to 9 Minutes | 303 | 15.8% |
| 10 to 14 Minutes | 270 | 14.1% |
| 15 to 19 Minutes | 136 | 7.1% |
| 20 to 24 Minutes | 145 | 7.5% |
| 25 to 29 Minutes | 35 | 1.8% |
| 30 to 34 Minutes | 134 | 7.0% |
| 35 to 39 Minutes | 189 | 9.8% |
| 40 to 44 Minutes | 32 | 1.7% |
| 45 to 59 Minutes | 148 | 7.7% |
| 60 to 89 Minutes | 401 | 20.9% |
| 90 or more Minutes | 23 | 1.2% |
Commute Time by Sex in Mattituck
The most common commute times in Mattituck are 35 to 39 minutes (189 commuters, 20.5%) for males and 5 to 9 minutes (285 commuters, 28.5%) for females.
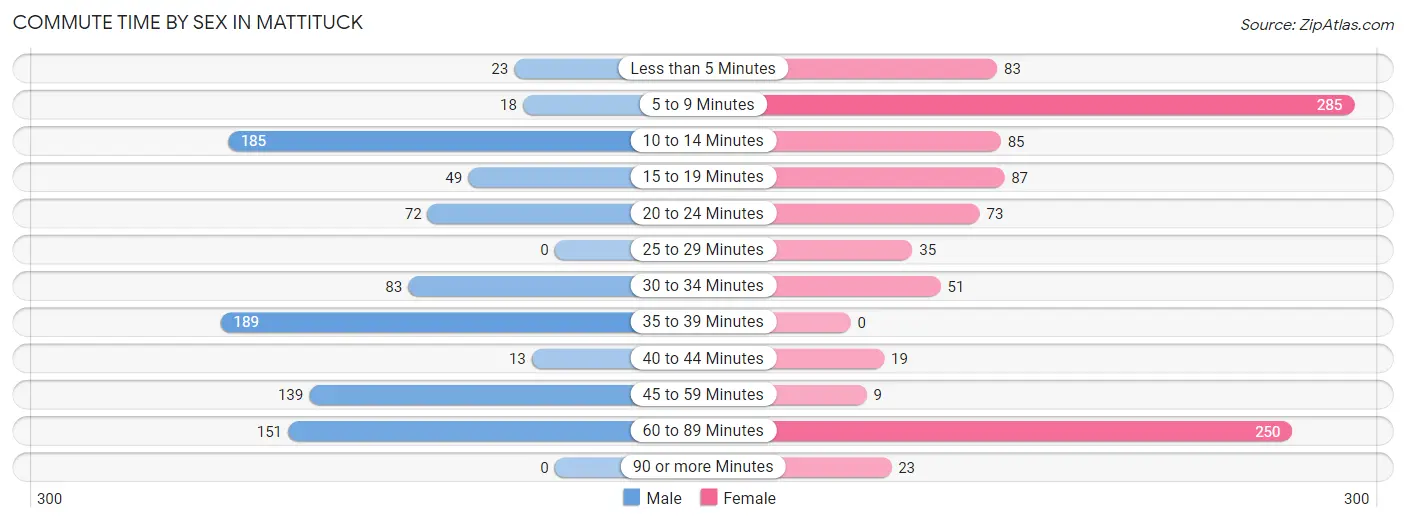
| Commute Time | Male | Female |
| Less than 5 Minutes | 23 (2.5%) | 83 (8.3%) |
| 5 to 9 Minutes | 18 (1.9%) | 285 (28.5%) |
| 10 to 14 Minutes | 185 (20.1%) | 85 (8.5%) |
| 15 to 19 Minutes | 49 (5.3%) | 87 (8.7%) |
| 20 to 24 Minutes | 72 (7.8%) | 73 (7.3%) |
| 25 to 29 Minutes | 0 (0.0%) | 35 (3.5%) |
| 30 to 34 Minutes | 83 (9.0%) | 51 (5.1%) |
| 35 to 39 Minutes | 189 (20.5%) | 0 (0.0%) |
| 40 to 44 Minutes | 13 (1.4%) | 19 (1.9%) |
| 45 to 59 Minutes | 139 (15.1%) | 9 (0.9%) |
| 60 to 89 Minutes | 151 (16.4%) | 250 (25.0%) |
| 90 or more Minutes | 0 (0.0%) | 23 (2.3%) |
Time of Departure to Work by Sex in Mattituck
The most frequent times of departure to work in Mattituck are 8:00 AM to 8:29 AM (497, 53.9%) for males and 7:30 AM to 7:59 AM (296, 29.6%) for females.
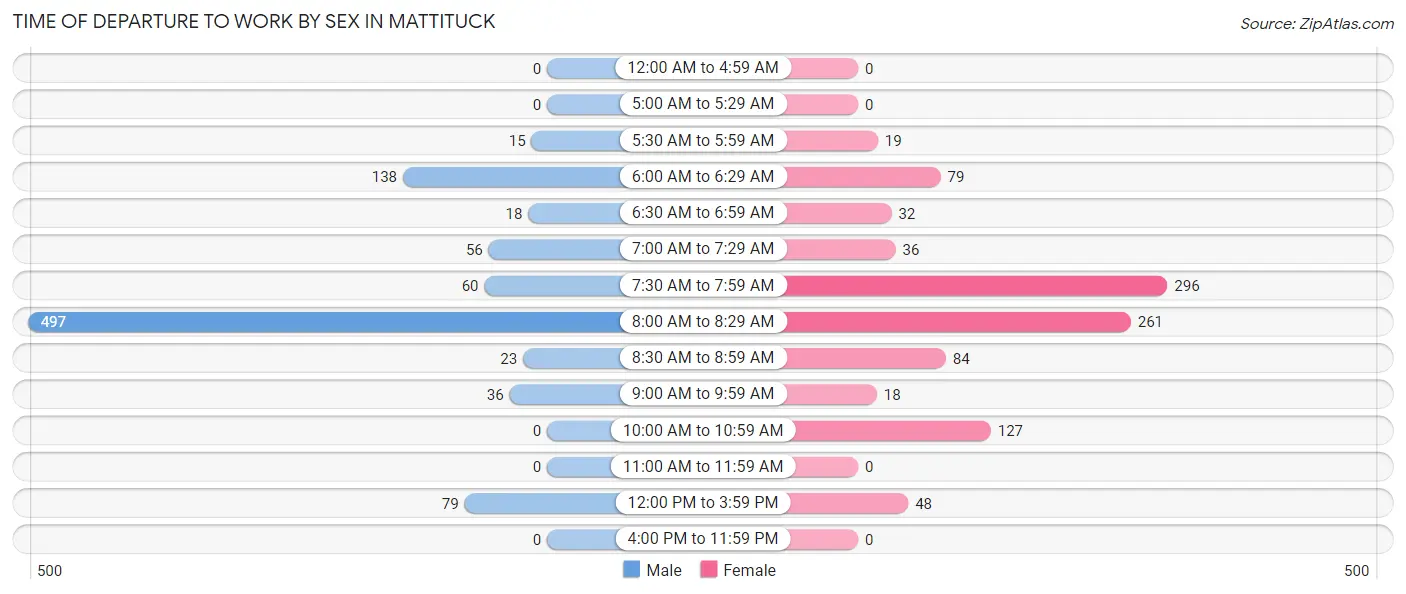
| Time of Departure | Male | Female |
| 12:00 AM to 4:59 AM | 0 (0.0%) | 0 (0.0%) |
| 5:00 AM to 5:29 AM | 0 (0.0%) | 0 (0.0%) |
| 5:30 AM to 5:59 AM | 15 (1.6%) | 19 (1.9%) |
| 6:00 AM to 6:29 AM | 138 (15.0%) | 79 (7.9%) |
| 6:30 AM to 6:59 AM | 18 (1.9%) | 32 (3.2%) |
| 7:00 AM to 7:29 AM | 56 (6.1%) | 36 (3.6%) |
| 7:30 AM to 7:59 AM | 60 (6.5%) | 296 (29.6%) |
| 8:00 AM to 8:29 AM | 497 (53.9%) | 261 (26.1%) |
| 8:30 AM to 8:59 AM | 23 (2.5%) | 84 (8.4%) |
| 9:00 AM to 9:59 AM | 36 (3.9%) | 18 (1.8%) |
| 10:00 AM to 10:59 AM | 0 (0.0%) | 127 (12.7%) |
| 11:00 AM to 11:59 AM | 0 (0.0%) | 0 (0.0%) |
| 12:00 PM to 3:59 PM | 79 (8.6%) | 48 (4.8%) |
| 4:00 PM to 11:59 PM | 0 (0.0%) | 0 (0.0%) |
| Total | 922 (100.0%) | 1,000 (100.0%) |
Housing Occupancy in Mattituck
Occupancy by Ownership in Mattituck
Of the total 1,963 dwellings in Mattituck, owner-occupied units account for 1,864 (95.0%), while renter-occupied units make up 99 (5.0%).
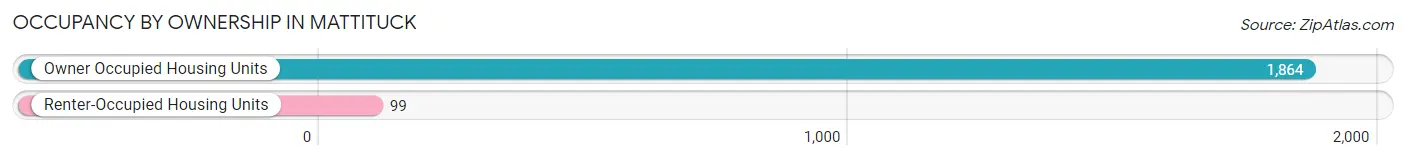
| Occupancy | # Housing Units | % Housing Units |
| Owner Occupied Housing Units | 1,864 | 95.0% |
| Renter-Occupied Housing Units | 99 | 5.0% |
| Total Occupied Housing Units | 1,963 | 100.0% |
Occupancy by Household Size in Mattituck
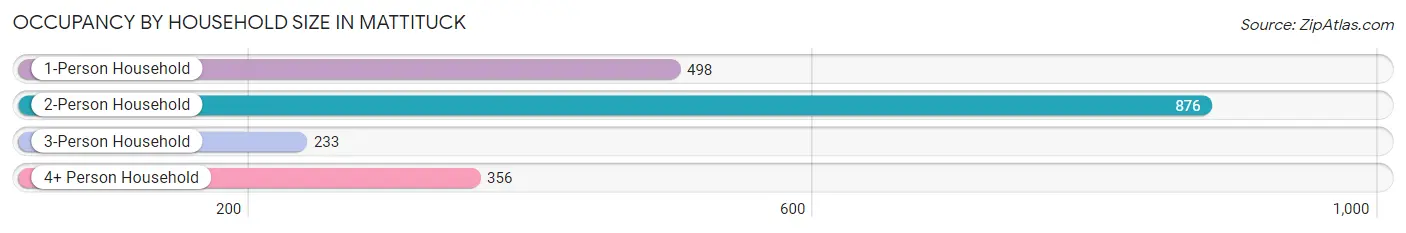
| Household Size | # Housing Units | % Housing Units |
| 1-Person Household | 498 | 25.4% |
| 2-Person Household | 876 | 44.6% |
| 3-Person Household | 233 | 11.9% |
| 4+ Person Household | 356 | 18.1% |
| Total Housing Units | 1,963 | 100.0% |
Occupancy by Ownership by Household Size in Mattituck
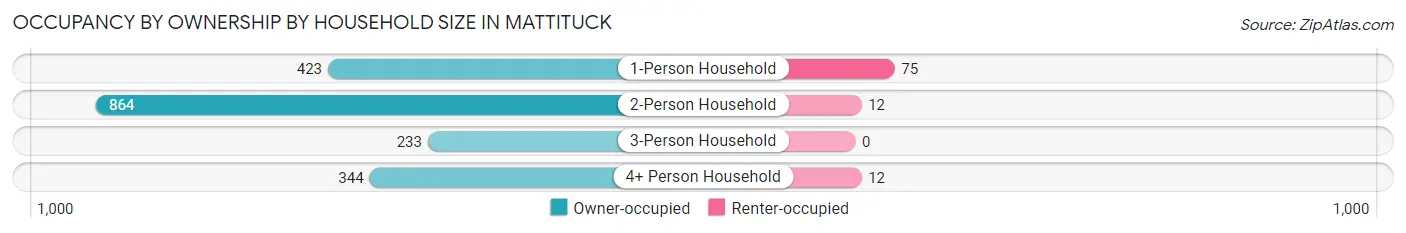
| Household Size | Owner-occupied | Renter-occupied |
| 1-Person Household | 423 (84.9%) | 75 (15.1%) |
| 2-Person Household | 864 (98.6%) | 12 (1.4%) |
| 3-Person Household | 233 (100.0%) | 0 (0.0%) |
| 4+ Person Household | 344 (96.6%) | 12 (3.4%) |
| Total Housing Units | 1,864 (95.0%) | 99 (5.0%) |
Occupancy by Educational Attainment in Mattituck
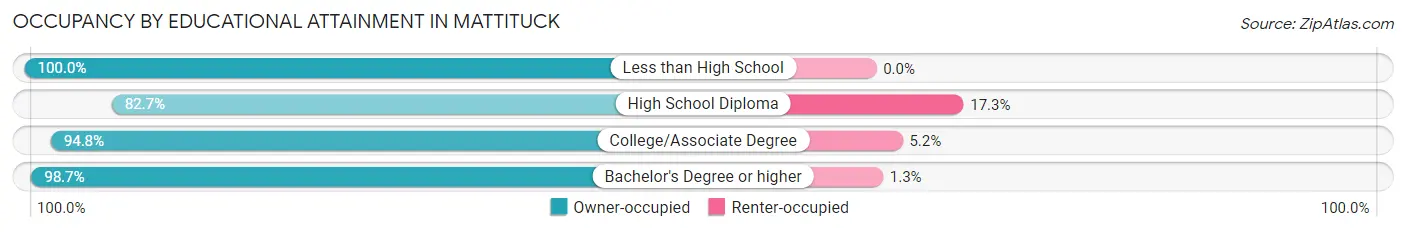
| Household Size | Owner-occupied | Renter-occupied |
| Less than High School | 89 (100.0%) | 0 (0.0%) |
| High School Diploma | 249 (82.7%) | 52 (17.3%) |
| College/Associate Degree | 637 (94.8%) | 35 (5.2%) |
| Bachelor's Degree or higher | 889 (98.7%) | 12 (1.3%) |
Occupancy by Age of Householder in Mattituck
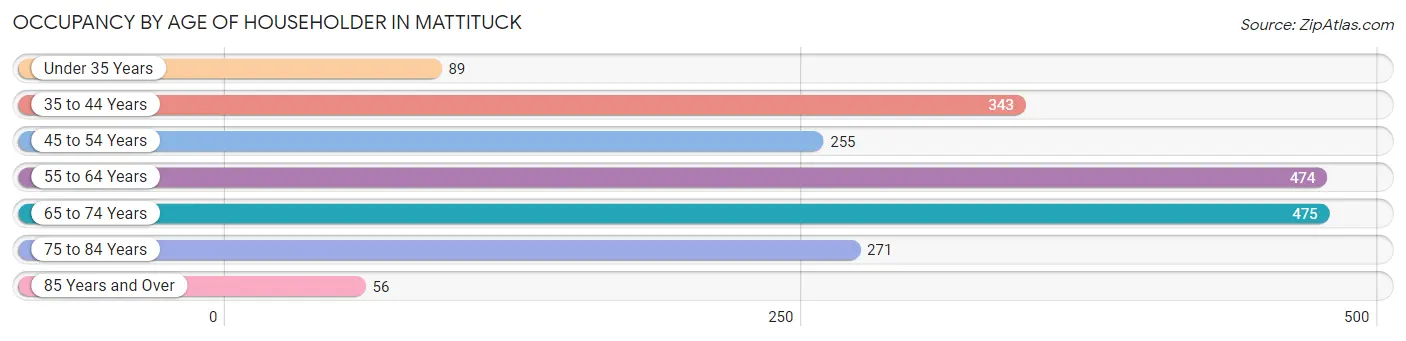
| Age Bracket | # Households | % Households |
| Under 35 Years | 89 | 4.5% |
| 35 to 44 Years | 343 | 17.5% |
| 45 to 54 Years | 255 | 13.0% |
| 55 to 64 Years | 474 | 24.1% |
| 65 to 74 Years | 475 | 24.2% |
| 75 to 84 Years | 271 | 13.8% |
| 85 Years and Over | 56 | 2.9% |
| Total | 1,963 | 100.0% |
Housing Finances in Mattituck
Median Income by Occupancy in Mattituck
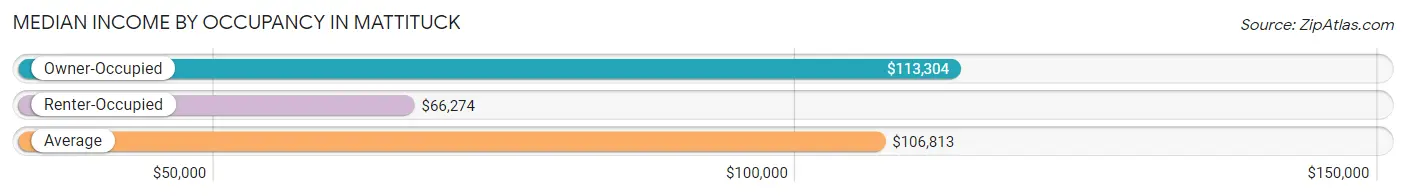
| Occupancy Type | # Households | Median Income |
| Owner-Occupied | 1,864 (95.0%) | $113,304 |
| Renter-Occupied | 99 (5.0%) | $66,274 |
| Average | 1,963 (100.0%) | $106,813 |
Occupancy by Householder Income Bracket in Mattituck
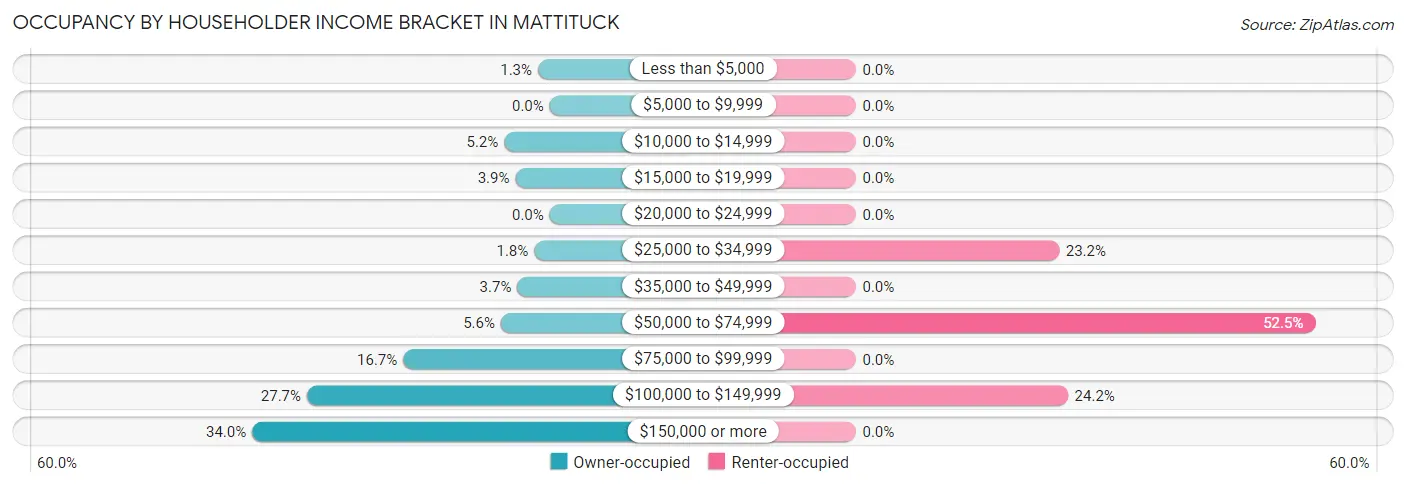
| Income Bracket | Owner-occupied | Renter-occupied |
| Less than $5,000 | 25 (1.3%) | 0 (0.0%) |
| $5,000 to $9,999 | 0 (0.0%) | 0 (0.0%) |
| $10,000 to $14,999 | 97 (5.2%) | 0 (0.0%) |
| $15,000 to $19,999 | 73 (3.9%) | 0 (0.0%) |
| $20,000 to $24,999 | 0 (0.0%) | 0 (0.0%) |
| $25,000 to $34,999 | 33 (1.8%) | 23 (23.2%) |
| $35,000 to $49,999 | 69 (3.7%) | 0 (0.0%) |
| $50,000 to $74,999 | 104 (5.6%) | 52 (52.5%) |
| $75,000 to $99,999 | 312 (16.7%) | 0 (0.0%) |
| $100,000 to $149,999 | 517 (27.7%) | 24 (24.2%) |
| $150,000 or more | 634 (34.0%) | 0 (0.0%) |
| Total | 1,864 (100.0%) | 99 (100.0%) |
Monthly Housing Cost Tiers in Mattituck
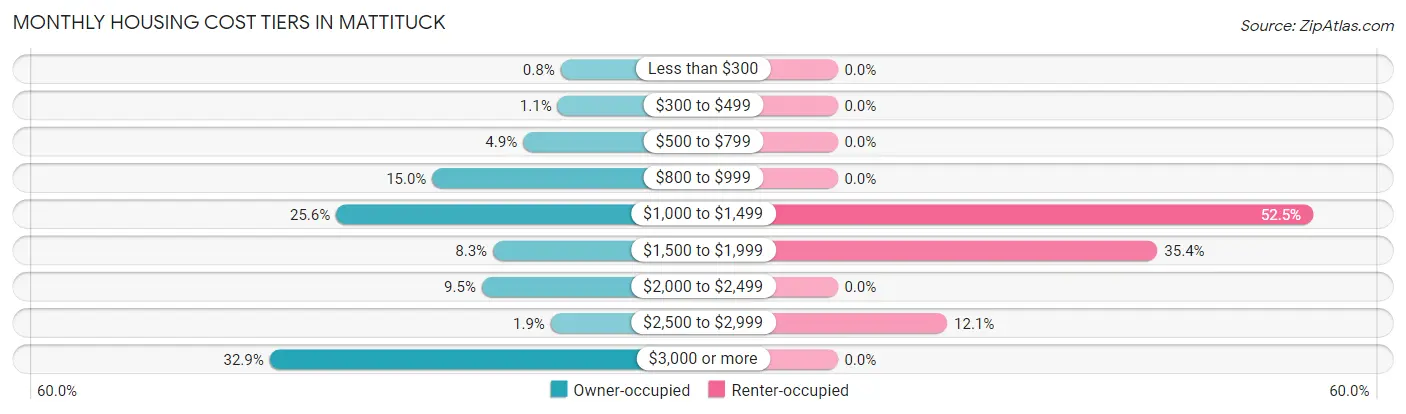
| Monthly Cost | Owner-occupied | Renter-occupied |
| Less than $300 | 15 (0.8%) | 0 (0.0%) |
| $300 to $499 | 21 (1.1%) | 0 (0.0%) |
| $500 to $799 | 92 (4.9%) | 0 (0.0%) |
| $800 to $999 | 279 (15.0%) | 0 (0.0%) |
| $1,000 to $1,499 | 477 (25.6%) | 52 (52.5%) |
| $1,500 to $1,999 | 154 (8.3%) | 35 (35.3%) |
| $2,000 to $2,499 | 177 (9.5%) | 0 (0.0%) |
| $2,500 to $2,999 | 35 (1.9%) | 12 (12.1%) |
| $3,000 or more | 614 (32.9%) | 0 (0.0%) |
| Total | 1,864 (100.0%) | 99 (100.0%) |
Physical Housing Characteristics in Mattituck
Housing Structures in Mattituck
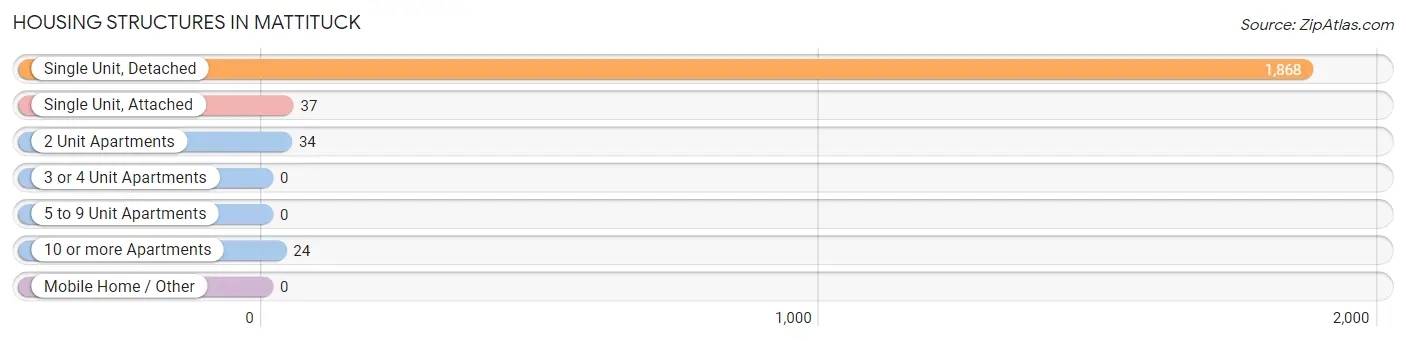
| Structure Type | # Housing Units | % Housing Units |
| Single Unit, Detached | 1,868 | 95.2% |
| Single Unit, Attached | 37 | 1.9% |
| 2 Unit Apartments | 34 | 1.7% |
| 3 or 4 Unit Apartments | 0 | 0.0% |
| 5 to 9 Unit Apartments | 0 | 0.0% |
| 10 or more Apartments | 24 | 1.2% |
| Mobile Home / Other | 0 | 0.0% |
| Total | 1,963 | 100.0% |
Housing Structures by Occupancy in Mattituck
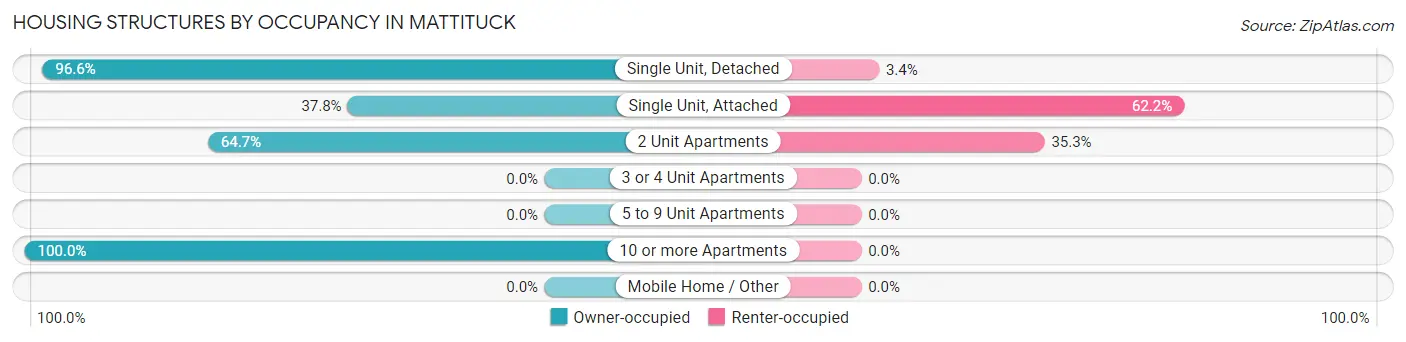
| Structure Type | Owner-occupied | Renter-occupied |
| Single Unit, Detached | 1,804 (96.6%) | 64 (3.4%) |
| Single Unit, Attached | 14 (37.8%) | 23 (62.2%) |
| 2 Unit Apartments | 22 (64.7%) | 12 (35.3%) |
| 3 or 4 Unit Apartments | 0 (0.0%) | 0 (0.0%) |
| 5 to 9 Unit Apartments | 0 (0.0%) | 0 (0.0%) |
| 10 or more Apartments | 24 (100.0%) | 0 (0.0%) |
| Mobile Home / Other | 0 (0.0%) | 0 (0.0%) |
| Total | 1,864 (95.0%) | 99 (5.0%) |
Housing Structures by Number of Rooms in Mattituck
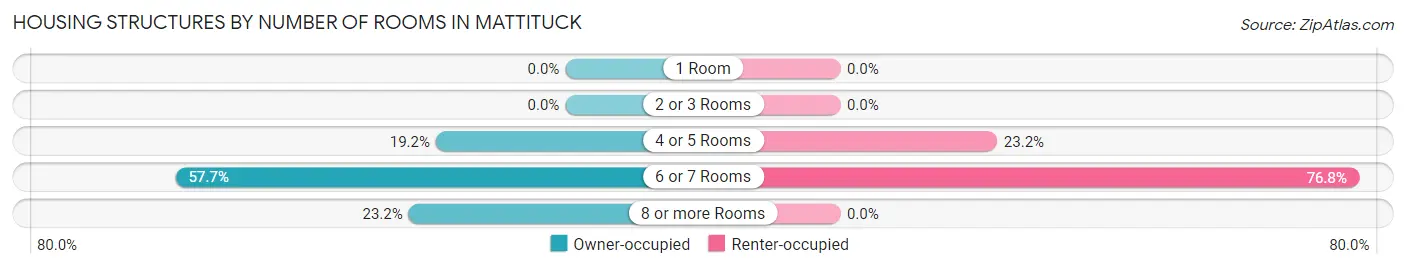
| Number of Rooms | Owner-occupied | Renter-occupied |
| 1 Room | 0 (0.0%) | 0 (0.0%) |
| 2 or 3 Rooms | 0 (0.0%) | 0 (0.0%) |
| 4 or 5 Rooms | 357 (19.2%) | 23 (23.2%) |
| 6 or 7 Rooms | 1,075 (57.7%) | 76 (76.8%) |
| 8 or more Rooms | 432 (23.2%) | 0 (0.0%) |
| Total | 1,864 (100.0%) | 99 (100.0%) |
Housing Structure by Heating Type in Mattituck
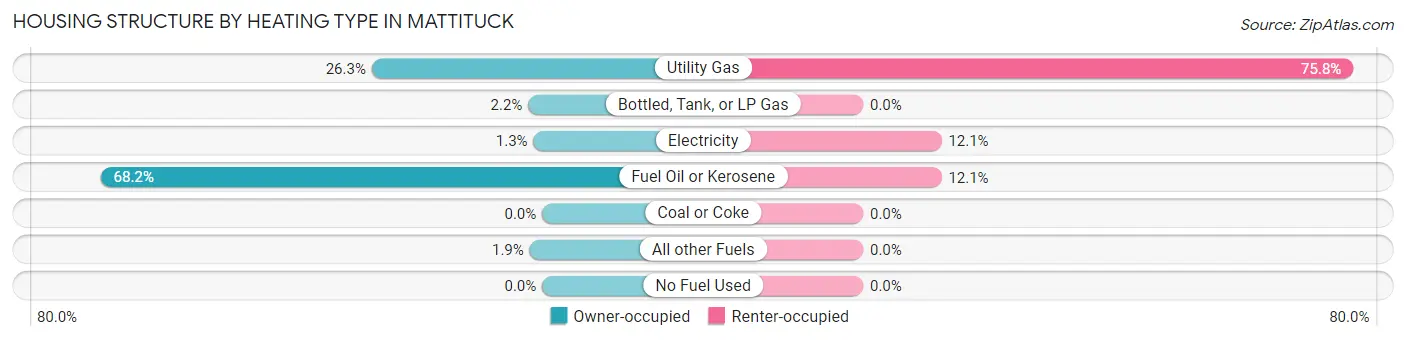
| Heating Type | Owner-occupied | Renter-occupied |
| Utility Gas | 491 (26.3%) | 75 (75.8%) |
| Bottled, Tank, or LP Gas | 40 (2.1%) | 0 (0.0%) |
| Electricity | 25 (1.3%) | 12 (12.1%) |
| Fuel Oil or Kerosene | 1,272 (68.2%) | 12 (12.1%) |
| Coal or Coke | 0 (0.0%) | 0 (0.0%) |
| All other Fuels | 36 (1.9%) | 0 (0.0%) |
| No Fuel Used | 0 (0.0%) | 0 (0.0%) |
| Total | 1,864 (100.0%) | 99 (100.0%) |
Household Vehicle Usage in Mattituck
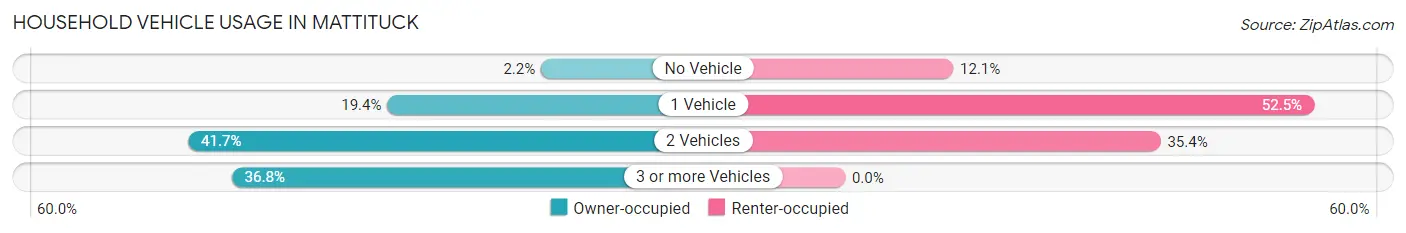
| Vehicles per Household | Owner-occupied | Renter-occupied |
| No Vehicle | 40 (2.1%) | 12 (12.1%) |
| 1 Vehicle | 361 (19.4%) | 52 (52.5%) |
| 2 Vehicles | 777 (41.7%) | 35 (35.3%) |
| 3 or more Vehicles | 686 (36.8%) | 0 (0.0%) |
| Total | 1,864 (100.0%) | 99 (100.0%) |
Real Estate & Mortgages in Mattituck
Real Estate and Mortgage Overview in Mattituck
| Characteristic | Without Mortgage | With Mortgage |
| Housing Units | 900 | 964 |
| Median Property Value | $627,000 | $708,800 |
| Median Household Income | $94,394 | $469 |
| Monthly Housing Costs | $1,153 | $571 |
| Real Estate Taxes | $7,027 | $24 |
Property Value by Mortgage Status in Mattituck
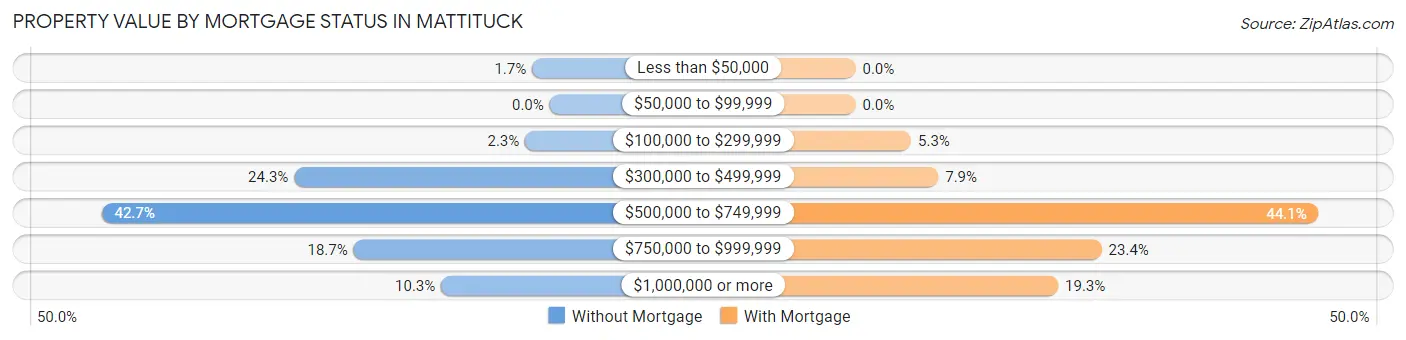
| Property Value | Without Mortgage | With Mortgage |
| Less than $50,000 | 15 (1.7%) | 0 (0.0%) |
| $50,000 to $99,999 | 0 (0.0%) | 0 (0.0%) |
| $100,000 to $299,999 | 21 (2.3%) | 51 (5.3%) |
| $300,000 to $499,999 | 219 (24.3%) | 76 (7.9%) |
| $500,000 to $749,999 | 384 (42.7%) | 425 (44.1%) |
| $750,000 to $999,999 | 168 (18.7%) | 226 (23.4%) |
| $1,000,000 or more | 93 (10.3%) | 186 (19.3%) |
| Total | 900 (100.0%) | 964 (100.0%) |
Household Income by Mortgage Status in Mattituck
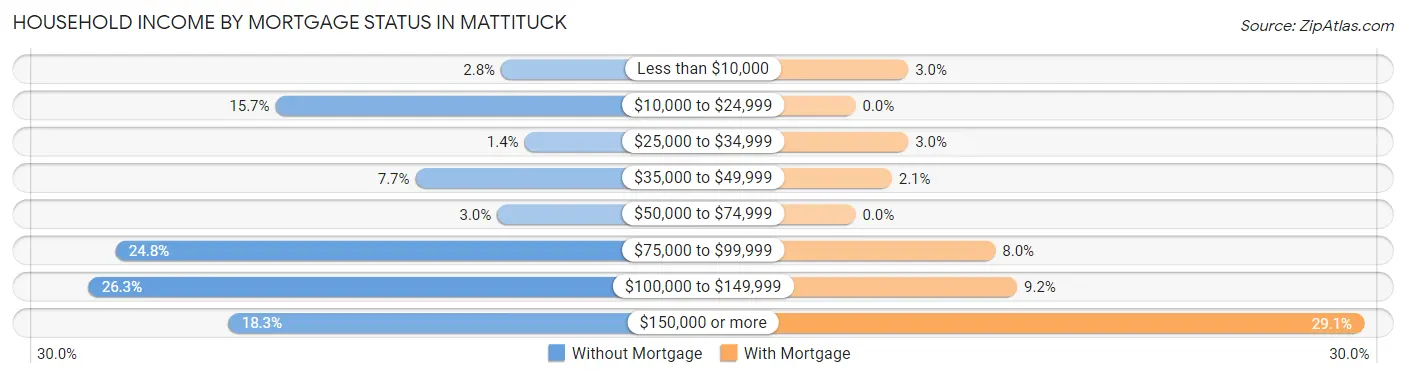
| Household Income | Without Mortgage | With Mortgage |
| Less than $10,000 | 25 (2.8%) | 29 (3.0%) |
| $10,000 to $24,999 | 141 (15.7%) | 0 (0.0%) |
| $25,000 to $34,999 | 13 (1.4%) | 29 (3.0%) |
| $35,000 to $49,999 | 69 (7.7%) | 20 (2.1%) |
| $50,000 to $74,999 | 27 (3.0%) | 0 (0.0%) |
| $75,000 to $99,999 | 223 (24.8%) | 77 (8.0%) |
| $100,000 to $149,999 | 237 (26.3%) | 89 (9.2%) |
| $150,000 or more | 165 (18.3%) | 280 (29.0%) |
| Total | 900 (100.0%) | 964 (100.0%) |
Property Value to Household Income Ratio in Mattituck
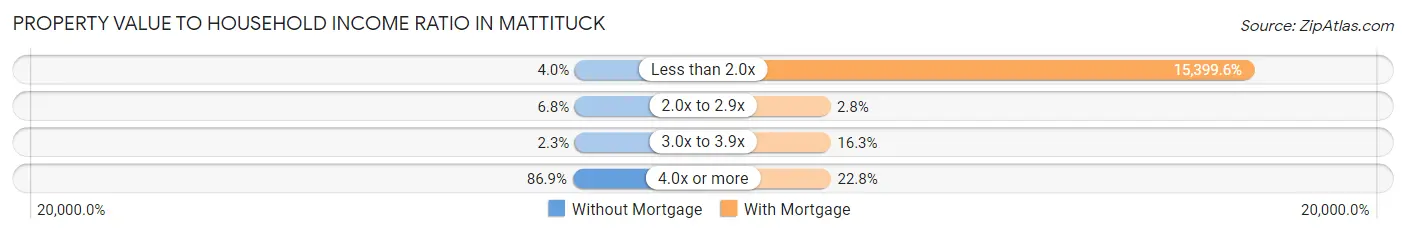
| Value-to-Income Ratio | Without Mortgage | With Mortgage |
| Less than 2.0x | 36 (4.0%) | 148,452 (15,399.6%) |
| 2.0x to 2.9x | 61 (6.8%) | 27 (2.8%) |
| 3.0x to 3.9x | 21 (2.3%) | 157 (16.3%) |
| 4.0x or more | 782 (86.9%) | 220 (22.8%) |
| Total | 900 (100.0%) | 964 (100.0%) |
Real Estate Taxes by Mortgage Status in Mattituck
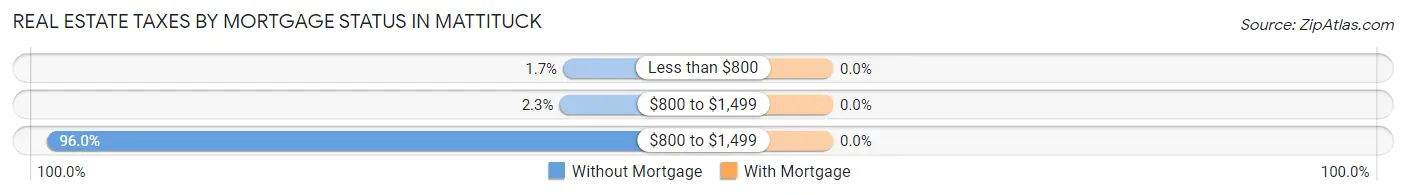
| Property Taxes | Without Mortgage | With Mortgage |
| Less than $800 | 15 (1.7%) | 0 (0.0%) |
| $800 to $1,499 | 21 (2.3%) | 0 (0.0%) |
| $800 to $1,499 | 864 (96.0%) | 0 (0.0%) |
| Total | 900 (100.0%) | 964 (100.0%) |
Health & Disability in Mattituck
Health Insurance Coverage by Age in Mattituck
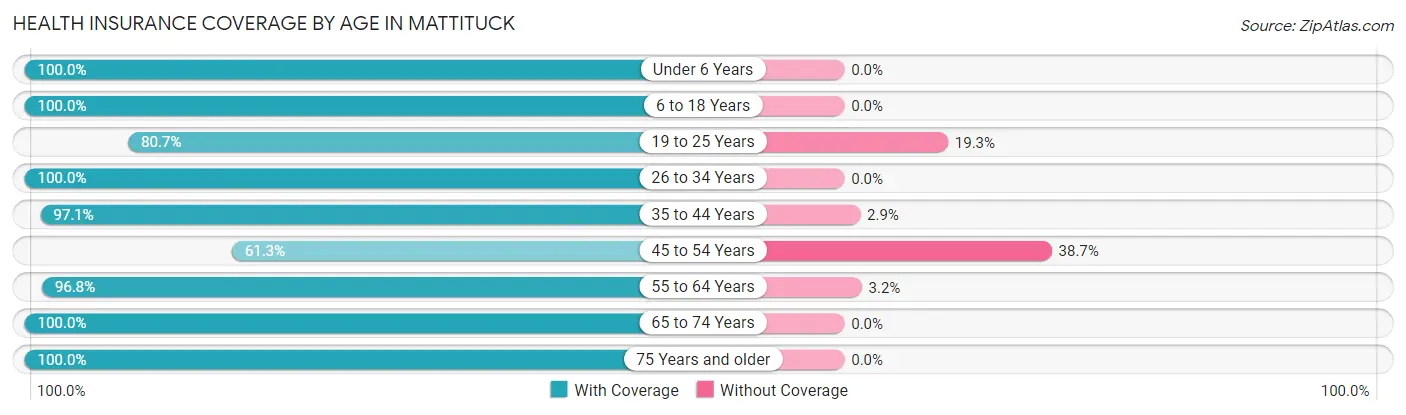
| Age Bracket | With Coverage | Without Coverage |
| Under 6 Years | 147 (100.0%) | 0 (0.0%) |
| 6 to 18 Years | 677 (100.0%) | 0 (0.0%) |
| 19 to 25 Years | 259 (80.7%) | 62 (19.3%) |
| 26 to 34 Years | 352 (100.0%) | 0 (0.0%) |
| 35 to 44 Years | 595 (97.1%) | 18 (2.9%) |
| 45 to 54 Years | 311 (61.3%) | 196 (38.7%) |
| 55 to 64 Years | 778 (96.8%) | 26 (3.2%) |
| 65 to 74 Years | 840 (100.0%) | 0 (0.0%) |
| 75 Years and older | 539 (100.0%) | 0 (0.0%) |
| Total | 4,498 (93.7%) | 302 (6.3%) |
Health Insurance Coverage by Citizenship Status in Mattituck
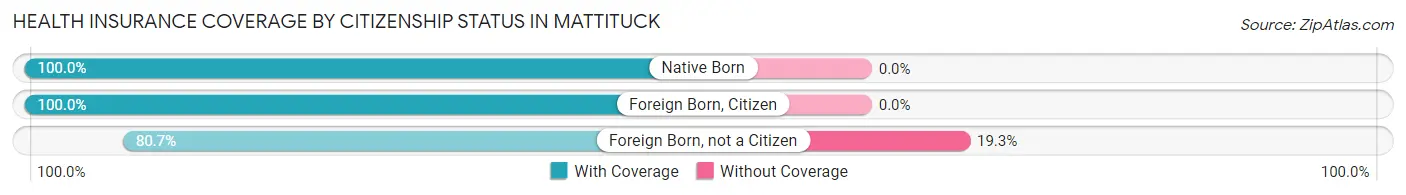
| Citizenship Status | With Coverage | Without Coverage |
| Native Born | 147 (100.0%) | 0 (0.0%) |
| Foreign Born, Citizen | 677 (100.0%) | 0 (0.0%) |
| Foreign Born, not a Citizen | 259 (80.7%) | 62 (19.3%) |
Health Insurance Coverage by Household Income in Mattituck
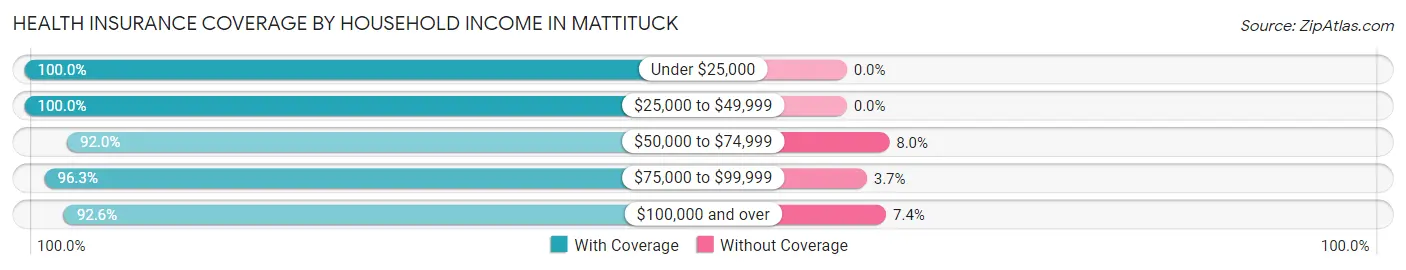
| Household Income | With Coverage | Without Coverage |
| Under $25,000 | 195 (100.0%) | 0 (0.0%) |
| $25,000 to $49,999 | 165 (100.0%) | 0 (0.0%) |
| $50,000 to $74,999 | 208 (92.0%) | 18 (8.0%) |
| $75,000 to $99,999 | 669 (96.3%) | 26 (3.7%) |
| $100,000 and over | 3,247 (92.6%) | 258 (7.4%) |
Public vs Private Health Insurance Coverage by Age in Mattituck
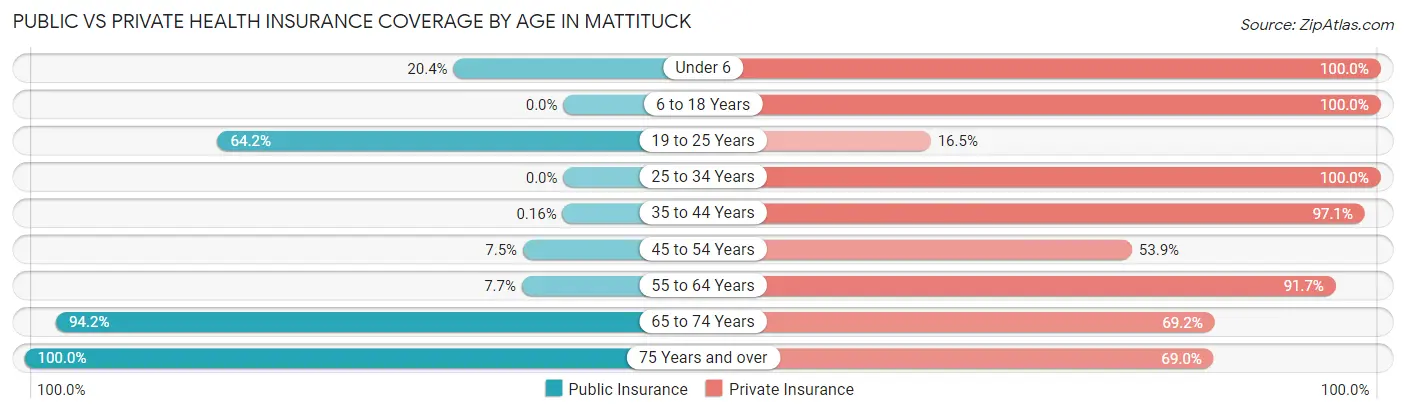
| Age Bracket | Public Insurance | Private Insurance |
| Under 6 | 30 (20.4%) | 147 (100.0%) |
| 6 to 18 Years | 0 (0.0%) | 677 (100.0%) |
| 19 to 25 Years | 206 (64.2%) | 53 (16.5%) |
| 25 to 34 Years | 0 (0.0%) | 352 (100.0%) |
| 35 to 44 Years | 1 (0.2%) | 595 (97.1%) |
| 45 to 54 Years | 38 (7.5%) | 273 (53.8%) |
| 55 to 64 Years | 62 (7.7%) | 737 (91.7%) |
| 65 to 74 Years | 791 (94.2%) | 581 (69.2%) |
| 75 Years and over | 539 (100.0%) | 372 (69.0%) |
| Total | 1,667 (34.7%) | 3,787 (78.9%) |
Disability Status by Sex by Age in Mattituck
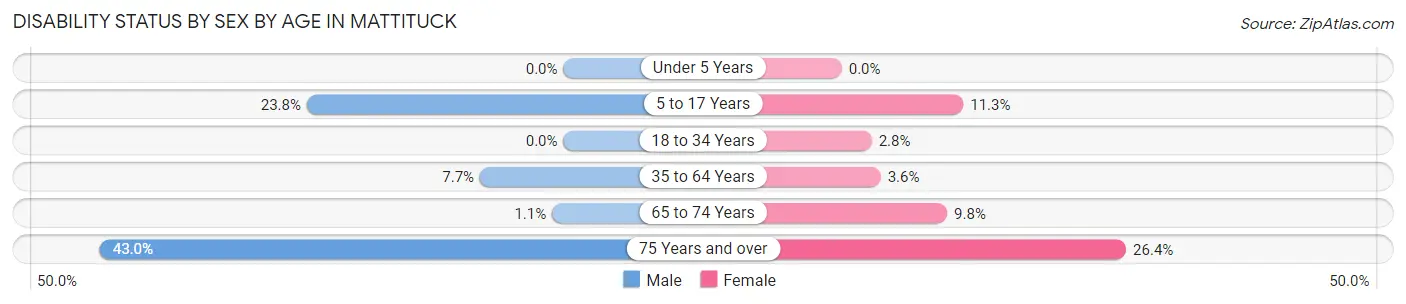
| Age Bracket | Male | Female |
| Under 5 Years | 0 (0.0%) | 0 (0.0%) |
| 5 to 17 Years | 100 (23.8%) | 29 (11.3%) |
| 18 to 34 Years | 0 (0.0%) | 4 (2.8%) |
| 35 to 64 Years | 61 (7.7%) | 41 (3.6%) |
| 65 to 74 Years | 4 (1.1%) | 45 (9.8%) |
| 75 Years and over | 77 (43.0%) | 95 (26.4%) |
Disability Class by Sex by Age in Mattituck
Disability Class: Hearing Difficulty
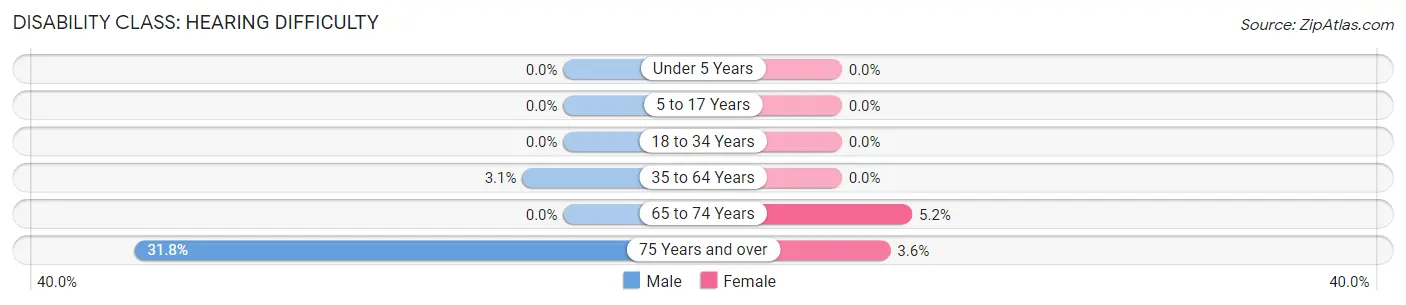
| Age Bracket | Male | Female |
| Under 5 Years | 0 (0.0%) | 0 (0.0%) |
| 5 to 17 Years | 0 (0.0%) | 0 (0.0%) |
| 18 to 34 Years | 0 (0.0%) | 0 (0.0%) |
| 35 to 64 Years | 24 (3.0%) | 0 (0.0%) |
| 65 to 74 Years | 0 (0.0%) | 24 (5.2%) |
| 75 Years and over | 57 (31.8%) | 13 (3.6%) |
Disability Class: Vision Difficulty
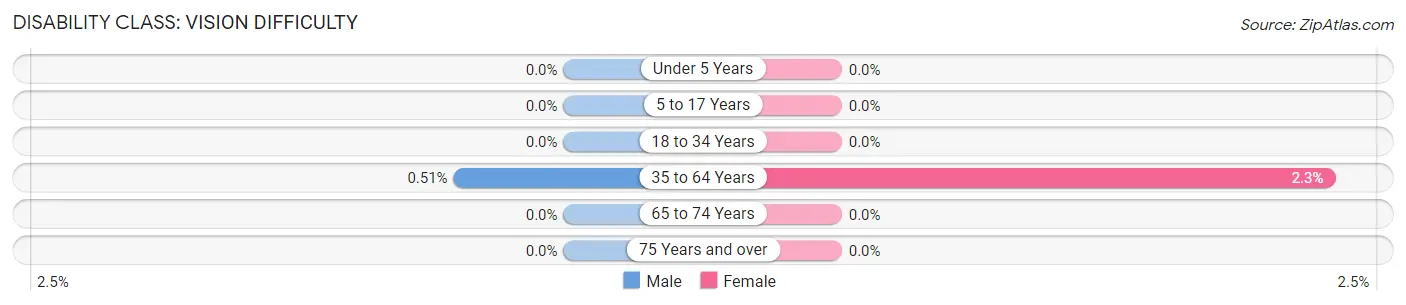
| Age Bracket | Male | Female |
| Under 5 Years | 0 (0.0%) | 0 (0.0%) |
| 5 to 17 Years | 0 (0.0%) | 0 (0.0%) |
| 18 to 34 Years | 0 (0.0%) | 0 (0.0%) |
| 35 to 64 Years | 4 (0.5%) | 26 (2.3%) |
| 65 to 74 Years | 0 (0.0%) | 0 (0.0%) |
| 75 Years and over | 0 (0.0%) | 0 (0.0%) |
Disability Class: Cognitive Difficulty
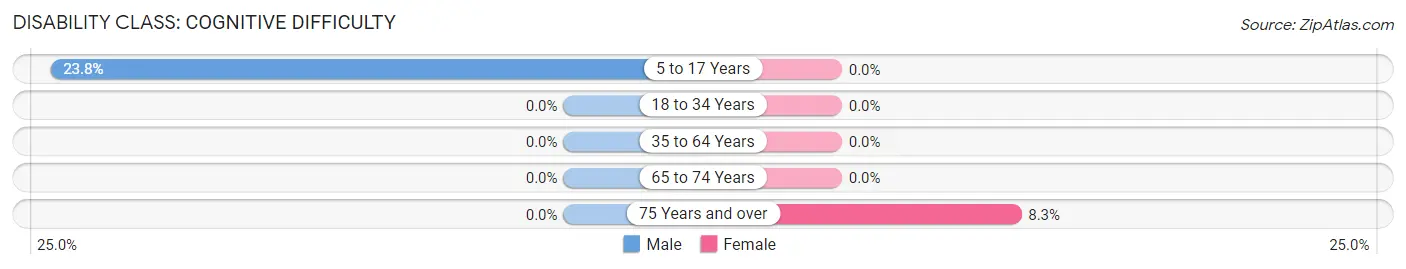
| Age Bracket | Male | Female |
| 5 to 17 Years | 100 (23.8%) | 0 (0.0%) |
| 18 to 34 Years | 0 (0.0%) | 0 (0.0%) |
| 35 to 64 Years | 0 (0.0%) | 0 (0.0%) |
| 65 to 74 Years | 0 (0.0%) | 0 (0.0%) |
| 75 Years and over | 0 (0.0%) | 30 (8.3%) |
Disability Class: Ambulatory Difficulty
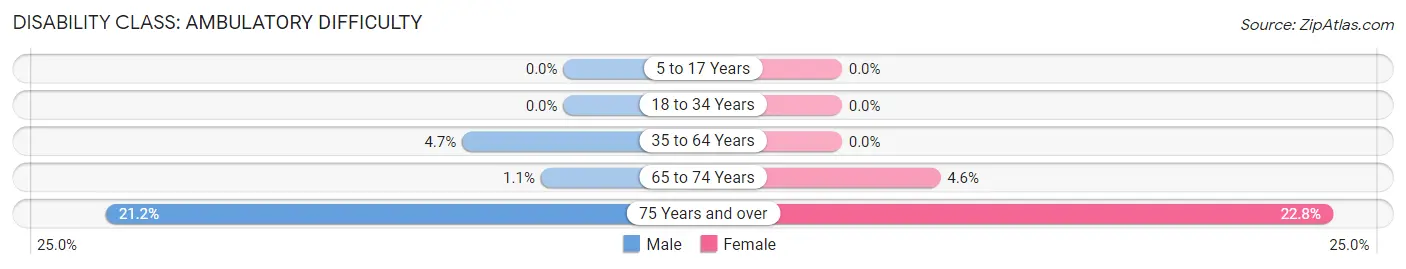
| Age Bracket | Male | Female |
| 5 to 17 Years | 0 (0.0%) | 0 (0.0%) |
| 18 to 34 Years | 0 (0.0%) | 0 (0.0%) |
| 35 to 64 Years | 37 (4.7%) | 0 (0.0%) |
| 65 to 74 Years | 4 (1.1%) | 21 (4.6%) |
| 75 Years and over | 38 (21.2%) | 82 (22.8%) |
Disability Class: Self-Care Difficulty
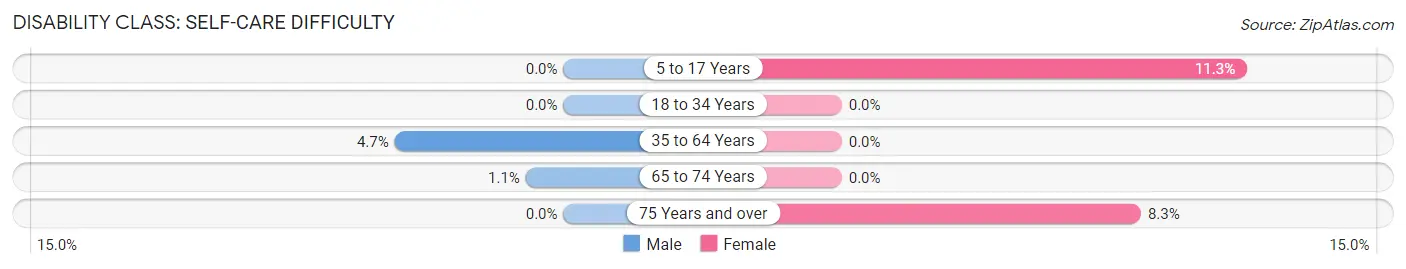
| Age Bracket | Male | Female |
| 5 to 17 Years | 0 (0.0%) | 29 (11.3%) |
| 18 to 34 Years | 0 (0.0%) | 0 (0.0%) |
| 35 to 64 Years | 37 (4.7%) | 0 (0.0%) |
| 65 to 74 Years | 4 (1.1%) | 0 (0.0%) |
| 75 Years and over | 0 (0.0%) | 30 (8.3%) |
Technology Access in Mattituck
Computing Device Access in Mattituck
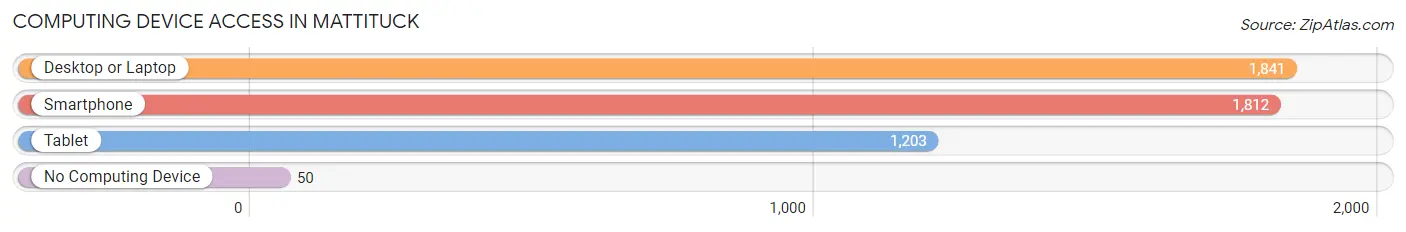
| Device Type | # Households | % Households |
| Desktop or Laptop | 1,841 | 93.8% |
| Smartphone | 1,812 | 92.3% |
| Tablet | 1,203 | 61.3% |
| No Computing Device | 50 | 2.5% |
| Total | 1,963 | 100.0% |
Internet Access in Mattituck
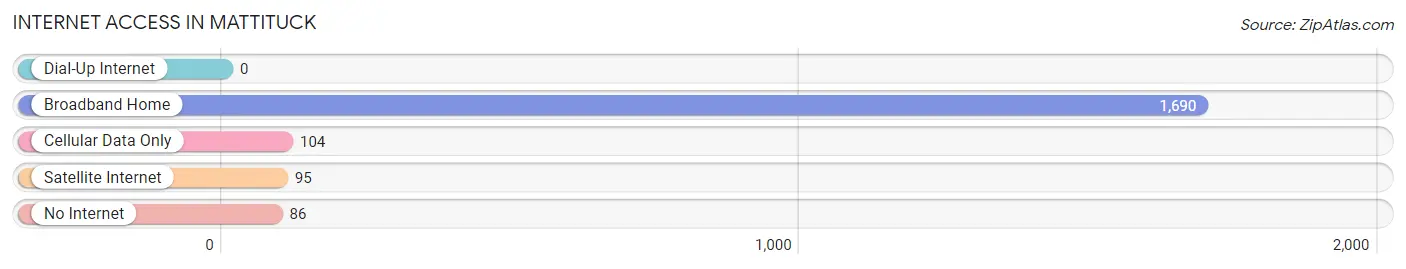
| Internet Type | # Households | % Households |
| Dial-Up Internet | 0 | 0.0% |
| Broadband Home | 1,690 | 86.1% |
| Cellular Data Only | 104 | 5.3% |
| Satellite Internet | 95 | 4.8% |
| No Internet | 86 | 4.4% |
| Total | 1,963 | 100.0% |
Mattituck Summary
Mattituck is a hamlet located in the Town of Southold in Suffolk County, New York. It is situated on the North Fork of Long Island, approximately 90 miles east of New York City. The hamlet is bordered by the hamlets of Cutchogue to the west, Laurel to the east, and Peconic to the south.
History
The area that is now Mattituck was originally inhabited by the Algonquin-speaking Manhanset Indians. The first European settlers arrived in the area in 1640, and the hamlet was officially established in 1744. The name Mattituck is derived from the Algonquin word “mattituck,” which means “great creek.”
In the late 19th century, Mattituck was a popular destination for wealthy New Yorkers looking to escape the hustle and bustle of the city. The area was known for its beautiful beaches, lush vineyards, and picturesque farms.
In the early 20th century, Mattituck became a popular destination for tourists and vacationers. The hamlet was home to several resorts, including the Mattituck Beach Club, which was a popular destination for families.
Geography
Mattituck is located on the North Fork of Long Island, approximately 90 miles east of New York City. The hamlet is bordered by the hamlets of Cutchogue to the west, Laurel to the east, and Peconic to the south.
The hamlet is situated on the Peconic Bay, which is part of the Long Island Sound. The bay is a popular destination for fishing, boating, and other water activities.
The area is known for its lush vineyards and farms, as well as its beautiful beaches. The hamlet is also home to several parks, including Mattituck Park, which features a playground, picnic area, and basketball court.
Economy
Mattituck’s economy is largely based on agriculture and tourism. The area is known for its vineyards and farms, which produce a variety of fruits and vegetables. The hamlet is also home to several wineries, which produce a variety of wines.
Tourism is also an important part of the local economy. The hamlet is home to several resorts, hotels, and bed and breakfasts, which attract visitors from all over the world. The area is also home to several restaurants, shops, and other attractions.
Demographics
As of the 2010 census, the population of Mattituck was 5,945. The population is predominantly white (94.3%), with small percentages of African American (1.3%), Asian (1.2%), and Hispanic (2.2%) residents.
The median household income in Mattituck is $77,917, and the median home value is $521,400. The unemployment rate is 3.7%, and the poverty rate is 4.3%.
Conclusion
Mattituck is a hamlet located in the Town of Southold in Suffolk County, New York. It is situated on the North Fork of Long Island, approximately 90 miles east of New York City. The hamlet is bordered by the hamlets of Cutchogue to the west, Laurel to the east, and Peconic to the south. The area is known for its lush vineyards and farms, as well as its beautiful beaches. The local economy is largely based on agriculture and tourism. The population of Mattituck is predominantly white, with small percentages of African American, Asian, and Hispanic residents. The median household income in Mattituck is $77,917, and the median home value is $521,400.
Common Questions
What is the Total Population of Mattituck?
Total Population of Mattituck is 4,800.
What is the Total Male Population of Mattituck?
Total Male Population of Mattituck is 2,310.
What is the Total Female Population of Mattituck?
Total Female Population of Mattituck is 2,490.
What is the Ratio of Males per 100 Females in Mattituck?
There are 92.77 Males per 100 Females in Mattituck.
What is the Ratio of Females per 100 Males in Mattituck?
There are 107.79 Females per 100 Males in Mattituck.
What is the Median Population Age in Mattituck?
Median Population Age in Mattituck is 50.1 Years.
What is the Average Family Size in Mattituck
Average Family Size in Mattituck is 2.9 People.
What is the Average Household Size in Mattituck
Average Household Size in Mattituck is 2.4 People.
What is Per Capita Income in Mattituck?
Per Capita income in Mattituck is $55,569.
What is the Median Family Income in Mattituck?
Median Family Income in Mattituck is $131,611.
What is the Median Household income in Mattituck?
Median Household Income in Mattituck is $106,813.
What is Income or Wage Gap in Mattituck?
Income or Wage Gap in Mattituck is 3.8%.
Women in Mattituck earn 96.2 cents for every dollar earned by a man.
What is Inequality or Gini Index in Mattituck?
Inequality or Gini Index in Mattituck is 0.37.
How Large is the Labor Force in Mattituck?
There are 2,414 People in the Labor Forcein in Mattituck.
What is the Percentage of People in the Labor Force in Mattituck?
57.4% of People are in the Labor Force in Mattituck.
What is the Unemployment Rate in Mattituck?
Unemployment Rate in Mattituck is 8.2%.