Lake Luzerne, NY
Lake Luzerne Map
Lake Luzerne Overview
1,354
TOTAL POPULATION
700
MALE POPULATION
654
FEMALE POPULATION
107.03
MALES / 100 FEMALES
93.43
FEMALES / 100 MALES
49.5
MEDIAN AGE
2.7
AVG FAMILY SIZE
1.9
AVG HOUSEHOLD SIZE
$40,046
PER CAPITA INCOME
$106,522
AVG FAMILY INCOME
$71,250
AVG HOUSEHOLD INCOME
0.45
INEQUALITY / GINI INDEX
609
LABOR FORCE [ PEOPLE ]
55.2%
PERCENT IN LABOR FORCE
3.4%
UNEMPLOYMENT RATE
Lake Luzerne Zip Codes
Lake Luzerne Area Codes
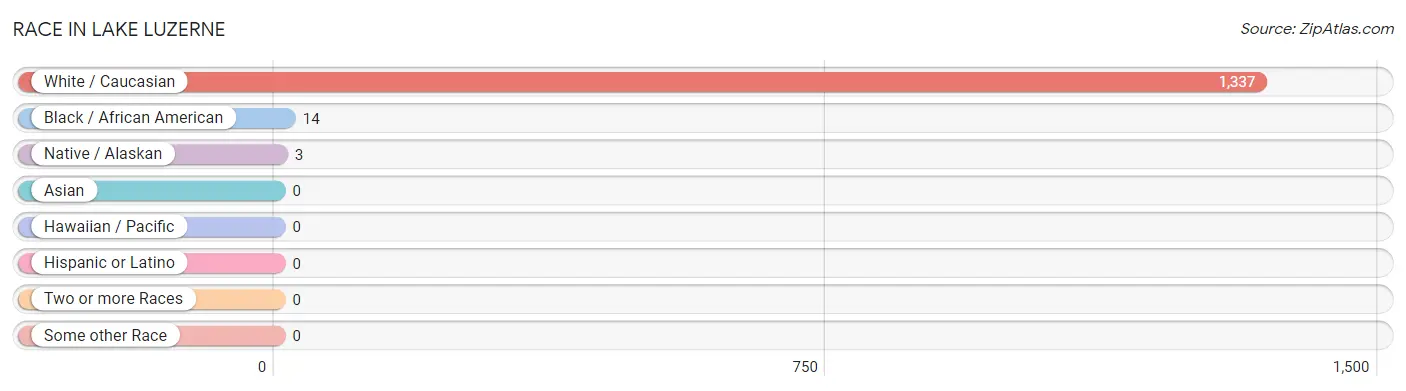
Race in Lake Luzerne
The most populous races in Lake Luzerne are White / Caucasian (1,337 | 98.7%), Black / African American (14 | 1.0%), and Native / Alaskan (3 | 0.2%).
| Race | # Population | % Population |
| Asian | 0 | 0.0% |
| Black / African American | 14 | 1.0% |
| Hawaiian / Pacific | 0 | 0.0% |
| Hispanic or Latino | 0 | 0.0% |
| Native / Alaskan | 3 | 0.2% |
| White / Caucasian | 1,337 | 98.7% |
| Two or more Races | 0 | 0.0% |
| Some other Race | 0 | 0.0% |
| Total | 1,354 | 100.0% |
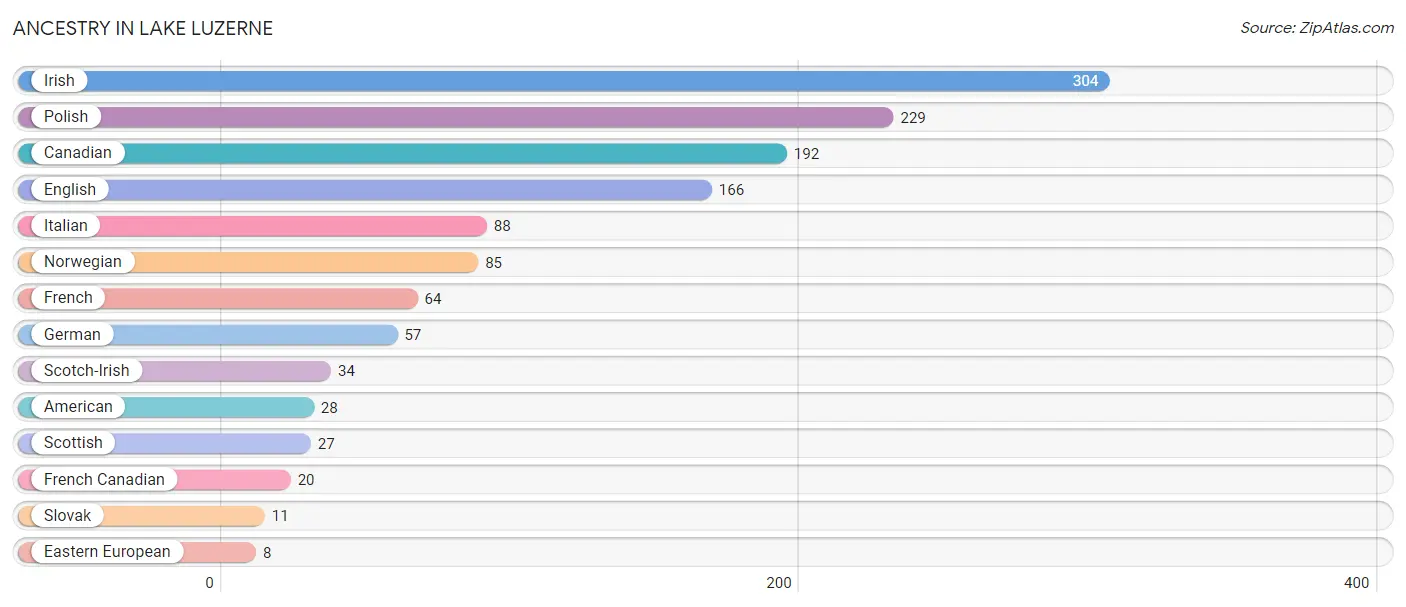
Ancestry in Lake Luzerne
The most populous ancestries reported in Lake Luzerne are Irish (304 | 22.5%), Polish (229 | 16.9%), Canadian (192 | 14.2%), English (166 | 12.3%), and Italian (88 | 6.5%), together accounting for 72.3% of all Lake Luzerne residents.
| Ancestry | # Population | % Population |
| American | 28 | 2.1% |
| Canadian | 192 | 14.2% |
| Eastern European | 8 | 0.6% |
| English | 166 | 12.3% |
| French | 64 | 4.7% |
| French Canadian | 20 | 1.5% |
| German | 57 | 4.2% |
| Irish | 304 | 22.5% |
| Italian | 88 | 6.5% |
| Norwegian | 85 | 6.3% |
| Polish | 229 | 16.9% |
| Scotch-Irish | 34 | 2.5% |
| Scottish | 27 | 2.0% |
| Slovak | 11 | 0.8% | View All 14 Rows |
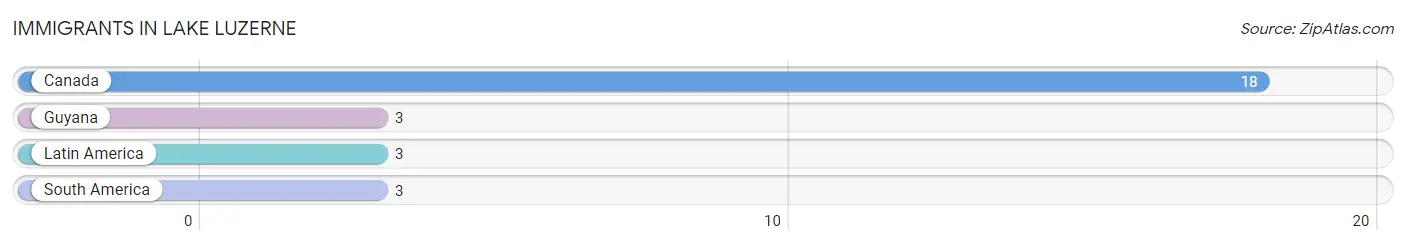
Immigrants in Lake Luzerne
The most numerous immigrant groups reported in Lake Luzerne came from Canada (18 | 1.3%), Guyana (3 | 0.2%), Latin America (3 | 0.2%), and South America (3 | 0.2%), together accounting for 2.0% of all Lake Luzerne residents.
| Immigration Origin | # Population | % Population |
| Canada | 18 | 1.3% |
| Guyana | 3 | 0.2% |
| Latin America | 3 | 0.2% |
| South America | 3 | 0.2% | View All 4 Rows |
Sex and Age in Lake Luzerne
Sex and Age in Lake Luzerne
The most populous age groups in Lake Luzerne are 30 to 34 Years (117 | 16.7%) for men and 80 to 84 Years (106 | 16.2%) for women.
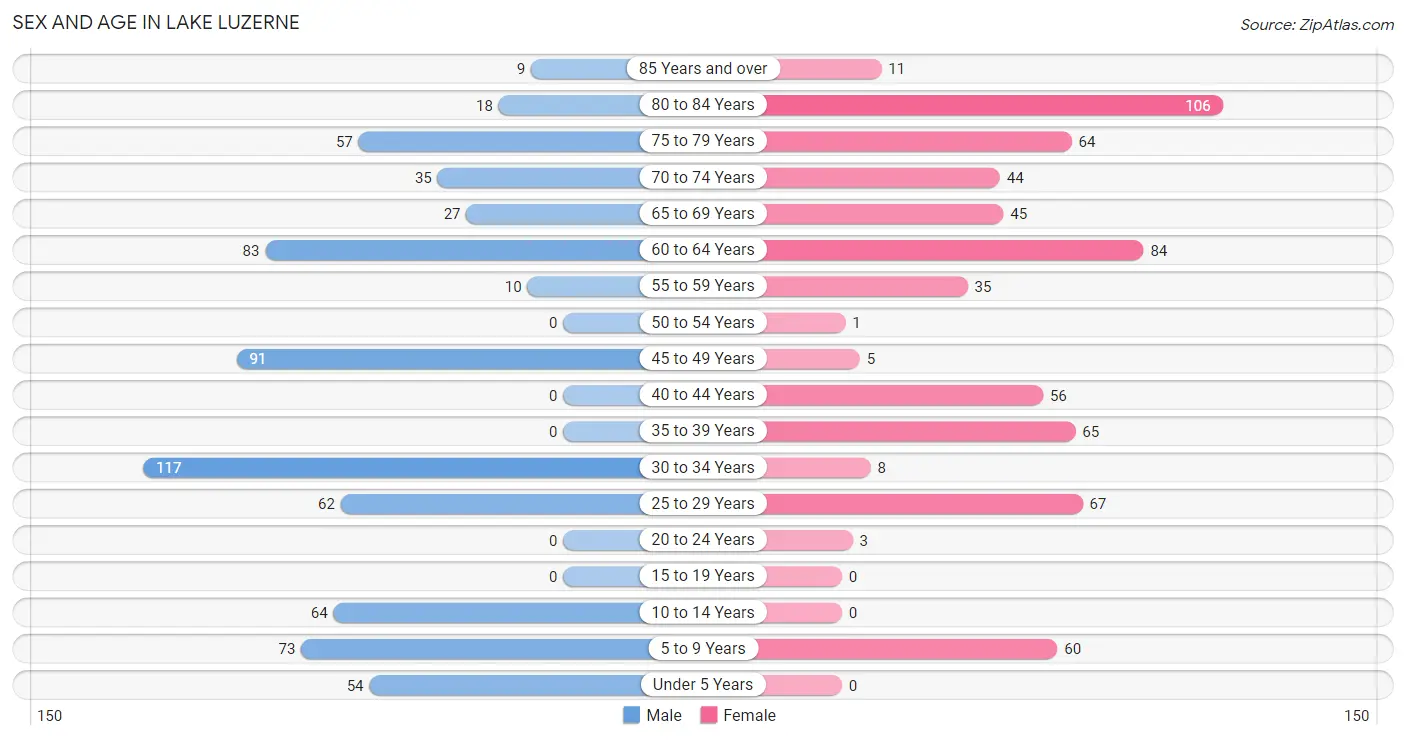
| Age Bracket | Male | Female |
| Under 5 Years | 54 (7.7%) | 0 (0.0%) |
| 5 to 9 Years | 73 (10.4%) | 60 (9.2%) |
| 10 to 14 Years | 64 (9.1%) | 0 (0.0%) |
| 15 to 19 Years | 0 (0.0%) | 0 (0.0%) |
| 20 to 24 Years | 0 (0.0%) | 3 (0.5%) |
| 25 to 29 Years | 62 (8.9%) | 67 (10.2%) |
| 30 to 34 Years | 117 (16.7%) | 8 (1.2%) |
| 35 to 39 Years | 0 (0.0%) | 65 (9.9%) |
| 40 to 44 Years | 0 (0.0%) | 56 (8.6%) |
| 45 to 49 Years | 91 (13.0%) | 5 (0.8%) |
| 50 to 54 Years | 0 (0.0%) | 1 (0.2%) |
| 55 to 59 Years | 10 (1.4%) | 35 (5.3%) |
| 60 to 64 Years | 83 (11.9%) | 84 (12.8%) |
| 65 to 69 Years | 27 (3.9%) | 45 (6.9%) |
| 70 to 74 Years | 35 (5.0%) | 44 (6.7%) |
| 75 to 79 Years | 57 (8.1%) | 64 (9.8%) |
| 80 to 84 Years | 18 (2.6%) | 106 (16.2%) |
| 85 Years and over | 9 (1.3%) | 11 (1.7%) |
| Total | 700 (100.0%) | 654 (100.0%) |
Families and Households in Lake Luzerne
Median Family Size in Lake Luzerne
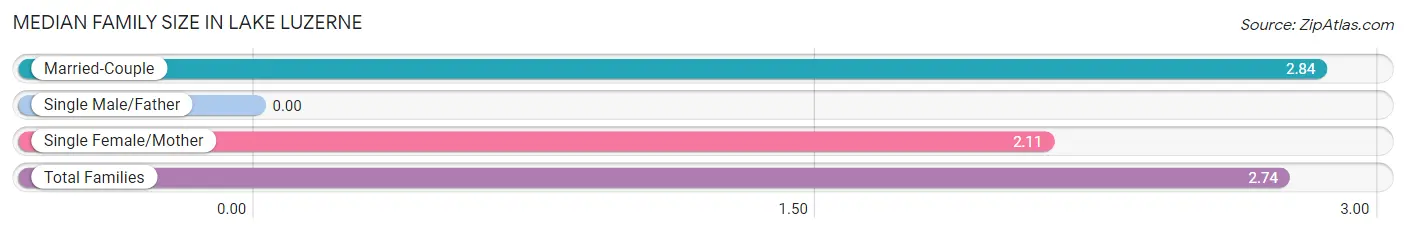
| Family Type | # Families | Family Size |
| Married-Couple | 287 (86.7%) | 2.84 |
| Single Male/Father | 0 (0.0%) | - |
| Single Female/Mother | 44 (13.3%) | 2.11 |
| Total Families | 331 (100.0%) | 2.74 |
Median Household Size in Lake Luzerne
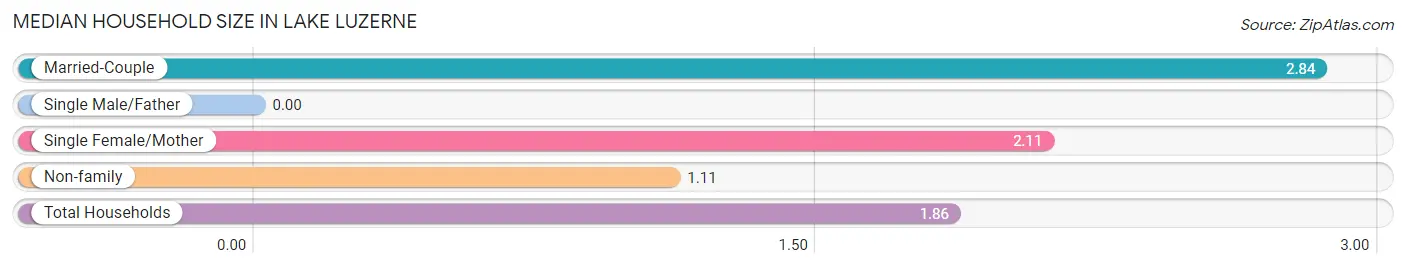
| Household Type | # Households | Household Size |
| Married-Couple | 287 (39.8%) | 2.84 |
| Single Male/Father | 0 (0.0%) | - |
| Single Female/Mother | 44 (6.1%) | 2.11 |
| Non-family | 390 (54.1%) | 1.11 |
| Total Households | 721 (100.0%) | 1.86 |
Household Size by Marriage Status in Lake Luzerne
Out of a total of 721 households in Lake Luzerne, 331 (45.9%) are family households, while 390 (54.1%) are nonfamily households. The most numerous type of family households are 2-person households, comprising 157, and the most common type of nonfamily households are 1-person households, comprising 348.
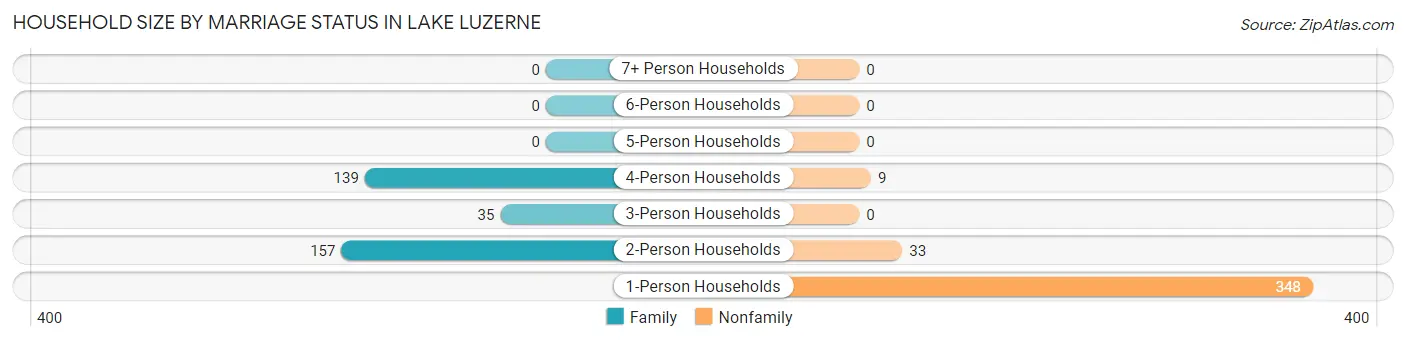
| Household Size | Family Households | Nonfamily Households |
| 1-Person Households | - | 348 (48.3%) |
| 2-Person Households | 157 (21.8%) | 33 (4.6%) |
| 3-Person Households | 35 (4.9%) | 0 (0.0%) |
| 4-Person Households | 139 (19.3%) | 9 (1.3%) |
| 5-Person Households | 0 (0.0%) | 0 (0.0%) |
| 6-Person Households | 0 (0.0%) | 0 (0.0%) |
| 7+ Person Households | 0 (0.0%) | 0 (0.0%) |
| Total | 331 (45.9%) | 390 (54.1%) |
Female Fertility in Lake Luzerne
Fertility by Age in Lake Luzerne
| Age Bracket | Women with Births | Births / 1,000 Women |
| 15 to 19 years | 0 (0.0%) | 0.0 |
| 20 to 34 years | 0 (0.0%) | 0.0 |
| 35 to 50 years | 0 (0.0%) | 0.0 |
| Total | 0 (0.0%) | 0.0 |
Fertility by Age by Marriage Status in Lake Luzerne
| Age Bracket | Married | Unmarried |
| 15 to 19 years | 0 (0.0%) | 0 (0.0%) |
| 20 to 34 years | 0 (0.0%) | 0 (0.0%) |
| 35 to 50 years | 0 (0.0%) | 0 (0.0%) |
| Total | 0 (0.0%) | 0 (0.0%) |
Fertility by Education in Lake Luzerne
| Educational Attainment | Women with Births | Births / 1,000 Women |
| Less than High School | 0 (0.0%) | 0.0 |
| High School Diploma | 0 (0.0%) | 0.0 |
| College or Associate's Degree | 0 (0.0%) | 0.0 |
| Bachelor's Degree | 0 (0.0%) | 0.0 |
| Graduate Degree | 0 (0.0%) | 0.0 |
| Total | 0 (0.0%) | 0.0 |
Fertility by Education by Marriage Status in Lake Luzerne
| Educational Attainment | Married | Unmarried |
| Less than High School | 0 (0.0%) | 0 (0.0%) |
| High School Diploma | 0 (0.0%) | 0 (0.0%) |
| College or Associate's Degree | 0 (0.0%) | 0 (0.0%) |
| Bachelor's Degree | 0 (0.0%) | 0 (0.0%) |
| Graduate Degree | 0 (0.0%) | 0 (0.0%) |
| Total | 0 (0.0%) | 0 (0.0%) |
Income in Lake Luzerne
Income Overview in Lake Luzerne
Per Capita Income in Lake Luzerne is $40,046, while median incomes of families and households are $106,522 and $71,250 respectively.
| Characteristic | Number | Measure |
| Per Capita Income | 1,354 | $40,046 |
| Median Family Income | 331 | $106,522 |
| Mean Family Income | 331 | $125,012 |
| Median Household Income | 721 | $71,250 |
| Mean Household Income | 721 | $77,798 |
| Income Deficit | 331 | $0 |
| Wage / Income Gap (%) | 1,354 | 0.00% |
| Wage / Income Gap ($) | 1,354 | 100.00¢ per $1 |
| Gini / Inequality Index | 1,354 | 0.45 |
Earnings by Sex in Lake Luzerne
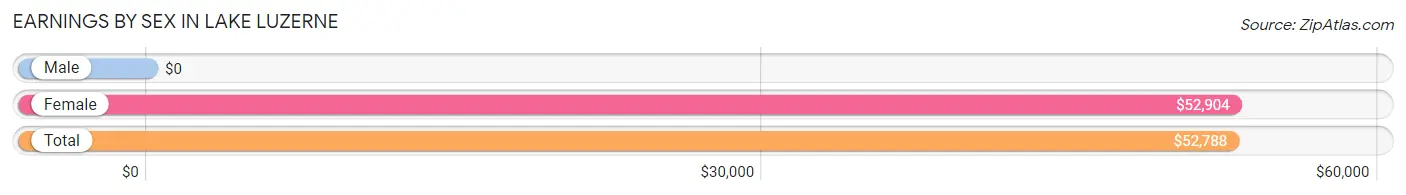
| Sex | Number | Average Earnings |
| Male | 264 (42.6%) | $0 |
| Female | 355 (57.4%) | $52,904 |
| Total | 619 (100.0%) | $52,788 |
Earnings by Sex by Income Bracket in Lake Luzerne
The most common earnings brackets in Lake Luzerne are $75,000 to $99,999 for men (120 | 45.5%) and $75,000 to $99,999 for women (91 | 25.6%).
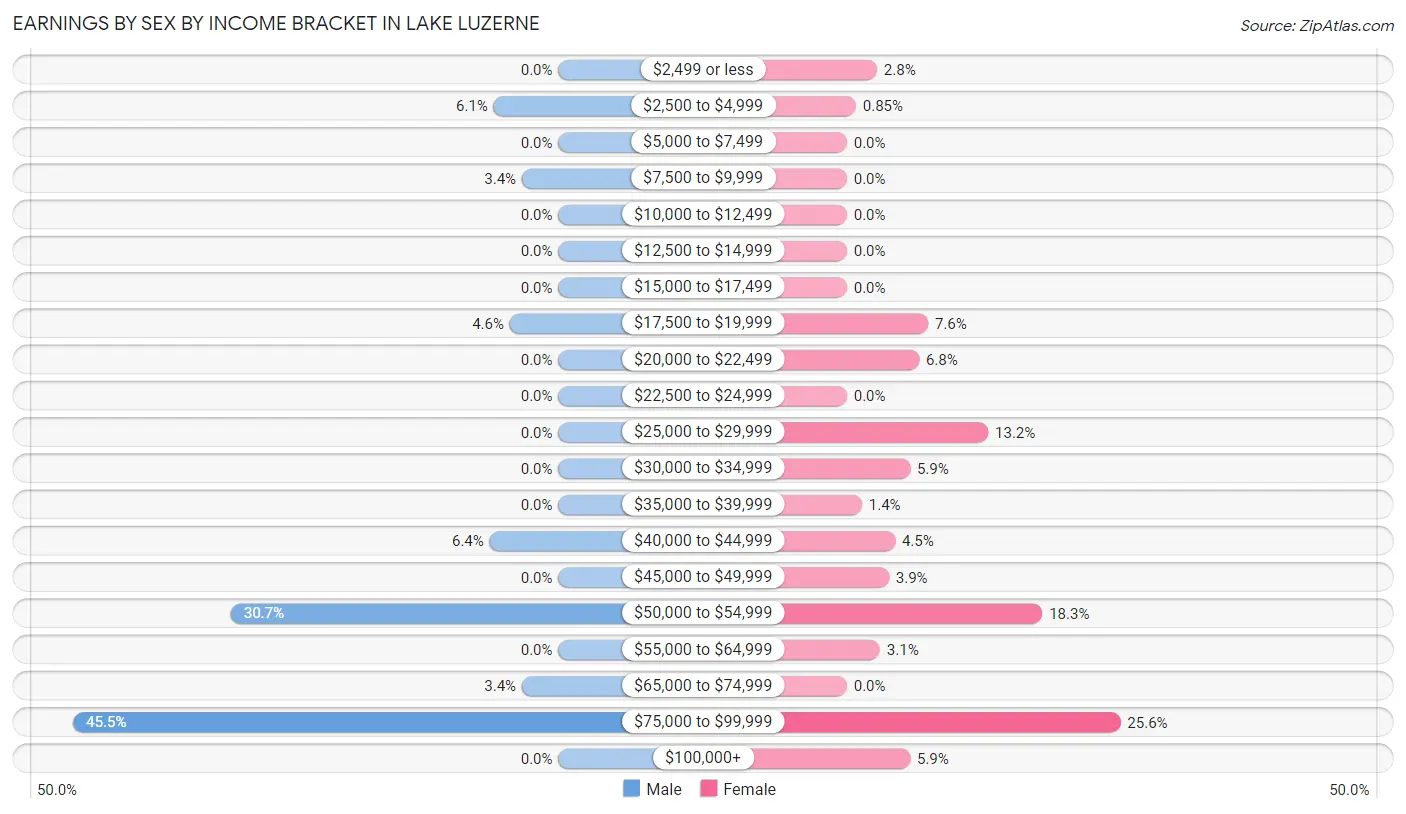
| Income | Male | Female |
| $2,499 or less | 0 (0.0%) | 10 (2.8%) |
| $2,500 to $4,999 | 16 (6.1%) | 3 (0.9%) |
| $5,000 to $7,499 | 0 (0.0%) | 0 (0.0%) |
| $7,500 to $9,999 | 9 (3.4%) | 0 (0.0%) |
| $10,000 to $12,499 | 0 (0.0%) | 0 (0.0%) |
| $12,500 to $14,999 | 0 (0.0%) | 0 (0.0%) |
| $15,000 to $17,499 | 0 (0.0%) | 0 (0.0%) |
| $17,500 to $19,999 | 12 (4.5%) | 27 (7.6%) |
| $20,000 to $22,499 | 0 (0.0%) | 24 (6.8%) |
| $22,500 to $24,999 | 0 (0.0%) | 0 (0.0%) |
| $25,000 to $29,999 | 0 (0.0%) | 47 (13.2%) |
| $30,000 to $34,999 | 0 (0.0%) | 21 (5.9%) |
| $35,000 to $39,999 | 0 (0.0%) | 5 (1.4%) |
| $40,000 to $44,999 | 17 (6.4%) | 16 (4.5%) |
| $45,000 to $49,999 | 0 (0.0%) | 14 (3.9%) |
| $50,000 to $54,999 | 81 (30.7%) | 65 (18.3%) |
| $55,000 to $64,999 | 0 (0.0%) | 11 (3.1%) |
| $65,000 to $74,999 | 9 (3.4%) | 0 (0.0%) |
| $75,000 to $99,999 | 120 (45.5%) | 91 (25.6%) |
| $100,000+ | 0 (0.0%) | 21 (5.9%) |
| Total | 264 (100.0%) | 355 (100.0%) |
Earnings by Sex by Educational Attainment in Lake Luzerne
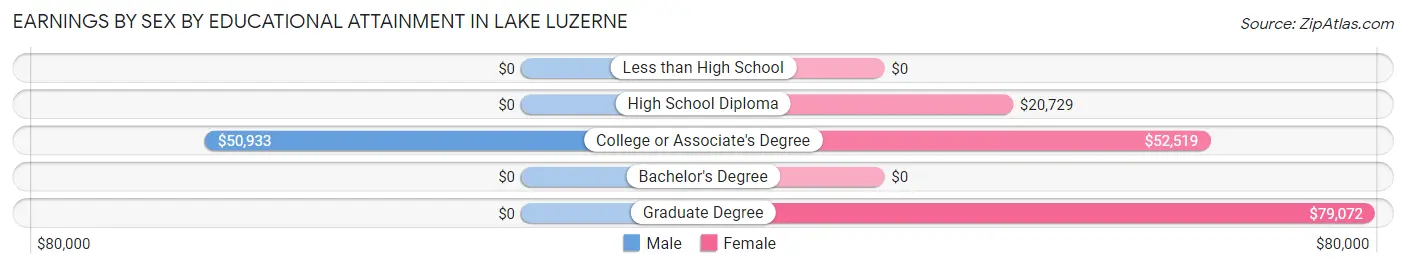
| Educational Attainment | Male Income | Female Income |
| Less than High School | - | - |
| High School Diploma | - | - |
| College or Associate's Degree | $50,933 | $52,519 |
| Bachelor's Degree | - | - |
| Graduate Degree | - | - |
| Total | - | - |
Family Income in Lake Luzerne
Family Income Brackets in Lake Luzerne
According to the Lake Luzerne family income data, there are 109 families falling into the $150,000 to $199,999 income range, which is the most common income bracket and makes up 32.9% of all families.
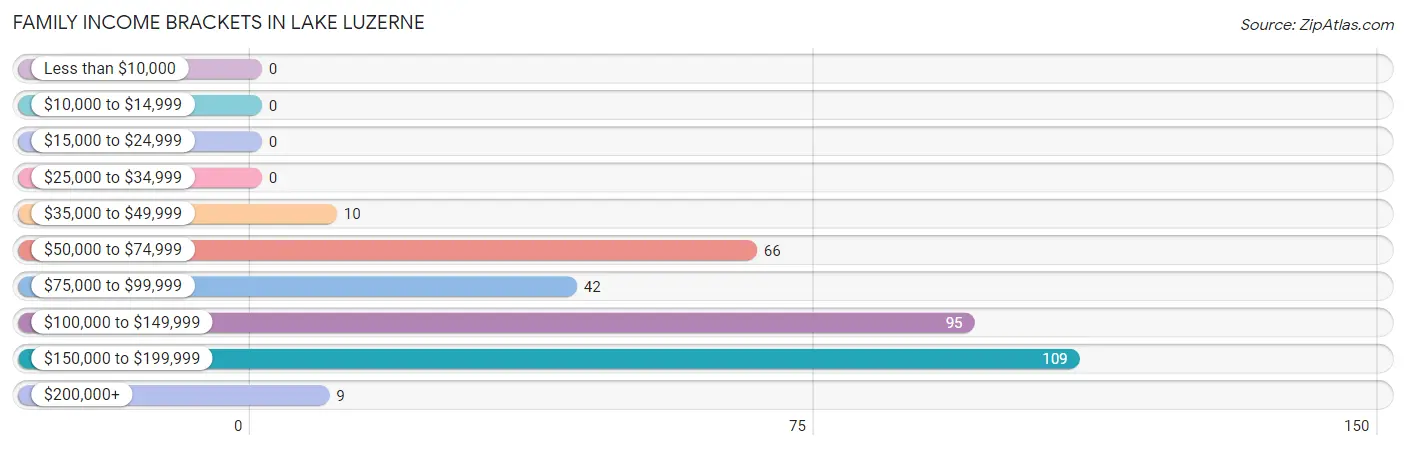
| Income Bracket | # Families | % Families |
| Less than $10,000 | 0 | 0.0% |
| $10,000 to $14,999 | 0 | 0.0% |
| $15,000 to $24,999 | 0 | 0.0% |
| $25,000 to $34,999 | 0 | 0.0% |
| $35,000 to $49,999 | 10 | 3.0% |
| $50,000 to $74,999 | 66 | 19.9% |
| $75,000 to $99,999 | 42 | 12.7% |
| $100,000 to $149,999 | 95 | 28.7% |
| $150,000 to $199,999 | 109 | 32.9% |
| $200,000+ | 9 | 2.7% |
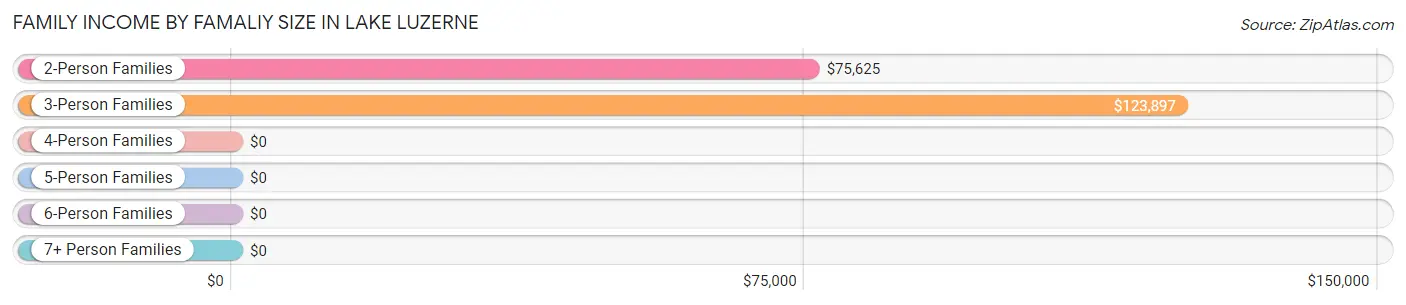
Family Income by Famaliy Size in Lake Luzerne
3-person families (35 | 10.6%) account for the highest median family income in Lake Luzerne with $123,897 per family, while 3-person families (35 | 10.6%) have the highest median income of $41,299 per family member.
| Income Bracket | # Families | Median Income |
| 2-Person Families | 157 (47.4%) | $75,625 |
| 3-Person Families | 35 (10.6%) | $123,897 |
| 4-Person Families | 139 (42.0%) | $0 |
| 5-Person Families | 0 (0.0%) | $0 |
| 6-Person Families | 0 (0.0%) | $0 |
| 7+ Person Families | 0 (0.0%) | $0 |
| Total | 331 (100.0%) | $106,522 |
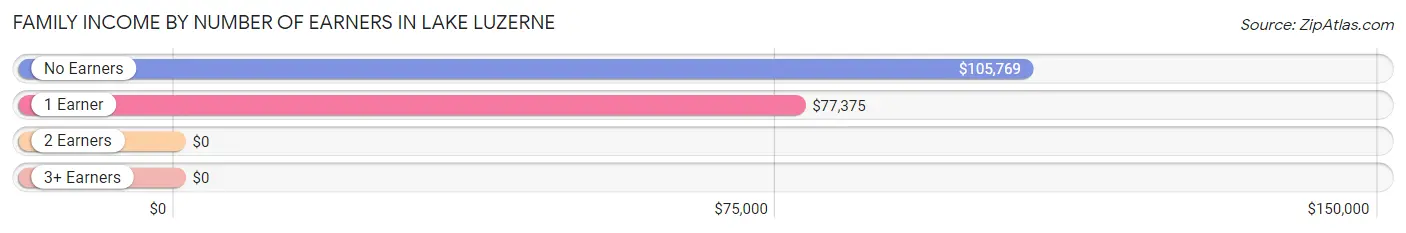
Family Income by Number of Earners in Lake Luzerne
| Number of Earners | # Families | Median Income |
| No Earners | 68 (20.5%) | $105,769 |
| 1 Earner | 57 (17.2%) | $77,375 |
| 2 Earners | 189 (57.1%) | $0 |
| 3+ Earners | 17 (5.1%) | $0 |
| Total | 331 (100.0%) | $106,522 |
Household Income in Lake Luzerne
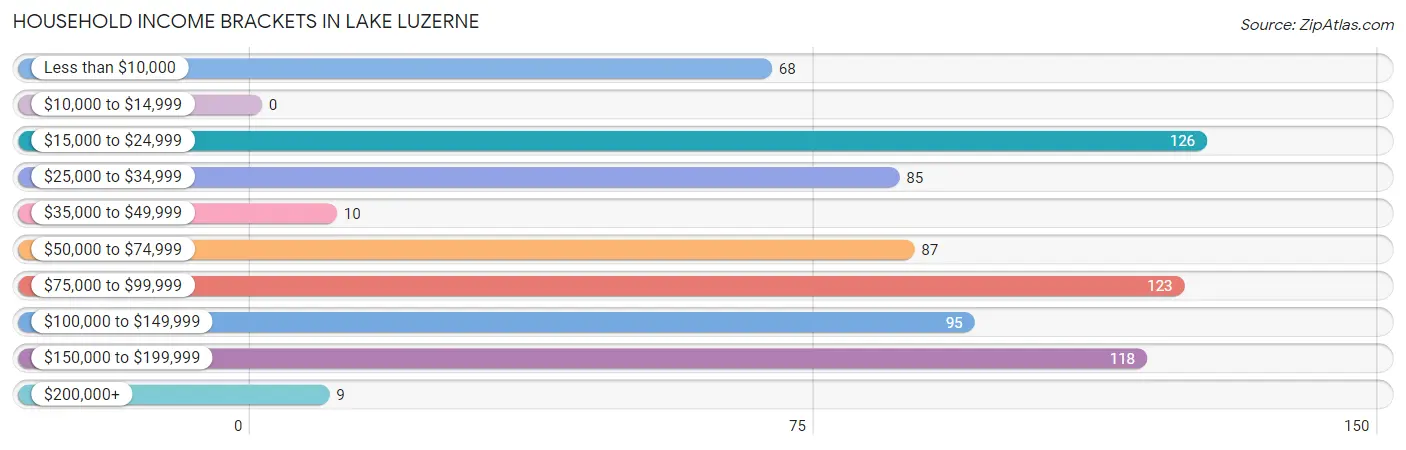
Household Income Brackets in Lake Luzerne
With 126 households falling in the category, the $15,000 to $24,999 income range is the most frequent in Lake Luzerne, accounting for 17.5% of all households.
| Income Bracket | # Households | % Households |
| Less than $10,000 | 68 | 9.4% |
| $10,000 to $14,999 | 0 | 0.0% |
| $15,000 to $24,999 | 126 | 17.5% |
| $25,000 to $34,999 | 85 | 11.8% |
| $35,000 to $49,999 | 10 | 1.4% |
| $50,000 to $74,999 | 87 | 12.1% |
| $75,000 to $99,999 | 123 | 17.1% |
| $100,000 to $149,999 | 95 | 13.2% |
| $150,000 to $199,999 | 118 | 16.4% |
| $200,000+ | 9 | 1.2% |
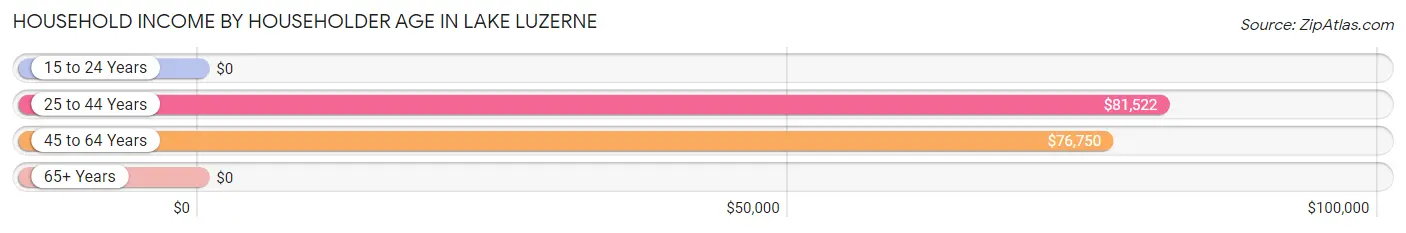
Household Income by Householder Age in Lake Luzerne
The median household income in Lake Luzerne is $71,250, with the highest median household income of $81,522 found in the 25 to 44 years age bracket for the primary householder. A total of 184 households (25.5%) fall into this category.
| Income Bracket | # Households | Median Income |
| 15 to 24 Years | 0 (0.0%) | $0 |
| 25 to 44 Years | 184 (25.5%) | $81,522 |
| 45 to 64 Years | 236 (32.7%) | $76,750 |
| 65+ Years | 301 (41.7%) | $0 |
| Total | 721 (100.0%) | $71,250 |
Poverty in Lake Luzerne
Income Below Poverty by Sex and Age in Lake Luzerne
With 14.7% poverty level for males and 2.9% for females among the residents of Lake Luzerne, 55 to 64 year old males and 18 to 24 year old females are the most vulnerable to poverty, with 65 males (69.9%) and 3 females (100.0%) in their respective age groups living below the poverty level.
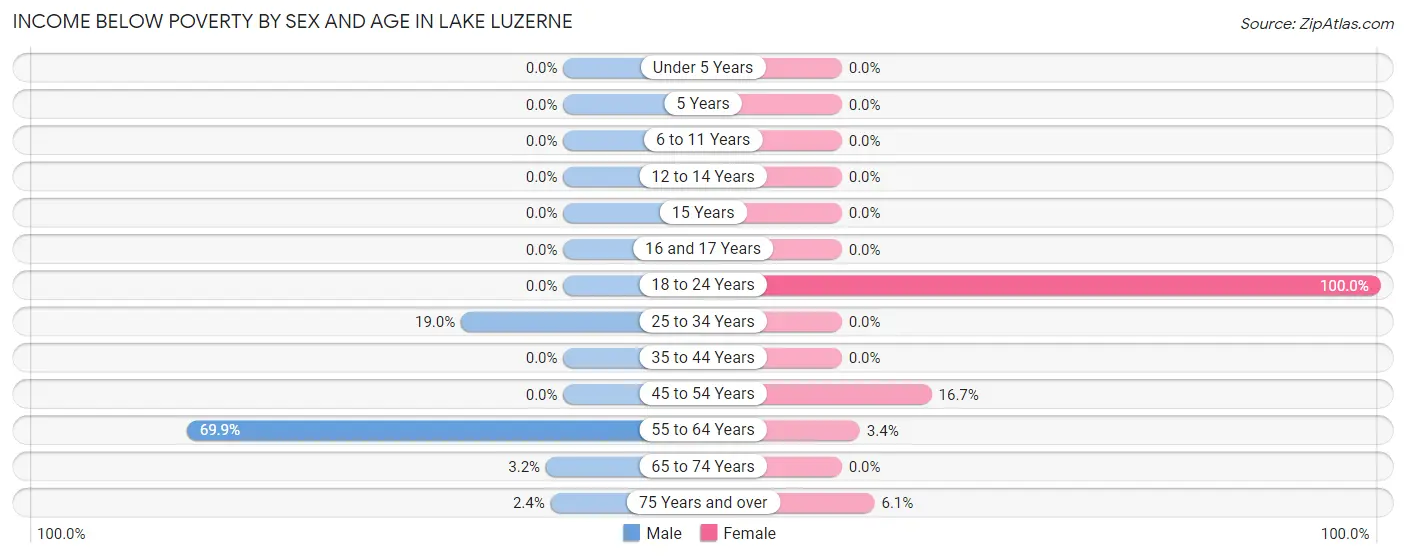
| Age Bracket | Male | Female |
| Under 5 Years | 0 (0.0%) | 0 (0.0%) |
| 5 Years | 0 (0.0%) | 0 (0.0%) |
| 6 to 11 Years | 0 (0.0%) | 0 (0.0%) |
| 12 to 14 Years | 0 (0.0%) | 0 (0.0%) |
| 15 Years | 0 (0.0%) | 0 (0.0%) |
| 16 and 17 Years | 0 (0.0%) | 0 (0.0%) |
| 18 to 24 Years | 0 (0.0%) | 3 (100.0%) |
| 25 to 34 Years | 34 (19.0%) | 0 (0.0%) |
| 35 to 44 Years | 0 (0.0%) | 0 (0.0%) |
| 45 to 54 Years | 0 (0.0%) | 1 (16.7%) |
| 55 to 64 Years | 65 (69.9%) | 4 (3.4%) |
| 65 to 74 Years | 2 (3.2%) | 0 (0.0%) |
| 75 Years and over | 2 (2.4%) | 11 (6.1%) |
| Total | 103 (14.7%) | 19 (2.9%) |
Income Above Poverty by Sex and Age in Lake Luzerne
According to the poverty statistics in Lake Luzerne, males aged under 5 years and females aged 6 to 11 years are the age groups that are most secure financially, with 100.0% of males and 100.0% of females in these age groups living above the poverty line.
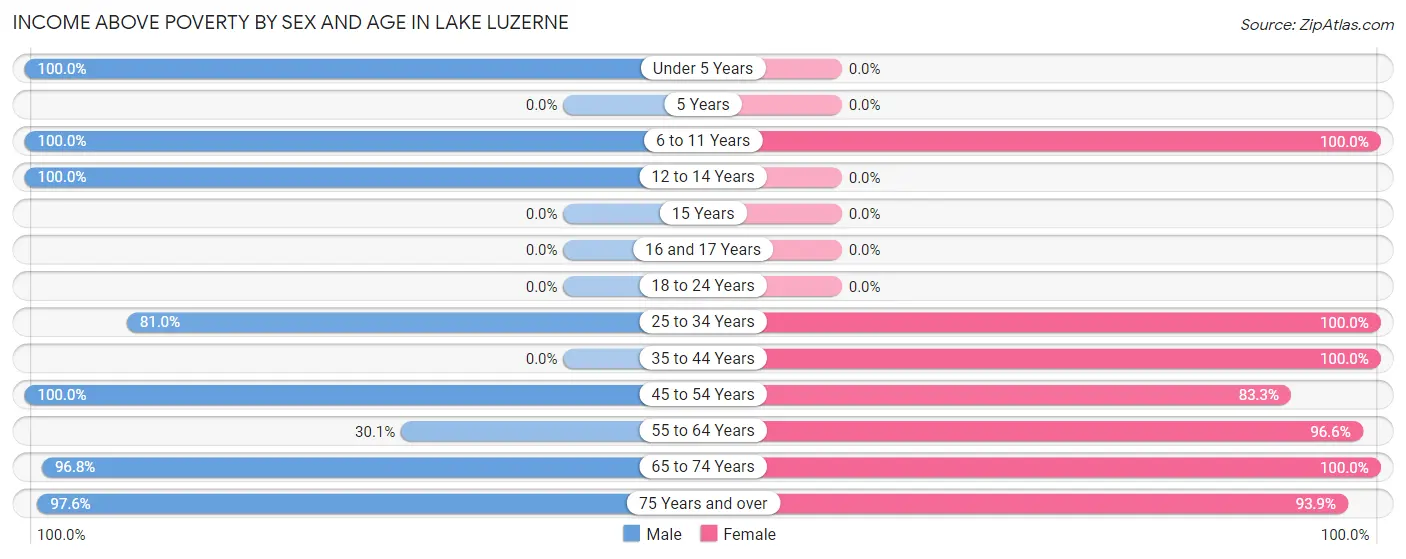
| Age Bracket | Male | Female |
| Under 5 Years | 54 (100.0%) | 0 (0.0%) |
| 5 Years | 0 (0.0%) | 0 (0.0%) |
| 6 to 11 Years | 73 (100.0%) | 60 (100.0%) |
| 12 to 14 Years | 64 (100.0%) | 0 (0.0%) |
| 15 Years | 0 (0.0%) | 0 (0.0%) |
| 16 and 17 Years | 0 (0.0%) | 0 (0.0%) |
| 18 to 24 Years | 0 (0.0%) | 0 (0.0%) |
| 25 to 34 Years | 145 (81.0%) | 75 (100.0%) |
| 35 to 44 Years | 0 (0.0%) | 121 (100.0%) |
| 45 to 54 Years | 91 (100.0%) | 5 (83.3%) |
| 55 to 64 Years | 28 (30.1%) | 115 (96.6%) |
| 65 to 74 Years | 60 (96.8%) | 89 (100.0%) |
| 75 Years and over | 82 (97.6%) | 170 (93.9%) |
| Total | 597 (85.3%) | 635 (97.1%) |
Income Below Poverty Among Married-Couple Families in Lake Luzerne
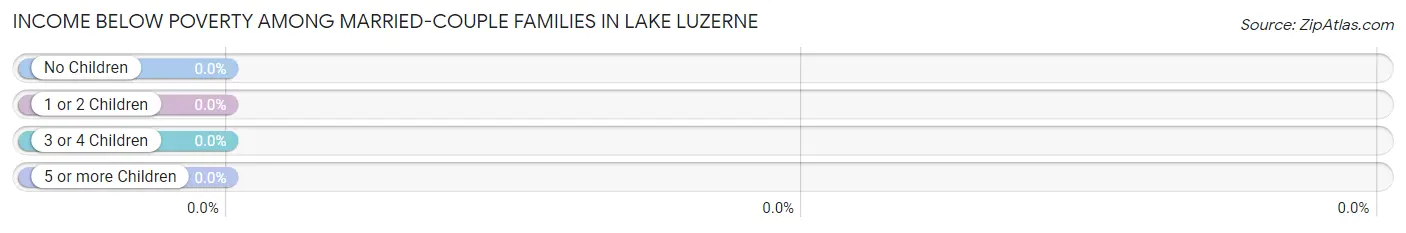
| Children | Above Poverty | Below Poverty |
| No Children | 148 (100.0%) | 0 (0.0%) |
| 1 or 2 Children | 139 (100.0%) | 0 (0.0%) |
| 3 or 4 Children | 0 (0.0%) | 0 (0.0%) |
| 5 or more Children | 0 (0.0%) | 0 (0.0%) |
| Total | 287 (100.0%) | 0 (0.0%) |
Income Below Poverty Among Single-Parent Households in Lake Luzerne
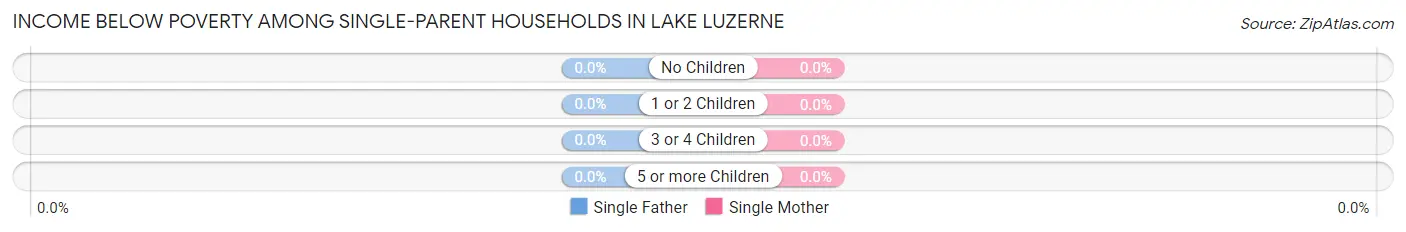
| Children | Single Father | Single Mother |
| No Children | 0 (0.0%) | 0 (0.0%) |
| 1 or 2 Children | 0 (0.0%) | 0 (0.0%) |
| 3 or 4 Children | 0 (0.0%) | 0 (0.0%) |
| 5 or more Children | 0 (0.0%) | 0 (0.0%) |
| Total | 0 (0.0%) | 0 (0.0%) |
Income Below Poverty Among Married-Couple vs Single-Parent Households in Lake Luzerne
| Children | Married-Couple Families | Single-Parent Households |
| No Children | 0 (0.0%) | 0 (0.0%) |
| 1 or 2 Children | 0 (0.0%) | 0 (0.0%) |
| 3 or 4 Children | 0 (0.0%) | 0 (0.0%) |
| 5 or more Children | 0 (0.0%) | 0 (0.0%) |
| Total | 0 (0.0%) | 0 (0.0%) |
Employment Characteristics in Lake Luzerne
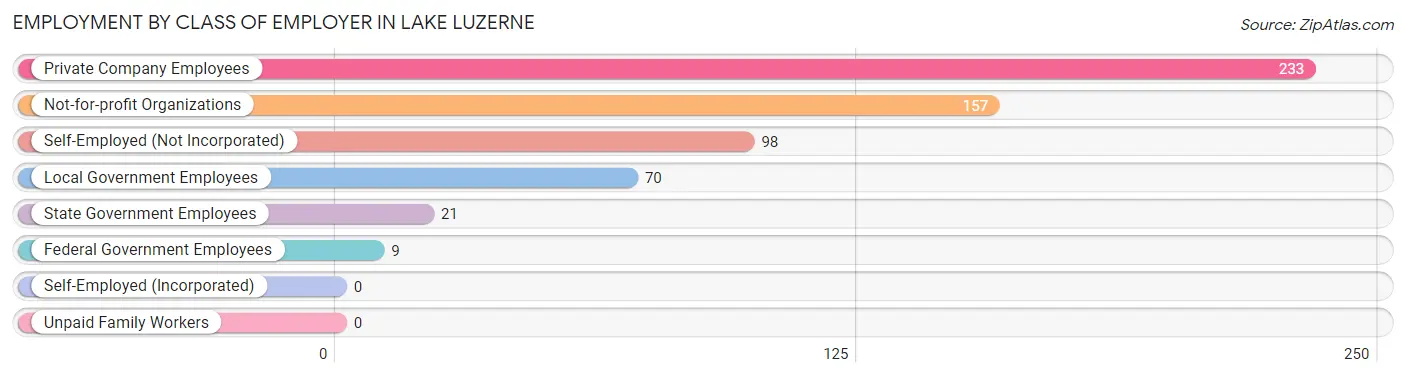
Employment by Class of Employer in Lake Luzerne
Among the 588 employed individuals in Lake Luzerne, private company employees (233 | 39.6%), not-for-profit organizations (157 | 26.7%), and self-employed (not incorporated) (98 | 16.7%) make up the most common classes of employment.
| Employer Class | # Employees | % Employees |
| Private Company Employees | 233 | 39.6% |
| Self-Employed (Incorporated) | 0 | 0.0% |
| Self-Employed (Not Incorporated) | 98 | 16.7% |
| Not-for-profit Organizations | 157 | 26.7% |
| Local Government Employees | 70 | 11.9% |
| State Government Employees | 21 | 3.6% |
| Federal Government Employees | 9 | 1.5% |
| Unpaid Family Workers | 0 | 0.0% |
| Total | 588 | 100.0% |
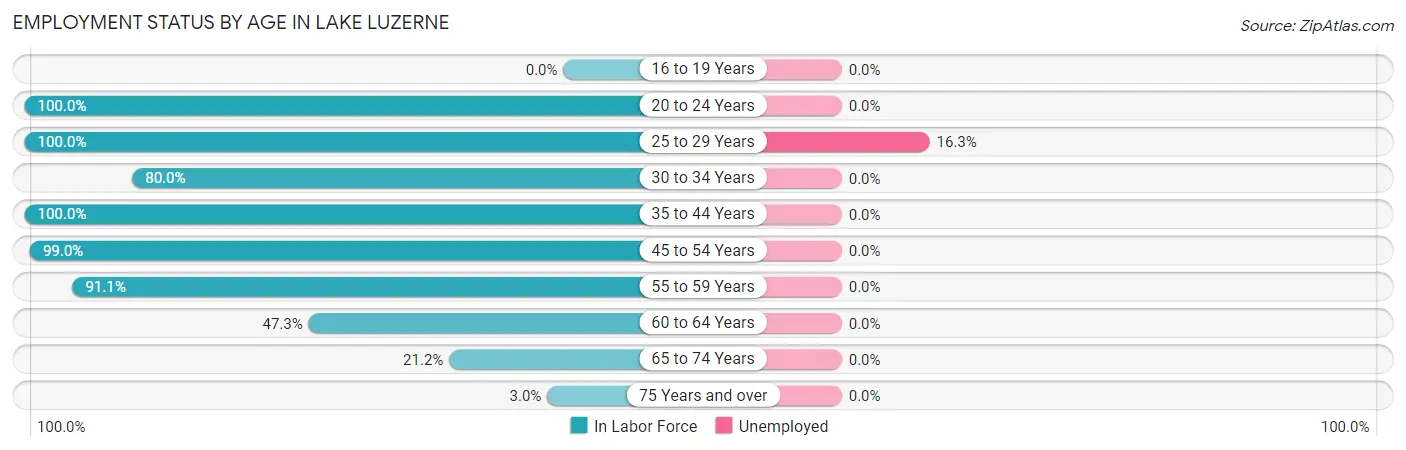
Employment Status by Age in Lake Luzerne
According to the labor force statistics for Lake Luzerne, out of the total population over 16 years of age (1,103), 55.2% or 609 individuals are in the labor force, with 3.4% or 21 of them unemployed. The age group with the highest labor force participation rate is 20 to 24 years, with 100.0% or 3 individuals in the labor force. Within the labor force, the 25 to 29 years age range has the highest percentage of unemployed individuals, with 16.3% or 21 of them being unemployed.
| Age Bracket | In Labor Force | Unemployed |
| 16 to 19 Years | 0 (0.0%) | 0 (0.0%) |
| 20 to 24 Years | 3 (100.0%) | 0 (0.0%) |
| 25 to 29 Years | 129 (100.0%) | 21 (16.3%) |
| 30 to 34 Years | 100 (80.0%) | 0 (0.0%) |
| 35 to 44 Years | 121 (100.0%) | 0 (0.0%) |
| 45 to 54 Years | 96 (99.0%) | 0 (0.0%) |
| 55 to 59 Years | 41 (91.1%) | 0 (0.0%) |
| 60 to 64 Years | 79 (47.3%) | 0 (0.0%) |
| 65 to 74 Years | 32 (21.2%) | 0 (0.0%) |
| 75 Years and over | 8 (3.0%) | 0 (0.0%) |
| Total | 609 (55.2%) | 21 (3.4%) |
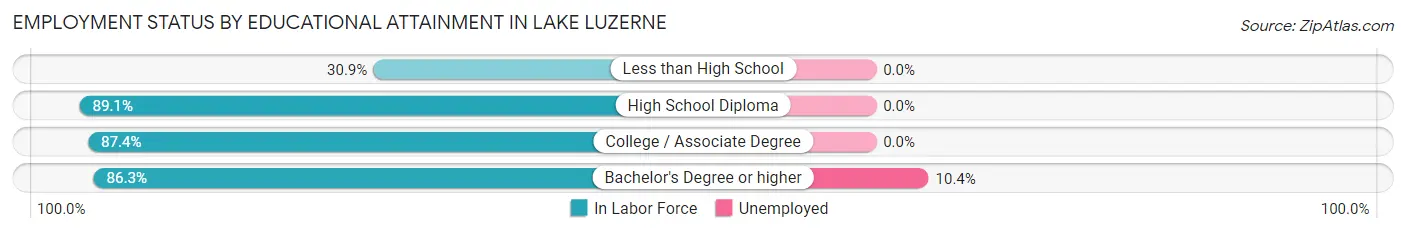
Employment Status by Educational Attainment in Lake Luzerne
According to labor force statistics for Lake Luzerne, 82.7% of individuals (566) out of the total population between 25 and 64 years of age (684) are in the labor force, with 3.7% or 21 of them being unemployed. The group with the highest labor force participation rate are those with the educational attainment of high school diploma, with 89.1% or 106 individuals in the labor force. Within the labor force, individuals with bachelor's degree or higher education have the highest percentage of unemployment, with 10.4% or 21 of them being unemployed.
| Educational Attainment | In Labor Force | Unemployed |
| Less than High School | 17 (30.9%) | 0 (0.0%) |
| High School Diploma | 106 (89.1%) | 0 (0.0%) |
| College / Associate Degree | 242 (87.4%) | 0 (0.0%) |
| Bachelor's Degree or higher | 201 (86.3%) | 24 (10.4%) |
| Total | 566 (82.7%) | 25 (3.7%) |
Employment Occupations by Sex in Lake Luzerne
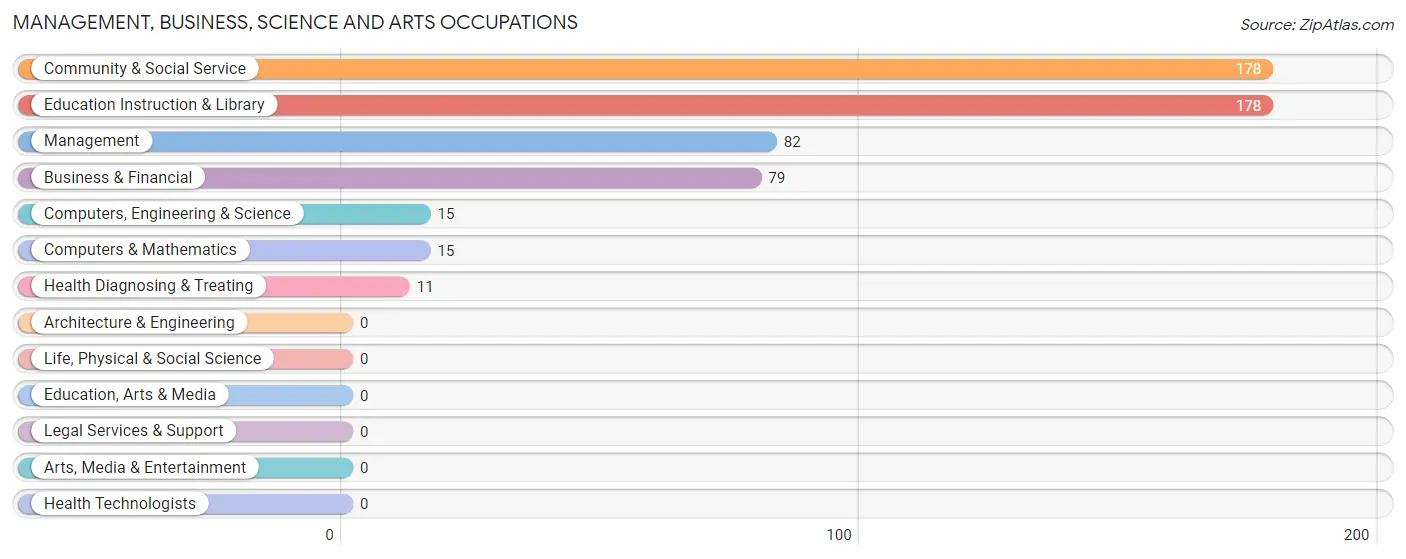
Management, Business, Science and Arts Occupations
The most common Management, Business, Science and Arts occupations in Lake Luzerne are Community & Social Service (178 | 30.3%), Education Instruction & Library (178 | 30.3%), Management (82 | 14.0%), Business & Financial (79 | 13.4%), and Computers, Engineering & Science (15 | 2.5%).
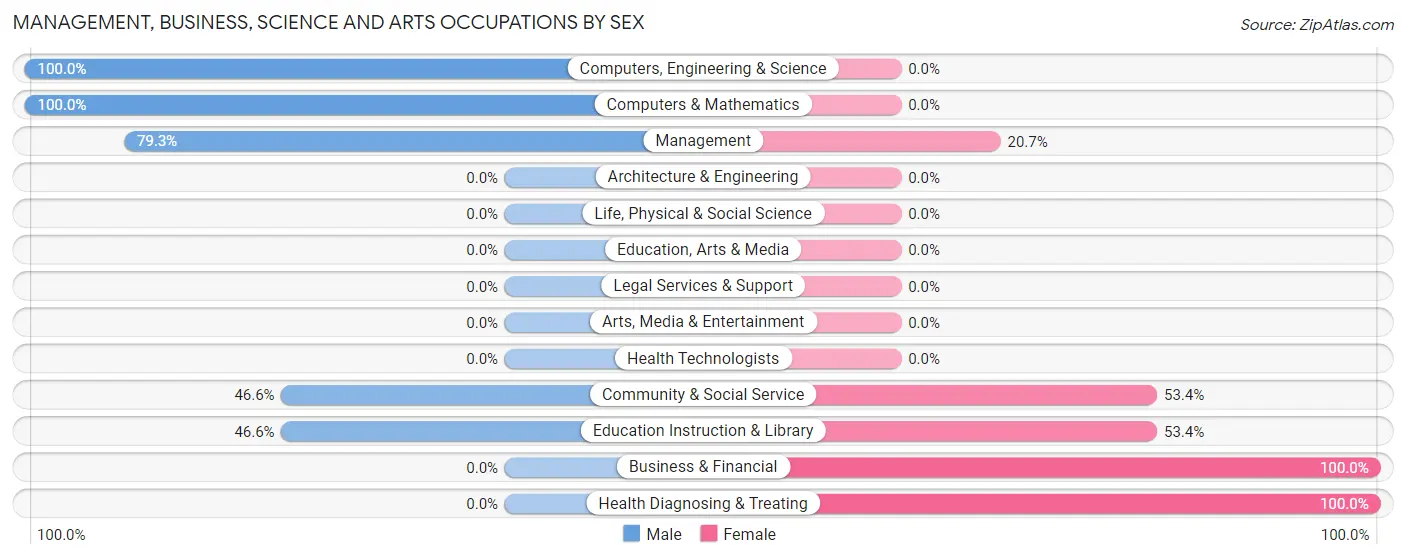
Management, Business, Science and Arts Occupations by Sex
Within the Management, Business, Science and Arts occupations in Lake Luzerne, the most male-oriented occupations are Computers, Engineering & Science (100.0%), Computers & Mathematics (100.0%), and Management (79.3%), while the most female-oriented occupations are Business & Financial (100.0%), Health Diagnosing & Treating (100.0%), and Community & Social Service (53.4%).
| Occupation | Male | Female |
| Management | 65 (79.3%) | 17 (20.7%) |
| Business & Financial | 0 (0.0%) | 79 (100.0%) |
| Computers, Engineering & Science | 15 (100.0%) | 0 (0.0%) |
| Computers & Mathematics | 15 (100.0%) | 0 (0.0%) |
| Architecture & Engineering | 0 (0.0%) | 0 (0.0%) |
| Life, Physical & Social Science | 0 (0.0%) | 0 (0.0%) |
| Community & Social Service | 83 (46.6%) | 95 (53.4%) |
| Education, Arts & Media | 0 (0.0%) | 0 (0.0%) |
| Legal Services & Support | 0 (0.0%) | 0 (0.0%) |
| Education Instruction & Library | 83 (46.6%) | 95 (53.4%) |
| Arts, Media & Entertainment | 0 (0.0%) | 0 (0.0%) |
| Health Diagnosing & Treating | 0 (0.0%) | 11 (100.0%) |
| Health Technologists | 0 (0.0%) | 0 (0.0%) |
| Total (Category) | 163 (44.7%) | 202 (55.3%) |
| Total (Overall) | 264 (44.9%) | 324 (55.1%) |
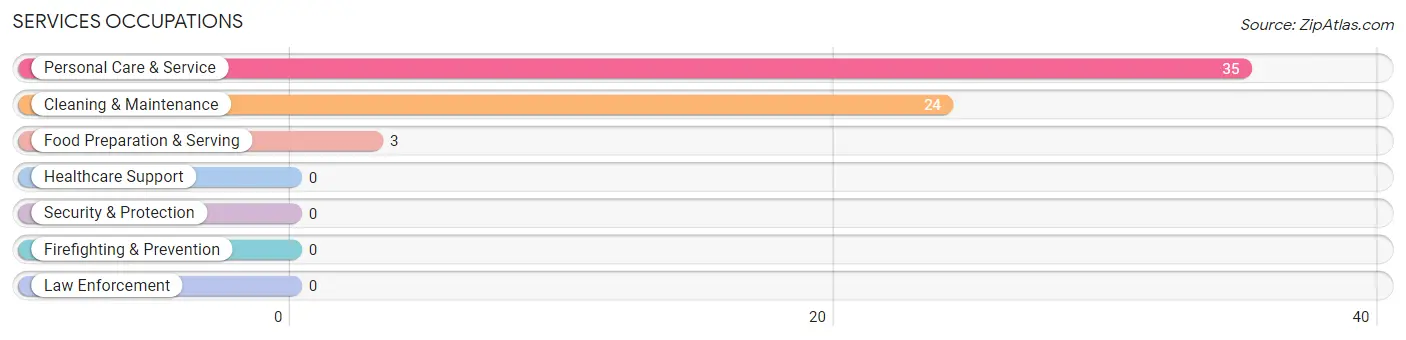
Services Occupations
The most common Services occupations in Lake Luzerne are Personal Care & Service (35 | 5.9%), Cleaning & Maintenance (24 | 4.1%), and Food Preparation & Serving (3 | 0.5%).
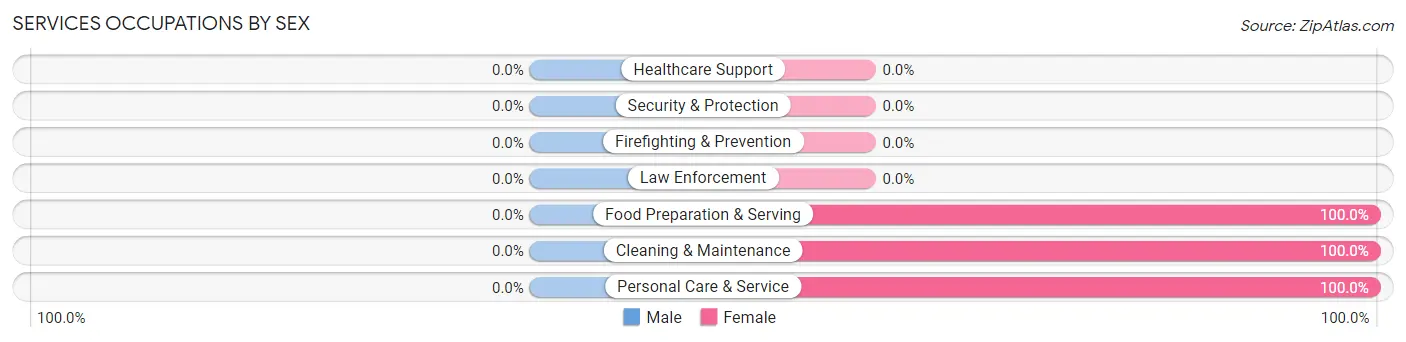
Services Occupations by Sex
| Occupation | Male | Female |
| Healthcare Support | 0 (0.0%) | 0 (0.0%) |
| Security & Protection | 0 (0.0%) | 0 (0.0%) |
| Firefighting & Prevention | 0 (0.0%) | 0 (0.0%) |
| Law Enforcement | 0 (0.0%) | 0 (0.0%) |
| Food Preparation & Serving | 0 (0.0%) | 3 (100.0%) |
| Cleaning & Maintenance | 0 (0.0%) | 24 (100.0%) |
| Personal Care & Service | 0 (0.0%) | 35 (100.0%) |
| Total (Category) | 0 (0.0%) | 62 (100.0%) |
| Total (Overall) | 264 (44.9%) | 324 (55.1%) |
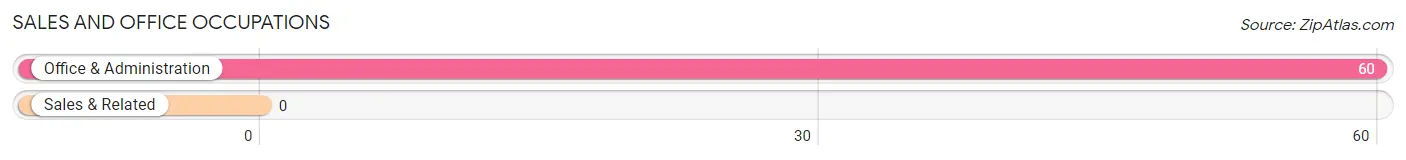
Sales and Office Occupations
The most common Sales and Office occupations in Lake Luzerne are , and Office & Administration (60 | 10.2%).
Sales and Office Occupations by Sex
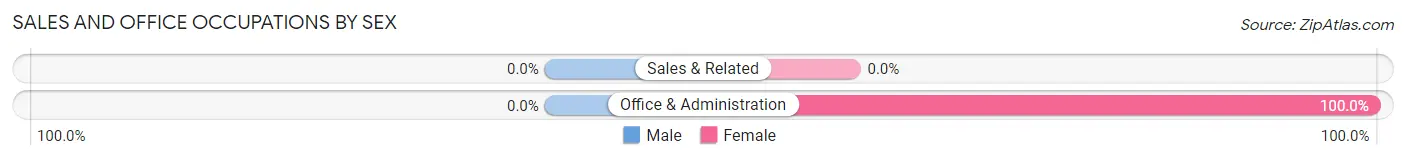
| Occupation | Male | Female |
| Sales & Related | 0 (0.0%) | 0 (0.0%) |
| Office & Administration | 0 (0.0%) | 60 (100.0%) |
| Total (Category) | 0 (0.0%) | 60 (100.0%) |
| Total (Overall) | 264 (44.9%) | 324 (55.1%) |
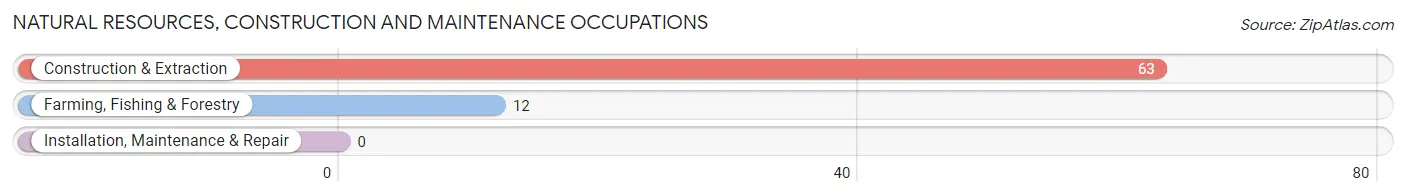
Natural Resources, Construction and Maintenance Occupations
The most common Natural Resources, Construction and Maintenance occupations in Lake Luzerne are Construction & Extraction (63 | 10.7%), and Farming, Fishing & Forestry (12 | 2.0%).
Natural Resources, Construction and Maintenance Occupations by Sex
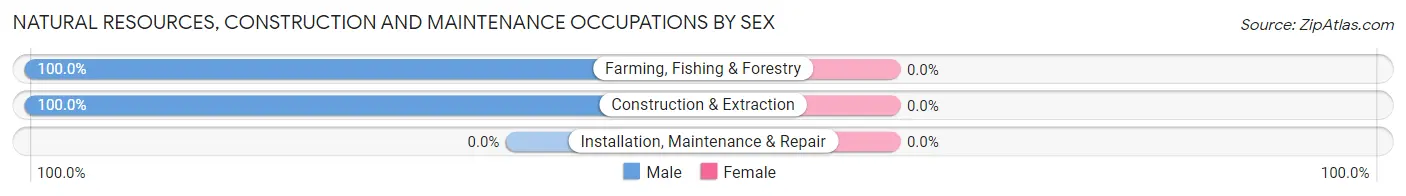
| Occupation | Male | Female |
| Farming, Fishing & Forestry | 12 (100.0%) | 0 (0.0%) |
| Construction & Extraction | 63 (100.0%) | 0 (0.0%) |
| Installation, Maintenance & Repair | 0 (0.0%) | 0 (0.0%) |
| Total (Category) | 75 (100.0%) | 0 (0.0%) |
| Total (Overall) | 264 (44.9%) | 324 (55.1%) |
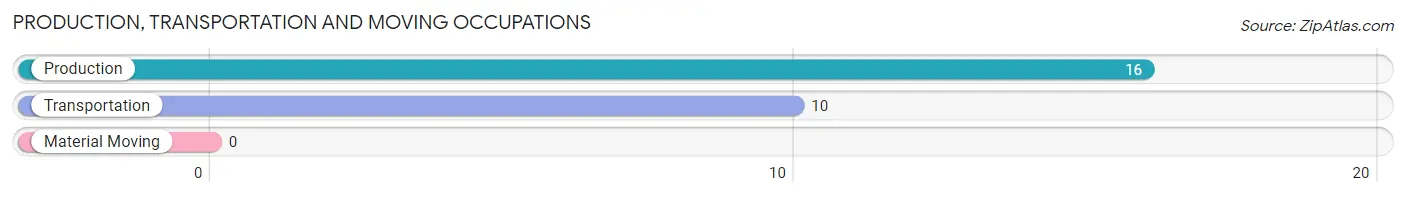
Production, Transportation and Moving Occupations
The most common Production, Transportation and Moving occupations in Lake Luzerne are Production (16 | 2.7%), and Transportation (10 | 1.7%).
Production, Transportation and Moving Occupations by Sex
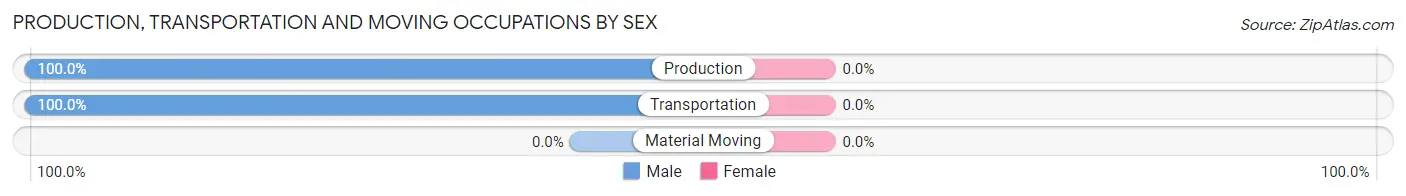
| Occupation | Male | Female |
| Production | 16 (100.0%) | 0 (0.0%) |
| Transportation | 10 (100.0%) | 0 (0.0%) |
| Material Moving | 0 (0.0%) | 0 (0.0%) |
| Total (Category) | 26 (100.0%) | 0 (0.0%) |
| Total (Overall) | 264 (44.9%) | 324 (55.1%) |
Employment Industries by Sex in Lake Luzerne
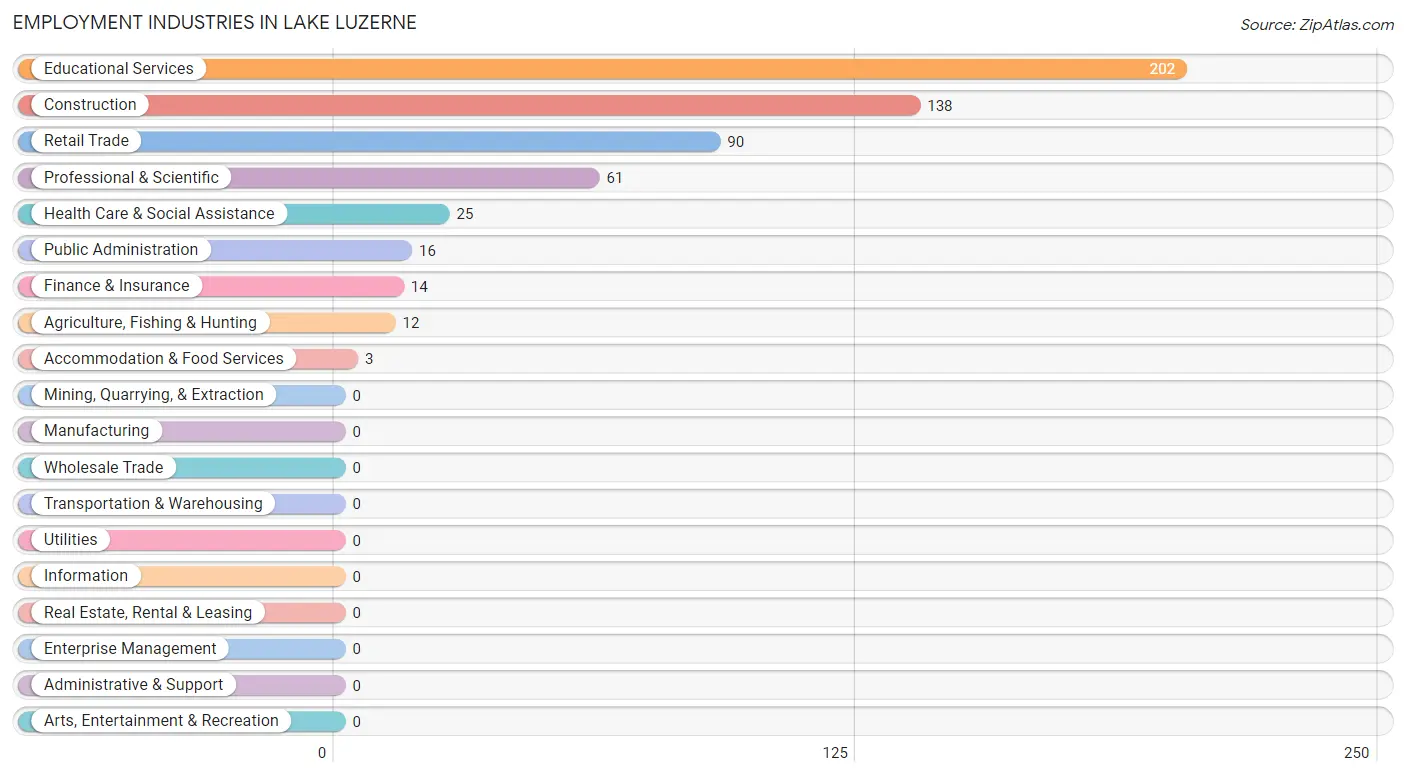
Employment Industries in Lake Luzerne
The major employment industries in Lake Luzerne include Educational Services (202 | 34.4%), Construction (138 | 23.5%), Retail Trade (90 | 15.3%), Professional & Scientific (61 | 10.4%), and Health Care & Social Assistance (25 | 4.3%).
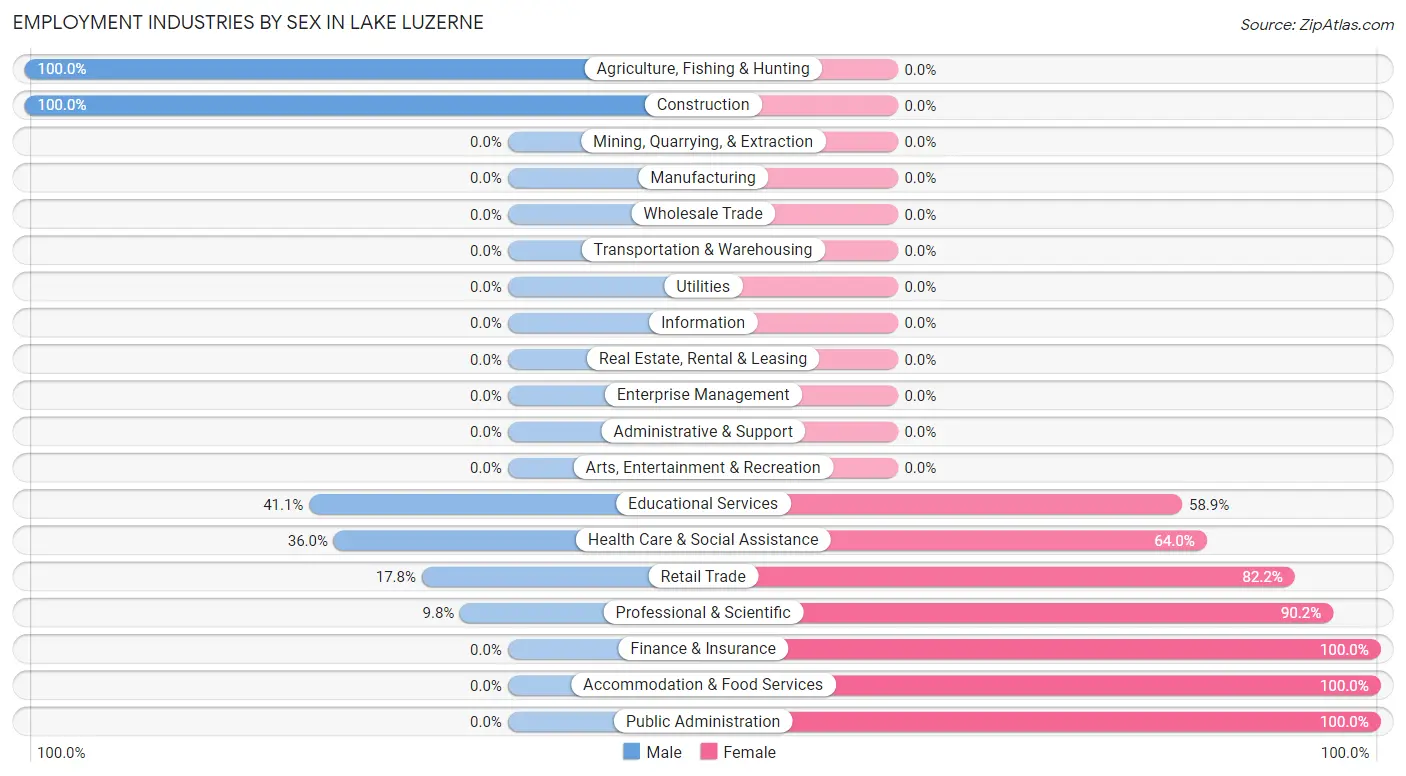
Employment Industries by Sex in Lake Luzerne
The Lake Luzerne industries that see more men than women are Agriculture, Fishing & Hunting (100.0%), Construction (100.0%), and Educational Services (41.1%), whereas the industries that tend to have a higher number of women are Finance & Insurance (100.0%), Accommodation & Food Services (100.0%), and Public Administration (100.0%).
| Industry | Male | Female |
| Agriculture, Fishing & Hunting | 12 (100.0%) | 0 (0.0%) |
| Mining, Quarrying, & Extraction | 0 (0.0%) | 0 (0.0%) |
| Construction | 138 (100.0%) | 0 (0.0%) |
| Manufacturing | 0 (0.0%) | 0 (0.0%) |
| Wholesale Trade | 0 (0.0%) | 0 (0.0%) |
| Retail Trade | 16 (17.8%) | 74 (82.2%) |
| Transportation & Warehousing | 0 (0.0%) | 0 (0.0%) |
| Utilities | 0 (0.0%) | 0 (0.0%) |
| Information | 0 (0.0%) | 0 (0.0%) |
| Finance & Insurance | 0 (0.0%) | 14 (100.0%) |
| Real Estate, Rental & Leasing | 0 (0.0%) | 0 (0.0%) |
| Professional & Scientific | 6 (9.8%) | 55 (90.2%) |
| Enterprise Management | 0 (0.0%) | 0 (0.0%) |
| Administrative & Support | 0 (0.0%) | 0 (0.0%) |
| Educational Services | 83 (41.1%) | 119 (58.9%) |
| Health Care & Social Assistance | 9 (36.0%) | 16 (64.0%) |
| Arts, Entertainment & Recreation | 0 (0.0%) | 0 (0.0%) |
| Accommodation & Food Services | 0 (0.0%) | 3 (100.0%) |
| Public Administration | 0 (0.0%) | 16 (100.0%) |
| Total | 264 (44.9%) | 324 (55.1%) |
Education in Lake Luzerne
School Enrollment in Lake Luzerne
The most common levels of schooling among the 188 students in Lake Luzerne are elementary school (73 | 38.8%), nursery / preschool (54 | 28.7%), and college / undergraduate (52 | 27.7%).
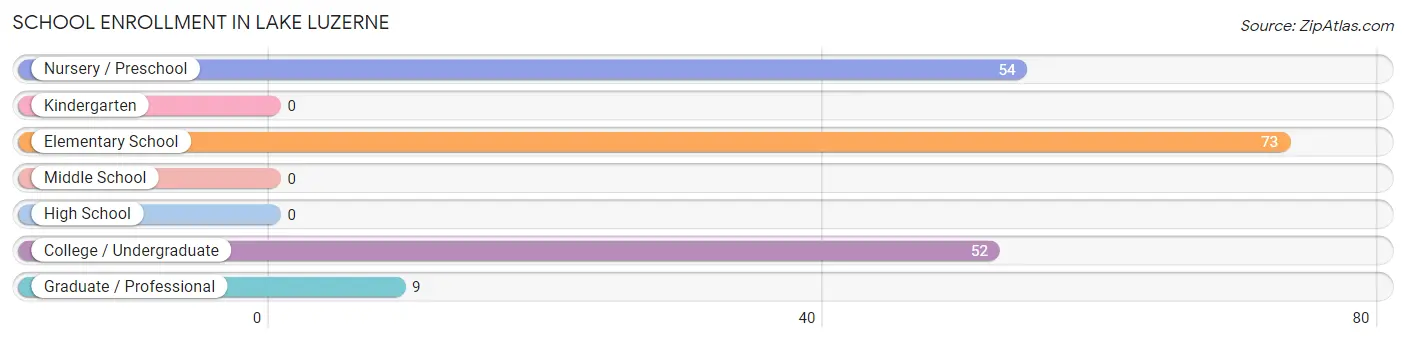
| School Level | # Students | % Students |
| Nursery / Preschool | 54 | 28.7% |
| Kindergarten | 0 | 0.0% |
| Elementary School | 73 | 38.8% |
| Middle School | 0 | 0.0% |
| High School | 0 | 0.0% |
| College / Undergraduate | 52 | 27.7% |
| Graduate / Professional | 9 | 4.8% |
| Total | 188 | 100.0% |
School Enrollment by Age by Funding Source in Lake Luzerne
Out of a total of 188 students who are enrolled in schools in Lake Luzerne, 13 (6.9%) attend a private institution, while the remaining 175 (93.1%) are enrolled in public schools. The age group of 35 years and over has the highest likelihood of being enrolled in private schools, with 13 (100.0% in the age bracket) enrolled. Conversely, the age group of 3 to 4 year olds has the lowest likelihood of being enrolled in a private school, with 54 (100.0% in the age bracket) attending a public institution.
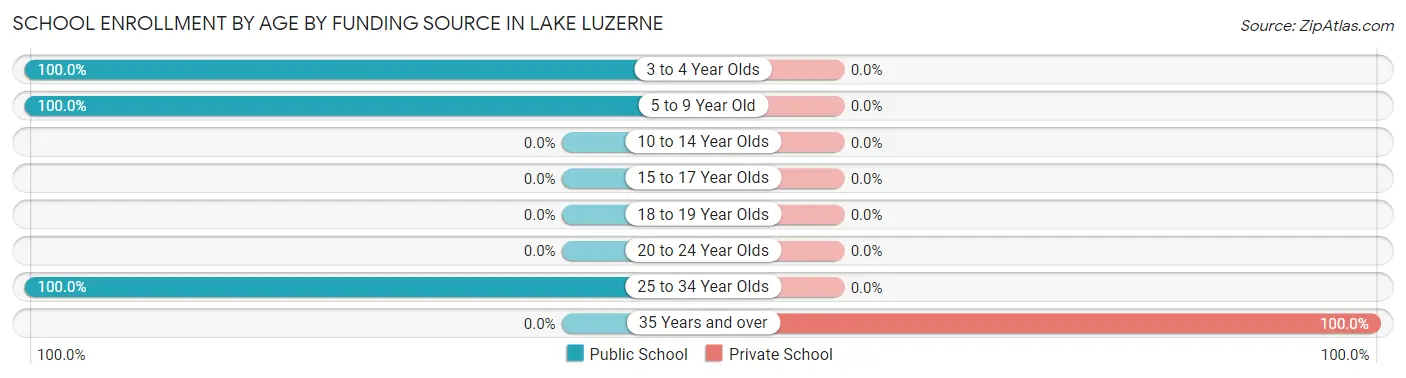
| Age Bracket | Public School | Private School |
| 3 to 4 Year Olds | 54 (100.0%) | 0 (0.0%) |
| 5 to 9 Year Old | 73 (100.0%) | 0 (0.0%) |
| 10 to 14 Year Olds | 0 (0.0%) | 0 (0.0%) |
| 15 to 17 Year Olds | 0 (0.0%) | 0 (0.0%) |
| 18 to 19 Year Olds | 0 (0.0%) | 0 (0.0%) |
| 20 to 24 Year Olds | 0 (0.0%) | 0 (0.0%) |
| 25 to 34 Year Olds | 48 (100.0%) | 0 (0.0%) |
| 35 Years and over | 0 (0.0%) | 13 (100.0%) |
| Total | 175 (93.1%) | 13 (6.9%) |
Educational Attainment by Field of Study in Lake Luzerne
Education (127 | 29.3%), liberal arts & history (97 | 22.4%), science & technology (81 | 18.7%), social sciences (53 | 12.2%), and visual & performing arts (37 | 8.5%) are the most common fields of study among 434 individuals in Lake Luzerne who have obtained a bachelor's degree or higher.
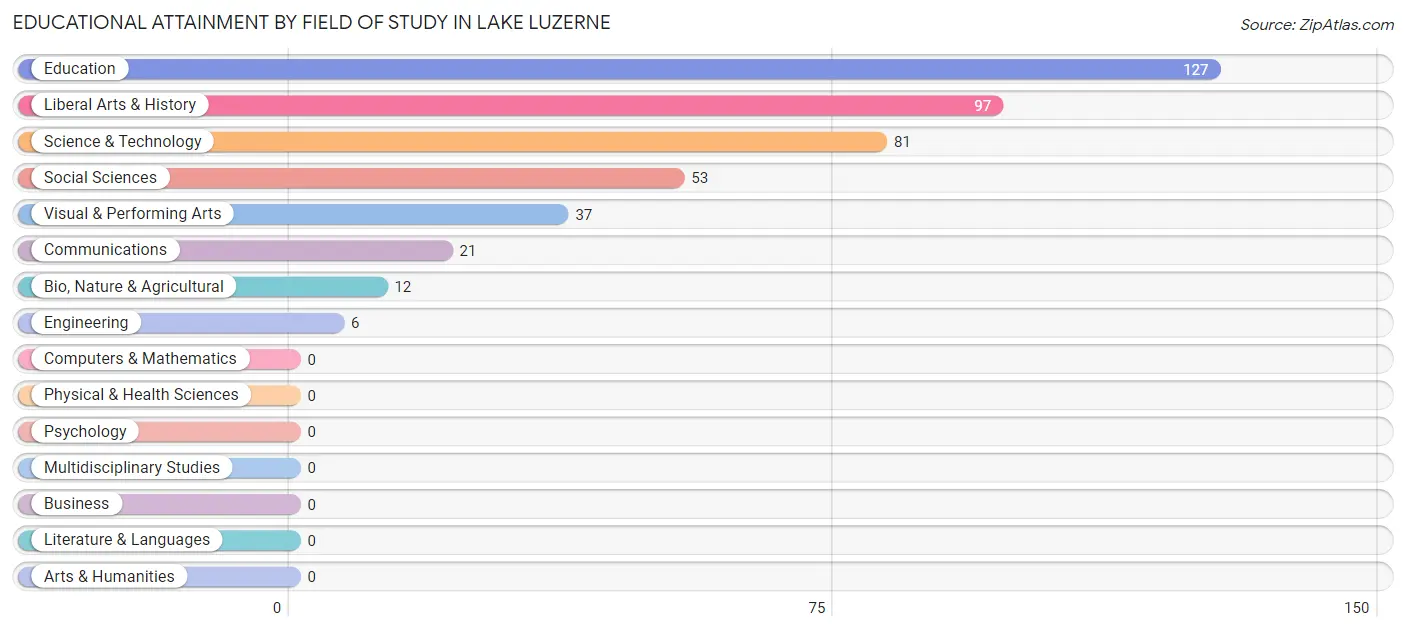
| Field of Study | # Graduates | % Graduates |
| Computers & Mathematics | 0 | 0.0% |
| Bio, Nature & Agricultural | 12 | 2.8% |
| Physical & Health Sciences | 0 | 0.0% |
| Psychology | 0 | 0.0% |
| Social Sciences | 53 | 12.2% |
| Engineering | 6 | 1.4% |
| Multidisciplinary Studies | 0 | 0.0% |
| Science & Technology | 81 | 18.7% |
| Business | 0 | 0.0% |
| Education | 127 | 29.3% |
| Literature & Languages | 0 | 0.0% |
| Liberal Arts & History | 97 | 22.4% |
| Visual & Performing Arts | 37 | 8.5% |
| Communications | 21 | 4.8% |
| Arts & Humanities | 0 | 0.0% |
| Total | 434 | 100.0% |
Transportation & Commute in Lake Luzerne
Vehicle Availability by Sex in Lake Luzerne
The most prevalent vehicle ownership categories in Lake Luzerne are males with 2 vehicles (128, accounting for 48.5%) and females with 2 vehicles (107, making up 39.5%).
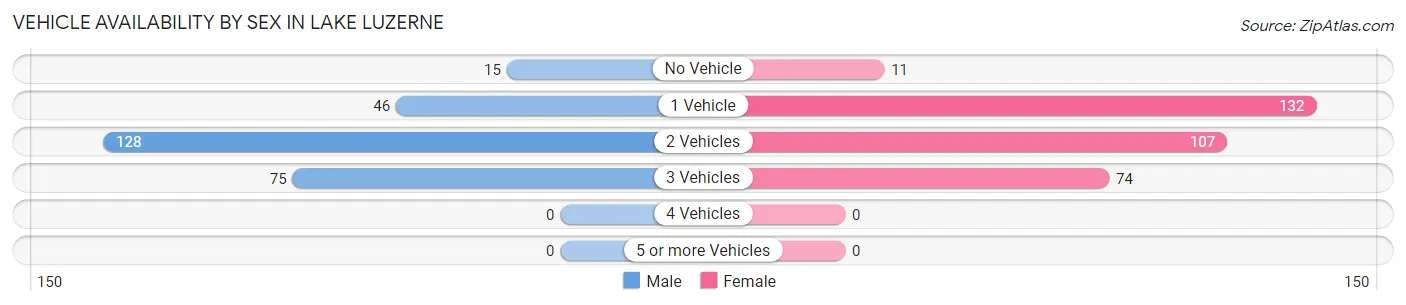
| Vehicles Available | Male | Female |
| No Vehicle | 15 (5.7%) | 11 (3.4%) |
| 1 Vehicle | 46 (17.4%) | 132 (40.7%) |
| 2 Vehicles | 128 (48.5%) | 107 (33.0%) |
| 3 Vehicles | 75 (28.4%) | 74 (22.8%) |
| 4 Vehicles | 0 (0.0%) | 0 (0.0%) |
| 5 or more Vehicles | 0 (0.0%) | 0 (0.0%) |
| Total | 264 (100.0%) | 324 (100.0%) |
Commute Time in Lake Luzerne
The most frequently occuring commute durations in Lake Luzerne are less than 5 minutes (197 commuters, 33.9%), 30 to 34 minutes (176 commuters, 30.2%), and 25 to 29 minutes (62 commuters, 10.6%).
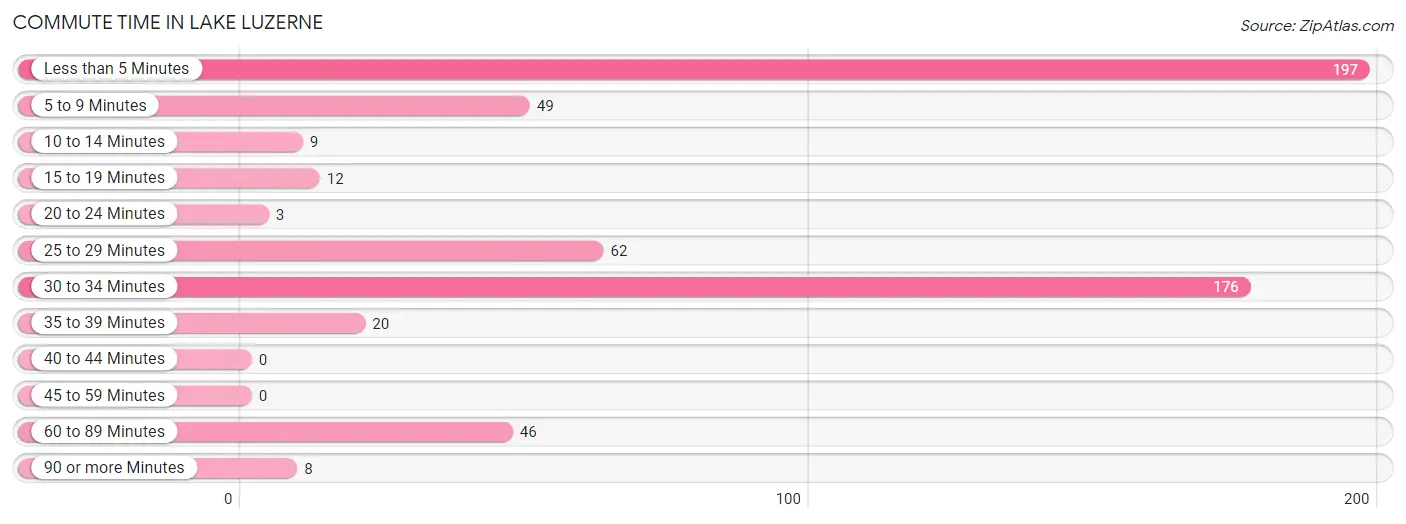
| Commute Time | # Commuters | % Commuters |
| Less than 5 Minutes | 197 | 33.9% |
| 5 to 9 Minutes | 49 | 8.4% |
| 10 to 14 Minutes | 9 | 1.5% |
| 15 to 19 Minutes | 12 | 2.1% |
| 20 to 24 Minutes | 3 | 0.5% |
| 25 to 29 Minutes | 62 | 10.6% |
| 30 to 34 Minutes | 176 | 30.2% |
| 35 to 39 Minutes | 20 | 3.4% |
| 40 to 44 Minutes | 0 | 0.0% |
| 45 to 59 Minutes | 0 | 0.0% |
| 60 to 89 Minutes | 46 | 7.9% |
| 90 or more Minutes | 8 | 1.4% |
Commute Time by Sex in Lake Luzerne
The most common commute times in Lake Luzerne are less than 5 minutes (120 commuters, 46.5%) for males and 30 to 34 minutes (101 commuters, 31.2%) for females.
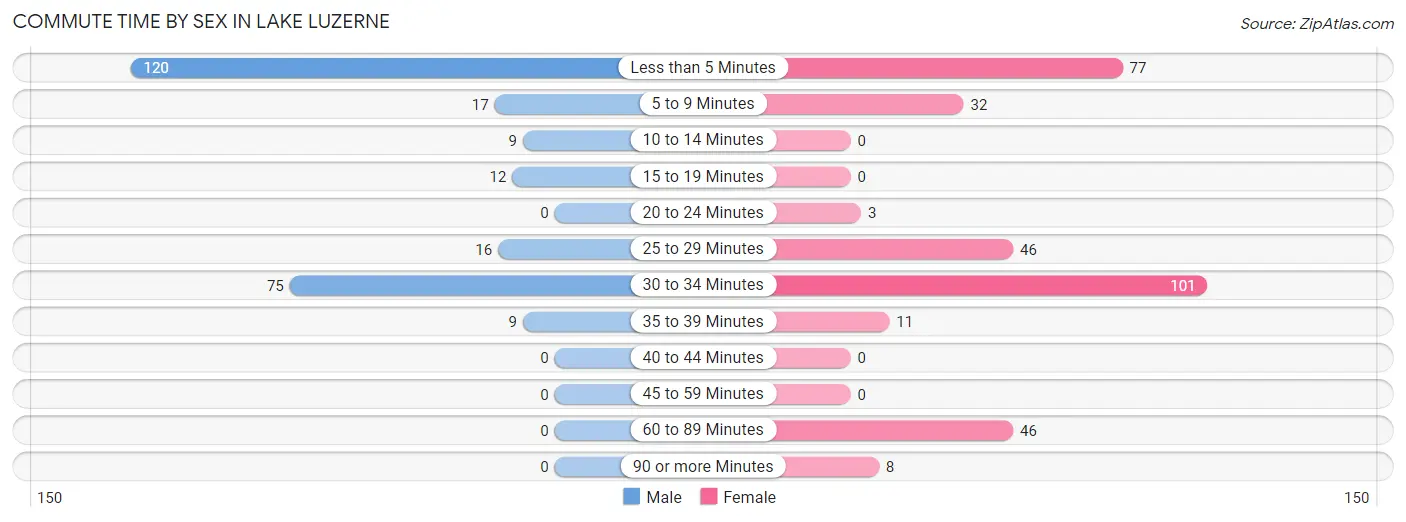
| Commute Time | Male | Female |
| Less than 5 Minutes | 120 (46.5%) | 77 (23.8%) |
| 5 to 9 Minutes | 17 (6.6%) | 32 (9.9%) |
| 10 to 14 Minutes | 9 (3.5%) | 0 (0.0%) |
| 15 to 19 Minutes | 12 (4.6%) | 0 (0.0%) |
| 20 to 24 Minutes | 0 (0.0%) | 3 (0.9%) |
| 25 to 29 Minutes | 16 (6.2%) | 46 (14.2%) |
| 30 to 34 Minutes | 75 (29.1%) | 101 (31.2%) |
| 35 to 39 Minutes | 9 (3.5%) | 11 (3.4%) |
| 40 to 44 Minutes | 0 (0.0%) | 0 (0.0%) |
| 45 to 59 Minutes | 0 (0.0%) | 0 (0.0%) |
| 60 to 89 Minutes | 0 (0.0%) | 46 (14.2%) |
| 90 or more Minutes | 0 (0.0%) | 8 (2.5%) |
Time of Departure to Work by Sex in Lake Luzerne
The most frequent times of departure to work in Lake Luzerne are 6:00 AM to 6:29 AM (82, 31.8%) for males and 8:00 AM to 8:29 AM (82, 25.3%) for females.
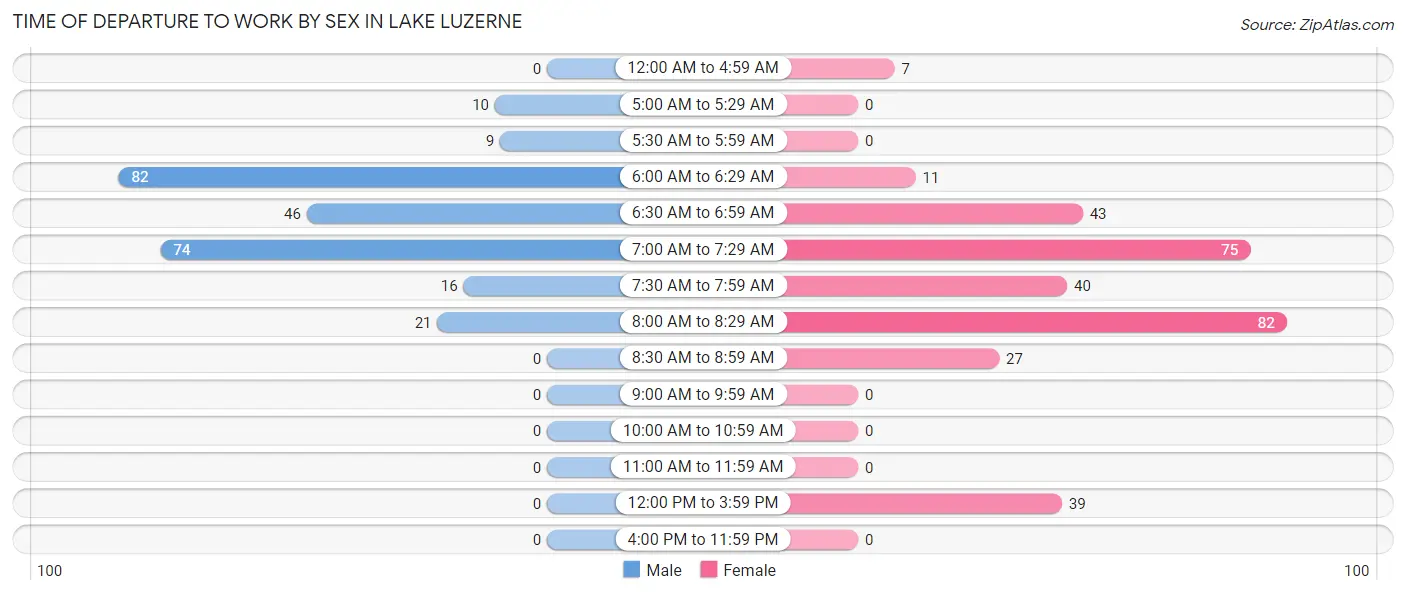
| Time of Departure | Male | Female |
| 12:00 AM to 4:59 AM | 0 (0.0%) | 7 (2.2%) |
| 5:00 AM to 5:29 AM | 10 (3.9%) | 0 (0.0%) |
| 5:30 AM to 5:59 AM | 9 (3.5%) | 0 (0.0%) |
| 6:00 AM to 6:29 AM | 82 (31.8%) | 11 (3.4%) |
| 6:30 AM to 6:59 AM | 46 (17.8%) | 43 (13.3%) |
| 7:00 AM to 7:29 AM | 74 (28.7%) | 75 (23.2%) |
| 7:30 AM to 7:59 AM | 16 (6.2%) | 40 (12.3%) |
| 8:00 AM to 8:29 AM | 21 (8.1%) | 82 (25.3%) |
| 8:30 AM to 8:59 AM | 0 (0.0%) | 27 (8.3%) |
| 9:00 AM to 9:59 AM | 0 (0.0%) | 0 (0.0%) |
| 10:00 AM to 10:59 AM | 0 (0.0%) | 0 (0.0%) |
| 11:00 AM to 11:59 AM | 0 (0.0%) | 0 (0.0%) |
| 12:00 PM to 3:59 PM | 0 (0.0%) | 39 (12.0%) |
| 4:00 PM to 11:59 PM | 0 (0.0%) | 0 (0.0%) |
| Total | 258 (100.0%) | 324 (100.0%) |
Housing Occupancy in Lake Luzerne
Occupancy by Ownership in Lake Luzerne
Of the total 721 dwellings in Lake Luzerne, owner-occupied units account for 641 (88.9%), while renter-occupied units make up 80 (11.1%).
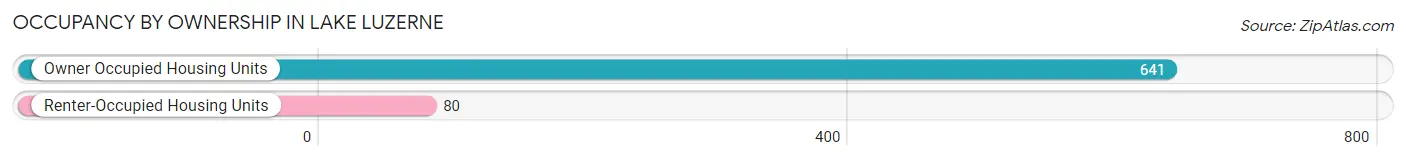
| Occupancy | # Housing Units | % Housing Units |
| Owner Occupied Housing Units | 641 | 88.9% |
| Renter-Occupied Housing Units | 80 | 11.1% |
| Total Occupied Housing Units | 721 | 100.0% |
Occupancy by Household Size in Lake Luzerne
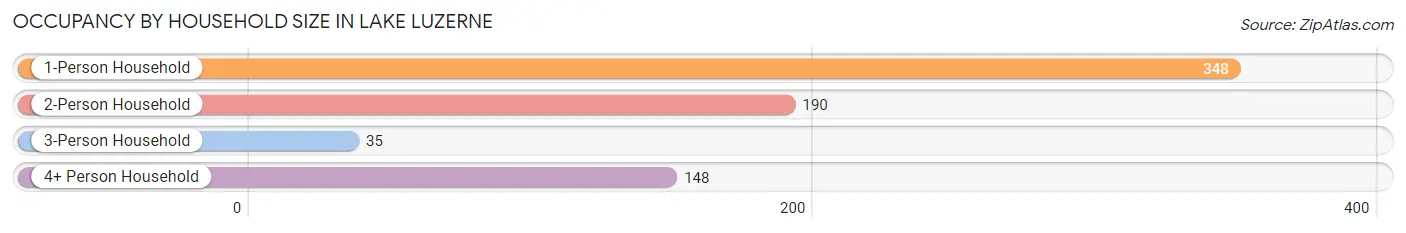
| Household Size | # Housing Units | % Housing Units |
| 1-Person Household | 348 | 48.3% |
| 2-Person Household | 190 | 26.4% |
| 3-Person Household | 35 | 4.9% |
| 4+ Person Household | 148 | 20.5% |
| Total Housing Units | 721 | 100.0% |
Occupancy by Ownership by Household Size in Lake Luzerne
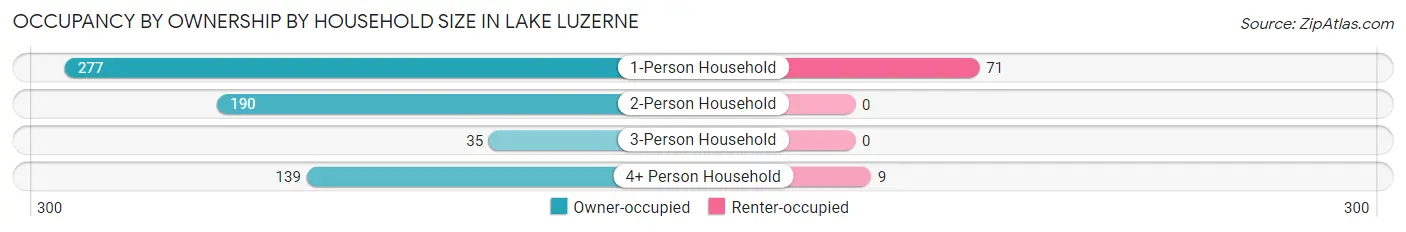
| Household Size | Owner-occupied | Renter-occupied |
| 1-Person Household | 277 (79.6%) | 71 (20.4%) |
| 2-Person Household | 190 (100.0%) | 0 (0.0%) |
| 3-Person Household | 35 (100.0%) | 0 (0.0%) |
| 4+ Person Household | 139 (93.9%) | 9 (6.1%) |
| Total Housing Units | 641 (88.9%) | 80 (11.1%) |
Occupancy by Educational Attainment in Lake Luzerne
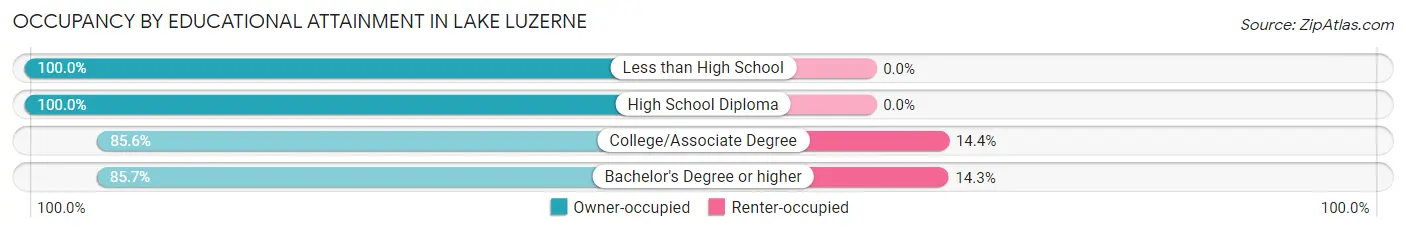
| Household Size | Owner-occupied | Renter-occupied |
| Less than High School | 43 (100.0%) | 0 (0.0%) |
| High School Diploma | 122 (100.0%) | 0 (0.0%) |
| College/Associate Degree | 231 (85.6%) | 39 (14.4%) |
| Bachelor's Degree or higher | 245 (85.7%) | 41 (14.3%) |
Occupancy by Age of Householder in Lake Luzerne
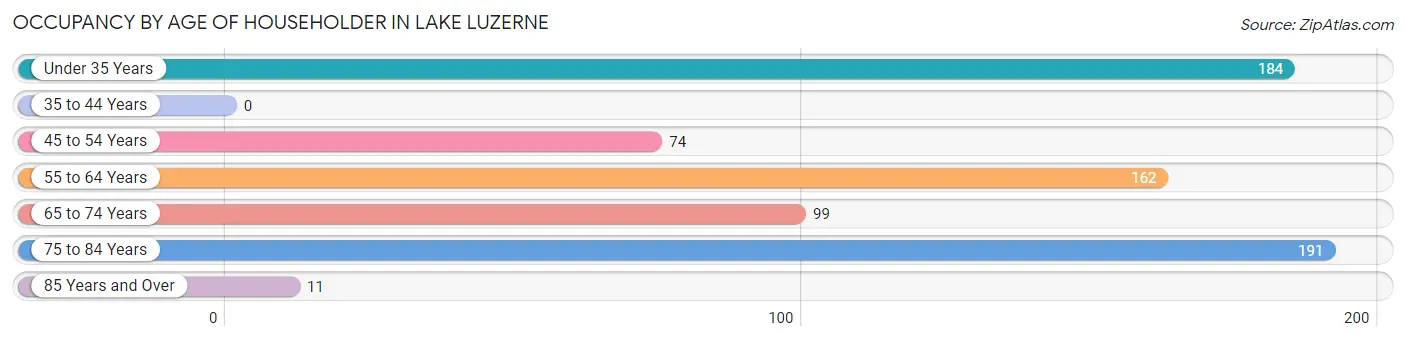
| Age Bracket | # Households | % Households |
| Under 35 Years | 184 | 25.5% |
| 35 to 44 Years | 0 | 0.0% |
| 45 to 54 Years | 74 | 10.3% |
| 55 to 64 Years | 162 | 22.5% |
| 65 to 74 Years | 99 | 13.7% |
| 75 to 84 Years | 191 | 26.5% |
| 85 Years and Over | 11 | 1.5% |
| Total | 721 | 100.0% |
Housing Finances in Lake Luzerne
Median Income by Occupancy in Lake Luzerne
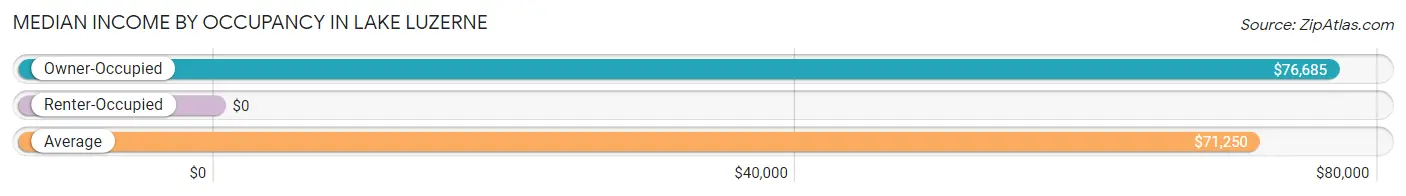
| Occupancy Type | # Households | Median Income |
| Owner-Occupied | 641 (88.9%) | $76,685 |
| Renter-Occupied | 80 (11.1%) | $0 |
| Average | 721 (100.0%) | $71,250 |
Occupancy by Householder Income Bracket in Lake Luzerne
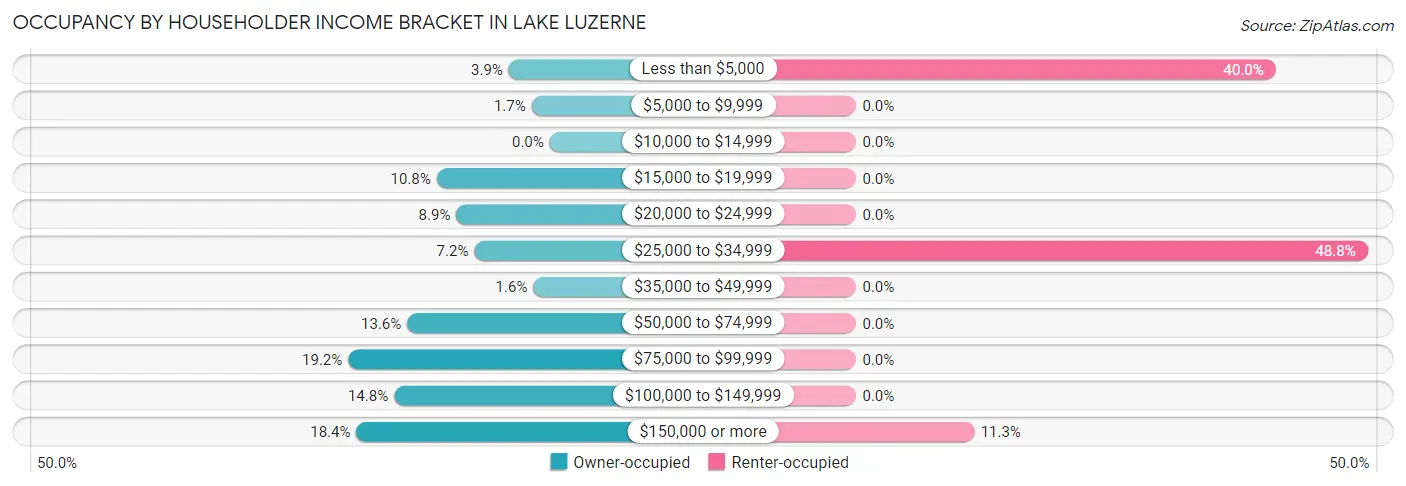
| Income Bracket | Owner-occupied | Renter-occupied |
| Less than $5,000 | 25 (3.9%) | 32 (40.0%) |
| $5,000 to $9,999 | 11 (1.7%) | 0 (0.0%) |
| $10,000 to $14,999 | 0 (0.0%) | 0 (0.0%) |
| $15,000 to $19,999 | 69 (10.8%) | 0 (0.0%) |
| $20,000 to $24,999 | 57 (8.9%) | 0 (0.0%) |
| $25,000 to $34,999 | 46 (7.2%) | 39 (48.7%) |
| $35,000 to $49,999 | 10 (1.6%) | 0 (0.0%) |
| $50,000 to $74,999 | 87 (13.6%) | 0 (0.0%) |
| $75,000 to $99,999 | 123 (19.2%) | 0 (0.0%) |
| $100,000 to $149,999 | 95 (14.8%) | 0 (0.0%) |
| $150,000 or more | 118 (18.4%) | 9 (11.3%) |
| Total | 641 (100.0%) | 80 (100.0%) |
Monthly Housing Cost Tiers in Lake Luzerne
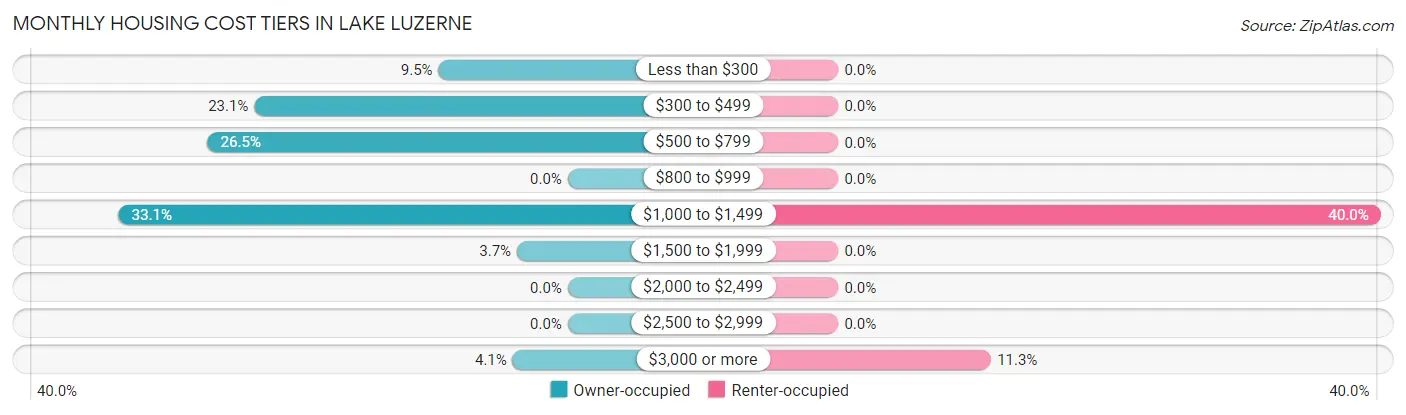
| Monthly Cost | Owner-occupied | Renter-occupied |
| Less than $300 | 61 (9.5%) | 0 (0.0%) |
| $300 to $499 | 148 (23.1%) | 0 (0.0%) |
| $500 to $799 | 170 (26.5%) | 0 (0.0%) |
| $800 to $999 | 0 (0.0%) | 0 (0.0%) |
| $1,000 to $1,499 | 212 (33.1%) | 32 (40.0%) |
| $1,500 to $1,999 | 24 (3.7%) | 0 (0.0%) |
| $2,000 to $2,499 | 0 (0.0%) | 0 (0.0%) |
| $2,500 to $2,999 | 0 (0.0%) | 0 (0.0%) |
| $3,000 or more | 26 (4.1%) | 9 (11.3%) |
| Total | 641 (100.0%) | 80 (100.0%) |
Physical Housing Characteristics in Lake Luzerne
Housing Structures in Lake Luzerne
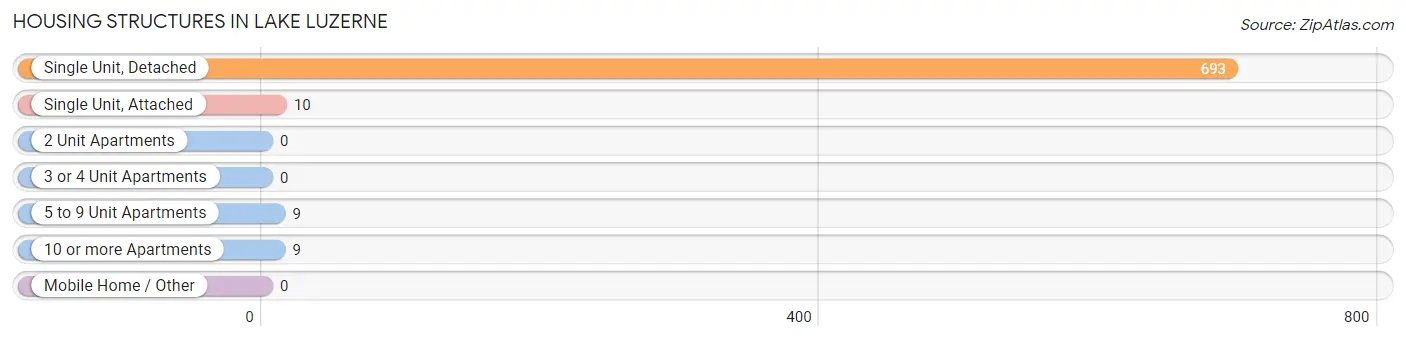
| Structure Type | # Housing Units | % Housing Units |
| Single Unit, Detached | 693 | 96.1% |
| Single Unit, Attached | 10 | 1.4% |
| 2 Unit Apartments | 0 | 0.0% |
| 3 or 4 Unit Apartments | 0 | 0.0% |
| 5 to 9 Unit Apartments | 9 | 1.3% |
| 10 or more Apartments | 9 | 1.3% |
| Mobile Home / Other | 0 | 0.0% |
| Total | 721 | 100.0% |
Housing Structures by Occupancy in Lake Luzerne
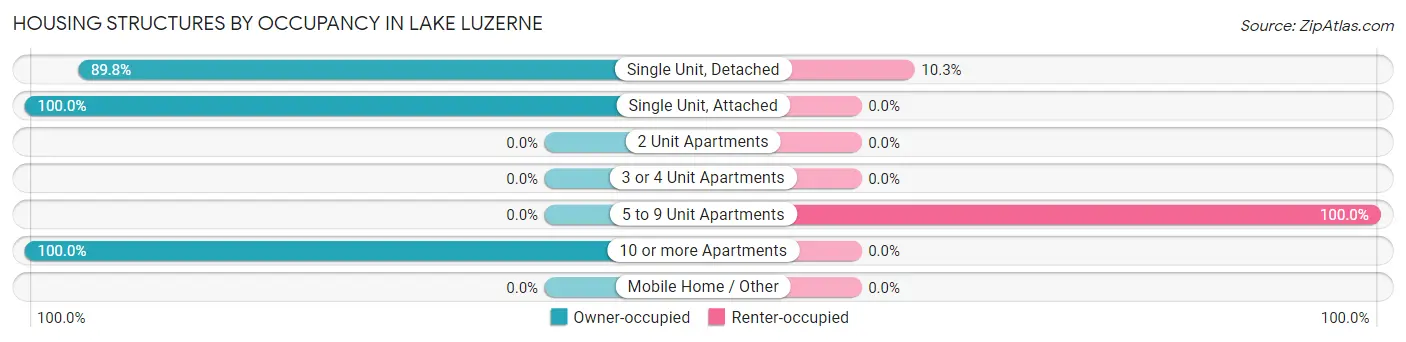
| Structure Type | Owner-occupied | Renter-occupied |
| Single Unit, Detached | 622 (89.7%) | 71 (10.2%) |
| Single Unit, Attached | 10 (100.0%) | 0 (0.0%) |
| 2 Unit Apartments | 0 (0.0%) | 0 (0.0%) |
| 3 or 4 Unit Apartments | 0 (0.0%) | 0 (0.0%) |
| 5 to 9 Unit Apartments | 0 (0.0%) | 9 (100.0%) |
| 10 or more Apartments | 9 (100.0%) | 0 (0.0%) |
| Mobile Home / Other | 0 (0.0%) | 0 (0.0%) |
| Total | 641 (88.9%) | 80 (11.1%) |
Housing Structures by Number of Rooms in Lake Luzerne
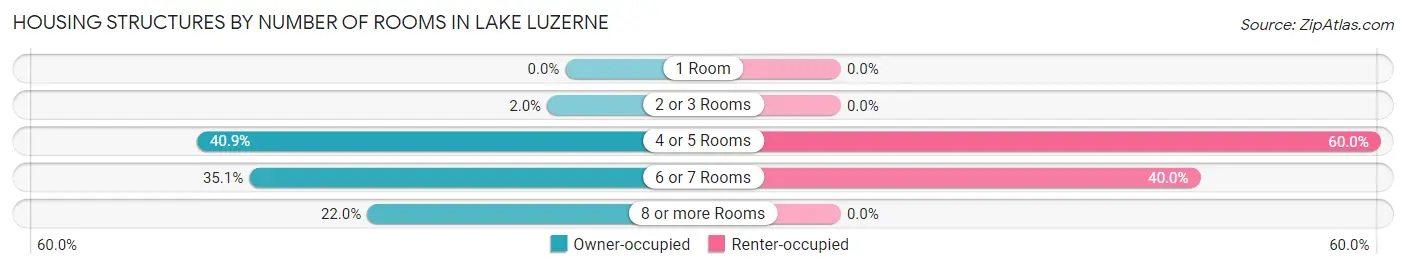
| Number of Rooms | Owner-occupied | Renter-occupied |
| 1 Room | 0 (0.0%) | 0 (0.0%) |
| 2 or 3 Rooms | 13 (2.0%) | 0 (0.0%) |
| 4 or 5 Rooms | 262 (40.9%) | 48 (60.0%) |
| 6 or 7 Rooms | 225 (35.1%) | 32 (40.0%) |
| 8 or more Rooms | 141 (22.0%) | 0 (0.0%) |
| Total | 641 (100.0%) | 80 (100.0%) |
Housing Structure by Heating Type in Lake Luzerne
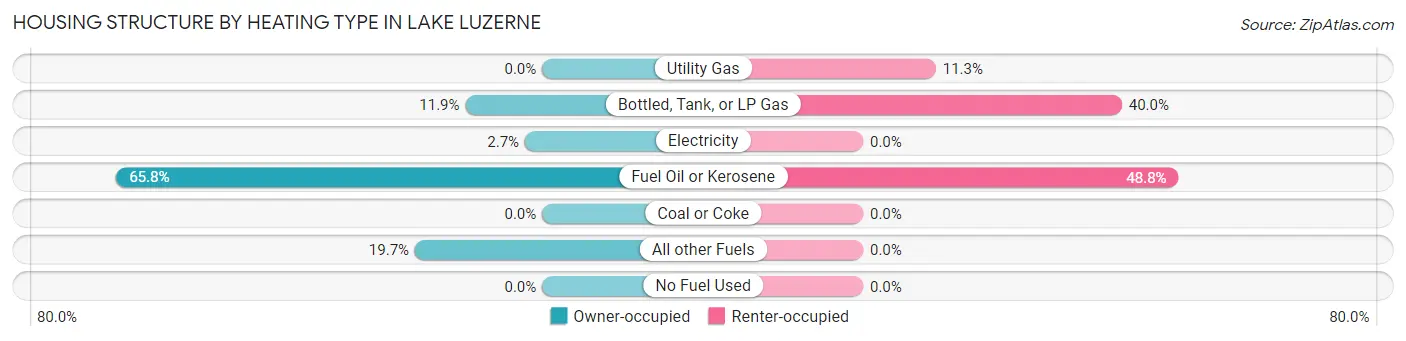
| Heating Type | Owner-occupied | Renter-occupied |
| Utility Gas | 0 (0.0%) | 9 (11.3%) |
| Bottled, Tank, or LP Gas | 76 (11.9%) | 32 (40.0%) |
| Electricity | 17 (2.6%) | 0 (0.0%) |
| Fuel Oil or Kerosene | 422 (65.8%) | 39 (48.7%) |
| Coal or Coke | 0 (0.0%) | 0 (0.0%) |
| All other Fuels | 126 (19.7%) | 0 (0.0%) |
| No Fuel Used | 0 (0.0%) | 0 (0.0%) |
| Total | 641 (100.0%) | 80 (100.0%) |
Household Vehicle Usage in Lake Luzerne
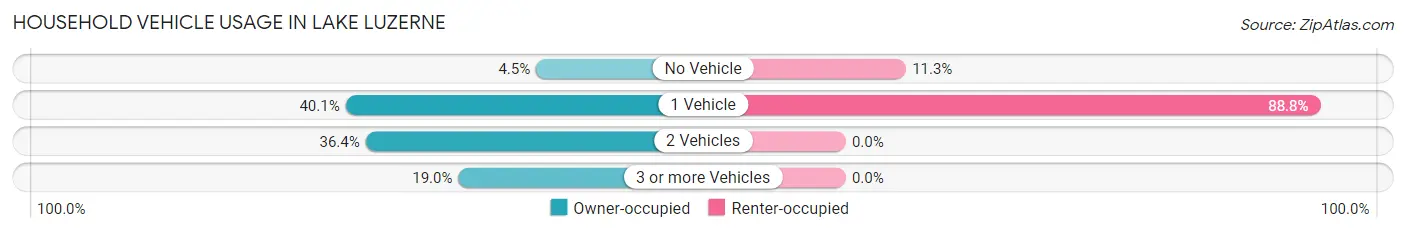
| Vehicles per Household | Owner-occupied | Renter-occupied |
| No Vehicle | 29 (4.5%) | 9 (11.3%) |
| 1 Vehicle | 257 (40.1%) | 71 (88.7%) |
| 2 Vehicles | 233 (36.3%) | 0 (0.0%) |
| 3 or more Vehicles | 122 (19.0%) | 0 (0.0%) |
| Total | 641 (100.0%) | 80 (100.0%) |
Real Estate & Mortgages in Lake Luzerne
Real Estate and Mortgage Overview in Lake Luzerne
| Characteristic | Without Mortgage | With Mortgage |
| Housing Units | 363 | 278 |
| Median Property Value | $193,400 | $216,900 |
| Median Household Income | - | - |
| Monthly Housing Costs | $499 | $26 |
| Real Estate Taxes | $3,396 | $27 |
Property Value by Mortgage Status in Lake Luzerne
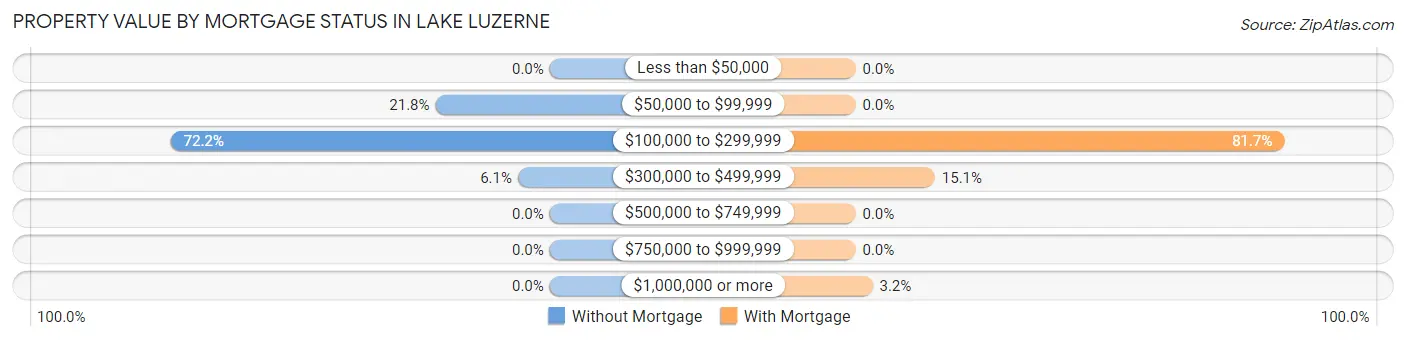
| Property Value | Without Mortgage | With Mortgage |
| Less than $50,000 | 0 (0.0%) | 0 (0.0%) |
| $50,000 to $99,999 | 79 (21.8%) | 0 (0.0%) |
| $100,000 to $299,999 | 262 (72.2%) | 227 (81.7%) |
| $300,000 to $499,999 | 22 (6.1%) | 42 (15.1%) |
| $500,000 to $749,999 | 0 (0.0%) | 0 (0.0%) |
| $750,000 to $999,999 | 0 (0.0%) | 0 (0.0%) |
| $1,000,000 or more | 0 (0.0%) | 9 (3.2%) |
| Total | 363 (100.0%) | 278 (100.0%) |
Household Income by Mortgage Status in Lake Luzerne
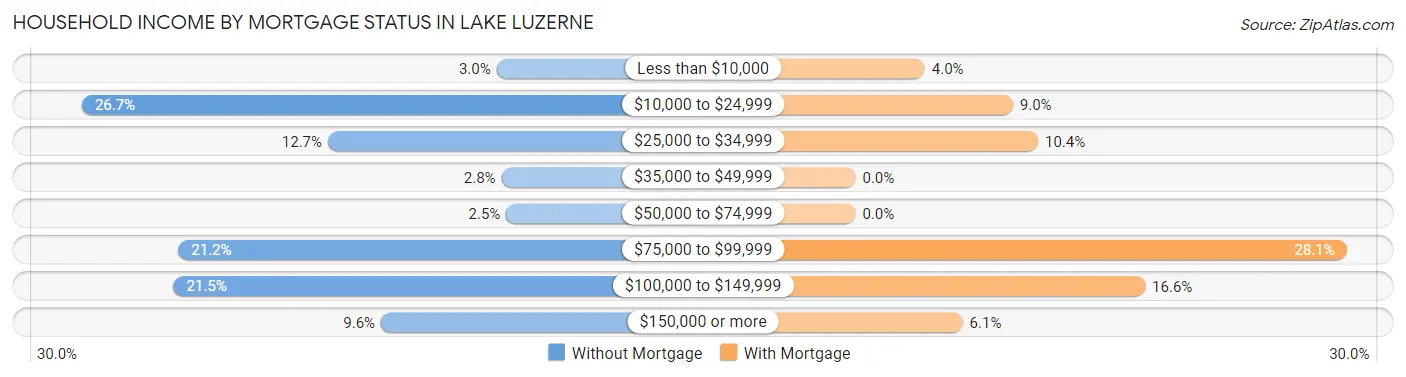
| Household Income | Without Mortgage | With Mortgage |
| Less than $10,000 | 11 (3.0%) | 11 (4.0%) |
| $10,000 to $24,999 | 97 (26.7%) | 25 (9.0%) |
| $25,000 to $34,999 | 46 (12.7%) | 29 (10.4%) |
| $35,000 to $49,999 | 10 (2.8%) | 0 (0.0%) |
| $50,000 to $74,999 | 9 (2.5%) | 0 (0.0%) |
| $75,000 to $99,999 | 77 (21.2%) | 78 (28.1%) |
| $100,000 to $149,999 | 78 (21.5%) | 46 (16.6%) |
| $150,000 or more | 35 (9.6%) | 17 (6.1%) |
| Total | 363 (100.0%) | 278 (100.0%) |
Property Value to Household Income Ratio in Lake Luzerne
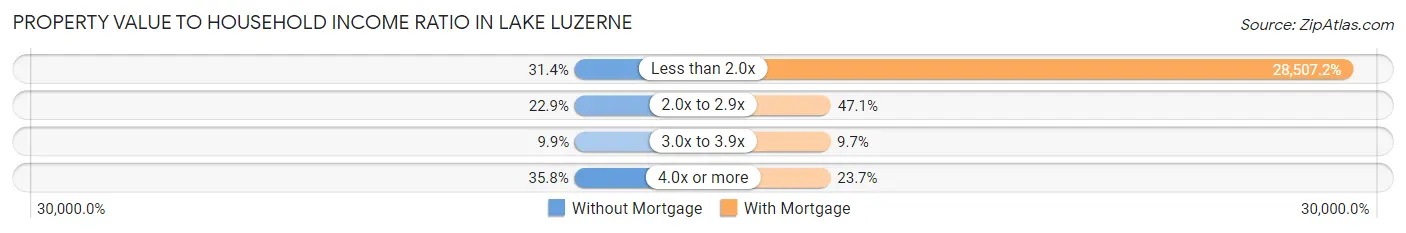
| Value-to-Income Ratio | Without Mortgage | With Mortgage |
| Less than 2.0x | 114 (31.4%) | 79,250 (28,507.2%) |
| 2.0x to 2.9x | 83 (22.9%) | 131 (47.1%) |
| 3.0x to 3.9x | 36 (9.9%) | 27 (9.7%) |
| 4.0x or more | 130 (35.8%) | 66 (23.7%) |
| Total | 363 (100.0%) | 278 (100.0%) |
Real Estate Taxes by Mortgage Status in Lake Luzerne
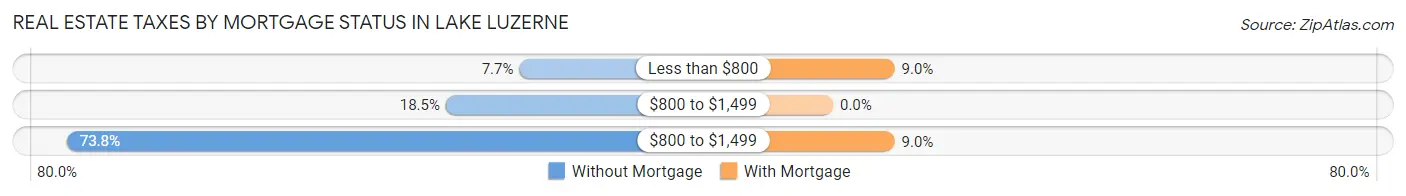
| Property Taxes | Without Mortgage | With Mortgage |
| Less than $800 | 28 (7.7%) | 25 (9.0%) |
| $800 to $1,499 | 67 (18.5%) | 0 (0.0%) |
| $800 to $1,499 | 268 (73.8%) | 25 (9.0%) |
| Total | 363 (100.0%) | 278 (100.0%) |
Health & Disability in Lake Luzerne
Health Insurance Coverage by Age in Lake Luzerne
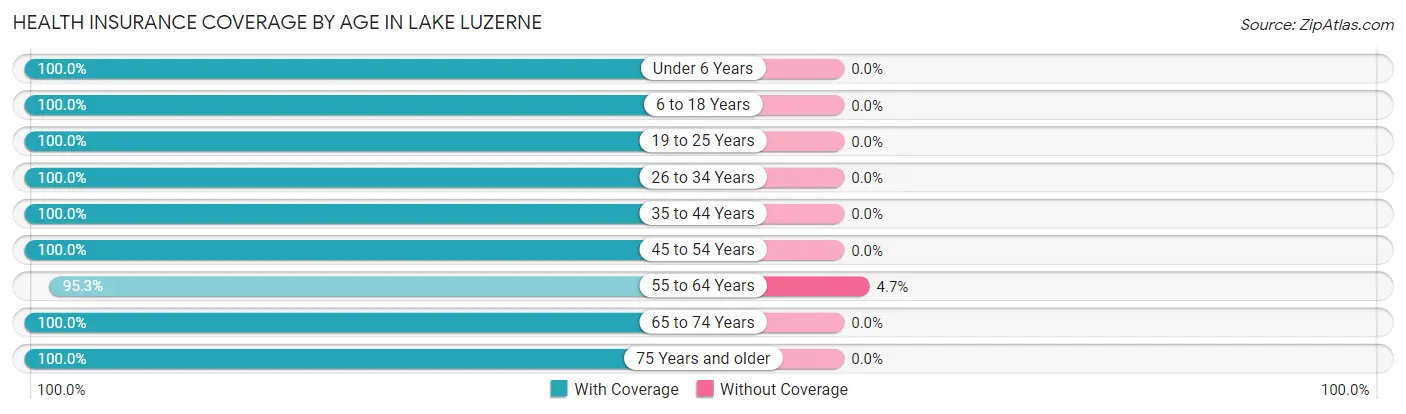
| Age Bracket | With Coverage | Without Coverage |
| Under 6 Years | 54 (100.0%) | 0 (0.0%) |
| 6 to 18 Years | 197 (100.0%) | 0 (0.0%) |
| 19 to 25 Years | 42 (100.0%) | 0 (0.0%) |
| 26 to 34 Years | 215 (100.0%) | 0 (0.0%) |
| 35 to 44 Years | 121 (100.0%) | 0 (0.0%) |
| 45 to 54 Years | 97 (100.0%) | 0 (0.0%) |
| 55 to 64 Years | 202 (95.3%) | 10 (4.7%) |
| 65 to 74 Years | 151 (100.0%) | 0 (0.0%) |
| 75 Years and older | 265 (100.0%) | 0 (0.0%) |
| Total | 1,344 (99.3%) | 10 (0.7%) |
Health Insurance Coverage by Citizenship Status in Lake Luzerne
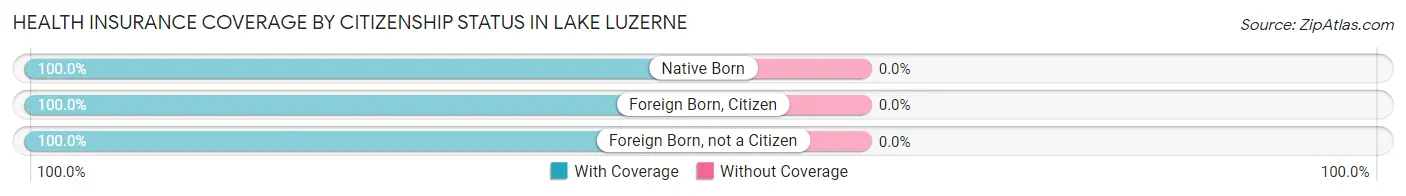
| Citizenship Status | With Coverage | Without Coverage |
| Native Born | 54 (100.0%) | 0 (0.0%) |
| Foreign Born, Citizen | 197 (100.0%) | 0 (0.0%) |
| Foreign Born, not a Citizen | 42 (100.0%) | 0 (0.0%) |
Health Insurance Coverage by Household Income in Lake Luzerne
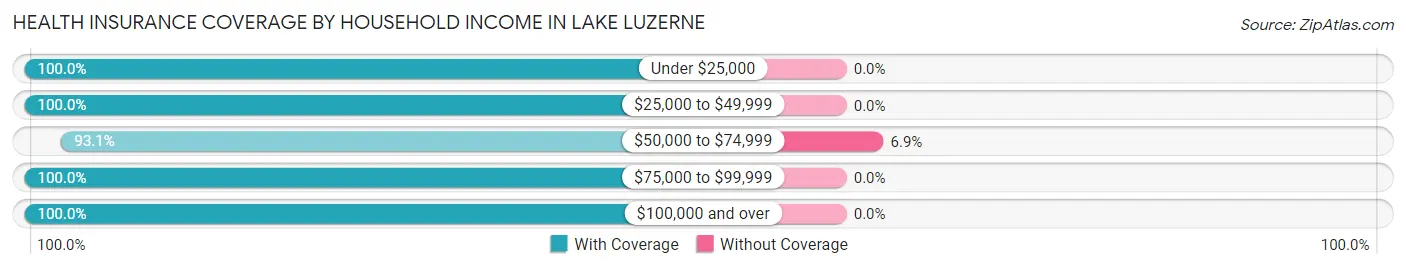
| Household Income | With Coverage | Without Coverage |
| Under $25,000 | 194 (100.0%) | 0 (0.0%) |
| $25,000 to $49,999 | 128 (100.0%) | 0 (0.0%) |
| $50,000 to $74,999 | 135 (93.1%) | 10 (6.9%) |
| $75,000 to $99,999 | 169 (100.0%) | 0 (0.0%) |
| $100,000 and over | 703 (100.0%) | 0 (0.0%) |
Public vs Private Health Insurance Coverage by Age in Lake Luzerne
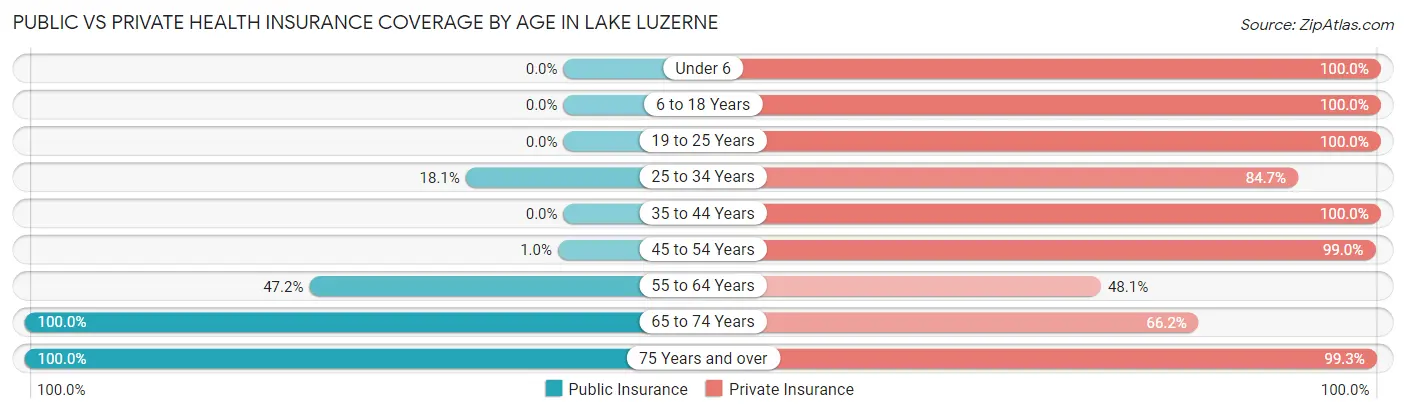
| Age Bracket | Public Insurance | Private Insurance |
| Under 6 | 0 (0.0%) | 54 (100.0%) |
| 6 to 18 Years | 0 (0.0%) | 197 (100.0%) |
| 19 to 25 Years | 0 (0.0%) | 42 (100.0%) |
| 25 to 34 Years | 39 (18.1%) | 182 (84.7%) |
| 35 to 44 Years | 0 (0.0%) | 121 (100.0%) |
| 45 to 54 Years | 1 (1.0%) | 96 (99.0%) |
| 55 to 64 Years | 100 (47.2%) | 102 (48.1%) |
| 65 to 74 Years | 151 (100.0%) | 100 (66.2%) |
| 75 Years and over | 265 (100.0%) | 263 (99.3%) |
| Total | 556 (41.1%) | 1,157 (85.5%) |
Disability Status by Sex by Age in Lake Luzerne
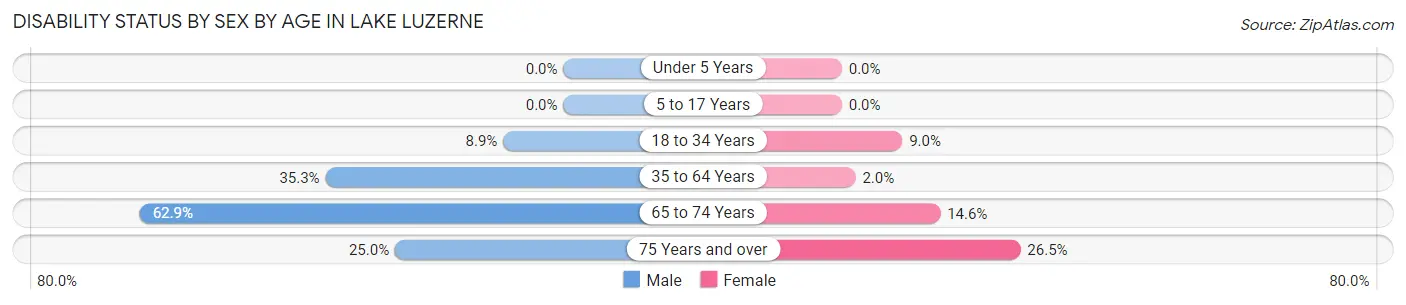
| Age Bracket | Male | Female |
| Under 5 Years | 0 (0.0%) | 0 (0.0%) |
| 5 to 17 Years | 0 (0.0%) | 0 (0.0%) |
| 18 to 34 Years | 16 (8.9%) | 7 (9.0%) |
| 35 to 64 Years | 65 (35.3%) | 5 (2.0%) |
| 65 to 74 Years | 39 (62.9%) | 13 (14.6%) |
| 75 Years and over | 21 (25.0%) | 48 (26.5%) |
Disability Class by Sex by Age in Lake Luzerne
Disability Class: Hearing Difficulty
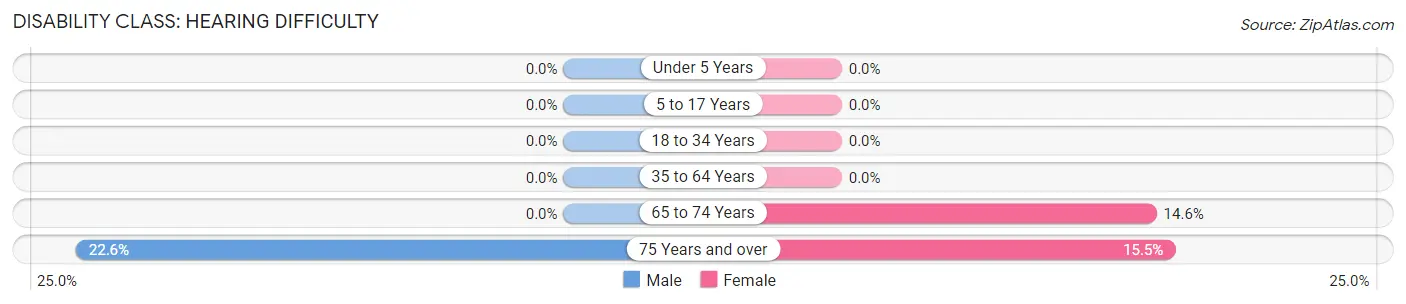
| Age Bracket | Male | Female |
| Under 5 Years | 0 (0.0%) | 0 (0.0%) |
| 5 to 17 Years | 0 (0.0%) | 0 (0.0%) |
| 18 to 34 Years | 0 (0.0%) | 0 (0.0%) |
| 35 to 64 Years | 0 (0.0%) | 0 (0.0%) |
| 65 to 74 Years | 0 (0.0%) | 13 (14.6%) |
| 75 Years and over | 19 (22.6%) | 28 (15.5%) |
Disability Class: Vision Difficulty
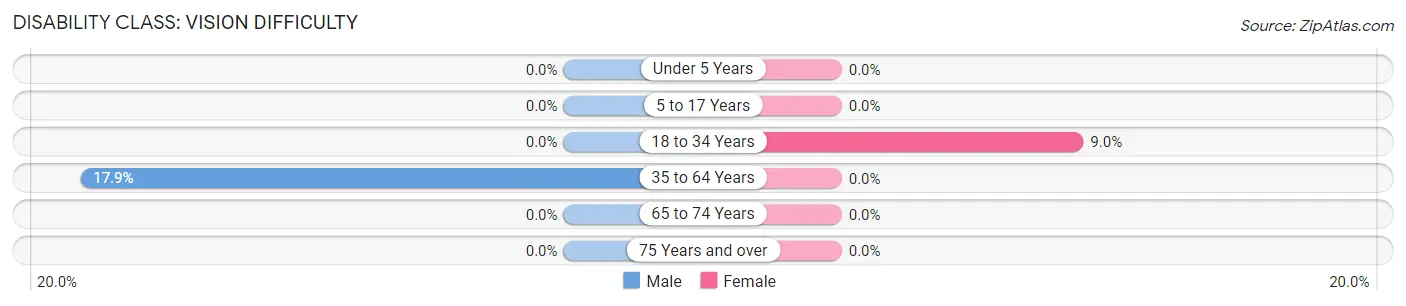
| Age Bracket | Male | Female |
| Under 5 Years | 0 (0.0%) | 0 (0.0%) |
| 5 to 17 Years | 0 (0.0%) | 0 (0.0%) |
| 18 to 34 Years | 0 (0.0%) | 7 (9.0%) |
| 35 to 64 Years | 33 (17.9%) | 0 (0.0%) |
| 65 to 74 Years | 0 (0.0%) | 0 (0.0%) |
| 75 Years and over | 0 (0.0%) | 0 (0.0%) |
Disability Class: Cognitive Difficulty
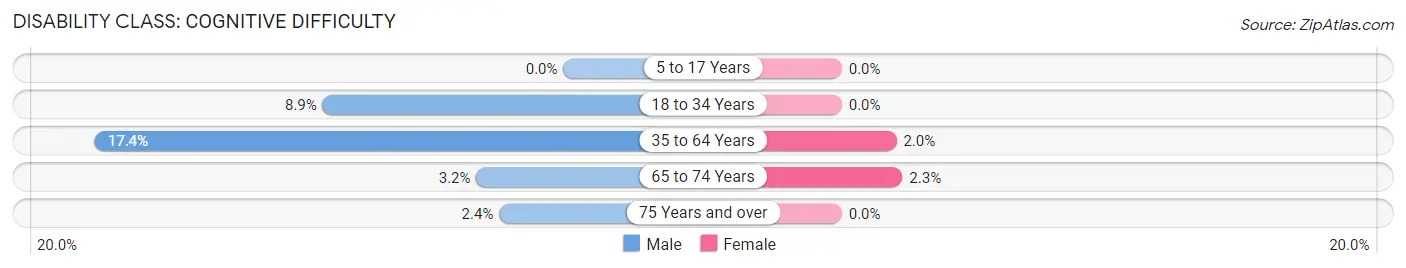
| Age Bracket | Male | Female |
| 5 to 17 Years | 0 (0.0%) | 0 (0.0%) |
| 18 to 34 Years | 16 (8.9%) | 0 (0.0%) |
| 35 to 64 Years | 32 (17.4%) | 5 (2.0%) |
| 65 to 74 Years | 2 (3.2%) | 2 (2.2%) |
| 75 Years and over | 2 (2.4%) | 0 (0.0%) |
Disability Class: Ambulatory Difficulty
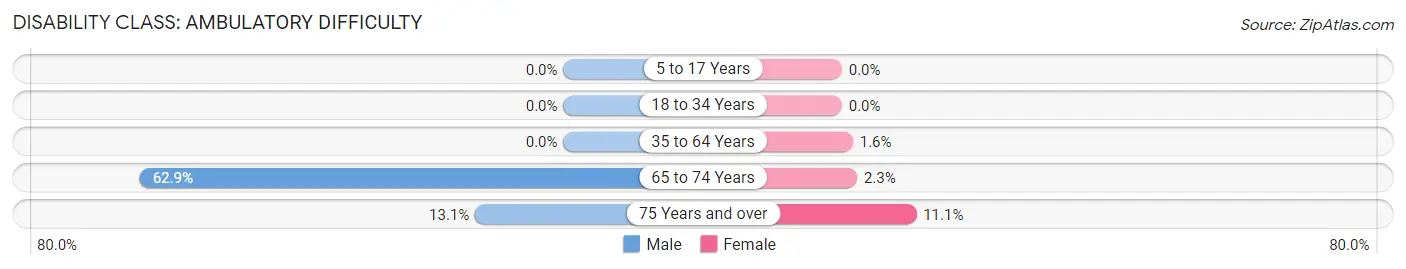
| Age Bracket | Male | Female |
| 5 to 17 Years | 0 (0.0%) | 0 (0.0%) |
| 18 to 34 Years | 0 (0.0%) | 0 (0.0%) |
| 35 to 64 Years | 0 (0.0%) | 4 (1.6%) |
| 65 to 74 Years | 39 (62.9%) | 2 (2.2%) |
| 75 Years and over | 11 (13.1%) | 20 (11.1%) |
Disability Class: Self-Care Difficulty
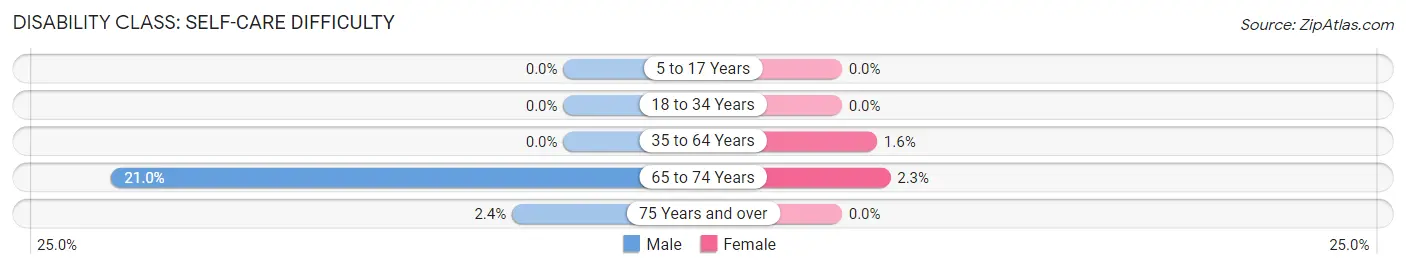
| Age Bracket | Male | Female |
| 5 to 17 Years | 0 (0.0%) | 0 (0.0%) |
| 18 to 34 Years | 0 (0.0%) | 0 (0.0%) |
| 35 to 64 Years | 0 (0.0%) | 4 (1.6%) |
| 65 to 74 Years | 13 (21.0%) | 2 (2.2%) |
| 75 Years and over | 2 (2.4%) | 0 (0.0%) |
Technology Access in Lake Luzerne
Computing Device Access in Lake Luzerne
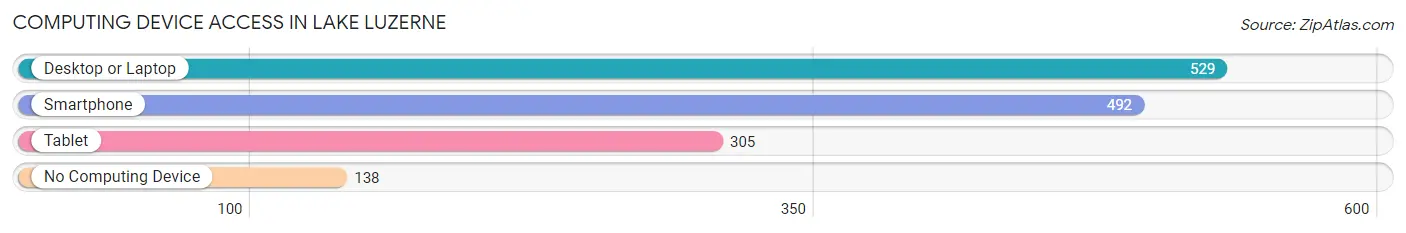
| Device Type | # Households | % Households |
| Desktop or Laptop | 529 | 73.4% |
| Smartphone | 492 | 68.2% |
| Tablet | 305 | 42.3% |
| No Computing Device | 138 | 19.1% |
| Total | 721 | 100.0% |
Internet Access in Lake Luzerne

| Internet Type | # Households | % Households |
| Dial-Up Internet | 28 | 3.9% |
| Broadband Home | 484 | 67.1% |
| Cellular Data Only | 51 | 7.1% |
| Satellite Internet | 0 | 0.0% |
| No Internet | 149 | 20.7% |
| Total | 721 | 100.0% |
Lake Luzerne Summary
History
Lake Luzerne is a hamlet located in the town of Lake Luzerne in Warren County, New York. It is situated on the western shore of Lake Luzerne, a lake of the same name. The hamlet was first settled in 1790 by a group of settlers from Massachusetts. The settlers were attracted to the area by the abundance of natural resources, including timber, fish, and game. The hamlet was originally known as “The Flats” due to its location on a flat plain.
In 1810, the hamlet was renamed “Lake Luzerne” after the lake. The lake was named after the Swiss city of Lucerne, which was the hometown of the first settlers. The hamlet grew slowly over the years, and by the mid-1800s, it had become a popular summer resort destination. The lake was a popular spot for fishing, boating, and swimming.
In the late 1800s, the hamlet began to experience a period of growth and development. The first hotel was built in 1875, and the first post office was established in 1877. The hamlet was incorporated in 1891, and the first school was built in 1895.
The hamlet continued to grow and develop throughout the 20th century. In the 1950s, the hamlet was home to a number of summer camps, and in the 1960s, the hamlet was home to a number of ski resorts. The hamlet also became a popular destination for snowmobiling and other winter activities.
Today, Lake Luzerne is a popular destination for tourists and locals alike. The hamlet is home to a number of restaurants, shops, and other businesses. The lake is still a popular spot for fishing, boating, and swimming. The hamlet is also home to a number of historic sites, including the Lake Luzerne Historical Society Museum.
Geography
Lake Luzerne is located in the town of Lake Luzerne in Warren County, New York. The hamlet is situated on the western shore of Lake Luzerne, a lake of the same name. The lake is approximately 2,000 acres in size and is the largest lake in Warren County. The lake is fed by several small streams and is surrounded by hills and mountains.
The hamlet is located in the Adirondack Mountains, and the surrounding area is home to a variety of wildlife, including deer, bear, and moose. The hamlet is also home to a number of parks and recreational areas, including the Lake Luzerne State Park.
Economy
The economy of Lake Luzerne is largely based on tourism. The hamlet is a popular destination for tourists and locals alike. The lake is a popular spot for fishing, boating, and swimming. The hamlet is also home to a number of restaurants, shops, and other businesses.
The hamlet is also home to a number of manufacturing and industrial businesses. The hamlet is home to a number of paper mills, as well as a number of other businesses that produce a variety of products, including furniture, clothing, and electronics.
Demographics
As of the 2010 census, the population of Lake Luzerne was 1,845. The population is largely white (94.3%), with a small percentage of African Americans (2.2%) and Native Americans (1.2%). The median household income is $45,000, and the median age is 44.
The hamlet is home to a number of churches, including the Lake Luzerne United Methodist Church, the Lake Luzerne Baptist Church, and the Lake Luzerne Presbyterian Church. The hamlet is also home to a number of schools, including the Lake Luzerne Elementary School and the Lake Luzerne High School.
Common Questions
What is the Total Population of Lake Luzerne?
Total Population of Lake Luzerne is 1,354.
What is the Total Male Population of Lake Luzerne?
Total Male Population of Lake Luzerne is 700.
What is the Total Female Population of Lake Luzerne?
Total Female Population of Lake Luzerne is 654.
What is the Ratio of Males per 100 Females in Lake Luzerne?
There are 107.03 Males per 100 Females in Lake Luzerne.
What is the Ratio of Females per 100 Males in Lake Luzerne?
There are 93.43 Females per 100 Males in Lake Luzerne.
What is the Median Population Age in Lake Luzerne?
Median Population Age in Lake Luzerne is 49.5 Years.
What is the Average Family Size in Lake Luzerne
Average Family Size in Lake Luzerne is 2.7 People.
What is the Average Household Size in Lake Luzerne
Average Household Size in Lake Luzerne is 1.9 People.
What is Per Capita Income in Lake Luzerne?
Per Capita income in Lake Luzerne is $40,046.
What is the Median Family Income in Lake Luzerne?
Median Family Income in Lake Luzerne is $106,522.
What is the Median Household income in Lake Luzerne?
Median Household Income in Lake Luzerne is $71,250.
What is Inequality or Gini Index in Lake Luzerne?
Inequality or Gini Index in Lake Luzerne is 0.45.
How Large is the Labor Force in Lake Luzerne?
There are 609 People in the Labor Forcein in Lake Luzerne.
What is the Percentage of People in the Labor Force in Lake Luzerne?
55.2% of People are in the Labor Force in Lake Luzerne.
What is the Unemployment Rate in Lake Luzerne?
Unemployment Rate in Lake Luzerne is 3.4%.