Gasport, NY
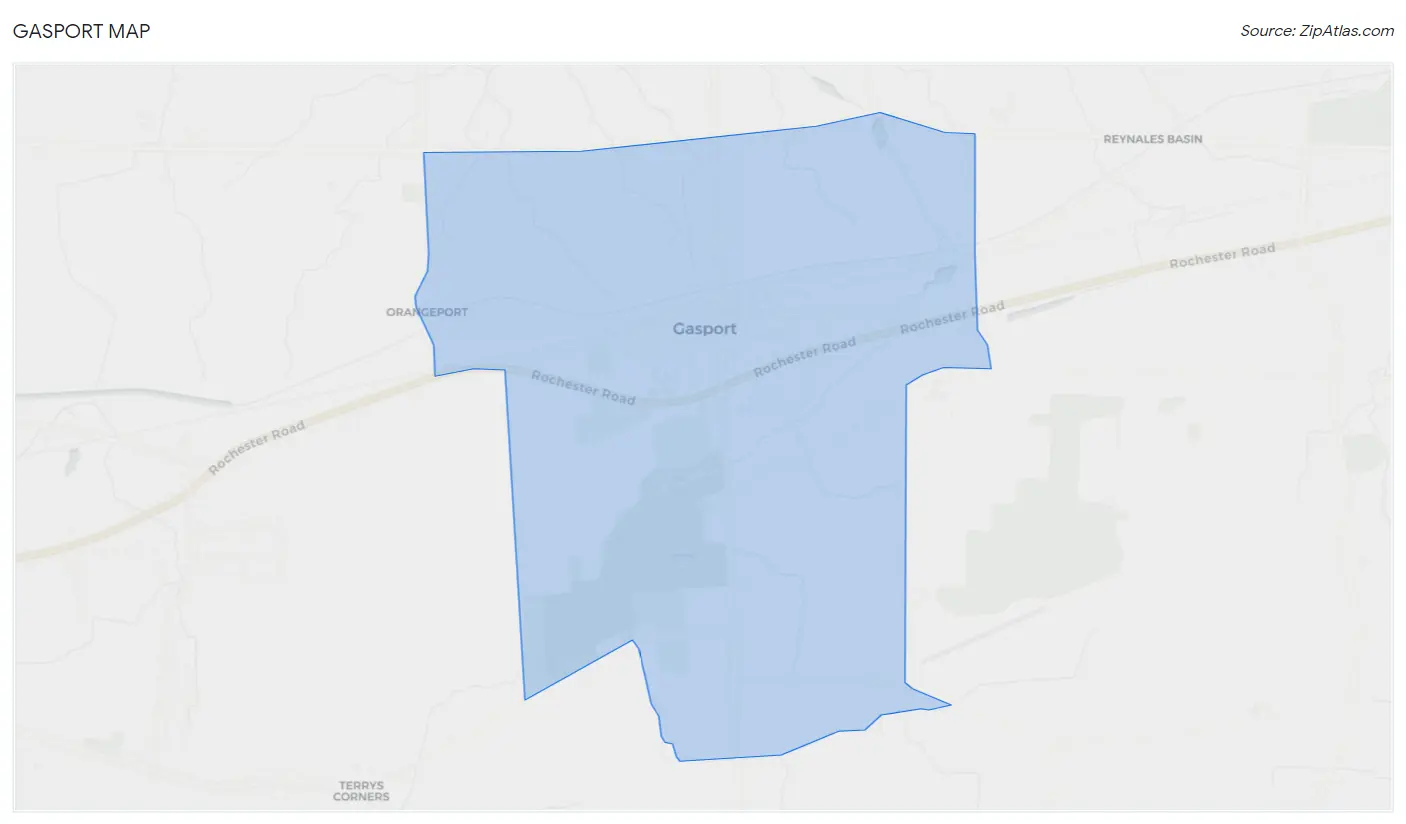
Gasport Map
Gasport Overview
1,400
TOTAL POPULATION
546
MALE POPULATION
854
FEMALE POPULATION
63.93
MALES / 100 FEMALES
156.41
FEMALES / 100 MALES
35.0
MEDIAN AGE
3.3
AVG FAMILY SIZE
2.4
AVG HOUSEHOLD SIZE
$38,222
PER CAPITA INCOME
$92,386
AVG FAMILY INCOME
$75,708
AVG HOUSEHOLD INCOME
31.8%
WAGE / INCOME GAP [ % ]
68.2¢/ $1
WAGE / INCOME GAP [ $ ]
0.38
INEQUALITY / GINI INDEX
810
LABOR FORCE [ PEOPLE ]
69.8%
PERCENT IN LABOR FORCE
7.2%
UNEMPLOYMENT RATE
Gasport Zip Codes
Gasport Area Codes
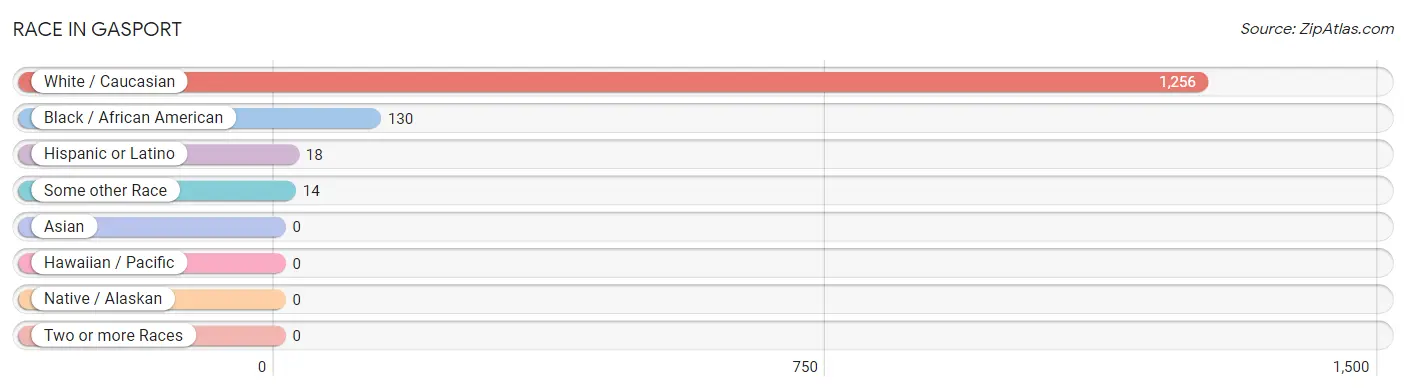
Race in Gasport
The most populous races in Gasport are White / Caucasian (1,256 | 89.7%), Black / African American (130 | 9.3%), and Hispanic or Latino (18 | 1.3%).
| Race | # Population | % Population |
| Asian | 0 | 0.0% |
| Black / African American | 130 | 9.3% |
| Hawaiian / Pacific | 0 | 0.0% |
| Hispanic or Latino | 18 | 1.3% |
| Native / Alaskan | 0 | 0.0% |
| White / Caucasian | 1,256 | 89.7% |
| Two or more Races | 0 | 0.0% |
| Some other Race | 14 | 1.0% |
| Total | 1,400 | 100.0% |
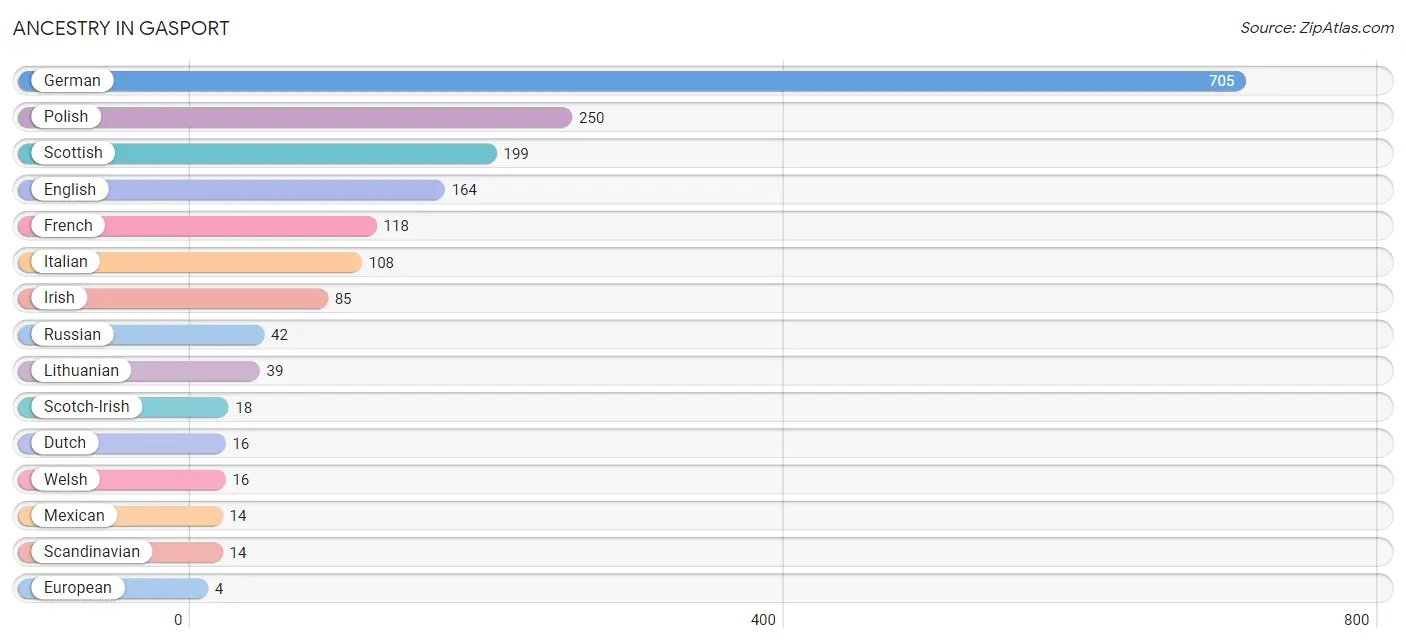
Ancestry in Gasport
The most populous ancestries reported in Gasport are German (705 | 50.4%), Polish (250 | 17.9%), Scottish (199 | 14.2%), English (164 | 11.7%), and French (118 | 8.4%), together accounting for 102.6% of all Gasport residents.
| Ancestry | # Population | % Population |
| American | 3 | 0.2% |
| Dutch | 16 | 1.1% |
| English | 164 | 11.7% |
| European | 4 | 0.3% |
| French | 118 | 8.4% |
| German | 705 | 50.4% |
| Irish | 85 | 6.1% |
| Italian | 108 | 7.7% |
| Lithuanian | 39 | 2.8% |
| Mexican | 14 | 1.0% |
| Polish | 250 | 17.9% |
| Russian | 42 | 3.0% |
| Scandinavian | 14 | 1.0% |
| Scotch-Irish | 18 | 1.3% |
| Scottish | 199 | 14.2% |
| South African | 2 | 0.1% |
| Subsaharan African | 2 | 0.1% |
| Ukrainian | 4 | 0.3% |
| Welsh | 16 | 1.1% | View All 19 Rows |
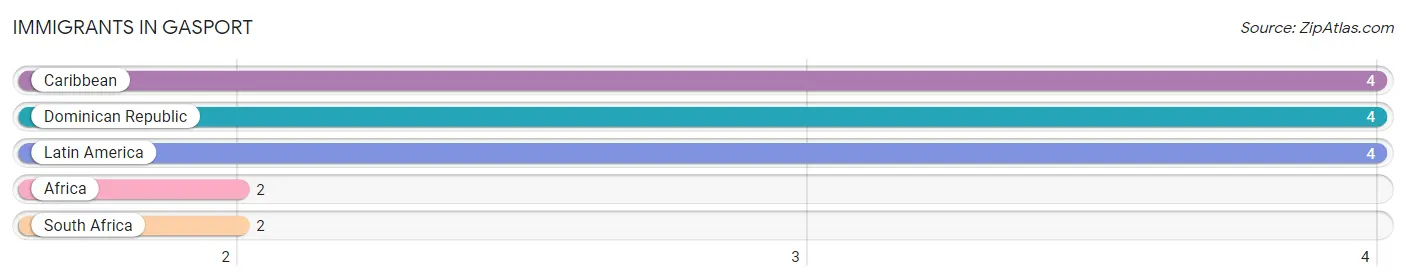
Immigrants in Gasport
The most numerous immigrant groups reported in Gasport came from Caribbean (4 | 0.3%), Dominican Republic (4 | 0.3%), Latin America (4 | 0.3%), Africa (2 | 0.1%), and South Africa (2 | 0.1%), together accounting for 1.1% of all Gasport residents.
| Immigration Origin | # Population | % Population |
| Africa | 2 | 0.1% |
| Caribbean | 4 | 0.3% |
| Dominican Republic | 4 | 0.3% |
| Latin America | 4 | 0.3% |
| South Africa | 2 | 0.1% | View All 5 Rows |
Sex and Age in Gasport
Sex and Age in Gasport
The most populous age groups in Gasport are 30 to 34 Years (78 | 14.3%) for men and 20 to 24 Years (128 | 15.0%) for women.
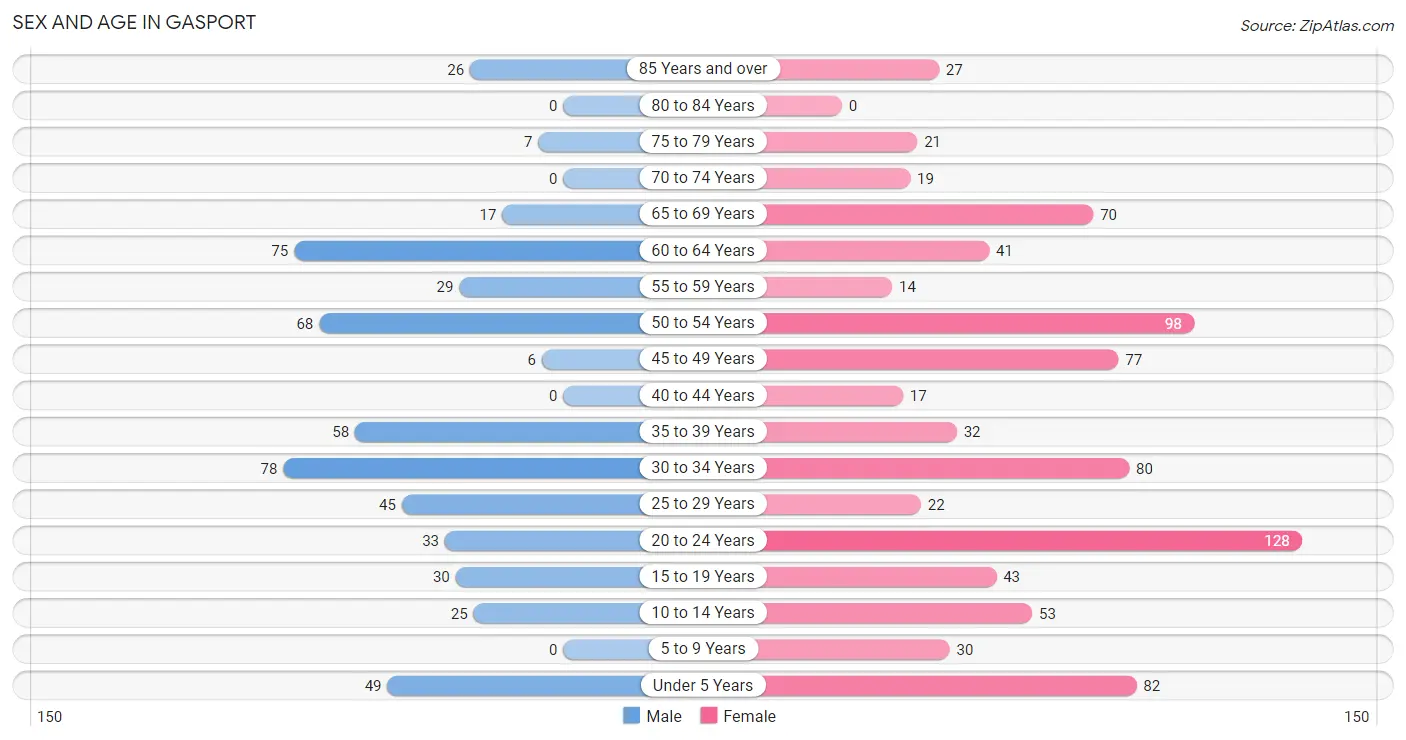
| Age Bracket | Male | Female |
| Under 5 Years | 49 (9.0%) | 82 (9.6%) |
| 5 to 9 Years | 0 (0.0%) | 30 (3.5%) |
| 10 to 14 Years | 25 (4.6%) | 53 (6.2%) |
| 15 to 19 Years | 30 (5.5%) | 43 (5.0%) |
| 20 to 24 Years | 33 (6.0%) | 128 (15.0%) |
| 25 to 29 Years | 45 (8.2%) | 22 (2.6%) |
| 30 to 34 Years | 78 (14.3%) | 80 (9.4%) |
| 35 to 39 Years | 58 (10.6%) | 32 (3.7%) |
| 40 to 44 Years | 0 (0.0%) | 17 (2.0%) |
| 45 to 49 Years | 6 (1.1%) | 77 (9.0%) |
| 50 to 54 Years | 68 (12.4%) | 98 (11.5%) |
| 55 to 59 Years | 29 (5.3%) | 14 (1.6%) |
| 60 to 64 Years | 75 (13.7%) | 41 (4.8%) |
| 65 to 69 Years | 17 (3.1%) | 70 (8.2%) |
| 70 to 74 Years | 0 (0.0%) | 19 (2.2%) |
| 75 to 79 Years | 7 (1.3%) | 21 (2.5%) |
| 80 to 84 Years | 0 (0.0%) | 0 (0.0%) |
| 85 Years and over | 26 (4.8%) | 27 (3.2%) |
| Total | 546 (100.0%) | 854 (100.0%) |
Families and Households in Gasport
Median Family Size in Gasport
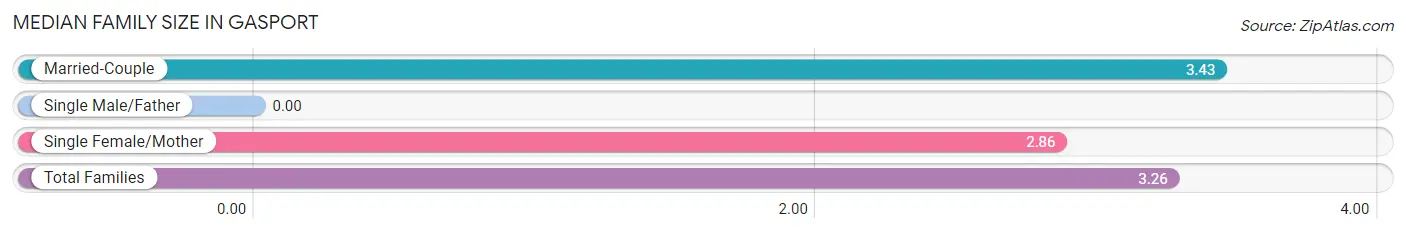
| Family Type | # Families | Family Size |
| Married-Couple | 213 (70.8%) | 3.43 |
| Single Male/Father | 0 (0.0%) | - |
| Single Female/Mother | 88 (29.2%) | 2.86 |
| Total Families | 301 (100.0%) | 3.26 |
Median Household Size in Gasport
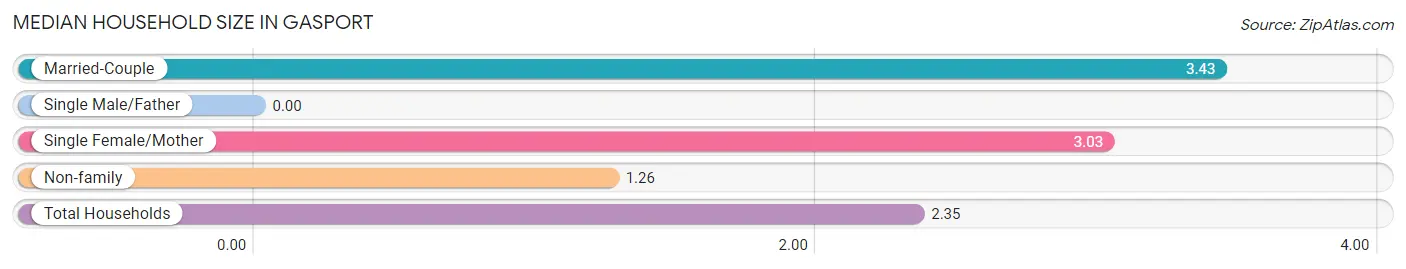
| Household Type | # Households | Household Size |
| Married-Couple | 213 (37.6%) | 3.43 |
| Single Male/Father | 0 (0.0%) | - |
| Single Female/Mother | 88 (15.5%) | 3.03 |
| Non-family | 266 (46.9%) | 1.26 |
| Total Households | 567 (100.0%) | 2.35 |
Household Size by Marriage Status in Gasport
Out of a total of 567 households in Gasport, 301 (53.1%) are family households, while 266 (46.9%) are nonfamily households. The most numerous type of family households are 2-person households, comprising 143, and the most common type of nonfamily households are 1-person households, comprising 199.
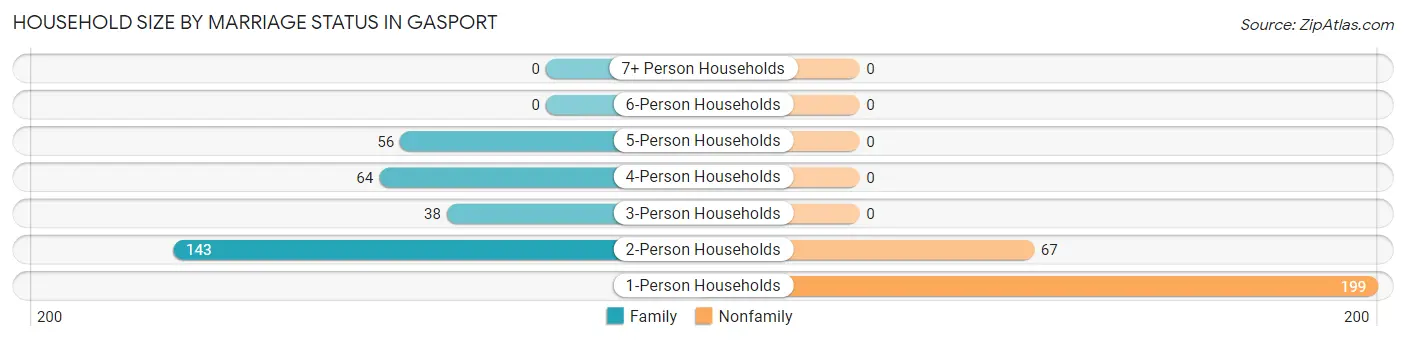
| Household Size | Family Households | Nonfamily Households |
| 1-Person Households | - | 199 (35.1%) |
| 2-Person Households | 143 (25.2%) | 67 (11.8%) |
| 3-Person Households | 38 (6.7%) | 0 (0.0%) |
| 4-Person Households | 64 (11.3%) | 0 (0.0%) |
| 5-Person Households | 56 (9.9%) | 0 (0.0%) |
| 6-Person Households | 0 (0.0%) | 0 (0.0%) |
| 7+ Person Households | 0 (0.0%) | 0 (0.0%) |
| Total | 301 (53.1%) | 266 (46.9%) |
Female Fertility in Gasport
Fertility by Age in Gasport
Average fertility rate in Gasport is 157.0 births per 1,000 women. Women in the age bracket of 35 to 50 years have the highest fertility rate with 186.0 births per 1,000 women. Women in the age bracket of 20 to 34 years acount for 54.3% of all women with births.
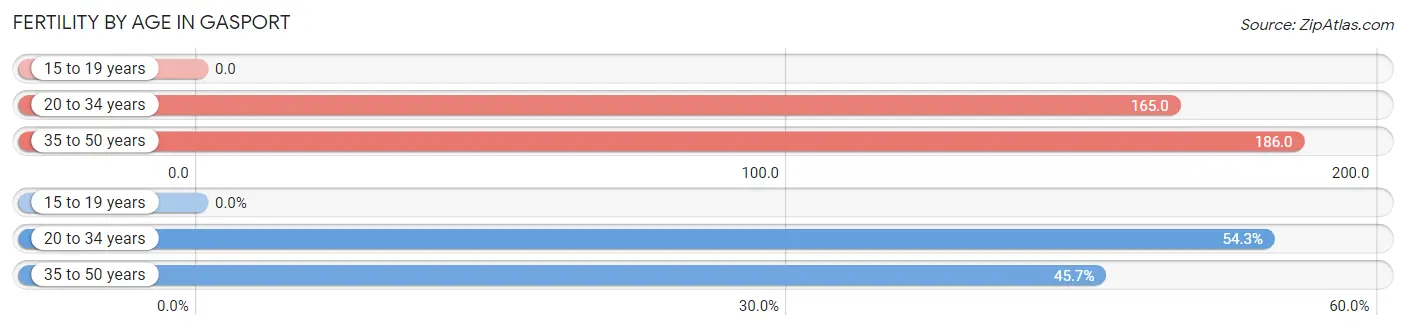
| Age Bracket | Women with Births | Births / 1,000 Women |
| 15 to 19 years | 0 (0.0%) | 0.0 |
| 20 to 34 years | 38 (54.3%) | 165.0 |
| 35 to 50 years | 32 (45.7%) | 186.0 |
| Total | 70 (100.0%) | 157.0 |
Fertility by Age by Marriage Status in Gasport
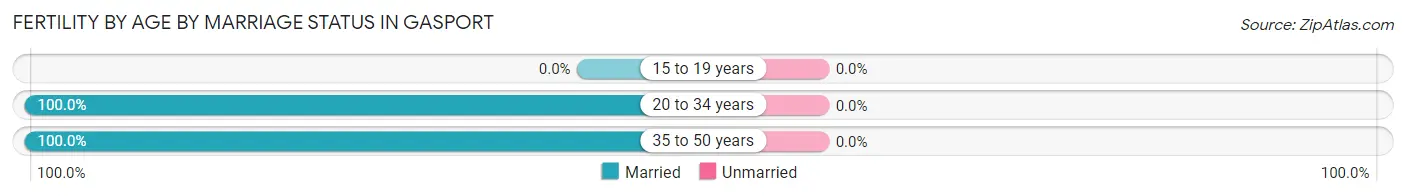
| Age Bracket | Married | Unmarried |
| 15 to 19 years | 0 (0.0%) | 0 (0.0%) |
| 20 to 34 years | 38 (100.0%) | 0 (0.0%) |
| 35 to 50 years | 32 (100.0%) | 0 (0.0%) |
| Total | 70 (100.0%) | 0 (0.0%) |
Fertility by Education in Gasport
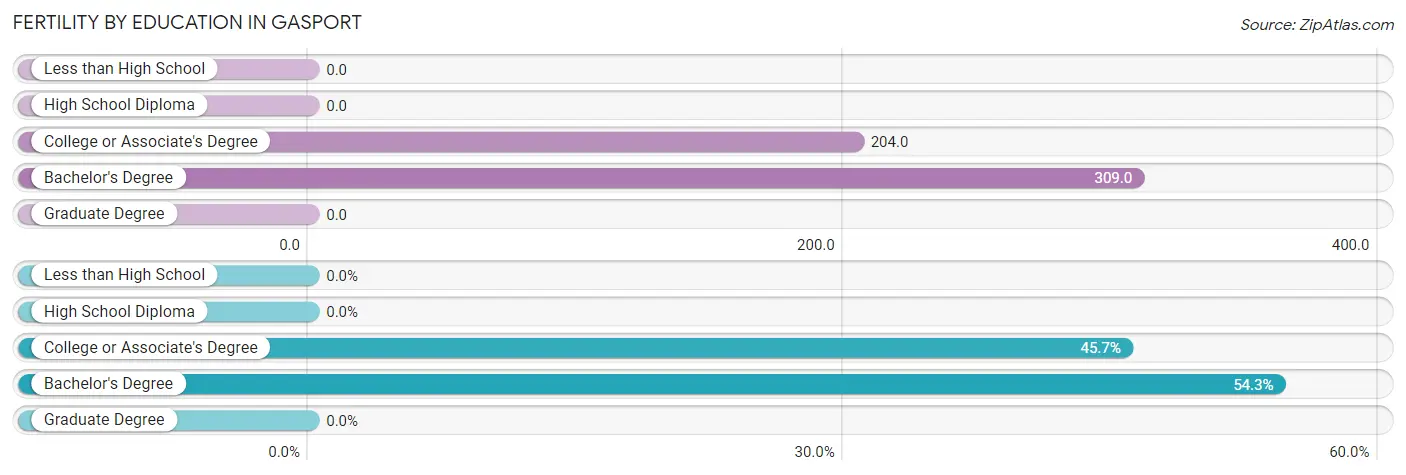
| Educational Attainment | Women with Births | Births / 1,000 Women |
| Less than High School | 0 (0.0%) | 0.0 |
| High School Diploma | 0 (0.0%) | 0.0 |
| College or Associate's Degree | 32 (45.7%) | 204.0 |
| Bachelor's Degree | 38 (54.3%) | 309.0 |
| Graduate Degree | 0 (0.0%) | 0.0 |
| Total | 70 (100.0%) | 157.0 |
Fertility by Education by Marriage Status in Gasport
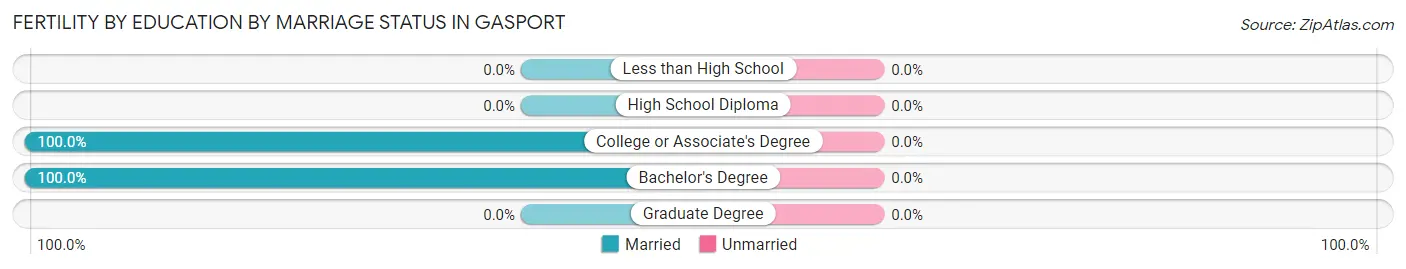
| Educational Attainment | Married | Unmarried |
| Less than High School | 0 (0.0%) | 0 (0.0%) |
| High School Diploma | 0 (0.0%) | 0 (0.0%) |
| College or Associate's Degree | 32 (100.0%) | 0 (0.0%) |
| Bachelor's Degree | 38 (100.0%) | 0 (0.0%) |
| Graduate Degree | 0 (0.0%) | 0 (0.0%) |
| Total | 70 (100.0%) | 0 (0.0%) |
Income in Gasport
Income Overview in Gasport
Per Capita Income in Gasport is $38,222, while median incomes of families and households are $92,386 and $75,708 respectively.
| Characteristic | Number | Measure |
| Per Capita Income | 1,400 | $38,222 |
| Median Family Income | 301 | $92,386 |
| Mean Family Income | 301 | $109,071 |
| Median Household Income | 567 | $75,708 |
| Mean Household Income | 567 | $89,396 |
| Income Deficit | 301 | $0 |
| Wage / Income Gap (%) | 1,400 | 31.78% |
| Wage / Income Gap ($) | 1,400 | 68.22¢ per $1 |
| Gini / Inequality Index | 1,400 | 0.38 |
Earnings by Sex in Gasport
Average Earnings in Gasport are $47,446, $59,107 for men and $40,324 for women, a difference of 31.8%.
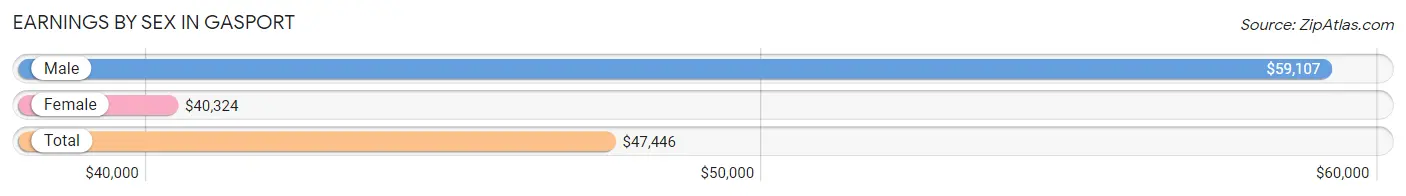
| Sex | Number | Average Earnings |
| Male | 364 (42.9%) | $59,107 |
| Female | 485 (57.1%) | $40,324 |
| Total | 849 (100.0%) | $47,446 |
Earnings by Sex by Income Bracket in Gasport
The most common earnings brackets in Gasport are $55,000 to $64,999 for men (82 | 22.5%) and $75,000 to $99,999 for women (130 | 26.8%).
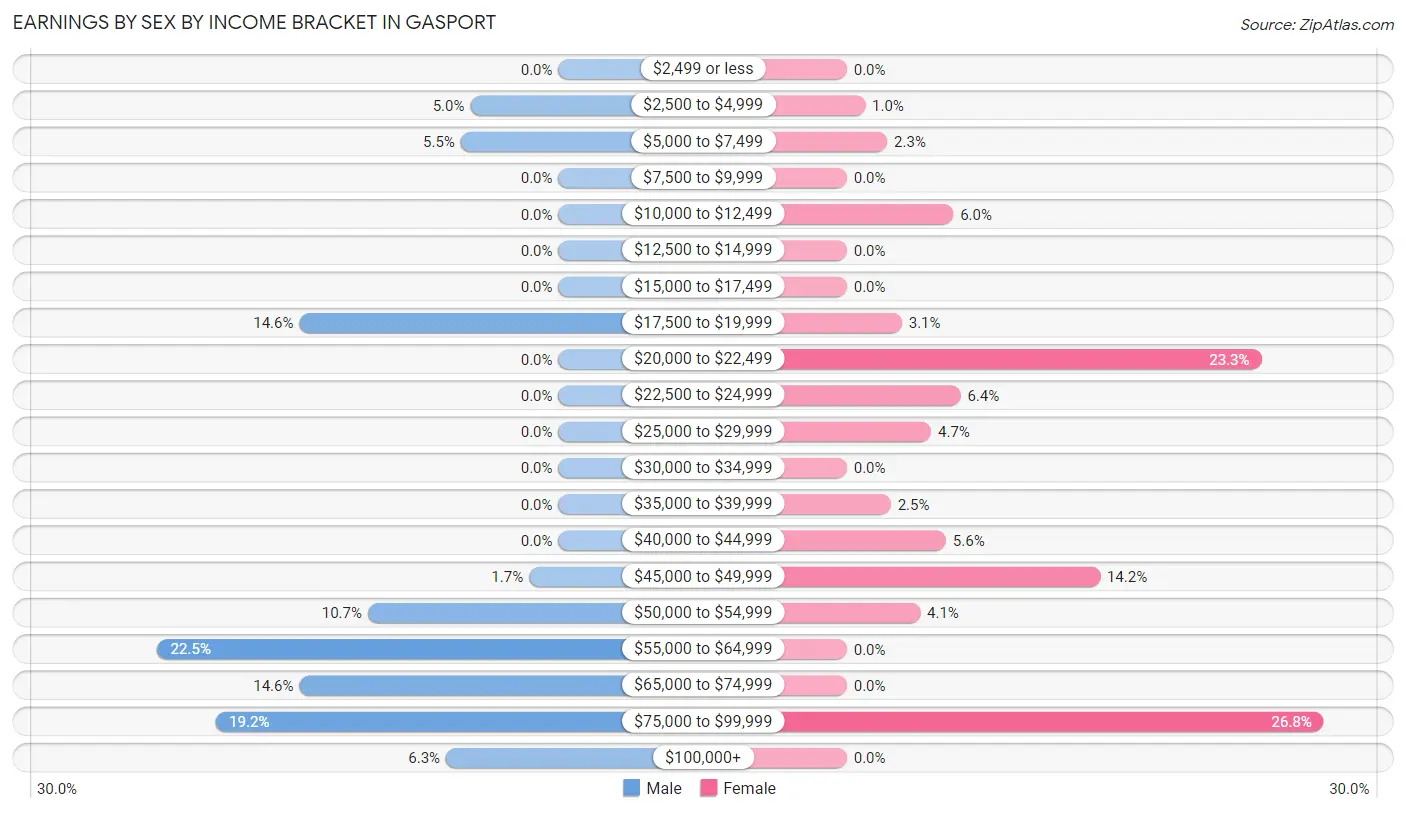
| Income | Male | Female |
| $2,499 or less | 0 (0.0%) | 0 (0.0%) |
| $2,500 to $4,999 | 18 (5.0%) | 5 (1.0%) |
| $5,000 to $7,499 | 20 (5.5%) | 11 (2.3%) |
| $7,500 to $9,999 | 0 (0.0%) | 0 (0.0%) |
| $10,000 to $12,499 | 0 (0.0%) | 29 (6.0%) |
| $12,500 to $14,999 | 0 (0.0%) | 0 (0.0%) |
| $15,000 to $17,499 | 0 (0.0%) | 0 (0.0%) |
| $17,500 to $19,999 | 53 (14.6%) | 15 (3.1%) |
| $20,000 to $22,499 | 0 (0.0%) | 113 (23.3%) |
| $22,500 to $24,999 | 0 (0.0%) | 31 (6.4%) |
| $25,000 to $29,999 | 0 (0.0%) | 23 (4.7%) |
| $30,000 to $34,999 | 0 (0.0%) | 0 (0.0%) |
| $35,000 to $39,999 | 0 (0.0%) | 12 (2.5%) |
| $40,000 to $44,999 | 0 (0.0%) | 27 (5.6%) |
| $45,000 to $49,999 | 6 (1.7%) | 69 (14.2%) |
| $50,000 to $54,999 | 39 (10.7%) | 20 (4.1%) |
| $55,000 to $64,999 | 82 (22.5%) | 0 (0.0%) |
| $65,000 to $74,999 | 53 (14.6%) | 0 (0.0%) |
| $75,000 to $99,999 | 70 (19.2%) | 130 (26.8%) |
| $100,000+ | 23 (6.3%) | 0 (0.0%) |
| Total | 364 (100.0%) | 485 (100.0%) |
Earnings by Sex by Educational Attainment in Gasport
Average earnings in Gasport are $63,250 for men and $47,246 for women, a difference of 25.3%. Men with an educational attainment of high school diploma enjoy the highest average annual earnings of $68,214, while those with college or associate's degree education earn the least with $56,786. Women with an educational attainment of college or associate's degree earn the most with the average annual earnings of $81,176, while those with high school diploma education have the smallest earnings of $38,958.
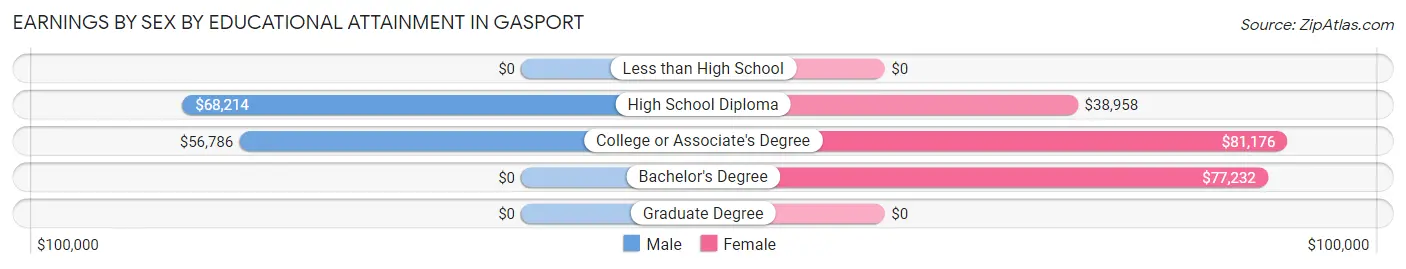
| Educational Attainment | Male Income | Female Income |
| Less than High School | - | - |
| High School Diploma | $68,214 | $38,958 |
| College or Associate's Degree | $56,786 | $81,176 |
| Bachelor's Degree | - | - |
| Graduate Degree | - | - |
| Total | $63,250 | $47,246 |
Family Income in Gasport
Family Income Brackets in Gasport
According to the Gasport family income data, there are 92 families falling into the $100,000 to $149,999 income range, which is the most common income bracket and makes up 30.6% of all families.
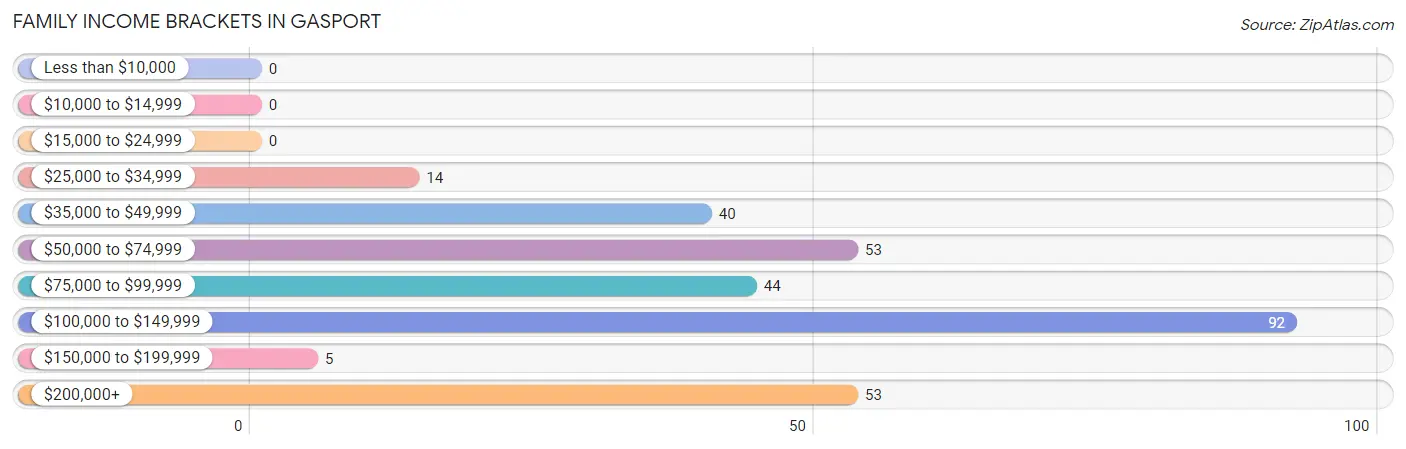
| Income Bracket | # Families | % Families |
| Less than $10,000 | 0 | 0.0% |
| $10,000 to $14,999 | 0 | 0.0% |
| $15,000 to $24,999 | 0 | 0.0% |
| $25,000 to $34,999 | 14 | 4.7% |
| $35,000 to $49,999 | 40 | 13.3% |
| $50,000 to $74,999 | 53 | 17.6% |
| $75,000 to $99,999 | 44 | 14.6% |
| $100,000 to $149,999 | 92 | 30.6% |
| $150,000 to $199,999 | 5 | 1.7% |
| $200,000+ | 53 | 17.6% |
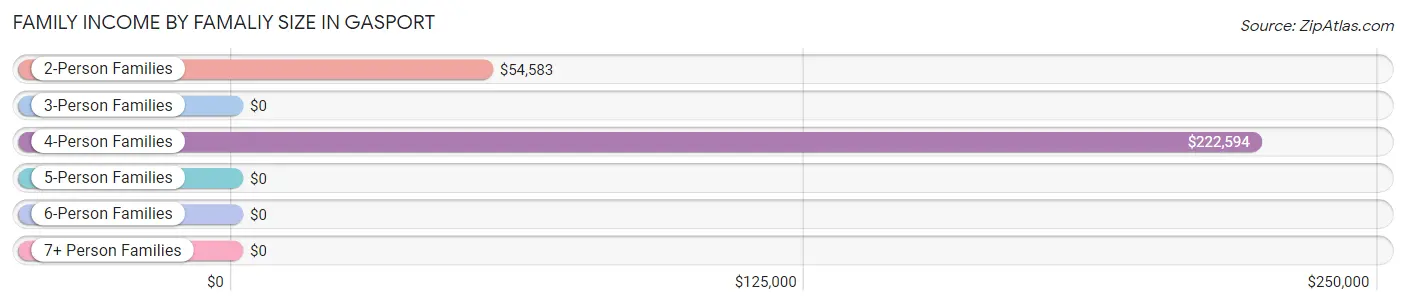
Family Income by Famaliy Size in Gasport
4-person families (77 | 25.6%) account for the highest median family income in Gasport with $222,594 per family, while 4-person families (77 | 25.6%) have the highest median income of $55,648 per family member.
| Income Bracket | # Families | Median Income |
| 2-Person Families | 143 (47.5%) | $54,583 |
| 3-Person Families | 38 (12.6%) | $0 |
| 4-Person Families | 77 (25.6%) | $222,594 |
| 5-Person Families | 43 (14.3%) | $0 |
| 6-Person Families | 0 (0.0%) | $0 |
| 7+ Person Families | 0 (0.0%) | $0 |
| Total | 301 (100.0%) | $92,386 |
Family Income by Number of Earners in Gasport
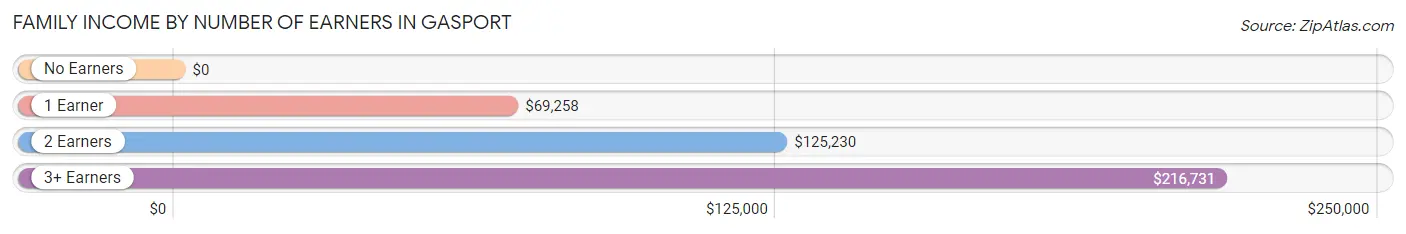
| Number of Earners | # Families | Median Income |
| No Earners | 57 (18.9%) | $0 |
| 1 Earner | 87 (28.9%) | $69,258 |
| 2 Earners | 69 (22.9%) | $125,230 |
| 3+ Earners | 88 (29.2%) | $216,731 |
| Total | 301 (100.0%) | $92,386 |
Household Income in Gasport
Household Income Brackets in Gasport
With 109 households falling in the category, the $100,000 to $149,999 income range is the most frequent in Gasport, accounting for 19.2% of all households.
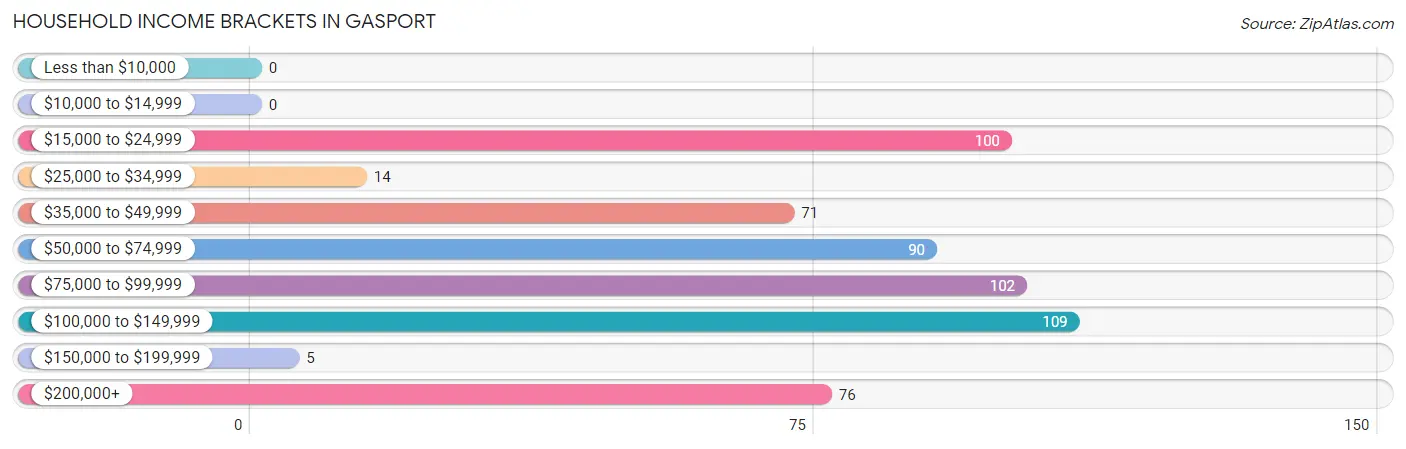
| Income Bracket | # Households | % Households |
| Less than $10,000 | 0 | 0.0% |
| $10,000 to $14,999 | 0 | 0.0% |
| $15,000 to $24,999 | 100 | 17.6% |
| $25,000 to $34,999 | 14 | 2.5% |
| $35,000 to $49,999 | 71 | 12.5% |
| $50,000 to $74,999 | 90 | 15.9% |
| $75,000 to $99,999 | 102 | 18.0% |
| $100,000 to $149,999 | 109 | 19.2% |
| $150,000 to $199,999 | 5 | 0.9% |
| $200,000+ | 76 | 13.4% |
Household Income by Householder Age in Gasport
The median household income in Gasport is $75,708, with the highest median household income of $75,875 found in the 45 to 64 years age bracket for the primary householder. A total of 233 households (41.1%) fall into this category. Meanwhile, the 15 to 24 years age bracket for the primary householder has the lowest median household income of $0, with 100 households (17.6%) in this group.
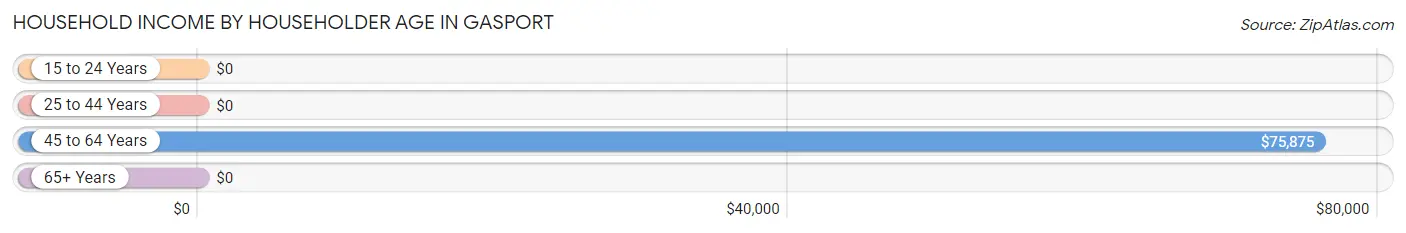
| Income Bracket | # Households | Median Income |
| 15 to 24 Years | 100 (17.6%) | $0 |
| 25 to 44 Years | 132 (23.3%) | $0 |
| 45 to 64 Years | 233 (41.1%) | $75,875 |
| 65+ Years | 102 (18.0%) | $0 |
| Total | 567 (100.0%) | $75,708 |
Poverty in Gasport
Income Below Poverty by Sex and Age in Gasport
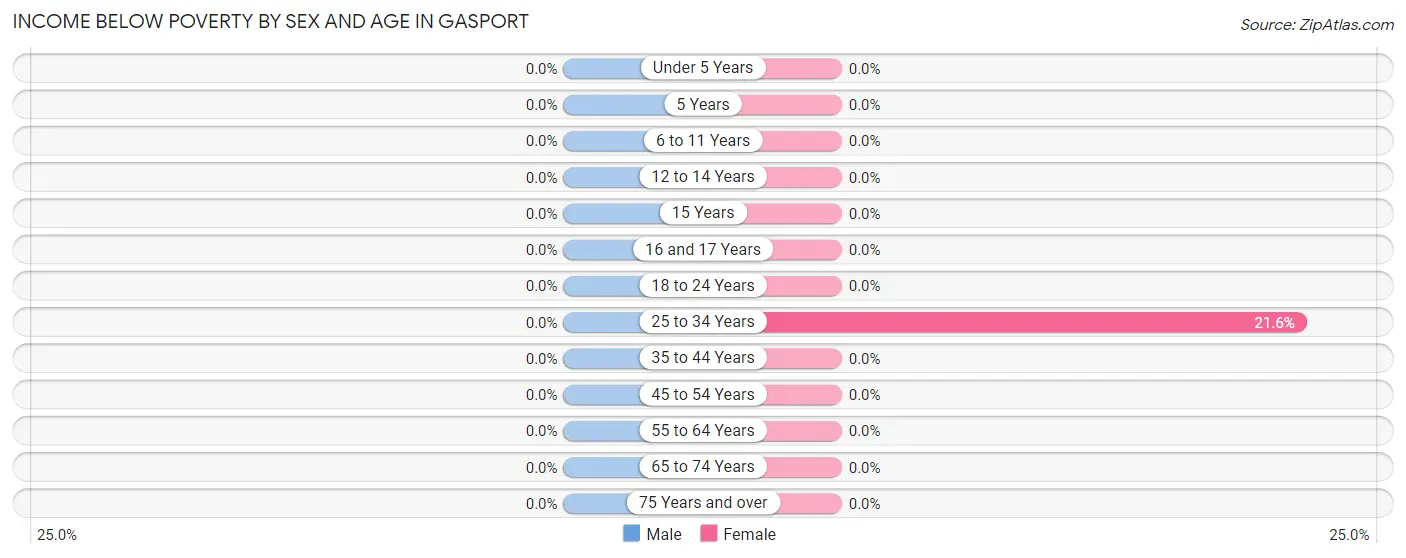
| Age Bracket | Male | Female |
| Under 5 Years | 0 (0.0%) | 0 (0.0%) |
| 5 Years | 0 (0.0%) | 0 (0.0%) |
| 6 to 11 Years | 0 (0.0%) | 0 (0.0%) |
| 12 to 14 Years | 0 (0.0%) | 0 (0.0%) |
| 15 Years | 0 (0.0%) | 0 (0.0%) |
| 16 and 17 Years | 0 (0.0%) | 0 (0.0%) |
| 18 to 24 Years | 0 (0.0%) | 0 (0.0%) |
| 25 to 34 Years | 0 (0.0%) | 22 (21.6%) |
| 35 to 44 Years | 0 (0.0%) | 0 (0.0%) |
| 45 to 54 Years | 0 (0.0%) | 0 (0.0%) |
| 55 to 64 Years | 0 (0.0%) | 0 (0.0%) |
| 65 to 74 Years | 0 (0.0%) | 0 (0.0%) |
| 75 Years and over | 0 (0.0%) | 0 (0.0%) |
| Total | 0 (0.0%) | 22 (2.7%) |
Income Above Poverty by Sex and Age in Gasport
According to the poverty statistics in Gasport, males aged under 5 years and females aged under 5 years are the age groups that are most secure financially, with 100.0% of males and 100.0% of females in these age groups living above the poverty line.
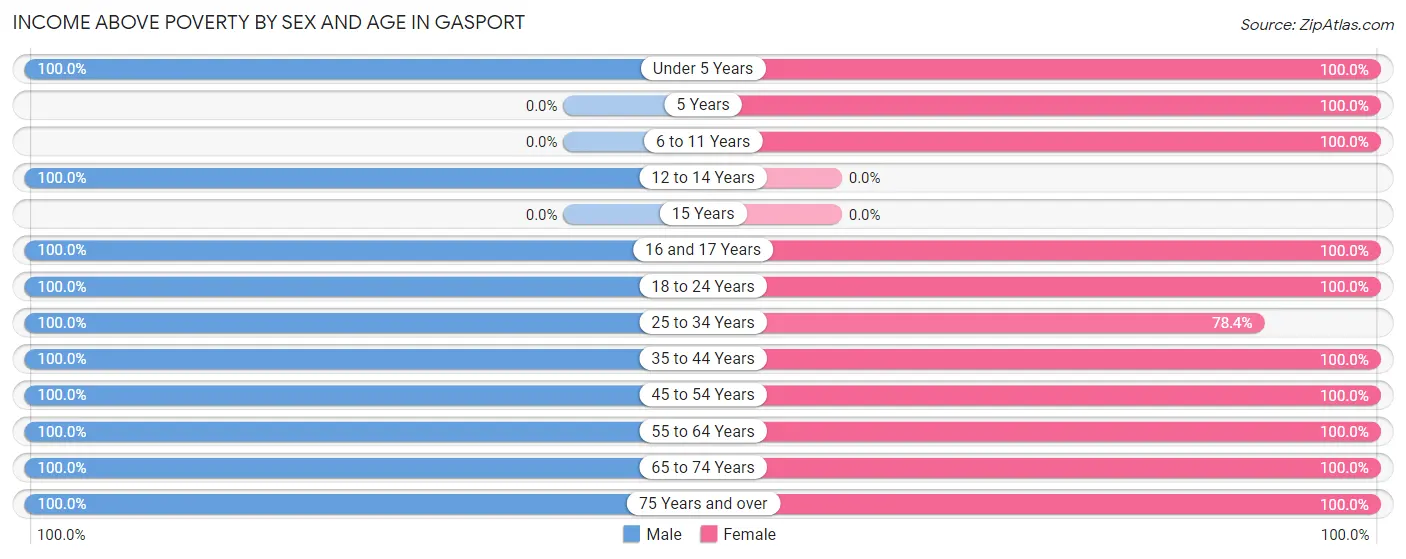
| Age Bracket | Male | Female |
| Under 5 Years | 49 (100.0%) | 82 (100.0%) |
| 5 Years | 0 (0.0%) | 30 (100.0%) |
| 6 to 11 Years | 0 (0.0%) | 53 (100.0%) |
| 12 to 14 Years | 25 (100.0%) | 0 (0.0%) |
| 15 Years | 0 (0.0%) | 0 (0.0%) |
| 16 and 17 Years | 18 (100.0%) | 5 (100.0%) |
| 18 to 24 Years | 45 (100.0%) | 166 (100.0%) |
| 25 to 34 Years | 123 (100.0%) | 80 (78.4%) |
| 35 to 44 Years | 58 (100.0%) | 49 (100.0%) |
| 45 to 54 Years | 74 (100.0%) | 171 (100.0%) |
| 55 to 64 Years | 98 (100.0%) | 55 (100.0%) |
| 65 to 74 Years | 17 (100.0%) | 86 (100.0%) |
| 75 Years and over | 14 (100.0%) | 15 (100.0%) |
| Total | 521 (100.0%) | 792 (97.3%) |
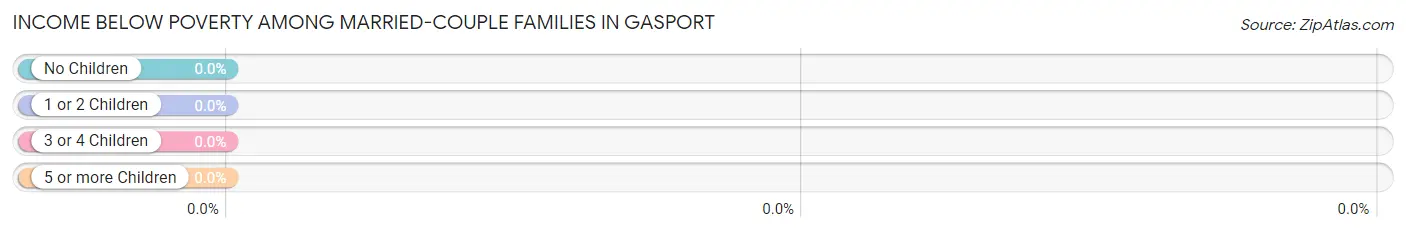
Income Below Poverty Among Married-Couple Families in Gasport
| Children | Above Poverty | Below Poverty |
| No Children | 87 (100.0%) | 0 (0.0%) |
| 1 or 2 Children | 94 (100.0%) | 0 (0.0%) |
| 3 or 4 Children | 32 (100.0%) | 0 (0.0%) |
| 5 or more Children | 0 (0.0%) | 0 (0.0%) |
| Total | 213 (100.0%) | 0 (0.0%) |
Income Below Poverty Among Single-Parent Households in Gasport
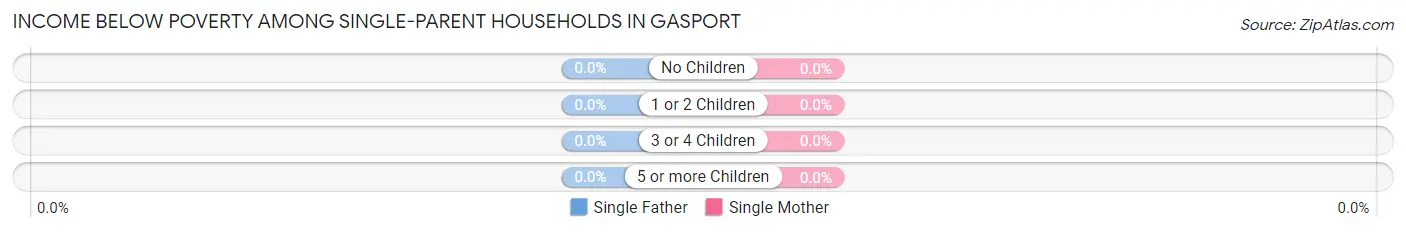
| Children | Single Father | Single Mother |
| No Children | 0 (0.0%) | 0 (0.0%) |
| 1 or 2 Children | 0 (0.0%) | 0 (0.0%) |
| 3 or 4 Children | 0 (0.0%) | 0 (0.0%) |
| 5 or more Children | 0 (0.0%) | 0 (0.0%) |
| Total | 0 (0.0%) | 0 (0.0%) |
Income Below Poverty Among Married-Couple vs Single-Parent Households in Gasport
| Children | Married-Couple Families | Single-Parent Households |
| No Children | 0 (0.0%) | 0 (0.0%) |
| 1 or 2 Children | 0 (0.0%) | 0 (0.0%) |
| 3 or 4 Children | 0 (0.0%) | 0 (0.0%) |
| 5 or more Children | 0 (0.0%) | 0 (0.0%) |
| Total | 0 (0.0%) | 0 (0.0%) |
Employment Characteristics in Gasport
Employment by Class of Employer in Gasport
Among the 723 employed individuals in Gasport, private company employees (433 | 59.9%), federal government employees (150 | 20.7%), and local government employees (72 | 10.0%) make up the most common classes of employment.
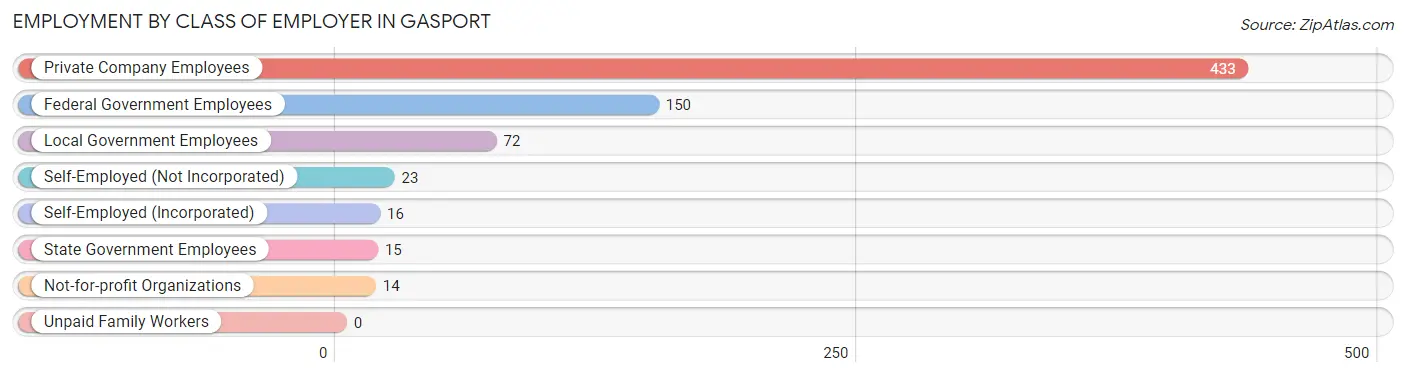
| Employer Class | # Employees | % Employees |
| Private Company Employees | 433 | 59.9% |
| Self-Employed (Incorporated) | 16 | 2.2% |
| Self-Employed (Not Incorporated) | 23 | 3.2% |
| Not-for-profit Organizations | 14 | 1.9% |
| Local Government Employees | 72 | 10.0% |
| State Government Employees | 15 | 2.1% |
| Federal Government Employees | 150 | 20.7% |
| Unpaid Family Workers | 0 | 0.0% |
| Total | 723 | 100.0% |
Employment Status by Age in Gasport
According to the labor force statistics for Gasport, out of the total population over 16 years of age (1,161), 69.8% or 810 individuals are in the labor force, with 7.2% or 58 of them unemployed. The age group with the highest labor force participation rate is 20 to 24 years, with 100.0% or 161 individuals in the labor force. Within the labor force, the 60 to 64 years age range has the highest percentage of unemployed individuals, with 56.3% or 40 of them being unemployed.
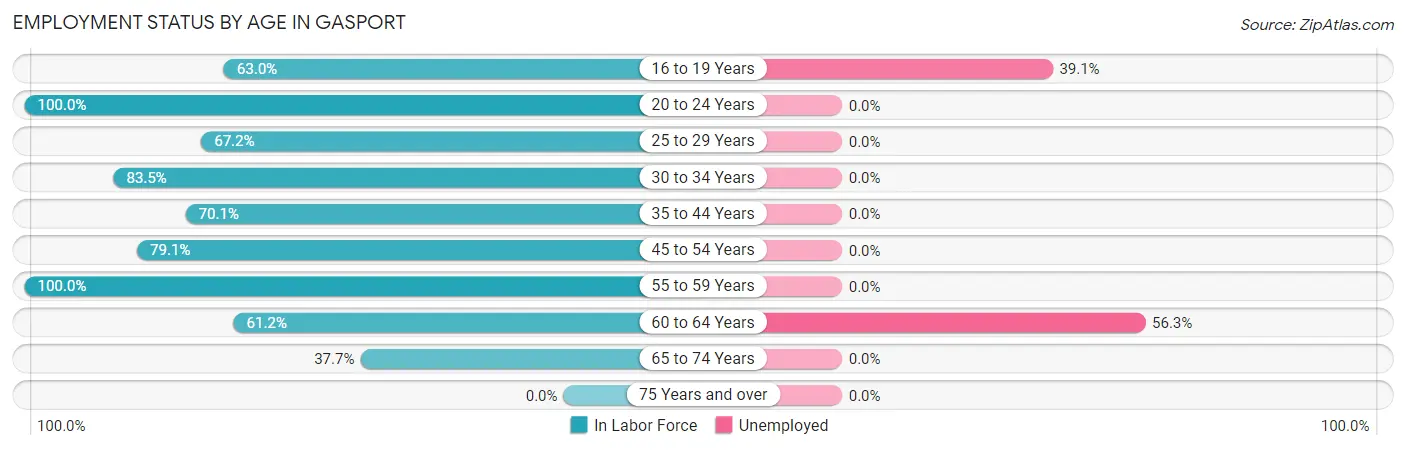
| Age Bracket | In Labor Force | Unemployed |
| 16 to 19 Years | 46 (63.0%) | 18 (39.1%) |
| 20 to 24 Years | 161 (100.0%) | 0 (0.0%) |
| 25 to 29 Years | 45 (67.2%) | 0 (0.0%) |
| 30 to 34 Years | 132 (83.5%) | 0 (0.0%) |
| 35 to 44 Years | 75 (70.1%) | 0 (0.0%) |
| 45 to 54 Years | 197 (79.1%) | 0 (0.0%) |
| 55 to 59 Years | 43 (100.0%) | 0 (0.0%) |
| 60 to 64 Years | 71 (61.2%) | 40 (56.3%) |
| 65 to 74 Years | 40 (37.7%) | 0 (0.0%) |
| 75 Years and over | 0 (0.0%) | 0 (0.0%) |
| Total | 810 (69.8%) | 58 (7.2%) |
Employment Status by Educational Attainment in Gasport
According to labor force statistics for Gasport, 76.1% of individuals (563) out of the total population between 25 and 64 years of age (740) are in the labor force, with 7.1% or 40 of them being unemployed. The group with the highest labor force participation rate are those with the educational attainment of bachelor's degree or higher, with 84.6% or 220 individuals in the labor force. Within the labor force, individuals with bachelor's degree or higher education have the highest percentage of unemployment, with 18.2% or 40 of them being unemployed.
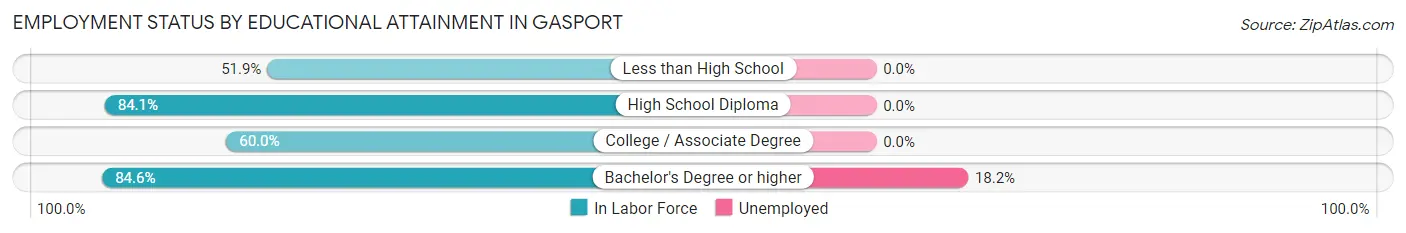
| Educational Attainment | In Labor Force | Unemployed |
| Less than High School | 28 (51.9%) | 0 (0.0%) |
| High School Diploma | 207 (84.1%) | 0 (0.0%) |
| College / Associate Degree | 108 (60.0%) | 0 (0.0%) |
| Bachelor's Degree or higher | 220 (84.6%) | 47 (18.2%) |
| Total | 563 (76.1%) | 53 (7.1%) |
Employment Occupations by Sex in Gasport
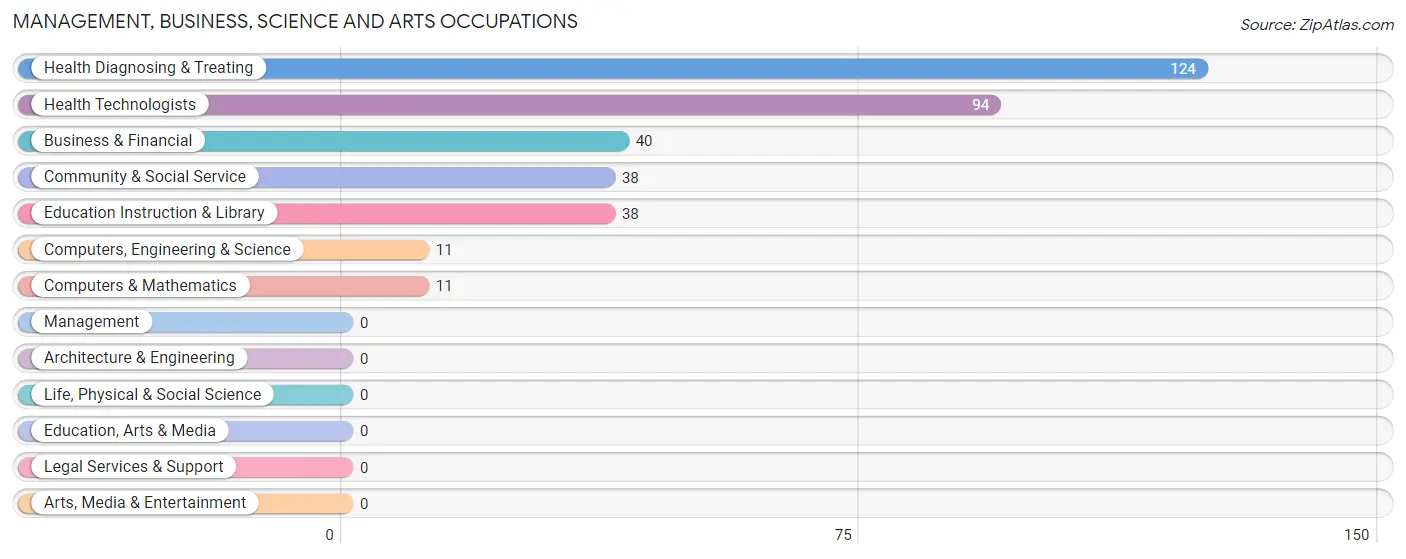
Management, Business, Science and Arts Occupations
The most common Management, Business, Science and Arts occupations in Gasport are Health Diagnosing & Treating (124 | 16.5%), Health Technologists (94 | 12.5%), Business & Financial (40 | 5.3%), Community & Social Service (38 | 5.1%), and Education Instruction & Library (38 | 5.1%).
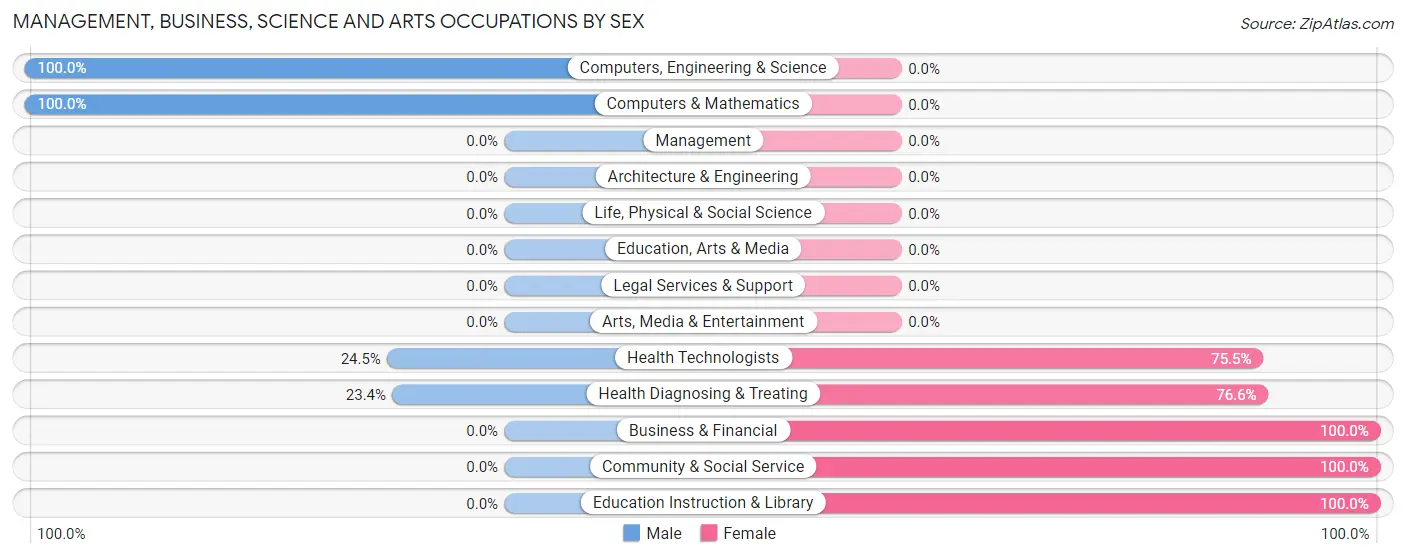
Management, Business, Science and Arts Occupations by Sex
Within the Management, Business, Science and Arts occupations in Gasport, the most male-oriented occupations are Computers, Engineering & Science (100.0%), Computers & Mathematics (100.0%), and Health Technologists (24.5%), while the most female-oriented occupations are Business & Financial (100.0%), Community & Social Service (100.0%), and Education Instruction & Library (100.0%).
| Occupation | Male | Female |
| Management | 0 (0.0%) | 0 (0.0%) |
| Business & Financial | 0 (0.0%) | 40 (100.0%) |
| Computers, Engineering & Science | 11 (100.0%) | 0 (0.0%) |
| Computers & Mathematics | 11 (100.0%) | 0 (0.0%) |
| Architecture & Engineering | 0 (0.0%) | 0 (0.0%) |
| Life, Physical & Social Science | 0 (0.0%) | 0 (0.0%) |
| Community & Social Service | 0 (0.0%) | 38 (100.0%) |
| Education, Arts & Media | 0 (0.0%) | 0 (0.0%) |
| Legal Services & Support | 0 (0.0%) | 0 (0.0%) |
| Education Instruction & Library | 0 (0.0%) | 38 (100.0%) |
| Arts, Media & Entertainment | 0 (0.0%) | 0 (0.0%) |
| Health Diagnosing & Treating | 29 (23.4%) | 95 (76.6%) |
| Health Technologists | 23 (24.5%) | 71 (75.5%) |
| Total (Category) | 40 (18.8%) | 173 (81.2%) |
| Total (Overall) | 306 (40.7%) | 446 (59.3%) |
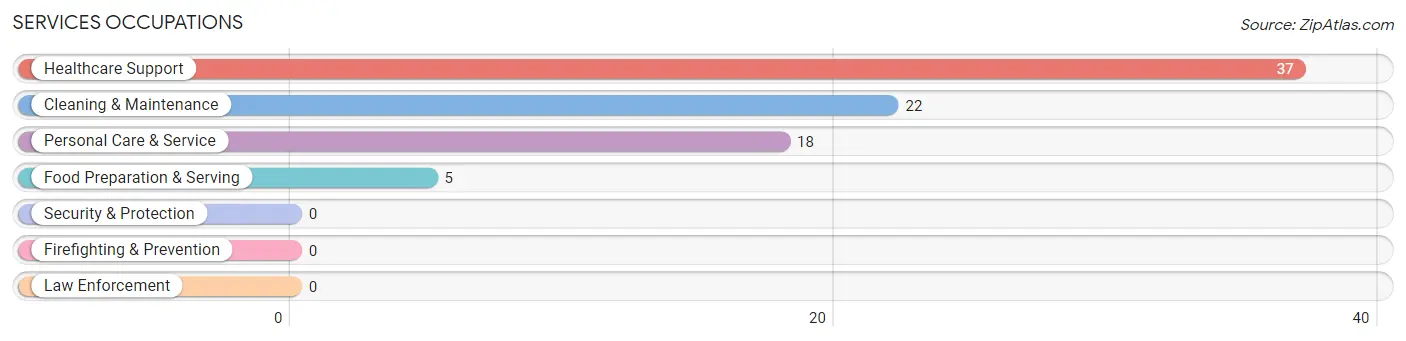
Services Occupations
The most common Services occupations in Gasport are Healthcare Support (37 | 4.9%), Cleaning & Maintenance (22 | 2.9%), Personal Care & Service (18 | 2.4%), and Food Preparation & Serving (5 | 0.7%).
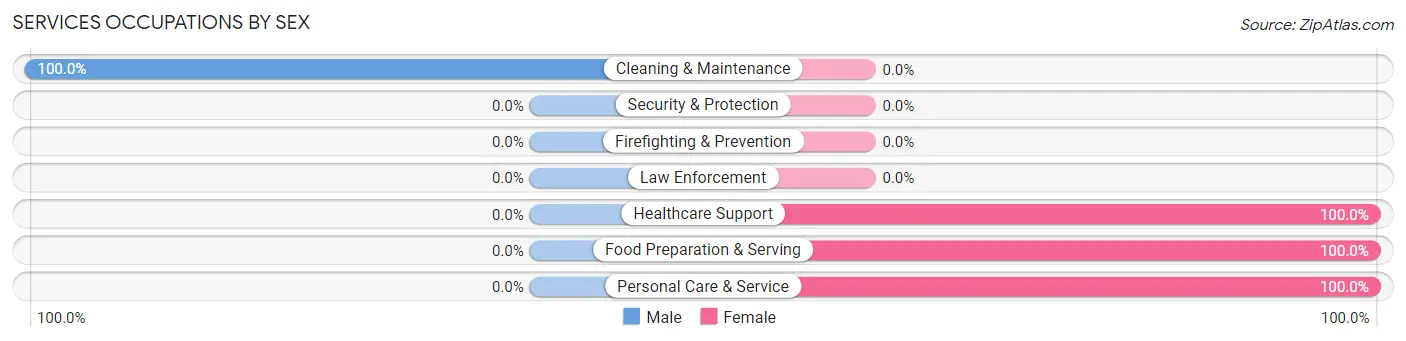
Services Occupations by Sex
| Occupation | Male | Female |
| Healthcare Support | 0 (0.0%) | 37 (100.0%) |
| Security & Protection | 0 (0.0%) | 0 (0.0%) |
| Firefighting & Prevention | 0 (0.0%) | 0 (0.0%) |
| Law Enforcement | 0 (0.0%) | 0 (0.0%) |
| Food Preparation & Serving | 0 (0.0%) | 5 (100.0%) |
| Cleaning & Maintenance | 22 (100.0%) | 0 (0.0%) |
| Personal Care & Service | 0 (0.0%) | 18 (100.0%) |
| Total (Category) | 22 (26.8%) | 60 (73.2%) |
| Total (Overall) | 306 (40.7%) | 446 (59.3%) |
Sales and Office Occupations
The most common Sales and Office occupations in Gasport are Office & Administration (143 | 19.0%), and Sales & Related (66 | 8.8%).
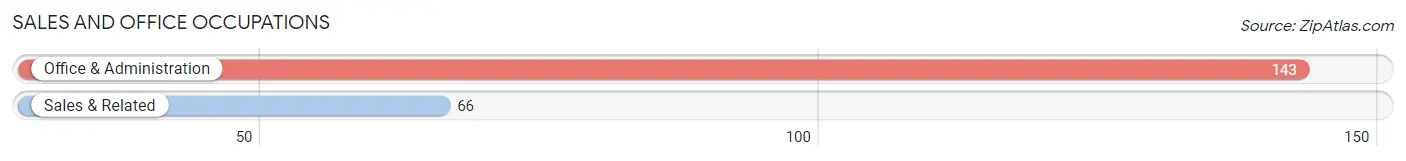
Sales and Office Occupations by Sex

| Occupation | Male | Female |
| Sales & Related | 38 (57.6%) | 28 (42.4%) |
| Office & Administration | 0 (0.0%) | 143 (100.0%) |
| Total (Category) | 38 (18.2%) | 171 (81.8%) |
| Total (Overall) | 306 (40.7%) | 446 (59.3%) |
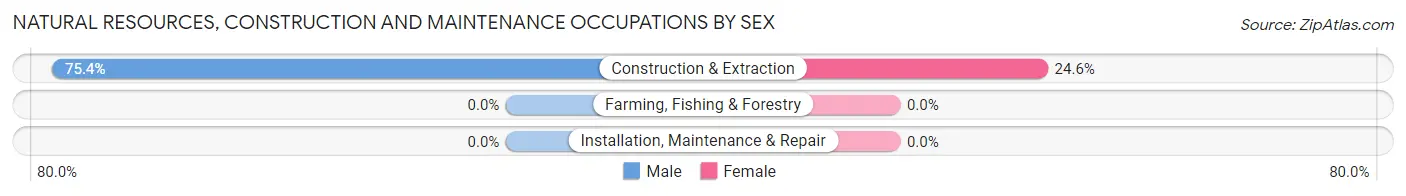
Natural Resources, Construction and Maintenance Occupations
The most common Natural Resources, Construction and Maintenance occupations in Gasport are , and Construction & Extraction (61 | 8.1%).

Natural Resources, Construction and Maintenance Occupations by Sex
| Occupation | Male | Female |
| Farming, Fishing & Forestry | 0 (0.0%) | 0 (0.0%) |
| Construction & Extraction | 46 (75.4%) | 15 (24.6%) |
| Installation, Maintenance & Repair | 0 (0.0%) | 0 (0.0%) |
| Total (Category) | 46 (75.4%) | 15 (24.6%) |
| Total (Overall) | 306 (40.7%) | 446 (59.3%) |
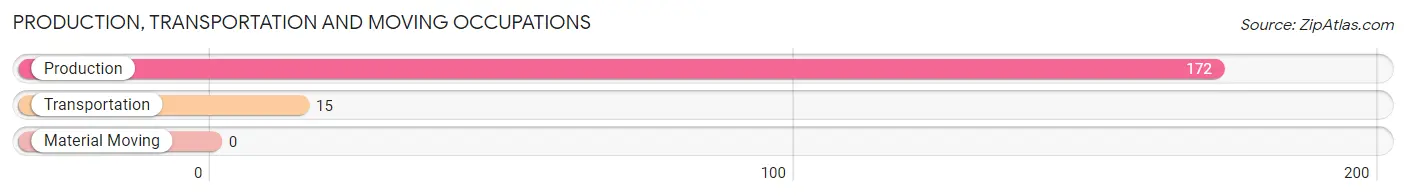
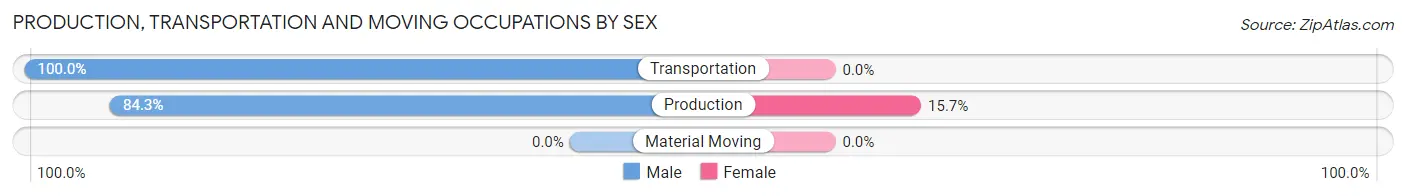
Production, Transportation and Moving Occupations
The most common Production, Transportation and Moving occupations in Gasport are Production (172 | 22.9%), and Transportation (15 | 2.0%).
Production, Transportation and Moving Occupations by Sex
| Occupation | Male | Female |
| Production | 145 (84.3%) | 27 (15.7%) |
| Transportation | 15 (100.0%) | 0 (0.0%) |
| Material Moving | 0 (0.0%) | 0 (0.0%) |
| Total (Category) | 160 (85.6%) | 27 (14.4%) |
| Total (Overall) | 306 (40.7%) | 446 (59.3%) |
Employment Industries by Sex in Gasport
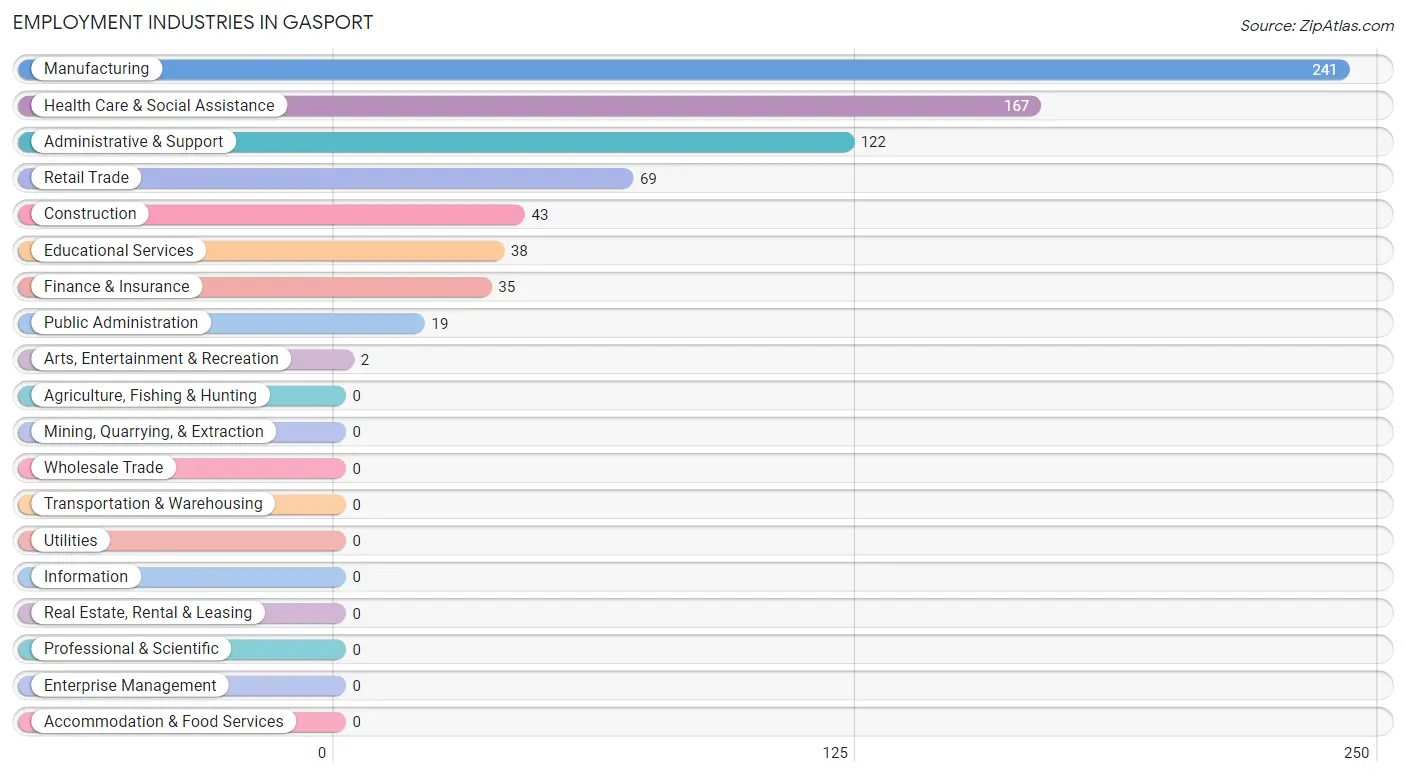
Employment Industries in Gasport
The major employment industries in Gasport include Manufacturing (241 | 32.1%), Health Care & Social Assistance (167 | 22.2%), Administrative & Support (122 | 16.2%), Retail Trade (69 | 9.2%), and Construction (43 | 5.7%).
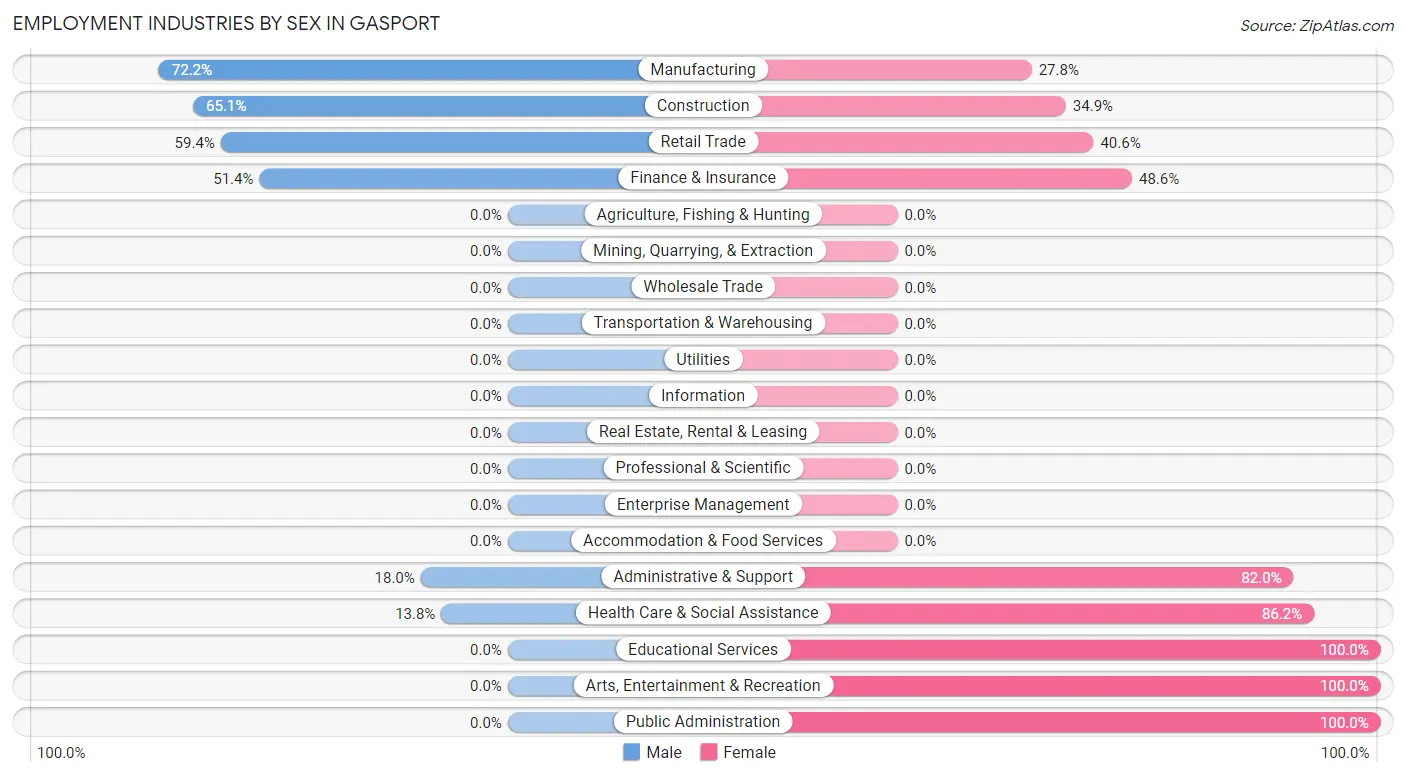
Employment Industries by Sex in Gasport
The Gasport industries that see more men than women are Manufacturing (72.2%), Construction (65.1%), and Retail Trade (59.4%), whereas the industries that tend to have a higher number of women are Educational Services (100.0%), Arts, Entertainment & Recreation (100.0%), and Public Administration (100.0%).
| Industry | Male | Female |
| Agriculture, Fishing & Hunting | 0 (0.0%) | 0 (0.0%) |
| Mining, Quarrying, & Extraction | 0 (0.0%) | 0 (0.0%) |
| Construction | 28 (65.1%) | 15 (34.9%) |
| Manufacturing | 174 (72.2%) | 67 (27.8%) |
| Wholesale Trade | 0 (0.0%) | 0 (0.0%) |
| Retail Trade | 41 (59.4%) | 28 (40.6%) |
| Transportation & Warehousing | 0 (0.0%) | 0 (0.0%) |
| Utilities | 0 (0.0%) | 0 (0.0%) |
| Information | 0 (0.0%) | 0 (0.0%) |
| Finance & Insurance | 18 (51.4%) | 17 (48.6%) |
| Real Estate, Rental & Leasing | 0 (0.0%) | 0 (0.0%) |
| Professional & Scientific | 0 (0.0%) | 0 (0.0%) |
| Enterprise Management | 0 (0.0%) | 0 (0.0%) |
| Administrative & Support | 22 (18.0%) | 100 (82.0%) |
| Educational Services | 0 (0.0%) | 38 (100.0%) |
| Health Care & Social Assistance | 23 (13.8%) | 144 (86.2%) |
| Arts, Entertainment & Recreation | 0 (0.0%) | 2 (100.0%) |
| Accommodation & Food Services | 0 (0.0%) | 0 (0.0%) |
| Public Administration | 0 (0.0%) | 19 (100.0%) |
| Total | 306 (40.7%) | 446 (59.3%) |
Education in Gasport
School Enrollment in Gasport
The most common levels of schooling among the 143 students in Gasport are middle school (78 | 54.5%), high school (35 | 24.5%), and college / undergraduate (30 | 21.0%).

| School Level | # Students | % Students |
| Nursery / Preschool | 0 | 0.0% |
| Kindergarten | 0 | 0.0% |
| Elementary School | 0 | 0.0% |
| Middle School | 78 | 54.5% |
| High School | 35 | 24.5% |
| College / Undergraduate | 30 | 21.0% |
| Graduate / Professional | 0 | 0.0% |
| Total | 143 | 100.0% |
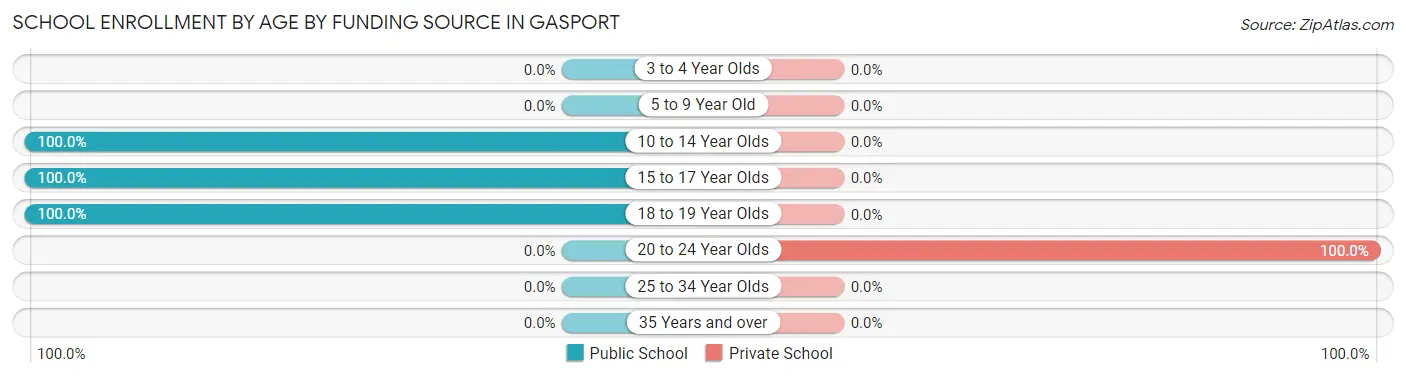
School Enrollment by Age by Funding Source in Gasport
Out of a total of 143 students who are enrolled in schools in Gasport, 15 (10.5%) attend a private institution, while the remaining 128 (89.5%) are enrolled in public schools. The age group of 20 to 24 year olds has the highest likelihood of being enrolled in private schools, with 15 (100.0% in the age bracket) enrolled. Conversely, the age group of 10 to 14 year olds has the lowest likelihood of being enrolled in a private school, with 78 (100.0% in the age bracket) attending a public institution.
| Age Bracket | Public School | Private School |
| 3 to 4 Year Olds | 0 (0.0%) | 0 (0.0%) |
| 5 to 9 Year Old | 0 (0.0%) | 0 (0.0%) |
| 10 to 14 Year Olds | 78 (100.0%) | 0 (0.0%) |
| 15 to 17 Year Olds | 23 (100.0%) | 0 (0.0%) |
| 18 to 19 Year Olds | 27 (100.0%) | 0 (0.0%) |
| 20 to 24 Year Olds | 0 (0.0%) | 15 (100.0%) |
| 25 to 34 Year Olds | 0 (0.0%) | 0 (0.0%) |
| 35 Years and over | 0 (0.0%) | 0 (0.0%) |
| Total | 128 (89.5%) | 15 (10.5%) |
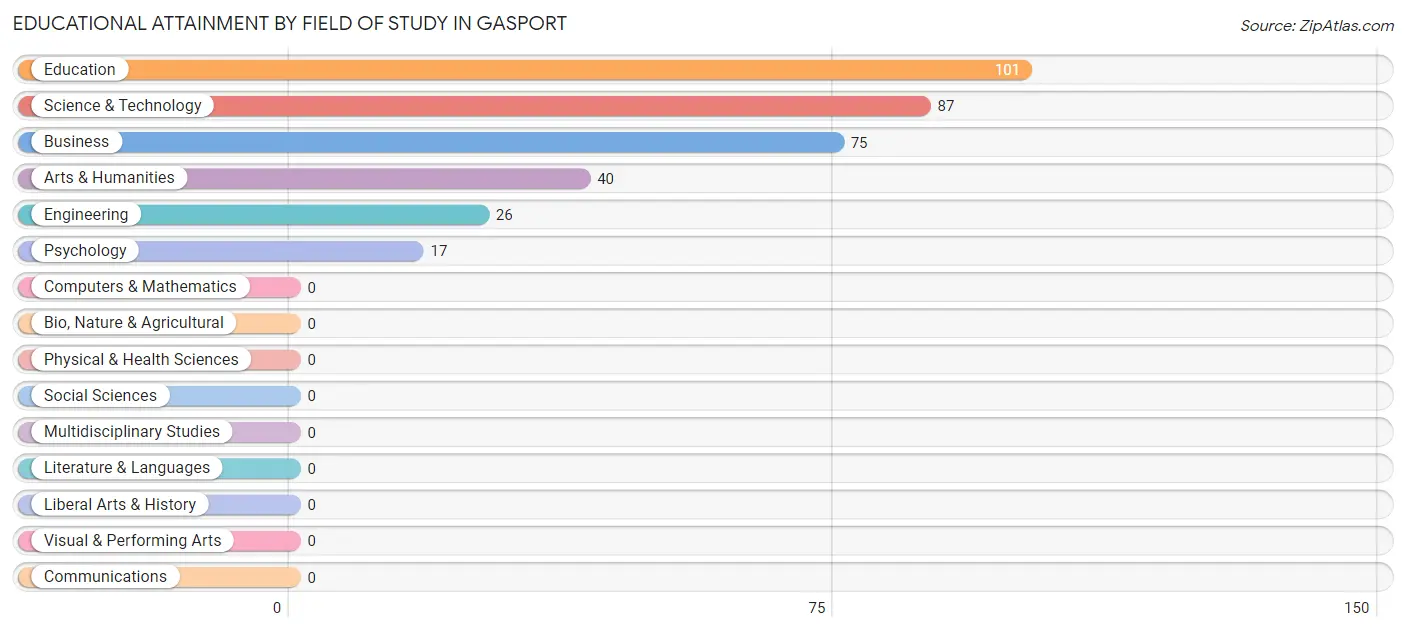
Educational Attainment by Field of Study in Gasport
Education (101 | 29.2%), science & technology (87 | 25.1%), business (75 | 21.7%), arts & humanities (40 | 11.6%), and engineering (26 | 7.5%) are the most common fields of study among 346 individuals in Gasport who have obtained a bachelor's degree or higher.
| Field of Study | # Graduates | % Graduates |
| Computers & Mathematics | 0 | 0.0% |
| Bio, Nature & Agricultural | 0 | 0.0% |
| Physical & Health Sciences | 0 | 0.0% |
| Psychology | 17 | 4.9% |
| Social Sciences | 0 | 0.0% |
| Engineering | 26 | 7.5% |
| Multidisciplinary Studies | 0 | 0.0% |
| Science & Technology | 87 | 25.1% |
| Business | 75 | 21.7% |
| Education | 101 | 29.2% |
| Literature & Languages | 0 | 0.0% |
| Liberal Arts & History | 0 | 0.0% |
| Visual & Performing Arts | 0 | 0.0% |
| Communications | 0 | 0.0% |
| Arts & Humanities | 40 | 11.6% |
| Total | 346 | 100.0% |
Transportation & Commute in Gasport
Vehicle Availability by Sex in Gasport
The most prevalent vehicle ownership categories in Gasport are males with 2 vehicles (116, accounting for 37.9%) and females with 2 vehicles (48, making up 28.0%).
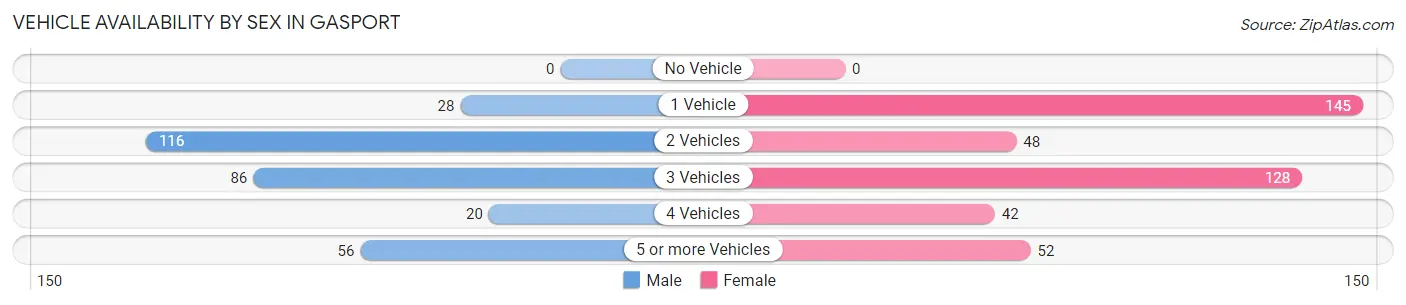
| Vehicles Available | Male | Female |
| No Vehicle | 0 (0.0%) | 0 (0.0%) |
| 1 Vehicle | 28 (9.1%) | 145 (34.9%) |
| 2 Vehicles | 116 (37.9%) | 48 (11.6%) |
| 3 Vehicles | 86 (28.1%) | 128 (30.8%) |
| 4 Vehicles | 20 (6.5%) | 42 (10.1%) |
| 5 or more Vehicles | 56 (18.3%) | 52 (12.5%) |
| Total | 306 (100.0%) | 415 (100.0%) |
Commute Time in Gasport
The most frequently occuring commute durations in Gasport are 10 to 14 minutes (196 commuters, 28.4%), 45 to 59 minutes (161 commuters, 23.3%), and 15 to 19 minutes (99 commuters, 14.3%).
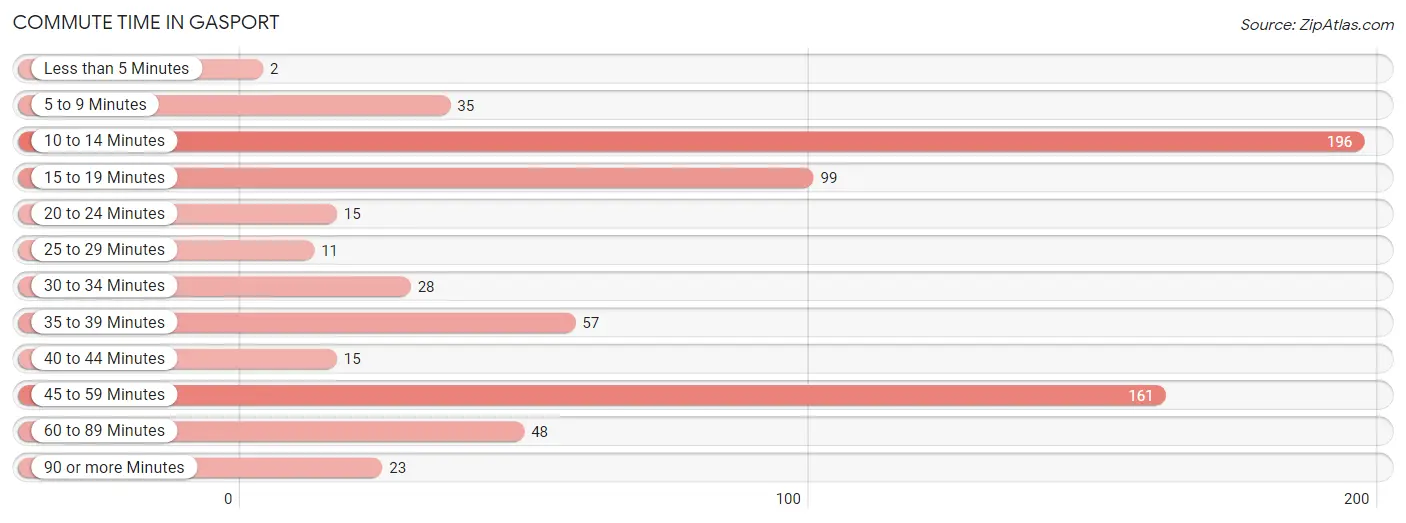
| Commute Time | # Commuters | % Commuters |
| Less than 5 Minutes | 2 | 0.3% |
| 5 to 9 Minutes | 35 | 5.1% |
| 10 to 14 Minutes | 196 | 28.4% |
| 15 to 19 Minutes | 99 | 14.3% |
| 20 to 24 Minutes | 15 | 2.2% |
| 25 to 29 Minutes | 11 | 1.6% |
| 30 to 34 Minutes | 28 | 4.1% |
| 35 to 39 Minutes | 57 | 8.3% |
| 40 to 44 Minutes | 15 | 2.2% |
| 45 to 59 Minutes | 161 | 23.3% |
| 60 to 89 Minutes | 48 | 7.0% |
| 90 or more Minutes | 23 | 3.3% |
Commute Time by Sex in Gasport
The most common commute times in Gasport are 45 to 59 minutes (118 commuters, 38.6%) for males and 10 to 14 minutes (185 commuters, 48.2%) for females.
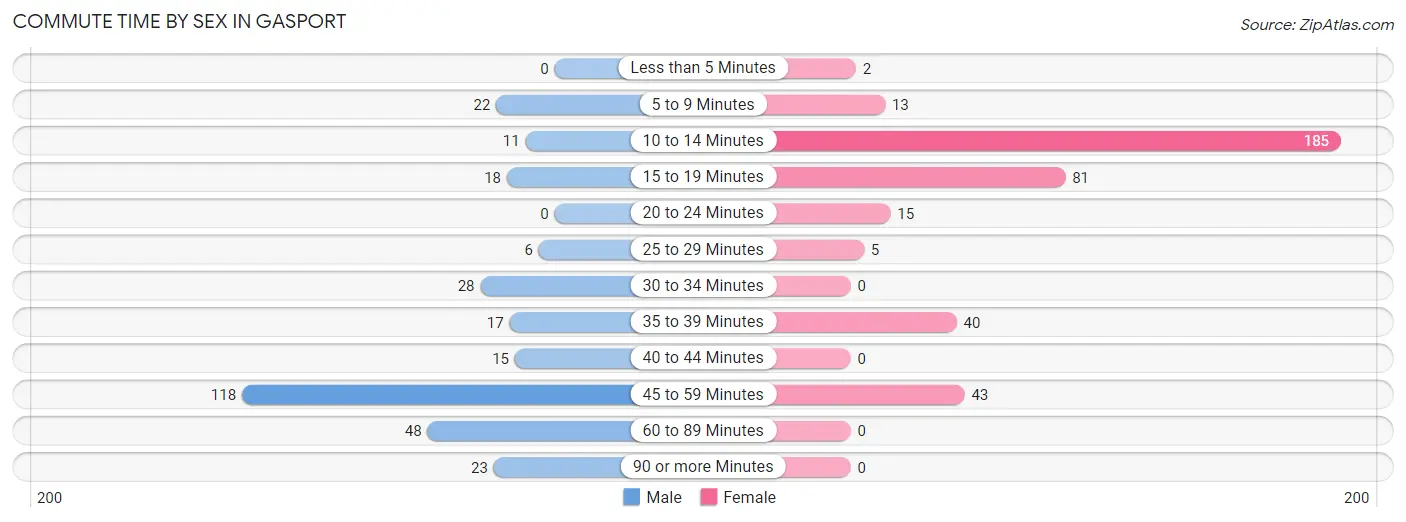
| Commute Time | Male | Female |
| Less than 5 Minutes | 0 (0.0%) | 2 (0.5%) |
| 5 to 9 Minutes | 22 (7.2%) | 13 (3.4%) |
| 10 to 14 Minutes | 11 (3.6%) | 185 (48.2%) |
| 15 to 19 Minutes | 18 (5.9%) | 81 (21.1%) |
| 20 to 24 Minutes | 0 (0.0%) | 15 (3.9%) |
| 25 to 29 Minutes | 6 (2.0%) | 5 (1.3%) |
| 30 to 34 Minutes | 28 (9.1%) | 0 (0.0%) |
| 35 to 39 Minutes | 17 (5.6%) | 40 (10.4%) |
| 40 to 44 Minutes | 15 (4.9%) | 0 (0.0%) |
| 45 to 59 Minutes | 118 (38.6%) | 43 (11.2%) |
| 60 to 89 Minutes | 48 (15.7%) | 0 (0.0%) |
| 90 or more Minutes | 23 (7.5%) | 0 (0.0%) |
Time of Departure to Work by Sex in Gasport
The most frequent times of departure to work in Gasport are 4:00 PM to 11:59 PM (106, 34.6%) for males and 8:00 AM to 8:29 AM (100, 26.0%) for females.
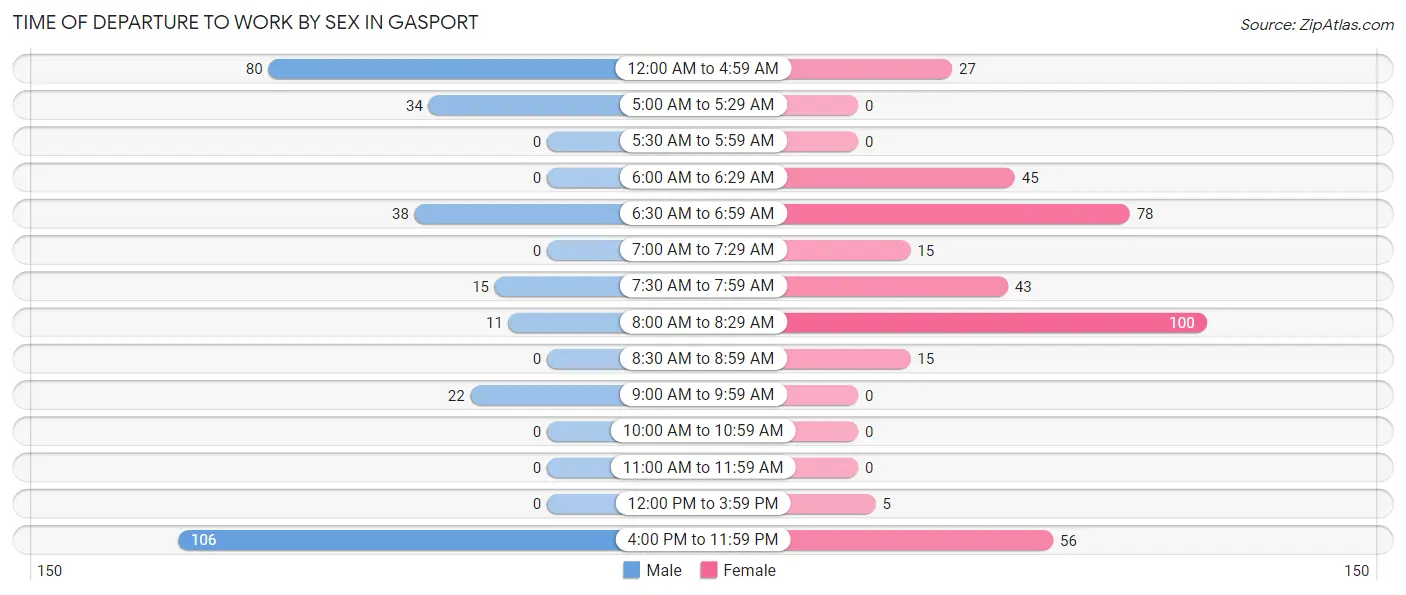
| Time of Departure | Male | Female |
| 12:00 AM to 4:59 AM | 80 (26.1%) | 27 (7.0%) |
| 5:00 AM to 5:29 AM | 34 (11.1%) | 0 (0.0%) |
| 5:30 AM to 5:59 AM | 0 (0.0%) | 0 (0.0%) |
| 6:00 AM to 6:29 AM | 0 (0.0%) | 45 (11.7%) |
| 6:30 AM to 6:59 AM | 38 (12.4%) | 78 (20.3%) |
| 7:00 AM to 7:29 AM | 0 (0.0%) | 15 (3.9%) |
| 7:30 AM to 7:59 AM | 15 (4.9%) | 43 (11.2%) |
| 8:00 AM to 8:29 AM | 11 (3.6%) | 100 (26.0%) |
| 8:30 AM to 8:59 AM | 0 (0.0%) | 15 (3.9%) |
| 9:00 AM to 9:59 AM | 22 (7.2%) | 0 (0.0%) |
| 10:00 AM to 10:59 AM | 0 (0.0%) | 0 (0.0%) |
| 11:00 AM to 11:59 AM | 0 (0.0%) | 0 (0.0%) |
| 12:00 PM to 3:59 PM | 0 (0.0%) | 5 (1.3%) |
| 4:00 PM to 11:59 PM | 106 (34.6%) | 56 (14.6%) |
| Total | 306 (100.0%) | 384 (100.0%) |
Housing Occupancy in Gasport
Occupancy by Ownership in Gasport
Of the total 567 dwellings in Gasport, owner-occupied units account for 534 (94.2%), while renter-occupied units make up 33 (5.8%).
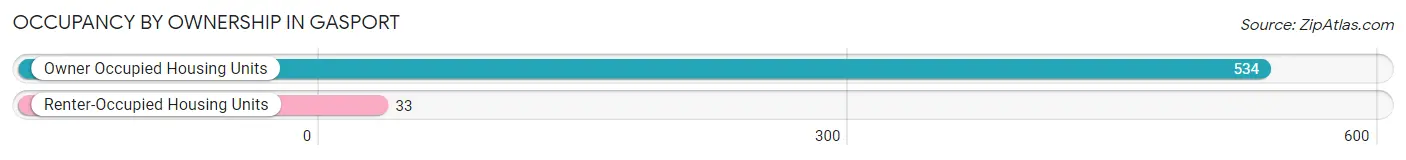
| Occupancy | # Housing Units | % Housing Units |
| Owner Occupied Housing Units | 534 | 94.2% |
| Renter-Occupied Housing Units | 33 | 5.8% |
| Total Occupied Housing Units | 567 | 100.0% |
Occupancy by Household Size in Gasport
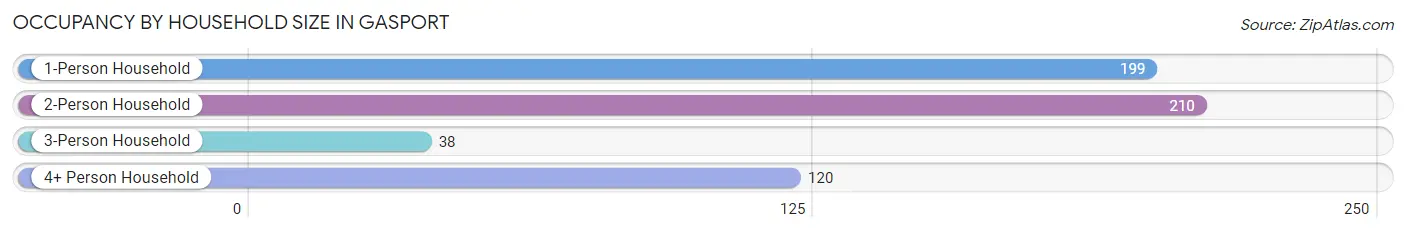
| Household Size | # Housing Units | % Housing Units |
| 1-Person Household | 199 | 35.1% |
| 2-Person Household | 210 | 37.0% |
| 3-Person Household | 38 | 6.7% |
| 4+ Person Household | 120 | 21.2% |
| Total Housing Units | 567 | 100.0% |
Occupancy by Ownership by Household Size in Gasport
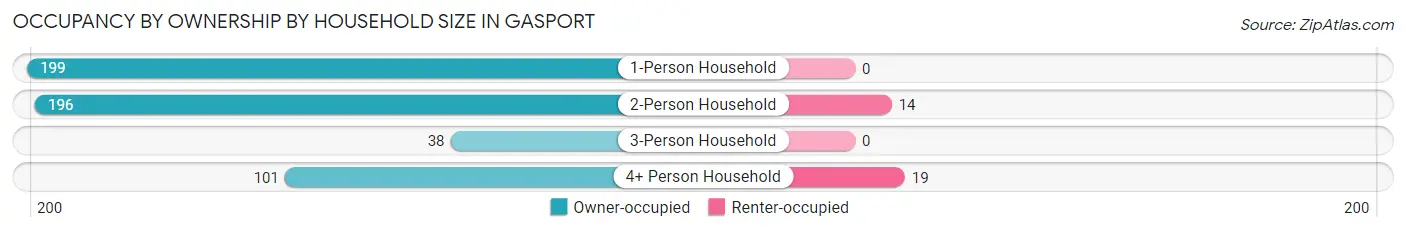
| Household Size | Owner-occupied | Renter-occupied |
| 1-Person Household | 199 (100.0%) | 0 (0.0%) |
| 2-Person Household | 196 (93.3%) | 14 (6.7%) |
| 3-Person Household | 38 (100.0%) | 0 (0.0%) |
| 4+ Person Household | 101 (84.2%) | 19 (15.8%) |
| Total Housing Units | 534 (94.2%) | 33 (5.8%) |
Occupancy by Educational Attainment in Gasport
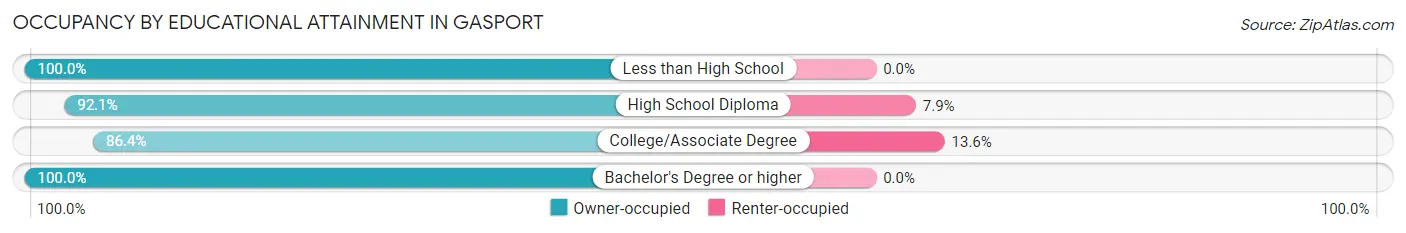
| Household Size | Owner-occupied | Renter-occupied |
| Less than High School | 39 (100.0%) | 0 (0.0%) |
| High School Diploma | 164 (92.1%) | 14 (7.9%) |
| College/Associate Degree | 121 (86.4%) | 19 (13.6%) |
| Bachelor's Degree or higher | 210 (100.0%) | 0 (0.0%) |
Occupancy by Age of Householder in Gasport
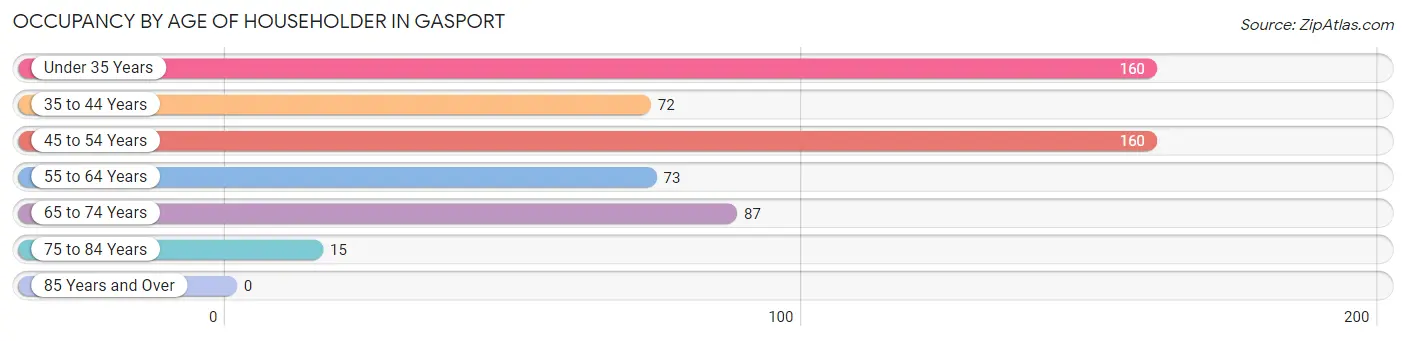
| Age Bracket | # Households | % Households |
| Under 35 Years | 160 | 28.2% |
| 35 to 44 Years | 72 | 12.7% |
| 45 to 54 Years | 160 | 28.2% |
| 55 to 64 Years | 73 | 12.9% |
| 65 to 74 Years | 87 | 15.3% |
| 75 to 84 Years | 15 | 2.6% |
| 85 Years and Over | 0 | 0.0% |
| Total | 567 | 100.0% |
Housing Finances in Gasport
Median Income by Occupancy in Gasport
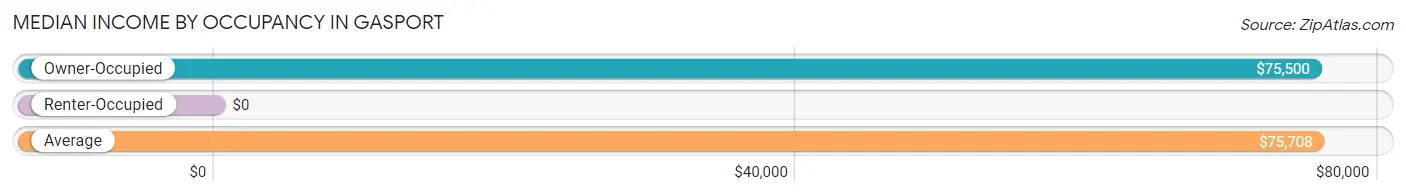
| Occupancy Type | # Households | Median Income |
| Owner-Occupied | 534 (94.2%) | $75,500 |
| Renter-Occupied | 33 (5.8%) | $0 |
| Average | 567 (100.0%) | $75,708 |
Occupancy by Householder Income Bracket in Gasport
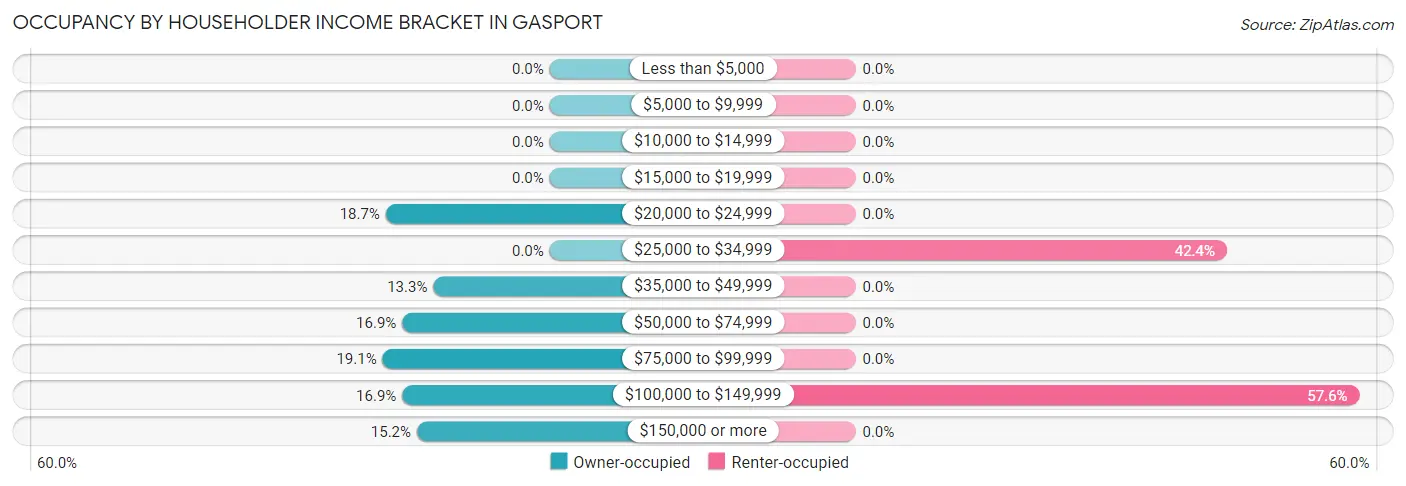
| Income Bracket | Owner-occupied | Renter-occupied |
| Less than $5,000 | 0 (0.0%) | 0 (0.0%) |
| $5,000 to $9,999 | 0 (0.0%) | 0 (0.0%) |
| $10,000 to $14,999 | 0 (0.0%) | 0 (0.0%) |
| $15,000 to $19,999 | 0 (0.0%) | 0 (0.0%) |
| $20,000 to $24,999 | 100 (18.7%) | 0 (0.0%) |
| $25,000 to $34,999 | 0 (0.0%) | 14 (42.4%) |
| $35,000 to $49,999 | 71 (13.3%) | 0 (0.0%) |
| $50,000 to $74,999 | 90 (16.9%) | 0 (0.0%) |
| $75,000 to $99,999 | 102 (19.1%) | 0 (0.0%) |
| $100,000 to $149,999 | 90 (16.9%) | 19 (57.6%) |
| $150,000 or more | 81 (15.2%) | 0 (0.0%) |
| Total | 534 (100.0%) | 33 (100.0%) |
Monthly Housing Cost Tiers in Gasport
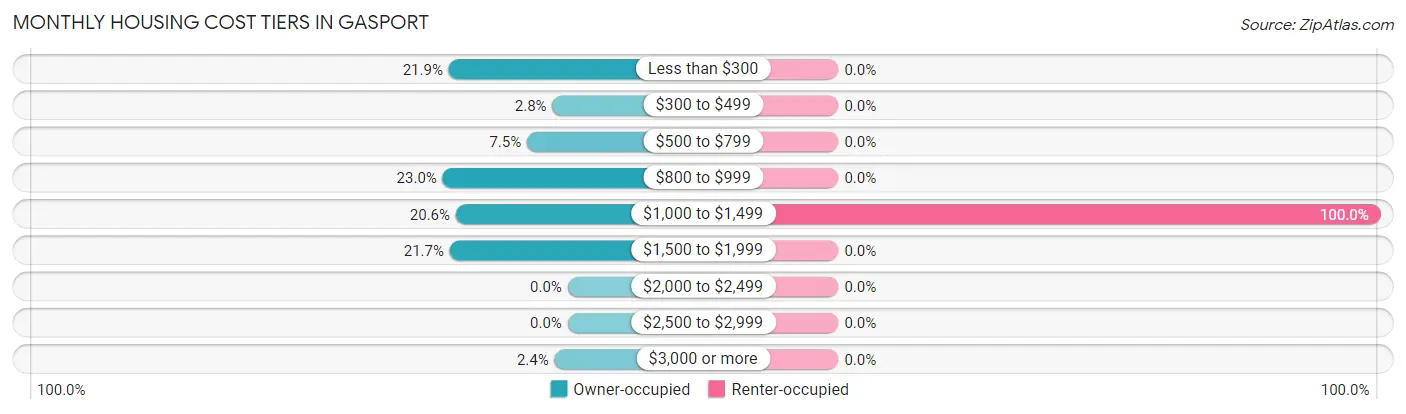
| Monthly Cost | Owner-occupied | Renter-occupied |
| Less than $300 | 117 (21.9%) | 0 (0.0%) |
| $300 to $499 | 15 (2.8%) | 0 (0.0%) |
| $500 to $799 | 40 (7.5%) | 0 (0.0%) |
| $800 to $999 | 123 (23.0%) | 0 (0.0%) |
| $1,000 to $1,499 | 110 (20.6%) | 33 (100.0%) |
| $1,500 to $1,999 | 116 (21.7%) | 0 (0.0%) |
| $2,000 to $2,499 | 0 (0.0%) | 0 (0.0%) |
| $2,500 to $2,999 | 0 (0.0%) | 0 (0.0%) |
| $3,000 or more | 13 (2.4%) | 0 (0.0%) |
| Total | 534 (100.0%) | 33 (100.0%) |
Physical Housing Characteristics in Gasport
Housing Structures in Gasport
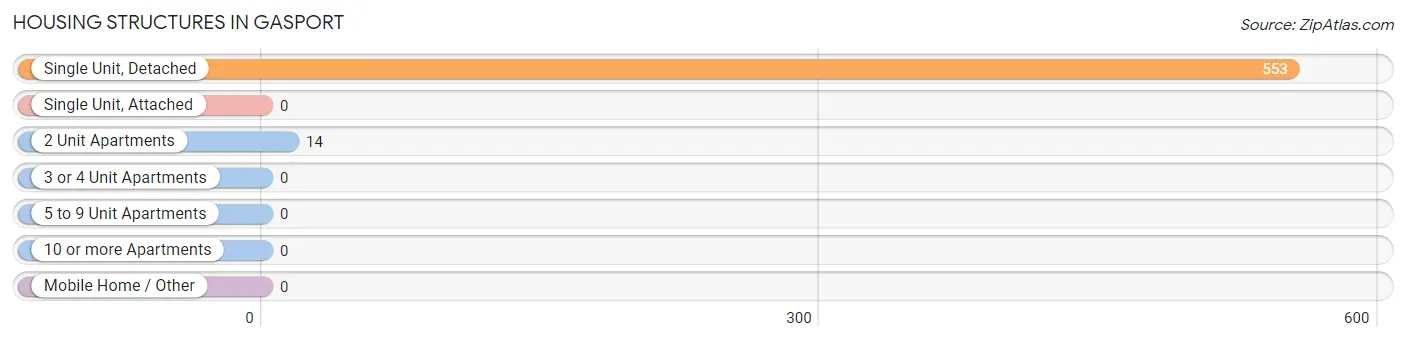
| Structure Type | # Housing Units | % Housing Units |
| Single Unit, Detached | 553 | 97.5% |
| Single Unit, Attached | 0 | 0.0% |
| 2 Unit Apartments | 14 | 2.5% |
| 3 or 4 Unit Apartments | 0 | 0.0% |
| 5 to 9 Unit Apartments | 0 | 0.0% |
| 10 or more Apartments | 0 | 0.0% |
| Mobile Home / Other | 0 | 0.0% |
| Total | 567 | 100.0% |
Housing Structures by Occupancy in Gasport
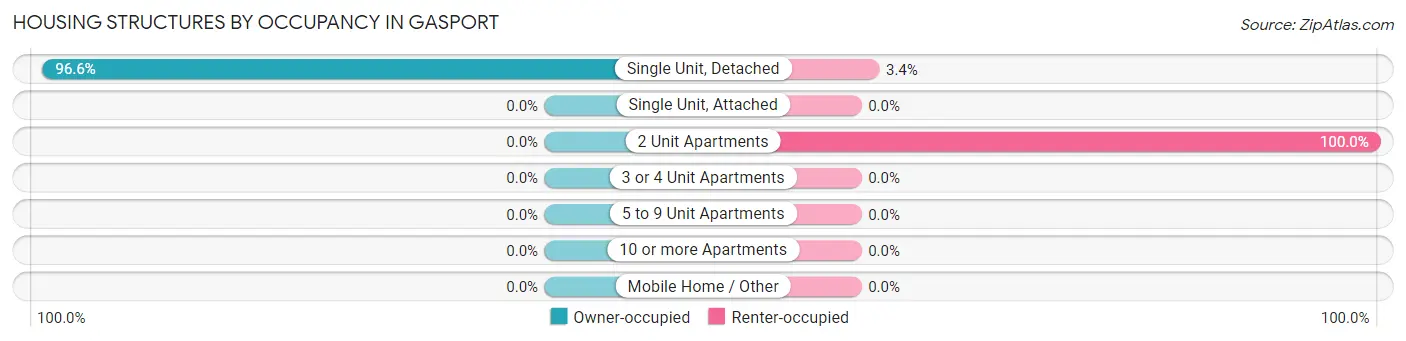
| Structure Type | Owner-occupied | Renter-occupied |
| Single Unit, Detached | 534 (96.6%) | 19 (3.4%) |
| Single Unit, Attached | 0 (0.0%) | 0 (0.0%) |
| 2 Unit Apartments | 0 (0.0%) | 14 (100.0%) |
| 3 or 4 Unit Apartments | 0 (0.0%) | 0 (0.0%) |
| 5 to 9 Unit Apartments | 0 (0.0%) | 0 (0.0%) |
| 10 or more Apartments | 0 (0.0%) | 0 (0.0%) |
| Mobile Home / Other | 0 (0.0%) | 0 (0.0%) |
| Total | 534 (94.2%) | 33 (5.8%) |
Housing Structures by Number of Rooms in Gasport
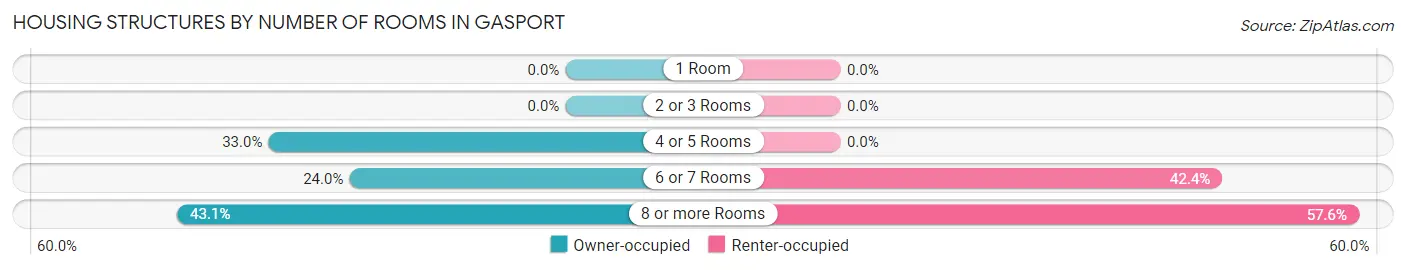
| Number of Rooms | Owner-occupied | Renter-occupied |
| 1 Room | 0 (0.0%) | 0 (0.0%) |
| 2 or 3 Rooms | 0 (0.0%) | 0 (0.0%) |
| 4 or 5 Rooms | 176 (33.0%) | 0 (0.0%) |
| 6 or 7 Rooms | 128 (24.0%) | 14 (42.4%) |
| 8 or more Rooms | 230 (43.1%) | 19 (57.6%) |
| Total | 534 (100.0%) | 33 (100.0%) |
Housing Structure by Heating Type in Gasport
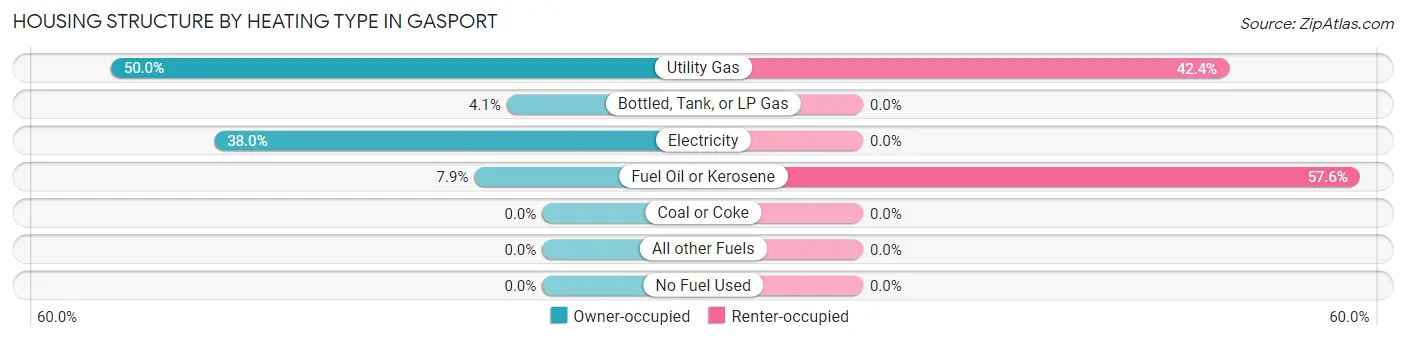
| Heating Type | Owner-occupied | Renter-occupied |
| Utility Gas | 267 (50.0%) | 14 (42.4%) |
| Bottled, Tank, or LP Gas | 22 (4.1%) | 0 (0.0%) |
| Electricity | 203 (38.0%) | 0 (0.0%) |
| Fuel Oil or Kerosene | 42 (7.9%) | 19 (57.6%) |
| Coal or Coke | 0 (0.0%) | 0 (0.0%) |
| All other Fuels | 0 (0.0%) | 0 (0.0%) |
| No Fuel Used | 0 (0.0%) | 0 (0.0%) |
| Total | 534 (100.0%) | 33 (100.0%) |
Household Vehicle Usage in Gasport
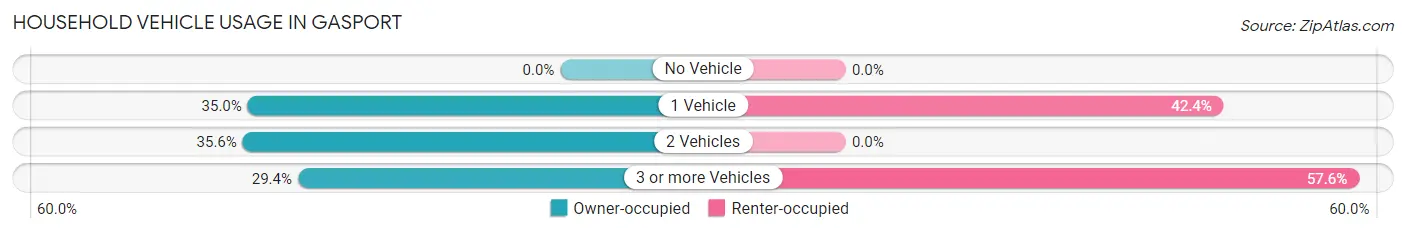
| Vehicles per Household | Owner-occupied | Renter-occupied |
| No Vehicle | 0 (0.0%) | 0 (0.0%) |
| 1 Vehicle | 187 (35.0%) | 14 (42.4%) |
| 2 Vehicles | 190 (35.6%) | 0 (0.0%) |
| 3 or more Vehicles | 157 (29.4%) | 19 (57.6%) |
| Total | 534 (100.0%) | 33 (100.0%) |
Real Estate & Mortgages in Gasport
Real Estate and Mortgage Overview in Gasport
| Characteristic | Without Mortgage | With Mortgage |
| Housing Units | 239 | 295 |
| Median Property Value | - | - |
| Median Household Income | - | - |
| Monthly Housing Costs | - | - |
| Real Estate Taxes | $6,082 | $25 |
Property Value by Mortgage Status in Gasport
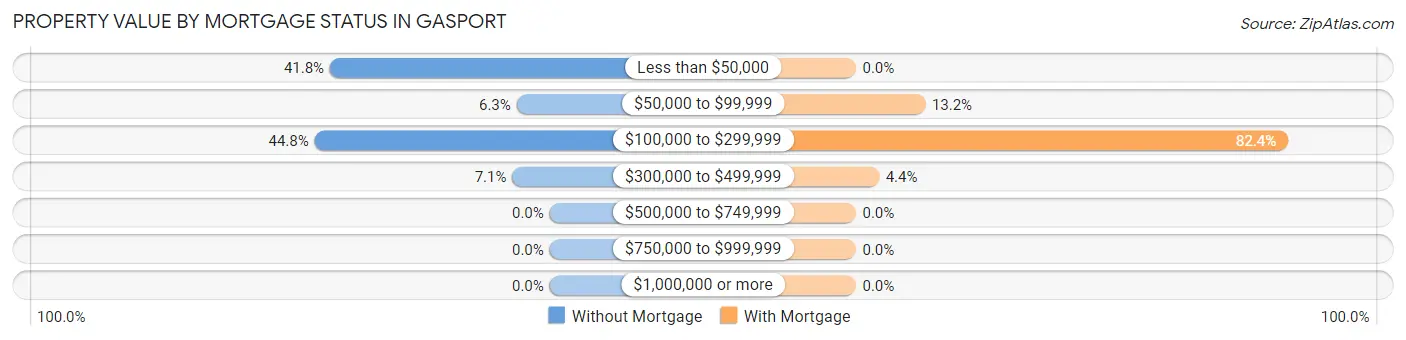
| Property Value | Without Mortgage | With Mortgage |
| Less than $50,000 | 100 (41.8%) | 0 (0.0%) |
| $50,000 to $99,999 | 15 (6.3%) | 39 (13.2%) |
| $100,000 to $299,999 | 107 (44.8%) | 243 (82.4%) |
| $300,000 to $499,999 | 17 (7.1%) | 13 (4.4%) |
| $500,000 to $749,999 | 0 (0.0%) | 0 (0.0%) |
| $750,000 to $999,999 | 0 (0.0%) | 0 (0.0%) |
| $1,000,000 or more | 0 (0.0%) | 0 (0.0%) |
| Total | 239 (100.0%) | 295 (100.0%) |
Household Income by Mortgage Status in Gasport
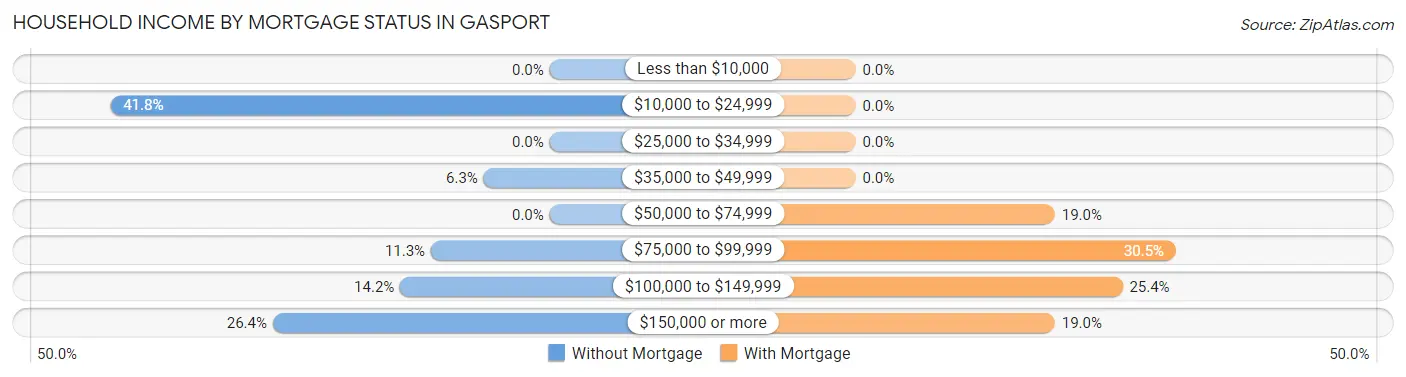
| Household Income | Without Mortgage | With Mortgage |
| Less than $10,000 | 0 (0.0%) | 0 (0.0%) |
| $10,000 to $24,999 | 100 (41.8%) | 0 (0.0%) |
| $25,000 to $34,999 | 0 (0.0%) | 0 (0.0%) |
| $35,000 to $49,999 | 15 (6.3%) | 0 (0.0%) |
| $50,000 to $74,999 | 0 (0.0%) | 56 (19.0%) |
| $75,000 to $99,999 | 27 (11.3%) | 90 (30.5%) |
| $100,000 to $149,999 | 34 (14.2%) | 75 (25.4%) |
| $150,000 or more | 63 (26.4%) | 56 (19.0%) |
| Total | 239 (100.0%) | 295 (100.0%) |
Property Value to Household Income Ratio in Gasport
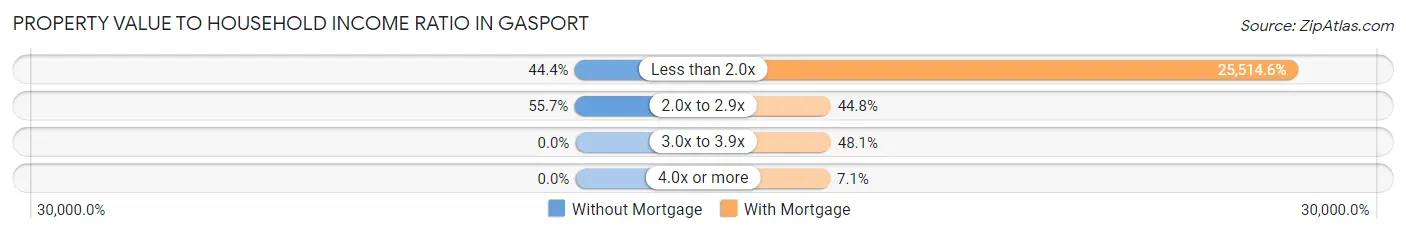
| Value-to-Income Ratio | Without Mortgage | With Mortgage |
| Less than 2.0x | 106 (44.4%) | 75,268 (25,514.6%) |
| 2.0x to 2.9x | 133 (55.6%) | 132 (44.8%) |
| 3.0x to 3.9x | 0 (0.0%) | 142 (48.1%) |
| 4.0x or more | 0 (0.0%) | 21 (7.1%) |
| Total | 239 (100.0%) | 295 (100.0%) |
Real Estate Taxes by Mortgage Status in Gasport
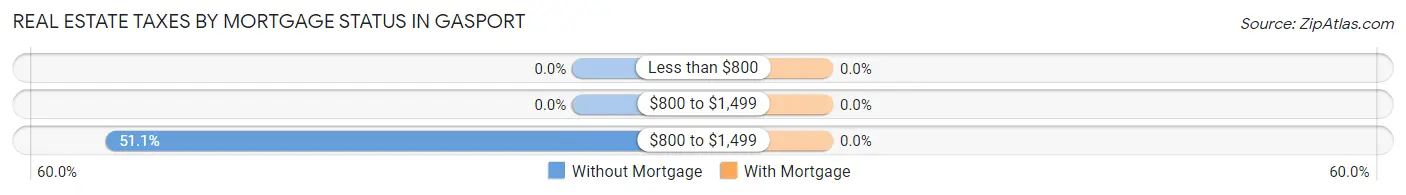
| Property Taxes | Without Mortgage | With Mortgage |
| Less than $800 | 0 (0.0%) | 0 (0.0%) |
| $800 to $1,499 | 0 (0.0%) | 0 (0.0%) |
| $800 to $1,499 | 122 (51.0%) | 0 (0.0%) |
| Total | 239 (100.0%) | 295 (100.0%) |
Health & Disability in Gasport
Health Insurance Coverage by Age in Gasport
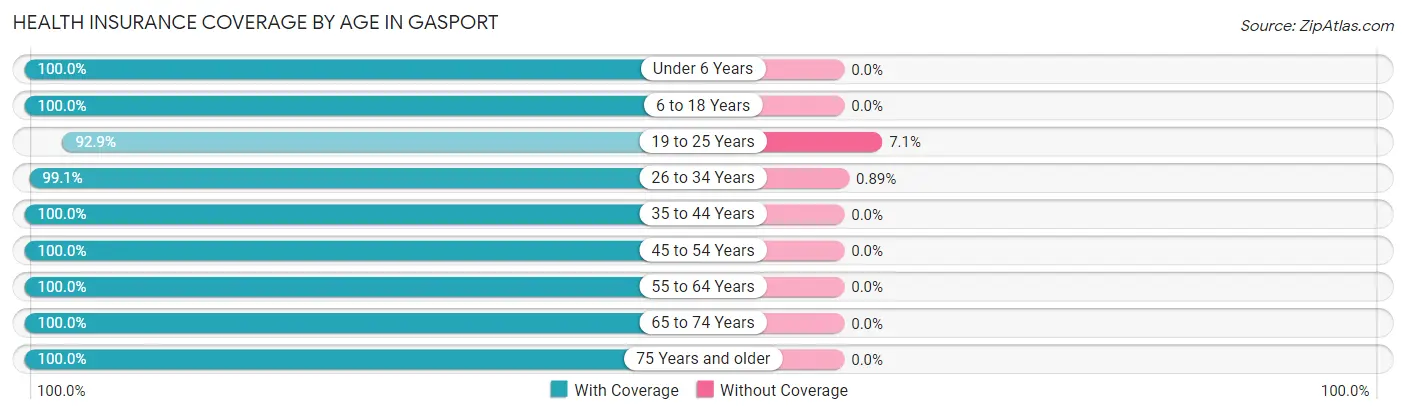
| Age Bracket | With Coverage | Without Coverage |
| Under 6 Years | 161 (100.0%) | 0 (0.0%) |
| 6 to 18 Years | 128 (100.0%) | 0 (0.0%) |
| 19 to 25 Years | 171 (92.9%) | 13 (7.1%) |
| 26 to 34 Years | 223 (99.1%) | 2 (0.9%) |
| 35 to 44 Years | 107 (100.0%) | 0 (0.0%) |
| 45 to 54 Years | 245 (100.0%) | 0 (0.0%) |
| 55 to 64 Years | 153 (100.0%) | 0 (0.0%) |
| 65 to 74 Years | 103 (100.0%) | 0 (0.0%) |
| 75 Years and older | 29 (100.0%) | 0 (0.0%) |
| Total | 1,320 (98.9%) | 15 (1.1%) |
Health Insurance Coverage by Citizenship Status in Gasport
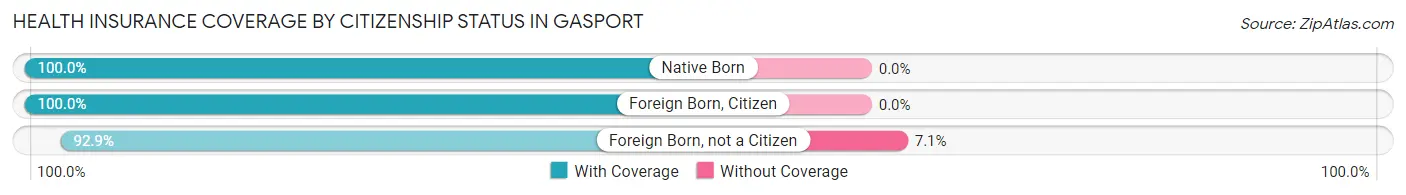
| Citizenship Status | With Coverage | Without Coverage |
| Native Born | 161 (100.0%) | 0 (0.0%) |
| Foreign Born, Citizen | 128 (100.0%) | 0 (0.0%) |
| Foreign Born, not a Citizen | 171 (92.9%) | 13 (7.1%) |
Health Insurance Coverage by Household Income in Gasport
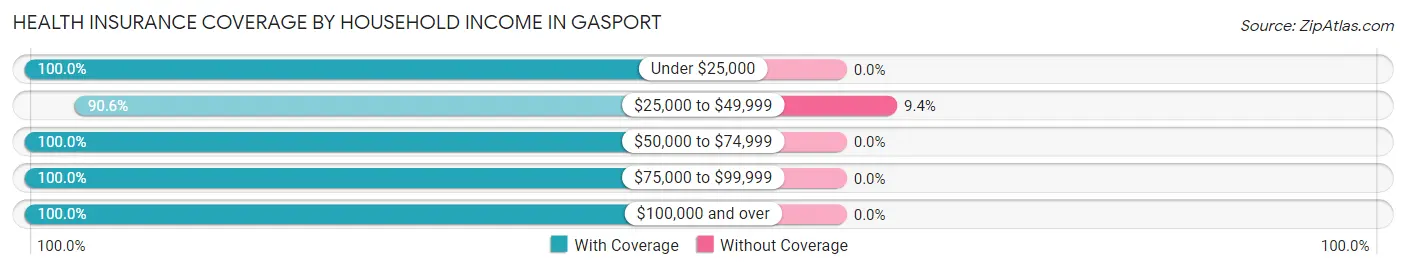
| Household Income | With Coverage | Without Coverage |
| Under $25,000 | 100 (100.0%) | 0 (0.0%) |
| $25,000 to $49,999 | 125 (90.6%) | 13 (9.4%) |
| $50,000 to $74,999 | 287 (100.0%) | 0 (0.0%) |
| $75,000 to $99,999 | 213 (100.0%) | 0 (0.0%) |
| $100,000 and over | 595 (100.0%) | 0 (0.0%) |
Public vs Private Health Insurance Coverage by Age in Gasport
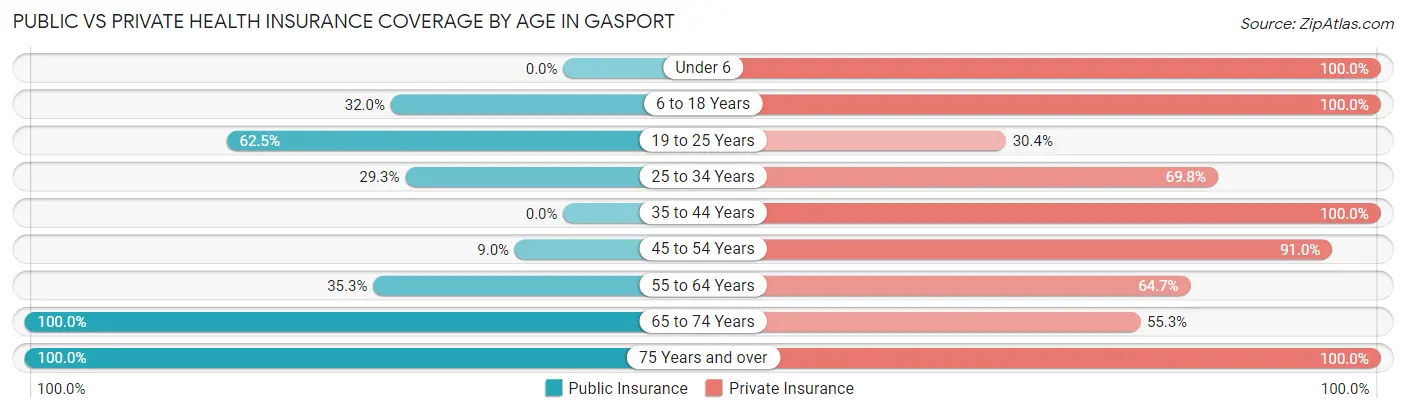
| Age Bracket | Public Insurance | Private Insurance |
| Under 6 | 0 (0.0%) | 161 (100.0%) |
| 6 to 18 Years | 41 (32.0%) | 128 (100.0%) |
| 19 to 25 Years | 115 (62.5%) | 56 (30.4%) |
| 25 to 34 Years | 66 (29.3%) | 157 (69.8%) |
| 35 to 44 Years | 0 (0.0%) | 107 (100.0%) |
| 45 to 54 Years | 22 (9.0%) | 223 (91.0%) |
| 55 to 64 Years | 54 (35.3%) | 99 (64.7%) |
| 65 to 74 Years | 103 (100.0%) | 57 (55.3%) |
| 75 Years and over | 29 (100.0%) | 29 (100.0%) |
| Total | 430 (32.2%) | 1,017 (76.2%) |
Disability Status by Sex by Age in Gasport
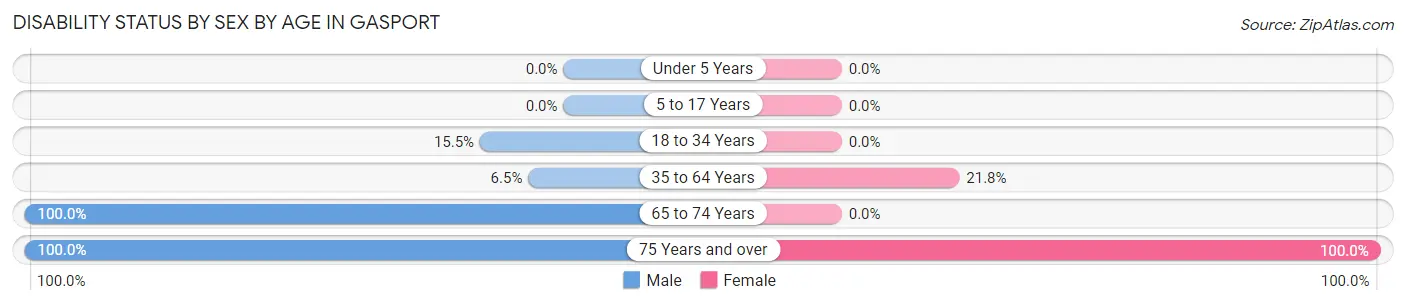
| Age Bracket | Male | Female |
| Under 5 Years | 0 (0.0%) | 0 (0.0%) |
| 5 to 17 Years | 0 (0.0%) | 0 (0.0%) |
| 18 to 34 Years | 26 (15.5%) | 0 (0.0%) |
| 35 to 64 Years | 15 (6.5%) | 60 (21.8%) |
| 65 to 74 Years | 17 (100.0%) | 0 (0.0%) |
| 75 Years and over | 14 (100.0%) | 15 (100.0%) |
Disability Class by Sex by Age in Gasport
Disability Class: Hearing Difficulty
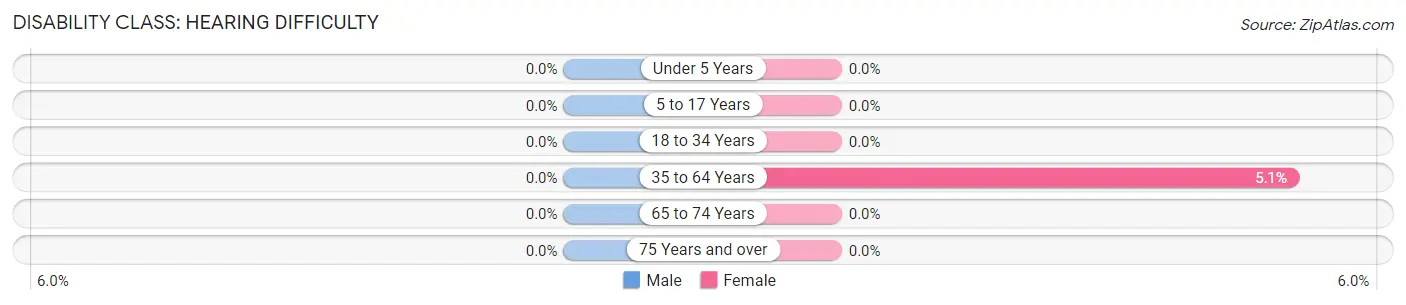
| Age Bracket | Male | Female |
| Under 5 Years | 0 (0.0%) | 0 (0.0%) |
| 5 to 17 Years | 0 (0.0%) | 0 (0.0%) |
| 18 to 34 Years | 0 (0.0%) | 0 (0.0%) |
| 35 to 64 Years | 0 (0.0%) | 14 (5.1%) |
| 65 to 74 Years | 0 (0.0%) | 0 (0.0%) |
| 75 Years and over | 0 (0.0%) | 0 (0.0%) |
Disability Class: Vision Difficulty
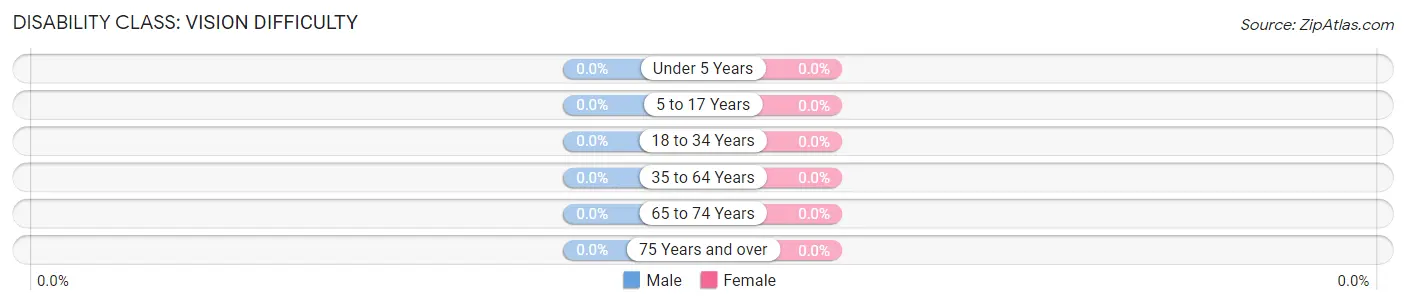
| Age Bracket | Male | Female |
| Under 5 Years | 0 (0.0%) | 0 (0.0%) |
| 5 to 17 Years | 0 (0.0%) | 0 (0.0%) |
| 18 to 34 Years | 0 (0.0%) | 0 (0.0%) |
| 35 to 64 Years | 0 (0.0%) | 0 (0.0%) |
| 65 to 74 Years | 0 (0.0%) | 0 (0.0%) |
| 75 Years and over | 0 (0.0%) | 0 (0.0%) |
Disability Class: Cognitive Difficulty

| Age Bracket | Male | Female |
| 5 to 17 Years | 0 (0.0%) | 0 (0.0%) |
| 18 to 34 Years | 0 (0.0%) | 0 (0.0%) |
| 35 to 64 Years | 0 (0.0%) | 0 (0.0%) |
| 65 to 74 Years | 0 (0.0%) | 0 (0.0%) |
| 75 Years and over | 14 (100.0%) | 0 (0.0%) |
Disability Class: Ambulatory Difficulty
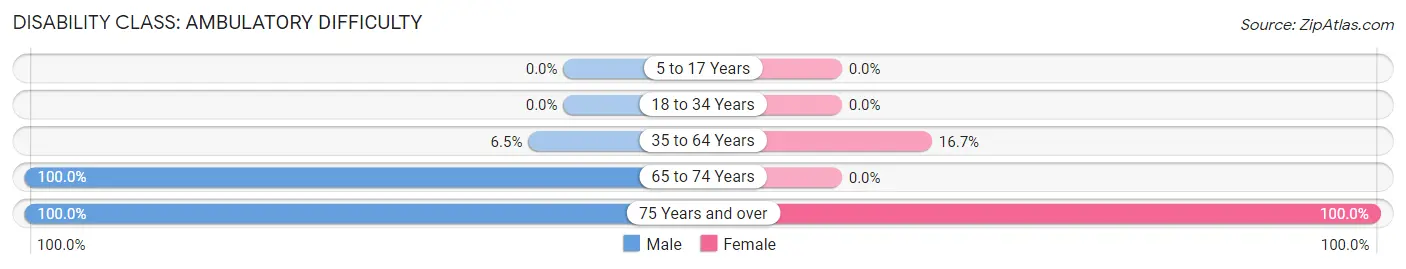
| Age Bracket | Male | Female |
| 5 to 17 Years | 0 (0.0%) | 0 (0.0%) |
| 18 to 34 Years | 0 (0.0%) | 0 (0.0%) |
| 35 to 64 Years | 15 (6.5%) | 46 (16.7%) |
| 65 to 74 Years | 17 (100.0%) | 0 (0.0%) |
| 75 Years and over | 14 (100.0%) | 15 (100.0%) |
Disability Class: Self-Care Difficulty
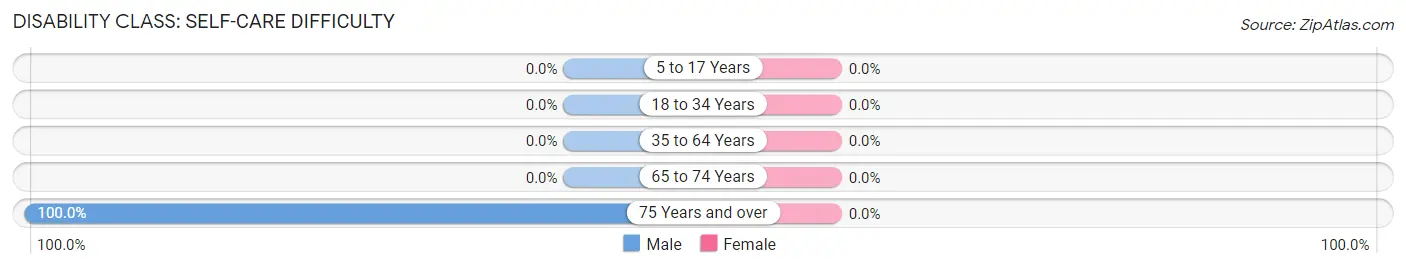
| Age Bracket | Male | Female |
| 5 to 17 Years | 0 (0.0%) | 0 (0.0%) |
| 18 to 34 Years | 0 (0.0%) | 0 (0.0%) |
| 35 to 64 Years | 0 (0.0%) | 0 (0.0%) |
| 65 to 74 Years | 0 (0.0%) | 0 (0.0%) |
| 75 Years and over | 14 (100.0%) | 0 (0.0%) |
Technology Access in Gasport
Computing Device Access in Gasport
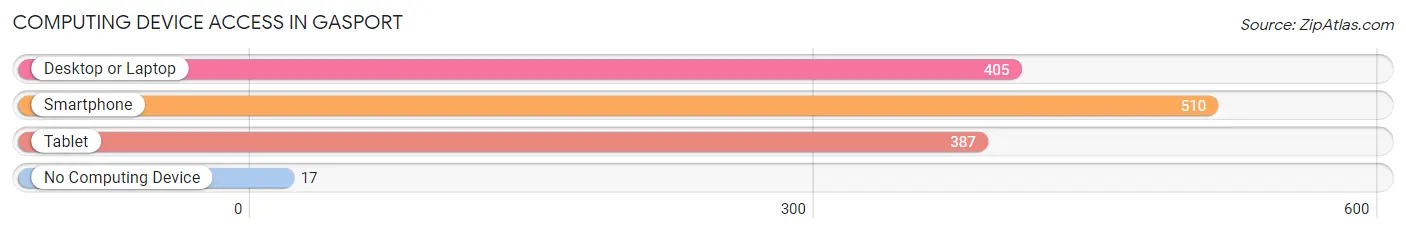
| Device Type | # Households | % Households |
| Desktop or Laptop | 405 | 71.4% |
| Smartphone | 510 | 89.9% |
| Tablet | 387 | 68.2% |
| No Computing Device | 17 | 3.0% |
| Total | 567 | 100.0% |
Internet Access in Gasport
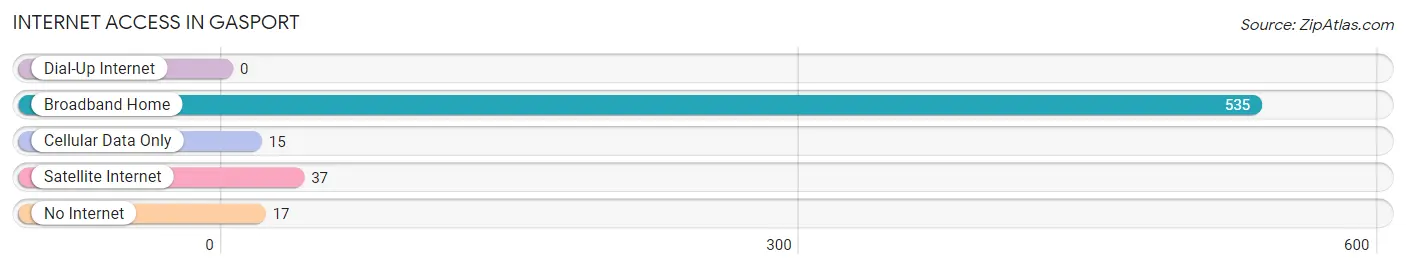
| Internet Type | # Households | % Households |
| Dial-Up Internet | 0 | 0.0% |
| Broadband Home | 535 | 94.4% |
| Cellular Data Only | 15 | 2.6% |
| Satellite Internet | 37 | 6.5% |
| No Internet | 17 | 3.0% |
| Total | 567 | 100.0% |
Gasport Summary
Gasport is a small hamlet located in Niagara County, New York, United States. It is situated on the west bank of the Erie Canal, just south of the City of Lockport. The population was 1,845 at the 2010 census.
History
Gasport was first settled in 1820 by a group of settlers from Connecticut. The hamlet was originally known as "Gasport Landing" due to its location on the Erie Canal. The name was changed to "Gasport" in 1845.
The hamlet was an important stop on the Erie Canal, as it was the site of a lock and a toll house. The lock was built in 1825 and was used to raise and lower boats between the canal and the Niagara River. The toll house was built in 1845 and was used to collect tolls from boats passing through the lock.
The hamlet was also home to a number of industries, including a grist mill, a saw mill, a tannery, and a brickyard. The grist mill was built in 1825 and was used to grind grain into flour. The saw mill was built in 1845 and was used to cut lumber for building construction. The tannery was built in 1855 and was used to process animal hides into leather. The brickyard was built in 1875 and was used to manufacture bricks for building construction.
Geography
Gasport is located at 43°12'45" North, 78°41'45" West (43.2125, -78.6958). According to the United States Census Bureau, the hamlet has a total area of 0.7 square miles (1.8 km2), all of it land.
Economy
The economy of Gasport is largely based on agriculture and tourism. The hamlet is home to several farms, which produce a variety of crops, including corn, soybeans, wheat, and hay. The hamlet is also home to several wineries, which produce a variety of wines.
The hamlet is also home to several businesses, including a grocery store, a hardware store, a gas station, and a restaurant. The hamlet is also home to several bed and breakfasts, which cater to tourists visiting the area.
Demographics
As of the census of 2010, there were 1,845 people, 717 households, and 486 families residing in the hamlet. The population density was 2,621.4 people per square mile (1,011.2/km2). There were 767 housing units at an average density of 1,093.6 per square mile (422.3/km2). The racial makeup of the hamlet was 97.2% White, 0.7% African American, 0.2% Native American, 0.2% Asian, 0.1% Pacific Islander, 0.4% from other races, and 1.2% from two or more races. Hispanic or Latino of any race were 1.7% of the population.
There were 717 households, out of which 33.2% had children under the age of 18 living with them, 48.2% were married couples living together, 13.2% had a female householder with no husband present, and 32.7% were non-families. 27.2% of all households were made up of individuals, and 11.2% had someone living alone who was 65 years of age or older. The average household size was 2.56 and the average family size was 3.09.
In the hamlet, the population was spread out, with 25.7% under the age of 18, 7.2% from 18 to 24, 28.2% from 25 to 44, 24.3% from 45 to 64, and 14.6% who were 65 years of age or older. The median age was 38 years. For every 100 females, there were 95.2 males. For every 100 females age 18 and over, there were 92.2 males.
The median income for a household in the hamlet was $41,250, and the median income for a family was $48,750. Males had a median income of $35,000 versus $25,000 for females. The per capita income for the hamlet was $19,845. About 6.2% of families and 8.2% of the population were below the poverty line, including 10.2% of those under age 18 and 5.2% of those age 65 or over.
Common Questions
What is the Total Population of Gasport?
Total Population of Gasport is 1,400.
What is the Total Male Population of Gasport?
Total Male Population of Gasport is 546.
What is the Total Female Population of Gasport?
Total Female Population of Gasport is 854.
What is the Ratio of Males per 100 Females in Gasport?
There are 63.93 Males per 100 Females in Gasport.
What is the Ratio of Females per 100 Males in Gasport?
There are 156.41 Females per 100 Males in Gasport.
What is the Median Population Age in Gasport?
Median Population Age in Gasport is 35.0 Years.
What is the Average Family Size in Gasport
Average Family Size in Gasport is 3.3 People.
What is the Average Household Size in Gasport
Average Household Size in Gasport is 2.4 People.
What is Per Capita Income in Gasport?
Per Capita income in Gasport is $38,222.
What is the Median Family Income in Gasport?
Median Family Income in Gasport is $92,386.
What is the Median Household income in Gasport?
Median Household Income in Gasport is $75,708.
What is Income or Wage Gap in Gasport?
Income or Wage Gap in Gasport is 31.8%.
Women in Gasport earn 68.2 cents for every dollar earned by a man.
What is Inequality or Gini Index in Gasport?
Inequality or Gini Index in Gasport is 0.38.
How Large is the Labor Force in Gasport?
There are 810 People in the Labor Forcein in Gasport.
What is the Percentage of People in the Labor Force in Gasport?
69.8% of People are in the Labor Force in Gasport.
What is the Unemployment Rate in Gasport?
Unemployment Rate in Gasport is 7.2%.