Gardiner, NY
Gardiner Map
Gardiner Overview
637
TOTAL POPULATION
307
MALE POPULATION
330
FEMALE POPULATION
93.03
MALES / 100 FEMALES
107.49
FEMALES / 100 MALES
39.9
MEDIAN AGE
4.7
AVG FAMILY SIZE
3.2
AVG HOUSEHOLD SIZE
$42,965
PER CAPITA INCOME
$104,767
AVG FAMILY INCOME
$104,894
AVG HOUSEHOLD INCOME
0.34
INEQUALITY / GINI INDEX
317
LABOR FORCE [ PEOPLE ]
74.4%
PERCENT IN LABOR FORCE
Gardiner Zip Codes
Gardiner Area Codes
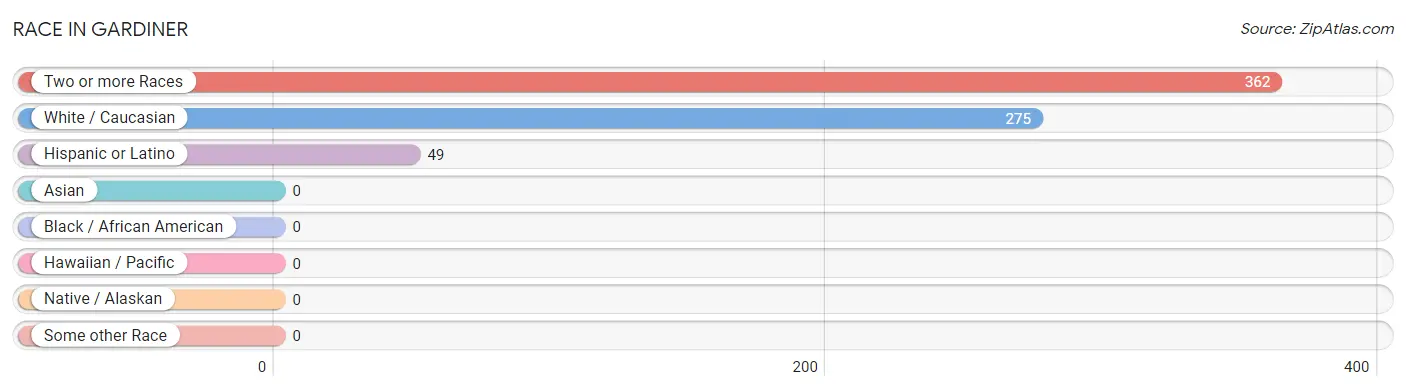
Race in Gardiner
The most populous races in Gardiner are Two or more Races (362 | 56.8%), White / Caucasian (275 | 43.2%), and Hispanic or Latino (49 | 7.7%).
| Race | # Population | % Population |
| Asian | 0 | 0.0% |
| Black / African American | 0 | 0.0% |
| Hawaiian / Pacific | 0 | 0.0% |
| Hispanic or Latino | 49 | 7.7% |
| Native / Alaskan | 0 | 0.0% |
| White / Caucasian | 275 | 43.2% |
| Two or more Races | 362 | 56.8% |
| Some other Race | 0 | 0.0% |
| Total | 637 | 100.0% |
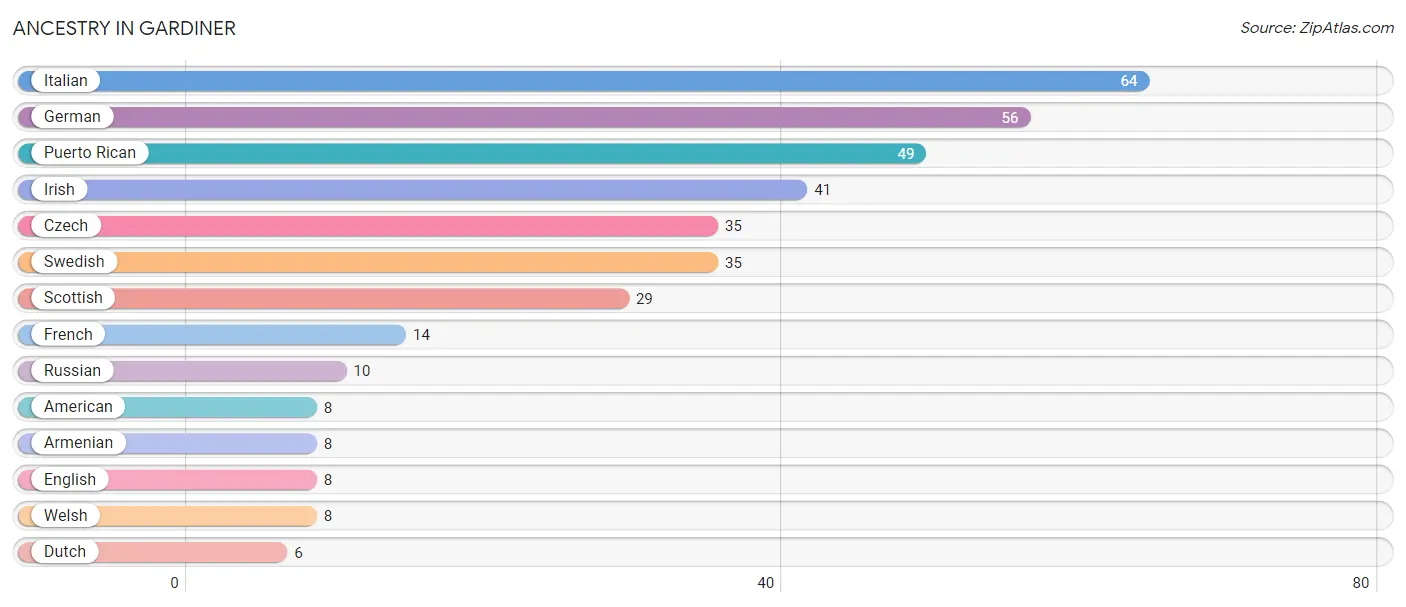
Ancestry in Gardiner
The most populous ancestries reported in Gardiner are Italian (64 | 10.1%), German (56 | 8.8%), Puerto Rican (49 | 7.7%), Irish (41 | 6.4%), and Czech (35 | 5.5%), together accounting for 38.5% of all Gardiner residents.
| Ancestry | # Population | % Population |
| American | 8 | 1.3% |
| Armenian | 8 | 1.3% |
| Czech | 35 | 5.5% |
| Dutch | 6 | 0.9% |
| English | 8 | 1.3% |
| French | 14 | 2.2% |
| German | 56 | 8.8% |
| Irish | 41 | 6.4% |
| Italian | 64 | 10.1% |
| Puerto Rican | 49 | 7.7% |
| Russian | 10 | 1.6% |
| Scottish | 29 | 4.5% |
| Swedish | 35 | 5.5% |
| Welsh | 8 | 1.3% | View All 14 Rows |
Immigrants in Gardiner

| Immigration Origin | # Population | % Population | View All 0 Rows |
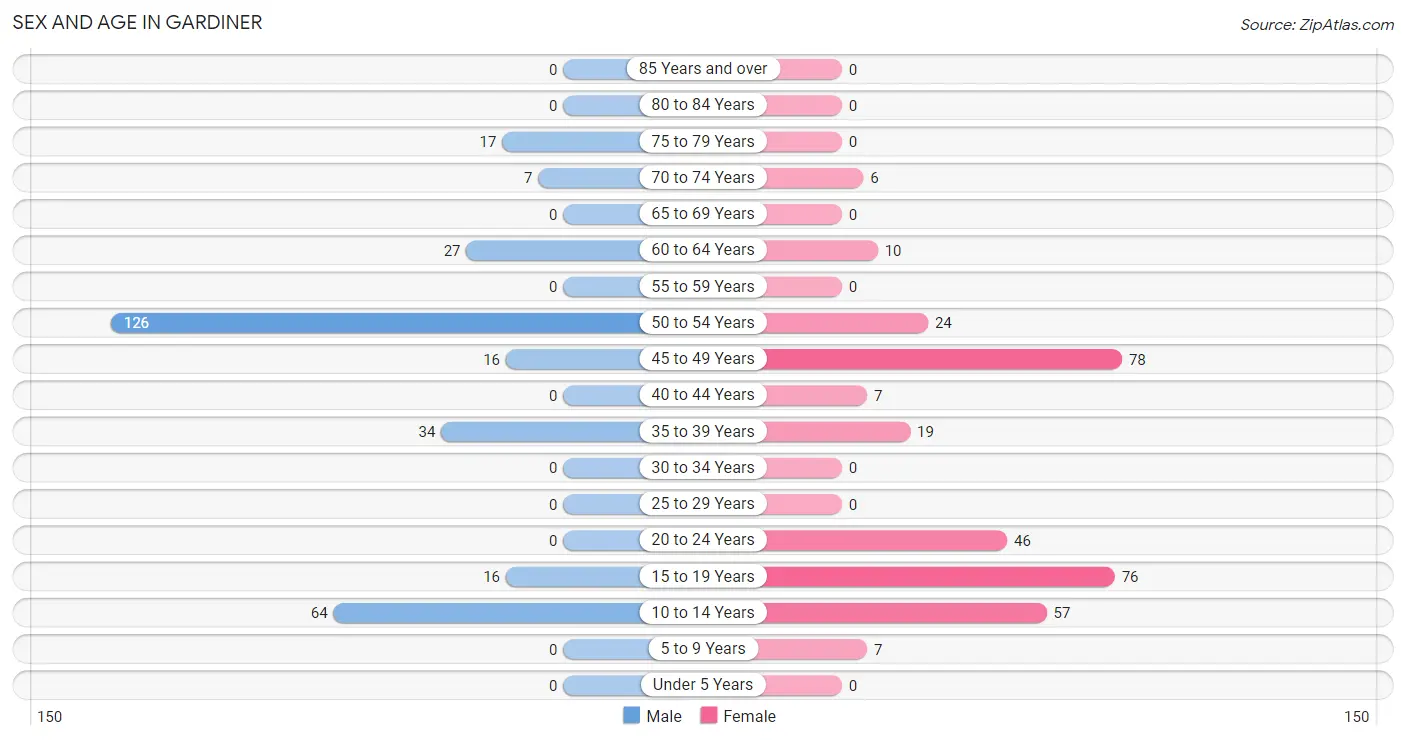
Sex and Age in Gardiner
Sex and Age in Gardiner
The most populous age groups in Gardiner are 50 to 54 Years (126 | 41.0%) for men and 45 to 49 Years (78 | 23.6%) for women.
| Age Bracket | Male | Female |
| Under 5 Years | 0 (0.0%) | 0 (0.0%) |
| 5 to 9 Years | 0 (0.0%) | 7 (2.1%) |
| 10 to 14 Years | 64 (20.8%) | 57 (17.3%) |
| 15 to 19 Years | 16 (5.2%) | 76 (23.0%) |
| 20 to 24 Years | 0 (0.0%) | 46 (13.9%) |
| 25 to 29 Years | 0 (0.0%) | 0 (0.0%) |
| 30 to 34 Years | 0 (0.0%) | 0 (0.0%) |
| 35 to 39 Years | 34 (11.1%) | 19 (5.8%) |
| 40 to 44 Years | 0 (0.0%) | 7 (2.1%) |
| 45 to 49 Years | 16 (5.2%) | 78 (23.6%) |
| 50 to 54 Years | 126 (41.0%) | 24 (7.3%) |
| 55 to 59 Years | 0 (0.0%) | 0 (0.0%) |
| 60 to 64 Years | 27 (8.8%) | 10 (3.0%) |
| 65 to 69 Years | 0 (0.0%) | 0 (0.0%) |
| 70 to 74 Years | 7 (2.3%) | 6 (1.8%) |
| 75 to 79 Years | 17 (5.5%) | 0 (0.0%) |
| 80 to 84 Years | 0 (0.0%) | 0 (0.0%) |
| 85 Years and over | 0 (0.0%) | 0 (0.0%) |
| Total | 307 (100.0%) | 330 (100.0%) |
Families and Households in Gardiner
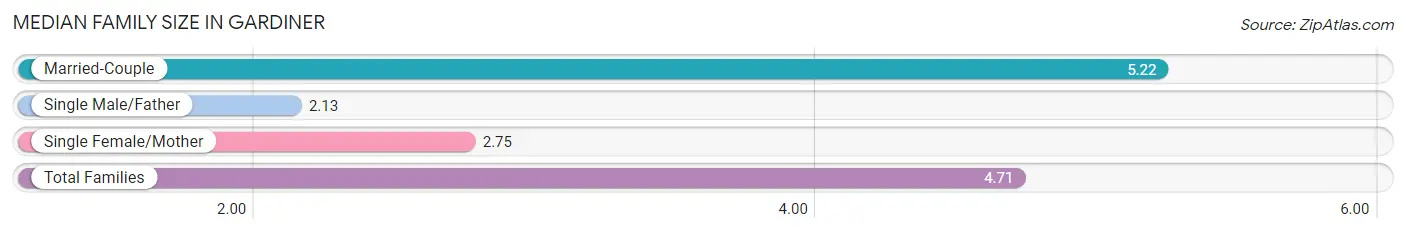
Median Family Size in Gardiner
The median family size in Gardiner is 4.71 persons per family, with married-couple families (87 | 81.3%) accounting for the largest median family size of 5.22 persons per family. On the other hand, single male/father families (8 | 7.5%) represent the smallest median family size with 2.13 persons per family.
| Family Type | # Families | Family Size |
| Married-Couple | 87 (81.3%) | 5.22 |
| Single Male/Father | 8 (7.5%) | 2.13 |
| Single Female/Mother | 12 (11.2%) | 2.75 |
| Total Families | 107 (100.0%) | 4.71 |
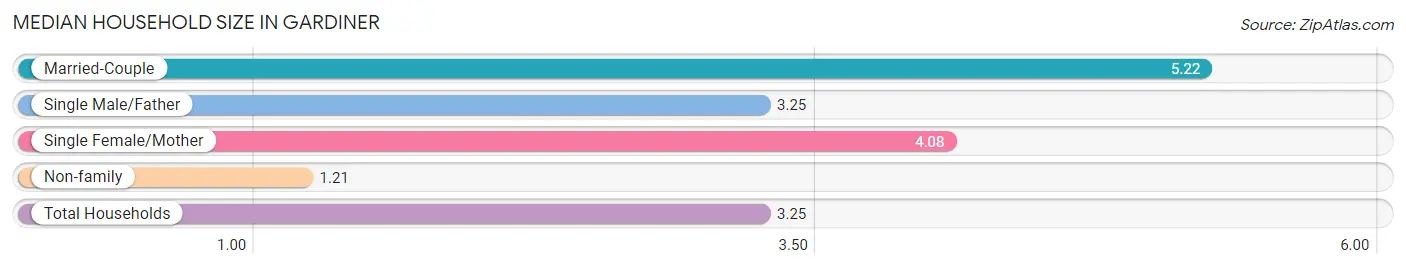
Median Household Size in Gardiner
The median household size in Gardiner is 3.25 persons per household, with married-couple households (87 | 44.4%) accounting for the largest median household size of 5.22 persons per household. non-family households (89 | 45.4%) represent the smallest median household size with 1.21 persons per household.
| Household Type | # Households | Household Size |
| Married-Couple | 87 (44.4%) | 5.22 |
| Single Male/Father | 8 (4.1%) | 3.25 |
| Single Female/Mother | 12 (6.1%) | 4.08 |
| Non-family | 89 (45.4%) | 1.21 |
| Total Households | 196 (100.0%) | 3.25 |
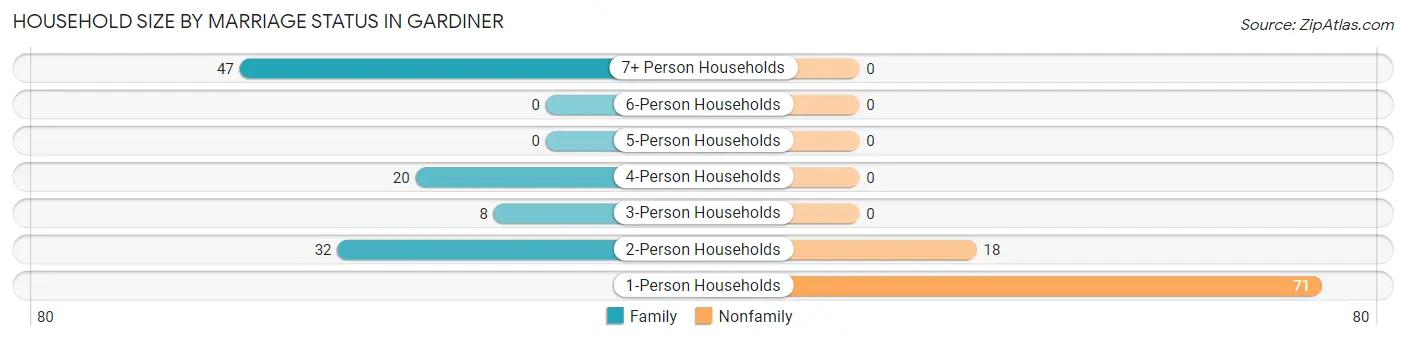
Household Size by Marriage Status in Gardiner
Out of a total of 196 households in Gardiner, 107 (54.6%) are family households, while 89 (45.4%) are nonfamily households. The most numerous type of family households are 7+ person households, comprising 47, and the most common type of nonfamily households are 1-person households, comprising 71.
| Household Size | Family Households | Nonfamily Households |
| 1-Person Households | - | 71 (36.2%) |
| 2-Person Households | 32 (16.3%) | 18 (9.2%) |
| 3-Person Households | 8 (4.1%) | 0 (0.0%) |
| 4-Person Households | 20 (10.2%) | 0 (0.0%) |
| 5-Person Households | 0 (0.0%) | 0 (0.0%) |
| 6-Person Households | 0 (0.0%) | 0 (0.0%) |
| 7+ Person Households | 47 (24.0%) | 0 (0.0%) |
| Total | 107 (54.6%) | 89 (45.4%) |
Female Fertility in Gardiner
Fertility by Age in Gardiner
| Age Bracket | Women with Births | Births / 1,000 Women |
| 15 to 19 years | 0 (0.0%) | 0.0 |
| 20 to 34 years | 0 (0.0%) | 0.0 |
| 35 to 50 years | 0 (0.0%) | 0.0 |
| Total | 0 (0.0%) | 0.0 |
Fertility by Age by Marriage Status in Gardiner
| Age Bracket | Married | Unmarried |
| 15 to 19 years | 0 (0.0%) | 0 (0.0%) |
| 20 to 34 years | 0 (0.0%) | 0 (0.0%) |
| 35 to 50 years | 0 (0.0%) | 0 (0.0%) |
| Total | 0 (0.0%) | 0 (0.0%) |
Fertility by Education in Gardiner
| Educational Attainment | Women with Births | Births / 1,000 Women |
| Less than High School | 0 (0.0%) | 0.0 |
| High School Diploma | 0 (0.0%) | 0.0 |
| College or Associate's Degree | 0 (0.0%) | 0.0 |
| Bachelor's Degree | 0 (0.0%) | 0.0 |
| Graduate Degree | 0 (0.0%) | 0.0 |
| Total | 0 (0.0%) | 0.0 |
Fertility by Education by Marriage Status in Gardiner
| Educational Attainment | Married | Unmarried |
| Less than High School | 0 (0.0%) | 0 (0.0%) |
| High School Diploma | 0 (0.0%) | 0 (0.0%) |
| College or Associate's Degree | 0 (0.0%) | 0 (0.0%) |
| Bachelor's Degree | 0 (0.0%) | 0 (0.0%) |
| Graduate Degree | 0 (0.0%) | 0 (0.0%) |
| Total | 0 (0.0%) | 0 (0.0%) |
Income in Gardiner
Income Overview in Gardiner
Per Capita Income in Gardiner is $42,965, while median incomes of families and households are $104,767 and $104,894 respectively.
| Characteristic | Number | Measure |
| Per Capita Income | 637 | $42,965 |
| Median Family Income | 107 | $104,767 |
| Mean Family Income | 107 | $158,279 |
| Median Household Income | 196 | $104,894 |
| Mean Household Income | 196 | $139,031 |
| Income Deficit | 107 | $0 |
| Wage / Income Gap (%) | 637 | 0.00% |
| Wage / Income Gap ($) | 637 | 100.00¢ per $1 |
| Gini / Inequality Index | 637 | 0.34 |
Earnings by Sex in Gardiner
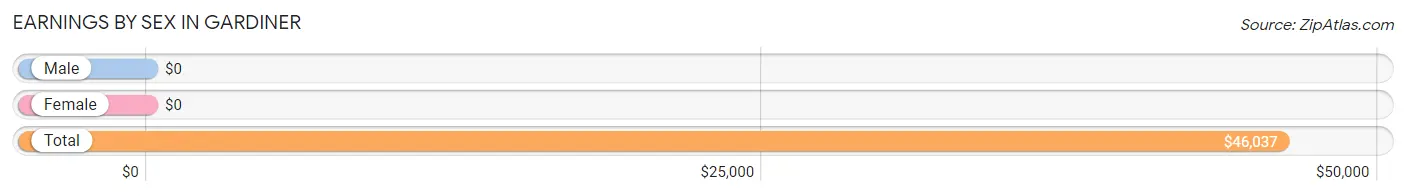
| Sex | Number | Average Earnings |
| Male | 203 (61.3%) | $0 |
| Female | 128 (38.7%) | $0 |
| Total | 331 (100.0%) | $46,037 |
Earnings by Sex by Income Bracket in Gardiner
The most common earnings brackets in Gardiner are $100,000+ for men (61 | 30.0%) and $25,000 to $29,999 for women (48 | 37.5%).
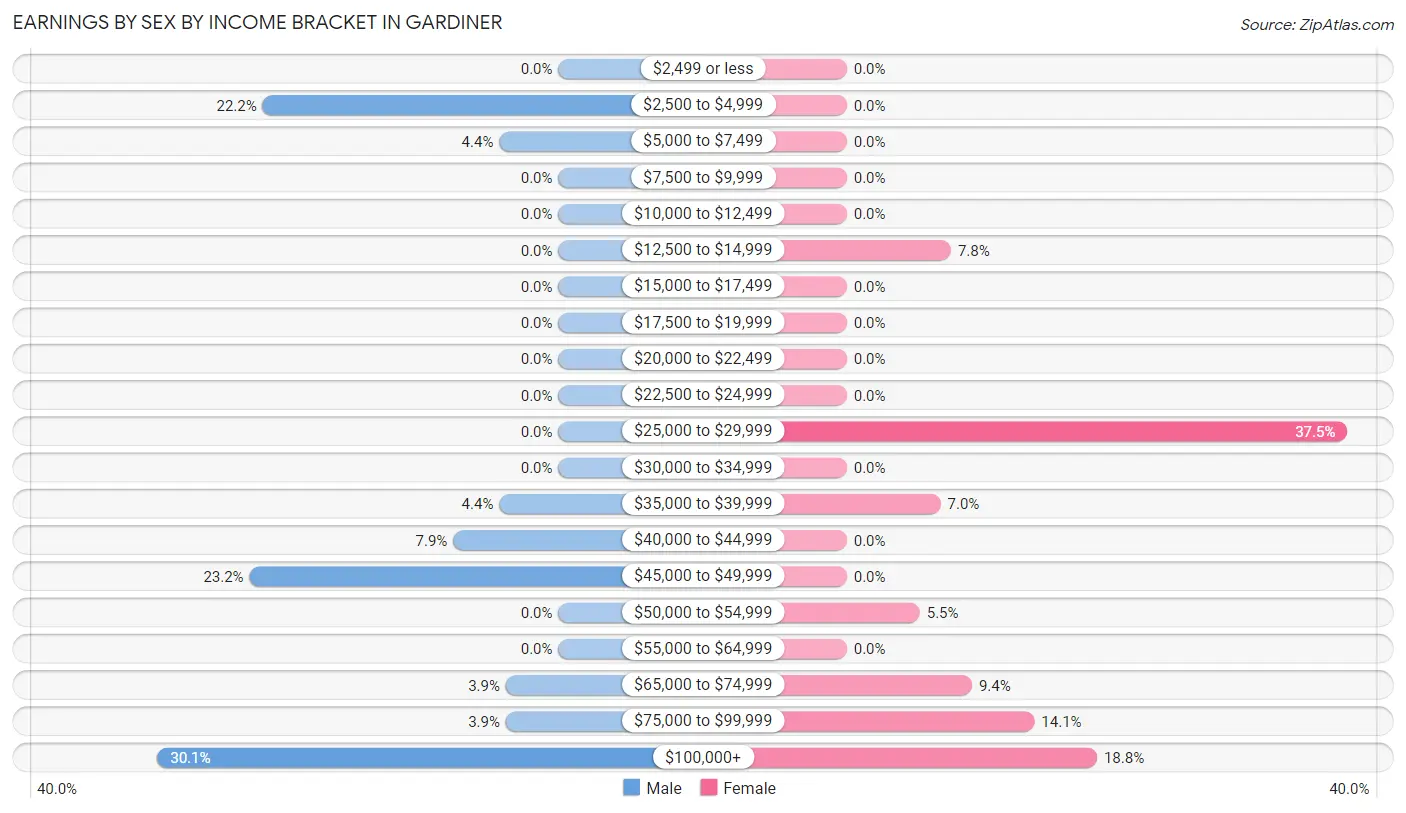
| Income | Male | Female |
| $2,499 or less | 0 (0.0%) | 0 (0.0%) |
| $2,500 to $4,999 | 45 (22.2%) | 0 (0.0%) |
| $5,000 to $7,499 | 9 (4.4%) | 0 (0.0%) |
| $7,500 to $9,999 | 0 (0.0%) | 0 (0.0%) |
| $10,000 to $12,499 | 0 (0.0%) | 0 (0.0%) |
| $12,500 to $14,999 | 0 (0.0%) | 10 (7.8%) |
| $15,000 to $17,499 | 0 (0.0%) | 0 (0.0%) |
| $17,500 to $19,999 | 0 (0.0%) | 0 (0.0%) |
| $20,000 to $22,499 | 0 (0.0%) | 0 (0.0%) |
| $22,500 to $24,999 | 0 (0.0%) | 0 (0.0%) |
| $25,000 to $29,999 | 0 (0.0%) | 48 (37.5%) |
| $30,000 to $34,999 | 0 (0.0%) | 0 (0.0%) |
| $35,000 to $39,999 | 9 (4.4%) | 9 (7.0%) |
| $40,000 to $44,999 | 16 (7.9%) | 0 (0.0%) |
| $45,000 to $49,999 | 47 (23.2%) | 0 (0.0%) |
| $50,000 to $54,999 | 0 (0.0%) | 7 (5.5%) |
| $55,000 to $64,999 | 0 (0.0%) | 0 (0.0%) |
| $65,000 to $74,999 | 8 (3.9%) | 12 (9.4%) |
| $75,000 to $99,999 | 8 (3.9%) | 18 (14.1%) |
| $100,000+ | 61 (30.0%) | 24 (18.8%) |
| Total | 203 (100.0%) | 128 (100.0%) |
Earnings by Sex by Educational Attainment in Gardiner
| Educational Attainment | Male Income | Female Income |
| Less than High School | - | - |
| High School Diploma | - | - |
| College or Associate's Degree | - | - |
| Bachelor's Degree | - | - |
| Graduate Degree | - | - |
| Total | - | - |
Family Income in Gardiner
Family Income Brackets in Gardiner
According to the Gardiner family income data, there are 75 families falling into the $100,000 to $149,999 income range, which is the most common income bracket and makes up 70.1% of all families.
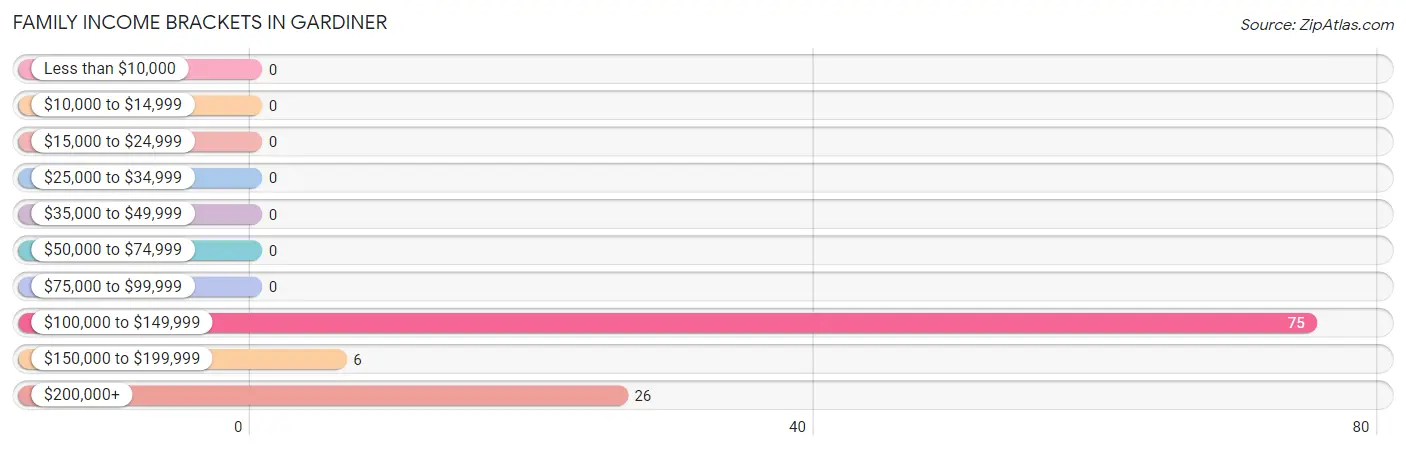
| Income Bracket | # Families | % Families |
| Less than $10,000 | 0 | 0.0% |
| $10,000 to $14,999 | 0 | 0.0% |
| $15,000 to $24,999 | 0 | 0.0% |
| $25,000 to $34,999 | 0 | 0.0% |
| $35,000 to $49,999 | 0 | 0.0% |
| $50,000 to $74,999 | 0 | 0.0% |
| $75,000 to $99,999 | 0 | 0.0% |
| $100,000 to $149,999 | 75 | 70.1% |
| $150,000 to $199,999 | 6 | 5.6% |
| $200,000+ | 26 | 24.3% |
Family Income by Famaliy Size in Gardiner
2-person families (40 | 37.4%) account for the highest median family income in Gardiner with $250,001 per family, while 2-person families (40 | 37.4%) have the highest median income of $125,000 per family member.
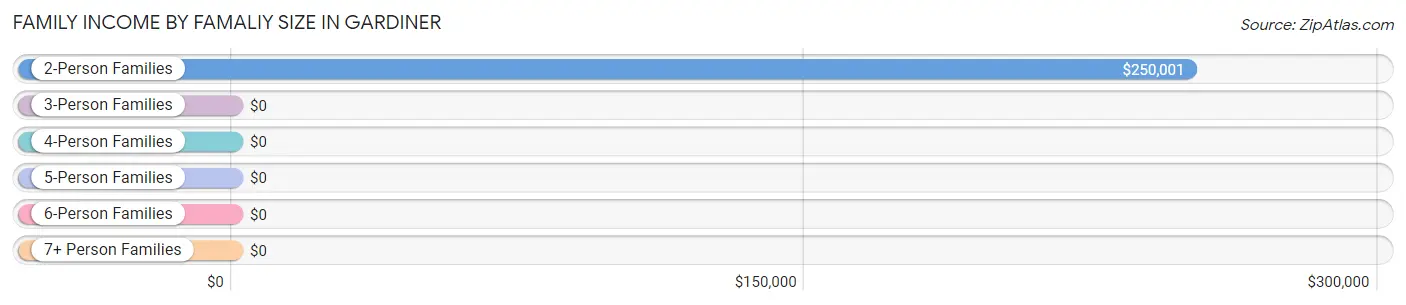
| Income Bracket | # Families | Median Income |
| 2-Person Families | 40 (37.4%) | $250,001 |
| 3-Person Families | 12 (11.2%) | $0 |
| 4-Person Families | 8 (7.5%) | $0 |
| 5-Person Families | 0 (0.0%) | $0 |
| 6-Person Families | 0 (0.0%) | $0 |
| 7+ Person Families | 47 (43.9%) | $0 |
| Total | 107 (100.0%) | $104,767 |
Family Income by Number of Earners in Gardiner
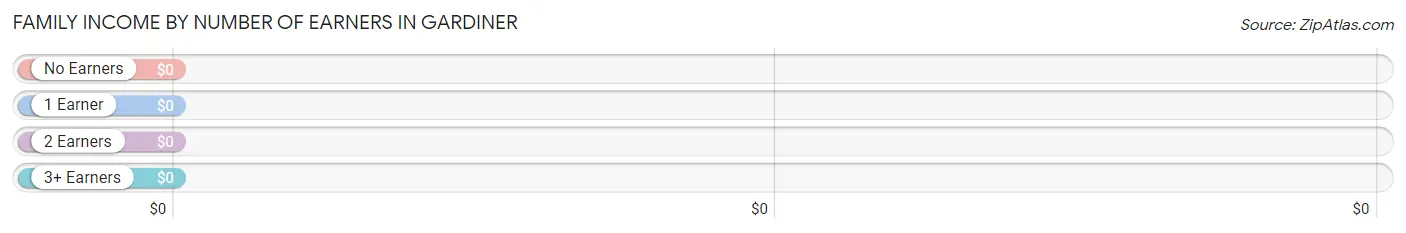
| Number of Earners | # Families | Median Income |
| No Earners | 6 (5.6%) | $0 |
| 1 Earner | 20 (18.7%) | $0 |
| 2 Earners | 34 (31.8%) | $0 |
| 3+ Earners | 47 (43.9%) | $0 |
| Total | 107 (100.0%) | $104,767 |
Household Income in Gardiner
Household Income Brackets in Gardiner
With 90 households falling in the category, the $100,000 to $149,999 income range is the most frequent in Gardiner, accounting for 45.9% of all households.
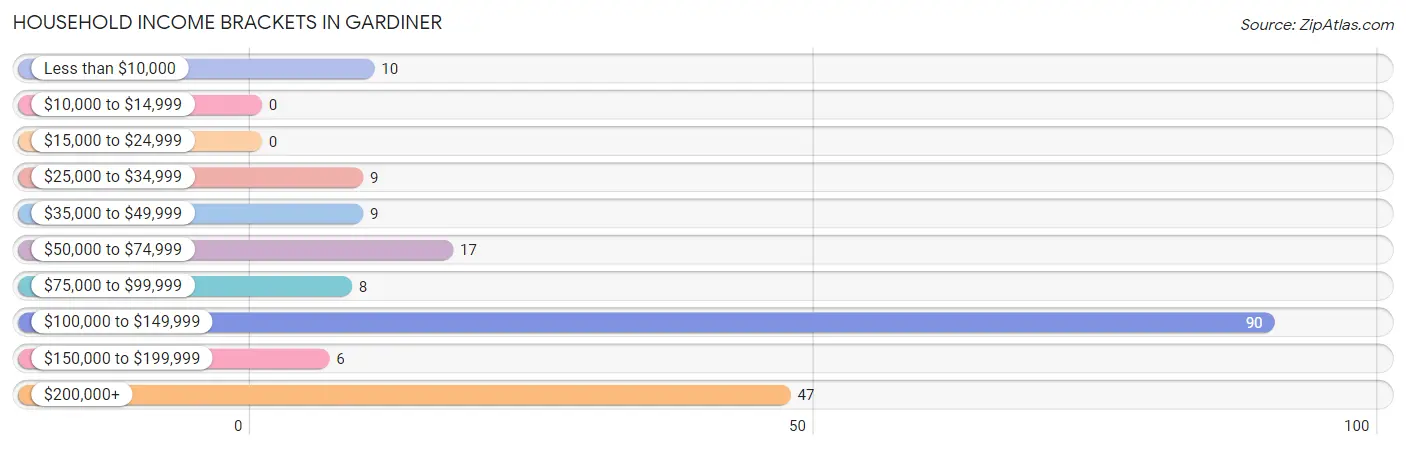
| Income Bracket | # Households | % Households |
| Less than $10,000 | 10 | 5.1% |
| $10,000 to $14,999 | 0 | 0.0% |
| $15,000 to $24,999 | 0 | 0.0% |
| $25,000 to $34,999 | 9 | 4.6% |
| $35,000 to $49,999 | 9 | 4.6% |
| $50,000 to $74,999 | 17 | 8.7% |
| $75,000 to $99,999 | 8 | 4.1% |
| $100,000 to $149,999 | 90 | 45.9% |
| $150,000 to $199,999 | 6 | 3.1% |
| $200,000+ | 47 | 24.0% |
Household Income by Householder Age in Gardiner
The median household income in Gardiner is $104,894, with the highest median household income of $130,000 found in the 45 to 64 years age bracket for the primary householder. A total of 146 households (74.5%) fall into this category.
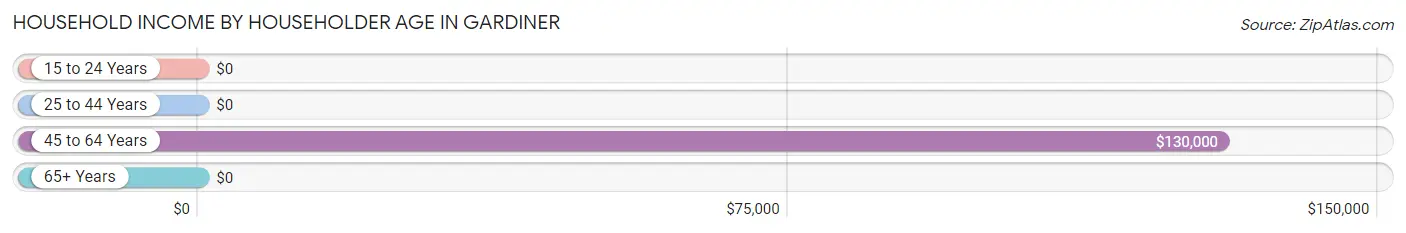
| Income Bracket | # Households | Median Income |
| 15 to 24 Years | 0 (0.0%) | $0 |
| 25 to 44 Years | 27 (13.8%) | $0 |
| 45 to 64 Years | 146 (74.5%) | $130,000 |
| 65+ Years | 23 (11.7%) | $0 |
| Total | 196 (100.0%) | $104,894 |
Poverty in Gardiner
Income Below Poverty by Sex and Age in Gardiner
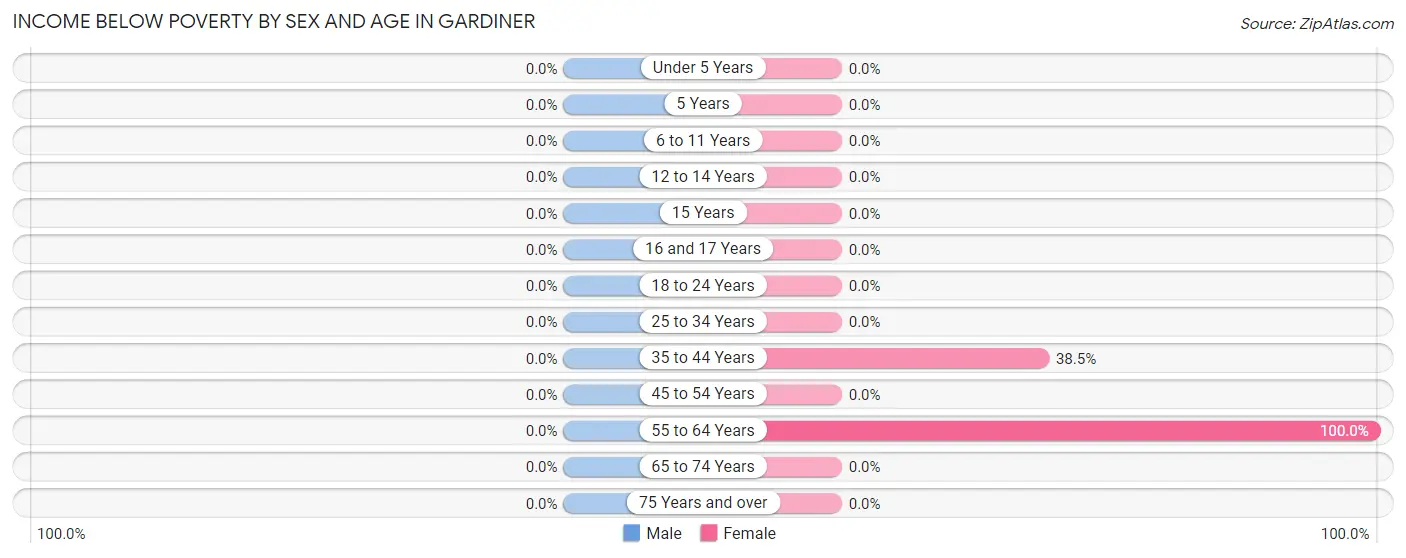
| Age Bracket | Male | Female |
| Under 5 Years | 0 (0.0%) | 0 (0.0%) |
| 5 Years | 0 (0.0%) | 0 (0.0%) |
| 6 to 11 Years | 0 (0.0%) | 0 (0.0%) |
| 12 to 14 Years | 0 (0.0%) | 0 (0.0%) |
| 15 Years | 0 (0.0%) | 0 (0.0%) |
| 16 and 17 Years | 0 (0.0%) | 0 (0.0%) |
| 18 to 24 Years | 0 (0.0%) | 0 (0.0%) |
| 25 to 34 Years | 0 (0.0%) | 0 (0.0%) |
| 35 to 44 Years | 0 (0.0%) | 10 (38.5%) |
| 45 to 54 Years | 0 (0.0%) | 0 (0.0%) |
| 55 to 64 Years | 0 (0.0%) | 10 (100.0%) |
| 65 to 74 Years | 0 (0.0%) | 0 (0.0%) |
| 75 Years and over | 0 (0.0%) | 0 (0.0%) |
| Total | 0 (0.0%) | 20 (6.1%) |
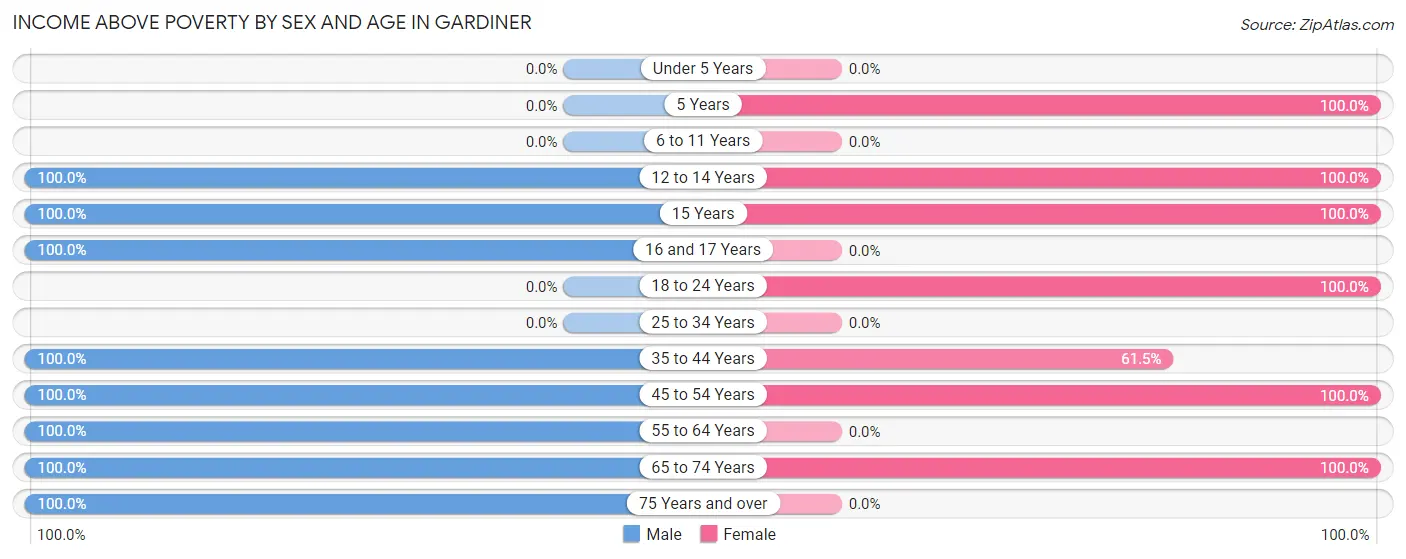
Income Above Poverty by Sex and Age in Gardiner
According to the poverty statistics in Gardiner, males aged 12 to 14 years and females aged 5 years are the age groups that are most secure financially, with 100.0% of males and 100.0% of females in these age groups living above the poverty line.
| Age Bracket | Male | Female |
| Under 5 Years | 0 (0.0%) | 0 (0.0%) |
| 5 Years | 0 (0.0%) | 7 (100.0%) |
| 6 to 11 Years | 0 (0.0%) | 0 (0.0%) |
| 12 to 14 Years | 64 (100.0%) | 57 (100.0%) |
| 15 Years | 7 (100.0%) | 76 (100.0%) |
| 16 and 17 Years | 9 (100.0%) | 0 (0.0%) |
| 18 to 24 Years | 0 (0.0%) | 46 (100.0%) |
| 25 to 34 Years | 0 (0.0%) | 0 (0.0%) |
| 35 to 44 Years | 34 (100.0%) | 16 (61.5%) |
| 45 to 54 Years | 142 (100.0%) | 102 (100.0%) |
| 55 to 64 Years | 27 (100.0%) | 0 (0.0%) |
| 65 to 74 Years | 7 (100.0%) | 6 (100.0%) |
| 75 Years and over | 17 (100.0%) | 0 (0.0%) |
| Total | 307 (100.0%) | 310 (93.9%) |
Income Below Poverty Among Married-Couple Families in Gardiner
| Children | Above Poverty | Below Poverty |
| No Children | 32 (100.0%) | 0 (0.0%) |
| 1 or 2 Children | 8 (100.0%) | 0 (0.0%) |
| 3 or 4 Children | 47 (100.0%) | 0 (0.0%) |
| 5 or more Children | 0 (0.0%) | 0 (0.0%) |
| Total | 87 (100.0%) | 0 (0.0%) |
Income Below Poverty Among Single-Parent Households in Gardiner
| Children | Single Father | Single Mother |
| No Children | 0 (0.0%) | 0 (0.0%) |
| 1 or 2 Children | 0 (0.0%) | 0 (0.0%) |
| 3 or 4 Children | 0 (0.0%) | 0 (0.0%) |
| 5 or more Children | 0 (0.0%) | 0 (0.0%) |
| Total | 0 (0.0%) | 0 (0.0%) |
Income Below Poverty Among Married-Couple vs Single-Parent Households in Gardiner
| Children | Married-Couple Families | Single-Parent Households |
| No Children | 0 (0.0%) | 0 (0.0%) |
| 1 or 2 Children | 0 (0.0%) | 0 (0.0%) |
| 3 or 4 Children | 0 (0.0%) | 0 (0.0%) |
| 5 or more Children | 0 (0.0%) | 0 (0.0%) |
| Total | 0 (0.0%) | 0 (0.0%) |
Employment Characteristics in Gardiner
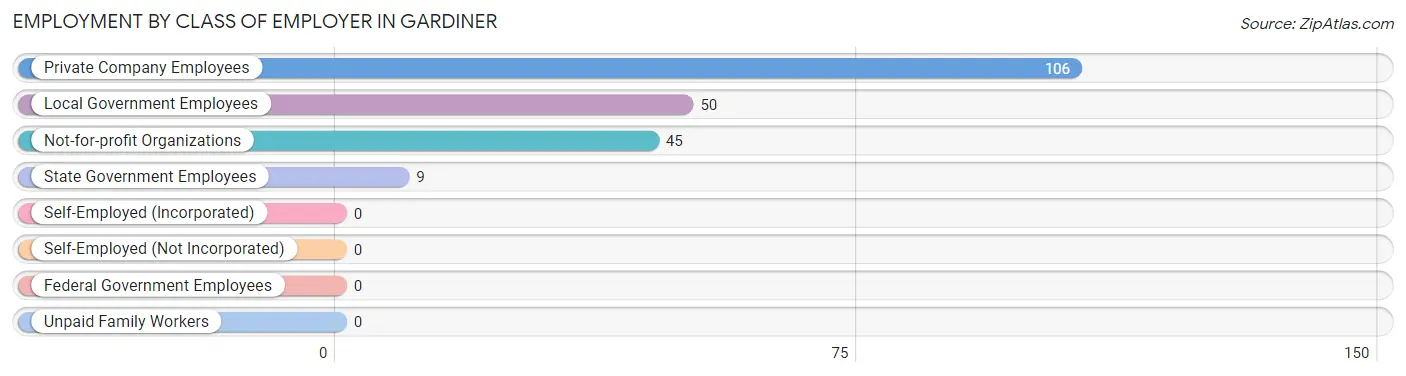
Employment by Class of Employer in Gardiner
Among the 210 employed individuals in Gardiner, private company employees (106 | 50.5%), local government employees (50 | 23.8%), and not-for-profit organizations (45 | 21.4%) make up the most common classes of employment.
| Employer Class | # Employees | % Employees |
| Private Company Employees | 106 | 50.5% |
| Self-Employed (Incorporated) | 0 | 0.0% |
| Self-Employed (Not Incorporated) | 0 | 0.0% |
| Not-for-profit Organizations | 45 | 21.4% |
| Local Government Employees | 50 | 23.8% |
| State Government Employees | 9 | 4.3% |
| Federal Government Employees | 0 | 0.0% |
| Unpaid Family Workers | 0 | 0.0% |
| Total | 210 | 100.0% |
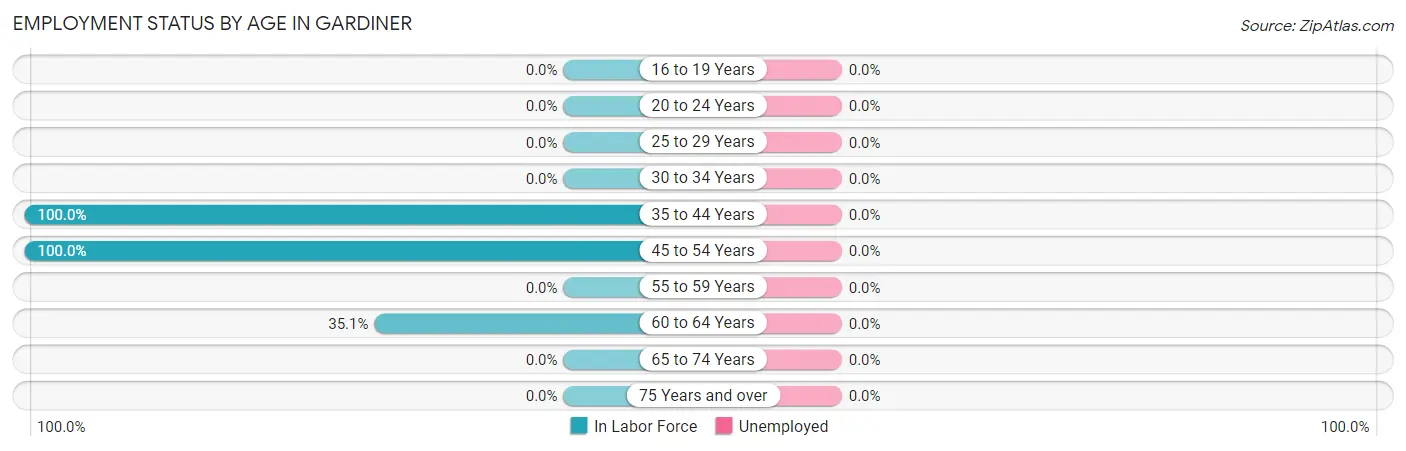
Employment Status by Age in Gardiner
| Age Bracket | In Labor Force | Unemployed |
| 16 to 19 Years | 0 (0.0%) | 0 (0.0%) |
| 20 to 24 Years | 0 (0.0%) | 0 (0.0%) |
| 25 to 29 Years | 0 (0.0%) | 0 (0.0%) |
| 30 to 34 Years | 0 (0.0%) | 0 (0.0%) |
| 35 to 44 Years | 60 (100.0%) | 0 (0.0%) |
| 45 to 54 Years | 244 (100.0%) | 0 (0.0%) |
| 55 to 59 Years | 0 (0.0%) | 0 (0.0%) |
| 60 to 64 Years | 13 (35.1%) | 0 (0.0%) |
| 65 to 74 Years | 0 (0.0%) | 0 (0.0%) |
| 75 Years and over | 0 (0.0%) | 0 (0.0%) |
| Total | 317 (74.4%) | 0 (0.0%) |
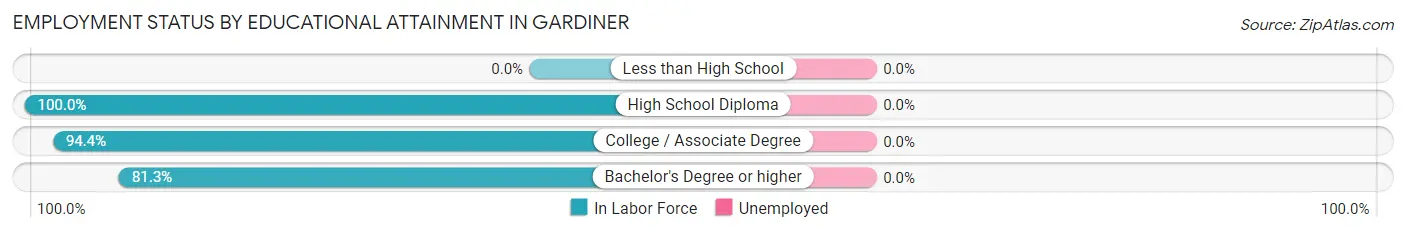
Employment Status by Educational Attainment in Gardiner
| Educational Attainment | In Labor Force | Unemployed |
| Less than High School | 0 (0.0%) | 0 (0.0%) |
| High School Diploma | 89 (100.0%) | 0 (0.0%) |
| College / Associate Degree | 167 (94.4%) | 0 (0.0%) |
| Bachelor's Degree or higher | 61 (81.3%) | 0 (0.0%) |
| Total | 317 (93.0%) | 0 (0.0%) |
Employment Occupations by Sex in Gardiner
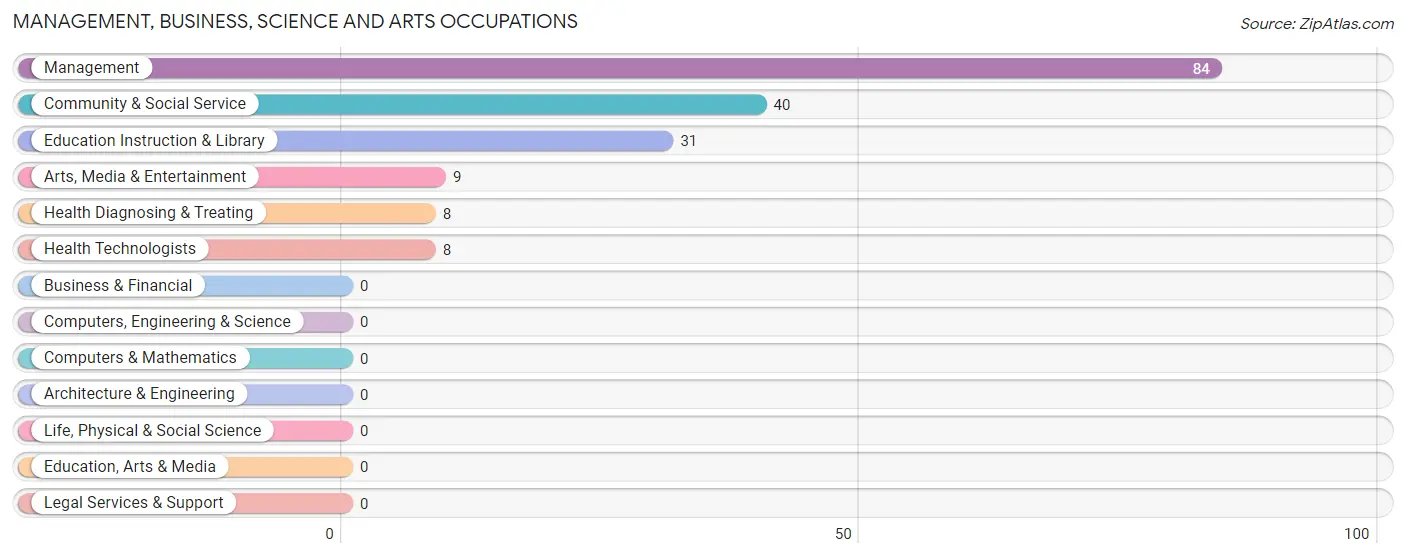
Management, Business, Science and Arts Occupations
The most common Management, Business, Science and Arts occupations in Gardiner are Management (84 | 26.5%), Community & Social Service (40 | 12.6%), Education Instruction & Library (31 | 9.8%), Arts, Media & Entertainment (9 | 2.8%), and Health Diagnosing & Treating (8 | 2.5%).
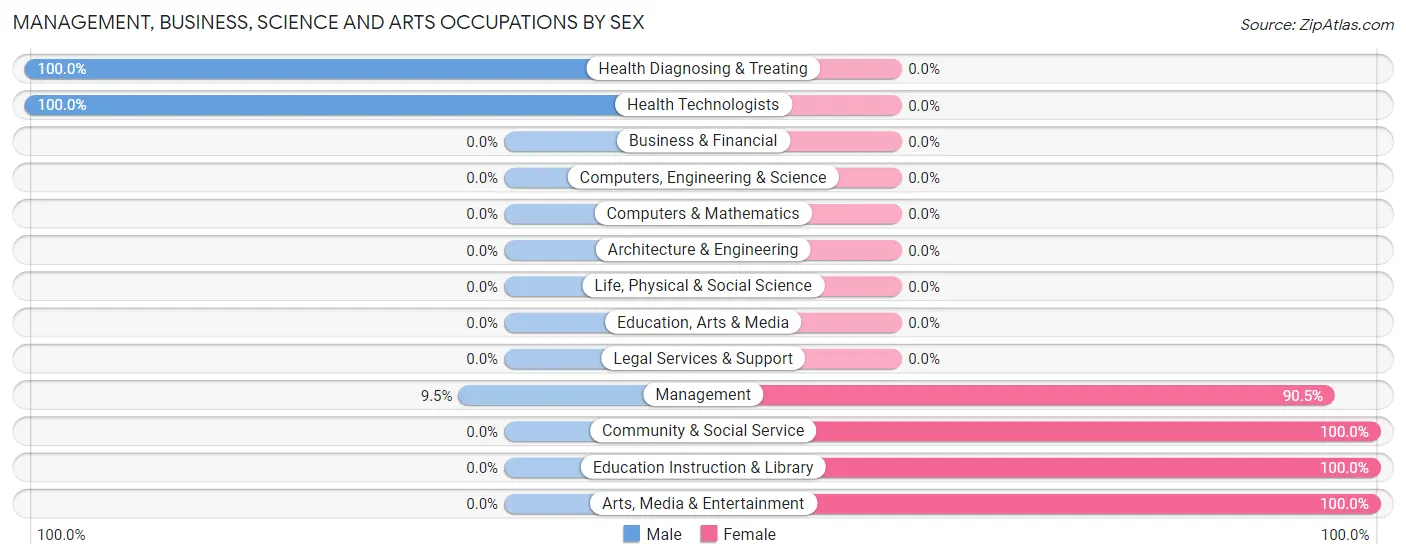
Management, Business, Science and Arts Occupations by Sex
Within the Management, Business, Science and Arts occupations in Gardiner, the most male-oriented occupations are Health Diagnosing & Treating (100.0%), Health Technologists (100.0%), and Management (9.5%), while the most female-oriented occupations are Community & Social Service (100.0%), Education Instruction & Library (100.0%), and Arts, Media & Entertainment (100.0%).
| Occupation | Male | Female |
| Management | 8 (9.5%) | 76 (90.5%) |
| Business & Financial | 0 (0.0%) | 0 (0.0%) |
| Computers, Engineering & Science | 0 (0.0%) | 0 (0.0%) |
| Computers & Mathematics | 0 (0.0%) | 0 (0.0%) |
| Architecture & Engineering | 0 (0.0%) | 0 (0.0%) |
| Life, Physical & Social Science | 0 (0.0%) | 0 (0.0%) |
| Community & Social Service | 0 (0.0%) | 40 (100.0%) |
| Education, Arts & Media | 0 (0.0%) | 0 (0.0%) |
| Legal Services & Support | 0 (0.0%) | 0 (0.0%) |
| Education Instruction & Library | 0 (0.0%) | 31 (100.0%) |
| Arts, Media & Entertainment | 0 (0.0%) | 9 (100.0%) |
| Health Diagnosing & Treating | 8 (100.0%) | 0 (0.0%) |
| Health Technologists | 8 (100.0%) | 0 (0.0%) |
| Total (Category) | 16 (12.1%) | 116 (87.9%) |
| Total (Overall) | 189 (59.6%) | 128 (40.4%) |
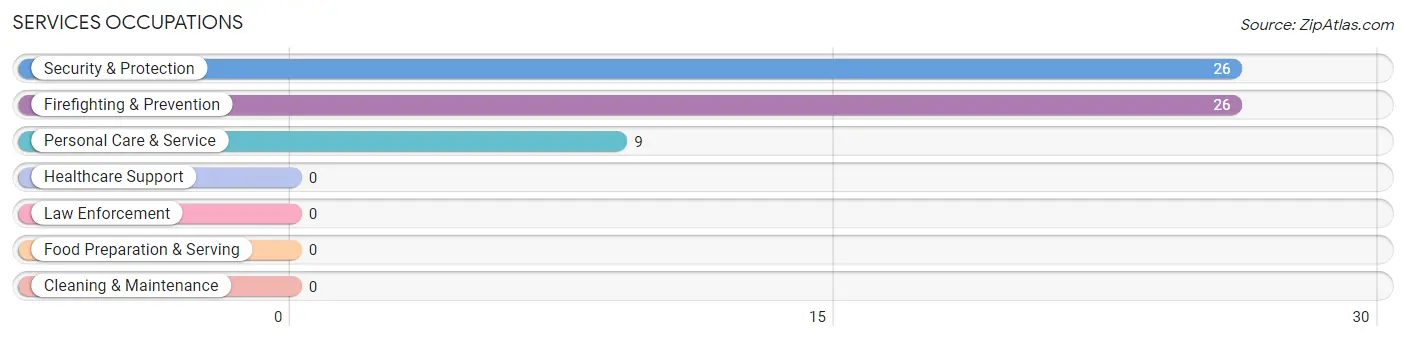
Services Occupations
The most common Services occupations in Gardiner are Security & Protection (26 | 8.2%), Firefighting & Prevention (26 | 8.2%), and Personal Care & Service (9 | 2.8%).
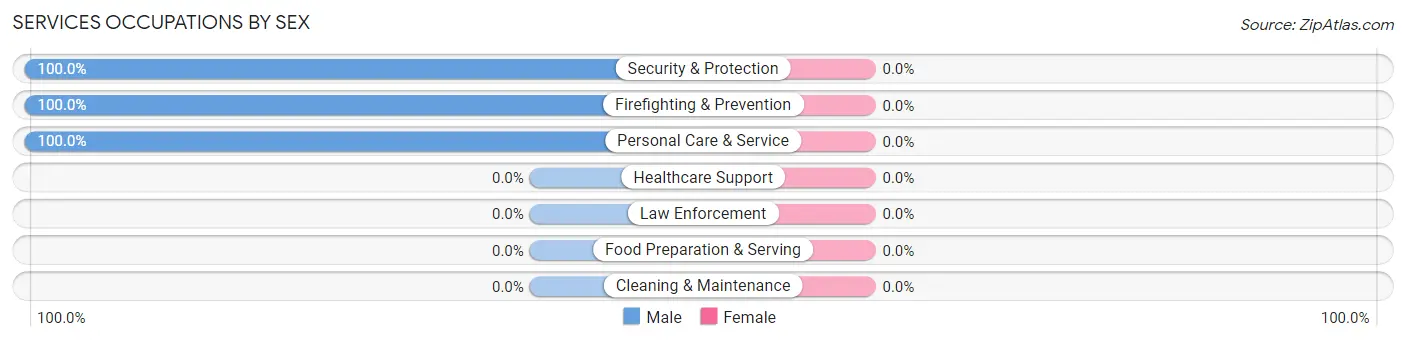
Services Occupations by Sex
| Occupation | Male | Female |
| Healthcare Support | 0 (0.0%) | 0 (0.0%) |
| Security & Protection | 26 (100.0%) | 0 (0.0%) |
| Firefighting & Prevention | 26 (100.0%) | 0 (0.0%) |
| Law Enforcement | 0 (0.0%) | 0 (0.0%) |
| Food Preparation & Serving | 0 (0.0%) | 0 (0.0%) |
| Cleaning & Maintenance | 0 (0.0%) | 0 (0.0%) |
| Personal Care & Service | 9 (100.0%) | 0 (0.0%) |
| Total (Category) | 35 (100.0%) | 0 (0.0%) |
| Total (Overall) | 189 (59.6%) | 128 (40.4%) |
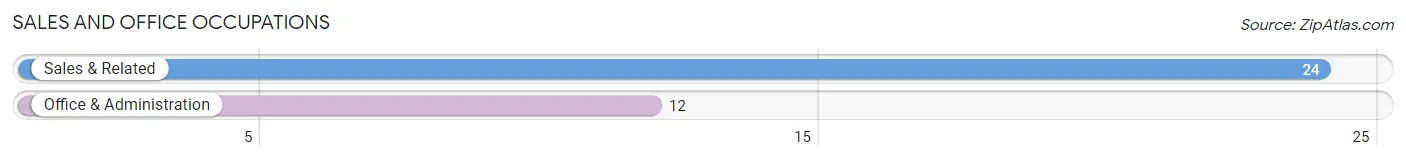
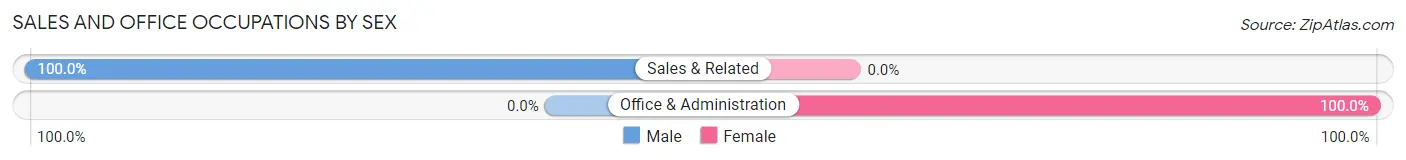
Sales and Office Occupations
The most common Sales and Office occupations in Gardiner are Sales & Related (24 | 7.6%), and Office & Administration (12 | 3.8%).
Sales and Office Occupations by Sex
| Occupation | Male | Female |
| Sales & Related | 24 (100.0%) | 0 (0.0%) |
| Office & Administration | 0 (0.0%) | 12 (100.0%) |
| Total (Category) | 24 (66.7%) | 12 (33.3%) |
| Total (Overall) | 189 (59.6%) | 128 (40.4%) |
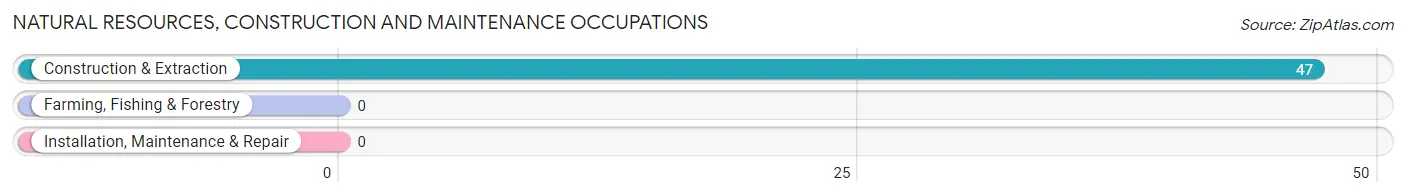
Natural Resources, Construction and Maintenance Occupations
The most common Natural Resources, Construction and Maintenance occupations in Gardiner are , and Construction & Extraction (47 | 14.8%).
Natural Resources, Construction and Maintenance Occupations by Sex
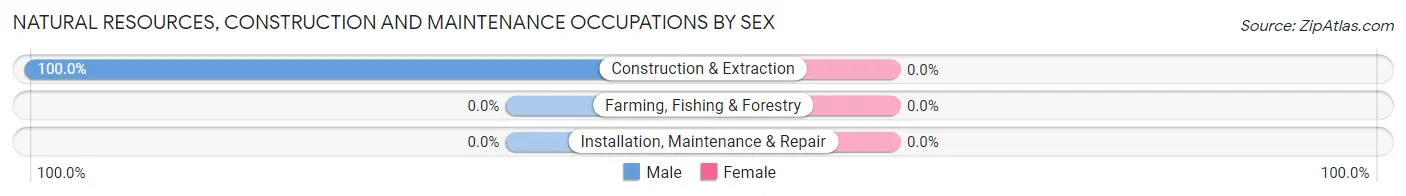
| Occupation | Male | Female |
| Farming, Fishing & Forestry | 0 (0.0%) | 0 (0.0%) |
| Construction & Extraction | 47 (100.0%) | 0 (0.0%) |
| Installation, Maintenance & Repair | 0 (0.0%) | 0 (0.0%) |
| Total (Category) | 47 (100.0%) | 0 (0.0%) |
| Total (Overall) | 189 (59.6%) | 128 (40.4%) |
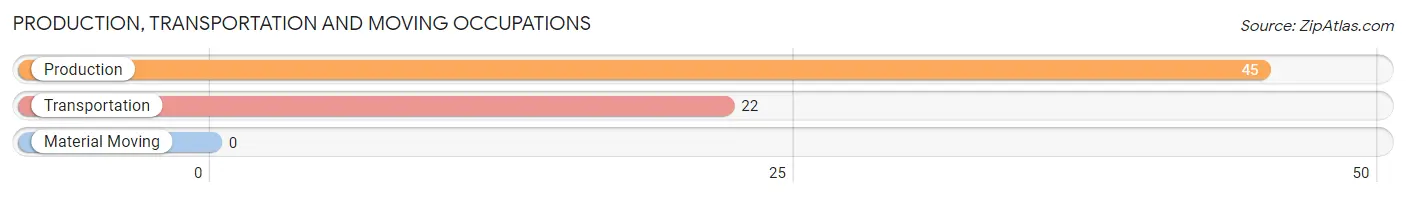
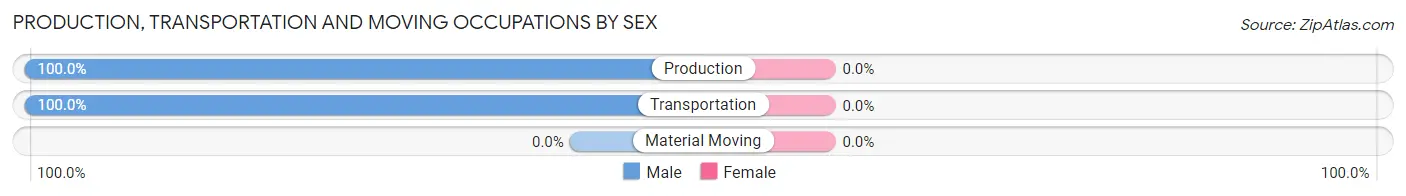
Production, Transportation and Moving Occupations
The most common Production, Transportation and Moving occupations in Gardiner are Production (45 | 14.2%), and Transportation (22 | 6.9%).
Production, Transportation and Moving Occupations by Sex
| Occupation | Male | Female |
| Production | 45 (100.0%) | 0 (0.0%) |
| Transportation | 22 (100.0%) | 0 (0.0%) |
| Material Moving | 0 (0.0%) | 0 (0.0%) |
| Total (Category) | 67 (100.0%) | 0 (0.0%) |
| Total (Overall) | 189 (59.6%) | 128 (40.4%) |
Employment Industries by Sex in Gardiner
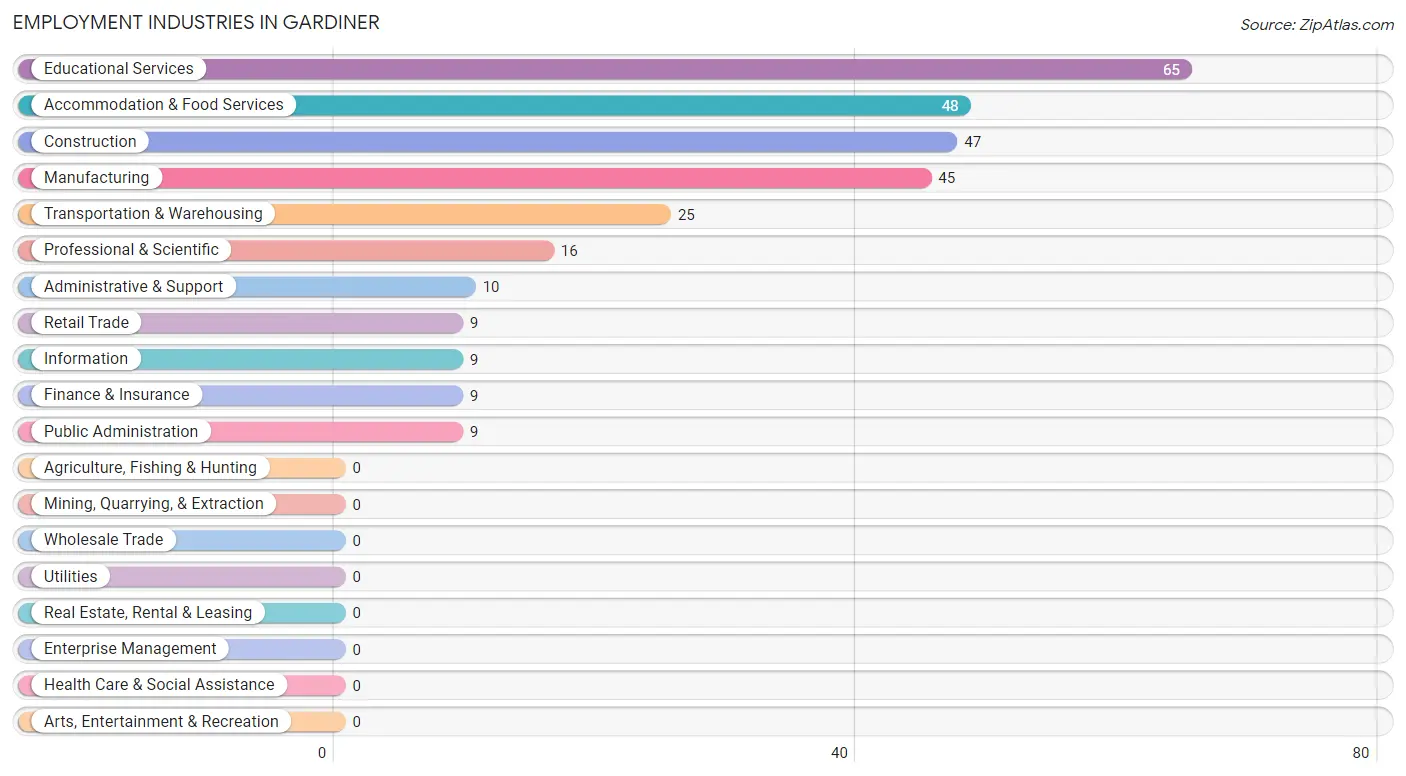
Employment Industries in Gardiner
The major employment industries in Gardiner include Educational Services (65 | 20.5%), Accommodation & Food Services (48 | 15.1%), Construction (47 | 14.8%), Manufacturing (45 | 14.2%), and Transportation & Warehousing (25 | 7.9%).
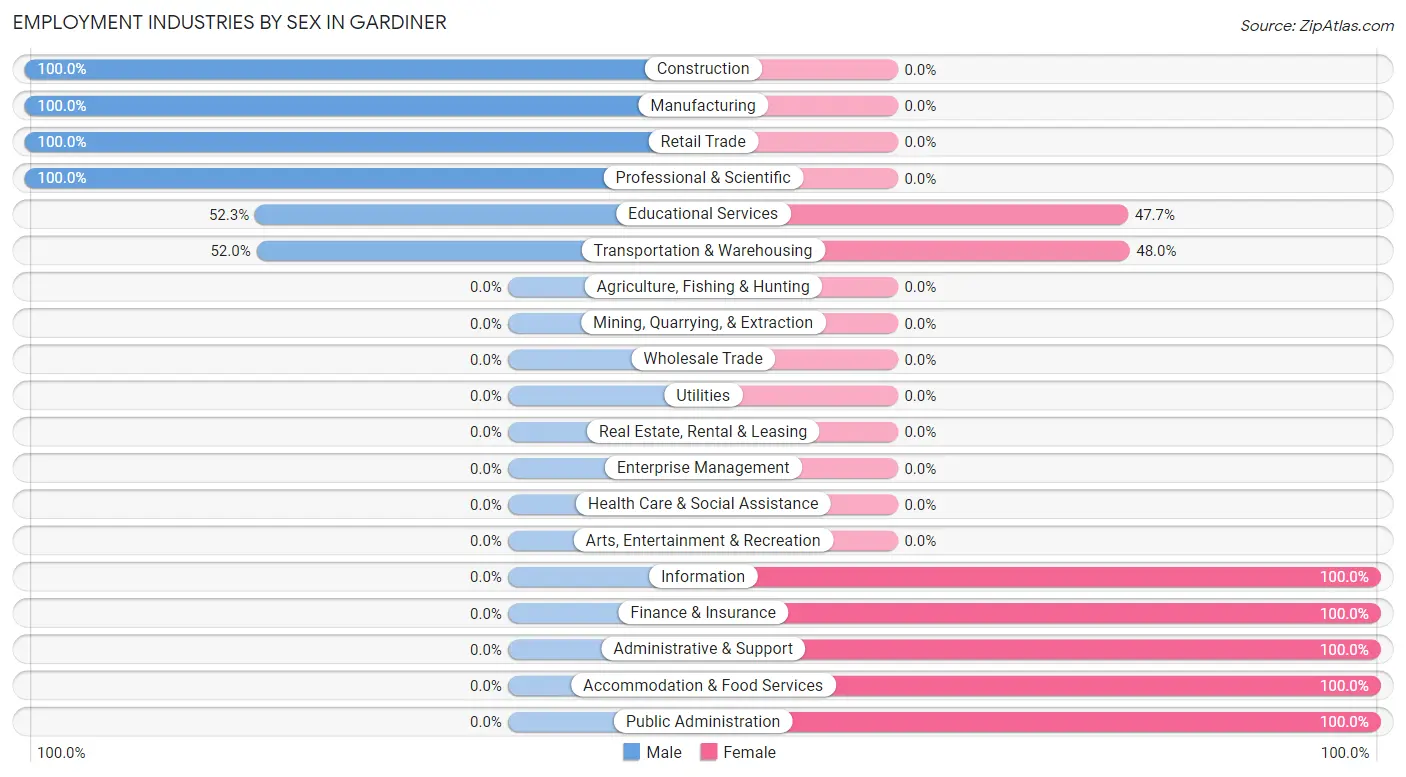
Employment Industries by Sex in Gardiner
The Gardiner industries that see more men than women are Construction (100.0%), Manufacturing (100.0%), and Retail Trade (100.0%), whereas the industries that tend to have a higher number of women are Information (100.0%), Finance & Insurance (100.0%), and Administrative & Support (100.0%).
| Industry | Male | Female |
| Agriculture, Fishing & Hunting | 0 (0.0%) | 0 (0.0%) |
| Mining, Quarrying, & Extraction | 0 (0.0%) | 0 (0.0%) |
| Construction | 47 (100.0%) | 0 (0.0%) |
| Manufacturing | 45 (100.0%) | 0 (0.0%) |
| Wholesale Trade | 0 (0.0%) | 0 (0.0%) |
| Retail Trade | 9 (100.0%) | 0 (0.0%) |
| Transportation & Warehousing | 13 (52.0%) | 12 (48.0%) |
| Utilities | 0 (0.0%) | 0 (0.0%) |
| Information | 0 (0.0%) | 9 (100.0%) |
| Finance & Insurance | 0 (0.0%) | 9 (100.0%) |
| Real Estate, Rental & Leasing | 0 (0.0%) | 0 (0.0%) |
| Professional & Scientific | 16 (100.0%) | 0 (0.0%) |
| Enterprise Management | 0 (0.0%) | 0 (0.0%) |
| Administrative & Support | 0 (0.0%) | 10 (100.0%) |
| Educational Services | 34 (52.3%) | 31 (47.7%) |
| Health Care & Social Assistance | 0 (0.0%) | 0 (0.0%) |
| Arts, Entertainment & Recreation | 0 (0.0%) | 0 (0.0%) |
| Accommodation & Food Services | 0 (0.0%) | 48 (100.0%) |
| Public Administration | 0 (0.0%) | 9 (100.0%) |
| Total | 189 (59.6%) | 128 (40.4%) |
Education in Gardiner
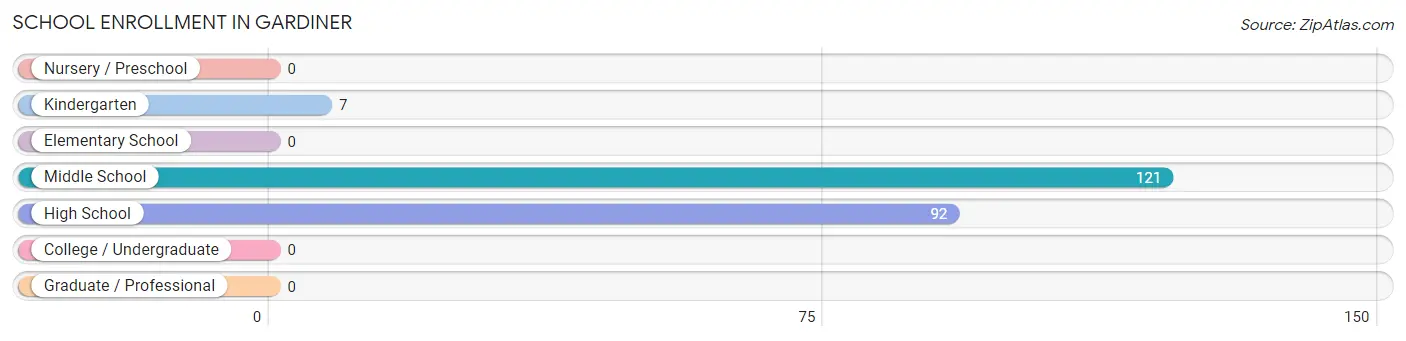
School Enrollment in Gardiner
The most common levels of schooling among the 220 students in Gardiner are middle school (121 | 55.0%), high school (92 | 41.8%), and kindergarten (7 | 3.2%).
| School Level | # Students | % Students |
| Nursery / Preschool | 0 | 0.0% |
| Kindergarten | 7 | 3.2% |
| Elementary School | 0 | 0.0% |
| Middle School | 121 | 55.0% |
| High School | 92 | 41.8% |
| College / Undergraduate | 0 | 0.0% |
| Graduate / Professional | 0 | 0.0% |
| Total | 220 | 100.0% |
School Enrollment by Age by Funding Source in Gardiner
Out of a total of 220 students who are enrolled in schools in Gardiner, 7 (3.2%) attend a private institution, while the remaining 213 (96.8%) are enrolled in public schools. The age group of 5 to 9 year old has the highest likelihood of being enrolled in private schools, with 7 (100.0% in the age bracket) enrolled. Conversely, the age group of 10 to 14 year olds has the lowest likelihood of being enrolled in a private school, with 121 (100.0% in the age bracket) attending a public institution.
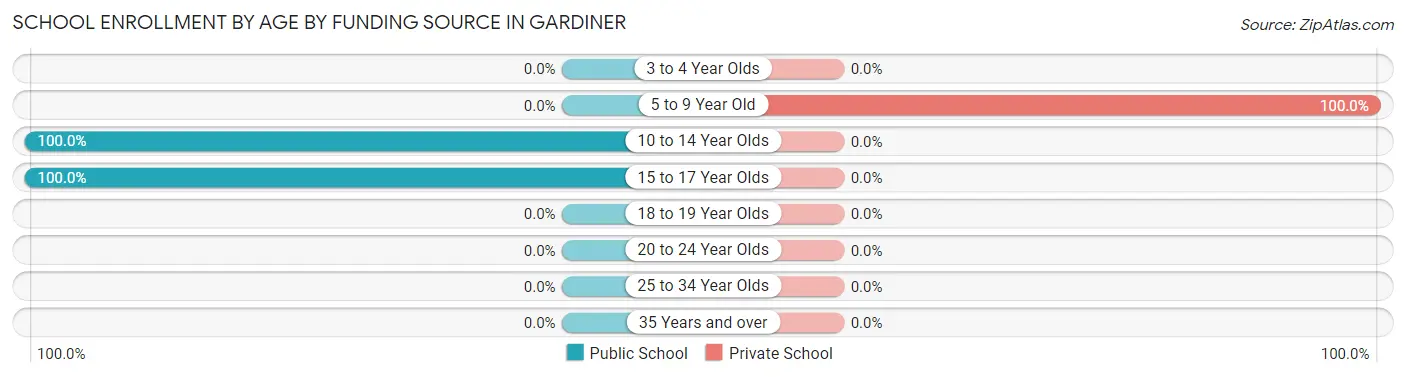
| Age Bracket | Public School | Private School |
| 3 to 4 Year Olds | 0 (0.0%) | 0 (0.0%) |
| 5 to 9 Year Old | 0 (0.0%) | 7 (100.0%) |
| 10 to 14 Year Olds | 121 (100.0%) | 0 (0.0%) |
| 15 to 17 Year Olds | 92 (100.0%) | 0 (0.0%) |
| 18 to 19 Year Olds | 0 (0.0%) | 0 (0.0%) |
| 20 to 24 Year Olds | 0 (0.0%) | 0 (0.0%) |
| 25 to 34 Year Olds | 0 (0.0%) | 0 (0.0%) |
| 35 Years and over | 0 (0.0%) | 0 (0.0%) |
| Total | 213 (96.8%) | 7 (3.2%) |
Educational Attainment by Field of Study in Gardiner
Education (24 | 26.4%), visual & performing arts (15 | 16.5%), bio, nature & agricultural (14 | 15.4%), liberal arts & history (13 | 14.3%), and science & technology (9 | 9.9%) are the most common fields of study among 91 individuals in Gardiner who have obtained a bachelor's degree or higher.
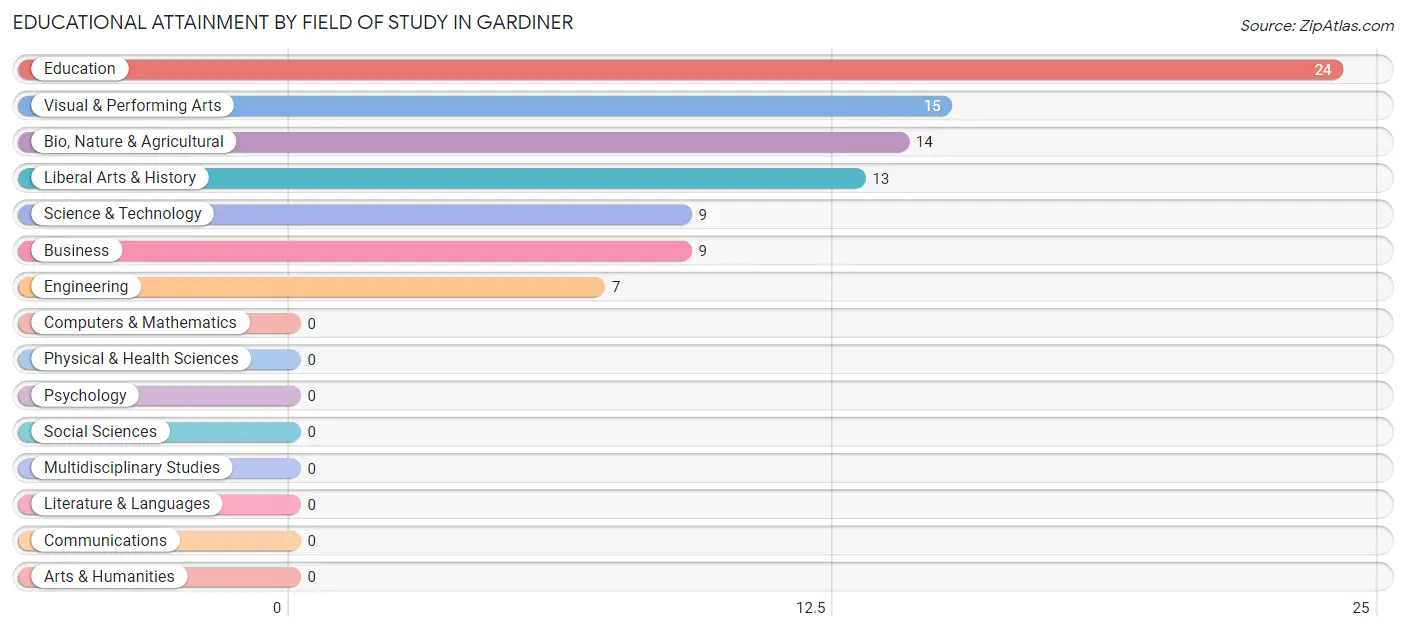
| Field of Study | # Graduates | % Graduates |
| Computers & Mathematics | 0 | 0.0% |
| Bio, Nature & Agricultural | 14 | 15.4% |
| Physical & Health Sciences | 0 | 0.0% |
| Psychology | 0 | 0.0% |
| Social Sciences | 0 | 0.0% |
| Engineering | 7 | 7.7% |
| Multidisciplinary Studies | 0 | 0.0% |
| Science & Technology | 9 | 9.9% |
| Business | 9 | 9.9% |
| Education | 24 | 26.4% |
| Literature & Languages | 0 | 0.0% |
| Liberal Arts & History | 13 | 14.3% |
| Visual & Performing Arts | 15 | 16.5% |
| Communications | 0 | 0.0% |
| Arts & Humanities | 0 | 0.0% |
| Total | 91 | 100.0% |
Transportation & Commute in Gardiner
Vehicle Availability by Sex in Gardiner
The most prevalent vehicle ownership categories in Gardiner are males with 4 vehicles (71, accounting for 50.0%) and females with 4 vehicles (24, making up 104.4%).
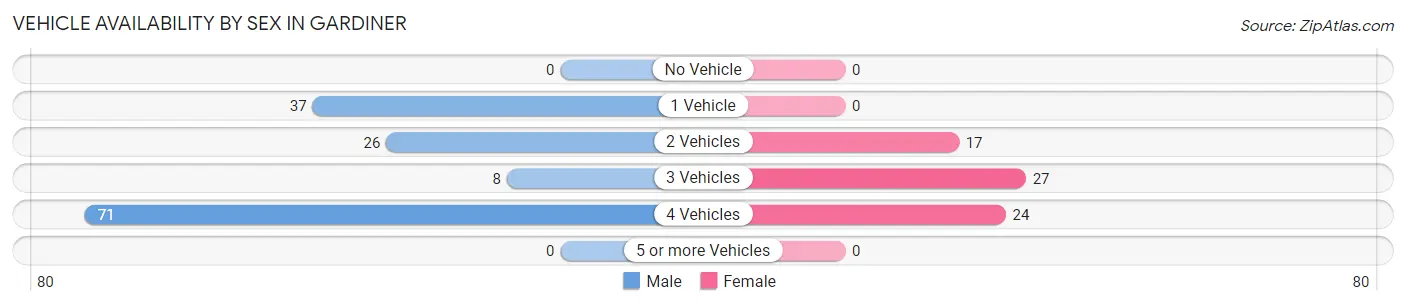
| Vehicles Available | Male | Female |
| No Vehicle | 0 (0.0%) | 0 (0.0%) |
| 1 Vehicle | 37 (26.1%) | 0 (0.0%) |
| 2 Vehicles | 26 (18.3%) | 17 (25.0%) |
| 3 Vehicles | 8 (5.6%) | 27 (39.7%) |
| 4 Vehicles | 71 (50.0%) | 24 (35.3%) |
| 5 or more Vehicles | 0 (0.0%) | 0 (0.0%) |
| Total | 142 (100.0%) | 68 (100.0%) |
Commute Time in Gardiner
The most frequently occuring commute durations in Gardiner are 5 to 9 minutes (45 commuters, 22.3%), 90 or more minutes (41 commuters, 20.3%), and 25 to 29 minutes (32 commuters, 15.8%).
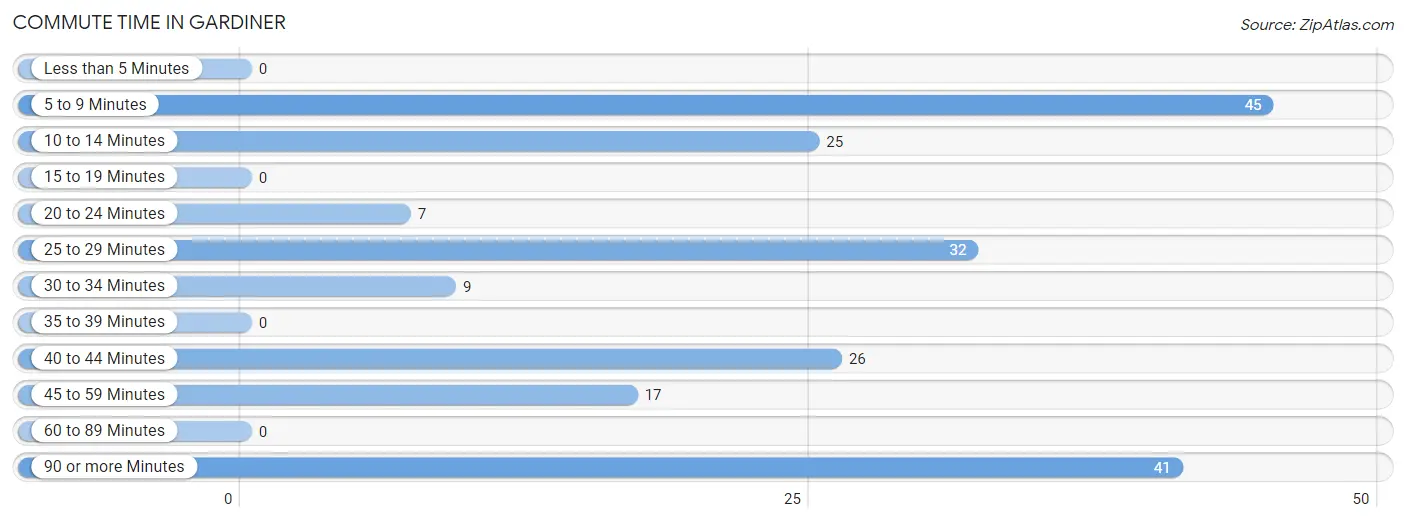
| Commute Time | # Commuters | % Commuters |
| Less than 5 Minutes | 0 | 0.0% |
| 5 to 9 Minutes | 45 | 22.3% |
| 10 to 14 Minutes | 25 | 12.4% |
| 15 to 19 Minutes | 0 | 0.0% |
| 20 to 24 Minutes | 7 | 3.5% |
| 25 to 29 Minutes | 32 | 15.8% |
| 30 to 34 Minutes | 9 | 4.5% |
| 35 to 39 Minutes | 0 | 0.0% |
| 40 to 44 Minutes | 26 | 12.9% |
| 45 to 59 Minutes | 17 | 8.4% |
| 60 to 89 Minutes | 0 | 0.0% |
| 90 or more Minutes | 41 | 20.3% |
Commute Time by Sex in Gardiner
The most common commute times in Gardiner are 5 to 9 minutes (45 commuters, 33.6%) for males and 90 or more minutes (28 commuters, 41.2%) for females.
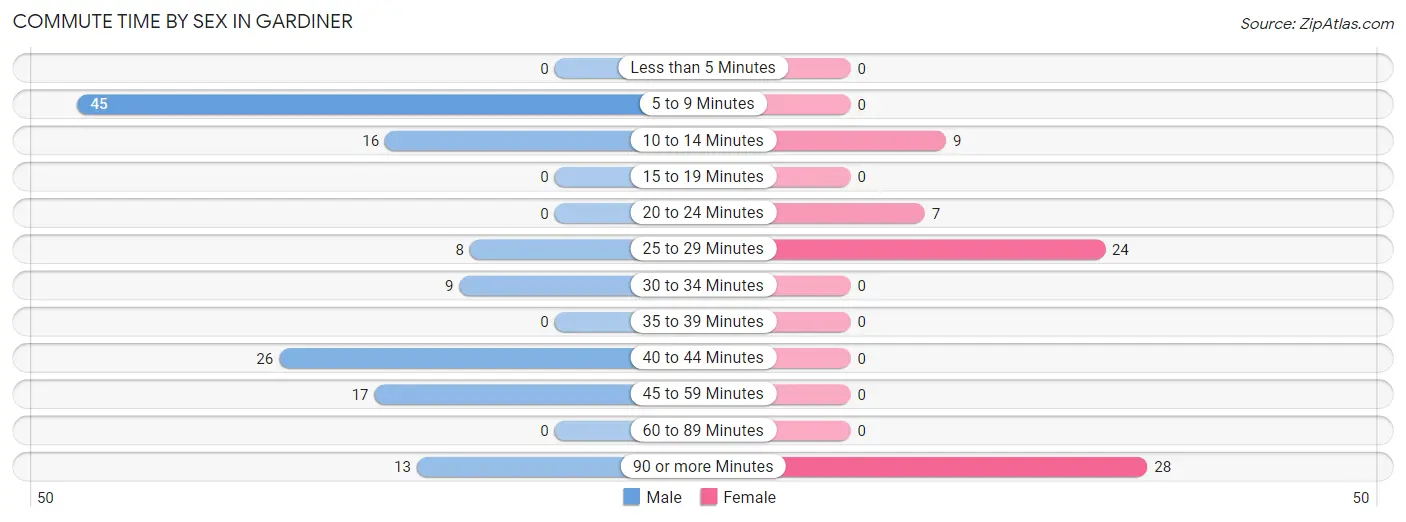
| Commute Time | Male | Female |
| Less than 5 Minutes | 0 (0.0%) | 0 (0.0%) |
| 5 to 9 Minutes | 45 (33.6%) | 0 (0.0%) |
| 10 to 14 Minutes | 16 (11.9%) | 9 (13.2%) |
| 15 to 19 Minutes | 0 (0.0%) | 0 (0.0%) |
| 20 to 24 Minutes | 0 (0.0%) | 7 (10.3%) |
| 25 to 29 Minutes | 8 (6.0%) | 24 (35.3%) |
| 30 to 34 Minutes | 9 (6.7%) | 0 (0.0%) |
| 35 to 39 Minutes | 0 (0.0%) | 0 (0.0%) |
| 40 to 44 Minutes | 26 (19.4%) | 0 (0.0%) |
| 45 to 59 Minutes | 17 (12.7%) | 0 (0.0%) |
| 60 to 89 Minutes | 0 (0.0%) | 0 (0.0%) |
| 90 or more Minutes | 13 (9.7%) | 28 (41.2%) |
Time of Departure to Work by Sex in Gardiner
The most frequent times of departure to work in Gardiner are 7:30 AM to 7:59 AM (61, 45.5%) for males and 7:00 AM to 7:29 AM (40, 58.8%) for females.
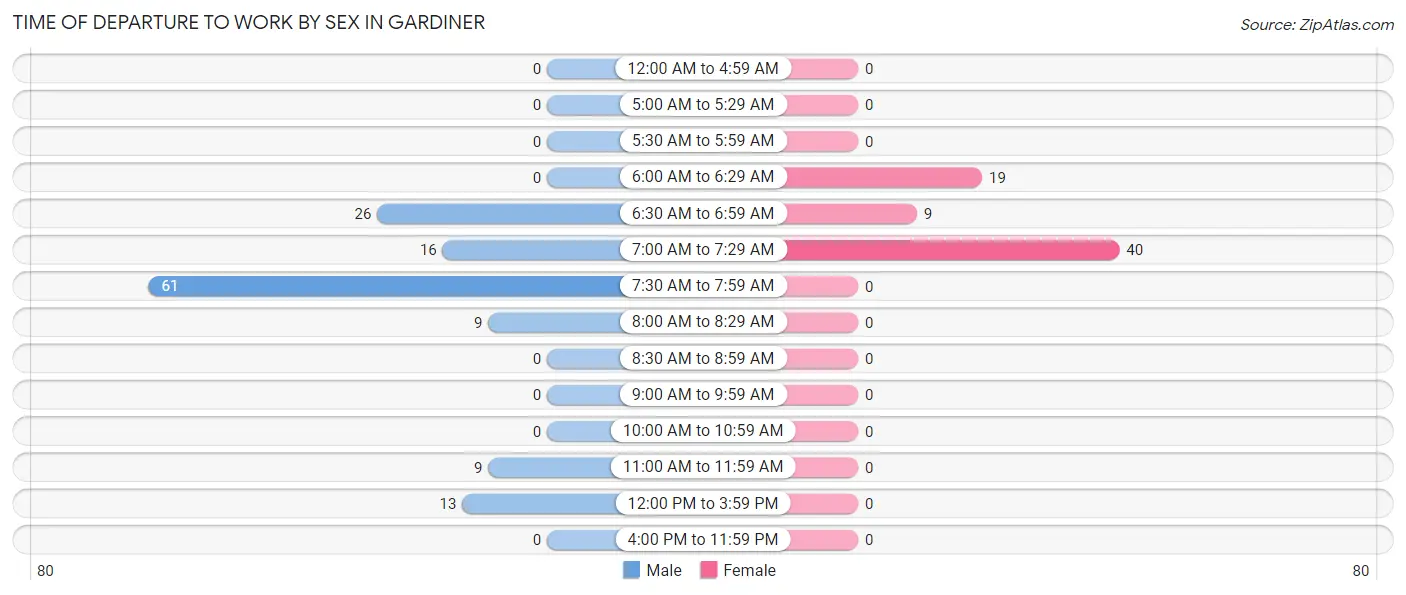
| Time of Departure | Male | Female |
| 12:00 AM to 4:59 AM | 0 (0.0%) | 0 (0.0%) |
| 5:00 AM to 5:29 AM | 0 (0.0%) | 0 (0.0%) |
| 5:30 AM to 5:59 AM | 0 (0.0%) | 0 (0.0%) |
| 6:00 AM to 6:29 AM | 0 (0.0%) | 19 (27.9%) |
| 6:30 AM to 6:59 AM | 26 (19.4%) | 9 (13.2%) |
| 7:00 AM to 7:29 AM | 16 (11.9%) | 40 (58.8%) |
| 7:30 AM to 7:59 AM | 61 (45.5%) | 0 (0.0%) |
| 8:00 AM to 8:29 AM | 9 (6.7%) | 0 (0.0%) |
| 8:30 AM to 8:59 AM | 0 (0.0%) | 0 (0.0%) |
| 9:00 AM to 9:59 AM | 0 (0.0%) | 0 (0.0%) |
| 10:00 AM to 10:59 AM | 0 (0.0%) | 0 (0.0%) |
| 11:00 AM to 11:59 AM | 9 (6.7%) | 0 (0.0%) |
| 12:00 PM to 3:59 PM | 13 (9.7%) | 0 (0.0%) |
| 4:00 PM to 11:59 PM | 0 (0.0%) | 0 (0.0%) |
| Total | 134 (100.0%) | 68 (100.0%) |
Housing Occupancy in Gardiner
Occupancy by Ownership in Gardiner
Of the total 196 dwellings in Gardiner, owner-occupied units account for 77 (39.3%), while renter-occupied units make up 119 (60.7%).
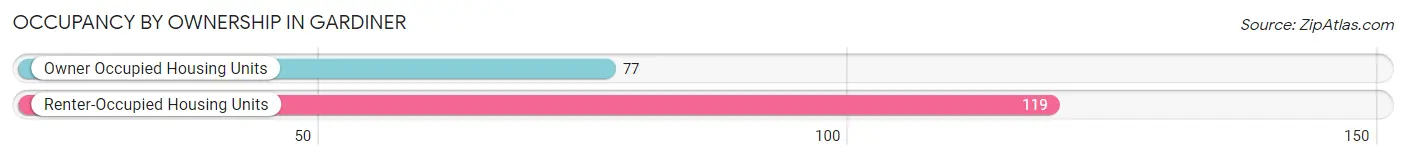
| Occupancy | # Housing Units | % Housing Units |
| Owner Occupied Housing Units | 77 | 39.3% |
| Renter-Occupied Housing Units | 119 | 60.7% |
| Total Occupied Housing Units | 196 | 100.0% |
Occupancy by Household Size in Gardiner
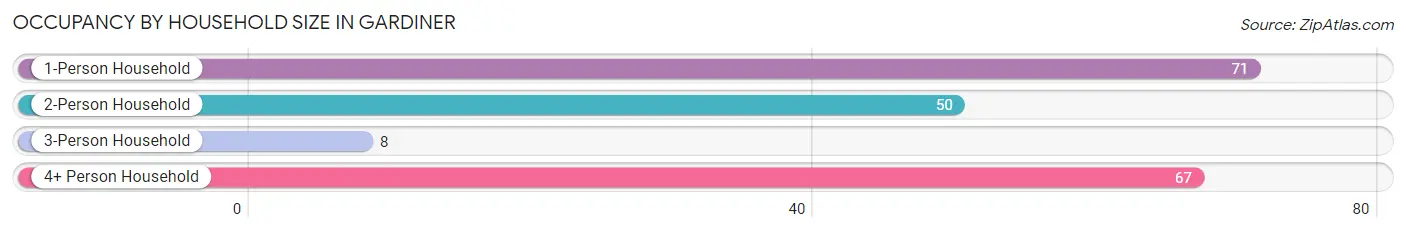
| Household Size | # Housing Units | % Housing Units |
| 1-Person Household | 71 | 36.2% |
| 2-Person Household | 50 | 25.5% |
| 3-Person Household | 8 | 4.1% |
| 4+ Person Household | 67 | 34.2% |
| Total Housing Units | 196 | 100.0% |
Occupancy by Ownership by Household Size in Gardiner
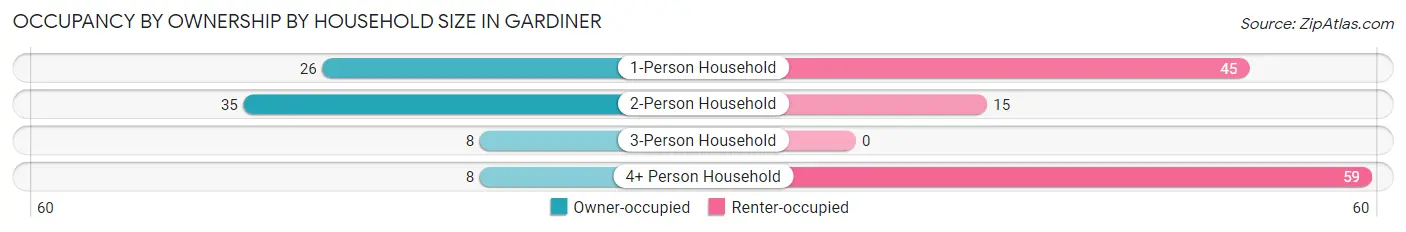
| Household Size | Owner-occupied | Renter-occupied |
| 1-Person Household | 26 (36.6%) | 45 (63.4%) |
| 2-Person Household | 35 (70.0%) | 15 (30.0%) |
| 3-Person Household | 8 (100.0%) | 0 (0.0%) |
| 4+ Person Household | 8 (11.9%) | 59 (88.1%) |
| Total Housing Units | 77 (39.3%) | 119 (60.7%) |
Occupancy by Educational Attainment in Gardiner
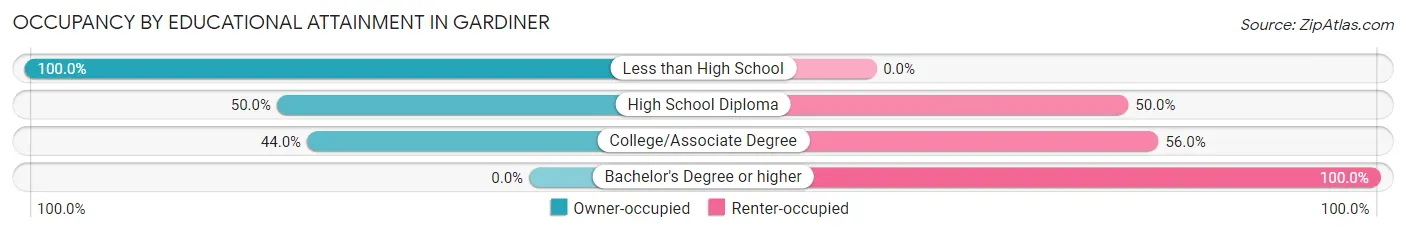
| Household Size | Owner-occupied | Renter-occupied |
| Less than High School | 9 (100.0%) | 0 (0.0%) |
| High School Diploma | 9 (50.0%) | 9 (50.0%) |
| College/Associate Degree | 59 (44.0%) | 75 (56.0%) |
| Bachelor's Degree or higher | 0 (0.0%) | 35 (100.0%) |
Occupancy by Age of Householder in Gardiner
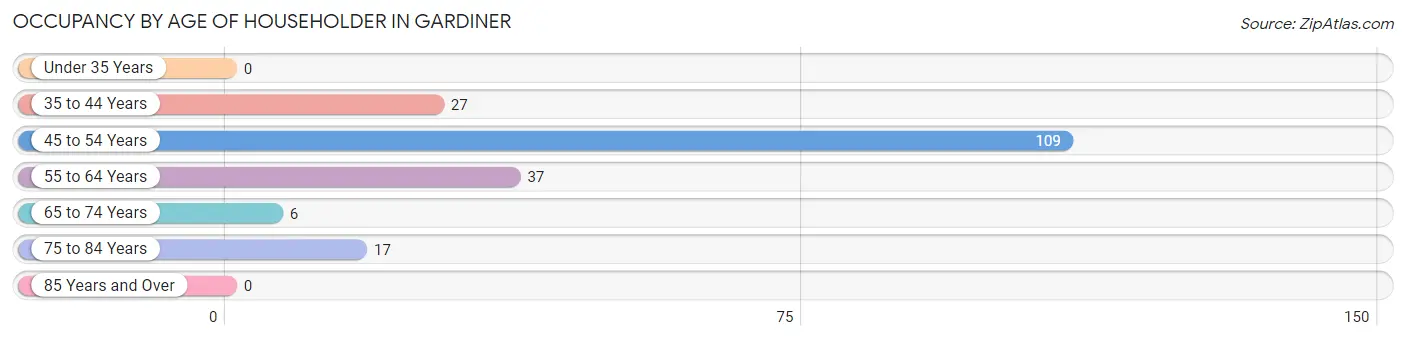
| Age Bracket | # Households | % Households |
| Under 35 Years | 0 | 0.0% |
| 35 to 44 Years | 27 | 13.8% |
| 45 to 54 Years | 109 | 55.6% |
| 55 to 64 Years | 37 | 18.9% |
| 65 to 74 Years | 6 | 3.1% |
| 75 to 84 Years | 17 | 8.7% |
| 85 Years and Over | 0 | 0.0% |
| Total | 196 | 100.0% |
Housing Finances in Gardiner
Median Income by Occupancy in Gardiner
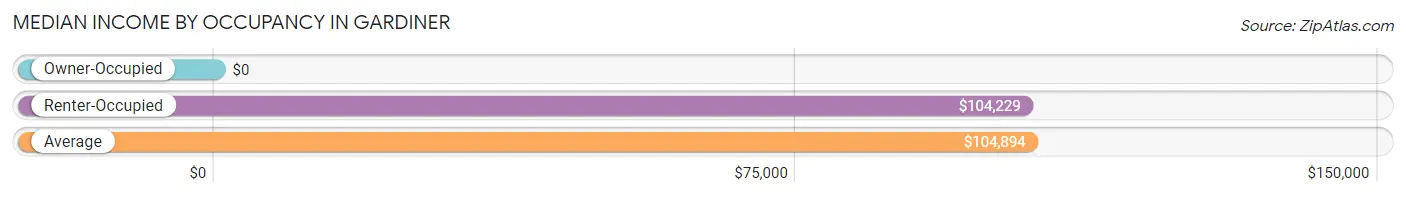
| Occupancy Type | # Households | Median Income |
| Owner-Occupied | 77 (39.3%) | $0 |
| Renter-Occupied | 119 (60.7%) | $104,229 |
| Average | 196 (100.0%) | $104,894 |
Occupancy by Householder Income Bracket in Gardiner
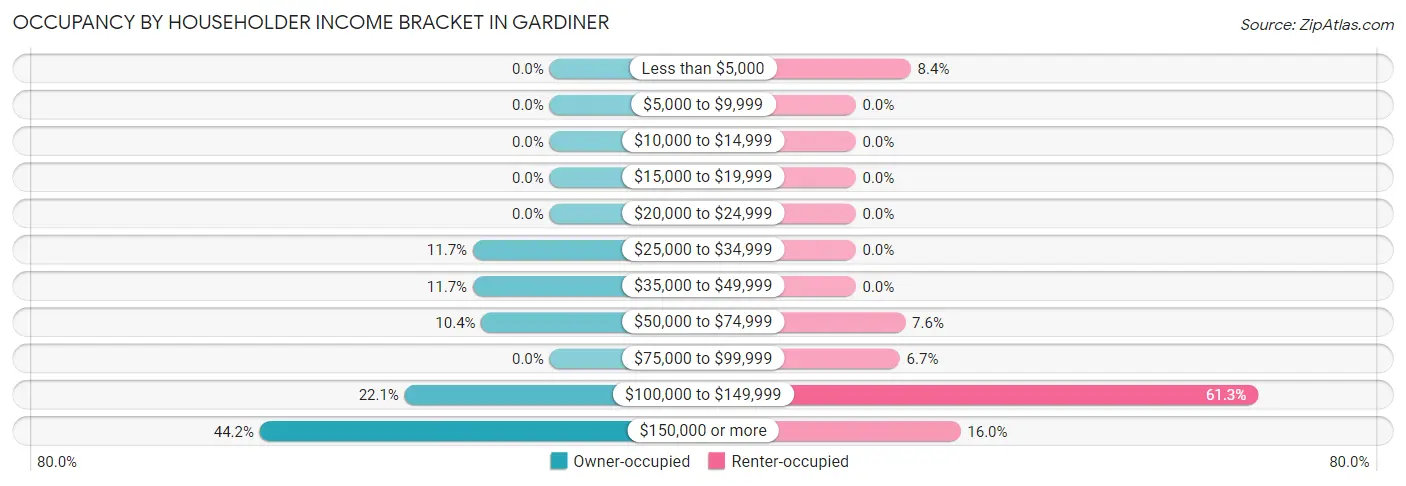
| Income Bracket | Owner-occupied | Renter-occupied |
| Less than $5,000 | 0 (0.0%) | 10 (8.4%) |
| $5,000 to $9,999 | 0 (0.0%) | 0 (0.0%) |
| $10,000 to $14,999 | 0 (0.0%) | 0 (0.0%) |
| $15,000 to $19,999 | 0 (0.0%) | 0 (0.0%) |
| $20,000 to $24,999 | 0 (0.0%) | 0 (0.0%) |
| $25,000 to $34,999 | 9 (11.7%) | 0 (0.0%) |
| $35,000 to $49,999 | 9 (11.7%) | 0 (0.0%) |
| $50,000 to $74,999 | 8 (10.4%) | 9 (7.6%) |
| $75,000 to $99,999 | 0 (0.0%) | 8 (6.7%) |
| $100,000 to $149,999 | 17 (22.1%) | 73 (61.3%) |
| $150,000 or more | 34 (44.2%) | 19 (16.0%) |
| Total | 77 (100.0%) | 119 (100.0%) |
Monthly Housing Cost Tiers in Gardiner
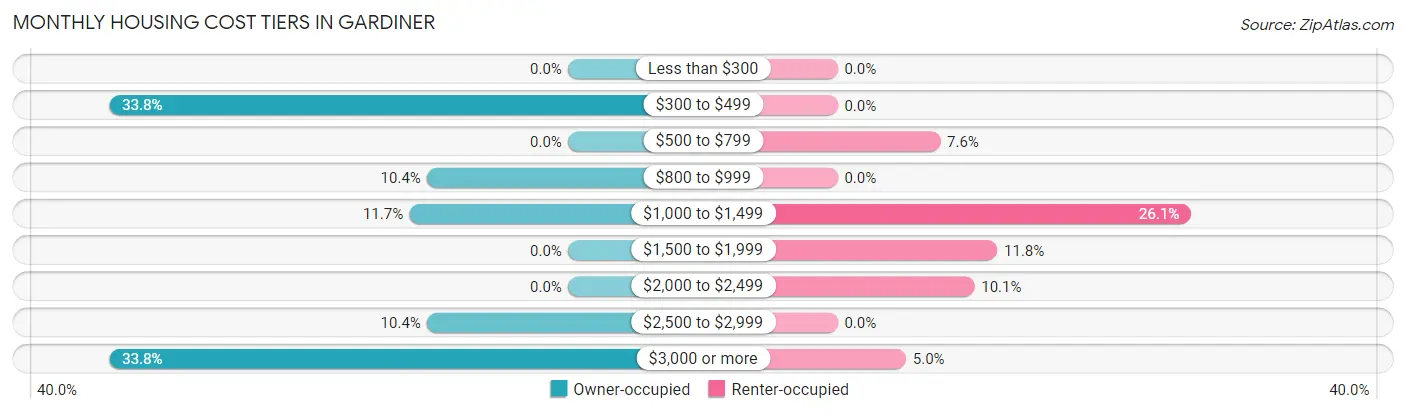
| Monthly Cost | Owner-occupied | Renter-occupied |
| Less than $300 | 0 (0.0%) | 0 (0.0%) |
| $300 to $499 | 26 (33.8%) | 0 (0.0%) |
| $500 to $799 | 0 (0.0%) | 9 (7.6%) |
| $800 to $999 | 8 (10.4%) | 0 (0.0%) |
| $1,000 to $1,499 | 9 (11.7%) | 31 (26.1%) |
| $1,500 to $1,999 | 0 (0.0%) | 14 (11.8%) |
| $2,000 to $2,499 | 0 (0.0%) | 12 (10.1%) |
| $2,500 to $2,999 | 8 (10.4%) | 0 (0.0%) |
| $3,000 or more | 26 (33.8%) | 6 (5.0%) |
| Total | 77 (100.0%) | 119 (100.0%) |
Physical Housing Characteristics in Gardiner
Housing Structures in Gardiner
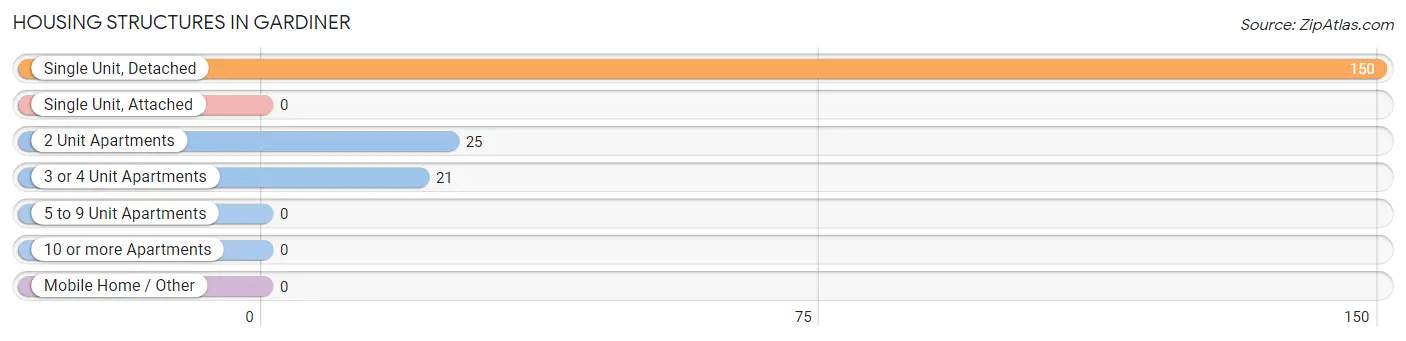
| Structure Type | # Housing Units | % Housing Units |
| Single Unit, Detached | 150 | 76.5% |
| Single Unit, Attached | 0 | 0.0% |
| 2 Unit Apartments | 25 | 12.8% |
| 3 or 4 Unit Apartments | 21 | 10.7% |
| 5 to 9 Unit Apartments | 0 | 0.0% |
| 10 or more Apartments | 0 | 0.0% |
| Mobile Home / Other | 0 | 0.0% |
| Total | 196 | 100.0% |
Housing Structures by Occupancy in Gardiner
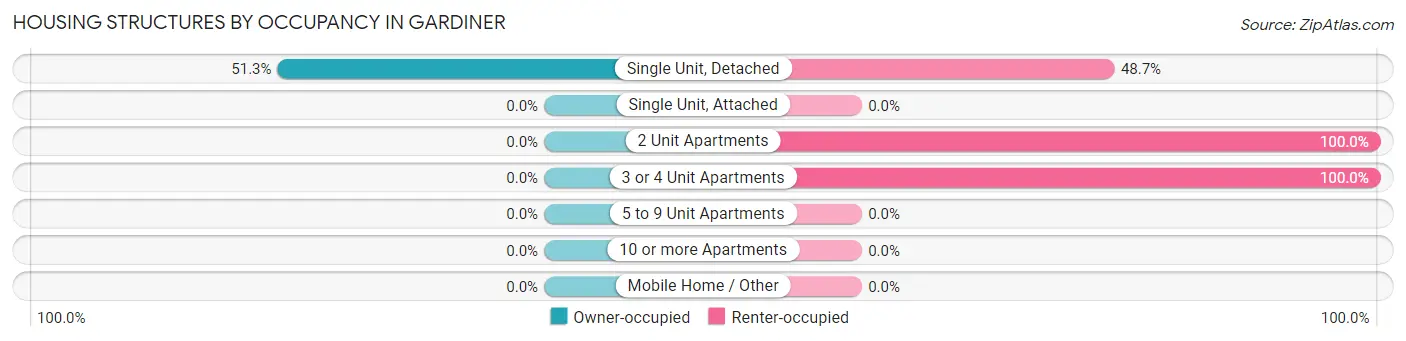
| Structure Type | Owner-occupied | Renter-occupied |
| Single Unit, Detached | 77 (51.3%) | 73 (48.7%) |
| Single Unit, Attached | 0 (0.0%) | 0 (0.0%) |
| 2 Unit Apartments | 0 (0.0%) | 25 (100.0%) |
| 3 or 4 Unit Apartments | 0 (0.0%) | 21 (100.0%) |
| 5 to 9 Unit Apartments | 0 (0.0%) | 0 (0.0%) |
| 10 or more Apartments | 0 (0.0%) | 0 (0.0%) |
| Mobile Home / Other | 0 (0.0%) | 0 (0.0%) |
| Total | 77 (39.3%) | 119 (60.7%) |
Housing Structures by Number of Rooms in Gardiner
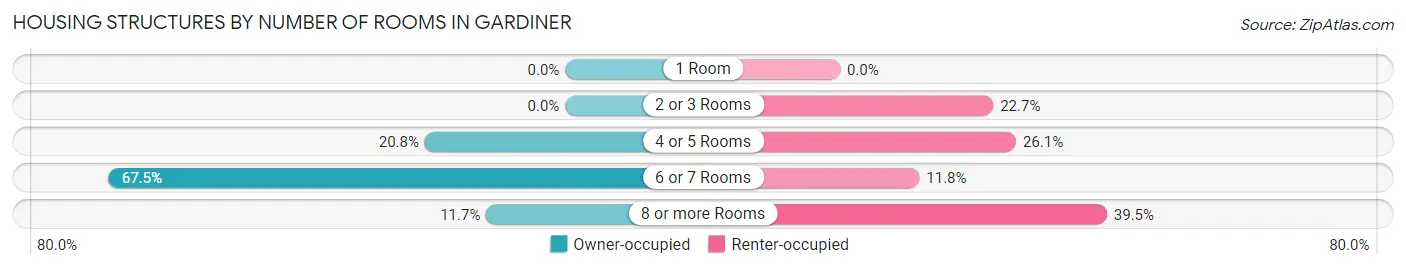
| Number of Rooms | Owner-occupied | Renter-occupied |
| 1 Room | 0 (0.0%) | 0 (0.0%) |
| 2 or 3 Rooms | 0 (0.0%) | 27 (22.7%) |
| 4 or 5 Rooms | 16 (20.8%) | 31 (26.1%) |
| 6 or 7 Rooms | 52 (67.5%) | 14 (11.8%) |
| 8 or more Rooms | 9 (11.7%) | 47 (39.5%) |
| Total | 77 (100.0%) | 119 (100.0%) |
Housing Structure by Heating Type in Gardiner
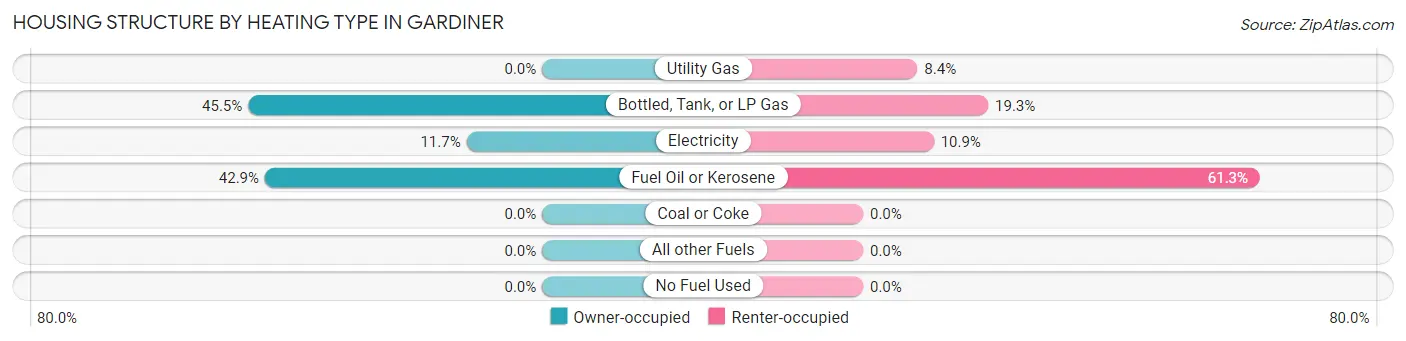
| Heating Type | Owner-occupied | Renter-occupied |
| Utility Gas | 0 (0.0%) | 10 (8.4%) |
| Bottled, Tank, or LP Gas | 35 (45.5%) | 23 (19.3%) |
| Electricity | 9 (11.7%) | 13 (10.9%) |
| Fuel Oil or Kerosene | 33 (42.9%) | 73 (61.3%) |
| Coal or Coke | 0 (0.0%) | 0 (0.0%) |
| All other Fuels | 0 (0.0%) | 0 (0.0%) |
| No Fuel Used | 0 (0.0%) | 0 (0.0%) |
| Total | 77 (100.0%) | 119 (100.0%) |
Household Vehicle Usage in Gardiner
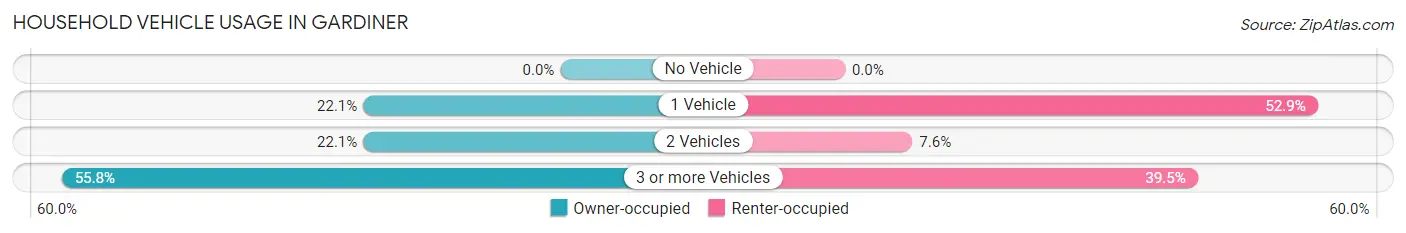
| Vehicles per Household | Owner-occupied | Renter-occupied |
| No Vehicle | 0 (0.0%) | 0 (0.0%) |
| 1 Vehicle | 17 (22.1%) | 63 (52.9%) |
| 2 Vehicles | 17 (22.1%) | 9 (7.6%) |
| 3 or more Vehicles | 43 (55.8%) | 47 (39.5%) |
| Total | 77 (100.0%) | 119 (100.0%) |
Real Estate & Mortgages in Gardiner
Real Estate and Mortgage Overview in Gardiner
| Characteristic | Without Mortgage | With Mortgage |
| Housing Units | 43 | 34 |
| Median Property Value | $221,900 | $0 |
| Median Household Income | - | - |
| Monthly Housing Costs | - | - |
| Real Estate Taxes | - | - |
Property Value by Mortgage Status in Gardiner
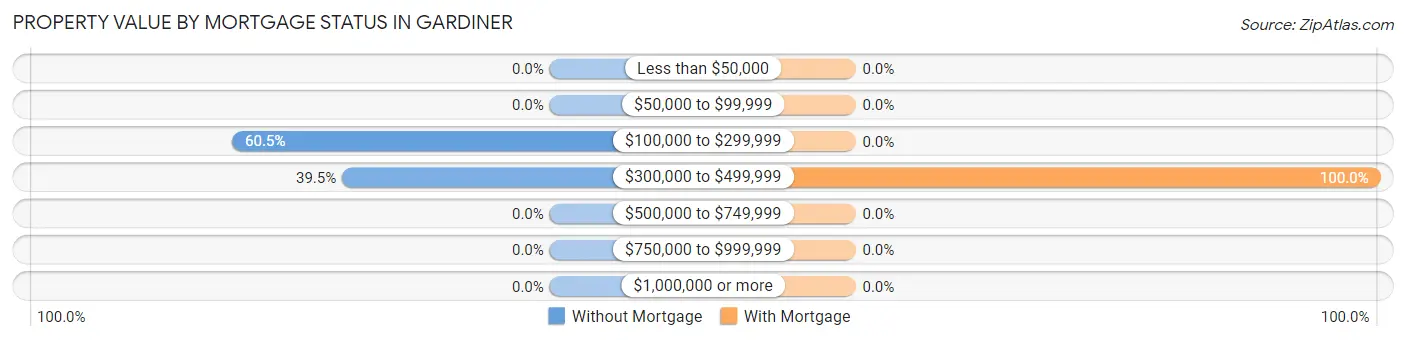
| Property Value | Without Mortgage | With Mortgage |
| Less than $50,000 | 0 (0.0%) | 0 (0.0%) |
| $50,000 to $99,999 | 0 (0.0%) | 0 (0.0%) |
| $100,000 to $299,999 | 26 (60.5%) | 0 (0.0%) |
| $300,000 to $499,999 | 17 (39.5%) | 34 (100.0%) |
| $500,000 to $749,999 | 0 (0.0%) | 0 (0.0%) |
| $750,000 to $999,999 | 0 (0.0%) | 0 (0.0%) |
| $1,000,000 or more | 0 (0.0%) | 0 (0.0%) |
| Total | 43 (100.0%) | 34 (100.0%) |
Household Income by Mortgage Status in Gardiner
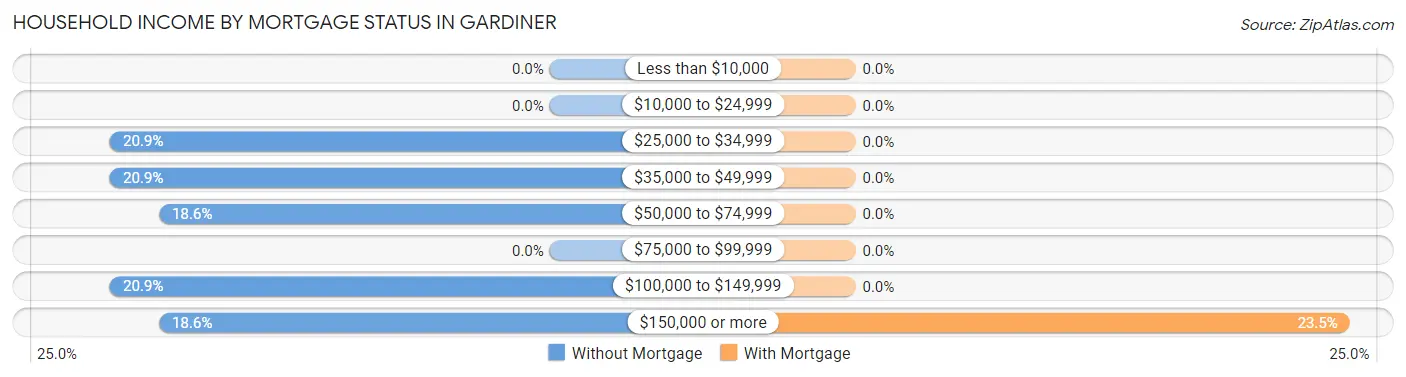
| Household Income | Without Mortgage | With Mortgage |
| Less than $10,000 | 0 (0.0%) | 0 (0.0%) |
| $10,000 to $24,999 | 0 (0.0%) | 0 (0.0%) |
| $25,000 to $34,999 | 9 (20.9%) | 0 (0.0%) |
| $35,000 to $49,999 | 9 (20.9%) | 0 (0.0%) |
| $50,000 to $74,999 | 8 (18.6%) | 0 (0.0%) |
| $75,000 to $99,999 | 0 (0.0%) | 0 (0.0%) |
| $100,000 to $149,999 | 9 (20.9%) | 0 (0.0%) |
| $150,000 or more | 8 (18.6%) | 8 (23.5%) |
| Total | 43 (100.0%) | 34 (100.0%) |
Property Value to Household Income Ratio in Gardiner
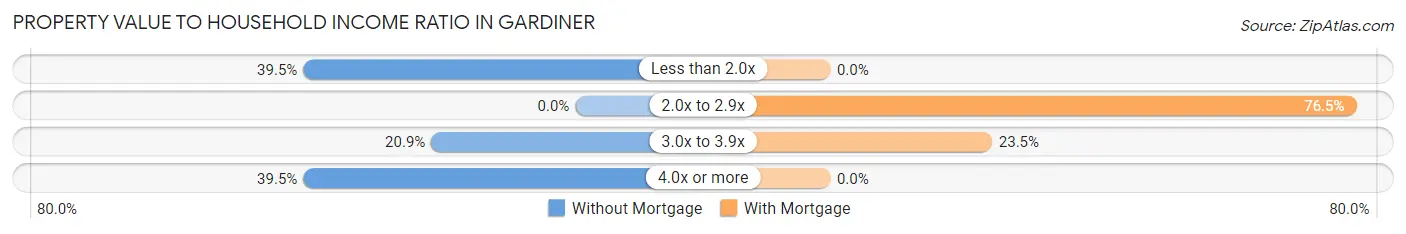
| Value-to-Income Ratio | Without Mortgage | With Mortgage |
| Less than 2.0x | 17 (39.5%) | 0 (0.0%) |
| 2.0x to 2.9x | 0 (0.0%) | 26 (76.5%) |
| 3.0x to 3.9x | 9 (20.9%) | 8 (23.5%) |
| 4.0x or more | 17 (39.5%) | 0 (0.0%) |
| Total | 43 (100.0%) | 34 (100.0%) |
Real Estate Taxes by Mortgage Status in Gardiner
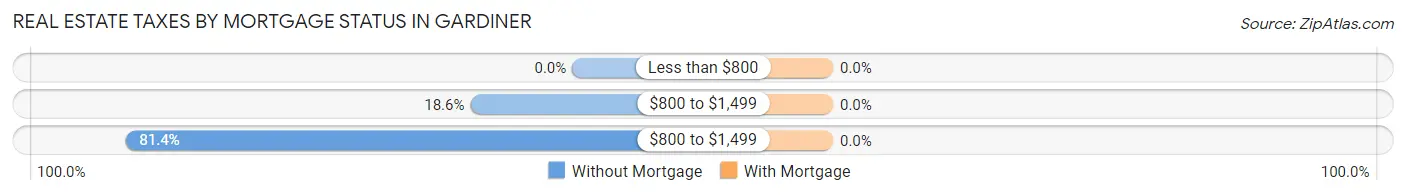
| Property Taxes | Without Mortgage | With Mortgage |
| Less than $800 | 0 (0.0%) | 0 (0.0%) |
| $800 to $1,499 | 8 (18.6%) | 0 (0.0%) |
| $800 to $1,499 | 35 (81.4%) | 0 (0.0%) |
| Total | 43 (100.0%) | 34 (100.0%) |
Health & Disability in Gardiner
Health Insurance Coverage by Age in Gardiner
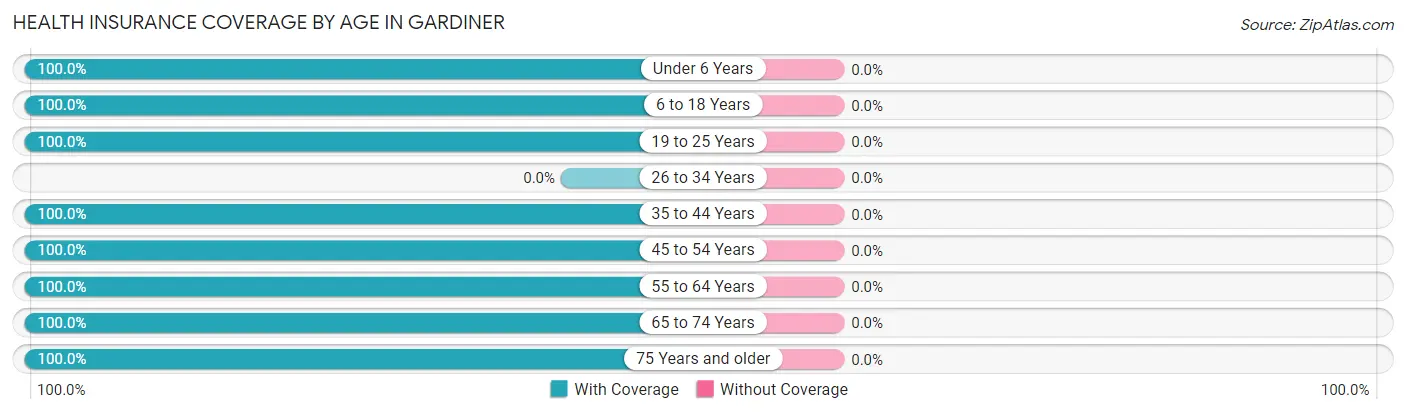
| Age Bracket | With Coverage | Without Coverage |
| Under 6 Years | 7 (100.0%) | 0 (0.0%) |
| 6 to 18 Years | 213 (100.0%) | 0 (0.0%) |
| 19 to 25 Years | 46 (100.0%) | 0 (0.0%) |
| 26 to 34 Years | 0 (0.0%) | 0 (0.0%) |
| 35 to 44 Years | 60 (100.0%) | 0 (0.0%) |
| 45 to 54 Years | 244 (100.0%) | 0 (0.0%) |
| 55 to 64 Years | 37 (100.0%) | 0 (0.0%) |
| 65 to 74 Years | 13 (100.0%) | 0 (0.0%) |
| 75 Years and older | 17 (100.0%) | 0 (0.0%) |
| Total | 637 (100.0%) | 0 (0.0%) |
Health Insurance Coverage by Citizenship Status in Gardiner
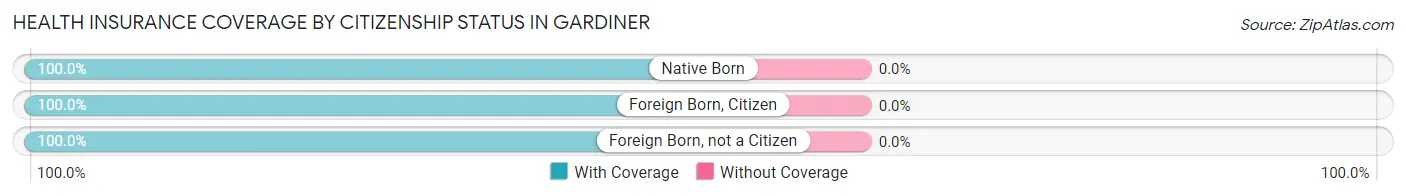
| Citizenship Status | With Coverage | Without Coverage |
| Native Born | 7 (100.0%) | 0 (0.0%) |
| Foreign Born, Citizen | 213 (100.0%) | 0 (0.0%) |
| Foreign Born, not a Citizen | 46 (100.0%) | 0 (0.0%) |
Health Insurance Coverage by Household Income in Gardiner
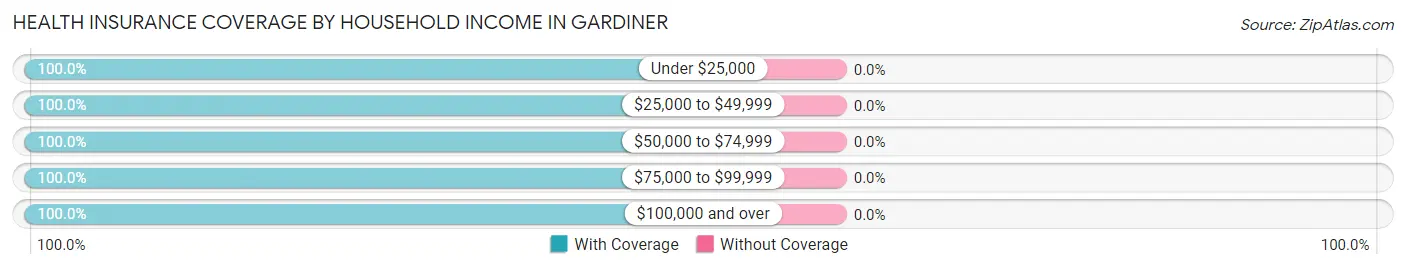
| Household Income | With Coverage | Without Coverage |
| Under $25,000 | 10 (100.0%) | 0 (0.0%) |
| $25,000 to $49,999 | 18 (100.0%) | 0 (0.0%) |
| $50,000 to $74,999 | 27 (100.0%) | 0 (0.0%) |
| $75,000 to $99,999 | 8 (100.0%) | 0 (0.0%) |
| $100,000 and over | 574 (100.0%) | 0 (0.0%) |
Public vs Private Health Insurance Coverage by Age in Gardiner
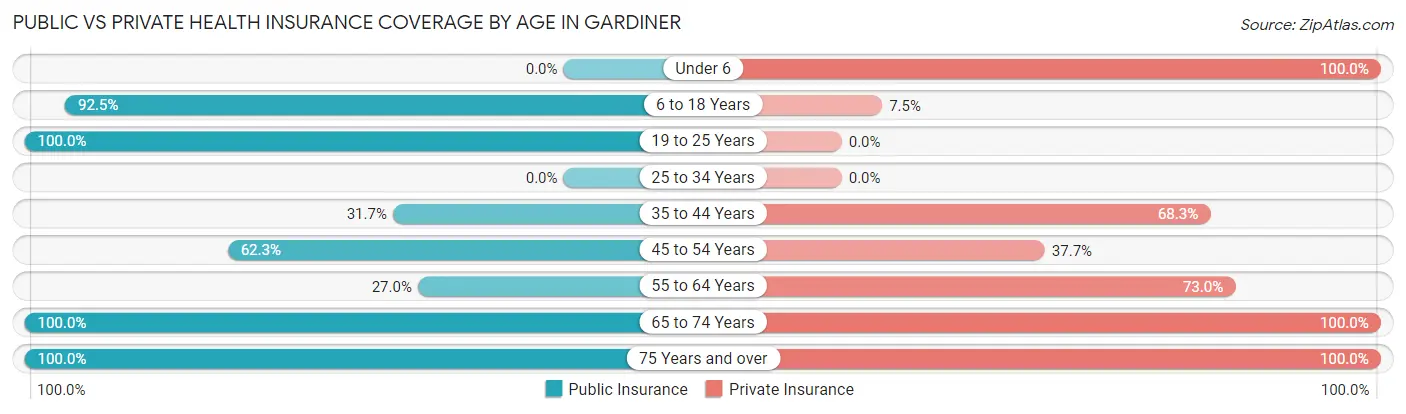
| Age Bracket | Public Insurance | Private Insurance |
| Under 6 | 0 (0.0%) | 7 (100.0%) |
| 6 to 18 Years | 197 (92.5%) | 16 (7.5%) |
| 19 to 25 Years | 46 (100.0%) | 0 (0.0%) |
| 25 to 34 Years | 0 (0.0%) | 0 (0.0%) |
| 35 to 44 Years | 19 (31.7%) | 41 (68.3%) |
| 45 to 54 Years | 152 (62.3%) | 92 (37.7%) |
| 55 to 64 Years | 10 (27.0%) | 27 (73.0%) |
| 65 to 74 Years | 13 (100.0%) | 13 (100.0%) |
| 75 Years and over | 17 (100.0%) | 17 (100.0%) |
| Total | 454 (71.3%) | 213 (33.4%) |
Disability Status by Sex by Age in Gardiner
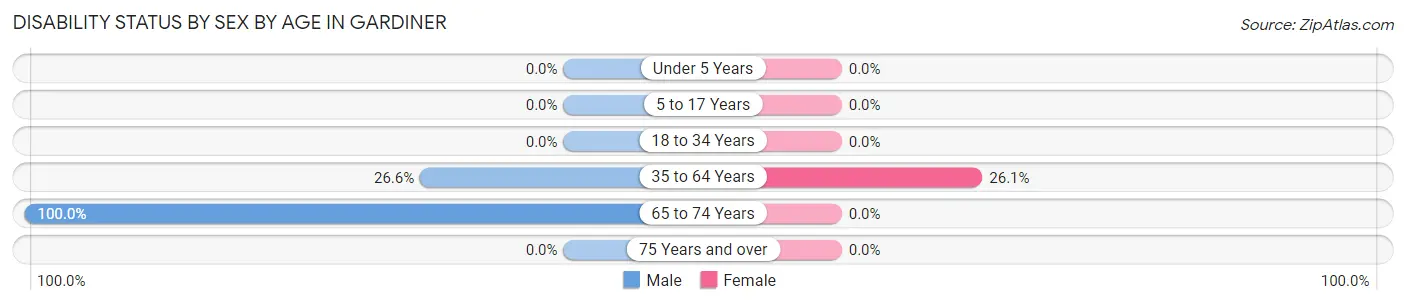
| Age Bracket | Male | Female |
| Under 5 Years | 0 (0.0%) | 0 (0.0%) |
| 5 to 17 Years | 0 (0.0%) | 0 (0.0%) |
| 18 to 34 Years | 0 (0.0%) | 0 (0.0%) |
| 35 to 64 Years | 54 (26.6%) | 36 (26.1%) |
| 65 to 74 Years | 7 (100.0%) | 0 (0.0%) |
| 75 Years and over | 0 (0.0%) | 0 (0.0%) |
Disability Class by Sex by Age in Gardiner
Disability Class: Hearing Difficulty
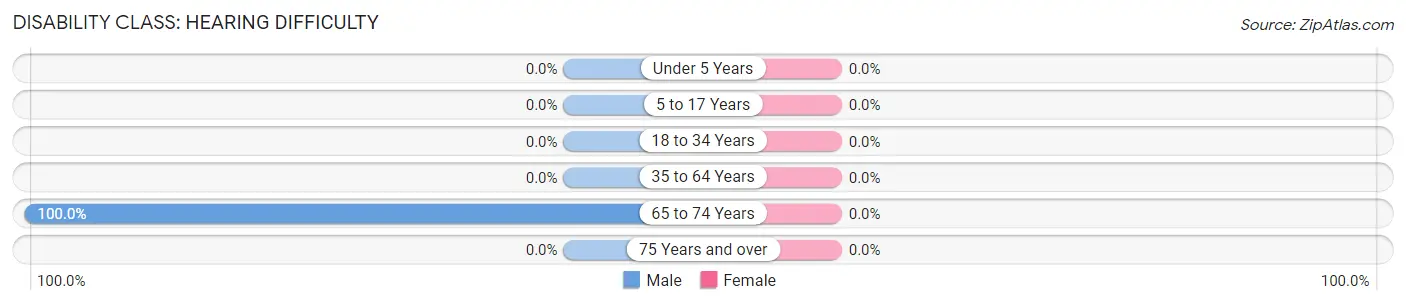
| Age Bracket | Male | Female |
| Under 5 Years | 0 (0.0%) | 0 (0.0%) |
| 5 to 17 Years | 0 (0.0%) | 0 (0.0%) |
| 18 to 34 Years | 0 (0.0%) | 0 (0.0%) |
| 35 to 64 Years | 0 (0.0%) | 0 (0.0%) |
| 65 to 74 Years | 7 (100.0%) | 0 (0.0%) |
| 75 Years and over | 0 (0.0%) | 0 (0.0%) |
Disability Class: Vision Difficulty
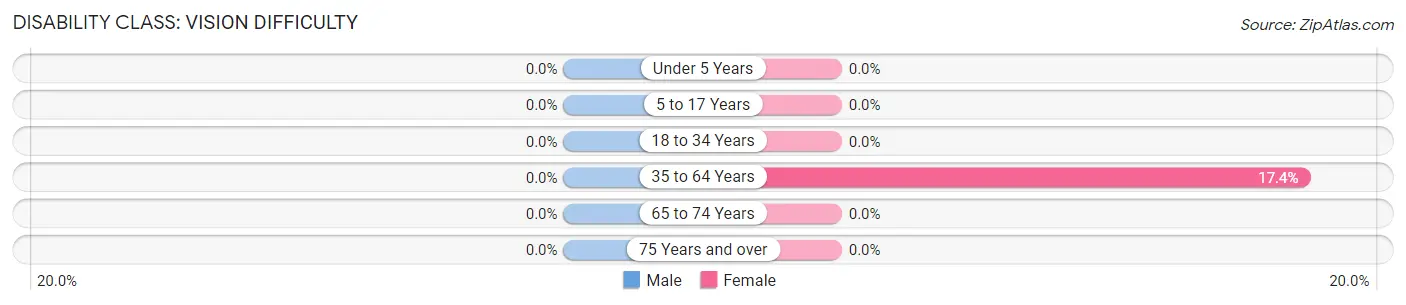
| Age Bracket | Male | Female |
| Under 5 Years | 0 (0.0%) | 0 (0.0%) |
| 5 to 17 Years | 0 (0.0%) | 0 (0.0%) |
| 18 to 34 Years | 0 (0.0%) | 0 (0.0%) |
| 35 to 64 Years | 0 (0.0%) | 24 (17.4%) |
| 65 to 74 Years | 0 (0.0%) | 0 (0.0%) |
| 75 Years and over | 0 (0.0%) | 0 (0.0%) |
Disability Class: Cognitive Difficulty
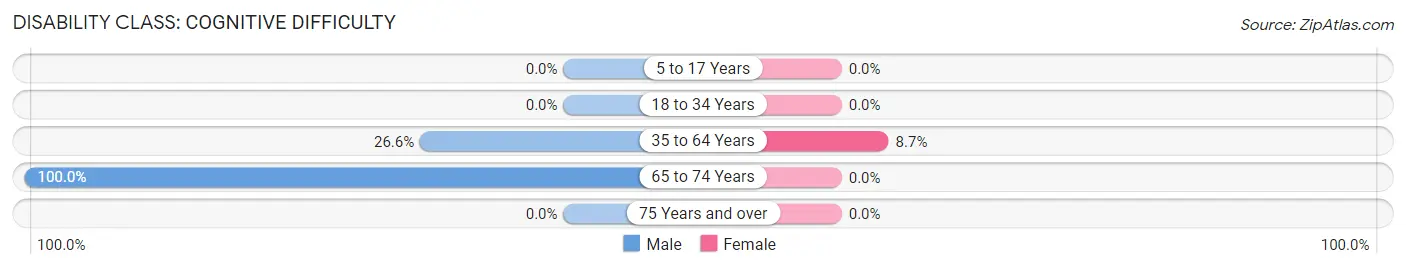
| Age Bracket | Male | Female |
| 5 to 17 Years | 0 (0.0%) | 0 (0.0%) |
| 18 to 34 Years | 0 (0.0%) | 0 (0.0%) |
| 35 to 64 Years | 54 (26.6%) | 12 (8.7%) |
| 65 to 74 Years | 7 (100.0%) | 0 (0.0%) |
| 75 Years and over | 0 (0.0%) | 0 (0.0%) |
Disability Class: Ambulatory Difficulty
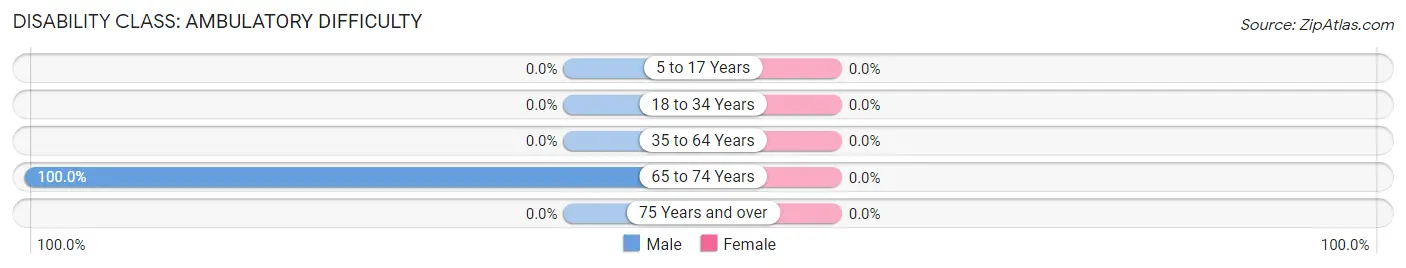
| Age Bracket | Male | Female |
| 5 to 17 Years | 0 (0.0%) | 0 (0.0%) |
| 18 to 34 Years | 0 (0.0%) | 0 (0.0%) |
| 35 to 64 Years | 0 (0.0%) | 0 (0.0%) |
| 65 to 74 Years | 7 (100.0%) | 0 (0.0%) |
| 75 Years and over | 0 (0.0%) | 0 (0.0%) |
Disability Class: Self-Care Difficulty
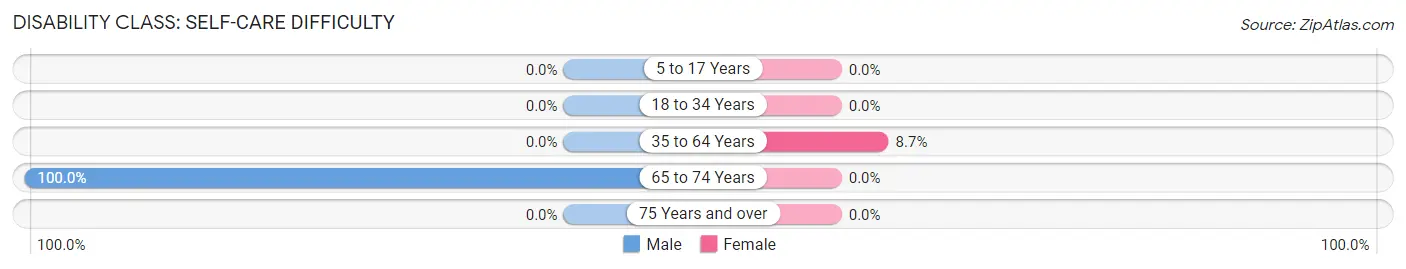
| Age Bracket | Male | Female |
| 5 to 17 Years | 0 (0.0%) | 0 (0.0%) |
| 18 to 34 Years | 0 (0.0%) | 0 (0.0%) |
| 35 to 64 Years | 0 (0.0%) | 12 (8.7%) |
| 65 to 74 Years | 7 (100.0%) | 0 (0.0%) |
| 75 Years and over | 0 (0.0%) | 0 (0.0%) |
Technology Access in Gardiner
Computing Device Access in Gardiner
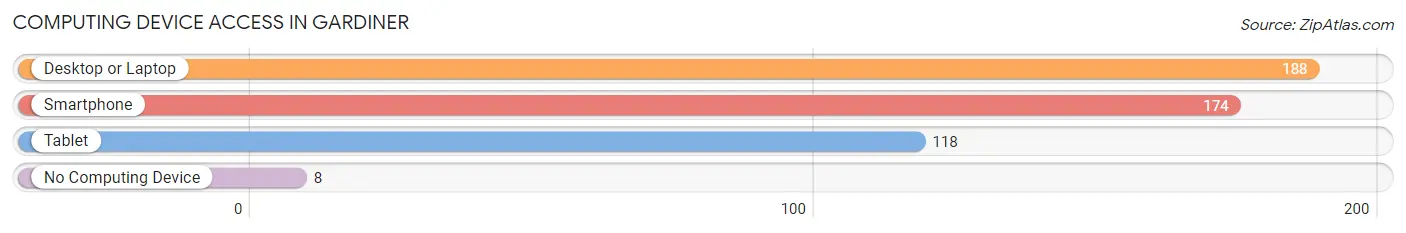
| Device Type | # Households | % Households |
| Desktop or Laptop | 188 | 95.9% |
| Smartphone | 174 | 88.8% |
| Tablet | 118 | 60.2% |
| No Computing Device | 8 | 4.1% |
| Total | 196 | 100.0% |
Internet Access in Gardiner
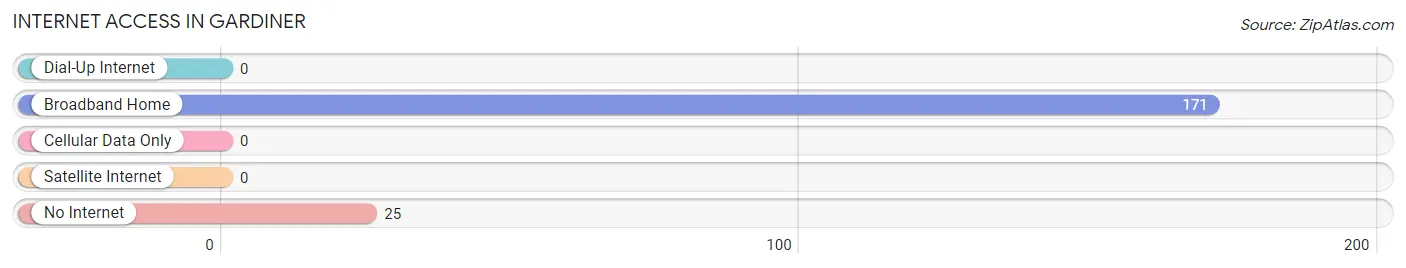
| Internet Type | # Households | % Households |
| Dial-Up Internet | 0 | 0.0% |
| Broadband Home | 171 | 87.2% |
| Cellular Data Only | 0 | 0.0% |
| Satellite Internet | 0 | 0.0% |
| No Internet | 25 | 12.8% |
| Total | 196 | 100.0% |
Gardiner Summary
Gardiner is a town located in Ulster County, New York, United States. The population was 11,945 at the 2010 census. The town is in the northwest part of the county, northwest of New Paltz.
History
Gardiner was first settled in 1663 by Dutch settlers. The town was originally part of the New Paltz Patent and was known as the "Great Nine Partners Patent". The town was established in 1798 from part of the Town of New Paltz.
Geography
Gardiner is located in the northwest corner of Ulster County, bordered by the towns of Shawangunk to the north, New Paltz to the east, Plattekill to the south, and Rosendale to the west. According to the United States Census Bureau, the town has a total area of 39.7 square miles, of which 39.3 square miles is land and 0.4 square miles, or 1.03%, is water.
The Shawangunk Ridge, a ridge of the Appalachian Mountains, runs through the northern part of the town. The highest point in the town is the summit of Bonticou Crag, at 1,622 feet (494 m) above sea level.
Economy
Gardiner is a rural town with a mix of agricultural and light industrial businesses. The town is home to several wineries, including Robibero Family Vineyards, Whitecliff Vineyard, and Glorie Farm Winery. The town is also home to several farms, including the Gardiner Farm, which produces organic vegetables, fruits, and herbs.
The town is also home to several small businesses, including a number of restaurants, antique stores, and art galleries.
Demographics
As of the census of 2010, there were 11,945 people, 4,541 households, and 3,092 families residing in the town. The population density was 303.7 people per square mile (117.2/km2). There were 4,845 housing units at an average density of 123.2 per square mile (47.5/km2). The racial makeup of the town was 92.3% White, 2.7% African American, 0.2% Native American, 1.2% Asian, 0.0% Pacific Islander, 1.7% from other races, and 2.1% from two or more races. Hispanic or Latino of any race were 6.2% of the population.
There were 4,541 households, out of which 32.2% had children under the age of 18 living with them, 53.2% were married couples living together, 10.2% had a female householder with no husband present, and 31.7% were non-families. 24.7% of all households were made up of individuals, and 8.3% had someone living alone who was 65 years of age or older. The average household size was 2.60 and the average family size was 3.12.
In the town, the population was spread out, with 25.2% under the age of 18, 6.7% from 18 to 24, 28.2% from 25 to 44, 28.2% from 45 to 64, and 11.7% who were 65 years of age or older. The median age was 39 years. For every 100 females, there were 97.2 males. For every 100 females age 18 and over, there were 94.2 males.
The median income for a household in the town was $54,846, and the median income for a family was $63,917. Males had a median income of $45,945 versus $35,938 for females. The per capita income for the town was $25,945. About 4.3% of families and 6.3% of the population were below the poverty line, including 8.2% of those under age 18 and 4.2% of those age 65 or over.
Common Questions
What is the Total Population of Gardiner?
Total Population of Gardiner is 637.
What is the Total Male Population of Gardiner?
Total Male Population of Gardiner is 307.
What is the Total Female Population of Gardiner?
Total Female Population of Gardiner is 330.
What is the Ratio of Males per 100 Females in Gardiner?
There are 93.03 Males per 100 Females in Gardiner.
What is the Ratio of Females per 100 Males in Gardiner?
There are 107.49 Females per 100 Males in Gardiner.
What is the Median Population Age in Gardiner?
Median Population Age in Gardiner is 39.9 Years.
What is the Average Family Size in Gardiner
Average Family Size in Gardiner is 4.7 People.
What is the Average Household Size in Gardiner
Average Household Size in Gardiner is 3.2 People.
What is Per Capita Income in Gardiner?
Per Capita income in Gardiner is $42,965.
What is the Median Family Income in Gardiner?
Median Family Income in Gardiner is $104,767.
What is the Median Household income in Gardiner?
Median Household Income in Gardiner is $104,894.
What is Inequality or Gini Index in Gardiner?
Inequality or Gini Index in Gardiner is 0.34.
How Large is the Labor Force in Gardiner?
There are 317 People in the Labor Forcein in Gardiner.
What is the Percentage of People in the Labor Force in Gardiner?
74.4% of People are in the Labor Force in Gardiner.